2011: květina, p. - končelová, m.: sherds on the map: intra-site gis of the neolithic site of...
TRANSCRIPT
Go Your Own Least Cost Path
Spatial technology and archaeological interpretation
Proceedings of the GIS session at EAA 2009, Riva del Garda
Edited by
J. W. H. Verhagen A. G. Posluschny
A. Danielisova
BAR International Series 2284 2011
Published by Archaeopress Publishers of British Archaeological Reports Gordon House 276 Banbury Road Oxford OX2 7ED England [email protected] www.archaeopress.com BAR S2284 Go Your Own Least Cost Path: Spatial technology and archaeological interpretation. Proceedings of the GIS session at EAA 2009, Riva del Garda © Archaeopress and the individual authors 2011 ISBN 978 1 4073 0861 6 Printed in England by 4edge, Hockley All BAR titles are available from: Hadrian Books Ltd 122 Banbury Road Oxford OX2 7BP England www.hadrianbooks.co.uk The current BAR catalogue with details of all titles in print, prices and means of payment is available free from Hadrian Books or may be downloaded from www.archaeopress.com
- 55 -
P. Verhagen, A. G. Posluschny, A. Danielisovù (eds.)Proceedings EAA 2009: Go Your Own Least Cost Path, Riva del Garda
Abstract
The aim of this paper is to point out the capabilities of GIS technology to solve questions of micro-scale forma-tion processes of the archaeological record. Micro-scale spatial analysis is rarely applied in archaeology outside hunter-gatherer studies. This case study is based on data obtained during rescue excavations at the Neolithic site of Bylany (Czech Republic). The excavation method ap-plied here enabled research into the formation processes of archaeological materials at the scale of individual pits. The obtained data were processed and analyzed in ArcGIS 9.3 and its extensions Spatial Analyst and 3D Analyst. The result consisted of a spatial model of the particular pit in-cluding its fill layers and individual artefacts. The model leads to an interpretation of the depositional history of the pit. This history apparently reflects a series of events that are mostly the result of intentional human activity.
Starting Points
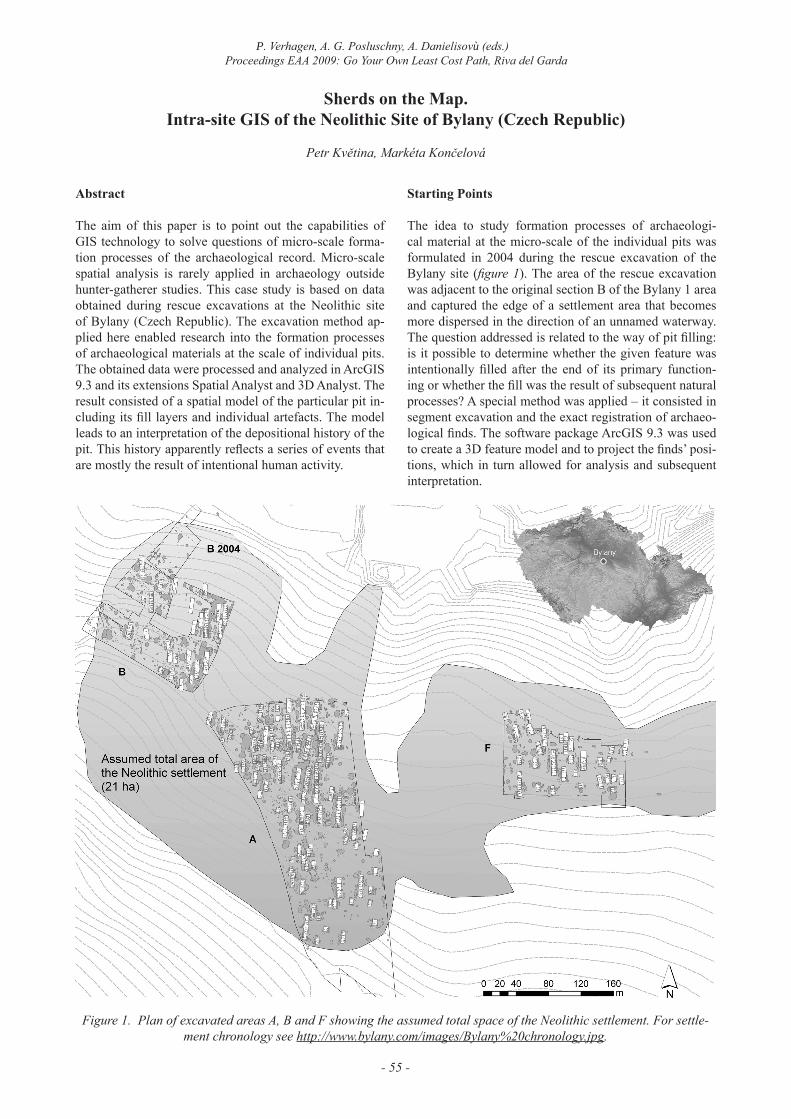
The idea to study formation processes of archaeologi-cal material at the micro-scale of the individual pits was formulated in 2004 during the rescue excavation of the Bylany site (figure 1). The area of the rescue excavation was adjacent to the original section B of the Bylany 1 area and captured the edge of a settlement area that becomes more dispersed in the direction of an unnamed waterway. The question addressed is related to the way of pit filling: is it possible to determine whether the given feature was intentionally filled after the end of its primary function-ing or whether the fill was the result of subsequent natural processes? A special method was applied – it consisted in segment excavation and the exact registration of archaeo-logical finds. The software package ArcGIS 9.3 was used to create a 3D feature model and to project the finds’ posi-tions, which in turn allowed for analysis and subsequent interpretation.
Sherds on the Map.Intra-site GIS of the Neolithic Site of Bylany (Czech Republic)
Petr Květina, Markéta Končelová
Figure 1. Plan of excavated areas A, B and F showing the assumed total space of the Neolithic settlement. For settle-ment chronology see http://www.bylany.com/images/Bylany%20chronology.jpg.
- 56 -
Petr Květina, Markéta KončelováSherds on the Map
Concise history of the Bylany site (Czech Republic) The excavation at Bylany was unique in its time because of the large-scale excavation method used and the appli-cation of formalized descriptions of archaeological data suitable for automated processing. The site awakened pro-fessional interest in the research of settlement areas of the first farmers in Central Europe (Linear Pottery culture or LBK)1. The first excavations at the site are associated with B. Soudský, whose work was continued by I. Pavlů, M. Zápotocká and J. Rulf. The field activities and subsequent processing of the finds have produced numerous stud-ies that have had a significant impact on the excavation methodology utilized at Neolithic sites and the analysis of archaeological material for this and other periods (e.g. soudský 1962; soudský - Pavlů 1972; Pavlů – rulF – zá-Potocká 1986; Pavlů – rulF – záPotocká 1995; Pavlů 2000). At the same time, they have also modified the inter-pretation of the society and culture of early farmers in the Czech territory and beyond.
1 This work was done with support from the research project at the Institute of Archaeology of the Academy of Sciences of the Czech Republic, Prague, entitled: “The archaeological potential of Bohemia: theoretical research, methodology and information science, care for national cultural heritage.” Identification code AV0Z80020508.
The history of archaeological excavations in Bylany can be divided into four distinct phases: Large-scale excava-tions were executed between 1953 and 1967; nearly 7 ha were studied and divided into three separate areas labeled A, B and F (figure 1). Even though only one-third of the originally planned excavations of the site (Bylany 1) was conducted, the site remains to this day the largest Neolith-ic settlement continuously studied in Bohemia. The main outcome of this phase of excavations was the establish-ment of the internal chronology of the settlement. It also proved that the discovered settlement is a non-homogene-ous spatiotemporal unit composed of several components.
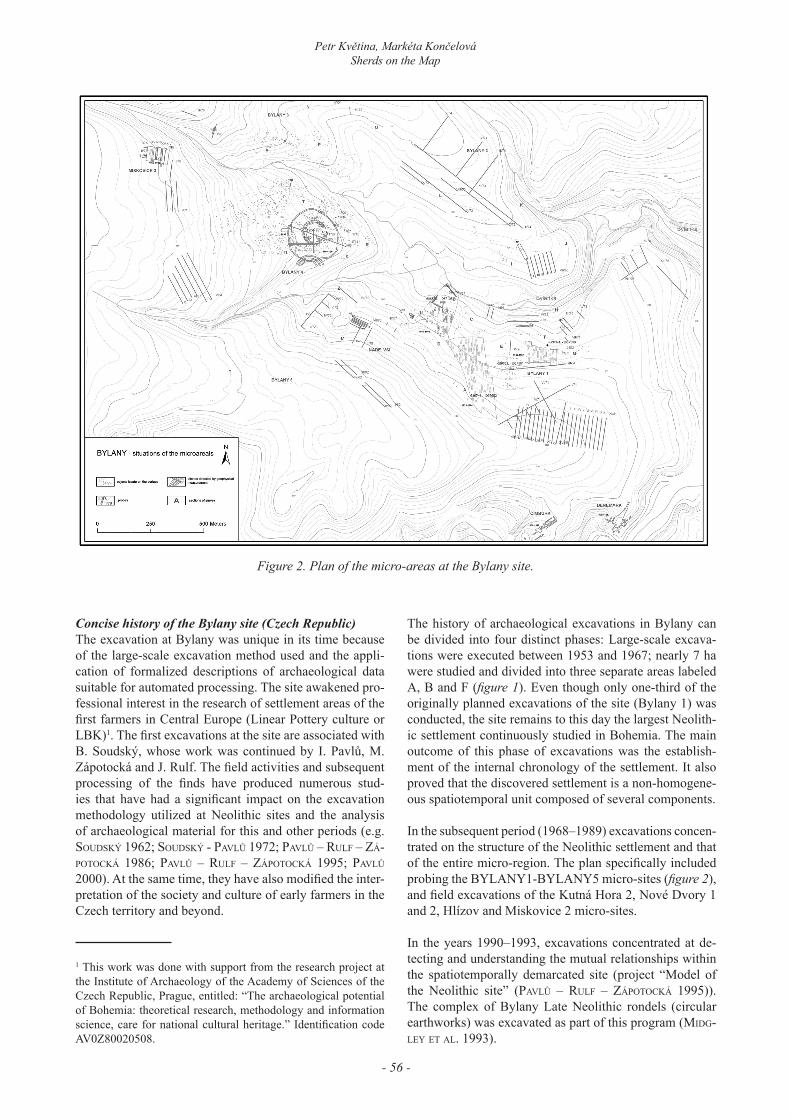
In the subsequent period (1968–1989) excavations concen-trated on the structure of the Neolithic settlement and that of the entire micro-region. The plan specifically included probing the BYLANY1-BYLANY5 micro-sites (figure 2), and field excavations of the Kutná Hora 2, Nové Dvory 1 and 2, Hlízov and Miskovice 2 micro-sites.
In the years 1990–1993, excavations concentrated at de-tecting and understanding the mutual relationships within the spatiotemporally demarcated site (project “Model of the Neolithic site” (Pavlů – rulF – záPotocká 1995)). The complex of Bylany Late Neolithic rondels (circular earthworks) was excavated as part of this program (MiDG-Ley eT aL. 1993).
Figure 2. Plan of the micro-areas at the Bylany site.
- 57 -
P. Verhagen, A. G. Posluschny, A. Danielisovù (eds.)Proceedings EAA 2009: Go Your Own Least Cost Path, Riva del Garda
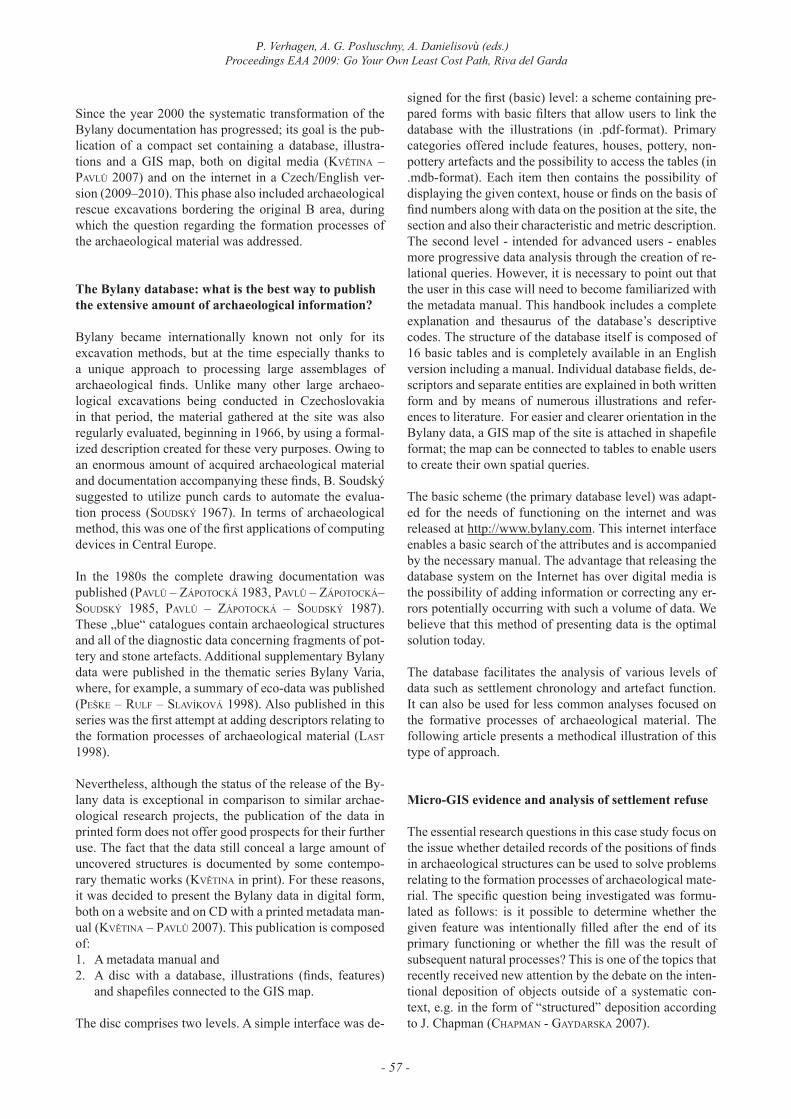
Since the year 2000 the systematic transformation of the Bylany documentation has progressed; its goal is the pub-lication of a compact set containing a database, illustra-tions and a GIS map, both on digital media (květina – Pavlů 2007) and on the internet in a Czech/English ver-sion (2009–2010). This phase also included archaeological rescue excavations bordering the original B area, during which the question regarding the formation processes of the archaeological material was addressed.
The Bylany database: what is the best way to publish the extensive amount of archaeological information?
Bylany became internationally known not only for its excavation methods, but at the time especially thanks to a unique approach to processing large assemblages of archaeological finds. Unlike many other large archaeo-logical excavations being conducted in Czechoslovakia in that period, the material gathered at the site was also regularly evaluated, beginning in 1966, by using a formal-ized description created for these very purposes. Owing to an enormous amount of acquired archaeological material and documentation accompanying these finds, B. Soudský suggested to utilize punch cards to automate the evalua-tion process (souDský 1967). In terms of archaeological method, this was one of the first applications of computing devices in Central Europe.
In the 1980s the complete drawing documentation was published (Pavlů – záPotocká 1983, Pavlů – záPotocká– soudský 1985, Pavlů – záPotocká – soudský 1987). These �blue“ catalogues contain archaeological structures and all of the diagnostic data concerning fragments of pot-tery and stone artefacts. Additional supplementary Bylany data were published in the thematic series Bylany Varia, where, for example, a summary of eco-data was published (PeŠke – rulF – sLaVíkoVá 1998). Also published in this series was the first attempt at adding descriptors relating to the formation processes of archaeological material (LasT 1998).
Nevertheless, although the status of the release of the By-lany data is exceptional in comparison to similar archae-ological research projects, the publication of the data in printed form does not offer good prospects for their further use. The fact that the data still conceal a large amount of uncovered structures is documented by some contempo-rary thematic works (květina in print). For these reasons, it was decided to present the Bylany data in digital form, both on a website and on CD with a printed metadata man-ual (květina – Pavlů 2007). This publication is composed of:1. A metadata manual and2. A disc with a database, illustrations (finds, features)
and shapefiles connected to the GIS map.
The disc comprises two levels. A simple interface was de-
signed for the first (basic) level: a scheme containing pre-pared forms with basic filters that allow users to link the database with the illustrations (in .pdf-format). Primary categories offered include features, houses, pottery, non-pottery artefacts and the possibility to access the tables (in .mdb-format). Each item then contains the possibility of displaying the given context, house or finds on the basis of find numbers along with data on the position at the site, the section and also their characteristic and metric description.The second level - intended for advanced users - enables more progressive data analysis through the creation of re-lational queries. However, it is necessary to point out that the user in this case will need to become familiarized with the metadata manual. This handbook includes a complete explanation and thesaurus of the database’s descriptive codes. The structure of the database itself is composed of 16 basic tables and is completely available in an English version including a manual. Individual database fields, de-scriptors and separate entities are explained in both written form and by means of numerous illustrations and refer-ences to literature. For easier and clearer orientation in the Bylany data, a GIS map of the site is attached in shapefile format; the map can be connected to tables to enable users to create their own spatial queries.
The basic scheme (the primary database level) was adapt-ed for the needs of functioning on the internet and was released at http://www.bylany.com. This internet interface enables a basic search of the attributes and is accompanied by the necessary manual. The advantage that releasing the database system on the Internet has over digital media is the possibility of adding information or correcting any er-rors potentially occurring with such a volume of data. We believe that this method of presenting data is the optimal solution today.
The database facilitates the analysis of various levels of data such as settlement chronology and artefact function. It can also be used for less common analyses focused on the formative processes of archaeological material. The following article presents a methodical illustration of this type of approach.
Micro-GIS evidence and analysis of settlement refuse
The essential research questions in this case study focus on the issue whether detailed records of the positions of finds in archaeological structures can be used to solve problems relating to the formation processes of archaeological mate-rial. The specific question being investigated was formu-lated as follows: is it possible to determine whether the given feature was intentionally filled after the end of its primary functioning or whether the fill was the result of subsequent natural processes? This is one of the topics that recently received new attention by the debate on the inten-tional deposition of objects outside of a systematic con-text, e.g. in the form of “structured” deposition according to J. Chapman (chaPMan - GayDarska 2007).
- 58 -
Petr Květina, Markéta KončelováSherds on the Map
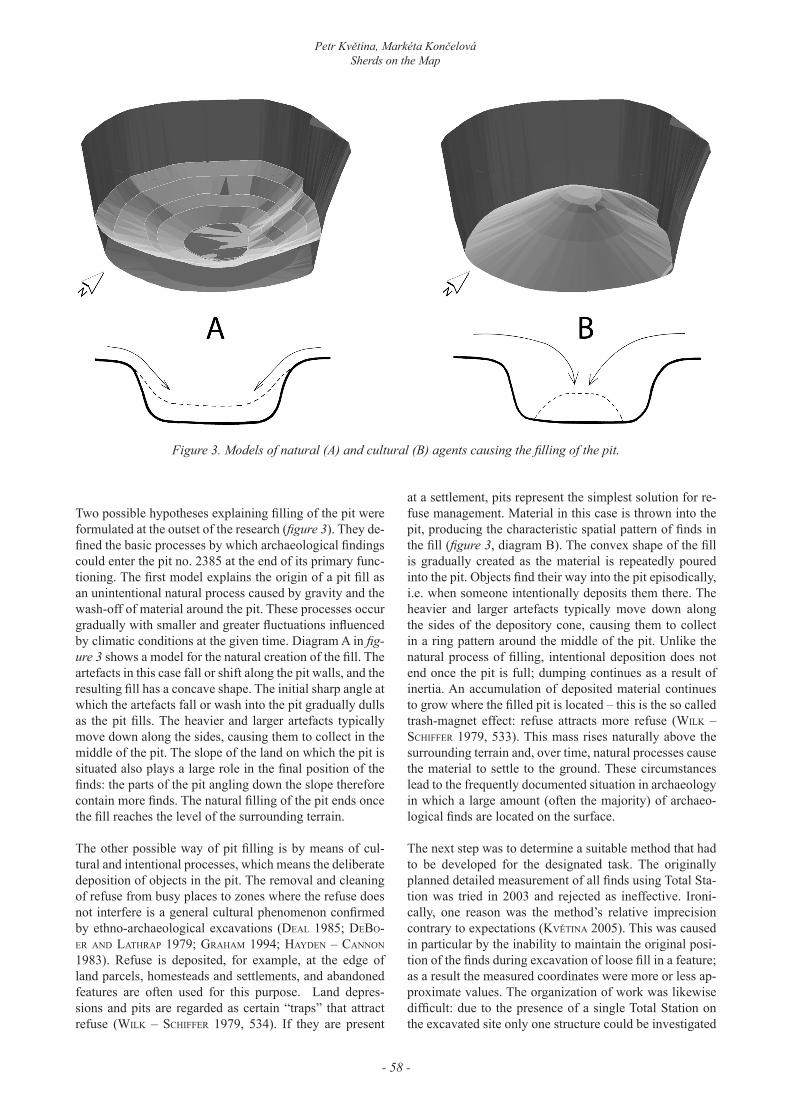
Two possible hypotheses explaining filling of the pit were formulated at the outset of the research (figure 3). They de-fined the basic processes by which archaeological findings could enter the pit no. 2385 at the end of its primary func-tioning. The first model explains the origin of a pit fill as an unintentional natural process caused by gravity and the wash-off of material around the pit. These processes occur gradually with smaller and greater fluctuations influenced by climatic conditions at the given time. Diagram A in fig-ure 3 shows a model for the natural creation of the fill. The artefacts in this case fall or shift along the pit walls, and the resulting fill has a concave shape. The initial sharp angle at which the artefacts fall or wash into the pit gradually dulls as the pit fills. The heavier and larger artefacts typically move down along the sides, causing them to collect in the middle of the pit. The slope of the land on which the pit is situated also plays a large role in the final position of the finds: the parts of the pit angling down the slope therefore contain more finds. The natural filling of the pit ends once the fill reaches the level of the surrounding terrain.
The other possible way of pit filling is by means of cul-tural and intentional processes, which means the deliberate deposition of objects in the pit. The removal and cleaning of refuse from busy places to zones where the refuse does not interfere is a general cultural phenomenon confirmed by ethno-archaeological excavations (deal 1985; deBo-er and lathraP 1979; grahaM 1994; hayden – cannon 1983). Refuse is deposited, for example, at the edge of land parcels, homesteads and settlements, and abandoned features are often used for this purpose. Land depres-sions and pits are regarded as certain “traps” that attract refuse (WiLk – schiffer 1979, 534). If they are present
at a settlement, pits represent the simplest solution for re-fuse management. Material in this case is thrown into the pit, producing the characteristic spatial pattern of finds in the fill (figure 3, diagram B). The convex shape of the fill is gradually created as the material is repeatedly poured into the pit. Objects find their way into the pit episodically, i.e. when someone intentionally deposits them there. The heavier and larger artefacts typically move down along the sides of the depository cone, causing them to collect in a ring pattern around the middle of the pit. Unlike the natural process of filling, intentional deposition does not end once the pit is full; dumping continues as a result of inertia. An accumulation of deposited material continues to grow where the filled pit is located – this is the so called trash-magnet effect: refuse attracts more refuse (WiLk – schiffer 1979, 533). This mass rises naturally above the surrounding terrain and, over time, natural processes cause the material to settle to the ground. These circumstances lead to the frequently documented situation in archaeology in which a large amount (often the majority) of archaeo-logical finds are located on the surface.
The next step was to determine a suitable method that had to be developed for the designated task. The originally planned detailed measurement of all finds using Total Sta-tion was tried in 2003 and rejected as ineffective. Ironi-cally, one reason was the method’s relative imprecision contrary to expectations (květina 2005). This was caused in particular by the inability to maintain the original posi-tion of the finds during excavation of loose fill in a feature; as a result the measured coordinates were more or less ap-proximate values. The organization of work was likewise difficult: due to the presence of a single Total Station on the excavated site only one structure could be investigated
Figure 3. Models of natural (A) and cultural (B) agents causing the filling of the pit.
- 59 -
P. Verhagen, A. G. Posluschny, A. Danielisovù (eds.)Proceedings EAA 2009: Go Your Own Least Cost Path, Riva del Garda
at a given time. A different method for recording the po-sition of archaeological finds was therefore tested during rescue excavations in 2004. This method can be referred to as segmented recording, as its principle is based on the simple division of selected archaeological structures into numerous small spatial segments (cubes). The arrange-ment of the cubes is regular and therefore artificial (it does not respect the natural horizontal or vertical division of
features). The dimensions of the cubes used for these pur-poses depend on the specific conditions, in this particular case 30 x 30 x 10 (depth) cm. During the excavations, the finds were recorded in these spatial cubes; this information was then connected with the finds for the entire processing period.
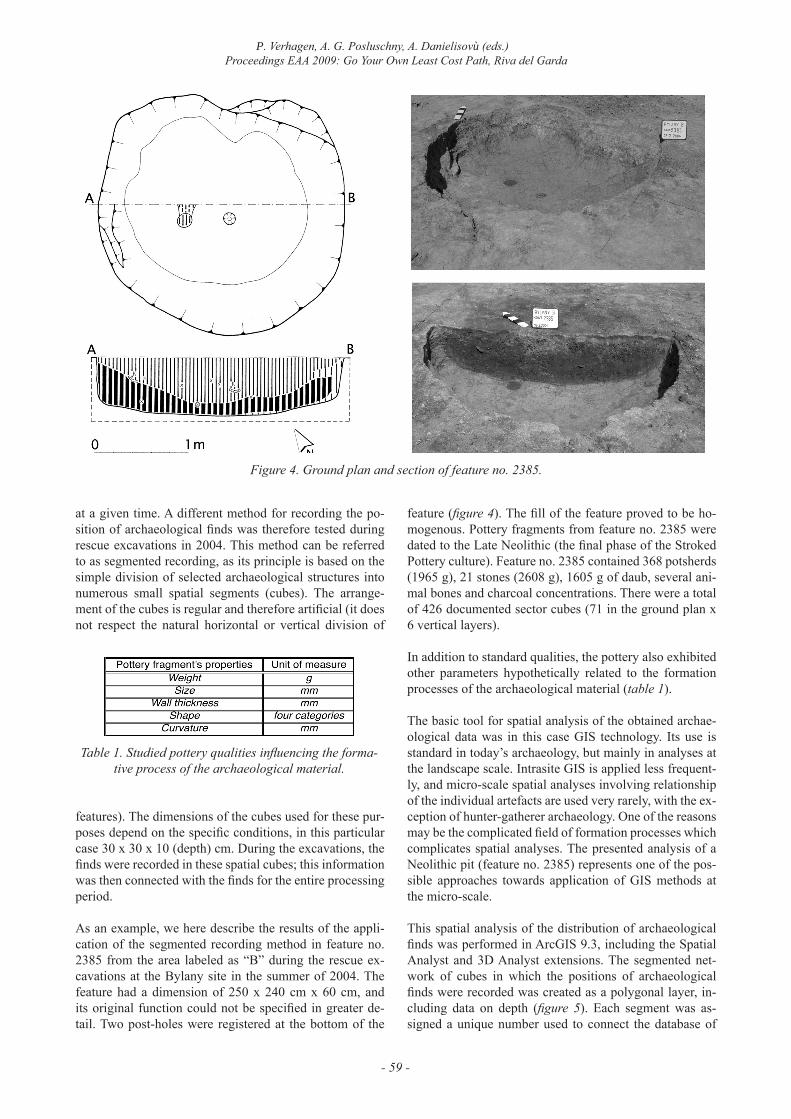
As an example, we here describe the results of the appli-cation of the segmented recording method in feature no. 2385 from the area labeled as “B” during the rescue ex-cavations at the Bylany site in the summer of 2004. The feature had a dimension of 250 x 240 cm x 60 cm, and its original function could not be specified in greater de-tail. Two post-holes were registered at the bottom of the
feature (figure 4). The fill of the feature proved to be ho-mogenous. Pottery fragments from feature no. 2385 were dated to the Late Neolithic (the final phase of the Stroked Pottery culture). Feature no. 2385 contained 368 potsherds (1965 g), 21 stones (2608 g), 1605 g of daub, several ani-mal bones and charcoal concentrations. There were a total of 426 documented sector cubes (71 in the ground plan x 6 vertical layers).
In addition to standard qualities, the pottery also exhibited other parameters hypothetically related to the formation processes of the archaeological material (table 1).
The basic tool for spatial analysis of the obtained archae-ological data was in this case GIS technology. Its use is standard in today’s archaeology, but mainly in analyses at the landscape scale. Intrasite GIS is applied less frequent-ly, and micro-scale spatial analyses involving relationship of the individual artefacts are used very rarely, with the ex-ception of hunter-gatherer archaeology. One of the reasons may be the complicated field of formation processes which complicates spatial analyses. The presented analysis of a Neolithic pit (feature no. 2385) represents one of the pos-sible approaches towards application of GIS methods at the micro-scale.
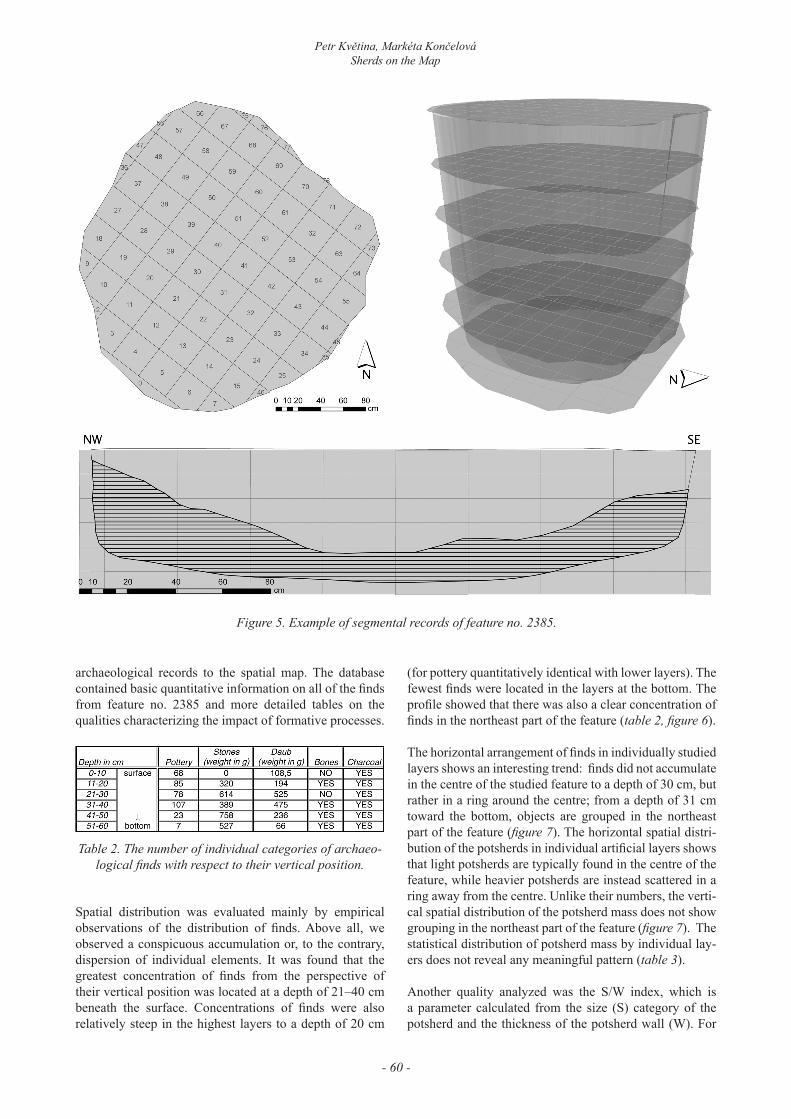
This spatial analysis of the distribution of archaeological finds was performed in ArcGIS 9.3, including the Spatial Analyst and 3D Analyst extensions. The segmented net-work of cubes in which the positions of archaeological finds were recorded was created as a polygonal layer, in-cluding data on depth (figure 5). Each segment was as-signed a unique number used to connect the database of
Figure 4. Ground plan and section of feature no. 2385.
Table 1. Studied pottery qualities influencing the forma-tive process of the archaeological material.
- 60 -
Petr Květina, Markéta KončelováSherds on the Map
archaeological records to the spatial map. The database contained basic quantitative information on all of the finds from feature no. 2385 and more detailed tables on the qualities characterizing the impact of formative processes.
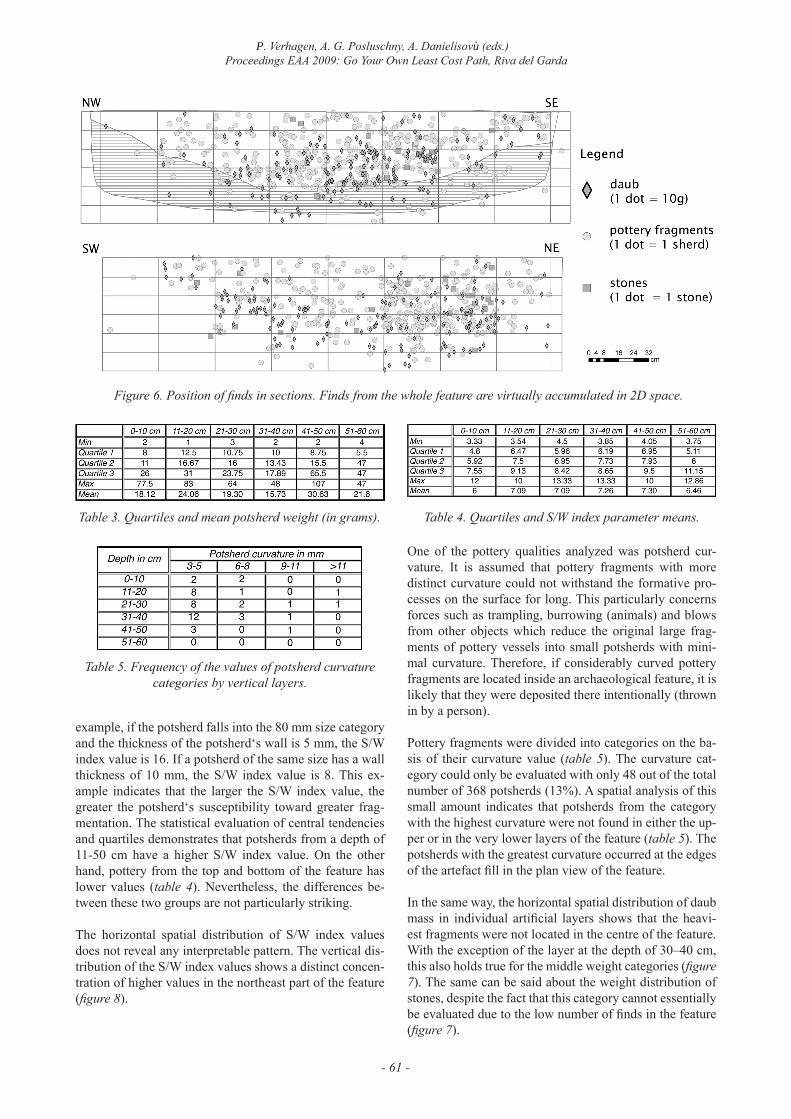
Spatial distribution was evaluated mainly by empirical observations of the distribution of finds. Above all, we observed a conspicuous accumulation or, to the contrary, dispersion of individual elements. It was found that the greatest concentration of finds from the perspective of their vertical position was located at a depth of 21–40 cm beneath the surface. Concentrations of finds were also relatively steep in the highest layers to a depth of 20 cm
(for pottery quantitatively identical with lower layers). The fewest finds were located in the layers at the bottom. The profile showed that there was also a clear concentration of finds in the northeast part of the feature (table 2, figure 6).
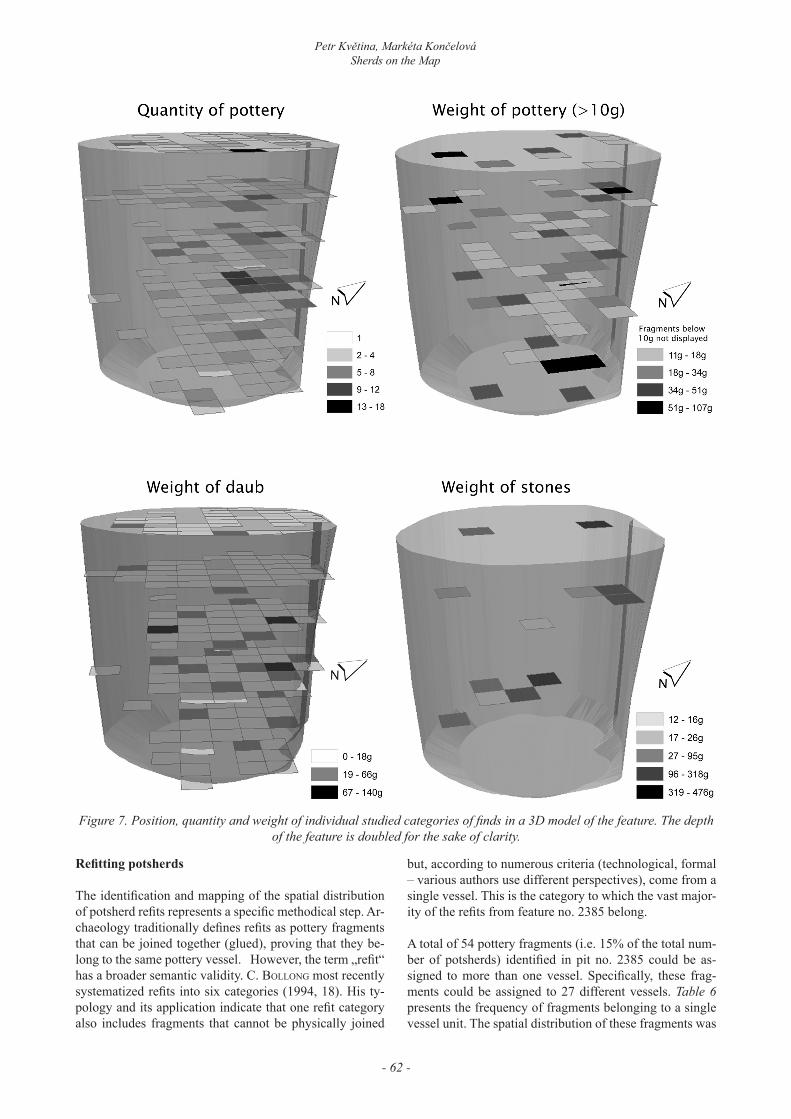
The horizontal arrangement of finds in individually studied layers shows an interesting trend: finds did not accumulate in the centre of the studied feature to a depth of 30 cm, but rather in a ring around the centre; from a depth of 31 cm toward the bottom, objects are grouped in the northeast part of the feature (figure 7). The horizontal spatial distri-bution of the potsherds in individual artificial layers shows that light potsherds are typically found in the centre of the feature, while heavier potsherds are instead scattered in a ring away from the centre. Unlike their numbers, the verti-cal spatial distribution of the potsherd mass does not show grouping in the northeast part of the feature (figure 7). The statistical distribution of potsherd mass by individual lay-ers does not reveal any meaningful pattern (table 3).
Another quality analyzed was the S/W index, which is a parameter calculated from the size (S) category of the potsherd and the thickness of the potsherd wall (W). For
Figure 5. Example of segmental records of feature no. 2385.
Table 2. The number of individual categories of archaeo-logical finds with respect to their vertical position.
- 61 -
P. Verhagen, A. G. Posluschny, A. Danielisovù (eds.)Proceedings EAA 2009: Go Your Own Least Cost Path, Riva del Garda
example, if the potsherd falls into the 80 mm size category and the thickness of the potsherd‘s wall is 5 mm, the S/W index value is 16. If a potsherd of the same size has a wall thickness of 10 mm, the S/W index value is 8. This ex-ample indicates that the larger the S/W index value, the greater the potsherd‘s susceptibility toward greater frag-mentation. The statistical evaluation of central tendencies and quartiles demonstrates that potsherds from a depth of 11-50 cm have a higher S/W index value. On the other hand, pottery from the top and bottom of the feature has lower values (table 4). Nevertheless, the differences be-tween these two groups are not particularly striking.
The horizontal spatial distribution of S/W index values does not reveal any interpretable pattern. The vertical dis-tribution of the S/W index values shows a distinct concen-tration of higher values in the northeast part of the feature (figure 8).
One of the pottery qualities analyzed was potsherd cur-vature. It is assumed that pottery fragments with more distinct curvature could not withstand the formative pro-cesses on the surface for long. This particularly concerns forces such as trampling, burrowing (animals) and blows from other objects which reduce the original large frag-ments of pottery vessels into small potsherds with mini-mal curvature. Therefore, if considerably curved pottery fragments are located inside an archaeological feature, it is likely that they were deposited there intentionally (thrown in by a person).
Pottery fragments were divided into categories on the ba-sis of their curvature value (table 5). The curvature cat-egory could only be evaluated with only 48 out of the total number of 368 potsherds (13%). A spatial analysis of this small amount indicates that potsherds from the category with the highest curvature were not found in either the up-per or in the very lower layers of the feature (table 5). The potsherds with the greatest curvature occurred at the edges of the artefact fill in the plan view of the feature.
In the same way, the horizontal spatial distribution of daub mass in individual artificial layers shows that the heavi-est fragments were not located in the centre of the feature. With the exception of the layer at the depth of 30–40 cm, this also holds true for the middle weight categories (figure 7). The same can be said about the weight distribution of stones, despite the fact that this category cannot essentially be evaluated due to the low number of finds in the feature (figure 7).
Table 3. Quartiles and mean potsherd weight (in grams). Table 4. Quartiles and S/W index parameter means.
Figure 6. Position of finds in sections. Finds from the whole feature are virtually accumulated in 2D space.
Table 5. Frequency of the values of potsherd curvature categories by vertical layers.
- 62 -
Petr Květina, Markéta KončelováSherds on the Map
Refitting potsherds
The identification and mapping of the spatial distribution of potsherd refits represents a specific methodical step. Ar-chaeology traditionally defines refits as pottery fragments that can be joined together (glued), proving that they be-long to the same pottery vessel. However, the term „refit“ has a broader semantic validity. C. boLLonG most recently systematized refits into six categories (1994, 18). His ty-pology and its application indicate that one refit category also includes fragments that cannot be physically joined
but, according to numerous criteria (technological, formal – various authors use different perspectives), come from a single vessel. This is the category to which the vast major-ity of the refits from feature no. 2385 belong.
A total of 54 pottery fragments (i.e. 15% of the total num-ber of potsherds) identified in pit no. 2385 could be as-signed to more than one vessel. Specifically, these frag-ments could be assigned to 27 different vessels. Table 6 presents the frequency of fragments belonging to a single vessel unit. The spatial distribution of these fragments was
Figure 7. Position, quantity and weight of individual studied categories of finds in a 3D model of the feature. The depth of the feature is doubled for the sake of clarity.
- 63 -
P. Verhagen, A. G. Posluschny, A. Danielisovù (eds.)Proceedings EAA 2009: Go Your Own Least Cost Path, Riva del Garda
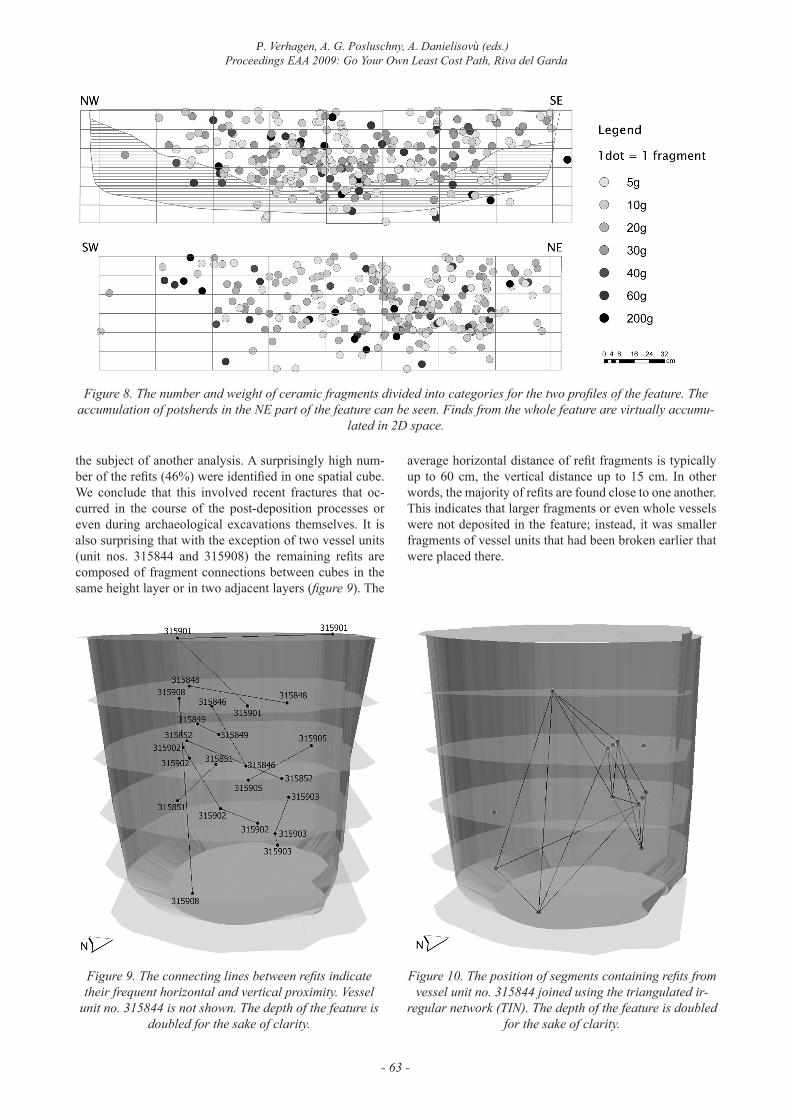
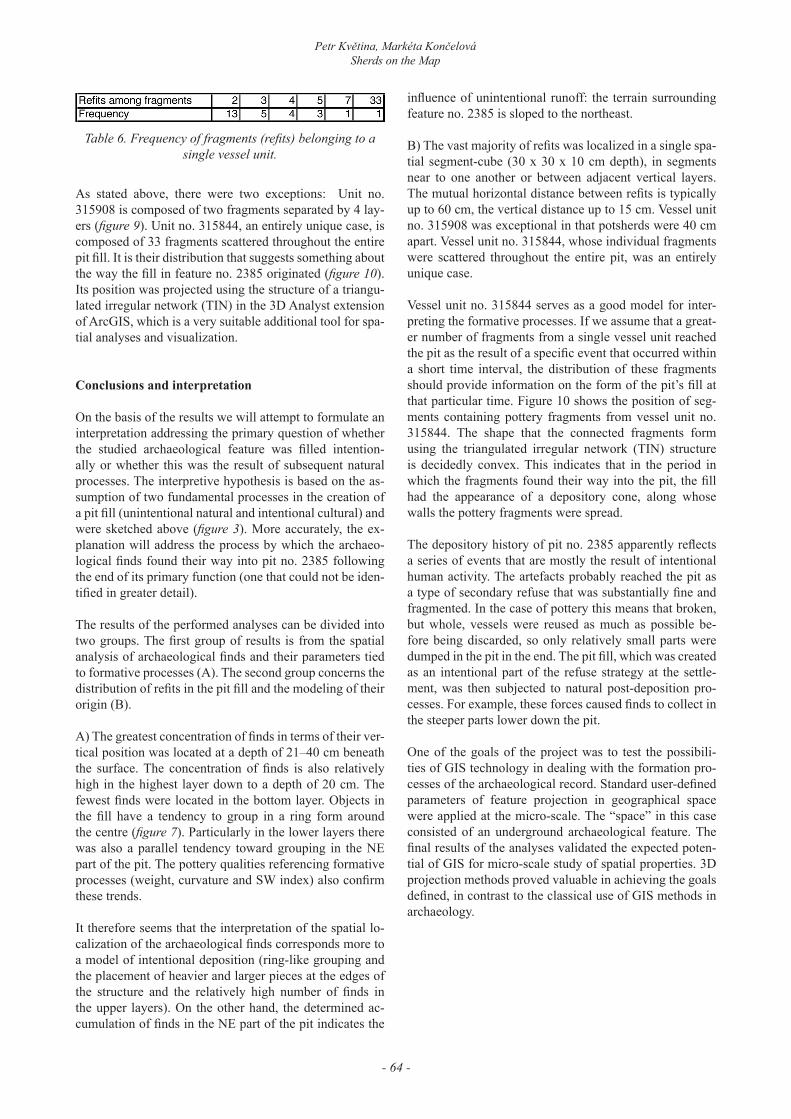
the subject of another analysis. A surprisingly high num-ber of the refits (46%) were identified in one spatial cube. We conclude that this involved recent fractures that oc-curred in the course of the post-deposition processes or even during archaeological excavations themselves. It is also surprising that with the exception of two vessel units (unit nos. 315844 and 315908) the remaining refits are composed of fragment connections between cubes in the same height layer or in two adjacent layers (figure 9). The
average horizontal distance of refit fragments is typically up to 60 cm, the vertical distance up to 15 cm. In other words, the majority of refits are found close to one another. This indicates that larger fragments or even whole vessels were not deposited in the feature; instead, it was smaller fragments of vessel units that had been broken earlier that were placed there.
Figure 8. The number and weight of ceramic fragments divided into categories for the two profiles of the feature. The accumulation of potsherds in the NE part of the feature can be seen. Finds from the whole feature are virtually accumu-
lated in 2D space.
Figure 9. The connecting lines between refits indicate their frequent horizontal and vertical proximity. Vessel
unit no. 315844 is not shown. The depth of the feature is doubled for the sake of clarity.
Figure 10. The position of segments containing refits from vessel unit no. 315844 joined using the triangulated ir-
regular network (TIN). The depth of the feature is doubled for the sake of clarity.
- 64 -
Petr Květina, Markéta KončelováSherds on the Map
As stated above, there were two exceptions: Unit no. 315908 is composed of two fragments separated by 4 lay-ers (figure 9). Unit no. 315844, an entirely unique case, is composed of 33 fragments scattered throughout the entire pit fill. It is their distribution that suggests something about the way the fill in feature no. 2385 originated (figure 10). Its position was projected using the structure of a triangu-lated irregular network (TIN) in the 3D Analyst extension of ArcGIS, which is a very suitable additional tool for spa-tial analyses and visualization.
Conclusions and interpretation
On the basis of the results we will attempt to formulate an interpretation addressing the primary question of whether the studied archaeological feature was filled intention-ally or whether this was the result of subsequent natural processes. The interpretive hypothesis is based on the as-sumption of two fundamental processes in the creation of a pit fill (unintentional natural and intentional cultural) and were sketched above (figure 3). More accurately, the ex-planation will address the process by which the archaeo-logical finds found their way into pit no. 2385 following the end of its primary function (one that could not be iden-tified in greater detail).
The results of the performed analyses can be divided into two groups. The first group of results is from the spatial analysis of archaeological finds and their parameters tied to formative processes (A). The second group concerns the distribution of refits in the pit fill and the modeling of their origin (B).
A) The greatest concentration of finds in terms of their ver-tical position was located at a depth of 21–40 cm beneath the surface. The concentration of finds is also relatively high in the highest layer down to a depth of 20 cm. The fewest finds were located in the bottom layer. Objects in the fill have a tendency to group in a ring form around the centre (figure 7). Particularly in the lower layers there was also a parallel tendency toward grouping in the NE part of the pit. The pottery qualities referencing formative processes (weight, curvature and SW index) also confirm these trends.
It therefore seems that the interpretation of the spatial lo-calization of the archaeological finds corresponds more to a model of intentional deposition (ring-like grouping and the placement of heavier and larger pieces at the edges of the structure and the relatively high number of finds in the upper layers). On the other hand, the determined ac-cumulation of finds in the NE part of the pit indicates the
influence of unintentional runoff: the terrain surrounding feature no. 2385 is sloped to the northeast.
B) The vast majority of refits was localized in a single spa-tial segment-cube (30 x 30 x 10 cm depth), in segments near to one another or between adjacent vertical layers. The mutual horizontal distance between refits is typically up to 60 cm, the vertical distance up to 15 cm. Vessel unit no. 315908 was exceptional in that potsherds were 40 cm apart. Vessel unit no. 315844, whose individual fragments were scattered throughout the entire pit, was an entirely unique case.
Vessel unit no. 315844 serves as a good model for inter-preting the formative processes. If we assume that a great-er number of fragments from a single vessel unit reached the pit as the result of a specific event that occurred within a short time interval, the distribution of these fragments should provide information on the form of the pit’s fill at that particular time. Figure 10 shows the position of seg-ments containing pottery fragments from vessel unit no. 315844. The shape that the connected fragments form using the triangulated irregular network (TIN) structure is decidedly convex. This indicates that in the period in which the fragments found their way into the pit, the fill had the appearance of a depository cone, along whose walls the pottery fragments were spread.
The depository history of pit no. 2385 apparently reflects a series of events that are mostly the result of intentional human activity. The artefacts probably reached the pit as a type of secondary refuse that was substantially fine and fragmented. In the case of pottery this means that broken, but whole, vessels were reused as much as possible be-fore being discarded, so only relatively small parts were dumped in the pit in the end. The pit fill, which was created as an intentional part of the refuse strategy at the settle-ment, was then subjected to natural post-deposition pro-cesses. For example, these forces caused finds to collect in the steeper parts lower down the pit.
One of the goals of the project was to test the possibili-ties of GIS technology in dealing with the formation pro-cesses of the archaeological record. Standard user-defined parameters of feature projection in geographical space were applied at the micro-scale. The “space” in this case consisted of an underground archaeological feature. The final results of the analyses validated the expected poten-tial of GIS for micro-scale study of spatial properties. 3D projection methods proved valuable in achieving the goals defined, in contrast to the classical use of GIS methods in archaeology.
Table 6. Frequency of fragments (refits) belonging to a single vessel unit.
- 65 -
P. Verhagen, A. G. Posluschny, A. Danielisovù (eds.)Proceedings EAA 2009: Go Your Own Least Cost Path, Riva del Garda
References Cited
boLLonG, C. A. 1994: Analysis of the stratigraphy and for-mation processes using patterns of pottery sherd disper-sion, Journal of Field Archaeology 21, 15 – 28.
DeaL, M. 1985: Household Pottery Disposal in the Maya Highlands: An Ethnoarchaeological Interpretation, Journal of Anthropology and Archaeology 4, 243 – 291.
Deboer, W. R. – LaThraP, D. W. 1979: The making and breaking of Shipibo-Conibo ceramics. In: Krammer, C. (ed.): Ethnoarchaeology implications of ethnography for archaeology, New York, 102 – 138.
GrahaM, M. 1994: Mobile Farmers. An Ethnoarchaeo-logical Approach to Settlement Organization among the Rarámuri of Northwestern Mexico, Ann Arbor.
hayDen, B. – cannon, A. 1983: Where the Garbage Goes: Refuse Disposal in the Maya Highlands, Journal of an-thropological archaeology 2, 117 – 163.
chaPMan, J. – GayDarska, B. 2007: Parts and Wholes: Fragmentation in Prehistoric Context, Oxford.
květina, P. 2005: Možnosti mikroprostorové analýzy artefaktů v archeologických objektech. In: Pavlů, I. (ed.): Bylany Varia 3, Prague, 9 – 16.
květina, P.( in print): The spatial analysis of non-ceramic refuse from the Neolithic site at Bylany, Czech Repub-lic, European Journal of Archaeology.
květina, P. – Pavlů, I. 2007: Neolitické sídliště v Bylanech – základní databáze, (Neolithic settlement at Bylany – essential database), Prague.
LasT, J. 1998: The Residue of Yesterday´s Existence: Set-tlement Space and Discard at Miskovice and Bylany. In: Pavlů, I. (ed.): Bylany Varia 1, Prague, 17 – 45.
MiDGLey, M. – Pavlů, I. – ruLf, J. – ZáPoTocká, M. 1993: Fortified settlements or ceremonial sites: new evidence from Bylany, Czechoslovakia, Antiquity 67/254, 91 – 96.
Pavlů, I. 2000: Life on a Neolithic site. Prague.
Pavlů, I. – ruLf, J. – ZáPoTocká, M. 1986: Theses on the Neolithic Site of Bylany, Památky archeologické 77, 288 – 412.
Pavlů, I. – ruLf, J. – ZáPoTocká, M. 1995: Bylany Ron-del. Model of the Neolithic Site, Praehistorica Archaeo-logica Bohemica 1995, Památky archeologické – Sup-plementum 3, 7 – 123.
Pavlů, I. – ZáPoTocká, M. 1978: Analysis of the Czech Ne-olithic Pottery. Projection, Handles and Spouts, Prague.
Pavlů, I. – ZáPoTocká, M. 1983: Bylany. Katalog A-1, Prague.
Pavlů, I. – ZáPoTocká, M. – souDský, O. 1985: Bylany. Katalog A-2, Prague.
Pavlů, I. – ZáPoTocká, M. – souDský, O. 1987: Bylany. Katalog B, F, Prague.
PeŠke, L. – ruLf, J. – sLaVíkoVá, J. 1998: Bylany – ekoda-ta. Specifikace nálezů kostí a rostlinných makrozbytků. In: Pavlů, I. (ed.): Bylany Varia 1, Prague, 83 – 117.
ruLf, J. (ed.) 1989: Bylany Seminar 1987. Collected pa-pers. Prague.
souDský, B. 1962: The Neolithic site of Bylany, Antiquity 36/173, 190 – 200.
souDský, B. 1967. Principles of automatic data treatment applied on Neolithic pottery, Prague, (manuscript of the Institute of Archaeology CAS, Prague).
souDský, B. – Pavlů, I. 1972: The Linear Pottery Culture settlements patterns of Central Europe. In: Ucko, P. J. – Tringham, R. – Dimbleby, G. W. (eds.): Man, settlement and urbanism, London, 317 – 328.
WiLk, R. – schiffer, M. 1979: The archaeology of Vacant Lots in Tucson, Arizona, American Antiquity 44/3, 520 – 536.
Petr Květina Institute of Archaeology CAS, Prague, v.v.i.
Letenská 4,118 01 – Prague 1
Czech Republic [email protected]
Markéta KončelováInstitute of Archaeology CAS, Prague, v.v.i.
Letenská 4,118 01 – Prague 1
Czech Republic [email protected]