1st quarter report - (un-audited) 2022 - psx data portal
TRANSCRIPT

1ST QUARTER REPORT
DEMONSTRATING
COMMITMENT DELIVERING
RESULTS
(Un-audited) 2022

MAPTop Position in Insurance Sector (Financial Category) 36th MAP Corporate Excellence Award
ICAP & ICMAPThird Position among Insurance Companies for Best Corporate Report & Sustainability Award
Lloyd’s Register LRQAISO 9001:2015 (All Functions including Enterprise Risk Management)
FPCCIOutstanding Service in Insurance
Insurance JournalCorporate Social Responsibility Highest Donation (2013-2015)
SAFAJoint 2nd Runner-up Position (Insurance Sector)
AA+PACRA
AA+VIS
B+(Good)AM BEST

02 Corporate Information
04 Directors' Review
07 Directors' Review in Urdu Language
FINANCIAL STATEMENTS
08 Condensed Interim Statement of Financial Position
10 Condensed Interim Statement of Profit and Loss Account
11 Condensed Interim Statement of Comprehensive Income
12 Condensed Interim Statement of Changes in Equity
14 Condensed Interim Statement of Cash Flows
16 Notes to the Condensed Interim Financial Statements
FINANCIAL STATEMENTS - WINDOW TAKAFUL OPERATIONS
33 Condensed Interim Statement of Financial Position of OPF and PTF
34 Condensed Interim Profit and Loss Account
35 Condensed Interim Statement of Comprehensive Income
36 Condensed Interim Statement of Changes in Operator's Fund and Participants' Takaful Fund
37 Condensed Interim Statement of Cash Flows
38 Notes to the Condensed Interim Financial Statements
CONTENTS

JUBILEE GENERAL INSURANCE2
CORPORATE INFORMATION
Chairman of the Board of Directors
R. Zakir Mahmood
Directors
Akbarali Pesnani
John Joseph Metcalf
Amin A. Hashwani
Amyn Currimbhoy
Riyaz Ali Towfiq Chinoy
Murtaza Hashwani
Abrar Ahmed Mir
Nausheen Ahmad
Managing Director and Chief Executive
Hassan Khan
Chief Financial Officer
Nawaid Jamal
Company Secretary
Abdul Wahid
Auditors
A.F. Ferguson & Co. (Chartered Accountants)
Shariah Advisor
Mufti Zeeshan Abdul Aziz
Legal Advisor
Surridge & Beecheno
(Non-Executive Director)
(Non-Executive Director)
(Non-Executive Director)
(Independent Director)
(Independent Director)
(Non-Executive Director)
(Non-Executive Director)
(Independent Director)
(Executive Director)
(Non-Executive Director)

Bankers
Habib Bank Limited Standard Chartered Bank (Pakistan) LimitedUnited Bank LimitedSoneri Bank LimitedBank Alfalah LimitedBankIslami Pakistan Limited Dubai Islamic Bank Pakistan Limited
Share Registrar
THK Associates (Pvt.) Limited, Plot No. 32-C, Jami Commercial Street 2, D.H.A., Phase VII Karachi.UAN: (92-21):111- 000-322 Tel: (92-21) 35310191-93
Head Office / Registered Office
2nd Floor, Jubilee Insurance House, I. I. Chundrigar Road, Karachi, Pakistan.
UAN: (92-21) 111-654-111Toll Free: 0800-03786Tel: (92-21) 32416022-26 Fax: (92-21) 34216728 - 32438738
E-Mail: [email protected]
Website: www.jubileegeneral.com.pk
Quick Response (QR) Code :
National Tax Number
0711347-1
Sales Tax Registration Number
1600980500182
1ST QUARTER REPORT 3
THE DIRECTORS’ REVIEW
2022 2021
........(Rupees in '000).......
31st March 31st March
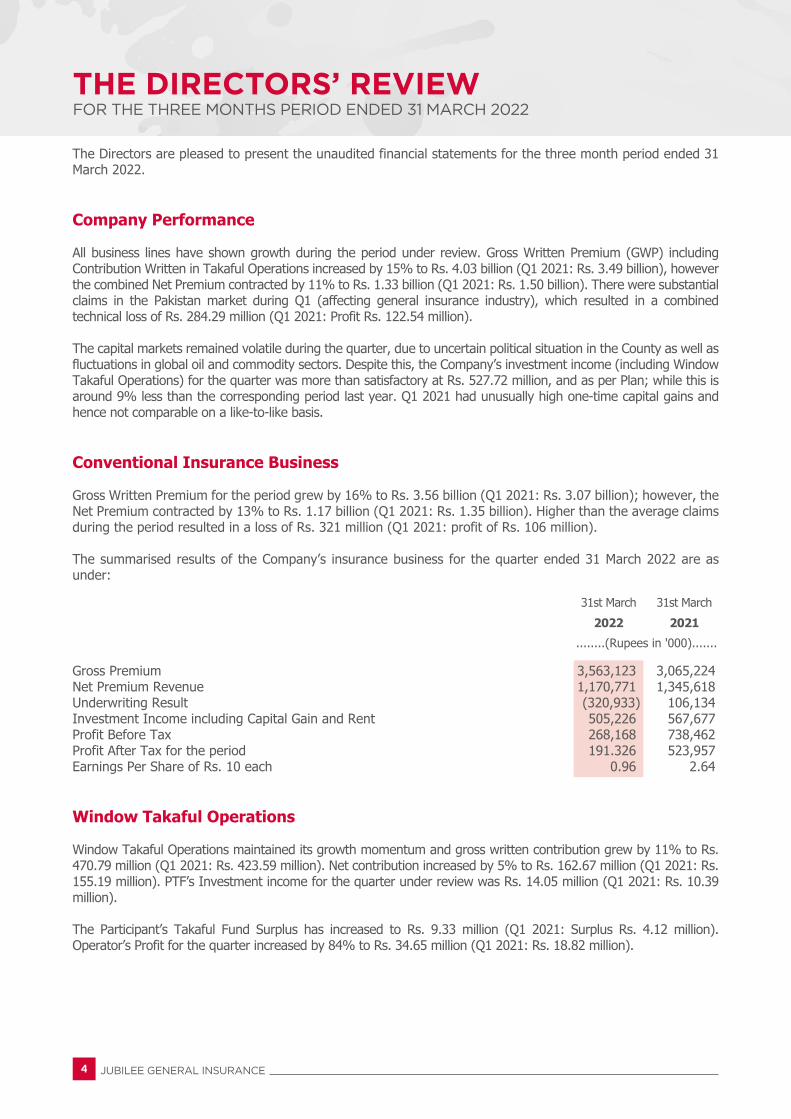
The Directors are pleased to present the unaudited financial statements for the three month period ended 31 March 2022.
Company Performance
All business lines have shown growth during the period under review. Gross Written Premium (GWP) including Contribution Written in Takaful Operations increased by 15% to Rs. 4.03 billion (Q1 2021: Rs. 3.49 billion), however the combined Net Premium contracted by 11% to Rs. 1.33 billion (Q1 2021: Rs. 1.50 billion). There were substantial claims in the Pakistan market during Q1 (affecting general insurance industry), which resulted in a combined technical loss of Rs. 284.29 million (Q1 2021: Profit Rs. 122.54 million).
The capital markets remained volatile during the quarter, due to uncertain political situation in the County as well as fluctuations in global oil and commodity sectors. Despite this, the Company’s investment income (including Window Takaful Operations) for the quarter was more than satisfactory at Rs. 527.72 million, and as per Plan; while this is around 9% less than the corresponding period last year. Q1 2021 had unusually high one-time capital gains and hence not comparable on a like-to-like basis.
Conventional Insurance Business
Gross Written Premium for the period grew by 16% to Rs. 3.56 billion (Q1 2021: Rs. 3.07 billion); however, the Net Premium contracted by 13% to Rs. 1.17 billion (Q1 2021: Rs. 1.35 billion). Higher than the average claims during the period resulted in a loss of Rs. 321 million (Q1 2021: profit of Rs. 106 million).
The summarised results of the Company’s insurance business for the quarter ended 31 March 2022 are as under:
Gross Premium 3,563,123 3,065,224Net Premium Revenue 1,170,771 1,345,618Underwriting Result (320,933) 106,134Investment Income including Capital Gain and Rent 505,226 567,677Profit Before Tax 268,168 738,462Profit After Tax for the period 191.326 523,957Earnings Per Share of Rs. 10 each 0.96 2.64
Window Takaful Operations
Window Takaful Operations maintained its growth momentum and gross written contribution grew by 11% to Rs. 470.79 million (Q1 2021: Rs. 423.59 million). Net contribution increased by 5% to Rs. 162.67 million (Q1 2021: Rs. 155.19 million). PTF’s Investment income for the quarter under review was Rs. 14.05 million (Q1 2021: Rs. 10.39 million).
The Participant’s Takaful Fund Surplus has increased to Rs. 9.33 million (Q1 2021: Surplus Rs. 4.12 million). Operator’s Profit for the quarter increased by 84% to Rs. 34.65 million (Q1 2021: Rs. 18.82 million).
FOR THE THREE MONTHS PERIOD ENDED 31 MARCH 2022
JUBILEE GENERAL INSURANCE4

The summarised results of Company’s Window Takaful Operations for the quarter under review are as follows:
Participants’ FundGross Contribution 470,796 423,592 Net Contribution 162,673 155,186 (Deficit) before Investment Income (1,899) (4,178)Investment Income 14,055 10,392 Surplus for the period 9,333 4,121 Operator’s Fund Revenue Account 38,547 20,587 Investment Income 8,435 4,558 Profit Before Tax 48,802 26,504 Profit After Tax for the period 34,649 18,818
Outlook
The overall political and economic situation remains uncertain - global economies are being affected by the Russian–Ukraine conflict; fluctuating oil and commodities prices; political turmoil within the country, as well as a rising trade deficit, high inflation, etc.; your Directors believe that the general insurance sector, barring any unforeseen calamities (economic or otherwise), is expected to remain relatively stable.
2022 2021
........(Rupees in '000).......
31st March 31st March
Hassan Khan Amyn CurrimbhoyManaging Director & Chief Executive Director
Karachi: 26 April 2022
1ST QUARTER REPORT 5

: � �� � � �� درج ذ��� � � � ��ہ �ل � � � � و�و �� آ��� ز��
� �������������� �
���ر
�� � � ��� ��
�� � � ��� ��
�رى � آ�� � �(�رہ) ����
�رى � آ�� ����
�� اس �ت � ��
�ز �� آ���
� ا�ؤ� ���� ر��
�رى � آ�� ����
�� ��
� از �
�� ��
� از � اس �ت � ��
� � �
�� �ان � �� �ى، � ������ ��ں ��
���� اور ا�س � �� �
���ں � �� وا� ا�ات، �
����� ��� �� � � � � ���� ، روس اور ��
��� ��� �� �
����
� � ��
�� �ر� � �� او ر ا�دى �ر�ل �� ��
�ز � �� � � � � � � ��� آ�ت (ا�دى ��� �� اور)� �وہ �ل ا�ر� � � � � ر� � �� �۔� �� �� �� اور �ر� �رے � �و�د،آپ � ڈا���
�رچ31 �رچ31
2021 2022
470,796
162,673
(1,899)
14,055
9,333
38,547
8,435
48,802
34,649
423,592
155,186
(4,178)
10,392
4,121
20,587
4,558
26,504
18,818
�ن �ن ��� �������� ا��
�� �� �� � � ا��
� � ڈا������ ��������
2022 �ا�:26ا���
�� ��� � ا���� ڈا���
JUBILEE GENERAL INSURANCE6

۔ � �� �� �� �س �� ���� �� ��ارے �� � آڈٹ �ہ ��� �
�� � �� وا� � �� � �� �ز31 �رچ2022 �ا�م ���
� ڈا���
� � �ر�د�
رو� � � ��4.03 � ا�� � �� ��
�15 �� � � � � �� �ہ � ��� � � �� (GWP) �ل �� آ��� ���
� �� ��۔ � � �� � �ِ ��ہ �ت � دوران �� � �م � �ت �� ز��
رو�)۔� � �� � � � ��1.50 رو� ����(2021 � � � ��: � � ��1.33 �� � �� ��
�11�� � � ���/ �� ���� رو�)� �� �� � � � ��3.49 ر�(2021 � � � ��:
رو�(2021 � � � �� �� � ��248.29 ��� �ن ������� � �� �� � �(� � دا� ��(�ں � �ل ا�ر� ا��ى � � �� ��
������� �� �� � دوران ��� �ر��
رو�) ر�۔ � �� 122.54
� � �ر�ل ا�ر��ؤ � �ر ر�۔اس � �و�د � �� � �� �ر����
������� �� � �
� � ا�ر ��ؤ � � ا�س � � �� اور �
� اور �� �
����
� � ��
� � �� � دوران � ���� �ر�ل ��
�� �ل � ا� �ت � �� �ن � ر� �� �� � �� �۔ ��� رو� � �� ا�� � ��527.72 (�
� � � �رى � �� �� وا� آ��(�ل و�و �� آ��� دوران، ����
��۔ � ��
� �� وہ �� ��ے � �� ��� �ر� زا� �،اس �� ��
�رى � �� � ���� �� �ل 2021� � � �� �� ��،� � � ��
�10 ً�� ��� ��
ا�ر� ��� � � ���
رو�(2021 � � ��1.17 �� � �� ��
�13 �� ���� رو�) اور �� � � � رو� (2021 � � � ��: 3.07�� � � � ا�� � ��3.56�� �
��16�� ���
����ہ �ت � دوران � ��� � ز��
رو� ��) � �� ر�۔ � �ن(2021 � � � ��: 106�� � � آ� � 321���� � او� �ح � زا� ������
�� ��ہ � �� � دوران ������ رو�) ر�۔ ز�� � � ��1.35 :�� � � �
:� 31�رچ2022� � �� وا� � �� � دوران � � ا�ر� �رو�ر � �� � �� درج ذ��
�� ����� ��
�� ����� ��
ا�ررا� رز�
� اور �ا��������� �
� �رى � آ�� �ل ������ ����
�� ��
� از �
�� ��
� از � � ��ہ �ت � �� ز��
( � � �� (رو�ں ��� ��
� 10رو� وا� � ا��
��
����ب رو�) �� �� �� � رو� (2021� � � ��: 423.59 �� � ��471.79 �� � � � ا�� � �� �� ��� ��
�11 � اور � � � �ر�د� � ��ہ ��� � � و�و �� آ���
���� �� �� ��� ����� ���� �
�����ہ �ت � دوران � � �ر رو�)۔ز�� � �� 155.19 :�� � � �2021) � رو� ��� � ��162.67 �ا�� � �� �
��5 � �� � � ر�۔�� ���
�رڈ � �۔ رو�)ر�� � رو�(2021� � � ��: 10.39�� � ��14.05 �رى آ�� ��
رو�(2021� � � � � �ھ �34.65�� ��
�84 �� � �� آ��� رو�)����۔� �� � �� � رو�(2021� � � �� ��:4.12�� � �� �� � � �� �ھ � 9.33��
� ����� ���� �
�� �ر
رو�) ����۔ � ��18.82 :�� �� �
�ز � ���� ڈا���
�ا� �ت � �ہ 31 �رچ 2022
............. رو� �� ' 000' .............
�رچ31 �رچ31
20222021
3,065,224
1,345,618
106,134
567,677
738,462
523,957
2.64
3,563,123
1,170,771
(320,933)
505,226
268,168
191.326
0.96
1ST QUARTER REPORT 7

R. Zakir MahmoodChairman
Hassan KhanChief Executive
2022 2021
Note ..............(Rupees in '000)..............(Audited)(Un-audited)
December 31,March 31,
AS AT MARCH 31, 2022
Assets
Property and equipment 7 83,742 90,933
Intangible assets 8 40,678 46,086
Investment properties 9 639,352 640,648
Investments in associates 10 1,018,167 973,680
Investments
Equity securities 11 2,983,026 3,081,110
Debt securities 12 11,214,816 8,280,257
Term deposits 13 159,313 2,669,303
Loans and other receivables 14 192,569 251,212
Insurance / reinsurance receivables 15 2,205,457 1,525,775
Reinsurance recoveries against outstanding claims 5,085,976 3,593,493
Salvage recoveries accrued 22,892 24,531
Deferred commission expense / acquisition cost 26 283,507 247,251
Prepayments 16 2,448,540 2,377,849
Cash & bank 17 2,234,670 1,901,990
Total assets of Window Takaful Operations - Operator's Fund 18 575,648 489,886
Total Assets 29,188,353 26,194,004
JUBILEE GENERAL INSURANCE8
CONDENSED INTERIM STATEMENT OFFINANCIAL POSITION

1ST QUARTER REPORT 9
2022 2021
Note ..............(Rupees in '000)..............(Audited)(Un-audited)
December 31,March 31,
Equity and Liabilities Capital and reserves attributable to Company's equity holders Authorised share capital: 250,000,000 (December 31, 2021: 250,000,000) Ordinary shares of Rs.10 each 2,500,000 2,500,000 Issued, subscribed and paid-up share capital [198,491,241 (December 31, 2021: 198,491,241) Ordinary shares of Rs.10 each] 1,984,912 1,984,912 Reserves 7,124,833 6,335,919 Unappropriated profit 453,443 1,868,869
Total Equity 9,563,188 10,189,700 Liabilities Underwriting provisions Outstanding claims including IBNR 25 6,844,082 5,154,819 Unearned premium reserves 24 5,048,813 4,244,992 Unearned reinsurance commission 26 169,876 148,056 Deferred taxation 19 65,321 67,596 Premium received in advance 207,445 316,455 Insurance / reinsurance payables 20 3,053,416 2,685,463 Other creditors and accruals 21 2,110,450 1,166,102 Deposits and other payables 22 1,566,770 1,617,132 Taxation - provision less payments 219,357 314,855
Total Liabilities 19,285,530 15,715,470 Total liabilities of Window Takaful Operations - Operator's Fund 18 339,635 288,834
19,625,165 16,004,304 Total Equity and Liabilities 29,188,353 26,194,004 Contingencies and commitments 23 The annexed notes from 1 to 35 form an integral part of these condensed interim financial statements.
Amyn CurrimbhoyDirector
Nawaid JamalChief Financial Officer
Amin A. HashwaniDirector

Note ..............(Rupees in '000)..............
2022 2021
Three months period endedMarch 31,March 31,
CONDENSED INTERIM PROFITAND LOSS ACCOUNT (UN-AUDITED)FOR THE THREE MONTHS PERIOD ENDED MARCH 31, 2022
Net insurance premium 24 1,170,771 1,345,618 Net insurance claims 25 960,224 744,961 Net commission and other acquisition costs 26 80,978 84,741
Insurance claims and acquisition expenses 1,041,203 829,703 Management expenses 450,502 409,782
Underwriting results (320,933) 106,134 Investment income 27 423,793 531,180 Rental Income 28 23,060 18,636 Other income 29 64,347 12,104 Other expenses (7,373) (18,828)
Results of operating activities 182,894 649,226 Share of profit of associates 10 36,472 62,732 Profit from Window Takaful Operations 18 48,802 26,504
Profit before tax 268,168 738,462 Income tax expense - Current (69,237) (205,337) - Deferred (7,605) (9,168)
(76,842) (214,505) Profit after tax 191,326 523,957 Earnings (after tax) per share - Rupee 30 0.96 2.64 The annexed notes from 1 to 35 form an integral part of these condensed interim financial statements.
Hassan KhanChief Executive
Amyn CurrimbhoyDirector
Nawaid JamalChief Financial Officer
R. Zakir MahmoodChairman
Amin A. HashwaniDirector
JUBILEE GENERAL INSURANCE10

Profit after tax for the period 191,326 523,957 Other comprehensive income Item that will not be reclassified to profit and loss account in subsequent periods Share in actuarial gain on defined benefit plan of an associate - net of tax (334) 949 Item that may be reclassified to profit and loss account in subsequent periods
Foreign currency translation difference - net of tax 6,629 6,997 Unrealised (diminution) / appreciation on 'available for sale' investments - net of tax (17,905) (155,901) Reclassification adjustment for net gain on disposal of available for sale investments included in profit and loss account - net of tax (11,971) (106,038) (29,876) (261,939) Unrealised appreciation / (diminution) on 'available for sale investments of Window Takaful Operations - net of tax 437 (628) Reclassification adjustment for net gain on disposal of available for sale investments included in profit and loss account Window Takaful Operations - net of tax (125) - 312 (628) Share in other comprehensive income of an associate
Net unrealised (diminution) / appreciation on 'available for sale' investments - net of tax (842) 1,134 Foreign currency translation difference - net of tax 238 (359) (604) 775 Total comprehensive income for the period 167,453 270,111 The annexed notes from 1 to 35 form an integral part of these condensed interim financial statements.
..............(Rupees in '000)..............
2022 2021
Three months period endedMarch 31,March 31,
1ST QUARTER REPORT 11
CONDENSED INTERIM STATEMENT OFCOMPREHENSIVE INCOME (UN-AUDITED)FOR THE THREE MONTHS PERIOD ENDED MARCH 31, 2022
Hassan KhanChief Executive
Amyn CurrimbhoyDirector
Nawaid JamalChief Financial Officer
R. Zakir MahmoodChairman
Amin A. HashwaniDirector

CO
ND
EN
SE
D I
NT
ER
IM S
TAT
EM
EN
T O
FC
HA
NG
ES
IN
EQ
UIT
Y (
UN
-AU
DIT
ED
)FO
R T
HE
TH
RE
E M
ON
TH
S P
ER
IOD
EN
DE
D M
AR
CH
31,
2022
......
......
......
......
......
......
......
......
......
......
......
......
......
......
......
......
......
......
......
......
......
......
... (
Ru
pee
s in
‘00
0)
......
......
......
......
......
......
......
......
......
......
......
......
......
......
......
......
......
......
......
......
......
.....
Shar
eca
pita
l
Cap
ital
res
erve
Res
erve
for
exce
ptio
nal
loss
es
Spec
ial
rese
rve
Gen
eral
rese
rve
Rev
enue
res
erve
s
Tota
l
Att
ribu
tabl
e to
equ
ity
hold
ers
of t
he C
ompa
ny
Unr
ealis
ed
appr
ecia
tion
/ (d
imin
utio
n) o
n re
valu
atio
n of
av
aila
-bl
e-fo
r-sa
le
inve
stm
ents
- ne
t of t
ax
Fore
ign
curr
ency
tr
ansl
atio
n di
ffer
ence
-
net
of t
ax
Com
pany
's s
hare
of
reta
ined
ear
ning
s ar
isin
g fr
om
busi
ness
oth
er t
han
part
icip
atin
g bu
sine
ss
attr
ibut
able
to
shar
ehol
ders
Led
ger
D o
f an
ass
ocia
te
Com
pany
's
shar
e of
mon
ey
cede
d to
waq
f fu
nd b
y an
as
soci
ate
Una
ppro
pria
ted
prof
it
Bal
ance
as
at J
anua
ry 1
, 202
1 -
(aud
ited
) 1,
984,
912
9,
384
48
1,52
2
9,35
4 3
,800
,000
1,
400,
000
24
1,60
5
32
1,62
0,20
0
9,54
7,00
9 Ch
ange
s in
equ
ity fo
r th
e pe
riod
ende
d M
arch
31,
202
1 To
tal c
ompr
ehen
sive
inco
me
for
the
peri
od
Prof
it af
ter
tax
-
-
-
-
-
-
-
-
52
3,95
7
523,
957
Ledg
er D
bal
ance
s -
-
-
-
-
-
11,1
99
-
(11,
199)
-
Oth
er c
ompr
ehen
sive
inco
me
Fore
ign
curr
ency
tran
slat
ion
diffe
renc
e -
net o
f tax
-
-
-
6,99
7
-
-
-
-
-
6,99
7 Sh
are
in o
ther
com
preh
ensi
ve in
com
e of
an
asso
ciat
e -
-
1,
134
(3
59)
-
-
-
-
949
1,
724
Oth
er c
ompr
ehen
sive
inco
me
of W
indo
w
Ta
kafu
l Ope
ratio
ns -
Ope
rato
r's F
und
- ne
t of t
ax
-
-
(628
) -
-
-
-
-
-
(6
28)
Unre
alis
ed a
ppre
ciat
ion
on r
eval
uatio
n of
avai
labl
e-fo
r-sa
le in
vest
men
ts -
net
of t
ax
-
-
(155
,901
) -
-
-
-
-
-
(1
55,9
01)
Recl
assi
ficat
ion
adju
stm
ent f
or n
et g
ain
on s
ale
of
av
aila
ble-
for-
sale
inve
stm
ents
incl
uded
in th
e pr
ofit
an
d lo
ss a
ccou
nt -
net
of t
ax
-
-
(106
,038
) -
-
-
-
-
-
(1
06,0
38)
-
-
(2
61,4
33)
6,63
8
-
-
11,1
99
-
513,
707
27
0,11
1 B
alan
ce a
s at
Mar
ch 3
1, 2
021
(un-
audi
ted)
1,
984,
912
9,
384
22
0,08
9
15,9
92
3,80
0,00
0
1,40
0,00
0
252,
804
32
2,
133,
907
9,
817,
120
JUBILEE GENERAL INSURANCE12
1ST QUARTER REPORT 13
Shar
eca
pita
l
Cap
ital
res
erve
Res
erve
for
exce
ptio
nal
loss
es
Spec
ial
rese
rve
Gen
eral
rese
rve
Rev
enue
res
erve
s
Tota
l
Att
ribu
tabl
e to
equ
ity
hold
ers
of t
he C
ompa
ny
Unr
ealis
ed
appr
ecia
tion
/ (d
imin
utio
n) o
n re
valu
atio
n of
av
aila
-bl
e-fo
r-sa
le
inve
stm
ents
- ne
t of t
ax
Fore
ign
curr
ency
tr
ansl
atio
n di
ffer
ence
-
net
of t
ax
Com
pany
's s
hare
of
reta
ined
ear
ning
s ar
isin
g fr
om
busi
ness
oth
er t
han
part
icip
atin
g bu
sine
ss
attr
ibut
able
to
shar
ehol
ders
Led
ger
D o
f an
ass
ocia
te
Com
pany
's
shar
e of
mon
ey
cede
d to
waq
f fu
nd b
y an
as
soci
ate
Una
ppro
pria
ted
prof
it
......
......
......
......
......
......
......
......
......
......
......
......
......
......
......
......
......
......
......
......
......
......
......
(R
up
ees
in ‘0
00
) ...
......
......
......
......
......
......
......
......
......
......
......
......
......
......
......
......
......
......
......
......
......
.
Has
san
Kha
nCh
ief E
xecu
tive
Am
yn C
urri
mbh
oyD
irect
orN
awai
d Ja
mal
Chie
f Fin
anci
al O
ffic
er
R. Z
akir
Mah
moo
dCh
airm
anA
min
A. H
ashw
ani
Dire
ctor
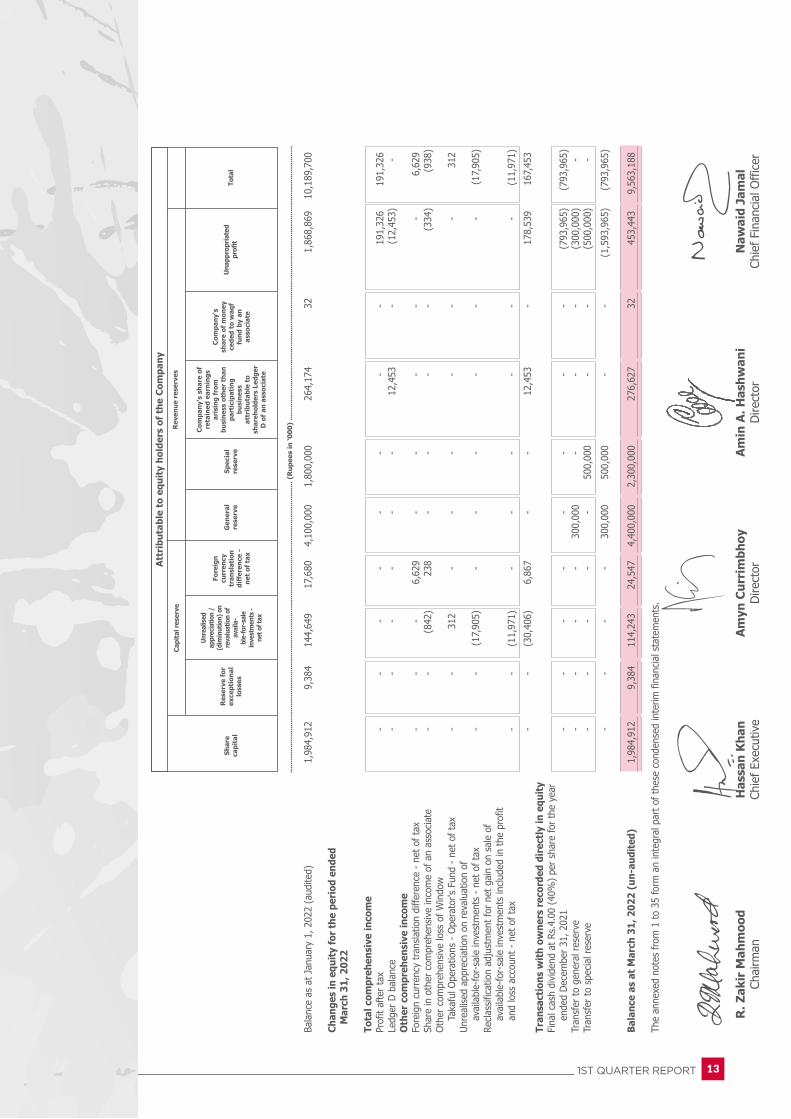
Bala
nce
as a
t Jan
uary
1, 2
022
(aud
ited)
1,
984,
912
9,
384
14
4,64
9
17,6
80
4,10
0,00
0
1,80
0,00
0
264,
174
32
1,
868,
869
10
,189
,700
Ch
ange
s in
equ
ity
for
the
peri
od e
nded
M
arch
31,
202
2 To
tal c
ompr
ehen
sive
inco
me
Prof
it af
ter
tax
-
-
-
-
-
-
-
-
191,
326
19
1,32
6 Le
dger
D b
alan
ce
-
-
-
-
-
-
12,4
53
-
(1
2,45
3)
-
Oth
er c
ompr
ehen
sive
inco
me
Fore
ign
curr
ency
tran
slat
ion
diffe
renc
e -
net o
f tax
-
-
-
6,62
9
-
-
-
-
-
6,
629
Shar
e in
oth
er c
ompr
ehen
sive
inco
me
of a
n as
soci
ate
-
-
(842
) 23
8
-
-
-
-
(334
) (9
38)
Oth
er c
ompr
ehen
sive
loss
of W
indo
w
T
akaf
ul O
pera
tions
- O
pera
tor's
Fun
d -
net o
f tax
-
-
31
2
-
-
-
-
-
-
312
Unre
alis
ed a
ppre
ciat
ion
on r
eval
uatio
n of
ava
ilabl
e-fo
r-sa
le in
vest
men
ts -
net
of t
ax
-
-
(17,
905)
-
-
-
-
-
-
(1
7,90
5)Re
clas
sific
atio
n ad
just
men
t for
net
gai
n on
sal
e of
ava
ilabl
e-fo
r-sa
le in
vest
men
ts in
clud
ed in
the
prof
it
and
loss
acc
ount
- n
et o
f tax
-
-
(1
1,97
1)
-
-
-
-
-
-
(11,
971)
-
-
(3
0,40
6)
6,86
7
-
-
12,4
53
-
17
8,53
9
167,
453
Tran
sact
ions
wit
h ow
ners
rec
orde
d di
rect
ly in
equ
ity
Fina
l cas
h di
vide
nd a
t Rs.
4.00
(40
%)
per
shar
e fo
r th
e ye
ar
end
ed D
ecem
ber
31, 2
021
-
-
-
-
-
-
-
-
(793
,965
) (7
93,9
65)
Tran
sfer
to g
ener
al r
eser
ve
-
-
-
-
300,
000
-
-
-
(300
,000
) -
Tr
ansf
er to
spe
cial
res
erve
-
-
-
-
-
500,
000
-
-
(5
00,0
00)
-
-
-
-
-
30
0,00
0
500,
000
-
-
(1
,593
,965
) (7
93,9
65)
Bal
ance
as
at M
arch
31,
202
2 (u
n-au
dite
d)
1,98
4,91
2
9,38
4
114,
243
24
,547
4,
400,
000
2,
300,
000
27
6,62
7
32
453,
443
9,
563,
188
The
anne
xed
note
s fr
om 1
to 3
5 fo
rm a
n in
tegr
al p
art o
f the
se c
onde
nsed
inte
rim fi
nanc
ial s
tate
men
ts.

..............(Rupees in '000)..............
2022 2021
Three months period endedMarch 31,March 31,
CONDENSED INTERIM STATEMENTOF CASH FLOWS (UN-AUDITED)FOR THE THREE MONTHS PERIOD ENDED MARCH 31, 2022
Operating cash flows (a) Underwriting activities Insurance premium received 2,808,656 2,371,627 Reinsurance premium paid (1,265,281) (1,325,517) Claims paid (923,245) (977,240) Reinsurance and other recoveries received 118,013 213,064 Commissions paid (179,782) (198,336) Commissions received 107,125 92,310 Management expenses paid (381,486) (349,112) Net cash inflow/ (outflow) from underwriting activities 284,000 (173,203) (b) Other operating activities Income taxes paid (150,582) (149,014) General and administration expenses paid (2,988) (4,589) Other operating payments (374,574) (288,359) Other operating receipts 430,502 535,822 Loans advanced (78) (662) Loans repayment received 210 248 Net cash (outflow) /inflow from other operating activities (97,510) 93,446 Total cash inflow / (outflow) from all operating activities 186,490 (79,757) Investment activities Profit / return received 380,563 281,763 Dividends received 83,095 60,018 Rentals received - net of expenses (10,350) 11,473 Payments for investments / investment property (10,314,252) (7,098,590) Proceeds from investments 7,492,042 6,853,466 Fixed capital expenditure (677) (5,518) Proceeds from sale of property and equipment - 37 Total cash inflow from investing activities (2,369,579) 102,649 Financing activities Dividends paid (1,883) (94) Principal repayment of lease liabilities against right of use asset - (181)Total cash outflow from financing activities (1,883) (275) Net cash (outflow) / inflow from all activities (2,184,972) 22,617 Cash at beginning of the period 4,434,642 980,289 Cash at end of the period 2,249,670 1,002,906
JUBILEE GENERAL INSURANCE14

1ST QUARTER REPORT 15
Reconciliation to profit and loss account Operating cash flows 186,490 (79,757) Depreciation / amortisation expense (13,259) (23,728) (Loss) on sale of property and equipment (17) (469) (Loss) on remeasurement of investments at fair value through profit or loss (5,602) (2,501) Profit on disposal of investments 46,642 215,943 Dividend income 106,916 98,671 Rental income 23,060 18,636 Other investment income 370,682 299,660 Profit for the period from Window Takaful Operations 34,649 18,818 Increase in assets other than cash 2,264,333 472,389 (Increase) in liabilities other than borrowings (2,822,568) (493,704) Profit after taxation 191,326 523,957 Cash for the purposes of the statement of cash flows consists of: Cash and bank deposits Cash and other equivalents Cash 1,079 854 Policy stamps and bond papers in hand 1,971 4,159 3,050 5,013 Current and other accounts Current accounts 117,625 106,356 Profit and Loss savings accounts 2,113,995 873,930 2,231,620 980,286 Deposits having maturity within 3 months (payable on demand) Term deposits - local currency 15,000 - Term deposits - foreign currency - 17,607 15,000 17,607 2,249,670 1,002,906 Definition of cash and cash equivalents Cash and cash equivalents comprises of cash in hand, policy stamps, bond papers, cheques in hand, bank balances
and other deposits which are readily convertible to cash in hand and which are used in the cash management function on a day-to-day basis.
The annexed notes from 1 to 35 form an integral part of these condensed interim financial statements.
Hassan KhanChief Executive
Amyn CurrimbhoyDirector
Nawaid JamalChief Financial Officer
R. Zakir MahmoodChairman
Amin A. HashwaniDirector
..............(Rupees in '000)..............
2022 2021
Three months period endedMarch 31,March 31,

1. LEGAL STATUS AND NATURE OF BUSINESS
Jubilee General Insurance Company Limited (the Company) is a public limited company incorporated in Pakistan on May 16, 1953. The Company is listed in the Pakistan Stock exchange and is engaged in general insurance business. The registered office of the Company is situated at 2nd Floor, Jubilee Insurance House, I. I. Chundrigar Road, Karachi.
The Company was granted authorisation on March 10, 2015 under Rule 6 of the Takaful Rules, 2012 to undertake Takaful Window Operations (WTO) in respect of general takaful products by Securities and Exchange Commission of Pakistan (SECP) and subsequently the Company commenced Window Takaful Operations on May 7, 2015.
2. BASIS OF PREPARATION AND STATEMENT OF COMPLIANCE
These condensed interim financial statements have been prepared in accordance with the format prescribed under Insurance Rules, 2017 and these should be read in conjunction with the annual audited financial statements of the Company for the year ended December 31, 2021.
2.1 Statement of Compliance 2.1.1 These condensed interim financial statements have been prepared in accordance with the accounting and
reporting standards as applicable in Pakistan for interim financial reporting. The accounting and reporting standards as applicable in Pakistan for interim financial reporting comprise of:
- International Financial Reporting Standards (IFRS) issued by the International Accounting Standards Board (IASB) as are notified under the Companies Act, 2017; and
- Provisions of and directives issued under the Companies Act, 2017, the Insurance Ordinance, 2000, the Insurance Rules, 2017, the Insurance Accounting Regulations, 2017, the Takaful Rules, 2012 and the General Takaful Accounting Regulations, 2019.
In case requirements differ, the provisions or directives of the Companies Act, 2017, the Insurance Ordinance, 2000, the Insurance Rules, 2017, the Insurance Accounting Regulations, 2017, the Takaful Rules, 2012 and the General Takaful Accounting Regulations, 2019 shall prevail.
2.1.1 Total assets, total liabilities and profit / (loss) of the Window Takaful Operations of the Company (referred to as the Operator's Fund) have been presented in these financial statements in accordance with the requirements of the General Takaful Accounting Regulations, 2019.
2.1.2 A separate set of financial statements of the Window Takaful Operations has been annexed to these condensed interim financial statements as per the requirements of the Takaful Rules, 2012.
2.1.3 The disclosures made in these condensed interim financial statements have, however, been limited based on the requirements of the International Accounting Standard 34: 'Interim Financial Reporting'. These condensed interim financial statements do not include all the information and disclosures required in a full set of financial statements and should be read in conjunction with the annual audited financial statements of the Company for the year ended December 31, 2021.
NOTES TO AND FORMING PART OF THECONDENSED INTERIM FINANCIALSTATEMENTS (UN-AUDITED)FOR THE THREE MONTHS PERIOD ENDED MARCH 31, 2022
JUBILEE GENERAL INSURANCE16
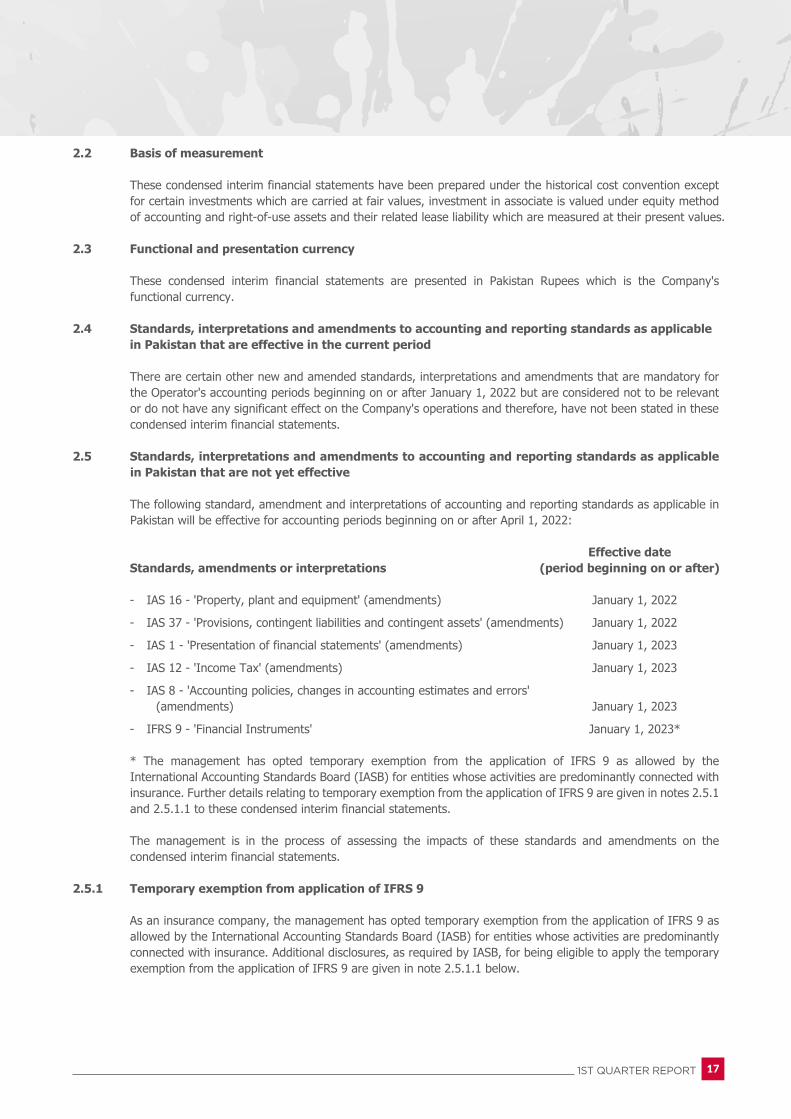
2.2 Basis of measurement
These condensed interim financial statements have been prepared under the historical cost convention except for certain investments which are carried at fair values, investment in associate is valued under equity method of accounting and right-of-use assets and their related lease liability which are measured at their present values.
2.3 Functional and presentation currency
These condensed interim financial statements are presented in Pakistan Rupees which is the Company's functional currency.
2.4 Standards, interpretations and amendments to accounting and reporting standards as applicable in Pakistan that are effective in the current period
There are certain other new and amended standards, interpretations and amendments that are mandatory for the Operator's accounting periods beginning on or after January 1, 2022 but are considered not to be relevant or do not have any significant effect on the Company's operations and therefore, have not been stated in these condensed interim financial statements.
2.5 Standards, interpretations and amendments to accounting and reporting standards as applicable in Pakistan that are not yet effective
The following standard, amendment and interpretations of accounting and reporting standards as applicable in
Pakistan will be effective for accounting periods beginning on or after April 1, 2022:
Effective date Standards, amendments or interpretations (period beginning on or after) - IAS 16 - 'Property, plant and equipment' (amendments) January 1, 2022
- IAS 37 - 'Provisions, contingent liabilities and contingent assets' (amendments) January 1, 2022
- IAS 1 - 'Presentation of financial statements' (amendments) January 1, 2023
- IAS 12 - 'Income Tax' (amendments) January 1, 2023
- IAS 8 - 'Accounting policies, changes in accounting estimates and errors' (amendments) January 1, 2023
- IFRS 9 - 'Financial Instruments' January 1, 2023* * The management has opted temporary exemption from the application of IFRS 9 as allowed by the
International Accounting Standards Board (IASB) for entities whose activities are predominantly connected with insurance. Further details relating to temporary exemption from the application of IFRS 9 are given in notes 2.5.1 and 2.5.1.1 to these condensed interim financial statements.
The management is in the process of assessing the impacts of these standards and amendments on the condensed interim financial statements.
2.5.1 Temporary exemption from application of IFRS 9 As an insurance company, the management has opted temporary exemption from the application of IFRS 9 as
allowed by the International Accounting Standards Board (IASB) for entities whose activities are predominantly connected with insurance. Additional disclosures, as required by IASB, for being eligible to apply the temporary exemption from the application of IFRS 9 are given in note 2.5.1.1 below.
1ST QUARTER REPORT 17

2.5.1.1 Fair value of financial assets as at March 31, 2022 and change in the fair values during the three months ended March 31, 2022
Financial assets with contractual cash flows that meet As at the SPPI criteria, excluding those held for trading March 31, 2022 (Rupees in '000) Pakistan Investment Bonds - Held to maturity (note 12) Opening fair value 48,785 Additions / (disposals) during the period - net - Decrease in fair value (610)
Closing fair value 48,175 Debt Securities Available for sale - Available for sale (note 12) Opening fair value 8,228,515 Additions / (disposals) during the period - net 2,967,071 Decrease in fair value (32,315)
Closing fair value 11,163,271 Financial assets that do not meet the SPPI criteria Equity Securities - Available for sale (note 11) Opening fair value 2,908,597 Additions / (disposals) during the period - net (88,603)
Decrease in fair value (9,763)
Closing fair value 2,810,231
The fair value of the remaining financial assets are not significantly different from their carrying amounts since these assets are short term in nature or are frequently repriced to market rate.
There are certain new and amended standards, interpretations and amendments that are mandatory for the
Company's accounting periods beginning on or after January 1, 2022 but are considered not to be relevant or do not have any significant effect on the Company's operations and therefore not stated in these condensed interim financial statements.
3. SUMMARY OF SIGNIFICANT ACCOUTING POLICIES The accounting policies and method of computation followed in these condensed interim financial statements are
same as compared to the annual financial statements of the Company as at and for the year ended December 31, 2021.
4. CRITICAL ACCOUNTING ESTIMATES AND JUDGMENTS The preparation of condensed interim financial statements requires management to make judgments, estimates
and assumptions that affect the application of accounting policies and the reported amounts of assets and liabilities, income and expense. Actual results may differ from these estimates. Estimates and underlying assumptions are reviewed on an ongoing basis. Revision to estimates are recognised prospectively. In preparing these condensed interim financial statements, the significant judgments made by management in applying the Company’s accounting policies and the key sources of estimation uncertainty were the same as those that applied to the financial statements as at and for the year ended December 31, 2021.
5. INSURANCE AND FINANCIAL RISK MANAGEMENT The insurance and financial risk management objectives and policies are consistent with those disclosed in the
annual audited financial statements of the Company for the year ended December 31, 2021.
JUBILEE GENERAL INSURANCE18

6. PREMIUM DEFICIENCY RESERVE No provision has been made in the condensed interim financial statements as the unearned premium reserve for
each class of business at period end is adequate to meet the expected future liability after reinsurance from claims and other expenses, expected to be incurred after the reporting date in respect of policies in force at the reporting date.
7. PROPERTY AND EQUIPMENT Operating assets 83,742 90,933 7.1 The break-up of operating assets as at the period / year end is given below: Building 3,987 4,044 Furniture and fixtures 21,824 22,849 Office equipment 27,334 28,595 Tracker equipment 7,052 9,539 Motor vehicles 5,654 5,826 Computers and related accessories 17,561 18,758 Right-of-use asset - building 330 1,322 83,742 90,933 7.2 Movement of property and equipment during the period / year is as follows: Opening book value 90,933 135,500 Add: Additions during the period / year Owned assets 677 7,961
91,610 143,461 Less: Net book value of assets disposed off during the period / year (17) (3,908) Less: Depreciation for the period / year (7,851) (48,620)
83,742 90,933
8. INTANGIBLE ASSETS Computer Software 40,678 46,086 Movement of intangible assets during the period / year is as follows : Opening book value 46,086 61,991 Add: Additions during the period / year - 6,086
46,086 68,077 Less: Amortisation for the period / year (5,408) (21,991)
40,678 46,086 9. INVESTMENT PROPERTIES The market value of the investment properties as per valuations carried out by professional valuers in 2021 and
as ascertained by the management is Rs. 3,746,714 thousands.
1ST QUARTER REPORT 19
2022 2021
..............(Rupees in '000)..............(Audited)(Un-audited)
December 31,March 31,

10. INVESTMENT IN ASSOCIATES
2022 2021 Face 2022 2021 Number of shares value per share Note ....... (Rupees in '000) ....... (Rupees) Quoted 5,611,592 5,611,592 10 Jubilee Life Insurance Company Limited 10.1 840,312 804,534 (JLIC) (Chief Executive Officer - Javed Ahmed)
(KGS) Unquoted 29,250,000 29,250,000 1 Jubilee Kyrgyzstan Insurance Company 10.2 177,855 169,146 Limited (JKIC) (incorporated in Kyrgyzstan) (Chief Executive: Khegai V.I.) 10.3 1,018,167 973,680
10.1 JLICL is engaged in life insurance business. Market value of investment and percentage of holding in associate are Rs. 1,122,318 thousands and 6.43% (December 31, 2021: Rs. 1,212,104 thousands and 6.43% respectively) respectively.
10.2 JKIC is a closed joint stock company and is engaged in the business of life and non-life insurance. The break-up-value of investment is Rs. 5.89 (2021: Rs. 5.60) per share and percentage of holding in associate is 19.5% (2021: 19.5%). The Company assessed the recoverable amount of investment in JKIC based on value-in-use calculation. Based on the valuation, the recoverable amount exceeds the carrying amount and accordingly, no impairment has been recognised in respect of JKIC for the period ended March 31, 2022 (2021: Rs. Nil).
(Un-audited)
March 31,
(Audited)
December 31,
(Un-audited) (Un-audited) (Un-audited)(Audited) (Audited) (Audited)
............................................................ (Rupees in '000) ..............................................................
Beginning of period / year 804,534 766,222 169,146 144,837 973,680 911,059
Share of profit / (loss) during the period / year 37,099 137,240 (627) 14,364 36,472 151,604
Less: Dividend received during the period / year - (92,591) - (1,975) - (94,566)
Foreign currency translation difference 335 (193) 9,336 11,920 9,671 11,727
Net unrealised appreciation on available -
for sale investment (1,186) (7,480) - - (1,186) (7,480)
Actuarial (loss) / gain on defined benefit plan (470) 1,336 - - (470) 1,336
End of the period / year 840,312 804,534 177,855 169,146 1,018,167 973,680
JLICL
2022 2021
Total
2022 2021
JKIC
2022 2021
10.3 Movement of investment in associates is as follows:
March 31, March 31, March 31,December 31, December 31, December 31,
11. INVESTMENTS IN EQUITY SECURITIES
Available for sale
Related parties Listed shares 560,975 482,126 560,975 497,967 Mutual Funds 1,268 4,416 1,268 4,609 562,243 486,542 562,243 502,576 Others Listed Shares 2,075,237 2,321,190 2,163,834 2,403,521 Unlisted Shares 2,500 2,500 2,500 2,500 2,077,737 2,323,690 2,166,334 2,406,021 Investment at fair value through profit or loss Listed Shares 178,355 172,794 177,562 172,513 2,818,335 2,983,026 2,906,139 3,081,110
(Un-audited)
CostCarrying value Market Value
(Rupees in ‘000)
(Audited)
CostCarrying value Market Value
March 31, 2022 December 31, 2021
JUBILEE GENERAL INSURANCE20

2022 2021
..............(Rupees in '000)..............(Audited)(Un-audited)
December 31,March 31,
12. INVESTMENTS IN DEBT SECURITIES
Government securities Held to maturity Pakistan Investment Bonds 12.1 51,545 51,545 51,741 51,741 Available for sale Pakistan Investment Bonds 12.1 2,347,933 2,353,219 2,329,775 2,365,344 Treasury Bills 8,816,910 8,810,053 5,867,970 5,863,172
11,164,843 11,163,271 8,197,745 8,228,516 11,216,388 11,214,816 8,249,486 8,280,257
Cost
(Rupees in ‘000)
Cost Carrying value
12.1 Pakistan Investment Bonds with face value of Rs. 200,000 thousands (31 December 2021: Rs. 200,000 thousands) are placed with State Bank of Pakistan under Section 29 of the Insurance Ordinance, 2000.
13. INVESTMENTS IN TERM DEPOSITS
Held to maturity
Deposits maturing within 12 months Term deposits - local currency 13.1 & 13.2 45,750 2,530,750 Term deposits - foreign currency 113,563 138,553 159,313 2,669,303 13.1 This includes Rs.5,750 thousands (2021: Rs.5,750 thousands) placed under lien with commercial banks against
bank guarantees. 13.2 This includes an amount of Rs. 40,000 thousands (2021: Rs. 1,525,000 thousands) held with a related party.
14. LOANS AND OTHER RECEIVABLES - CONSIDERED GOOD
Accrued Investment income 56,432 96,900 Security deposit 30,685 36,280 Advance to suppliers 78,049 78,049 Loans to employees 959 1,091 Sales tax recoverable 10,136 20,947 Medical claims recoverable 5,159 6,118 Receivables against sale of Investment - 5,031 Other receivables 11,149 6,796
192,569 251,212
Note
Note
2022 2021
..............(Rupees in '000)..............(Audited)(Un-audited)
December 31,March 31,
(Un-audited) (Audited)
March 31, 2022 December 31, 2021
1ST QUARTER REPORT 21

15. INSURANCE / RE-INSURANCE RECEIVABLES
Due from Insurance contract holders 15.1 2,272,379 1,636,124 Less: provision for impairment of receivables from Insurance contract holders (174,961) (174,961) 2,097,418 1,461,163 Due from other Insurers / reinsurers 125,039 81,612 Less: provision for impairment of receivables from other Insurance / re-insurance (17,000) (17,000) 108,039 64,612 2,205,457 1,525,775 15.1 Due from Insurance contract holders includes Rs. 149,389 thousands (2021: Rs. 73,188 thousands) due from
related parties.
16. PREPAYMENTS
Prepaid reinsurance premium ceded 2,393,278 2,339,417 Prepaid rent 13,070 17,140 Prepaid miscellaneous expenses 42,192 21,292 2,448,540 2,377,849
17. CASH & BANK
Cash and cash equivalents - Cash in hand 1,079 56 - Policy and revenue stamps and Bond papers 1,971 2,817 3,050 2,873 Cash at bank 17.1 - Current accounts 117,625 84,031 - Savings accounts 2,113,995 1,815,086 2,231,620 1,899,117 2,234,670 1,901,990 17.1 Cash at bank includes Rs. 105,647 thousands (2021: Rs. 104,676 thousands) held with related party.
18. WINDOW TAKAFUL OPERATIONS Assets Cash and bank deposits 263,173 258,206 Investments 72,355 56,261 Property and equipment and intangible assets 2,127 2,224 Other assets 237,993 173,195 Total Assets 575,648 489,886 Total Liabilities 339,635 288,834
Profit before tax for the period 48,802 26,504
Details of assets and liabilities and segment disclosures of Window Takaful Operations are stated in annexed condensed interim financial information.
JUBILEE GENERAL INSURANCE22
2022 2021
..............(Rupees in '000)..............(Audited)(Un-audited)
December 31,March 31,
..............(Rupees in '000)..............2022 2021
Three months period endedMarch 31,March 31,

..............(Rupees in '000)..............2022 2021
Three months period endedMarch 31,March 31,
19. DEFERRED TAXATION - NET Deferred tax credits arising in respect of: Share of profit of associates 266,563 255,986 Right-of-use asset - net 96 383 Foreign currency translation difference 9,728 7,021 Unrealised appreciation on revaluation of available-for-sale investments 48,276 60,480
324,663 323,870 Deferred tax debits arising in respect of: Accelerated tax depreciation (1,862) (881) Share in other comprehensive (loss) of an associate (714) (467) Actuarial loss on defined benefit plan (17,882) (17,746) Provision for doubtful debts (55,669) (55,669) Impairment on available-for-sale investments (111,889) (109,993) Other provisions (71,326) (71,518)
(259,342) (256,274) 65,321 67,596 20. INSURANCE / REINSURANCE PAYABLES Due to insurance contract holders 92,586 101,744 Due to other insurers / reinsurers 2,960,830 2,583,719
3,053,416 2,685,463 21. OTHER CREDITORS AND ACCRUALS Agent commission payable 462,073 439,315 Federal Excise Duty and Sales Tax 168,711 134,588 Federal Insurance Fee 6,559 4,985 Workers' Welfare Fund 279,948 275,563 Tax deducted at source 8,826 11,143 Accrued expenses 122,209 49,622 Claims payable-stale cheques 75,669 74,173 Unclaimed dividend 140,667 142,550 Unpaid dividend 793,965 - Others 51,823 34,163
2,110,450 1,166,102
22. DEPOSITS AND OTHER PAYABLES
Advance rent 22.1 16,137 50,842 Security deposits against bond insurance 1,542,840 1,558,527 Other deposits 7,793 7,763
1,566,770 1,617,132 22.1 This includes an amount of Rs. 10,915 thousands (December 31, 2021 : Rs. 12,367 thousands) received from a
related party.
1ST QUARTER REPORT 23
2022 2021
..............(Rupees in '000)..............(Audited)(Un-audited)
December 31,March 31,

JUBILEE GENERAL INSURANCE24
23. CONTINGENCIES
The status of the contingencies remains unchanged as disclosed in the annual audited financial statements as at December 31, 2021,except for the following:
During the period, the Assistant Commissioner - Sindh Board of Revenue (SRB) has issued order under section 23, 43(3), 43(12), and 44 of the Sindh Sales Tax on Services Act, 2011 and created a demand of Rs. 1,197,631 thousands by charging sales tax on reinsurance premium ceded and commission received by the Company during the period from July 2014 to June 2015. The Company has filed an appeal against the order with the Commissioner - SRB which is pending adjudication. Based on the tax advisor's opinion, the management is confident of a favourable outcome of the appeal. Hence, no provision has been made in these condensed interim financial statements.
- There are no material commitments outstanding as at March 31, 2022.
24. NET INSURANCE PREMIUM
Written gross premium 3,563,123 3,065,224 Add: Unearned premium reserve opening 4,244,992 3,465,728 Less: Unearned premium reserve closing 5,048,813 4,202,740 Premium earned 2,759,302 2,328,212 Less: Reinsurance premium ceded 1,642,392 1,207,966 Add: Prepaid reinsurance premium opening 2,339,417 1,663,576 Less: Prepaid reinsurance premium closing 2,393,278 1,888,948 Reinsurance expense 1,588,531 982,594 1,170,771 1,345,618
25. NET INSURANCE CLAIMS EXPENSE Claims paid 923,245 977,240 Add: Outstanding claims including IBNR closing 6,844,082 4,395,102 Less: Outstanding claims including IBNR opening 5,154,819 4,807,405 Claims expense 2,612,508 564,937 Reinsurance and other recoveries received 161,440 196,459 Add: Reinsurance and other recoveries received in respect of outstanding claims closing 5,108,868 2,883,405 Less: Reinsurance and other recoveries received in respect of outstanding claims opening 3,618,024 3,259,888 Reinsurance and other recoveries revenue 1,652,284 (180,024) 960,224 744,961
26. NET COMMISSION EXPENSE / ACQUISITION COSTS Commission paid or payable 202,539 206,547 Add: Deferred commission expense opening 247,251 210,288 Less: Deferred commission expense closing 283,507 267,900 Net Commission 166,283 148,935 Less: Commission received or receivables 107,125 92,310 Add: Unearned reinsurance commission opening 148,056 108,839 Less: Unearned reinsurance commission closing 169,876 136,955 Commission from reinsurers 85,305 64,194 80,978 84,741
..............(Rupees in '000)..............
2022 2021
Three months period endedMarch 31,March 31,

1ST QUARTER REPORT 25
..............(Rupees in '000)..............
2022 2021
Three months period endedMarch 31,March 31,27. INVESTMENT INCOME
Income from equity securities Available for sale Dividend Income - Related parties 9,608 15,785 - Others 91,395 82,886 101,003 98,671 Fair value through profit or loss Dividend Income - others 5,913 - Income from debt securities Held to maturity - Return on government securities 1,212 4,037 - Amortisation of discount / (premium) - net (196) 1,651 1,016 5,688 Available for sale - Return on government securities 256,426 187,927 - Amortisation of discount - net 18,132 31,000 274,558 218,927 Income from term deposits - Return on term deposits 27.1 9,432 863 Net realised gains / (losses) on investments Available for sale - Gain on sale of equity securities 35,549 224,688 - Loss on sale of equity securities - (11,444) 35,549 213,244 Fair value through profit or loss - Gain on sale of equity securities 11,770 2,699 - Loss on sale of equity securities (677) - 11,093 2,699 Net unrealised losses on investments at fair value through profit or loss (5,602) (2,501) Total investment income 432,962 537,591 Less: Investment related expenses (9,169) (6,411) 423,793 531,180 27.1 This includes Rs. 586 thousands (March 31, 2021: Rs. 586 thousands) return on term deposits held with a related party.
28. RENTAL INCOME
Rental income 35,321 30,455 Expenses related to investment property (12,261) (11,819) 23,060 18,636 29. OTHER INCOME
Income from financial assets / liabilities Return on bank balances 29.1 58,373 17,861 Exchange gain 4,629 (5,816) Return on loans to employees 12 6 Others 1,350 522 Income from non-financial assets (Loss) on sale of fixed assets (17) (469) 64,347 12,104 29.1 This includes Rs. 698 thousands (March 31, 2021: Rs. 698 thousands) return on bank balances held with related
parties.

JUBILEE GENERAL INSURANCE26
31. TRANSACTIONS WITH RELATED PARTIES / ASSOCIATED UNDERTAKINGS
Related parties / associated undertakings comprise of associated companies, directors, key management personnel and employees' funds. The transactions and balances with related parties / associated companies, other than those which have been disclosed elsewhere in these condensed interim financial information, are as follows:
Associated companies Insurance premium written (including government levies administrative surcharge and policy stamps) 286,570 266,969 Insurance premium received / adjusted during the period 277,125 220,478 Insurance claims paid 91,355 147,679 Commission paid 443 4,406 Purchases of goods and services 23,774 20,968 Dividend income 9,608 15,785 Rent income 22,266 18,136 Reimbursement of expenses * 10,500 10,500 Director's fee 150 375 Key management personnel Remuneration 30,681 25,651 Employees' funds Contribution to provident fund 8,868 8,497 Provision for gratuity fund 8,250 7,800 Others Insurance premium written (including government levies administrative surcharge and policy stamps) 557 34 Insurance premium received / adjusted during the period 567 11 Expense allocated to Window Takaful Operations 25,107 25,107 Claims paid - 12 Rent income 670 609 Directors' fee 1,500 1,275 * The expenses pertain to Accident and Health business Common Back Office Operations jointly shared with
Jubilee Life Insurance.
..............(Rupees in '000)..............2022 2021
Three months period endedMarch 31,March 31,
..............(Rupees in '000)..............2022 2021
Three months period endedMarch 31,March 31,
30. EARNINGS PER SHARE - BASIC AND DILUTED Basic earnings per share are calculated by dividing the net profit for the period by the weighted average number
of shares as at the period end as follows:
Profit after taxation 191,326 523,957 ---- (Number of shares in '000) ---- Weighted average number of shares of Rs.10 each 198,491 198,491 --------------- (Rupees ) -------------- Earnings per share of Rs.10 each - basic and diluted 0.96 2.64 30.1 No figure for diluted earnings per share has been presented as the Company has not issued any instrument
which would have an impact on earnings per share when exercised.

1ST QUARTER REPORT 27
The class wise revenues and results are as follows:
Premium receivable (inclusive of Federal Excise Duty, Federal Insurance Fee and Administrative Surcharge) 1,197,804 357,858 643,993 283,939 844,277 658,286 3,986,157
Less: Federal Excise Duty / Sales Tax 150,214 37,545 76,237 32,833 - 77,876 374,705 - Federal Insurance Fee 10,395 3,047 5,622 2,477 8,358 5,744 35,643 - Others (152) 12,453 351 5 170 (141) 12,686 Gross written premium (inclusive of Administrative Surcharge) 1,037,347 304,813 561,783 248,624 835,749 574,807 3,563,123
- Gross direct premium 1,034,795 298,597 549,373 248,268 835,749 572,435 3,539,217 - Administrative surcharge 2,552 6,216 12,410 356 - 2,372 23,906
1,037,347 304,813 561,783 248,624 835,749 574,807 3,563,123 Insurance premium earned 1,066,359 263,976 402,672 89,265 418,451 518,579 2,759,302 Insurance premium ceded to reinsurers 1,023,062 63,577 13,107 81,647 2,458 404,679 1,588,531
Net Insurance premium 43,297 200,399 389,565 7,618 415,993 113,900 1,170,771 Commission income 36,795 1,900 210 8,298 - 38,102 85,305 Net underwriting income 80,092 202,299 389,775 15,916 415,993 152,002 1,256,076 Insurance claims 1,991,038 55,430 167,582 5,931 327,648 64,879 2,612,508 Insurance claims recovered from reinsurer 1,604,505 3,686 1,786 6,056 (1,377) 37,628 1,652,284
Net claims 386,533 51,744 165,796 (125) 329,025 27,251 960,224 Commission expense 57,827 35,416 27,649 2,086 16,644 26,661 166,283 Management expense 103,616 60,818 121,996 8,469 53,880 101,723 450,502
Net Insurance Claims and expenses 547,976 147,978 315,441 10,430 399,549 155,635 1,577,009
Underwriting result (467,884) 54,320 74,334 5,486 16,444 (3,633) (320,933) Net investment income 423,793 Rental income 23,060 Other income 64,347 Other expenses (7,373) Share in profit of associates 36,472 Profit from window takaful operations 48,802
Profit before tax 268,168
32. SEGMENT INFORMATION
Following segment information prepared in accordance with the requirements of Insurance Ordinance, 2000 and the Insurance Rules, 2017 for class of business wise revenues, results, assets and liabilities:
........................................................... (Rupees in '000) ...........................................................
For the three months period ended March 31, 2022 (Un-audited) Fire and property damage
Marine, aviation and
transportMotor Liability Accident
and health Miscellaneous Total

JUBILEE GENERAL INSURANCE28
Premium receivable (inclusive of Federal Excise Duty, Federal Insurance Fee and Administrative Surcharge) 1,116,271 307,998 513,927 185,942 691,725 630,833 3,446,696
Less: Federal Excise Duty / Sales Tax 138,502 33,761 61,388 37,512 - 73,143 344,306 Federal Insurance Fee 9,710 2,615 4,498 1,463 6,848 5,398 30,532 Others (1,613) 9,897 (886) 5 103 (872) 6,634 Gross written premium (inclusive of Administrative Surcharge) 969,672 261,725 448,927 146,962 684,774 553,164 3,065,224
Gross direct premium 967,080 256,088 438,650 146,617 684,774 537,462 3,030,671 Facultative inward premium - - - - - 13,485 13,485 Administrative surcharge 2,592 5,637 10,277 345 - 2,217 21,068
969,672 261,725 448,927 146,962 684,774 553,164 3,065,224 Insurance premium earned 785,200 229,466 345,536 107,511 448,627 411,872 2,328,212 Insurance premium ceded to reinsurers 509,983 39,289 14,202 100,472 963 317,686 982,594
Net Insurance premium 275,217 190,178 331,334 7,039 447,664 94,186 1,345,618 Commission income 26,007 1,026 179 6,447 - 30,535 64,194 Net underwriting income 301,224 191,204 331,513 13,486 447,664 124,721 1,409,812 Insurance claims (72) 99,183 156,745 (50,280) 394,695 (35,335) 564,937 Insurance claims recovered from reinsurer (100,362) (2,785) (554) (49,982) 19,338 (45,680) (180,024)
100,290 101,967 157,299 (297) 375,357 10,345 744,961 Commission expense 50,661 34,419 29,343 1,844 16,482 16,186 148,935 Management expense 100,045 51,765 105,247 8,250 48,618 95,856 409,781
Net Insurance Claims and expenses 250,996 188,151 291,889 9,797 440,457 122,388 1,303,678
Underwriting result 50,228 3,052 39,625 3,689 7,207 2,333 106,134 Net investment income 531,180 Rental income 18,636 Other income 12,104 Other expenses (18,828) Share in profit of associates 62,732 Profit from window takaful operations 26,504
Profit before tax 738,462
........................................................... (Rupees in '000) ...........................................................
For the three months period ended March 31, 2021 (Un-audited)Fire and property damage
Marine, aviation and
transportMotor Liability Accident
and health Miscellaneous Total
The class wise assets and liabilities are as follows:
Segment assets 4,425,760 322,132 429,054 1,847,066 376,123 2,590,975 9,991,110 Unallocated corporate assets 18,621,595 Unallocated assets of Window Takaful Operation - Operator's Fund 575,648
Consolidated total assets 4,425,760 322,132 429,054 1,847,066 376,123 2,590,975 29,188,353 Segment liabilities 6,659,775 991,688 1,823,195 1,997,354 2,018,410 3,802,994 17,293,415 Unallocated corporate liabilities 1,992,115 Unallocated liabilities of Window Takaful Operation - Operator's Fund 339,635
Consolidated total liabilities 6,659,775 991,688 1,823,195 1,997,354 2,018,410 3,802,994 19,625,165
........................................................... (Rupees in '000) ...........................................................
As at March 31, 2022 (Un-audited)Fire and property damage
Marine, aviation and
transportMotor Liability Accident
and health Miscellaneous Total
1ST QUARTER REPORT 29
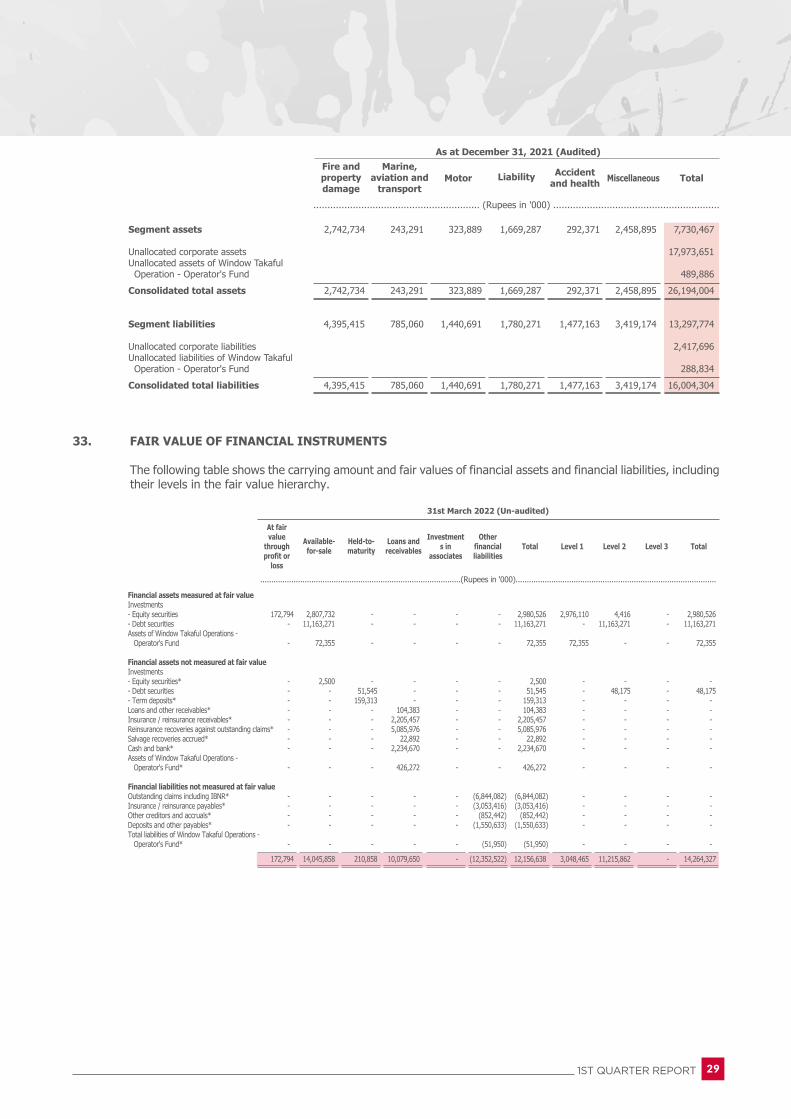
Segment assets 2,742,734 243,291 323,889 1,669,287 292,371 2,458,895 7,730,467 Unallocated corporate assets 17,973,651 Unallocated assets of Window Takaful Operation - Operator's Fund 489,886
Consolidated total assets 2,742,734 243,291 323,889 1,669,287 292,371 2,458,895 26,194,004 Segment liabilities 4,395,415 785,060 1,440,691 1,780,271 1,477,163 3,419,174 13,297,774 Unallocated corporate liabilities 2,417,696 Unallocated liabilities of Window Takaful Operation - Operator's Fund 288,834
Consolidated total liabilities 4,395,415 785,060 1,440,691 1,780,271 1,477,163 3,419,174 16,004,304
........................................................... (Rupees in '000) ...........................................................
As at December 31, 2021 (Audited)Fire and property damage
Marine, aviation and
transportMotor Liability Accident
and health Miscellaneous Total
Financial assets measured at fair value Investments - Equity securities 172,794 2,807,732 - - - - 2,980,526 2,976,110 4,416 - 2,980,526 - Debt securities - 11,163,271 - - - - 11,163,271 - 11,163,271 - 11,163,271 Assets of Window Takaful Operations - Operator's Fund - 72,355 - - - - 72,355 72,355 - - 72,355 Financial assets not measured at fair value Investments - Equity securities* - 2,500 - - - - 2,500 - - - - - Debt securities - - 51,545 - - - 51,545 - 48,175 - 48,175 - Term deposits* - - 159,313 - - - 159,313 - - - - Loans and other receivables* - - - 104,383 - - 104,383 - - - - Insurance / reinsurance receivables* - - - 2,205,457 - - 2,205,457 - - - - Reinsurance recoveries against outstanding claims* - - - 5,085,976 - - 5,085,976 - - - - Salvage recoveries accrued* - - - 22,892 - - 22,892 - - - - Cash and bank* - - - 2,234,670 - - 2,234,670 - - - - Assets of Window Takaful Operations - Operator's Fund* - - - 426,272 - - 426,272 - - - - Financial liabilities not measured at fair value Outstanding claims including IBNR* - - - - - (6,844,082) (6,844,082) - - - - Insurance / reinsurance payables* - - - - - (3,053,416) (3,053,416) - - - - Other creditors and accruals* - - - - - (852,442) (852,442) - - - - Deposits and other payables* - - - - - (1,550,633) (1,550,633) - - - - Total liabilities of Window Takaful Operations - Operator's Fund* - - - - - (51,950) (51,950) - - - -
172,794 14,045,858 210,858 10,079,650 - (12,352,522) 12,156,638 3,048,465 11,215,862 - 14,264,327
At fair value
through profit or
loss
Available-for-sale
Held-to- maturity
Loans and receivables
Investments in
associates
Other financial liabilities
Total Level 1 Level 2 Level 3 Total
31st March 2022 (Un-audited)
..........................................................................................(Rupees in '000)..........................................................................................
33. FAIR VALUE OF FINANCIAL INSTRUMENTS
The following table shows the carrying amount and fair values of financial assets and financial liabilities, including their levels in the fair value hierarchy.

* The Company has not disclosed the fair value of these items because their carrying amounts are a reasonable approximation of fair value.
33.1 The fair values of traded investments are based on quoted market prices. The fair values of unquoted equity investments, other than investments in subsidiaries, associates and joint ventures, are estimated using the break-up value of the investee company.
The fair value of unquoted debt securities, fixed term advances, other assets and other liabilities can not be calculated with sufficient reliability due to the absence of a current and active market for such assets and liabilities and reliable data regarding market rates for similar instruments.
In the opinion of the management, the fair value of the remaining financial assets and liabilities are not significantly different from their carrying values since they are either short-term in nature or, in the case of customer advances, deposits and certain long term borrowings, are frequently repriced.
All assets and liabilities for which fair value is measured or disclosed in these condensed interim financial statements are categorised within the fair value hierarchy based on the lowest level input that is significant to the fair value measurement as a whole.
Level 1 - Fair value measurements using quoted prices (unadjusted) in active markets for identical assets or liabilities.
Level 2 - Fair value measurements using inputs other than quoted prices included within Level 1 that are observable for the assets or liability, either directly (i.e. as prices) or indirectly (i.e. derived from prices).
Level 3 - Fair value measurements using inputs that are not based on observable market data (i.e. unobservable inputs).
JUBILEE GENERAL INSURANCE30
Financial assets measured at fair value Investments - Equity securities 172,513 2,906,097 - - - - 3,078,610 3,074,001 4,609 - 3,078,610 - Debt securities - 8,228,516 - - - - 8,228,516 - 8,228,516 - 8,228,516 Assets of Window Takaful Operations - Operator's Fund - 56,261 - - - - 56,261 56,261 - - 56,261 Financial assets not measured at fair value Investments - Equity securities* - 2,500 - - - - 2,500 - - - - - Debt securities - - 51,741 - - - 51,741 - 48,785 - 48,785 - Term deposits* - - 2,669,303 - - - 2,669,303 - - - - Loans and other receivables* - - - 152,216 - - 152,216 - - - - Insurance / reinsurance receivables* - - - 1,525,775 - - 1,525,775 - - - - Reinsurance recoveries against outstanding claims* - - - 3,593,493 - - 3,593,493 - - - - Salvage recoveries accrued* - - - 24,531 - - 24,531 - - - - Cash and bank* - - - 1,901,990 - - 1,901,990 - - - - Assets of Window Takaful Operations - Operator's Fund* - - - 360,795 - - 360,795 - - - - Financial liabilities not measured at fair value Provision for outstanding claims (including IBNR)* - - - - - (5,154,819) (5,154,819) - - - - Insurance / reinsurance payables* - - - - - (2,685,463) (2,685,463) - - - - Other creditors and accruals* - - - - - (739,823) (739,823) - - - - Deposits and other payables* - - - - - (1,566,290) (1,566,290) - - - - Total liabilities of Window Takaful Operations - Operator's Fund* - - - - - (52,230) (52,230) - - - -
172,513 11,193,374 2,721,044 7,558,800 - (10,198,625) 11,447,105 3,130,262 8,281,910 - 11,412,172
At fair value
through profit or
loss
Available-for-sale
Held-to- maturity
Loans and receivables
Investments in
associates
Other financial liabilities
Total Level 1 Level 2 Level 3 Total
31st December 2021 (Audited)
..........................................................................................(Rupees in '000)..........................................................................................

34. DATE OF AUTHORISATION FOR ISSUE
These condenced interim financial statements have been authorised for issue in accordance with a resolution of the Board of Directors on April 26 , 2022.
35. GENERAL All figures have been rounded off to the nearest thousand of rupees, unless otherwise stated.
1ST QUARTER REPORT 31
Hassan KhanChief Executive
Amyn CurrimbhoyDirector
Nawaid JamalChief Financial Officer
R. Zakir MahmoodChairman
Amin A. HashwaniDirector

WINDOW TAKAFUL OPERATIONS

Assets
Property and equipment 7 1,628 1,636 - - Intangible assets 499 588 - - Investments Equity securities 8 72,355 56,261 115,473 85,204 Term deposits 9 - - 100,000 200,000 Loans and other receivables 10 45 41 5,254 6,525 Takaful / Re-takaful receivables 11 - - 398,821 298,100 Salvage recoveries accrued - - 6,990 9,567 Deferred taxation 1,219 1,347 - - Deferred wakala fee 21 - - 241,380 203,065 Receivable from PTF 12 163,073 102,562 - - Re-takaful recoveries against outstanding claims / benefits - - 351,045 304,534 Deferred commission expense 22 71,624 68,165 - - Prepayments 13 2,032 1,080 127,140 112,297 Cash & bank 14 263,173 258,206 675,339 505,559 Total Assets 575,648 489,886 2,021,442 1,724,851 Funds and Liabilities Funds attributable to: Operator's Fund (OPF) Statutory fund 100,000 100,000 - - Reserves (2,985) (3,297) - - Accumulated profit 138,998 104,349 - - Balance of Operator's Fund 236,013 201,052 - - Participants' Takaful Fund (PTF) Seed money - - 500 500 Reserves - - (11,314) (11,915)Accumulated surplus - - 210,542 201,209 Balance of Participants' Takaful Fund - - 199,728 189,794 Liabilities PTF Underwriting Provisions Outstanding claims including IBNR 20 - - 647,354 587,984 Unearned contribution reserves - - 678,060 559,455 Reserve for unearned re-takaful rebate 19 - - 11,308 8,752 - - 1,336,722 1,156,191 Unearned wakala fee 21 241,380 203,065 - - Contribution received in advance - - 32,762 26,547 Takaful / re-takaful Payables 15 - - 259,451 224,298 Other creditors and accruals 16 52,156 52,583 29,706 25,459 Taxation - provision less payments 46,099 33,186 - - Payable to OPF 12 - - 163,073 102,562 Total Liabilities 339,635 288,834 1,821,714 1,535,057 Total funds and liabilities 575,648 489,886 2,021,442 1,724,851 Contingencies and commitments 17 The annexed notes 1 to 30 form an integral part of these condensed interim financial statements.
......................................... (Rupees in '000) .........................................
March 31, 2022(Un-audited)
December 31, 2021(Audited)
March 31, 2022(Un-audited)
December 31, 2021(Audited)
Note
OPF PTF
CONDENSED INTERIM STATEMENT OFFINANCIAL POSITION OF OPF AND PTFAS AT MARCH 31, 2022
1ST QUARTER REPORT 33
Hassan KhanChief Executive
Amyn CurrimbhoyDirector
Nawaid JamalChief Financial Officer
R. Zakir MahmoodChairman
Amin A. HashwaniDirector

PTF Contribution earned 230,154 208,280 Less: Contribution ceded to retakaful (67,481) (53,094)
Net contribution revenue 18 162,673 155,186 Re-takaful rebate earned 19 4,562 1,862
Net underwriting income 167,235 157,048 Net claims 20 (168,740) (161,795)Other direct expenses (394) 569
Deficit before investment income (1,899) (4,178) Investment income 23 3,638 1,290 Other income 24 10,405 9,087 Less: Modarib's share of investment income 25 (2,811) (2,078)
Surplus transferred to accumulated surplus 9,333 4,121 OPF Wakala fee 21 122,037 98,810 Commission expense 22 (37,375) (36,547)General,administrative and management expenses (46,115) (41,676)
38,547 20,587 Modarib's share of PTF investment income 25 2,811 2,078 Investment income 23 1,718 1,139 Direct expenses (900) (675)Other income 24 6,626 3,375
Profit before taxation 48,802 26,504 Taxation (14,153) (7,686)
Profit after taxation 34,649 18,818 The annexed notes 1 to 30 form an integral part of these condensed interim financial statements.
Note ..............(Rupees in '000)..............
2022 2021
Three months period endedMarch 31,March 31,
CONDENSED INTERIM STATEMENT OFPROFIT AND LOSS ACCOUNT (UN-AUDITED)FOR THE THREE MONTHS PERIOD ENDED MARCH 31, 2022
JUBILEE GENERAL INSURANCE34
Hassan KhanChief Executive
Amyn CurrimbhoyDirector
Nawaid JamalChief Financial Officer
R. Zakir MahmoodChairman
Amin A. HashwaniDirector

..............(Rupees in '000)..............
2022 2021
Three months period endedMarch 31, March 31,
PTF Surplus during the period 9,333 4,121 Other comprehensive income / (loss) for the period: Item that may be reclassified to the profit and loss account in subsequent period - Net unrealised gain / (loss) arising during the period on revaluation of available-for-sale investments 791 (2,988) - Reclassification adjustment for net gain on available for sale investments included in profit and loss account (190) -
Other comprehensive income / (loss) for the period 601 (2,988) Total comprehensive income for the period 9,934 1,133 OPF Profit after tax for the period 34,649 18,818 Other comprehensive income for the period: Item that may be reclassified to the profit and loss account in subsequent period - Net unrealised gain / loss arising during the period on revaluation of available-for-sale investments - net of tax 437 (628) - Reclassification adjustment for net gain on available for sale investments included in the profit and loss account - net of tax (125) -
Other comprehensive income / (loss) for the period 312 (628) Total comprehensive income for the period 34,961 18,190 The annexed notes 1 to 30 form an integral part of these condensed interim financial statements.
CONDENSED INTERIM STATEMENT OFCOMPREHENSIVE INCOME (UN-AUDITED)FOR THE THREE MONTHS PERIOD ENDED MARCH 31, 2022
1ST QUARTER REPORT 35
Hassan KhanChief Executive
Amyn CurrimbhoyDirector
Nawaid JamalChief Financial Officer
R. Zakir MahmoodChairman
Amin A. HashwaniDirector

................................(Rupees in '000)................................
Available for sale
investment revaluation
reserve
Seedmoney
AccumulatedSurplus Total
Attributable to participants of the PTF
Balance as at January 01, 2021 (audited) 100,000 (5,296) 90,984 185,688 Profit after tax for the period - - 18,818 18,818 Other comprehensive loss for the period - (628) - (628) Balance as at March 31, 2021 (un-audited) 100,000 (5,924) 109,802 203,878 Balance as at January 01, 2022 (audited) 100,000 (3,297) 104,349 201,052 Profit after tax for the period - - 34,649 34,649 Other comprehensive income for the period - 312 - 312 Balance as at March 31, 2022 (un-audited) 100,000 (2,985) 138,998 236,013
Balance as at January 01, 2021 (audited) 500 (10,108) 181,129 171,521 Surplus for the period - - 4,121 4,121 Other comprehensive loss for the period - (2,988) - (2,988) Balance as at March 31, 2021 (un-audited) 500 (13,096) 185,250 172,654 Balance as at January 01, 2022 (audited) 500 (11,915) 201,209 189,794 Surplus for the period - - 9,333 9,333 Other comprehensive income for the period - 601 - 601 Balance as at March 31, 2022 (un-audited) 500 (11,314) 210,542 199,728 The annexed notes 1 to 30 form an integral part of these condensed interim financial statements.
...................................(Rupees in '000)...................................
Available for sale
investment revaluation
reserve
StatutoryFund
Unappropriatedprofit Total
Attributable to Operator's Fund
CONDENSED INTERIM STATEMENT OFCHANGES IN OPERATOR'S FUND ANDPARTICIPANTS' TAKAFUL FUND AS AT MARCH 31, 2022
JUBILEE GENERAL INSURANCE36
Hassan KhanChief Executive
Amyn CurrimbhoyDirector
Nawaid JamalChief Financial Officer
R. Zakir MahmoodChairman
Amin A. HashwaniDirector

Operating Cash flows (a) Takaful activities Contribution received - - 361,621 305,270 Re-takaful contribution paid - - (46,435) (53,285) Claims / Benefits paid - - (163,509) (170,543) Re-takaful and other recoveries received - - 24,138 15,761 Commission paid (42,985) (41,082) - - Commission received - - 7,118 3,964 Wakala fee received 101,084 80,936 - - Wakala fee paid - - (101,084) (80,936) Modarib share received 1,568 2,513 - - Modarib share paid - - (1,568) (2,513) Net cash generated from takaful activities 59,667 42,367 80,281 17,718 (b) Other operating activities Income tax paid (1,240) (638) (2,511) (1,493) General and other expenses paid (47,008) (41,639) 637 332 Other operating payments (1,469) (1,119) (55,910) (41,131) Other operating receipts 2,236 2,505 59,932 47,477 Net cash (used in) / generated from other operating activities (47,481) (40,891) 2,148 5,185 Total cash generated from all operating activities 12,186 1,476 82,429 22,903 Investment activities Profit / return received 6,717 3,419 14,907 8,956 Dividend received 1,450 729 1,831 954 Payment for investments (17,000) - (31,000) - Proceeds from investments 1,614 90 1,613 167 Total cash (used in) / generated from investing activities (7,219) 4,238 (12,649) 10,077 Net cash generated from all activities 4,967 5,714 69,780 32,980 Cash and cash equivalents at beginning of three months period 258,206 210,422 705,559 632,062 Cash and cash equivalents at end of three months period 263,173 216,136 775,339 665,042 Reconciliation to Profit and Loss Account Operating cash flows 12,186 1,476 82,429 22,903 Depreciation expense (7) (585) - - Amortisation (89) (214) - - Profit / return received 6,717 3,419 14,907 8,956 Net realised gain on sale of investments 268 90 282 166 Dividend income 1,450 1,049 1,831 1,124 Increase in assets other than cash 64,926 73,523 158,228 158,232 Increase in liabilities other than borrowings (50,802) (59,940) (248,344) (187,260) Net profit / surplus for the period 34,649 18,818 9,333 4,121
Cash and cash equivalents include the following for the purpose of the statement of cash flows:
CASH AND BANK Cash and cash equivalent Policy, revenue stamps and bond papers 6 3 227 476 Cash at bank Current accounts - - 13,219 13,974 Savings accounts 263,167 216,133 661,893 650,592 263,167 216,133 675,112 664,566 Deposits having maturity within 3 months Term deposits - - 100,000 - 263,173 216,136 775,339 665,042 Definition of cash and cash equivalents Cash and cash equivalents comprises of cash in hand, policy stamps, bond papers, bank balances and other deposits which are readily convertible to cash in hand and which are used in the cash management function on a day-to-day basis. The annexed notes 1 to 30 form an integral part of these condensed interim financial statements.
........................ (Rupees in '000) .......................
OPF PTF2022 2021 2022 2021
CONDENSED INTERIM STATEMENT OFCASH FLOWS (UN-AUDITED) FOR THE THREE MONTHS PERIOD ENDED MARCH 31, 2022
1ST QUARTER REPORT 37
Hassan KhanChief Executive
Amyn CurrimbhoyDirector
Nawaid JamalChief Financial Officer
R. Zakir MahmoodChairman
Amin A. HashwaniDirector

1. LEGAL STATUS AND NATURE OF BUSINESS Jubilee General Insurance Company Limited ("the Operator") is a public limited company incorporated in Pakistan
on 16 May 1953. The Operator is listed on Pakistan Stock Exchange and is engaged in general insurance business. The registered office of the Operator is situated at 2nd Floor, Jubilee Insurance House, I. I. Chundrigar Road, Karachi.
The Operator was granted authorisation on 10 March 2015 under Rule 6 of the Takaful Rules, 2012 to undertake
Window Takaful Operations ("the operations") by Securities and Exchange Commission of Pakistan ("SECP") under Takaful Rules, 2012 to carry on General takaful operations in Pakistan. The Waqf deed was executed on 30 April 2015 and the Operator commenced activities of the operations on 7 May 2015.
2. BASIS OF PREPARATION AND STATEMENT OF COMPLIANCE 2.1 Statement of compliance These condensed financial statements have been prepared in accordance with the accounting and reporting
standards as applicable in Pakistan. The accounting and reporting standards comprise of:
- International Financial Reporting Standards (IFRS) issued by the International Accounting Standard Board (IASB) as are notified under the Companies Act, 2017; and
- Provisions of and directives issued under the Companies Act, 2017, Insurance Ordinance, 2000, Insurance
Rules, 2017, Insurance Accounting Regulations, 2017, Takaful Rules, 2012 and General Takaful Accounting Regulations, 2019.
In case requirements differ, the provisions or directives of the Companies Act, 2017, the Insurance Ordinance,
2000, the Insurance Rules, 2017, the Insurance Accounting Regulations, 2017, the Takaful Rules, 2012 and General Takaful Accounting Regulations, 2019 shall prevail.
2.1.1 The Securities and Exchange Commission of Pakistan ("SECP") vide its S.R.O 1416(I)/2019 dated 20th
November, 2019 has prescribed format of the presentation of published financial statements for general takaful operator for takaful business. These condensed interim financial statements have been prepared in accordance with the format as prescribed by the SECP. The disclosures made in these condensed interim financial statements have, however, been limited based on the requirements of the International Accounting Standard 34: 'Interim Financial Reporting'. These condensed interim financial statements do not include all the information and disclosures required in a full set of financial statements as presbribed by the SECP and should be read in conjunction with the annual audited financial statements of the Operator for the year ended December 31, 2021.
2.1.2 These condensed financial statements reflect the financial position and results of operations of both the Operator's Fund ("OPF") and Participants' Takaful Fund in a manner that the assets, liabilities, income and expenses of the OPF and PTF remain separately identifiable.
2.2 Basis of measurement These condensed financial statements have been prepared under the historical cost convention except for certain
investments which are carried at fair values. 2.3 Functional and presentational currency Items included in the financial statements are measured using the currency of the primary economic
environment in which the Operator operates. The financial statements are presented in Pakistani Rupees, which is the Operator’s functional and presentational currency.
2.4 Standards, interpretations and amendments to the accounting and reporting standards as
applicable in Pakistan that are effective in the current period
2.4.1 There are certain other new and amended standards, interpretations and amendments that are mandatory for the Operator's accounting periods beginning on or after January 1, 2022 but are considered not to be relevant or do not have any significant effect on the Operator's operations and therefore, have not been stated in these condensed interim financial statements.
CONDENSED INTERIM NOTES TO ANDFORMING PART OF THE FINANCIALSTATEMENTS (UN-AUDITED) FOR THE THREE MONTHS PERIOD ENDED MARCH 31, 2022
JUBILEE GENERAL INSURANCE38

2.5 Standards, interpretations and amendments to accounting and reporting standards as applicable in Pakistan that are not yet effective
The following standards, amendments and interpretations of the accounting and reporting standards as
applicable in Pakistan will be effective for accounting periods beginning on or after January 1, 2022:
Effective date Standards, amendments or interpretations (period beginning on or after) - IAS 16 - 'Property, plant and equipment' (amendments) January 1, 2022 - IAS 37 - 'Provisions, contingent liabilities and contingent assets' (amendments) January 1, 2022 - IAS 1 - 'Presentation of financial statements' (amendments) January 1, 2023 - IAS 8 - 'Accounting policies, changes in accounting estimates and errors'
(amendments) January 1, 2023 - IAS 12 - 'Income Tax' (amendments) January 1, 2023 - IFRS 9 - 'Financial Instruments' January 1, 2023
* The management has opted temporary exemption from the application of IFRS 9 as allowed by the International Accounting Standards Board (IASB) for entities whose activities are predominantly connected with insurance. Further details relating to temporary exemption from the application of IFRS 9 are given in notes 2.5.1 and 2.5.1.1 to these condensed interim financial statements.
The management is in the process of assessing the impacts of these standards and amendments on the
condensed interim financial statements of the Operator. 2.5.1 Temporary exemption from application of IFRS 9 As an insurance company, the management has opted temporary exemption from the application of IFRS 9 as
allowed by the International Accounting Standards Board (IASB) for entities whose activities are predominantly connected with insurance. Additional disclosures, as required by IASB, for being eligible to apply the temporary exemption from the application of IFRS 9 are given in note 2.5.1.1 below.
2.5.1.1 Fair value of financial assets as at March 31, 2022 and changes in the fair values during the three
months ended March 31, 2022 As at
March 31, 2022 Financial assets that do not meet the SPPI criteria (Rupees in '000) (Un-audited) Operator's Fund Equity Securities - Available for sale (note 8) Opening fair value 56,261 Net additions during the year - net 15,655 Increase in fair value 439 Closing fair value 72,355 Participants' Takaful Fund Equity Securities - Available for sale (note 8) Opening fair value 85,204 Net additions during the year - net 29,668 Increase in fair value 601 Closing fair value 115,473 2.5.2 There are certain other new and amended standards, interpretations and amendments that are mandatory for
the Operator's accounting periods beginning on or after January 1, 2022 but are considered not to be relevant or will not have any significant effect on the Operator's operations and are therefore not stated in these condensed interim financial statements.
3. ACCOUNTING POLICIES The accounting policies and the methods of computation adopted in the preparation of these condensed interim
financial statements are the same as those applied in the preparation of the audited financial statements for the year ended 31 December 2021.
1ST QUARTER REPORT 39

4. ESTIMATES AND JUDGMENTS The preparation of condensed interim financial statements requires management to make judgments, estimates
and assumptions that affect the application of accounting policies and the reported amounts of assets and liabilities, income and expense. Actual results may differ from these estimates. In preparing these condensed interim financial statements, the significant judgments made by management in applying the Operator’s accounting policies and the key sources of estimation uncertainty were the same as those that applied to the financial statements as at and for the year ended 31 December 2021.
5. TAKAFUL AND FINANCIAL RISK MANAGEMENT The takaful and financial risk management objectives and policies are consistent with those disclosed in the
annual financial statements of the Operator's for the year ended 31 December 2021. 6. CONTRIBUTION DEFICIENCY RESERVE No provision has been made as the unearned contribution reserve for each class of business at period end is
adequate to meet the expected future liability after re-takaful from claims and other expenses expected to be increased after the reporting date in respect of policies in force at reporting date.
7. PROPERTY AND EQUIPMENT 7.1 OPERATING ASSETS 7.1.1 Operator's Fund No additions were made during the three months period ended 31 March 2022 (31 March 2021 : Rs. Nil).
OPF Others Listed shares 59,559 55,355 60,905 56,261 Mutual Funds 17,000 17,000 - - 76,559 72,355 60,905 56,261 PTF Others Listed shares 95,787 84,473 97,119 85,204 Mutual Funds 31,000 31,000 - - 126,787 115,473 97,119 85,204 9. INVESTMENT IN TERM DEPOSITS
Held to maturity Deposits maturing within 12 months - term deposit receipts - - 100,000 200,000
8. INVESTMENT IN EQUITY SECURITIES - AVAILABLE-FOR-SALE
......................... (Rupees in ‘000) ..........................
Cost Carryingvalue
Carryingvalue
Cost
2022 2021(Un-audited) (Audited)
December 31,March 31,
.............................. (Rupees in '000) .............................
PTFOPF
2022 20212022 2021
(Un-audited) (Audited) (Un-audited) (Audited)
December 31,March 31,December 31,March 31,
JUBILEE GENERAL INSURANCE40

Accrued investment income - - 792 3,757 Sales tax recoverable 19 14 1,976 2,687 Medical claims recoverable - - - 81 Other receivables 26 27 2,486 - 45 41 5,254 6,525
.............................. (Rupees in '000) .............................
PTFOPF
2022 20212022 2021
(Un-audited) (Audited) (Un-audited) (Audited)
December 31,March 31,December 31,March 31,
10. LOANS AND OTHER RECEIVABLES
.............................. (Rupees in '000) .............................
Wakala fee 160,262 100,994 160,262 100,994 Modarib fee 2,811 1,568 2,811 1,568 163,073 102,562 163,073 102,562 13. PREPAYMENTS
Prepaid re-takaful contribution ceded - - 127,140 112,297 Prepaid miscellaneous expenses 2,032 1,080 - - 2,032 1,080 127,140 112,297 14. CASH AND BANK Cash and cash equivalent Policy and revenue stamps 6 12 227 709 Cash at bank - Current accounts - - 13,219 18,893 - Savings accounts 263,167 258,194 661,893 485,957 14.1 & 14.2 263,167 258,194 675,112 504,850 263,173 258,206 675,339 505,559 14.1 Cash and bank balances of OPF include Rs. 144,278 thousands (2021 : Rs. 100,624 thousands) held with a related party.
14.2 Cash and bank balances of PTF include Rs. 100,262 thousands (2021 : Rs. 146,913 thousands) held with a related party.
PTFOPF
2022 20212022 2021
(Un-audited) (Audited) (Un-audited) (Audited)
December 31,March 31,December 31,March 31,
2022 2021
..............(Rupees in '000)..............(Audited)(Un-audited)
December 31,March 31,11. TAKAFUL / RE-TAKAFUL RECEIVABLES - PTF
Due from takaful contract holders 11.1 329,040 214,386 Due from other Takaful / Re-takaful operators 11.2 69,781 83,714
398,821 298,100 11.1 This includes Rs. 92 thousands (2021: Rs. 76 thousands) receivable from related parties.
11.2 This includes Rs. 2,384 thousands (2021 : Rs. 3,285 thousands) receivable from a related party. 12. RECEIVABLE / PAYABLE (Current account between OPF and PTF)
Note
Note
1ST QUARTER REPORT 41

PTF
2022 2021
..............(Rupees in '000)..............(Audited)(Un-audited)
December 31,March 31,
15. TAKAFUL / RE-TAKAFUL PAYABLES
Due to takaful participants / re-takaful payable 259,451 224,298
16. OTHER CREDITORS AND ACCRUALS
Agents commission payable 48,358 50,509 - - Federal excise duty / sales tax - - 13,467 10,858 Federal takaful fee - - 1,079 1,013 Accrued expenses 1,124 1,214 5,684 4,551 Other tax payables 206 353 894 1,062 Miscellaneous 2,468 507 8,582 7,975
52,156 52,583 29,706 25,459
17. CONTINGENCIES AND COMMITMENTS The status of contingency remains unchanged as disclosed in financial statements as of 31 December, 2021.
.............................. (Rupees in '000) .............................
PTFOPF
2022 20212022 2021
(Un-audited) (Audited) (Un-audited) (Audited)
December 31,March 31,December 31,March 31,
18. NET CONTRIBUTION REVENUE
Written gross contribution 27 470,796 423,592 Less: Wakala fee 160,352 143,421 Contribution net of Wakala fee 310,444 280,171 Add: Unearned contribution reserve - opening 356,390 323,311 Less: Unearned contribution reserve - closing 436,680 395,202 Contribution earned 230,154 208,280 Less: Re-takaful contribution ceded 82,324 67,737 Add: Prepaid re-takaful contribution - opening 112,297 80,104 Less: Prepaid re-takaful contribution - closing 127,140 94,747 Re-takaful expense 67,481 53,094 Net Contribution 162,673 155,186 19. RETAKAFUL REBATE EARNED Retakaful rebate / commission received 7,118 3,964 Add: Unearned retakaful rebate / commission - opening 8,752 3,167 Less: Unearned retakaful rebate / commission - closing 11,308 5,269
4,562 1,862
..............(Rupees in '000)..............
2022 2021
Three months period endedMarch 31, March 31,
Note(Un-audited) (Un-audited)
PTF
PTF
JUBILEE GENERAL INSURANCE42

20. NET CLAIMS Benefits / claims paid 163,509 170,543 Add: Outstanding benefits / claims including IBNR - closing 647,354 570,743 Less: Outstanding benefits / claims including IBNR - opening 587,984 542,576 Claims expense 222,879 198,710 Less: Re-takaful and other recoveries received 10,205 10,508 Add: Re-takaful and other recoveries in respect of outstanding claims - closing 358,035 367,979 Less: Re-takaful and other recoveries against outstanding claims - opening 314,101 341,572 Re-takaful and other recoveries revenue 54,139 36,915 Net claims expense 168,740 161,795
OPF
1ST QUARTER REPORT 43
.............................. (Rupees in '000) .............................
PTFOPF
2022 20212022 2021
(Un-audited) (Audited) (Un-audited) (Audited)
December 31,March 31,December 31,March 31,
21. WAKALA FEE INCOME Gross Wakala fee 160,352 143,421 Add: Unearned Wakala fee - opening 203,065 159,231 Less: Unearned Wakala fee - closing 241,380 203,842
122,037 98,810 22. COMMISSION EXPENSE Commission paid or payable 40,834 47,403 Add: Deferred commission expense - opening 68,165 62,536 Less: Deferred commission expense - closing 71,624 73,392 37,375 36,547 23. INVESTMENT INCOME
Income from equity securities Available-for-sale Dividend income 1,450 1,049 1,831 1,124 Income from term deposits Return on term deposits - - 1,525 - 1,450 1,049 3,356 1,124 Net realised gains / (losses) on investments Available-for-sale Realised gain on sale of equity securities 268 90 282 166 Realised loss on sale of equity securities - - - -
268 90 282 166 Total Investment Income 1,718 1,139 3,638 1,290
OPF
OPF
..............(Rupees in '000)..............
2022 2021
Three months period endedMarch 31, March 31,
(Un-audited) (Un-audited)

JUBILEE GENERAL INSURANCE44
24. OTHER INCOME Return on bank balances 24.1 & 24.2 6,717 3,419 10,417 9,102 Miscellaneous (91) (44) (12) (15) 6,626 3,375 10,405 9,087 24.1 Return on bank balances of OPF include Rs. 3,300 thousands (31 March 2021: Rs.2,118 thousands) held with a
related party. 24.2 Return on bank balances of PTF include Rs. 2,919 thousands (31 March 2021: Rs.1,725 thousands) held with a
related party. 25. MODARIB'S FEE The operator manages the participants' investments as a Modarib and charge 20% Modarib's share of the
investment income earned by PTF.
.............................. (Rupees in '000) .............................
PTFOPF
2022 20212022 2021
(Un-audited) (Audited) (Un-audited) (Audited)
December 31,March 31,December 31,March 31,
Note
26. TRANSACTIONS WITH RELATED PARTIES The definition of related parties as given in IAS 24 - Related parties has been followed. Related parties comprise
the Operator, associated companies, companies under common control, companies with common directors, major shareholders, employees' retirement benefit plans, directors and key management personnel of the Operator. All transactions involving related parties arising in the normal course of business are conducted at commercial terms and conditions. The transactions and balances with related parties / associated companies, other than those which have been disclosed elsewhere in the condensed interim financial statements, are as follows:
Contribution written 1,047 30
Contribution received 1,030 30
Rent 26.1 670 609
Reimbursement of expenses 26.2 29,471 25,728
Purchases of goods and services 556 539
Remuneration of key management personnel 3,116 3,116
Contributions to provident fund 153 153
26.1 This represents rent paid to the operator. 26.2 These expenses pertain to accident and health business common back office operations jointly shared with
Jubilee Life Insurance Company Limited (an associated company) and an allocation of management expenses including personnel expenses from the Company to the Operations.
..............(Rupees in '000)..............
2022 2021
Three months period endedMarch 31, March 31,
(Un-audited) (Un-audited)

1ST QUARTER REPORT 45
27. SEGMENT INFORMATION Segment information is prepared in accordance with the requirements of Insurance Ordinance, 2000 and General
Takaful Accounting Regulations, 2019 for class wise revenues, results, assets and liabilities:
The class wise revenues and results are as follows:
Contribution received / receivable (inclusive of Federal Excise Duty / Sales Tax , Federal Takaful Fee and Administrative surcharge) 81,986 39,248 279,117 102,145 24,878 527,374 Less: Federal Excise Duty 9,687 4,091 32,990 - 2,759 49,527 Federal Takaful Fee 722 332 2,441 1,011 221 4,727 Others 68 2,015 182 43 16 2,324
Gross written contribution (inclusive of administrative surcharge) 71,509 32,810 243,504 101,091 21,882 470,796 Gross direct contribution 71,003 31,606 238,879 101,091 21,663 464,242 Administrative surcharge 506 1,204 4,625 - 219 6,554
71,509 32,810 243,504 101,091 21,882 470,796 Takaful contribution earned 40,037 22,481 101,902 54,288 11,446 230,154 Takaful contribution ceded to re-takaful (50,457) (5,345) (5,717) - (5,962) (67,481)
Net takaful contribution (10,420) 17,136 96,185 54,288 5,484 162,673 Re-takaful rebate 3,977 218 8 - 359 4,562
Net underwriting income (6,443) 17,354 96,193 54,288 5,843 167,235 Takaful claims (71,903) (8,926) (74,854) (63,981) (3,215) (222,879)Takaful claims recovered from re-takaful 52,799 1,521 (1,295) - 1,114 54,139
Net claims (19,104) (7,405) (76,149) (63,981) (2,101) (168,740) Other direct expenses (60) (42) (166) (98) (28) (394)
(Deficit) / surplus before investment income (25,607) 9,907 19,878 (9,791) 3,714 (1,899)Net investment income 3,638 Other income 10,405 Modarib share of investment income (2,811)
Surplus transferred to balance of PTF 9,333
Three months period ended March 31, 2022 (Un-audited) - PTF
Fire and property damage
Marine, aviation and
transportMotor
Accidentand health Miscellaneous Total
........................................ (Rupees in '000) ......................................
Wakala fee 21,613 12,235 55,894 26,141 6,154 122,037 Commission expense (8,840) (5,628) (12,511) (9,196) (1,200) (37,375)Management expenses (7,005) (4,957) (19,488) (11,506) (3,159) (46,115)
5,768 1,650 23,895 5,439 1,795 38,547 Modarib share of PTF Investment Income 2,811 Investment income 1,718 Direct expenses (900)Other income 6,626
Profit before taxation 48,802 Taxation (14,153)
Profit after tax 34,649
Three months period ended March 31, 2022 (Un-audited) - OPF
Fire and property damage
Marine, aviation and
transportMotor
Accidentand health Miscellaneous Total
........................................ (Rupees in '000) ......................................

JUBILEE GENERAL INSURANCE46
Wakala fee 15,940 11,272 40,383 26,202 5,013 98,810 Commission expense (7,263) (5,857) (12,704) (9,721) (1,002) (36,547)Management expenses (5,277) (4,148) (20,159) (9,340) (2,752) (41,676)
3,400 1,267 7,520 7,141 1,259 20,587 Modarib share of PTF Investment Income 2,078 Investment income 1,139 Direct expenses (675)Other income 3,375
Profit before taxation 26,504 Taxation (7,686)
Profit after tax 18,818
Contribution received / receivable (inclusive of Federal Excise Duty / Sales Tax , Federal Takaful Fee and Administrative surcharge) 66,524 48,829 213,777 120,107 22,992 472,229 Less: Federal Excise Duty 7,883 5,958 25,827 - 2,703 42,371 Federal Takaful Fee 578 407 1,893 1,189 202 4,269 Others 37 1,745 162 42 11 1,997
Gross written contribution (inclusive of administrative surcharge) 58,026 40,719 185,895 118,876 20,076 423,592 Gross direct contribution 57,584 39,643 181,830 118,876 19,896 417,829 Administrative surcharge 442 1,076 4,065 - 180 5,763
58,026 40,719 185,895 118,876 20,076 423,592 Takaful contribution earned 31,348 21,051 88,076 55,056 12,749 208,280 Takaful contribution ceded to re-takaful (24,074) (13,670) (6,622) - (8,728) (53,094)
Net takaful contribution 7,274 7,381 81,454 55,056 4,021 155,186 Re-takaful rebate 1,421 193 9 - 239 1,862
Net underwriting income 8,695 7,574 81,463 55,056 4,260 157,048 Takaful claims (17,817) (48,400) (70,309) (61,568) (616) (198,710)Takaful claims recovered from re-takaful 6,657 18,481 11,868 - (91) 36,915 Net claims (11,160) (29,919) (58,441) (61,568) (707) (161,795) Other direct expenses - - 569 - - 569
(Deficit) / surplus before investment income (2,465) (22,345) 23,591 (6,512) 3,553 (4,178)Net investment income 1,290 Other income 9,087 Modarib share of investment income (2,078)
Surplus transferred to balance of PTF 4,121
Three months period ended March 31, 2021 (Un-audited) - PTF
Fire and property damage
Marine, aviation and
transportMotor
Accidentand health Miscellaneous Total
........................................ (Rupees in '000) ......................................
Three months period ended March 31, 2021 (Un-audited) - OPF
Fire and property damage
Marine, aviation and
transportMotor
Accidentand health Miscellaneous Total
........................................ (Rupees in '000) ......................................

1ST QUARTER REPORT 47
The classwise assets and liabilities are as follows:
Corporate segment assets 541,075 54,378 334,860 142,124 52,939 1,125,376
Corporate unallocated assets 896,066
Total assets 2,021,442 Corporate segment liabilities 644,106 107,923 657,933 308,508 103,244 1,821,714
Corporate unallocated liabilities -
Total liabilities 1,821,714
Corporate segment assets 46,398 19,129 106,319 51,835 11,016 234,697
Corporate unallocated assets 340,951
Total assets 575,648 Corporate segment liabilities 53,270 11,329 153,158 59,223 16,556 293,536
Corporate unallocated liabilities 46,099
Total liabilities 339,635
Corporate segment assets 459,729 48,790 247,818 124,147 47,159 927,643
Corporate unallocated assets 797,208
Total assets 1,724,851 Corporate segment liabilities 557,926 99,123 505,141 273,224 99,643 1,535,057
Corporate unallocated liabilities -
Total liabilities 1,535,057
Corporate segment assets 32,900 14,886 70,994 44,654 7,293 170,727
Corporate unallocated assets 319,159
Total assets 489,886 Corporate segment liabilities 49,209 12,723 120,996 57,821 14,899 255,648
Corporate unallocated liabilities 33,186
Total liabilities 288,834
As at December 31, 2021 (Audited) - PTF
Fire and property damage
Marine, aviation and
transportMotor
Accidentand health Miscellaneous Total
.......................................... (Rupees in '000) ...........................................
As at March 31, 2022 (Un-audited) - PTF
Fire and property damage
Marine, aviation and
transportMotor
Accidentand health Miscellaneous Total
.......................................... (Rupees in '000) ...........................................
As at March 31, 2022 (Un-audited) - OPF
Fire and property damage
Marine, aviation and
transportMotor
Accidentand health Miscellaneous Total
.......................................... (Rupees in '000) ...........................................
As at December 31, 2021 (Audited) - OPF
Fire and property damage
Marine, aviation and
transportMotor
Accidentand health Miscellaneous Total
.......................................... (Rupees in '000) ...........................................

JUBILEE GENERAL INSURANCE48
Financial assets measured at fair value Investments in equity securities 187,828 - - - 187,828 187,828 - - 187,828 Financial assets not measured at fair value Cash and bank* - - 938,512 - 938,512 - - - - Term deposits* - 100,000 - - 100,000 - - - - Takaful / re-takaful receivables* - - 398,821 - 398,821 - - - - Receivable from PTF* - - 163,073 - 163,073 - - - - Loans and receivables* - - 3,304 - 3,304 - - - - Salvage recoveries accrued* - - 6,990 - 6,990 - - - - Re-takaful recoveries against outstanding claims / benefits* - - 351,045 - 351,045 - - - - Financial liabilities not measured at fair value Outstanding claims including IBNR* - - - (647,354) (647,354) - - - - Takaful / re-takaful payables* - - - (259,451) (259,451) - - - - Payable to OPF* - - - (163,073) (163,073) - - - - Other creditors and accruals* - - - (66,216) (66,216) - - - -
187,828 100,000 1,861,745 (1,136,094) 1,013,479 187,828 - - 187,828
Financial assets measured at fair valueInvestments in equity securities 141,465 - - - 141,465 141,465 - - 141,465 Financial assets not measured at fair value Cash and bank* - - 763,765 - 763,765 - - - - Term deposits* - 200,000 - - 200,000 - - - - Takaful / re-takaful receivables* - - 298,100 - 298,100 - - - - Receivable from PTF* - - 102,562 - 102,562 - - - - Loans and receivables* - - 3,865 - 3,865 - - - - Salvage recoveries accrued* - - 9,567 - 9,567 - - - - Re-takaful recoveries against outstanding claims / benefits* - - 304,534 - 304,534 - - - - Financial liabilities not measured at fair value Outstanding claims including IBNR* - - - (587,984) (587,984) - - - - Takaful / re-takaful payables* - - - (224,298) (224,298) - - - - Payable to OPF* - - - (102,562) (102,562) - - - - Other creditors and accruals* - - - (64,756) (64,756) - - - -
141,465 200,000 1,482,393 (979,600) 844,258 141,465 - - 141,465 * The Operator has not disclosed the fair value of these items because their carrying amounts are a reasonable approximation of fair value.
28. FAIR VALUE OF FINANCIAL INSTRUMENTS The following table shows the carrying amounts and fair values of financial assets and financial liabilities,
including their levels in the fair value hierarchy.
Available-for-sale
Loansand
receivables
Held-to- maturity
Other financial liabilities
Total Level 1 Level 2 Level 3 Total
Carrying amount Fair value
......................................................................................... (Rupees in '000) .........................................................................................
March 31، 2022 (Un-audited)
Available-for-sale
Loansand
receivables
Held-to- maturity
Other financial liabilities
Total Level 1 Level 2 Level 3 Total
Carrying amount Fair value
......................................................................................... (Rupees in '000) .........................................................................................
December 31, 2021 (Audited)

28.1 Fair value is an amount for which an asset could be exchanged, or a liability settled, between knowledgeable willing parties in an arm's length transaction. Consequently, differences may arise between the carrying values and the fair values estimates.
The operations measures fair values using the following fair value hierarchy that reflects the significance of the
inputs used in making the measurements: Level 1: Fair value measurements using quoted prices (unadjusted) in active markets for identical assets or
liabilities. Level 2: Fair value measurements using inputs other than quoted prices included within Level 1 that are
observable for the asset or liability, either directly (i.e. as prices) or indirectly (i.e. derived from prices). Level 3: Unobservable inputs for the asset or liability. 29. DATE OF AUTHORISATION FOR ISSUE These condensed interim financial statements have been authorised for issue in accordance with a resolution of
the Board of Directors on April 26, 2022. 30. GENERAL All figures have been rounded off to the nearest thousand of rupees, unless otherwise stated.
1ST QUARTER REPORT 49
Hassan KhanChief Executive
Amyn CurrimbhoyDirector
Nawaid JamalChief Financial Officer
R. Zakir MahmoodChairman
Amin A. HashwaniDirector

Jubilee General Insurance Company Limited2nd Floor, Jubilee Insurance House,I.I. Chundrigar Road, P.O. Box: 4795,Karachi-74000, Pakistan.
UAN: (9221) 111-654-111Fax: (9221) 32416728/32438738 Toll Free: 0800-03786, SMS: 82665
Email: [email protected]: www.jubileegeneral.com.pk