1987-calcil tissue int-bone
TRANSCRIPT

Calcif Tissue Int (1987) 40:332-338 Calcified Tissue International �9 1987 Springer-Verlag New York Inc.
Transmission Electron Microscopy of Lattice Planes in Human Alveolar Bone Apatite Crystals
E Cuisinier, E. E Bres, J. Hemmerle, J.-C. Voegel, and R. M. Frank
Unit6 de Recherches INSERM U 157, Facult6 de Chirurgie Dentaire, 1 place de l'H6pital, 67000 Strasbourg, France
Summary. Periodic fringes corresponding to six different lattice planes have been observed in apa- tite crystals of human normal alveolar bone by transmission electron microscopy. Three of these sets of fringes have spacings less than 3.5 ,~ corre- sponding to the Scherzer resolution of the micro- scope used. The (0002) lattice,plane of hydroxyapa- tite of 3.4 A d-spacinogs, the (2111) lattice plane with a d-spacing of 2.81 A, and the (30-30) lattice plane with a d-spacing of 2.72 A have been identified. The (0002) and (2121) lattice planes have been observed for the first time in bone microcrystals. Some of the crystals studied were characterized by a mean width/thickness ratio of 6.91, typical of platelike habit, whereas observations of crystals aligned along the (1310) and (1511) directions showed a nee- dlelike habit. The mean length of the bone apatite crystals was 470 A. A dark line similar to the one observed in enamel and dentine crystals was also seen. The bone microcrystals observed have shown a high sensitivity to beam damage.
Key words: Human alveolar bone - - Apati te crystals - - Lattice planes - - Transmission electron microscopy.
Human bones are composed of 60% weight of a mineral phase [1]. A strong correspondence of structure was observed between the crystals com- posing this phase and bone crystals, as shown by X-ray diffraction studies [2]. The crystal habit of bone microcrystals has been studied by the X-ray diffraction techniques [3, 4] and transmission elec-
Send reprint requests to E Cuisinier at the above address.
tron microscopy [5-9]. Transmission electron mi- croscopy is more adapted to the study of the struc- ture and shape of microcrystals of the type encoun- tered in bone because individual microcrystals can be observed with this technique [10, 11]. X-ray dif- fraction studies [3, 4], have shown that the bone mineral particles have a needlelike habit, but elec- tron microscopy observations have shown a plate- like morphology. Lees [12] proposed a structure of bone tissues where both types of crystals exist. No accurate measurement of platelike crystals length was made by Lees but he estimated that it cannot exceed 500 A. The contrast dark line parallel was observed for the first time in enamel by R6nnholm [13] and in dentine by Nakahara [14] who has de- scribed this structure as a disk parallel to the (1070) plane and situated inside the crystals.
Materials and Methods
Fragments of human alveolar bone have been obtained in adult patients 18-25 years old and in connection with the extraction of third molars without soft tissue inflammation. Samples have been fixed for 2 hours in a solution of 2% glutaraldehyde and 2% paraformaldehyde in 0.1 M sodium cacodylate at pH 7.4. After 2 hours of postfixation in a solution of 1% O~O 4 in the same buffer, the specimens have been embedded in Epon 812. Nondecalcified 200-300 A thick sections have been prepared with a Sorval Porter MT-1 microtome equipped with a diamond knife and floated onto 400 mesh carbon-coated copper grids.
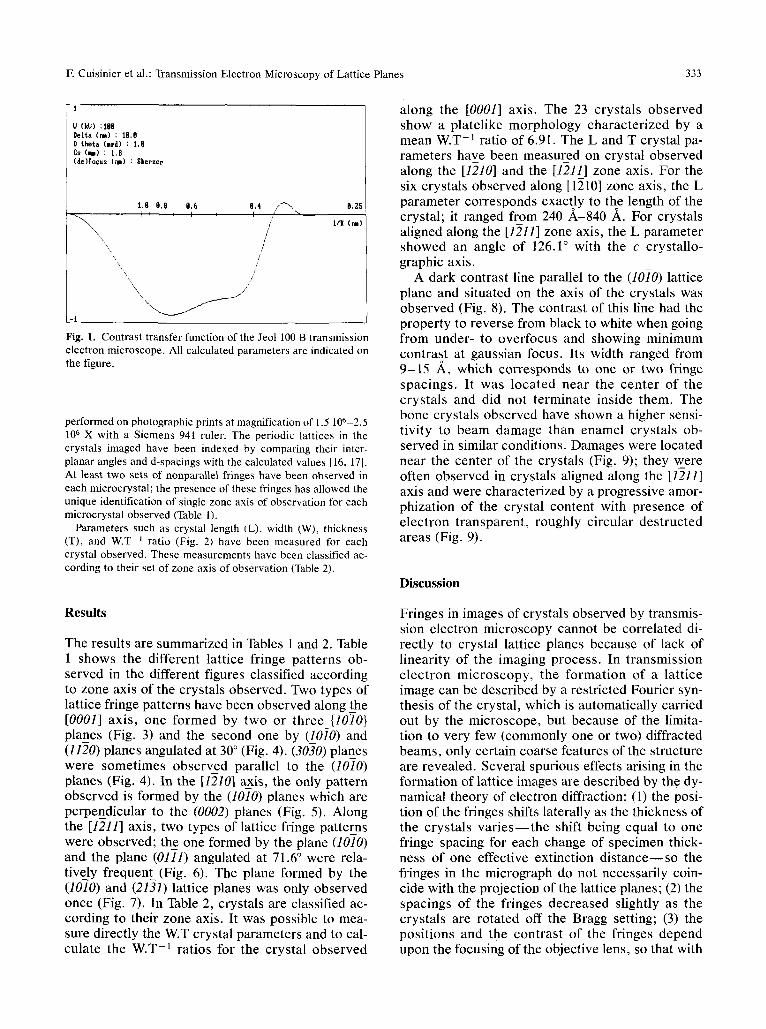
Bright field transmission electron microscopy has been per- formed at 100 kV with a Jeol 100 B transmission electron micro- scope equipped with an anticontamination device. No goniom- eter stage was used. An objective aperture of 30 txm diameter was used for selecting all beams up to a resolution of 2.5 J~, The spherical aberration constant of the objective lens was 1.8 mm, the chromatic aberration constant was 1.5 ram, and the focal length of the objective lens was 1.8 ram. The Jeol 100 B has an information limit of 0.4 ,~-1 and a first cutoff frequency of the contrast transfer function [15] at Scherzer focus ( - 942.3 A) of 0.278 ,~-~ [15] (Fig. 1). Dimensional measurements have been
F. Cuisinier et al.: Transmission Electron Microscopy of Lattice Planes 333
- 1
O ( ~ ) :lBB D e l ~ ( M ) : 18.0 D theta (mrd) : 1,8 Cs ( m ) : 1.8 (de)focus (~) : Sherzer
.-1
1 , 8 B , 8 8.6 [ , 4 , i
\ \ /
g,4 / ~ B.25 I / N, ,
I/K Cnm)
Fig. 1. Contrast transfer function of the Jeol 100 B transmission electron microscope. All calculated parameters are indicated on the figure.
performed on photographic prints at magnification of 1.5 106-2.5 106 X with a Siemens 941 ruler. The periodic lattices in the crystals imaged have been indexed by comparing their inter- planar angles and d-spacings with the calculated values [16, 17]. At least two sets of nonparallel fringes have been observed in each microcrystal; the presence of these fringes has allowed the unique identification of single zone axis of observation for each microcrystal observed (Table 1).
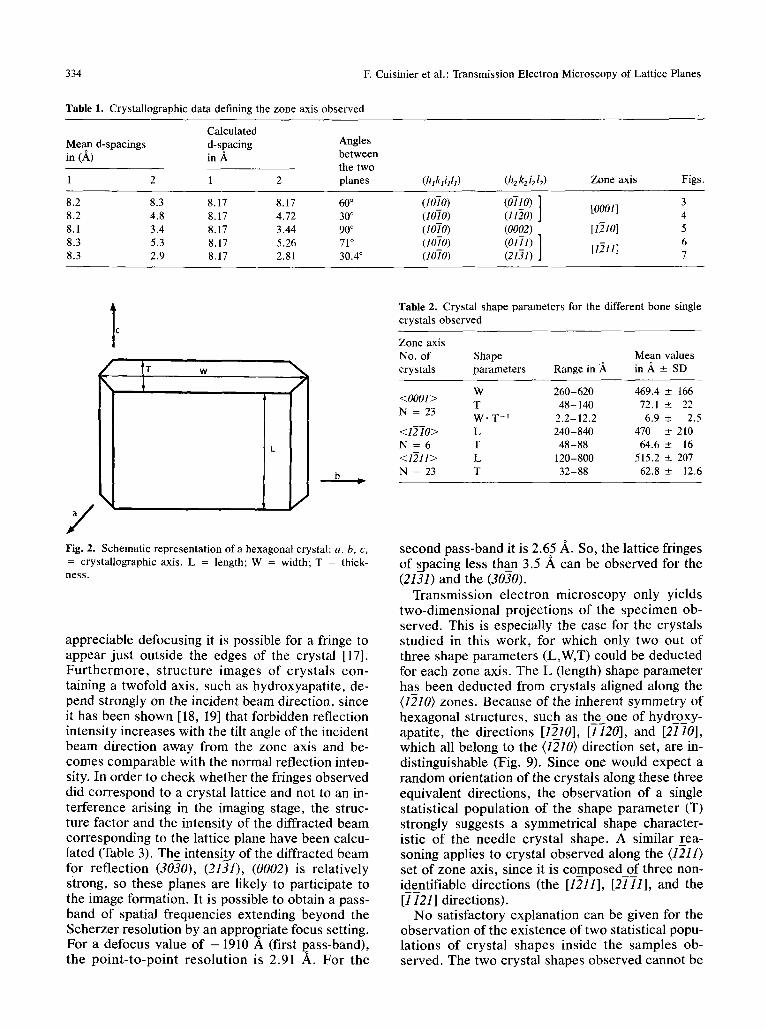
Parameters such as crystal length (L), width (W), thickness (T), and W.T -1 ratio (Fig. 2) have been measured for each crystal observed. These measurements have been classified ac- cording to their set of zone axis of observation (Table 2).
along the [0001] axis. The 23 crystals observed show a platelike morphology charac ter ized by a mean W.T -1 ratio of 6.91. The L and T crystal pa- rameters have been measured on crystal observed along the [1310] and the [1-211] zone axis. For the six crystals observed along [1210] zone axis, the L parameter corresponds exactly to the length of the crystal; it ranged from 240 A-840 ,~. For crystals aligned along the [1211] zone axis, the L parameter showed an angle of 126.1 ~ with the c crystallo- graphic axis.
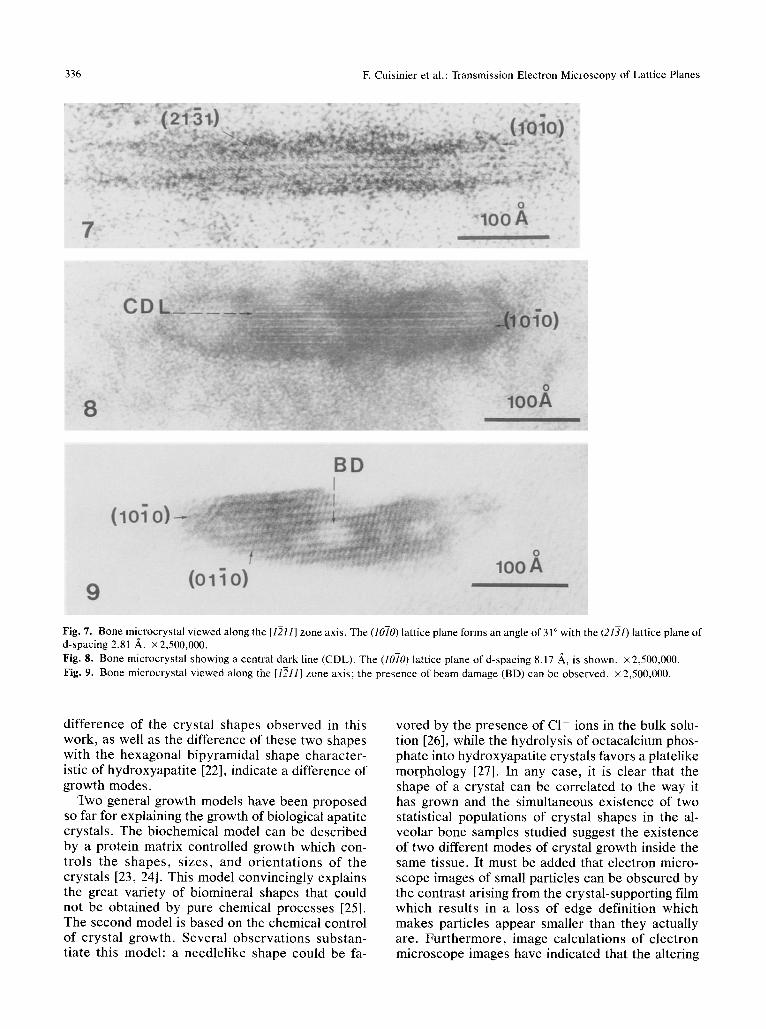
A dark contrast line parallel to the (1010) lattice plane and situated on the axis of the crystals was observed (Fig. 8). The contrast of this line had the proper ty to reverse from black to white when going f rom under- to overfocus and showing minimum contrast at gaussian focus. Its width ranged from 9 -15 A, which corresponds to one or two fringe spacings. It was loca ted near the cen te r of the crystals and did not terminate inside them. The bone crystals observed have shown a higher sensi- t ivity to beam damage than enamel crystals ob- served in similar conditions. Damages were located near the center of the crystals (Fig. 9); they were often observed in crystals aligned along the [1-211] axis and were characterized by a progressive amor- phization of the crystal content with presence of e lec t ron t ransparent , roughly circular des t ructed areas (Fig. 9).
Discussion
Results
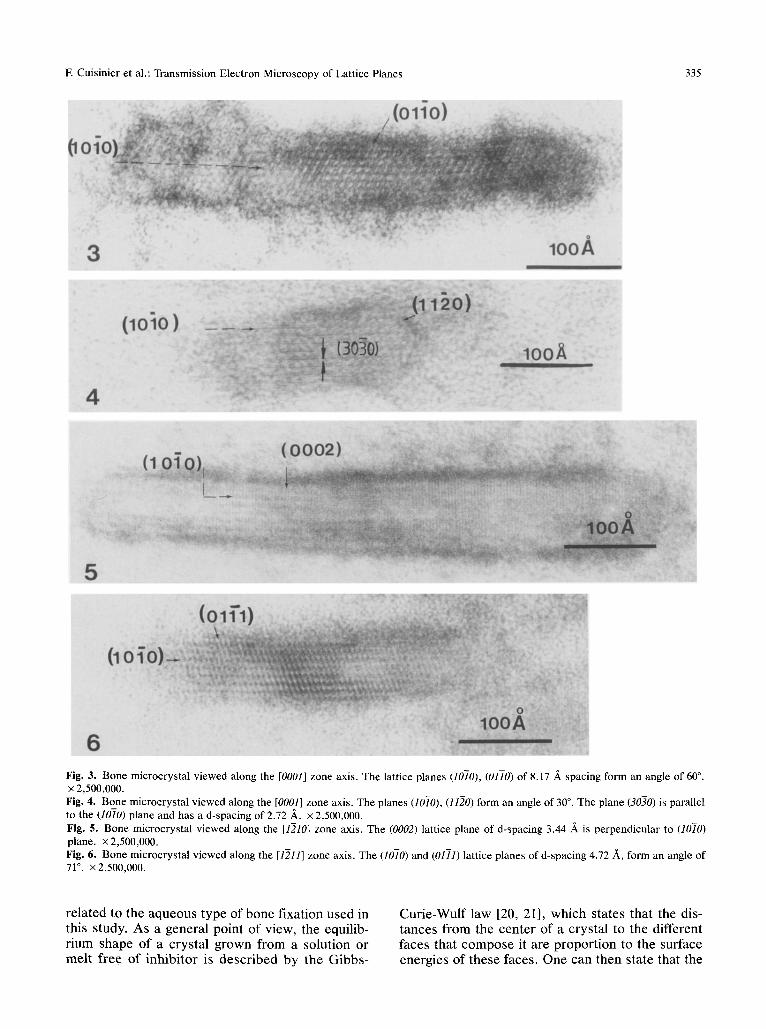
The results are summarized in Tables 1 and 2. Table 1 shows the different lattice fringe pat terns ob- served in the different figures classified according to zone axis of the crystals observed. Two types of lattice fringe patterns have been observed along the [0001] axis, one fo rmed by two or three{10iO} planes (Fig. 3) and the second one by (1010) and (1120) planes angulated at 30 ~ (Fig. 4). (3030) planes were somet imes observed parallel to the (1010) planes (Fig. 4). In the [1510] axis, the only pattern observed is formed by the (1010) planes which are perpendicular to the (0002) planes (Fig. 5). Along the [1211] axis, two types of lattice fringe patterns were observed; the one formed by the plane (1010) and the plane (0171) angulated at 71.6 ~ were rela- tively f r e que n t (Fig. 6). The plane formed by the (1010) and (2131) lattice planes was only observed once (Fig. 7). In Table 2, crystals are classified ac- cording to their zone axis. It was possible to mea- sure directly the W.T crystal parameters and to cal- culate the W.T -a ratios for the crystal observed
Fringes in images of crystals observed by transmis- sion electron microscopy cannot be correlated di- rectly to crystal lattice planes because of lack of l ineari ty of the imaging process . In t ransmission e l ec t ron mic roscopy , the fo rmat ion of a latt ice image can be described by a restricted Fourier syn- thesis of the crystal, which is automatically carried out by the microscope, but because of the limita- tion to very few (commonly one or two) diffracted beams, only certain coarse features of the structure are revealed. Several spurious effects arising in the formation of lattice images are described by the dy- namical theory of electron diffraction: (1) the posi- tion of the fringes shifts laterally as the thickness of the crystals v a r i e s - - t h e shift being equal to one fringe spacing for each change of specimen thick- ness of one effective extinction d i s t ance - - so the fringes in the micrograph do not necessarily coin- cide with the projection of the lattice planes; (2) the spacings of the fringes decreased slightly as the crystals are rotated off the Bragg setting; (3) the posi t ions and the contras t of the fringes depend upon the focusing of the objective lens, so that with
334 E Cuisinier et al.: Transmission Electron Microscopy of Lattice Planes
Table 1. Crystallographic data defining the zone axis observed
Calculated Mean d-spacings d-spacing Angles in (,&) in ,& between
the two 1 2 1 2 planes (hlklilll) (h2k2ifl2) Zone axis Figs,
8.2 8.3 8.17 8.17 60 ~ 8.2 4.8 8.17 4.72 30 ~ 8.1 3.4 8.17 3.44 90 ~ 8.3 5.3 8.17 5.26 71 ~ 8.3 2.9 8.17 2.81 30.4 ~
(1070) (OilO) ] 3 [0001] (10-i0) (11-20) ] 4 (1070) (0002) [1310] 5 (10-i0) (0171) ] [1311] 6 (1070) (2131) ] 7
t b 1
I
I )
b p
Fig. 2. Schematic representation of a hexagonal crystal: a, b, c, = crystallographic axis. L = length; W = width; T = thick- ness.
appreciable defocusing it is possible for a fringe to appear just outside the edges of the crystal [17]. Furthermore, structure images of crystals con- taining a twofold axis, such as hydroxyapatite, de- pend strongly on the incident beam direction, since it has been shown [18, 19] that forbidden reflection intensity increases with the tilt angle of the incident beam direction away from the zone axis and be- comes comparable with the normal reflection inten- sity. In order to check whether the fringes observed did correspond to a crystal lattice and not to an in- terference arising in the imaging stage, the struc- ture factor and the intensity of the diffracted beam corresponding to the lattice plane have been calcu- lated (Table 3). The intensity of the diffracted beam for reflection (3030), (2131), (0002) is relatively strong, so these planes are likely to participate to the image formation. It is possible to obtain a pass- band of spatial frequencies extending beyond the Scherzer resolution by an approl~riate focus setting. For a defocus value of - 1910 A (first poass-band), the point-to-point resolution is 2.91 A. For the
Table 2. Crystal shape parameters for the different bone single crystals observed
Zone axis No. of Shape Mean values crystals parameters Range in A in A _+ SD
W 260-620 469.4 • 166 <0001>
T 48-140 72.1 _ 22 N = 23
W. T -1 2.2-12.2 6.9 ~ 2.5 <1210> L 240-840 470 _+ 210 N = 6 T 48-88 64.6 • 16 <1-,211> L 120-800 515.2 -+ 207 N = 23 T 32-88 62.8 -+ 12.6
second pass-band it is 2.65 ,&. So, the lattice fringes of spacing less than 3.5/~, can be observed for the (2131) and the (3030).
Transmission electron microscopy only yields two-dimensional projections of the specimen ob- served. This is especially the case for the crystals studied in this work, for which only two out of three shape parameters (L,W,T) could be deducted for each zone axis. The L (length) shape parameter has been deducted from crystals aligned along the (1-210) zones. Because of the inherent symmetry of hexagonal structures, such as the_one of hydroxy- apatite, the directions [1-210], [1120], and [2110], which all belong to the (1-210) direction set, are in- distinguishable (Fig. 9). Since one would expect a random orientation of the crystals along these three equivalent directions, the observation of a single statistical population of the shape parameter (T) strongly suggests a symmetrical shape character- istic of the needle crystal shape. A similar rea- soning applies to crystal observed along the (1-211) set of zone axis, since it is composedo_f three non- identifiable directions (the [1211], [2111], and the [1121] directions).
No satisfactory explanation can be given for the observation of the existence of two statistical popu- lations of crystal shapes inside the samples ob- served. The two crystal shapes observed cannot be
F. Cuisinier et al.: Transmission Electron Microscopy of Lattice Planes 335
Fig. 3. Bone microcrystal viewed along the [0001] zone axis. The lattice planes (1070), (0170) of 8.17 A spacing form an angle of 60 ~ • 2,500,000. Fig. 4. Bone microcrystal viewed along the [0001] zone axis. The planes (1010), (1130) form an angle of 30 ~ The plane (3030) is parallel to the (1070) plane and has a d-spacing of 2.72 ~_. x 2,500,000. Fig. 5. Bone microcrystal viewed along the [f210] zone axis. The (0002) lattice plane of d-spacing 3.44 A is perpendicular to (1070) plane. • 2,500,000. Fig. 6. Bone microcrystal viewed along the [1311] zone axis. The (1070) and (0171) lattice planes of d-spacing 4.72 A, form an angle of 71 ~ • 2,500,000.
re la ted to the aqueous type of b o n e f ixat ion used in this study. As a genera l po in t of view, the equi l ib- r i um shape of a crys ta l g rown f rom a so lu t ion or me l t f ree of i nh ib i t o r is d e s c r i b e d b y the G ibbs -
C u r i e - W u l f law [20, 21], which states tha t the dis- t ances f rom the cen te r of a c rys ta l to the different faces that c o m p o s e it are p ropor t ion to the surface energies of these faces. One can then state that the
336 E Cuisinier et al.: Transmission Electron Microscopy of Lattice Planes
Fig. 7. Bone microcrystal viewed along the [1311] zone axis. The (1070) lattice plane forms an angle of 31 ~ with the (2131) lattice plane of d-spacing 2.81 A. x 2,500,000. Fig. 8. Bone microcrystal showing a central dark line (CDL). The (1070) lattice plane of d-spacing 8.17 .~, is shown, x 2,500,000. Fig. 9. Bone microcrystal viewed along the [13111 zone axis; the presence of beam damage (BD) can be observed. • 2,500,000.
d i f ference of the crys ta l shapes obse rved in this work, as well as the difference of these two shapes with the hexagona l b ipyramida l shape charac ter - istic of hydroxyapat i te [22], indicate a difference of growth modes.
Two general growth models have been proposed so far for explaining the growth of biological apati te crystals. The biochemical model can be described by a protein matrix controlled growth which con- t rois the shapes , s izes , and o r i en ta t ions of the crystals [23, 24]. This model convincingly explains the great var iety of biomineral shapes that could not be obtained by pure chemical processes [25]. The second model is based on the chemical control o f c rys ta l growth. Several observa t ions substan- t iate this model : a needlel ike shape could be fa-
vored by the presence of C1- ions in the bulk solu- tion [26], while the hydrolysis of octacalcium phos- phate into hydroxyapat i te crystals favors a platelike morphology [27]. In any case, it is clear that the shape of a crystal can be correlated to the way it has grown and the simultaneous existence of two statistical populat ions of crystal shapes in the al- veolar bone samples studied suggest the existence of two different modes of crystal growth inside the same tissue. I t must be added that electron micro- scope images of small particles can be obscured by the contrast arising f rom the crystal-support ing film which resul ts in a loss of edge definit ion which makes particles appear smaller than they actually are. Fu r the rmore , image calculat ions of e lec t ron microscope images have indicated that the altering
E Cuisinier et al.: Transmission Electron Microscopy of Lattice Planes 337
a 3
a l
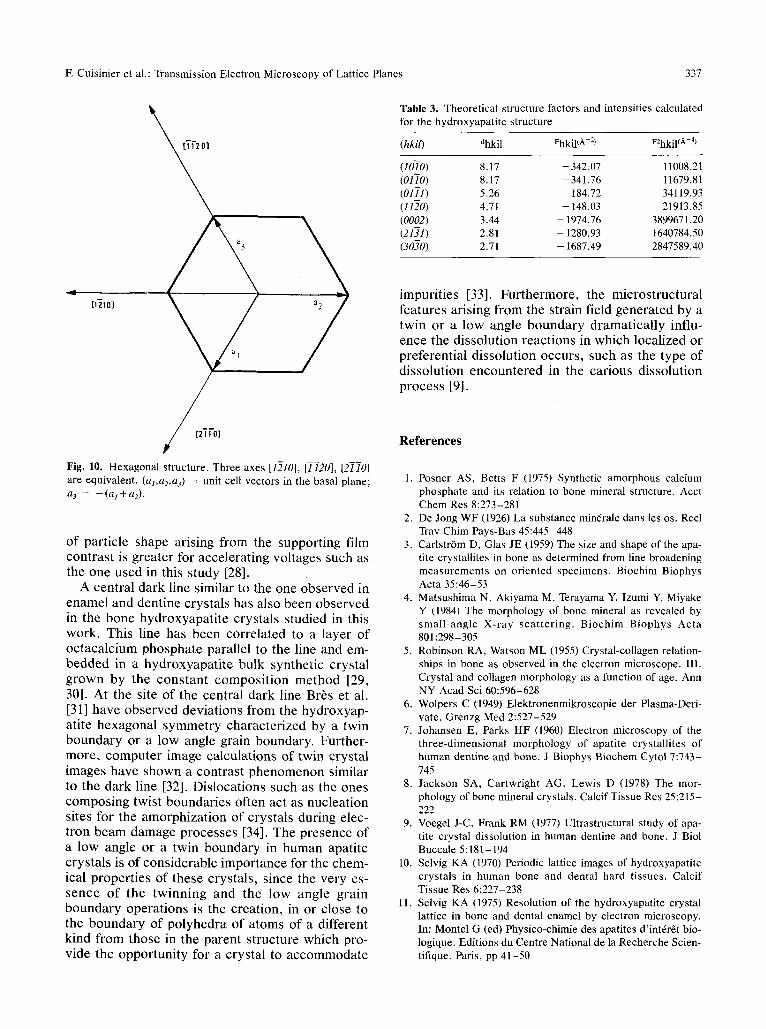
Fig. 10. Hexagonal structure. Three axes [1]10], [71201, [2770] are equivalent. (al,a2,a3) = unit cell vectors in the basal plane; a3 = -(al+a2).
of particle shape arising from the supporting film contrast is greater for accelerating voltages such as the one used in this study [28].
A central dark line similar to the one observed in enamel and dentine crystals has also been observed in the bone hydroxyapatite crystals studied in this work. This line has been correlated to a layer of octacalcium phosphate parallel to the line and em- bedded in a hydroxyapatite bulk synthetic crystal grown by the constant composition method [29, 30]. At the site of the central dark line Brbs et al. [31] have observed deviations from the hydroxyap- atite hexagonal symmetry characterized by a twin boundary or a low angle grain boundary. Further- more, computer image calculations of twin crystal images have shown a contrast phenomenon similar to the dark line [32]. Dislocations such as the ones composing twist boundaries often act as nucleation sites for the amorphization of crystals during elec- tron beam damage processes [34]. The presence of a low angle or a twin boundary in human apatite crystals is of considerable importance for the chem- ical properties of these crystals, since the very es- sence of the twinning and the low angle grain boundary operations is the creation, in or close to the boundary of polyhedra of atoms of a different kind from those in the parent structure which pro- vide the opportunity for a crystal to accommodate
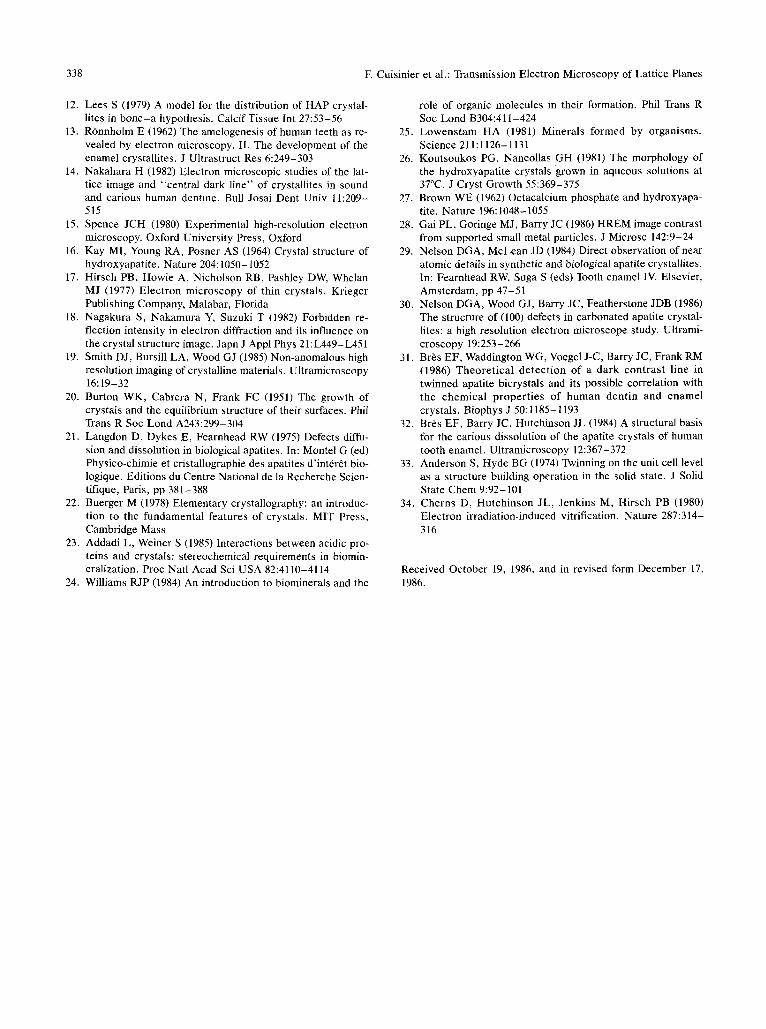
Table 3. Theoretical structure factors and intensities calculated for the hydroxyapatite structure
(hkil) dhki 1 Vhkil(A-2 ) FEhkil(A 4~
(10-[0) 8.17 - 342.07 11008.21 (0170) 8.17 -341.76 11679.81 (0111) 5.26 - 184.72 34119.93 (1120) 4.71 - 148.03 21913.85 (0002) 3.44 - 1974.76 3899671.20 (2131) 2.81 - 1280.93 1640784.50 (30"30) 2.71 - 1687.49 2847589.40
impurities [33]. Furthermore, the microstructural features arising from the strain field generated by a twin or a low angle boundary dramatically influ- ence the dissolution reactions in which localized or preferential dissolution occurs, such as the type of dissolution encountered in the carious dissolution process [9].
References
1. Posner AS, Bens F (1975) Synthetic amorphous calcium phosphate and its relation to bone mineral structure. Acct Chem Res 8:273-281
2. De Jong WF (1926) La substance min6rale dans les os. Recl Trav Chim Pays-Bas 45:445-448
3. Carlstr6m D, Glas JE (1959) The size and shape of the apa- tite crystallites in bone as determined from line broadening measurements on oriented specimens. Biochim Biophys Acta 35:46-53
4. Matsushima N, Akiyama M, Terayama Y, Izumi Y, Miyake Y (1984) The morphology of bone mineral as revealed by small-angle X-ray scat ter ing. Biochim Biophys Acta 801:298-305
5. Robinson RA, Watson ML (1955) Crystal-collagen relation- ships in bone as observed in the electron microscope. III. Crystal and collagen morphology as a function of age. Ann NY Acad Sci 60:596-628
6. Wolpers C (1949) Elektronenmikroscopie der Plasma-Deri- vate. Grenzg Med 2:527-529
7. Johansen E, Parks HF (1960) Electron microscopy of the three-dimensional morphology of apatite crystallites of human dentine and bone. J Biophys Biochem Cytol 7:743- 745
8. Jackson SA, Cartwright AG, Lewis D (1978) The mor- phology of bone mineral crystals. Calcif Tissue Res 25:215- 222
9. Voegel J-C, Frank RM (1977) Ultrastructural study of apa- rite crystal dissolution in human dentine and bone. J Biol Buccale 5:181 - 194
10. Setvig KA (1970) Periodic lattice images of hydroxyapatite crystals in human bone and dental hard tissues. Calcif Tissue Res 6:227-238
11. Selvig KA (1975) Resolution of the hydroxyapatite crystal lattice in bone and dental enamel by electron microscopy. In: Montel G (ed) Physico-chimie des apatites d'int6r6t bio- logique. Editions du Centre National de la Recherche Scien- tifique. Paris, pp 41-50
338 E Cuisinier et al.: Transmission Electron Microscopy of Lattice Planes
12. Lees S (1979) A model for the distribution of HAP crystal- lites in b o n e - a hypothesis. Calcif Tissue Int 27:53-56
13. R6nnholm E (1962) The amelogenesis of human teeth as re- vealed by electron microscopy. II. The development of the enamel crystallites. J Ultrastruct Res 6:249-303
14. Nakahara H (1982) Electron microscopic studies of the lat- tice image and "central dark line" of crystallites in sound and carious human dentine. Bull Josai Dent Univ 11:209- 515
15. Spence JCH (1980) Experimental high-resolution electron microscopy. Oxford University Press, Oxford
16. Kay MI, Young RA, Posner AS (1964) Crystal structure of hydroxyapatite. Nature 204:1050-1052
17. Hirsch PB, Howie A, Nicholson RB, Pashley DW, Whelan MJ (1977) Electron microscopy of thin crystals. Krieger Publishing Company, Malabar, Florida
18. Nagakura S, Nakamura Y, Suzuki T (1982) Forbidden re- flection intensity in electron diffraction and its influence on the crystal structure image. Japn J Appl Phys 21:L449-L451
19. Smith DJ, Bursill LA, Wood GJ (1985) Non-anomalous high resolution imaging of crystalline materials. Ultramicroscopy 16:19-32
20. Burton WK, Cabrera N, Frank FC (1951) The growth of crystals and the equilibrium structure of their surfaces. Phil Trans R Soc Lond A243:299-304
21. Langdon D, Dykes E, Fearnhead RW (1975) Defects diffu- sion and dissolution in biological apatites. In: Montel G (ed) Physico-chimie et cristallographie des apatites d'int6r6t bio- logique. Editions du Centre National de la Recherche Scien- tifique, Paris, pp 381-388
22. Buerger M (1978) Elementary crystallography: an introduc- tion to the fundamental features of crystals. MIT Press, Cambridge Mass
23. Addadi L, Weiner S (1985) Interactions between acidic pro- teins and crystals: stereochemical requirements in biomin- eralization. Proc Natl Acad Sci USA 82:4110-4114
24. Williams RJP (1984) An introduction to biominerals and the
role of organic molecules in their formation. Phil Trans R Soc Lond B304:411-424
25. Lowenstam HA (1981) Minerals formed by organisms. Science 211:1126-1131
26. Koutsoukos PG, Nancollas GH (1981) The morphology of the hydroxyapatite crystals grown in aqueous solutions at 37~ J Cryst Growth 55:369-375
27. Brown WE (1962) Octacalcium phosphate and hydroxyapa- tite. Nature 196:1048-1055
28. Gai PL, Goringe MJ, Barry JC (1986) HREM image contrast from supported small metal particles. J Microsc 142:9-24
29. Nelson DGA, McLean JD (1984) Direct observation of near atomic details in synthetic and biological apatite crystallites. In: Fearnhead RW, Suga S (eds) Tooth enamel IV. Elsevier, Amsterdam, pp 47-51
30. Nelson DGA, Wood GJ, Barry JC, Featherstone JDB (1986) The structure of (100) defects in carbonated apatite crystal- lites: a high resolution electron microscope study. Ultrami- croscopy 19:253-266
31. Br6s EF, Waddington WG, Voegel J-C, Barry JC, Frank RM (1986) Theoret ical detect ion of a dark contras t line in twinned apatite bicrystals and its possible correlation with the chemical propert ies of human dentin and enamel crystals. Biophys J 50:1185-1193
32. Br~s EF, Barry JC, Hutchinson JL (1984) A structural basis for the carious dissolution of the apatite crystals of human tooth enamel. Ultramicroscopy 12:367-372
33. Anderson S, Hyde BG (1974) Twinning on the unit cell level as a structure building operation in the solid state. J Solid State Chem 9:92-101
34. Cherns D, Hutchinson JL, Jenkins M, Hirsch PB (1980) Electron irradiation-induced vitrification. Nature 287:314- 316
Received October 19, 1986, and in revised form December 17, 1986.