12. .05- .ol - dtic
TRANSCRIPT
UNCLASSIFIED. SECURITY CLASSIFICATION OF THIS PAGE
REPORT DOCUMENTATION PAGE
la REPORT SECURITY CLASSIFICATION
Unclassified 2a SECURITY CLASSIFICATION AUTHORITY
2b DECLASS1FICATION/DOWNGRADING SCHEDULE
A PERFORMING ORGANIZATION REPORT NUMBER(S)
6a. NAME OF PERFORMING ORGANIZATION
Arthur Young & Company L
5b. OFFICE SYMBOL (If applicable)
lb. RESTRICTIVE MARKINGS
3. DISTRIBUTION/AVAILABILITY OF REPORT
Approved for public release; distribution unlimited.
5. MONITORING ORGANIZATION REPORT NUMBER(S)
BRMC-86-5066-1
7a. NAME OF MONITORING ORGANIZATION
AFBRMC
6c. ADDRESS (City. State and 7.1P Code)
Kansas City, Missouri 64105
8*. NAME OF FUNDING/SPONSORING ORGANIZATION
8b. OFFICE SYMBOL {If applicable)
RDCB 8c ADDRESS (City, State and ZIP Code)
Wright-Patterson AFB, Ohio 45433-6583
11. TITLE (Include Security Classification) ,, _ . Manufacturing Work Measurement £.ystom Evaluation (Tlncl fl9s1 f 1 prl)
7b. ADDRESS (City, State and ZIP Code)
Wright-Patterson AFB, Ohio 45433-6583
9. PROCUREMENT INSTRUMENT IDENTIFICATION NUMBER
F33615-86-C-5066
10. SOURCE OF FUNDING NOS.
PROGRAM ELEMENT NO.
71113F
PROJECT NO.
06
TASK NO.
00
WORK UNIT NO.
00
12. PERSONAL AUTHOR(S)
Arthur Young & Company 13a. TYPE OF REPORT
Final 13b. TIME COVERED
FROM ^IfenfiS TO U^S7 16. SUPPLEMENTARY NOTATION
14. DATE OF REPORT (Yr., Mo., Day)
1987, April 15. PAGE COUNT
309
17 COSATI CODES
FIELD
.12.
.05-
GROUP
.OL
.02.
SUB. GR.
18 SUBJECT TERMS (Continue on reverse if necessary and identify by block number)
Work Measurement, Time Standards, Contract Administration, Accuracy, Statistical Analysis, Prnfhir.tion _
•
19. ABSTRACT (Continue on reverse if necessary and identify by block number)
Final Report and Reference Guide documenting currently available predetermined time systems evaluated as to their ability to meet MIL STD 1567A. Identified for evaluation were 20 predetermined time systems, two machining data systems, and three software systems which utilize conmercially available predetermined time systems. Report includes a detailed description of each system identified and where applicable, a statistical evaluation of the system's accuracy. System descriptions include history, general description, application method, training information, costs, conpliance to MIL STD 1567A, strengths and weaknesses, and current users.
20. DISTRIBUTION/AVAILABILITY OF ABSTRACT
UNCLASSIFIED/UNLIMITED IS SAME AS RPT. D DTIC USERS □
22a. NAME OF RESPONSIBLE INDIVIDUAL
Major R.C. Collins
21. ABSTRACT SECURITY CLASSIFICATION
Unclassified
22b, TELEPHONE NUMBER (Include Area Code)
(513) 255-6221
22c. OFFICE SYMBOL
AFBRMC-RDCB
DD FORM 1473, 83 APR EDITION OF 1 JAN 73 IS OBSOLETE. UNCLASSIFIED SECURITY CLASSIFICATION OF THIS PAGE
Li6;^Wto
oo o
o in
AIR FORCE BUSINESS RESEARCH MANAGEMENT CENTER
MANUFACTURING WORK MEASUREMENT SYSTEM EVALUATION
FINAL REPORT AND
REFERENCE GUIDE
APPROVED FOR PUBLIC RELEASE; DISTRIBUTION UNLIMITED.
PREPARED BY: ARTHUR YOUNG & CO. 920 MAIN STREET KANSAS CITY, MO 64105
CONTRACT NO. F33615-86-C-5066
APRIL 1987
Arthur Young A MEMBER OF ARTHUR VDUNO 'NTERNATsONAL
PREFACE
This reference guide has been prepared to provide its users with a basic
understanding of work measurement, the intent of MIL STD 1567A, and an
explanation of currently available predetermined time measurement systems,
their application, and potential to meet MIL STD 1567A.
The data contained in this report/reference guide does not represent the
author's opinion but is based on data provided by system vendors and user
references supplied by the vendors.
CERTIFICATION OF TECHNICAL DATA OONPORMITY
The Contractor, Arthur Young & Company, hereby certifies that +~ +u u
nT FSsritcioTief the, rhn?cJ data ^I'vSd^SrS LTcS?L0
o?"the cont?^ ^ 1S C0,nPlete• a0CUrate' and ca"Plies «"" an requires
O/ Name and Title of Certitying Omcial
TABI£ OP OONTBNTS
PAGE
EXECUTIVE SUMMARY 1
TECHNICAL APPROACH 7
WORK MEASUREMENT OVERVIEW 11
MIL STD 1567A OVERVIEW 17
SYSTEM DESCRIPTIONS
SUMMARY 29
PREDETERMINED TIME SYSTEMS
MOTION TIME SURVEY (MTS) 33 G.E. STANDARD DATA 40 MM-l, 4M, 2M 47 MTM-2, ADAM 60 IflM-S 68 MTM-MEK 73 MTM-UAS 79 MTM-V 86 MTM-TE 91 MTM-M 95 MANPRO" 100 BASIC MOST® 110 MINI MOST® 119 MAXI MOST® 127 CUE/DART 135 MASTER STANDARD DATA (MSD) 143 NAVAIR - ELEMENTAL STANDARD DATA 150 WORK-FACTOR® 157 UNIVEL® 173 MODAPTS PLUS™ 181
MACHINE PROCESS
AM COST ESTIMATOR 192 METCUT 198
DATABASE SOFTWARE
EASE 208 CSD 212 SUPERCAPES 215
SYSTEM ACCURACY 219
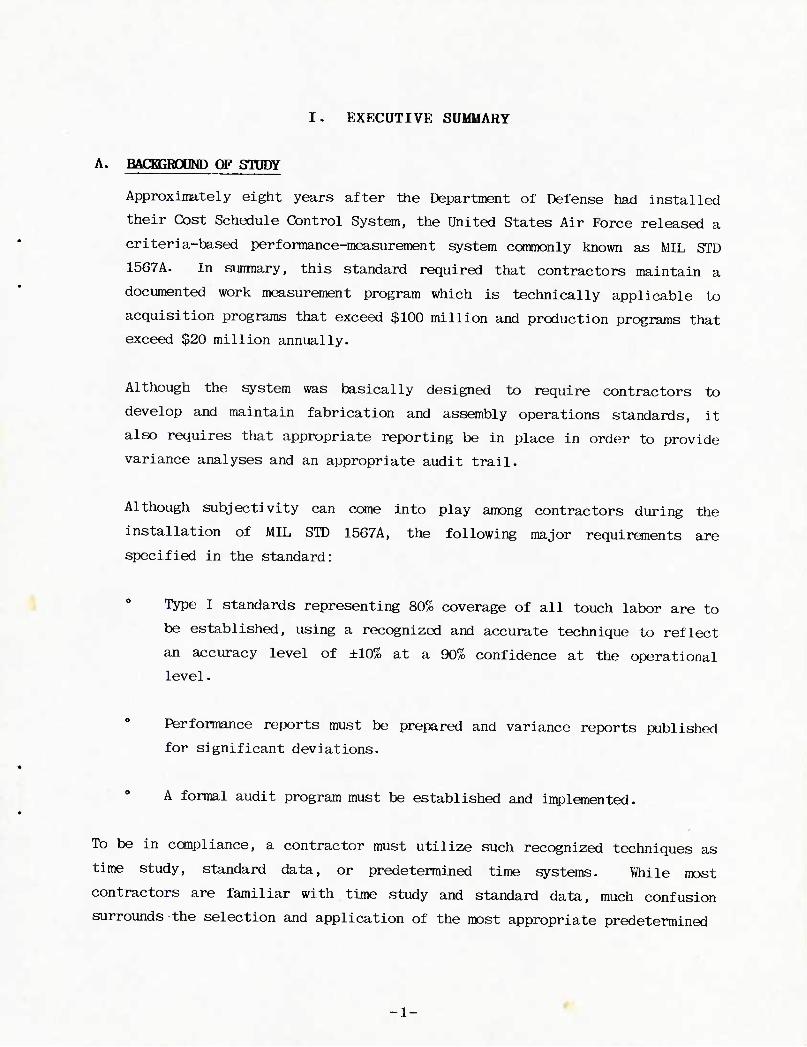
I. EXECUTIVE SUMMARY
A. BACKGROUND OF STUDY
Approximately eight years after the Department of Defense had installed
their Cost Schedule Control System, the United States Air Force released a
criteria-based performance-measurement system commonly known as MIL STD
1567A. In sunmary, this standard required that contractors maintain a
documented work measurement program which is technically applicable to
acquisition programs that exceed $100 million and production programs that
exceed $20 million annually.
Although the system was basically designed to require contractors to
develop and maintain fabrication and assembly operations standards, it
also requires that appropriate reporting be in place in order to provide
variance analyses and an appropriate audit trail.
Although subjectivity can cone into play among contractors during the
installation of MIL STD 1567A, the following major requirements are
specified in the standard:
Type I standards representing 80% coverage of all touch labor are to
be established, using a recognized and accurate technique to reflect
an accuracy level of ±10% at a 90% confidence at the operational
level.
Performance reports must be prepared and variance reports published
for significant deviations.
A formal audit program must be established and implemented.
To be in compliance, a contractor must utilize such recognized techniques as
time study, standard data, or predetermined time systems. While most
contractors are familiar with time study and standard data, much confusion
surrounds the selection and application of the most appropriate predetermined
-1-
time system for their particular environment. This lack of understanding and
limited source documentation has created discrepancies in their approach,
created unnecessary validation of system data, and hindered acceptance,
resulting in unnecessary implementation costs.
With this in mind, the United States Air Force contracted with Arthur Young &
Company to perform an in-depth review of currently available predetermined
time measurement systems and to compile this data into a single reference
document which could be used by defense contractors in constructing and
evaluating work measurement systems in accordance with MIL STD 1567A.
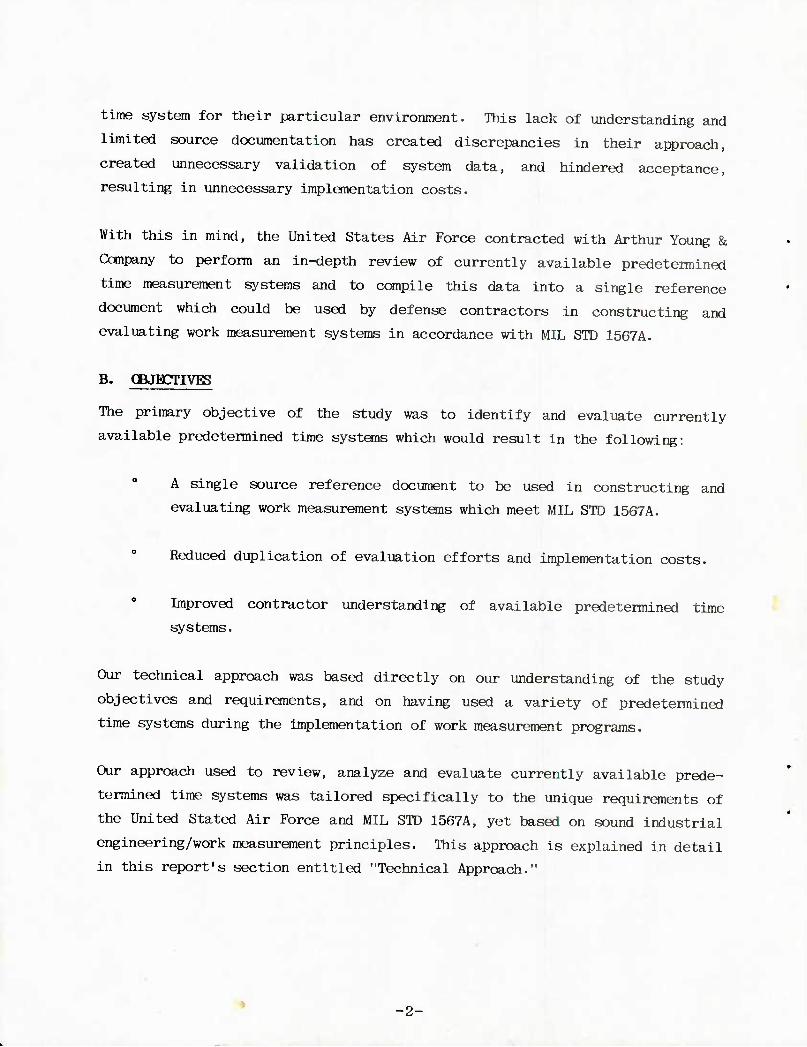
B. CBJBCTIVES
The primary objective of the study was to identify and evaluate currently
available predetermined time systems which would result in the following:
A single source reference document to be used in constructing and
evaluating work measurement systems which meet MIL STD 1567A.
Reduced duplication of evaluation efforts and implementation costs.
Improved contractor understanding of available predetermined time
systems.
Our technical approach was based directly on our understanding of the study
objectives and requirements, and on having used a variety of predetermined
time systems during the implementation of work measurement programs.
Our approach used to review, analyze and evaluate currently available prede-
termined time systems was tailored specifically to the unique requirements of
the United Stated Air Force and MIL STD 1567A, yet based on sound industrial
engineering/work measurement principles. This approach is explained in detail
in this report's section entitled "Technical Approach."
-2-
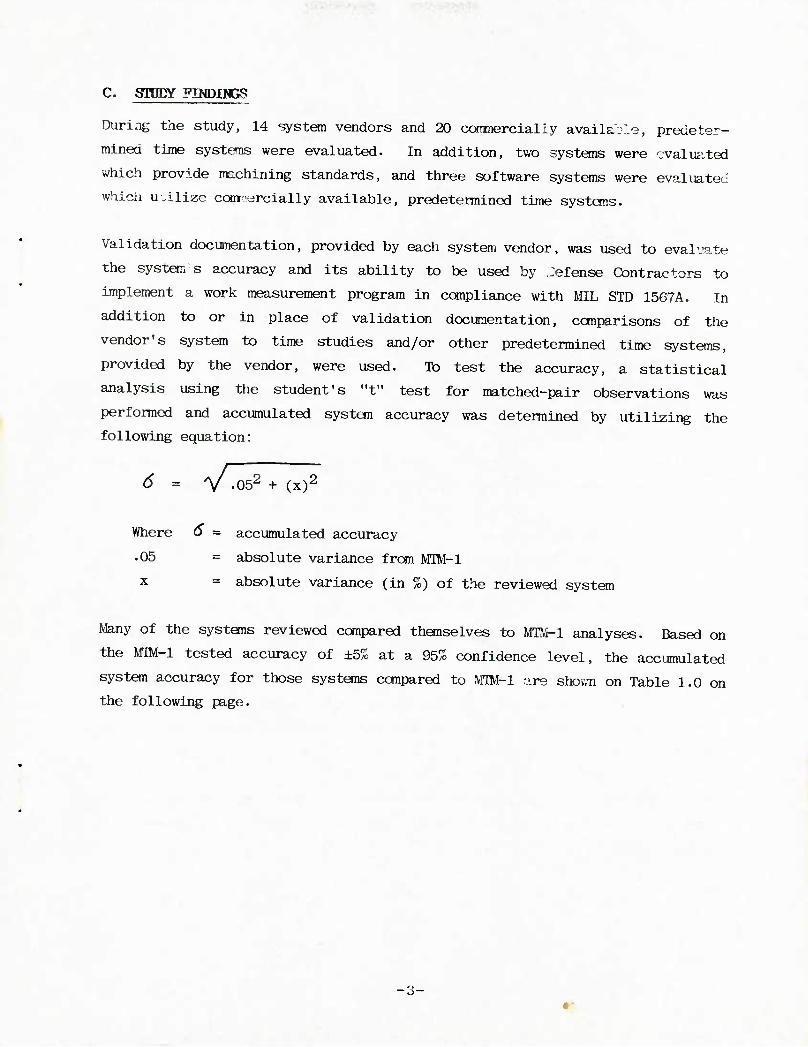
C. STDDY FINDINGS
During the study, 14 system vendors and 20 cornmercially available, predeter-
mined time systems were evaluated. In addition, two systems were evaluated
which provide machining standards, and three software systems were evaluated
which utilize cotir-ercially available, predetermined time systems.
Validation documentation, provided by each system vendor, was used to evalvate
the system s accuracy and its ability to be used by defense Contractors to
implement a work measurement program in compliance with MIL STD 1567A. In
addition to or in place of validation documentation, comparisons of the
vendor's system to time studies and/or other predetermined time systems,
provided by the vendor, were used. To test the accuracy, a statistical
analysis using the student's "t" test for matched-pair observations was
performed and accumulated system accuracy was determined by utilizing the
following equation:
6 = y .os2 + (x)2
Where 0 = accumulated accuracy
•05 = absolute variance from MTM-1
x = absolute variance (in %) of the reviewed system
Many of the systems reviewed compared themselves to MTM-1 analyses. Based on
the MTM-1 tested accuracy of ±5% at a 95% confidence level, the accumulated
system accuracy for those systems compared to MTM-1 are shewn on Table 1.0 on
the following page.
-3-
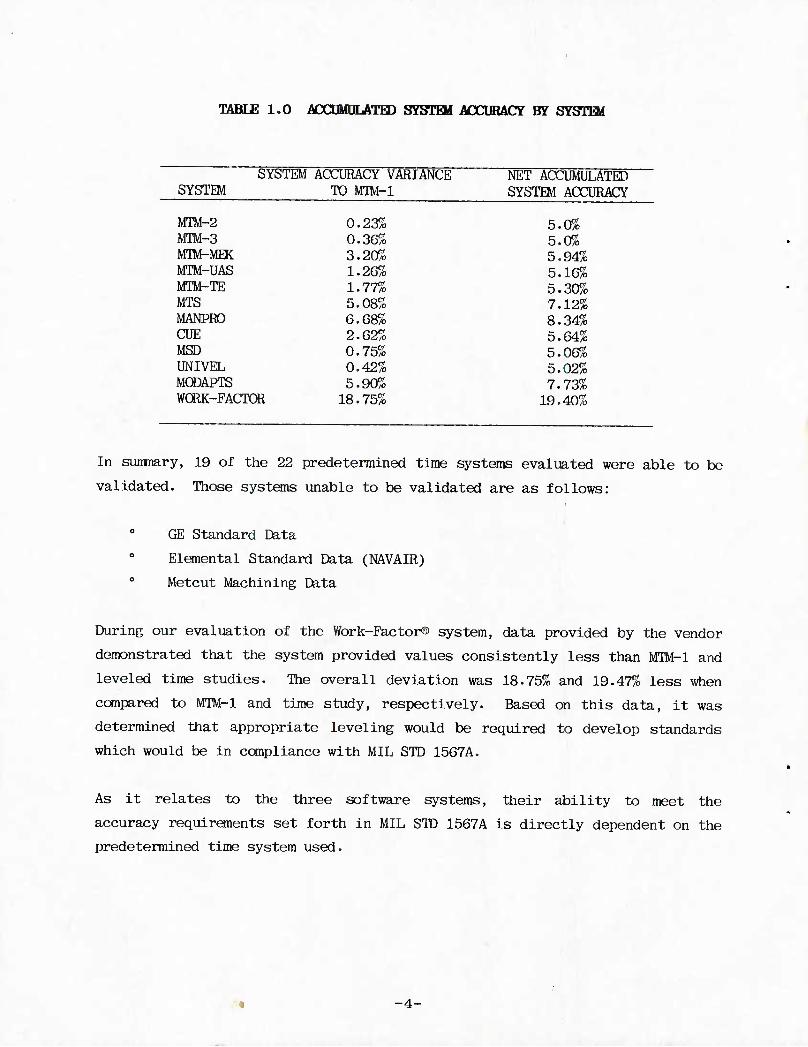
TABE£ 1.0 iSCCDMULATED SYSTEM ACTSJRACY BY SYSTEM
SYSTEM ACCURACY VARIANCE NET ACCUMULATED SYSTEM TO MTM-l SYSTEM ACCURACY
MTM-2 0.23% 5.0% MTM-3 0.36% 5.0% MTW-MEK 3.20% 5.94% MTM-UAS 1.26% 5.16% MTM-TE 1.77% 5.30% MTS 5.08% 7.12% MANPRO 6.68% 8.34% CUE 2.62% 5.64% MSD 0.75% 5.06% UNIVEL 0.42% 5.02% MODAPIS 5.90% 7.73% WORK-FACTOR 18.75% 19.40%
In sunroary, 19 of the 22 predetermined time systems evaluated were able to be
validated. Those systems unable to be validated are as follows:
GE Standard Data
Elemental Standard Data (NAVAIR) 0 Metcut Machining Data
During our evaluation of the Work-Factor© system, data provided by the vendor
demonstrated that the system provided values consistently less than MTM-l and
leveled time studies. The overall deviation was 18.75% and 19.47% less when
compared to MTM-l and time study, respectively. Based on this data, it was
determined that appropriate leveling would be required to develop standards
which would be in compliance with MIL STD 1567A.
As it relates to the three software systems, their ability to meet the
accuracy requirements set forth in MIL STD 1567A is directly dependent on the
predetermined time system used.
-4-
A chart suramrizing each system evaluated was prepared and divided into two
sections. The first section evaluated the systems against criteria outlined
in Paragraph 5.1 of MIL STD 1567A while the second section evaluated the
systems against basic system criteria.
D. OONCUDSIONS AND REOCMMEMDATIONS
Based on this study, it was concluded that a sufficient number of predeter-
mined time systems are available and can be used by Defense Contractors in
implementing a work measurement program which will meet the requirements set
forth in MIL STD 1567A. In addition, based on discussions with system vendors
and system users, it appears that a number of Defense Contractors have
implemented or are in the process of implementing, work measuranent programs
in compliance with MIL STD 1567A. In selected instances, these discussions
revealed that sane Defense Contractors have passed Government audits in
relation to MIL STD 15G7A.
In summry, the following conclusions were realized based on the results of
this study:
Majority of the predetermined time systems evaluated could be used by
Defense Contractors to implement a work measurement program in compliance
with the MIL STD 1567A as identified in Paragraph 5.1.
Accuracy requirements, as stated in Paragraph 5.1 of the MIL STD, place
the ability to meet this requirement on the application of the system and
the final product or Type I standard and not on the system itself.
Accuracy of the Type I standard derived from using one of the systems
verified during the study will directly depend upon the accuracy of the
system applicator.
For those systems in which their theoretical accuracy was unable to be
verified, the potential does exist that, if the system is properly
applied, resulting standards may meet accuracy requirements for Type I
engineered labor standards.
-5-
As the burden of selecting and implementing a work measurement program is
the responsibility of the Defense Contractor, it is believed that this
reference guide will provide a useful resource for identifying and
selecting an appropriate work measurement system.
Based on this study, a number of recommendations were developed as follows:
The United States Air Force should consider performing an evaluation of
applicator accuracy achieved when applying those predetermined time
systems identified in the study during the development of Type I
standards. Consistency in application will be a key factor in developing
standards in compliance with MIL STD 1567A.
The United States Air Force should recommend that Defense Contractors not
only evaluate and select systems based on their projected level of
accuracy, but that they should also consider the following:
System Application Method
System Flexibility
Training and Certification Requirements
System Maintenance and Support
System/Implementation Costs
Implementation Time Requirements
The United States Air Force should consider sponsoring a joint defense-
contractor/system-vendor seminar in which the study team presents the
study findings and Contractors are invited to ask questions and express
concerns relating to MIL STD 1567A.
In sunmary, the results of this study have provided the United States Air
Force with a comprehensive Reference Guide to be provided to Defense
Contractors and to be used as a guide to evaluate and select those systems
which best fit their needs in implementing a work measurement program. Having
been developed to present an overview of each available predetermined time
system, the Reference Guide will provide a useful starting point and tool for
identifying appropriate predetermined time systems.
-6-
II. TECHNICAL APPBOACH
The technical approach used to review, analyze and evaluate currently avail-
able predetermined time systems involved a single phase with seven major
tasks. A detailed outline of the technical approach used is discussed in the
following paragraphs.
I*ase I - Evaluate Predetermined Time Systems and Develop
Reference Guide
During this single phased study, the project team identified, evaluated and
documented in a reference guide, all currently available, predetermined time
systems which were found to meet MIL STD 1567A and whose manufacturers were
willing to provide sufficient validation documentation. The following tasks
illustrate the work completed during this study.
• Task 1 - Identify Ocmnerclally Available Predetermined
Tune Systems
In order to identify currently available predetermined time systems,
the project team performed the following subtasks:
Subtask 1.1 - Literature Survey
During this subtask a computerized literature search was
conducted by accessing an estimated 20 data bases. (See Exhibit
1.0.) As a result of this review, approximately 20 articles
addressing MIL STD 1567A, predetermined time systems, and
evaluation procedures were identified and retrieved.
Subtask 1.2 - Development of Forms
Prior to soliciting system-related data from system vendors, an
introductory letter and survey questionnaire were developed and
sent to each prospective system manufacturer. (See Exhibit
2.0.) The questionnaire dealt with general system-related data
and provided team members with a guide to use during follow-up
phone surveys.
-7-
Subtask 1.3 - Phone Contact Procedures
Approximately three days after having sent the questionnaire to
vendors, project team members initiated phone surveys. During
those phone surveys, 16 vendors were interviewed and 30 prede-
termined time systems were identified for evaluation.
Task 2 - Market Survey Briefing
Having identified and surveyed vendors, a briefing was prepared and
presented to Air Force personnel. During this meeting, the following
data was presented:
Systems identified and general description data. (See Exhibit
3.0.)
Recarmendations as to systems to be further evaluated. (See
Exhibit 4.0.)
Procedures to be used in handling confidential and/or
proprietary system data provided by vendors.
Approach to be used in evaluating and ranking systems.
Tfeisk 3 - Evaluate Systems Identified
Utilizing system data provided by the vendors, a MIL STD 1567A
compliance evaluation for each system was completed. Based on this
evaluation, additional data required was identified for collection
during future tasks. Having completed the evaluation, a final
compliance sunmary was prepared. (See table in System Descriptions
Section.)
"fesk 4 - Evaluate System Validation Documentation
Utilizing the statistical data provided by the vendors, an evaluation
was conducted as to the approach used and the validity of the backup
data provided. The validation process included the use of the
student's "t" test for matched-pair observations, validation of basic
-8-
element structures, and accumulated system accuracy. Based on this
review, it became apparent that the following system validation was
commonplace among the vendors:
Statistical data analyzing the micromotions and/or basic detail
was no longer available; or, if available, not able to be
provided; or would involve extensive in-depth review of motion
films and analyses.
Basic system validation has been based on comparisons to other
predetermined time systems, with the majority comparing
themselves to MTM-1.
During the validation process, two vendor site trips were
conducted, with the following vendors visited:
00 Serge A. Birn (USD) 00 MTM Association (MIM) 00 H. B. Maynard (MOST®) 00 METCUT Research Associates (METCUT) 00 General Analysis, Inc. (CUE) 00 Management Research Frontiers, Inc. (MODAPTS™) 00 Methods Management (MANPRO™) 00 Management Science, Inc. (UNIVEL®)
T^sk 5 - Prepare and Present Draft Report
Having concluded the data collection/validation effort, the project
team utilized the data provided, prepared and presented the draft
final report. This report included the following:
- Executive Summary
Technical Approach
System Accuracy
System Descriptions
-9-
In addition to the draft report, validation data provided by the
vendors was compiled and presented under separate cover.
lvask 6 - Prepare Filial Report
Incorporating review comments by Air Force representatives, a final
report/reference guide was prepared including all carments, and
submitted for final approval.
Task 7 - Prepare and Present Reference Guide
Utilizing the data provided by vendors, general system descriptions
were prepared and sent to each vendor for their review and connments.
Based on their conments, system descriptions were finalized and a
draft Reference Guide was prepared and presented to the Air Force.
In addition to the system descriptions, four additional sections were
included in the draft Reference Guide as follows:
Preface
Work Measurement Overview
MIL STD 1567A Overview
System Accuracy
Incorporating review comments by Air Force representatives, the final
report and reference guide were combined into one report containing
the following sections:
Preface
Executive Sunmary
- Technical Approach
Work Measurement Overview
MIL STD 1567A Overview
- System Descriptions
- System Accuracy
-10-
WCKK MEASUREMENT OVERVIEW
Man's desire to know how long it should take to perform a given task not only
exists today, but has existed since ancient times. As might be expected,
there can be numerous reasons for wanting to identify how long a particular
task and/or job will take to complete. Although one reason may be no more
than to satisfy our curiosity, realistically, work measurement is usually
performed to provide management with an accurate and consistent basis in which
to:
0 Plan work 0 Determine performance 0 Cost products
As might be expected, management is continually faced with making decisions
involving the efficient use of the company's resources, whether it be
manpower, machines or material. Having available accurate times, management
can more effectively plan and budget as well as direct the fabrication and
assembly of parts and components into final product. Work measurement
provides management a more complete and accurate tool to present how work is
being performed. It is through this knowledge that management can make
factual decisions and improvements to its respective manufacturing process.
Work measurement, therefore, is not only a means in which to establish times
for tasks being performed, but a means to benefit managanent, the worker and
ultimately the consumer.
The real value of analyzing work and developing engineered standards is to
provide managanent with the ability to:
Establish rational goals and objectives
Measure/evaluate performance and utilization of resources (i.e.,
manpower, material and machines)
-11-
0 Identify the true source of the problem
0 Justify method/process changes
Although there are many techniques now available, the original concept used in
developing standards was "guessing." Today's version of guessing, although no
more accurate or faster, has become more sophisticated, is known as the
"educated guess," and is supported by:
0 Intuition 0 Personal experience
Inherent ability or inability to make a confident-sounding response
Once work is completed and recorded, data is available to be used in
estimating future work standards. Based on this information, the second
generation of standards development, "historical data," evolved. This
approach accurately told what had taken place, but to be used to accurately
predict what will happen in the future required two important assumptions:
0 Manufacturing conditions, and the products which were the original
basis for the standard, are the best and will not change.
Tasks to be performed in the future will continue to be the same as
those performed when the historical data was developed.
As increasing interest was placed on the development and accuracy of standards
and measurement techniques, the third concept, "time study," evolved. Through
the efforts of many early innovators of measurement techniques, work was
viewed as something which could be controlled and/or engineered. Basically,
there was no known reason why work should be performed in a haphazard manner,
utilizing poor methods. Based on the assumption that workers could be
instructed in the best method to perform specified tasks, it was concluded
that each task should be broken down into basic elements which could then be
arranged to produce a more efficient approach to performing the work. To
accomplish this, a stopwatch was then used to determine actual times for each
of these tasks. To be able to use these times, for other workers performing
-12-
the same or similar tasks, required the analyst to rate the individual's work
pace/skill and adjust the time to meet a level reflecting 100% effort and
skill. Although a widely used technique, time study had three significant
drawbacks:
The analyst must have the skill and experience to accurately rate or
compare the operator to the 100% performance level.
No matter how expensive and/or accurate the stopwatch may be, it
cannot accurately forecast or predict times for future situations.
Its basic capability is in developing times for what has already
occurred.
Considering the variety of tasks being performed, the number of
observations required, and how well the method has been defined, time
study can be a very labor-intensive and costly technique.
Using the time study approach of breaking tasks into basic elements, it became
apparent that the majority of manual operations are combinations of basic
elements. By studying each of these elements, early engineers were able to
determine the most effective work methods, which resulted in reduced motion
content for a given work task. This approach soon became known as motion
study. By combining time study with motion study, the best of both techniques
were realized and "predetermined time systems" (PTS) were created. Each of
the PMTS developed utilizes time/motion-study data to assign times to
individual basic motions. Utilizing these predetermined times and motions,
the measurement process becomes simply a procedure of selecting the best
method or motion sequence to perfonn a given task and assigning the
appropriate pre-established time for each of the motions selected. This
approach provides the engineer with the ability to:
0 Predict future task time requirements.
0 Utilize a stopwatch for minor process times.
-13-
Eliminate the need to rate operator performance. (Most systems have
leveled their times to reflect 100% performance.)
Focus on the v/ork performed and method used.
In addition to the above-mentioned advantages, a predetermined time system
also provides a cost-effective approach to developing, implementing and
maintaining work standards.
Over the past 10 years, computers have played an integral part in enhancing
the flow of information. Realizing the benefits which can be derived from
utilizing computers for data flow and analysis, it was only a matter of time
before industrial engineers began using the computer to develop and maintain
standards. Utilizing the computer's speed, accuracy, and ability to sort, the
"computerized" phase of measurement techniques began to evolve. Having a
computerized system available for developing and maintaining standards allows
the analyst to focus on more productive tasks by:
Eliminating routine work, the majority of paperwork and the use of a
stopwatch.
Allowing changes to shop floor conditions to be easily implemented
and documented.
Allowing standards to be automatically maintained and updated.
Performing analyses two to five times faster than with manual
predetermined systems.
Historically, the major reasons management has been reluctant to develop and
implement engineered standards has been cost, a lack of awareness and
understanding as to systems currently available, and which system best fits
the company's needs. With the development of predetermined and conputerized
systems, the cost of implementing and maintaining a standards program lias been
reduced when compared to previously available techniques. Therefore, the
major obstacle in the decision process is the selection of the most
-14-
appropriate system. In general, during the selection process, the following
guidelines should be followed:
High-level measurement systems should be practiced only by properly
trained individuals. Systems should provide controlled and unified
training.
Since work measurement should be used as a management tool for
identifying potential cost savings, it is essential that the systems
selected be method-sensitive.
Measurement systems used should provide a greater benefit than the
cost of measuring the work; therefore, the system selected should be
cost-effective in its application without affecting its accuracy.
Measurement systems should provide a reliable way for management to
realize the benefits of increased productivity; therefore, the system
selected should provide an accurate data base in which management can
make decisions as it relates to:
- Scheduling
- Product design
- Methods improvement
- Staffing requirements
In surmary, the system best suited for a given manufacturing environment is
the one that meets established goals and provides the required level of
accuracy at a reasonable cost. It is evident that selecting an appropriate
system requires a sufficient amount of review, analysis and coordination.
When this effort has been ignored, the system selected often does not meet the
above criteria, places an undue cost burden to maintain and update, creates
inconsistencies in its data base, and provides management with inaccurate
data.
-15-
It is the consensus of the authors of this final report and reference guide
that it is the intent of MIL STD 1567A (see MIL STD 1567A Overview) to assist
defense contractors in achieving increased discipline in their work
measurement programs, resulting in improved productivity and efficiency. In
addition, it is the objective of the Air Force to assist contractors in
identifying and selecting appropriate measurement systems by providing a
reference guide which presents, in sunmary fashion, currently available
predetermined time systems.
■16-
MIL STD 1567A OVERVIEW
FOREWARD
The purpose of this standard is to assist in achieving increased discipline in
contractors' work measurement programs with the objective of improved
productivity and efficiency in contractor industrial operations. Experience
lias shown that excess manpower and lost time can be identified, reduced, and
continued method improvement made regularly where work measurement programs
have been Implemented and conscientiously pursued.
Active support of the program by all affected levels of management, based on
an appreciation of work measurement and its objectives is vitally important.
Work measurement and the reporting of labor performance is not considered an
end in itself but a means to more effective management. Understanding the
implication inherent in the objectives of the work measurement program will
promote realization of its full value. It is Important that objectives be
presented and clearly demonstrated to all personnel who will be closely
associated with the program.
The following are benefits which can accrue as a result of the employment of a
work measurement program:
(a) Achieving greater output from a given amount of resources.
(b) Obtaining lower unit cost at all levels of production because
production is more efficient.
(c) Reducing the amount of waste in performing operations.
(d) Reducing extra operations and the extra equipment needed to perform
these operations.
(e) Encouraging continued attention to methods and process analysis
because of the necessity for achieving improved performance.
-17-
(f) Improving the budgeting process and providing a basis for price
estimating, including the development of Government Cost Estimates
and should cost analyses.
(g) Acting as a basis for planning for long-term manpower, equipment and
capital requirements.
(h) Improving production control activities and delivery time estimation.
(i) Focusing continual attention on cost reduction and cost control.
(j) Helping in the solution of layout and materials handling problems by
providing accurate figures for planning and utilization of such
equipment.
(k) Providing an objective and measured base from which management and
labor can project piecework requirements, earnings, and performance
incentives.
While recognizing the benefits that may normally be expected from the require-
ment for a work measurement system, it is DOD policy to selectively apply and
tailor standardization documents to to ensure their cost-effective use in the
acquisition process. Each prograjn office should carefully consider, within
DOD and Service guidelines, benefits and costs of imposing MIL STD 1567 on
each specific acquisition. Contractors may propose document application and
tailoring modifications with supporting rationale for such modifications.
The DOD is committed to development and coordination with industry of detailed
application guidance to accompany MIL STD 1567. The purpose of this guidance
is to provide non-contractual information on when and how to use the document,
the source of and flexibility inherent within specific document requirements,
information on what is required to satisfy document requirements, and the
extent of Government review and approval. The guidance is intended to promote
consistency in application and interpretation of MIL STD 1567 requirements.
-18-
Until this guidance can be issued in the form of an "Application Guidance"
appendix to MIL STD 1567, or in a separate Military Handbook, the following
applies:
(a) Use and correct application of appropriate predetermined time systems
can be assumed to satisfy Government requirements for system
accuracy.
(b) The contractor and the Government are encouraged to come to an early
agreement of what constitutes an acceptable system satisfying the
intent of this standard.
(c) Care should be exercised in the use of a work measurement system to
ensure that the overall intent is not lost. Management understanding
and attention to the manufacturing process is necessary for increased
productivity. Work measurement provides one of the tools; however,
misuse could result in reduced work-force motivation and
productivity.
Feedback on the success or difficulties encountered (benefits and costs) in
the application of this standard on specific contracts is encouraged.
Contractor/industry and Government experience should be forwarded to the
following address: Coranander, Air Force Systems Command, Attn: ALX, Comnand
Standardization Office, Andrews AFB DC 20334.
1. Scope
1.1 Rirpose. This standard requires the application of a disciplined work
measurement program as a management tool to improve productivity on those
contracts to which it is applied. It establishes criteria which must be met
by the contractor's work measurement programs and provides guidance for
implementation of these techniques and their use in assuring cost effective
development and production of systems and equipnent.
-19-
1.2 Applicability. This standard is applicable to new/follow-on contracts,
including modifications, as shown in paragraphs 1.2a, 1.2b, 1.2c, 1.2.1 below.
The dollar thresholds indicated are to be based on the current Five-Year
Defense Program (FYDP) budget sutmissions.
a. Full-scale acquisition-program developments which exceed $100
million.
b. Production, which may include some types of depot-level maintenance
repair or overhaul, that exceeds $20 million annually or $100 million
cumulatively. It shall not be applied to contracts or subcontracts
for construction, facilities, off-the-shelf ccmnodities, time and
materials, research, study, or developments vtfiich are not connected
with an acquisition program.
c This standard is not applicable to ship construction, ship system
contracts which have low-volume non-repetitive production runs, or
service-type contracts.
1.2.1 Subcontracting. When this standard is applied to prime development or
production contracts, it shall also be applied to related subcontracts and/or
modifications which exceed $5 million annually or $25 million cumulatively.
If it is determined by the prime contractor that such application is not cost-
effective or is inappropriate for other reasons, the prime contractor may
request the Government to waive the specific application. Requests for
waivers shall be supported with the data used to make the detennination.
1.3 Cbntractual Intent. This standard requires the application of a
documented work measurement system. This standard further requires that the
contractor apply procedures to maintain and audit the work measurement
system. It is not the intent of this standard to prescribe or imply
organization structure, management methodology, or the details of
implementation procedures.
-20-
1.4 Oon-ective Actions. When surveillance by the contractor or the
Government discloses that the work measurement program does not meet the
requirements of this standard, a plan shall be initiated to expeditiously
assure that corrective measures shall be implemented, demonstrated and
documented. The contractor's system is subject to disapproval by the
Government whenever it does not meet the requirements of this standard.
1.5 Documentation. "me work measurement program shall include sufficient
documentation to assure effective operation of the program and to provide for
internal audits as required by paragraph 5.14. Documentation shall specify
organizational responsibilities, state policies, and provide operational
procedures and instructions. The results of contractor system audits and
plans for corrective actions shall be made readily available to the Government
for review.
2. Reference Docunents
Not Applicable
3. Definitions
3.1 Actual Hours. An amount determined on the basis of time incurred as
distinguished from forecasted time. Includes standard time properly adjusted
for applicable variance.
3.2 Earned Hours. The time in standard hours credited to a worker or group
of workers as the result of successfully completing a given task or group of
tasks; usually calculated by sumning the products of applicable standard times
multiplied by the completed work units.
3.3 labor Efficiency. The ratio of earned hours to actual hours spent on the
same increments of work during a reporting period. When earned hours equal
actual hours, the efficiency equals 100%.
3.4 Methods Engineering. The analyses and design of work methods and
systems, including technological selection of operations or processes,
specification of equipment type, and location.
-21-
3-5 Operation Analysis. A study which encompasses all those procedures
concerned with the design or improvement of production, the purpose of the
operation or other operations, inspection requirements, materials used and the
manner of handling material, setup, tool equipment, working conditions, and
methods used.
3.6 Predetermined Time System. An organized body of information, procedures
and techniques employed in the study and evaluation of manual work elements.
The system is expressed in terms of the motions used, their general and
specific nature, the conditions under which they occur, and their previously
detennined performance times.
■
3.7 Realization Factor.
(a) A ratio of total actual labor hours to the standard earned hours.
(b) A factor by which labor standards are multiplied when developing
actual/projected man-hour requirements.
3.8 Subcontract. A contract between the prime contractor and a third party
to produce parts, components, or assemblies in accordance with the prime
contractor's designs, specifications or directions, and applicable only to the
prime contract.
3.9 Touch Labor. Production labor which can be reasonably and consistently
related directly to a unit of work being manufactured, processed or tested.
It involves work affecting the composition, condition or production of a
product; it may also be referred to as "hands-on labor" or "factory labor."
NOTE: As used in this standard, touch labor includes such functions as
machining, welding, fabricating, setup, cleaning, painting, assembling,
functional testing of production articles and that labor required to complete
the manually-controlled process portions of the work cycle.
3.10 Touch Labor Standard. A standard time set on a touch labor operation.
-22-
3.11 Type I Engineered labor Standards. These are standards established
using a recognized technique such as time study, standard data, a recognized
predetermined time system, or a combination thereof to derive at least 90% of
the normal time associated with the labor effort covered by the standard and
meeting specific requirements of paragraph 5.1. Work sampling may be used to
supplement or as a check on other, more definitive techniques.
3.12 Type II labor Standard. All labor standards not meeting the criteria
established in paragraph 5.1.
3.13 Standard Time Data. A compilation of all elements that are used for
performing a given class of work with normal elemental time values for each
element. The data is used as a basis for determining time standards on work
similar to that from which the data were determined.
3.14 Touch labor Normal/Standard Time. Normal time is the time required by a
qualified worker to perform a task at a normal pace to complete an element,
cycle or operation, using a prescribed method. The personal, fatigue, and
unavoidable delay allowance added to this normal time results in the standard
time.
3.15 Operation. (1) A job or task consisting of one or more work elements,
normally done essentially in one location; (2) the lowest-level grouping of
elemental times at which PF&D allowances are applied.
3.16 Element. A subdivision of the operation composed of a sequence of one
or several basic motions and/or machine or process activities, which is
distinct, describable and measurable.
4. General Requirements
4.1 General. Minimum requirements which must be met in the implementation of
an acceptable work measurement program are:
a. An explicit definition of standard time that shall apply throughout
the jurisdiction of work measurement.
•23-
b. A work measurement plan and supporting procedures.
c. A clear designation of the organization and personnel responsible for
the execution of the system.
d. A plan to establish and maintain engineered labor standards to known
accuracy.
e. A plan to conduct methods engineering studies to improve operations
and to upgrade Type II labor standards to Type I Engineered Labor
Standards in accordance with requirements of paragraph 5.4.
f. A defined plan for the use of labor standards as an input to
budgeting, estimating, production planning, and "touch labor"
performance evaluation.
g. A plan to ensure that system data is corrected when labor standards
are revised according to paragraph 5.11 below. ■
5. Specific Requirements
5.1 Type I Bigiiieered labor Standards. All Type 1 standards must reflect an
accuracy of ±10% with a 90% or greater confidence at the operation level. For
short operations, the accuracy requirement may be better met by accumulating
small operations into super operations whose times are approximately one-half
hour. Type I standards must include:
a. Documentation of an operations analysis.
b. A record of standard practice or method followed when the standard
was developed.
c. A record of rating or leveling.
d. A record of the standard time computation including allowances.
-24-
e. A record of observed or predetermined time system time values used in
determining the final standard time.
5.1.1 Predetermined Tiine Systems. It is not the intent of this Military
Standard to challenge the accuracy of those predetermined time systems whose
inherent accuracy meets the requirements of paragraph 5.1. However, when a
predetermined time system is used, it shall be incumbent on the contractor to
demonstrate to the Government that the accuracy of the original data base has
not been compromised in application or standards development.
5.2 (derations Analysis. Operations analysis is considered an integral part
of the development of a Type I Engineered Labor Standard. An operations
analysis shall be accomplished and recorded prior to the determination of a
Type I standard and in the improvement of established labor standards.
5.3 Standard Data. The contractor shall take full advantage of available
standard time data of known accuracy and traceability.
5.4 labor Standards Coverage. The contractor shall develop and implement a
Work Measurement Coverage Plan ^lich provides a time-phased schedule for
achieving 80% coverage of all categories of touch labor hours with Type I
standards. (See 3.9, Touch Labor.)
5.4.1 Cbst Trade-off Analysis. The Work Measurement Coverage Plan shall be
based on cost trade-off analyses which consider the status and effectiveness
of the contractor's existing work measurement program.
5.4.2 Initial Coverage. Type II Standards are acceptable for initial
coverage. All Type II standards shall be approved by the oragnization(s)
responsible for establishing and implementing work measurement standards and
estimating when Type I Standards have not yet been developed.
5.4.3 Upgrading. The Work Measurement Touch Labor Coverage Plan shall
provide a schedule for upgrading Type II to Type I Standards.
5.5 leveling/Performance Rating. All time studies shall be rated by using
recognized techniques.
5.6 Allowances. Allowances for personal, fatigue, and unavoidable delays
shall be developed and included as part of the labor standard. Allowances
should not be excessive or inconsistent with those normally allowed for like
work and conditions.
5.7 Estimating. The contractor's procedures shall describe how touch labor
standards are utilized to develop price proposals.
5.8 Ifee of labor Standards. Labor standards shall be used:
5.8.1 Budgets, Plans, and Schedules. As an input to developing budgets,
plans and schedules, when available.
5.8.2 Touch labor Hours. As a basis for estimating touch labor hours when
issuing changes to contracts and as a basis for estimating the prices of
initial spares, replenishment spares and follow-on production buys, when
available. ■
5.8.3 Measuring Performance. As a basis for measuring touch labor
performance.
5.9 Realization Factor. When labor standards have been modified by
realization factors, major elements which contribute to the total factor shall
be identified. The analysis supporting each element shall be available to the
Government for review.
5.10 labor Efficiency. A forecast of anticipated touch labor efficiency
shall be used in manpower planning, both on a long-range and current
scheduling basis.
5.11 Revisions, Labor standards shall be reviewed for accuracy and
appropriate system data revision shall be made when changes occur to:
■26-
a. Methods or procedures
b. Tools, jigs, and fixtures
c. Workplace and work layout
d. Specified materials
e. Work content of the job
5.12 ProductioD Oount. Work units shall be clearly and discretely defined so
as to cause accurate measurement of the work completed and shall be expressed
in terms of completed:
a. End items
b. Operations
c. Lots or batches of end items
5-12.1 Rartial Credit. In those cases where partial production credit is
appropriate, the work measurement procedures shall define the method to be
used to permit a timely and current production measure.
5.13 labor Performance Beporting. The contractor's work measurement program
shall provide for periodic reporting of labor performance. The report shall
be prepared at least weekly for each work center and shall be sunmarized at
each appropriate management level; it shall indicate labor efficiency and
shall compare current results with pre-established contractor goals.
5.13.1 Variance Analysis. Labor performance reports shall be reviewed by
supervisory and staff support functions. When a significant departure from
projected performance goals occurs, a formal written analysis which addresses
causes and corrective actions shall be prepared.
5.13.2 Report Retention. Performance reports and related variance trend
analyses shall be retained for a six-month period.
5.14 System Audit. The contractor shall use an internal review process to
monitor the work measurement system. This process shall be so designed that
weaknesses or failures of the system are identified and brought to the
attention of management to enable timely corrective action. Written
-27-
procedures shall describe the audit techniques to be used in evaluating system
compliance.
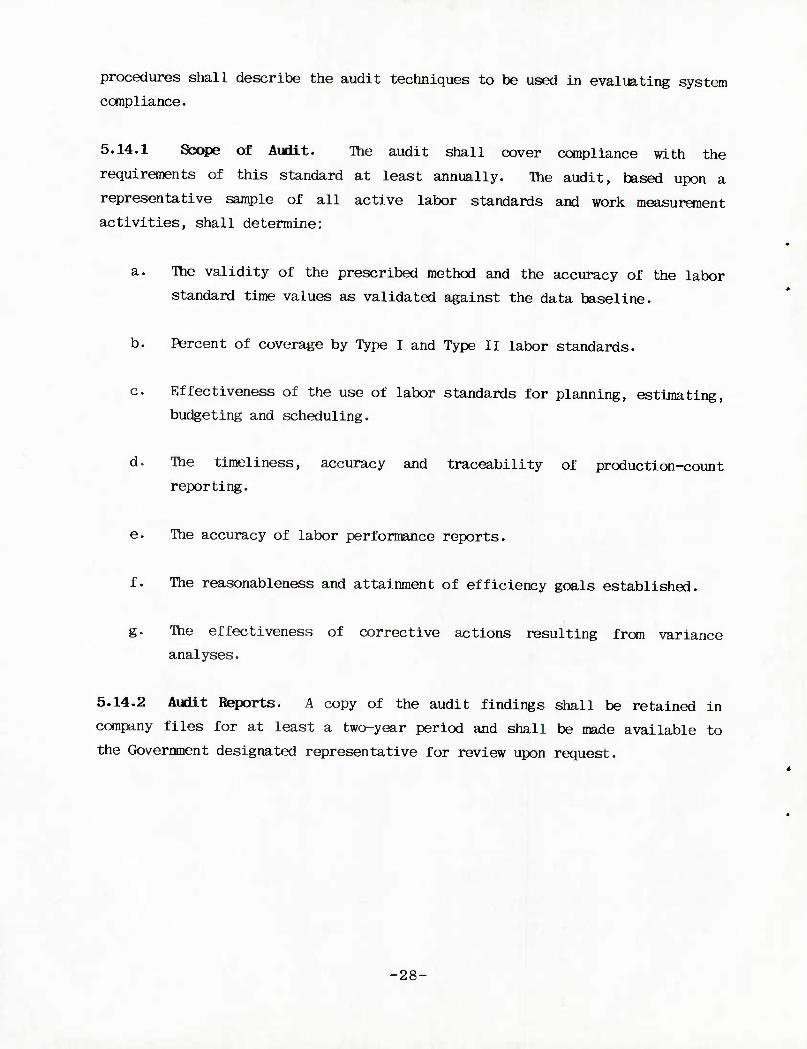
5.14.1 Scope of Audit. The audit shall cover compliance with the
requirements of this standard at least annually. The audit, based upon a
representative sample of all active labor standards and work measurement
activities, shall determine:
a. The validity of the prescribed method and the accuracy of the labor
standard time values as validated against the data baseline.
b. Percent of coverage by Type I and Type II labor standards.
c. Effectiveness of the use of labor standards for planning, estimating,
budgeting and scheduling.
d. The timeliness, accuracy and traceability of production-count
reporting.
e. The accuracy of labor performance reports.
f. The reasonableness and attainment of efficiency goals established.
g. The effectiveness of corrective actions resulting from variance
analyses.
5.14.2 Audit Reports. A copy of the audit findings shall be retained in
company files for at least a two-year period and shall be made available to
the Government designated representative for review upon request.
-28-

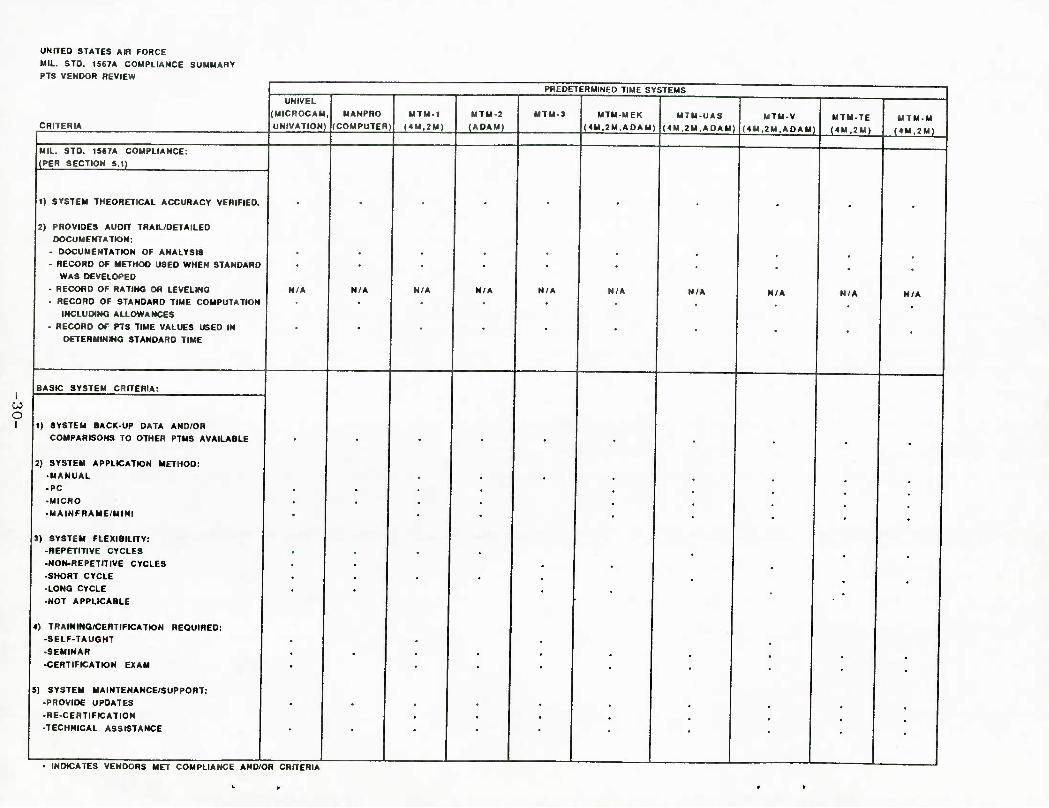
SUMMARY
The charts on the following pages suirmarize each system evaluated and are
divided into two sections. The first section relates to criteria outlined in
Paragraph 5.1 of MIL STD 1567A while the second section relates to basic
system criteria.
■29-
I 00 o
I
UNITED STATES AIR FORCE
MIL. STD. 1SS7A COMPLIANCE SUMMARY PTS VENDOR REVIEW
CRITERIA
MIL. STD. 15S7A COMPLIANCE:
(PER SECTION 5.1)
1) SYSTEM THEORETICAL ACCURACY VERIFIED.
2) PROVIDES AUDIT TRAIL/DETAILED
DOCUMENTATION:
- DOCUMENTATION OF ANALYSIS
- RECORD OF METHOD USED WHEN STANDARD
WAS DEVELOPED
- RECORD OF RATING OR LEVELING
- RECORD OF STANDARD TIME COMPUTATION
INCLUDING ALLOWANCES
- RECORD Of PTS TIME VALUES USED IN
DETERMINING STANDARD TIME
UNIVEL
(MICROCAM,
UNIVATION)
MANPRO
(COMPUTER)
BASIC SYSTEM CRITERIA:
1) SYSTEM BACK-UP DATA AND/OR
COMPARISONS TO OTHER PTMS AVAILABLE
2) SYSTEM APPLICATION METHOD:
-MANUAL
-PC
-MICRO
-MAINFRAME/MINI
I) SYSTEM FLEXIBILITY:
-REPETITIVE CYCLES
-NON-REPETITIVE CYCLES
-SHORT CYCLE
-LONG CYCLE
-NOT APPLICABLE
4) TRAINMQ/CERTIFICATION REQUIRED: -SELF-TAUGHT
-SEMINAR
-CERTIFICATION EXAM
5) SYSTEM MAINTENANCE/SUPPORT:
-PROVIDE UPDATES
-RE-CERTIFICATION
-TECHNICAL ASSISTANCE
N/A
MTM-1
(«M,2M)
MTM-2
(ADAM)
PREDETERMINED TIME SYSTEMS
MTM-3
N/A
MTM-MEK
(4M,2M,ADAM) MTM-UAS
MM,2M,ADAM) MTM-V
(4M,2M,ADAM) MTM-TE
(4M,2M) MTM-M
(4M,2M)
..
N/A
INDICATES VENDORS MET COMPLIANCE AND/OR CRITERIA
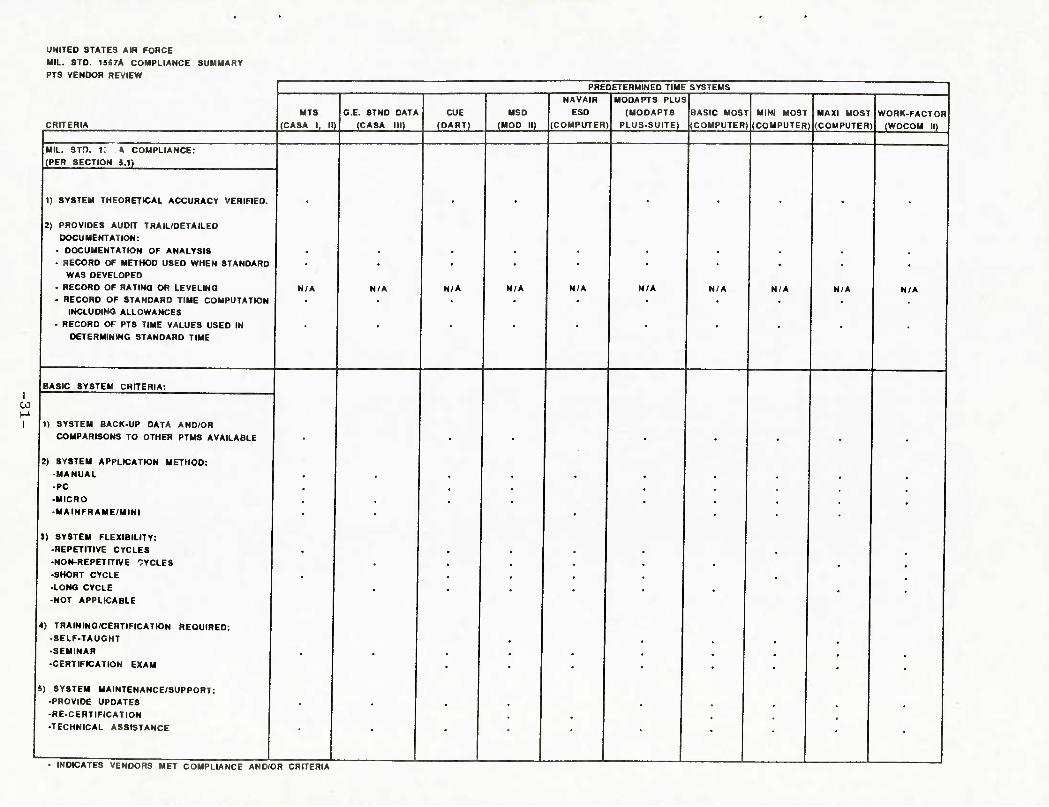
UNITED STATES AW FORCE
MIL. STD. 15S7A COMPLIANCE SUMMARY
PTS VENDOR REVIEW
CRITERIA
PREDETERMINED TIME SYSTEMS
MTS
(CA8A I, II)
G.E. STND DATA
(CASA III)
CUE
(DART)
MSD
(MOD II)
NAVAIR
ESD
(COMPUTER)
MODAPTS PLUS
(MODAPTS
PLUS-SUITE)
BASIC MOST
(COMPUTER)
MINI MOST
(COMPUTER)
MAXI MOST
(COMPUTER) WORK-FACTOR
(WOCOM II)
I CO
MIL. STO. « A COMPLIANCE:
(PER SECTION i.l)
1) SYSTEM THEORETICAL ACCURACY VERIFIED.
2) PROVIDES AUDIT TRAIL/DETAILED
DOCUMENTATION:
- DOCUMENTATION OF ANALYSIS
- RECORD OF METHOD USED WHEN STANDARD
WAS DEVELOPED
• RECORD OF RATING OR LEVELING
- RECORD OF STANDARD TIME COMPUTATION
INCLUDING ALLOWANCES
- RECORD OF PTS TIME VALUES USED IN
D€TERMINING STANDARD TIME
BASIC SYSTEM CRITERIA:
1) SYSTEM BACK-UP DATA AND/OR
COMPARISONS TO OTHER PTMS AVAILABLE
2) SYSTEM APPLICATION METHOD:
-MANUAL
-PC -MICRO
-MAINFRAME/MINI
3) SYSTEM FLEXIBILITY:
-REPETITIVE CYCLES
-NON-REPETITIVE CYCLES
-SHORT CYCLE
•LONG CYCLE
-NOT APPLICABLE
4) TRAINING/CERTIFICATION REQUIRED:
-SELF-TAUGHT
-SEMINAR
-CERTIFICATION EXAM
5) SYSTEM MAINTENANCE/SUPPORT:
PROVIDE UPDATES
RE-CERTIFICATION
TECHNICAL ASSISTANCE
N/A N/A N/A
INDICATES VENDORS MET COMPLIANCE AND/OR CRITERIA
N/A N/A
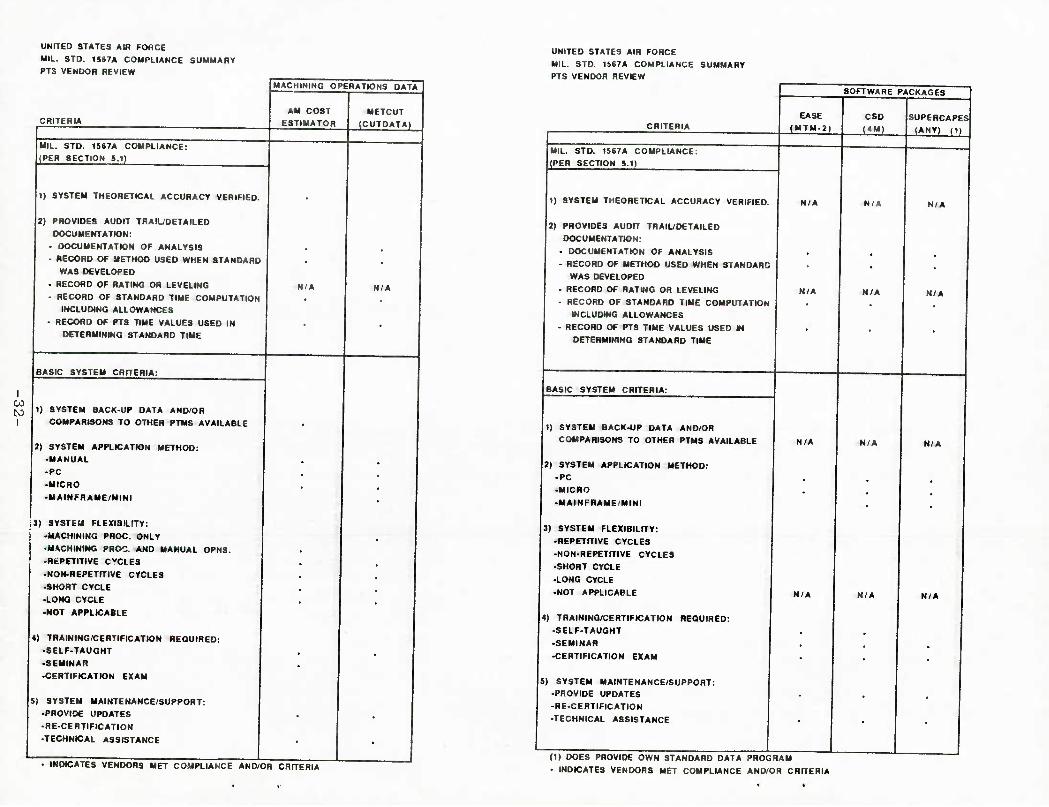
UNITED STATES AIR FORCE
MIL. STO. 1SS7A COMPLIANCE SUMMARY PTS VENDOR REVIEW
CRITERIA
MIL. STO. 1S67A COMPLIANCE: (PER SECTION S.I)
MACHINING OPERATIONS DATA
AM COST
ESTIMATOR
1) SYSTEM THEORETICAL ACCURACY VERIFIED.
2) PROVIDES AUDIT TRAIL/DETAILED
DOCUMENTATION:
• DOCUMENTATION OF ANALYSIS
- RECORD OF METHOD USED WHEN STANDARD
WAS DEVELOPED
• RECORD OF RATING OR LEVELING
- RECORD OF STANDARD TIME COMPUTATION INCLUDING ALLOWANCES
- RECORD OF PTS TIME VALUES USED IN
DETERMINING STANDARD TIME
BASIC SYSTEM CRITERIA:
I CO
to I
1) SYSTEM BACK-UP DATA AND/OR
COMPARISONS TO OTHER PTMS AVAILABLE
2) SYSTEM APPLICATION METHOD:
-MANUAL
-PC
-MICRO
-MAINFRAME/MINI
(1) SYSTEM FLEXIBILITY:
-MACHINING PROC. ONLY
MACHINING PHOO. AND MANUAL OPNS.
-REPETITIVE CYCLES
-NON-REPETITIVE CYCLES
-SHORT CYCLE
-LONG CYCLE
-NOT APPLICABLE
4) TRAINING/CERTIFICATION REQUIRED:
-SELF-TAUGHT
•SEMINAR
•CERTIFICATION EXAM
5) SYSTEM MAINTENANCE/SUPPORT:
■PROVIDE UPDATES
RE-CERTIFICATION
TECHNICAL ASSISTANCE
METCUT
(CUTDATA)
N/A
INDICATES VENDORS MET COMPLIANCE AND/OR CRITERIA
UNITED STATES AIR FORCE
MIL. STD. 1S67A COMPLIANCE SUMMARY PTS VENDOR REVIEW
CRITERIA
MIL. STD. 1567A COMPLIANCE:
(PER SECTION 5.1)
1) SYSTEM THEORETICAL ACCURACY VERIFIED.
2) PROVIDES AUDIT TRAIL/DETAILED
DOCUMENTATION:
■ DOCUMENTATION OF ANALYSIS
• RECORD OF METHOD USED WHEN STANDARD
WAS DEVELOPED
• RECORD OF RATING OR LEVELING
RECORD OF STANDARD TIME COMPUTATION
INCLUDING ALLOWANCES
RECORD OF PTS TIME VALUES USED M
DETERMINING STANDARD TIME
SOFTWARE PACKAGES
EASE
(MTM-2) CSD
<4M)
N/A
BASIC SYSTEM CRITERIA:
N/A
SUPERCAPES
(ANY) (D
N/A
N/A
N/A
1) SYSTEM BACK-UP DATA AND/OR
COMPARISONS TO OTHER PTMS AVAILABLE
2) SYSTEM APPLICATION METHOD:
-PC
-MICRO
•MAINFRAME/MINI
3) SYSTEM FLEXIBILITY:
■REPETITIVE CYCLES
■NON-REPETITIVE CYCLES
-SHORT CYCLE
-LONG CYCLE
-NOT APPLICABLE
4) TRAINING/CERTIFICATION REQUIRED:
-SELF-TAUGHT
-SEMINAR
-CERTIFICATION EXAM
5) SYSTEM MAINTENANCE/SUPPORT: ■PROVIDE UPDATES
RE-CERTIFICATION
TECHNICAL ASSISTANCE
N/A
N/A N/A
(1) DOES PROVIDE OWN STANDARD DATA PROGRAM
• INDICATES VENDORS MET COMPLIANCE AND/OR CRITERIA
OONTACT COMPANY ADDRESS
MOTION TIME SURVEY (MTS)
Gary R. Conte or Daniel T. Keonig General Electric Company,, Corp. Engineering & Manf. 1285 Boston Avenue, Bridgeport, CT 06G01-2385
FHONE: (203) 382-2719
SYSrai HISTORY:
The first attempts to utilize motion study at General Electric were initiated
in 1933-34 with Segur's System, Motion Time Analysis, which applied time
values to movements. Enhancements to this technique were made by adjusting
Segur's times to values which could be maintained by an operator over a full
day. This was done by developing a method which compensated for reduction in
operation time as an operator gained proficiency. In addition, the manual and
the method of recording were abbreviated. This revised version was known as
Modified Motion-Time Analysis. In 1948 a committee was formed to evaluate the
various motion time data systems and Motion Time Survey (MES) was adopted for
use throughout the General Electric Company.
The first computerized version of MTS, Computer Aided Station Analysis I
(GASA I) was developed by General Electric and was first installed in December
1982. As a result of continuous systems development and enhancements, General
Electric upgraded the CASA I software package into a software package that
could be used by plants with medium- to high- volume needs and was compatible
with a larger number of computer hardware systems. Ocmputer Aided Station
Analysis II (CASA II) was introduced in early 1985 and was first installed in
March 1985.
SYSTBI EESCRIPTICW:
Motion Time Survey (MTS) is a manual, predetermined time system in which the
basic movements and motions required to perform most industrial operations
have been combined into five groups designated by Transports, Gets, Places,
Precision, and Miscellaneous. Time values have been developed to represent the
total time required to perform each movement within a group.
-33-
Ocmputer Aided Station Analysis I and II are computer software packages that
use the MTS Data base. Each of these systems have features which make
development and maintenance of work standards easier by requiring less time
than the manual approach. System features are as follows:
CASA I:
Compiled Programs - Faster Response
Improved Functional Operation Capabilities
Enhanced Workplace Layout Graphics
Universal Data Retrieval Capability
Compatible with IBM XT or AT
Hard-disk Data Storage Option
CASA II: 0 Multi-terminal Network - Hard-disk Data Storage 0 "Oracle" Relational Data-base Management System 0 Enhanced Analysis Capabilities - Fast response 0 Universal Data (Plant Data) Generation and Insertion 0 Operational Standard Generation 0 Mass Updating of Universal Data Changes
Potential to Interface and Support "CAPP" (Conputer-Aided Process
Planning) Systons
SYSTEM APHJCATIOW:
MTS can be applied either manually or by computer as follows:
0 MANUAL:
The MTS system utilizes a standard form, the Motion Time Survey Worksheet,
for documenting the methods used to perform work and their appropriate
time values.
Initially the analyst must document the workplace layout where the work is
performed. This includes arrangement of tools, materials, and equipment.
The actual analysis of the operation is documented on the MTS worksheet.
MTS is based upon the principle that, in its simplest form, any operation
-34-
becomes a series of related get-and-place elements. The entire operation
is recorded, listing consecutive elements of work performed by the
operator's left hand and right hand. If visualized, the method must be
verified by actual shop floor observation.
Time values documented on the worksheet are for one hand only as
identified during the analysis of left-hand/right-hand performance. The
longer required time becomes the recorded time. In recording the time
values for each element, the transport is determined first, followed by
the get or the place, the precision, and finally by any applicable miscel-
laneous item.
After the total time for each element has been calculated for the
operation, allowances reflecting experience levels, and other applicable
constraints, are determined and applied in order to arrive at the work
standard for the studied activity.
MTS is best suited for sbort-cycle jobs that are highly repetitive with no
variations.
OOMPUTER:
The methodology of the CASA I and CASA II systems are the same as MTS,
although the application is different. The same information documented on
the Motion Time Survey worksheet is input via computer into the CASA I, II
systems. This is accomplished by using system-defined action codes.
These action codes are in the form of working tables and tell the computer
what additional inputs to expect and are set up to automatically ask for
the required information. The action codes indicate different combina-
tions of movement that are taking place (i.e., GET & PLACE, GET, GET &
DISPOSE, etc.).
As with MTS, the conputerized CASA I and II versions are best suited for
short-cycle, highly repetitive, no method-variation activities.
-35-
The hardware systems on which the CASA I and CASA II software can operate
are as follows:
CASA I - IBM PC/XT or compatible computer (Single-user)
CASA II - DEC/VAX, IBM/VM-CMS, Prime, Honeywell/DPS6 (Multi-user)
1RAINING/TBCHNICAL ASSISTANCE:
The system vendor provides user training and implementation assistance in-
house or at the user's facility. The training approach taken is a combination
of classroom lecture and hands-on system application. MTS requires two weeks
of training, and the CASA I and II systems require two to three weeks of
training and implementation assistance. Additionally, a one-week instructor
workshop is provided to train qualified individuals in the instruction of MTS
and CASA I, II. No certification is required for use of the systems.
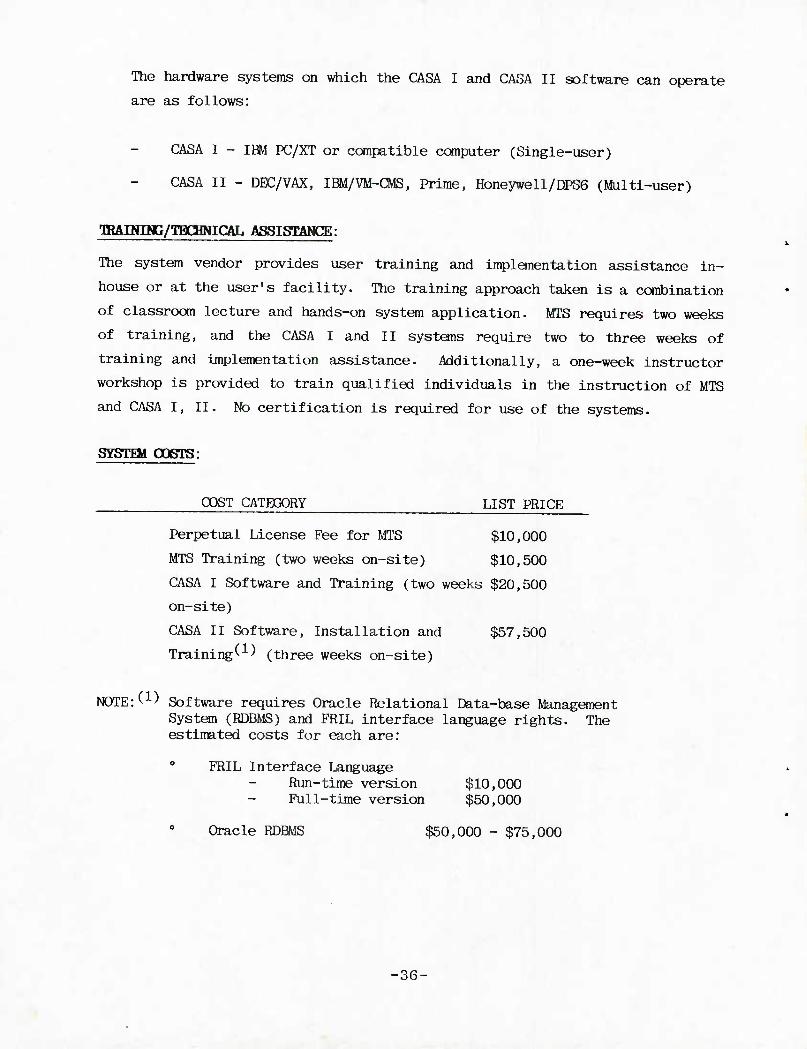
SYSTEM OOCTS:
COST CATEGORY LIST PRICE
Perpetual License Fee for MTS $10,000
MTS Training (two weeks on-site) $10,500
CASA I Software and Training (two weeks $20,500
on-site)
CASA II Software, Installation and $57,500
Training^ (three weeks on-site)
NOTE:(1^ Software requires Oracle Relational Data-base Management System (RDBMS) and FRIL interface language rights. The estimated costs for each are:
0 FRIL Interface Language Run-time version $10,000 Full-time version $50,000
Oracle RDBMS $50,000 - $75,000
-36-
OOMHLIANCE WITH MIL STD 1567A:
The MTS predetermined time system is in compliance with the specific require-
ments set forth in MIL STD 1567A. Based on our review of statistical backup
data provided by the vendor, the system will theoretically generate standards
with an accuracy of at least ±10% at a 90% confidence level. (See System
Accuracy Section). Those specific requirements which have been met are as
follows:
All Type I standards must reflect an accuracy of +10% with a 90% or
greater confidence at the operation level.
0 Documentation of an operations analysis.
A record of standard practice or method followed when the standard
was developed.
0 A record of rating or leveling.
A record of the standard time computation including allowances.
A record of observed or predetermined time system time values used in
determining the final standard time.
Provision of an audit trail down to the elemental standard time
level.
STRENGTHS AND WEAKNESSES:
Strengths and weaknesses and/or constraints identified are based on
discussions with users of the MIS predetermined time system. The caiments
listed below are based on these discussions and, while a broad range of
industries were sampled, carments should not be considered universal and
therefore may not be applicable to all manufacturing environments:
0 Easy to apply.
-37-
Computerized application provides improved speed, accuracy and
consistency of application, and enables the user to more easily
modify standards, perform mass updates, and develop and analyze
"what-if" method-improvement scenarios.
Generates good documentation of the work sequence or process being
analyzed.
System is well-accepted by direct labor personnel.
The computer application can allow for direct input of operation
descriptions, based on observation of the operation, without having
to document the operations and then input into the system.
Two computerized versions are available, each having its own
capabilities and features, thus providing a user the ability to
evaluate each based upon his particular needs.
The system was developed by utilizing the system vendor's accepted
terminology and may require interpretation by users outside of the
company.
The system is best suited for short-cycle, highly repetitive, no
method-variation activities.
SYSTEM USEBS:
General Electric has not actively marketed its systems outside of its company;
however, those companies which were previously held by GE retained and are
applying MTS, CASA I and CASA II. Specific areas in which the systems are
currently being used, and the number of users in each area, are as follows:
-38-
Electronics Assembly - 10
Electrical/Mechanical - 32
Consumer - 32
Materials - 4
External - 3
REFERENCE SOURCE:
General Electric Company
-39-
OONTEACT COMPANY ADDRESS PHONE:
G.E. STANDARD DATA
Gary R. Conte and Daniel T. Koenig General Electric Company, Corp. Engineering & Manufacturing 1285 Boston Avenue, Bridgeport, CT 06601 (203) 382-2719
SYSTEM HISTCRY:
G.E. Standard Data was developed by General Electric at the company's facility
in Schenectady, New York, in 1903. The system's first application was in the
same facility in 1965.
Ocmputer Aided Station Analysis III (C&SA III) was developed by General
Electric in 1985. The system's first application was in June of 1985 at G.
E.'s Space Systems, in Valley Forge, Pennsylvania.
The Oanputer Aided Methods Analysis (CASA/CAMA) integrated system is the
latest development in support of General Electric's desire to integrate
management's manufacturing decision-making activities.
SYsrrai DESCRIPTIOW:
G.E. Standard Data is a manual predetermined time system which is based on
Motion Time Survey (MTS) analyses of:
Body Movements
- clean - file - equipment preparation - maintenance
Hand Manipulations
Layout and Mark
Mental Progress
PDsition and Align
Secure and Loosen
Tool Handling
Measure and Gage
Time studies were used to determine times for using cranes, journal jacks,
etc. G.E. Standard Data is conprised of 90 Standard Data Codes.
-40-
The Motion Time Survey elements used to develop the G.E. Standard Data are
available in the manual, "Element Analysis for G.E. Standard Data", in which
backup for all the standard data is provided.
CASA III is a computer software package that uses the G.E. Standard Data
Base. CASA III was developed as an enhancement to the CASA II system and
retains the prime features. The system utilizes the "ORACLE" Relational Data
Base Management System and provides for four Variable Data Inputs, including
use of G.E. Standard Data Tables, Plant Level Generated Tables and Formulas.
CASA III also generates Universal and Operational Level Standards with mass
updating capability. The CASA III system was developed to meet the needs of a
large plant with low volume production.
CASA/CAMA is an integrated engineered time standards and process planning
system using relational data base computer software. It is a mechanism for
integrating engineered time standards and process planning into one computer-
generated system. It provides for the integration of methods description,
application of incremental standards, and the resulting generation of a
process plan. CAMA can be fully integrated with the CASA II and CASA III
systems and provide source data for Conputer Integrated Manufacturing (CIM).
SYSTEM APPLICATION:
G.E. Standard Data
Uses a technique called "Coded Variables Technique" in the application of
the system. This technique was developed to reduce the amount of time
required to build application tables using standard data. The features of
this technique are: 1) selection of elements of a standard is made from a
small code book; 2) the necessary information to specify the elements of
a standard are recorded in a definite pattern on an analysis form; 3)
analysis form is designed so that associated connecting links (such as
miscellaneous body moves, transports, and walking standards) can be
recorded on the same line with the standard used to record the main
activity; and 4) the lookup and extending of time values may be done by a
clerk thus allowing the analyst to devote more time and effort to job
analysis.
-41-
When using the coded variables technique for analyzing manual operations,
the analysis is recorded on a preprinted analysis sheet. The analyst
indicates on this sheet each standard that is used and the variables that
determine the time to be allowed. After the analysis has been canpleted,
the time values must be looked up in the coded variables tables and re-
corded on the analysis sheet. If the analysis was performed using the
visualization process, it must be verified by actual shop floor observa-
tion. G.E. Standard Data is best suited for long cycle, low repetition
types of work.
Casa III System
In developing standards with the CASA III computer system, the analyst
must perform the same job analysis activities as described for the manual
application of G.E. Standard Data. The standards are developed on the
computer screen by first inputting the "Header Information" which includes
a standard number, definitions of move distances or transports for the
work place, and description and location of objects in the work place.
Next the elemental data relating to the activity is input by entering the
appropriate action codes and variables. The CASA III system will automa-
tically translate the codes and variables into verbage describing the
activity. This verbage can be edited to give a more detailed activity
description without altering the underlying action codes or variables.
Each element of the standard development is entered in this manner until
the entire activity has been input. The CASA III system automatically
calculates the elemental time values and totals them for the standard.
Any additional information needed to complete the standard, such as setup
times, machine run times, allowances, prorates, etc., may be input.
The work environment best suited for using CASA III is long cycle, low
repetition types of work. Typical operations that may be analyzed by any
of the CASA systems are:
Conveyor Assemblies 0 Spot Welding "> Bench Assemblies
Machine Tapping 0 Punch Press 0 Riveting Machines
Drill Press 0 Hand Taping Operations
Milling Machine 0 Manual Portions of Autonatic Machine Cycles
-42-
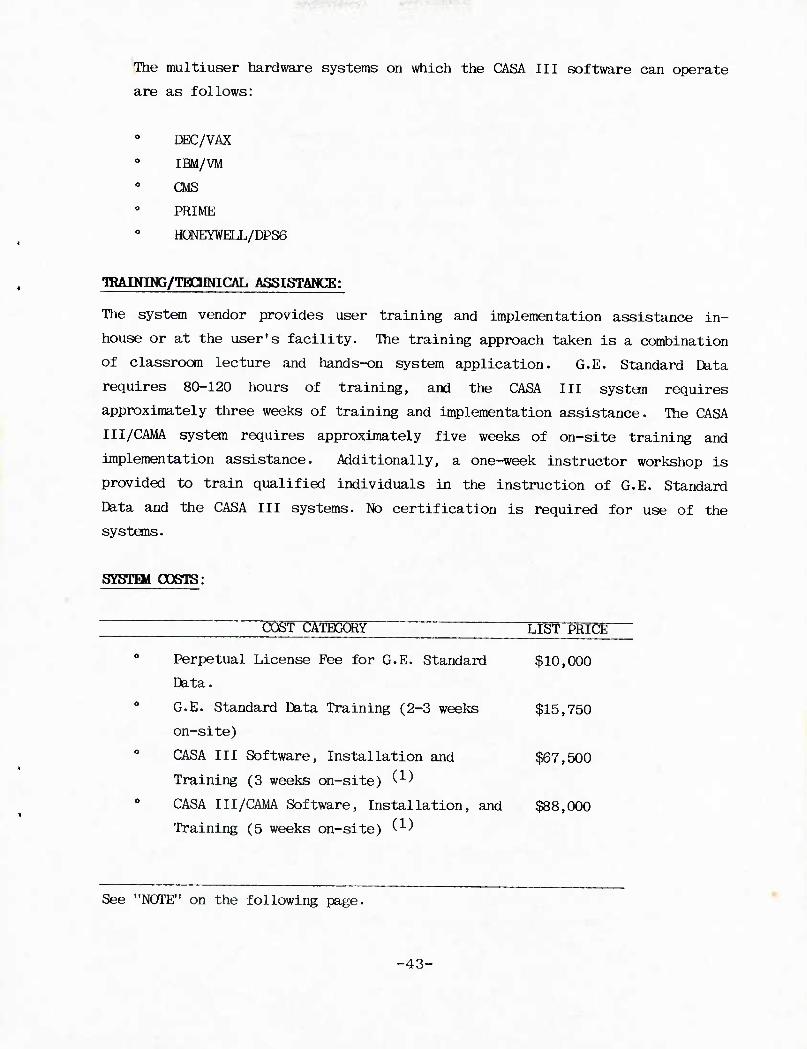
The multiuser hardware systems on which the CASA III software can operate
are as follows:
DEC/VAX
IBM/VM
CMS
PRIME
HONEYWELL/DPS6
TRAINING/TECHNICAL ASSISTANCE:
The system vendor provides user training and implementation assistance in-
house or at the user's facility. The training approach taken is a combination
of classroom lecture and hands-on system application. G.E. Standard Data
requires 80-120 hours of training, and the CASA III system requires
approximately three weeks of training and implementation assistance. The CASA
III/CAMA system requires approximately five weeks of on-site training and
implementation assistance. Additionally, a one-week instructor workshop is
provided to train qualified individuals in the instruction of G.E. Standard
Data and the CASA III systems. No certification is required for use of the
systems.
SYSTEM COSTS:
00ST CATBGGRY LIST PRICE
Perpetual License Fee for G.E. Standard $10,000
Data.
G.E. Standard Data Training (2-3 weeks $15,750
on-site)
CASA III Software, Installation and $67,500
Training (3 weeks on-site) (•'■'
CASA III/CAMA Software, Installation, and $88,000
Training (5 weeks on-site) '*■'
See "NOTE" on the following page.
■43-
NOTE: t1) Sol'tware requires Oracle Relational Data Base
Management System (RDBMS), and FRIL Interface
Language Rights. The estimated costs for each are:
0 Oracle RDBMS - $50,000 - $75,000 0 FRIL Interface Language:
Run-time version - $10,000
Full-time version - $50,000
OQMPLIANCE WITH MIL STD 1567A:
The G.E. Standard Data system utilizes the time elements developed by the GE-
MTS predetermined time system. The accuracy level of this system is directly
related to the potential accumulated percent error which could not be deter-
mined, as the necessary statistical data could not be provided. Those basic
requirements, as specified in the MIL STD, which are in question, are as
follows:
All Type I standards must reflect an accuracy of ±10% with a 90% or
greater confidence at the operation level.
Those requirements which the system does meet are as follows:
0 Documentation of an operations analysis.
A record of standard practice or method followed when the standard
was developed.
0 A record of rating or leveling.
A record of the standard time computation including allowances.
A record of observed or predetermined time system time values used in
determining the final standard time.
-44-
. ■ v ■ . ■
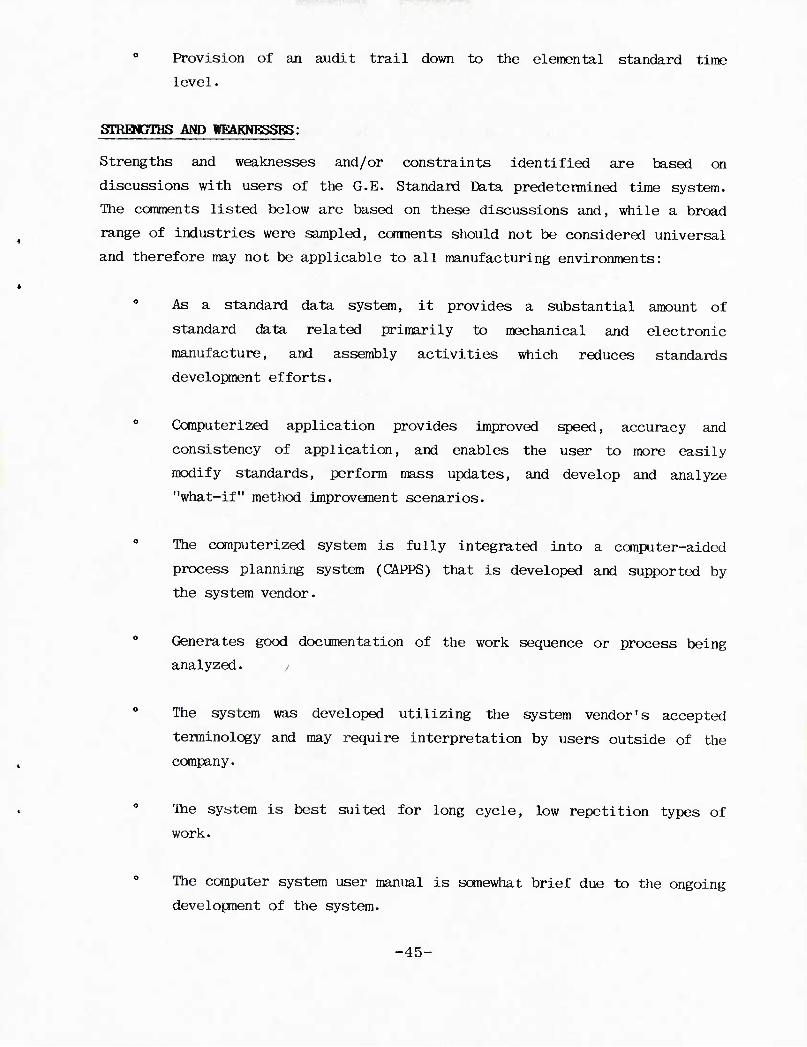
Provision of an audit trail down to the elemental standard time
level.
STRENGTHS AND WEAKNESSES:
Strengths and weaknesses and/or constraints identified are based on
discussions with users of the G.E. Standard Data predetermined time system.
The comments listed below are based on these discussions and, while a broad
range of industries were sampled, comments should not be considered universal
and therefore may not be applicable to all manufacturing environments:
As a standard data system, it provides a substantial amount of
standard data related primarily to mechanical and electronic
manufacture, and assembly activities which reduces standards
development efforts.
0 Conputerized application provides improved speed, accuracy and
consistency of application, and enables the user to more easily
modify standards, perform mass updates, and develop and analyze
"what-if" method improvement scenarios.
The computerized system is fully integrated into a computer-aided
process planning system (CAPPS) that is developed and supported by
the system vendor.
Generates good documentation of the work sequence or process being
analyzed. /
The system was developed utilizing the system vendor's accepted
tenninology and may require interpretation by users outside of the
company.
The system is best suited for long cycle, low repetition types of
work.
The computer system user manual is somewhat brief due to the ongoing
development of the system.
-45-
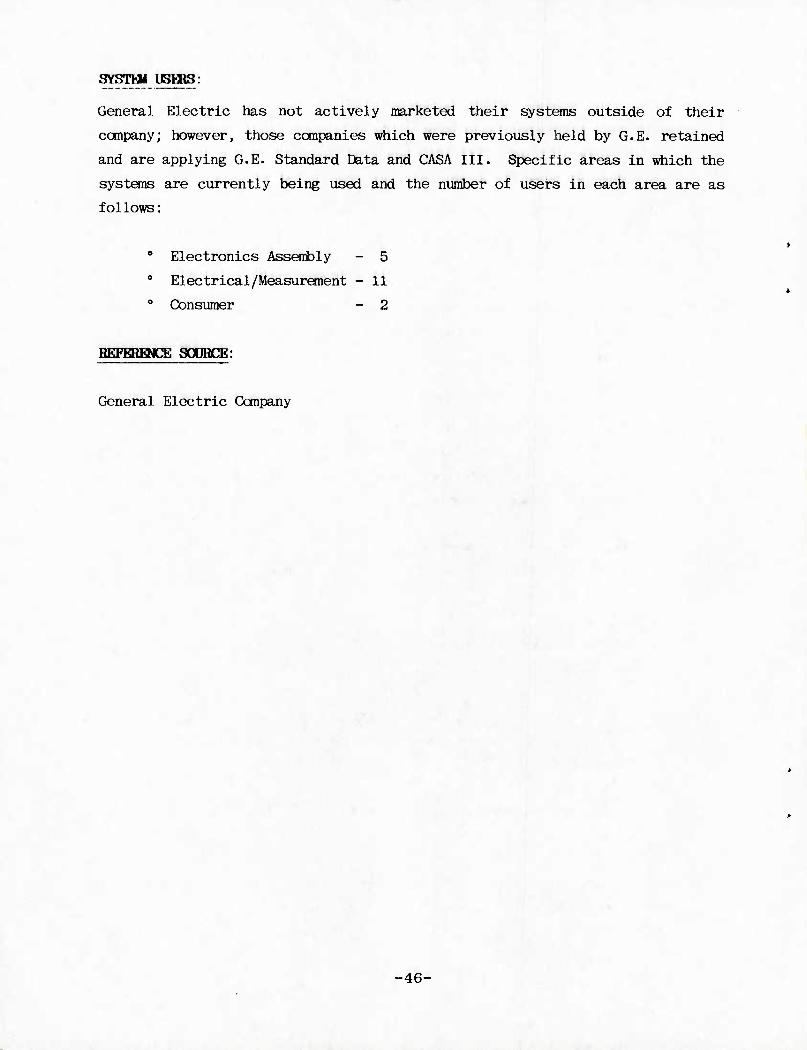
SYSTHI USERS:
General Electric has not actively marketed their systems outside of their
company; however, those companies which were previously held by G.E. retained
and are applying G.E. Standard Data and CASA III. Specific areas in which the
systems are currently being used and the number of users in each area are as
follows:
0 Electronics Assentoly - 5 0 Electrical/Measurement - 11 0 Consumer - 2
REFERENCE SOURCE:
General Electric Company
-46-
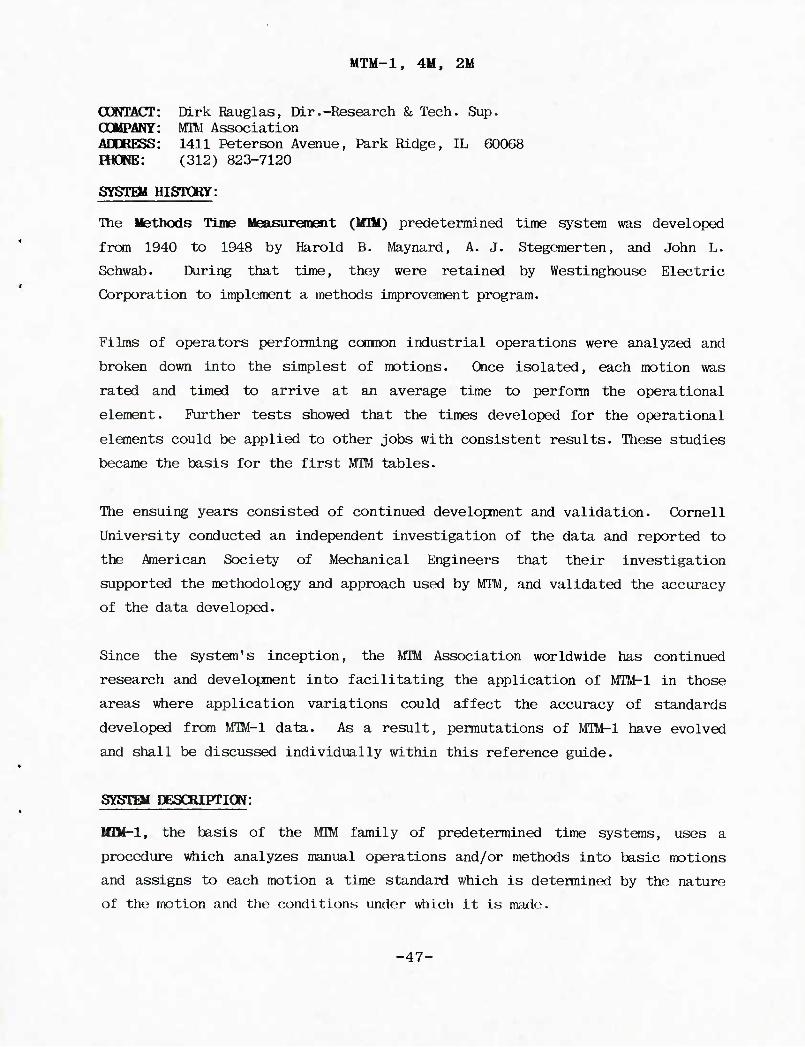
OONTACT COMPANY ADDRESS
MTM-1, 4M, 2M
Dirk Rauglas, Dir.-Research & Tech. Sup. MTM Association 1411 Peterson Avenue, Park Ridge, IL 60068
FHOME: (312) 823-7120
SYSTQi HISTPORY:
The Methods Time Measurement (IQM) predetermined time system was developed
from 1940 to 1948 by Harold B. Maynard, A. J. Stegemerten, and John L.
Schwab. During that time, they were retained by Westinghouse Electric
Corporation to implement a methods improvement program.
Films of operators performing conmon industrial operations were analyzed and
broken down into the simplest of motions. Once isolated, each motion was
rated and timed to arrive at an average time to perform the operational
element. Further tests showed that the times developed for the operational
elements could be applied to other jobs with consistent results. These studies
became the basis for the first MTM tables.
The ensuing years consisted of continued development and validation. Cornell
University conducted an independent investigation of the data and reported to
the American Society of Mechanical Engineers that their investigation
supported the methodology and approach used by MTM, and validated the accuracy
of the data developed.
Since the system's inception, the MTM Association worldwide has continued
research and development into facilitating the application of MTM-1 in those
areas where application variations could affect the accuracy of standards
developed from MTM-l data. As a result, permutations of MTM-1 have evolved
and shall be discussed individually within this reference guide.
SYSTEM EESCRIPTIOW:
MEM-1, the basis of the MTM family of predetermined time systems, uses a
procedure which analyzes manual operations and/or methods into basic motions
and assigns to each motion a time standard which is determined by the nature
of the motion and the conditions under which it is made;.
-47-
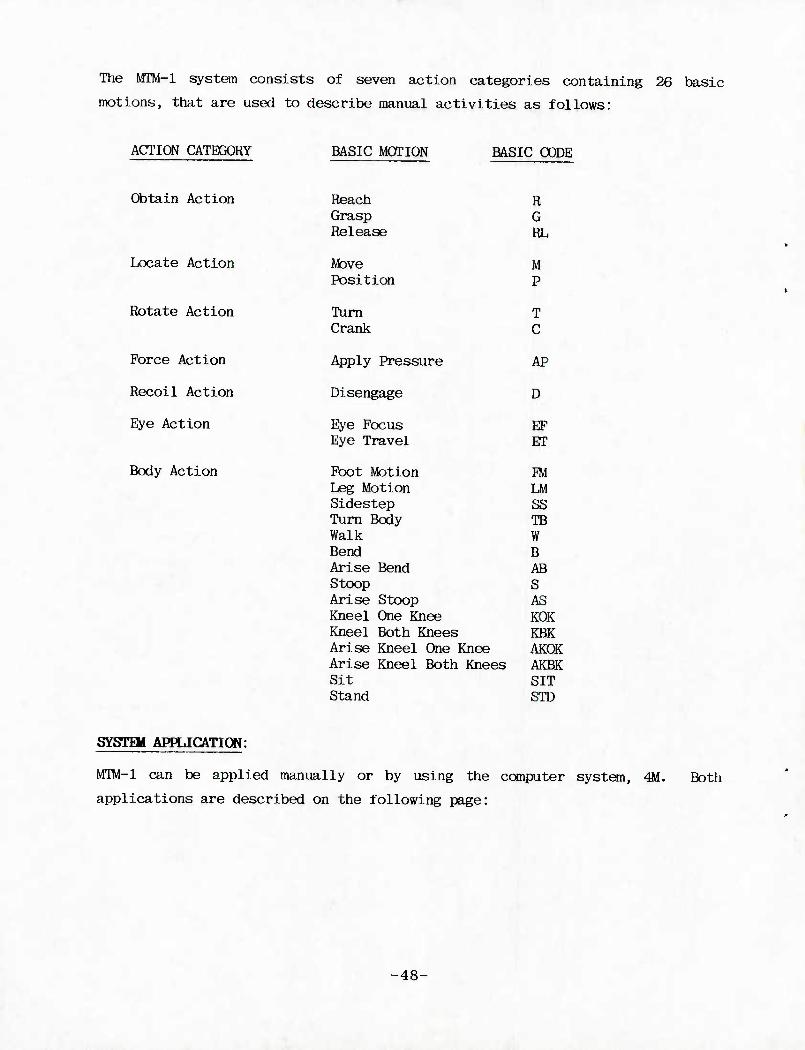
The MTM-1 system consists of seven action categories containing 26 basic
motions, that are used to describe manual activities as follows:
ACTION CATEGORY BASIC MOTION BASIC CODE
Obtain Action Reach R Grasp G Release RL
Locate Action Move M Position P
Rotate Action Turn T Crank C
Force Action Apply Pressure AP
Recoil Action Disengage D
Eye Action Eye Focus EF Eye Travel ETT
Body Action Foot Motion FM Leg Motion LM Sidestep SS Turn Body TB Walk W Bend B Arise Bend AB Stoop S Arise Stoop AS Kneel One Knee KOK Kneel Both Knees KBK Arise Kneel One Knee AKOK Arise Kneel Both Knees AKBK Sit SIT Stand STD
SYSTEM APPLICATION:
MTO-l can be applied manually or by using the computer system, 4M.
applications are described on the following page:
Both
-48-
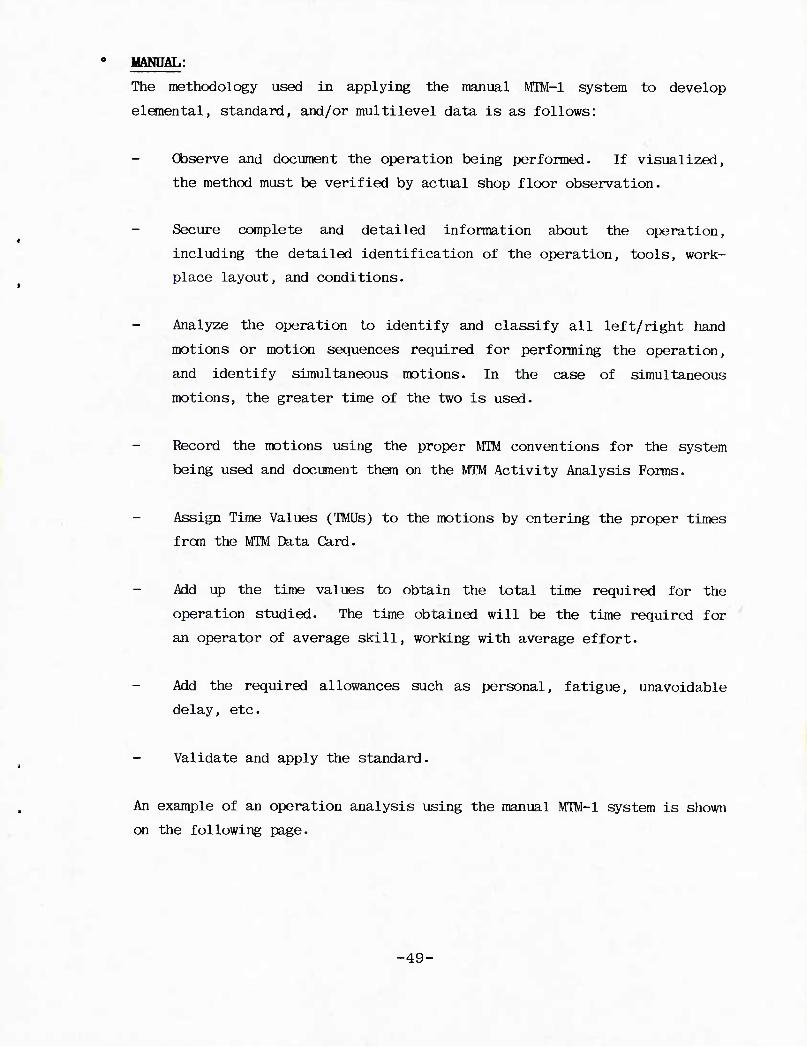
MANDAL:
The methodology used in applying the manual MTM-1 system to develop
elemental, standard, and/or multilevel data is as follows:
Observe and document the operation being performed. If visualized,
the method must be verified by actual shop floor observation.
Secure complete and detailed information about the operation,
including the detailed identification of the operation, tools, work-
place layout, and conditions.
Analyze the operation to identify and classify all left/right hand
motions or motion sequences required for performing the operation,
and identify simultaneous motions. In the case of simultaneous
motions, the greater time of the two is used.
Record the motions using the proper MTM conventions for the system
being used and document than on the MTM Activity Analysis Forms.
Assign Time Values (TMUs) to the motions by entering the proper times
from the MTM Data Card.
Add up the time values to obtain the total time required for the
operation studied. The time obtained will be the time required for
an operator of average skill, working with average effort.
Add the required allowances such as personal, fatigue, unavoidable
delay, etc•
Validate and apply the standard.
An example of an operation analysis using the manual MTM-1 system is shown
on the following page.
-49-
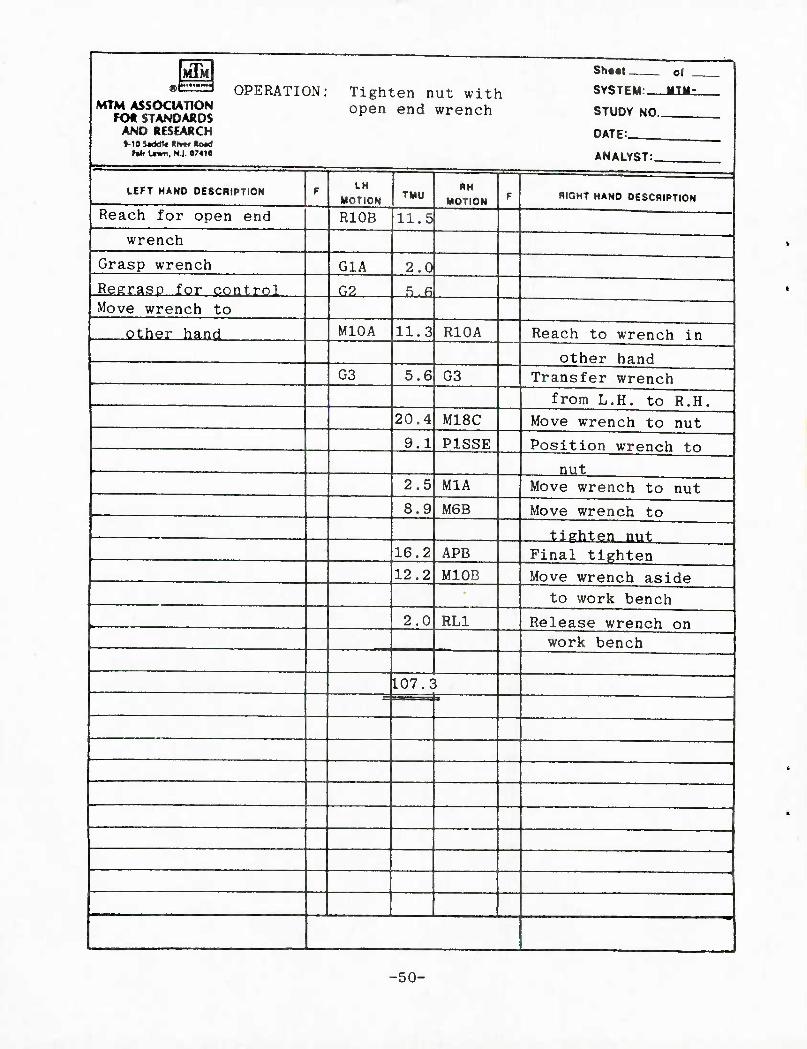
■ MTM Sh««{ o( i
MMMMW r>mrD A fprriKT . mj i-^ ^ . . , CVCTCU. UTU.
MTM ASSOCIATION WJTI^t\rtI J.UII . ij-gnten nut witn
open end wrench STUDY NO. AND RESEARCH DATE: «-10 S«dd1« *lm Ro*d
Hk Uwn. N.|. 07410 ANALYST:
LEFT HAND DESCRIPTION r LH MOTION TMU
RH MOTION F RIGHT HAND DESCRIPTION
Reach for open end R10B 11.5
wrench ""*
Grasp wrench G1A 2.0
Resra§p for control 02 S.fi ■
Move wrench to other hand M10A 11.3 R10A Reach to wrench in
other hand 03 5.6 03 Transfer wrench
from L.H. to R.H. 20.4 M18C Move wrench to nut 9.1 P1SSE Position wrench to
nut 2.5 MIA Move wrench to nut 8.9 MOB Move wrench to
tighten niit 16.2 APE Final tighten 12.2 M10B Move wrench aside
to work bench 2.0 RL1 Release wrench on
work bench
107.: 1 i
-50-
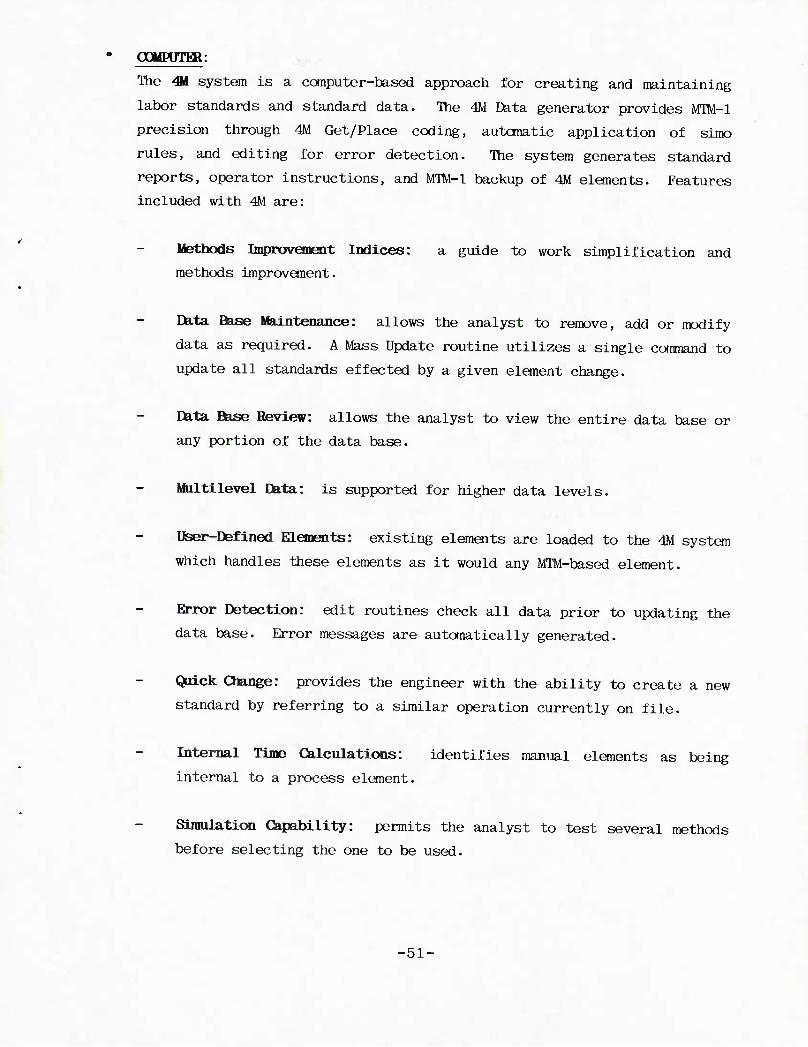
OOMTOTEa:
The 4U system is a computer-based approach for creating and maintaining
labor standards and standard data. The 4M Data generator provides MTM-1
precision through 4M Get/Place coding, autcmatic application of sirno
rules, and editing for error detection. The system generates standard
reports, operator instructions, and MTM-1 backup of 4M elements. Features
included with 4M are:
Methods Improvement Indices: a guide to work simplification and
methods improvement.
Data Base Maintenance: allows the analyst to remove, add or modify
data as required. A Mass Update routine utilizes a single command to
update all standards effected by a given element change.
Eb.ta Base Review: allows the analyst to view the entire data base or
any portion of the data base.
Multilevel Data: is supported for higher data levels.
Dser-Defined Elements: existing elements are loaded to the 4M system
which handles these elements as it would any MTM-based element.
Error Detection: edit routines check all data prior to updating the
data base. Error messages are automatically generated.
C^iick Change: provides the engineer with the ability to create a new
standard by referring to a similar operation currently on file.
Internal Time Calculations: identifies manual elements as being
internal to a process element.
Simulation Capability: permits the analyst to test several methods
before selecting the one to be used.
-51-
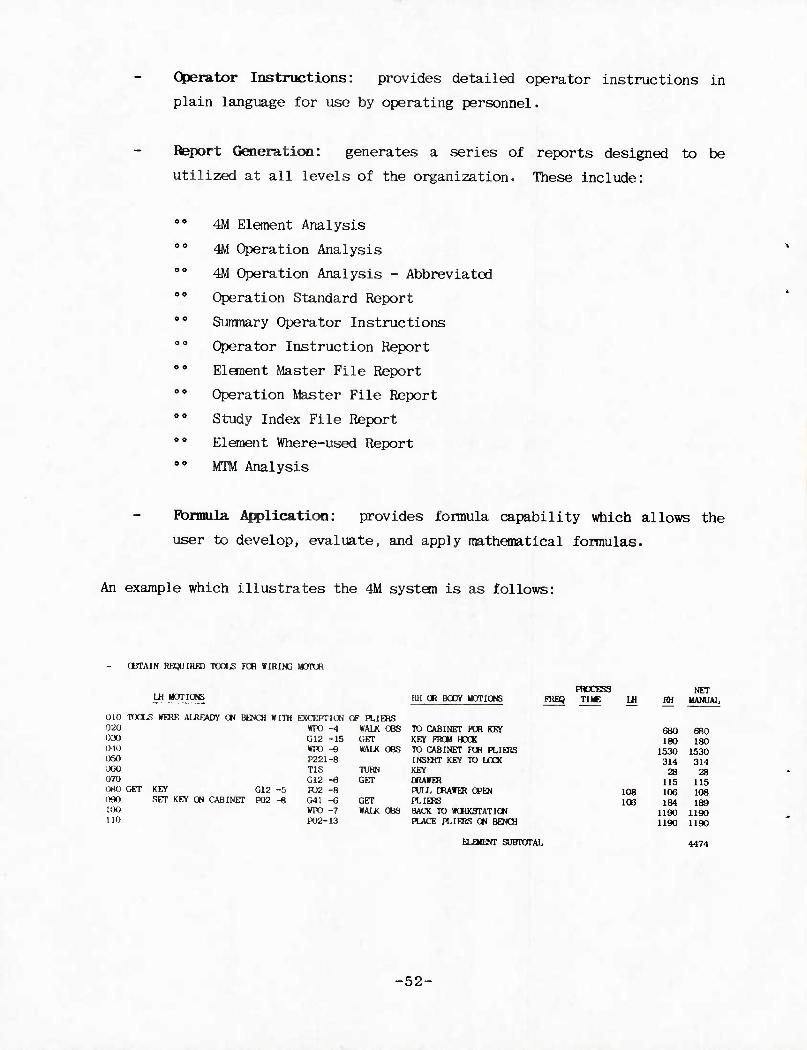
C|)erator Instructions: provides detailed operator instructions in
plain language for use by operating personnel.
Fteport Generation: generates a series of reports designed to be
utilized at all levels of the organization. These include:
00 4M Element Analysis 00 4M Operation Analysis 00 4M Operation Analysis - Abbreviated 00 Operation Standard Report 00 Sunmary Operator Instructions 00 Operator Instruction Report 00 Element Master File Report 00 Operation Master File Report 00 Study Index File Report 00 Element Where-used Report
MTM Analysis
Fbrraula, Application: provides formula capability which allows the
user to develop, evaluate, and apply mathematical formulas.
An example which illustrates the 4M system is as follows:
OBTAIN REQUIRED TOOLS FOR WIRIIC MOTOR
Lfl MOTIONS RH OR BODY MOTICNS FRBQ FnocE:
010 mm.s WERE ALREADY an BENCH WITH EXCEPTION OF HLIERS 020 WP0 -4 WALK OBS TO CABINET TOR KEY 0.T0 GI2 -15 GET KEY FRCM HOCK O-IO 1)50
WTO -9 P221-8
WALK OBS TO CABINET FOR PLIERS INSHTT KEY TO UXX
JCO T1S TORN KEY 070 012 -6 GET DRAWER 080 GET KEY 012 -5 P02 -8 WLL DRAWER OPEN 090 SET ICEY ON CABINET P02 -8 G41 -6 GET PLIERS 100 WTO -7 WALK OBS BACK TO WORKSTATION 110 P02-I3 HJiCE PLIERS ON BENCH
FiniFWT SUBTOTAL
LH RH NET
MANUAL
680 680 180 180
1530 1530 314 314
28 28 115 115
108 106 108 106 184 189
1190 1190 1190 1190
4474
-52-
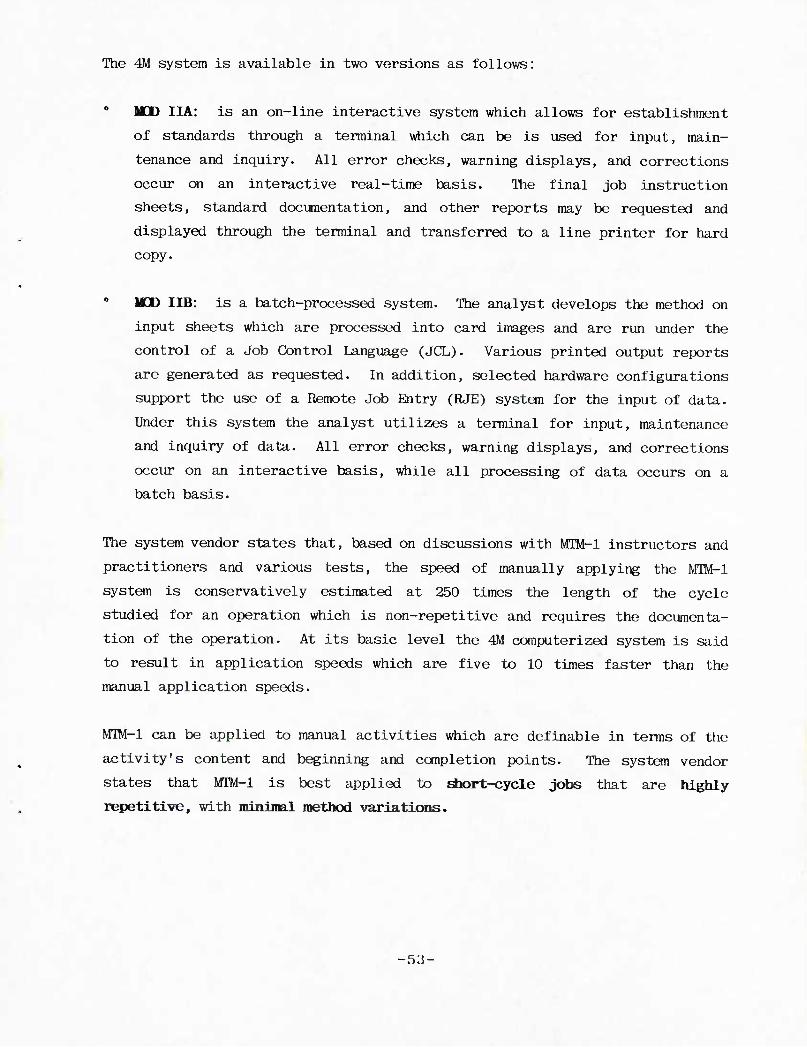
The 4M system is available in two versions as follows:
0 MCD IIA: is an on-line interactive system which allows for establishment
of standards through a terminal which can be is used for input, main-
tenance and inquiry. All error checks, warning displays, and corrections
occur on an interactive real-time basis. The final job instruction
sheets, standard documentation, and other reports may be requested and
displayed through the terminal and transferred to a line printer for hard
copy.
0 MOD IIB: is a batch-processed system. The analyst develops the method on
input sheets which are processed into card images and are run under the
control of a Job Control Language (JCL). Various printed output reports
are generated as requested. In addition, selected hardware configurations
support the use of a Remote Job Entry (RJE) system for the input of data.
Under this system the analyst utilizes a terminal for input, maintenance
and inquiry of data. All error checks, warning displays, and corrections
occur on an interactive basis, while all processing of data occurs on a
batch basis.
The system vendor states that, based on discussions with MTM-1 instructors and
practitioners and various tests, the speed of manually applying the MTM-1
system is conservatively estimated at 250 times the length of the cycle
studied for an operation which is non-repetitive and requires the documenta-
tion of the operation. At its basic level the 4M computerized system is said
to result in application speeds which are five to 10 times faster than the
manual application speeds.
MIM-1 can be applied to manual activities which are definable in terms of the
activity's content and beginning and completion points. The system vendor
states that MTM-l is best applied to sfaort-cycle jobs that are highly
repetitive, with minimal method variations.
-53-
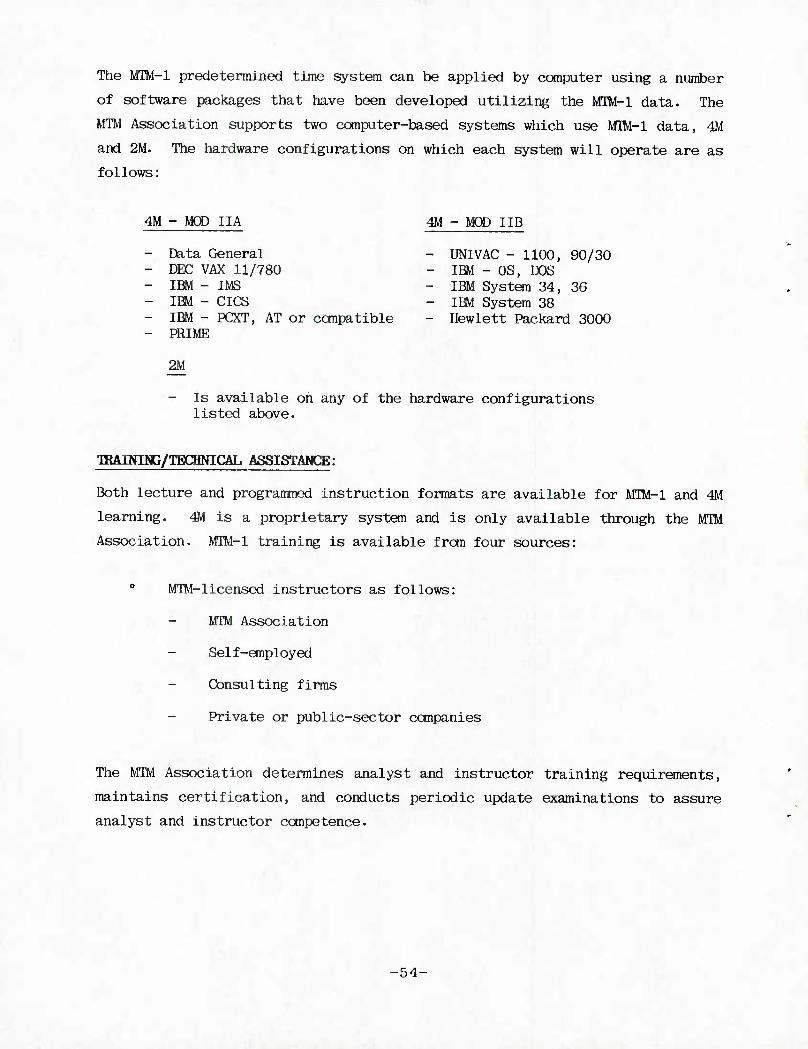
The MTM-1 predetermined time system can be applied by computer using a number
of software packages that have been developed utilizing the MTM-1 data. The
MTM Association supports two computer-based systems which use MIM-l data, 4M
and 2M. The hardware configurations on which each system will operate are as
follows:
4M - MOD IIA 4M - MOD IIB
- Data General - UNIVAC - 1100, 90/30 - DEC VAX 11/780 - IBM - OS, DOS - IBM - IMS - IBM System 34, 36 - IBM - CICS - IBM System 38 - IBM - PCXT, AT or canpatible - Hewlett Packard 3000 - PRIME
2M
- Is available on any of the hardware configurations listed above.
TOAINING/TBCHNICAL ASSISTANCE:
Both lecture and programmed instruction formats are available for MTM-1 and 4M
learning. 4M is a proprietary system and is only available through the MTM
Association. MTM-1 training is available from four sources:
" MTM-licensed instructors as follows:
- MTM Association
Self-employed
Consulting firms
Private or public-sector conpanies
The MTM Association determines analyst and instructor training requirements,
maintains certification, and conducts periodic update examinations to assure
analyst and instructor conpetence.
-54-
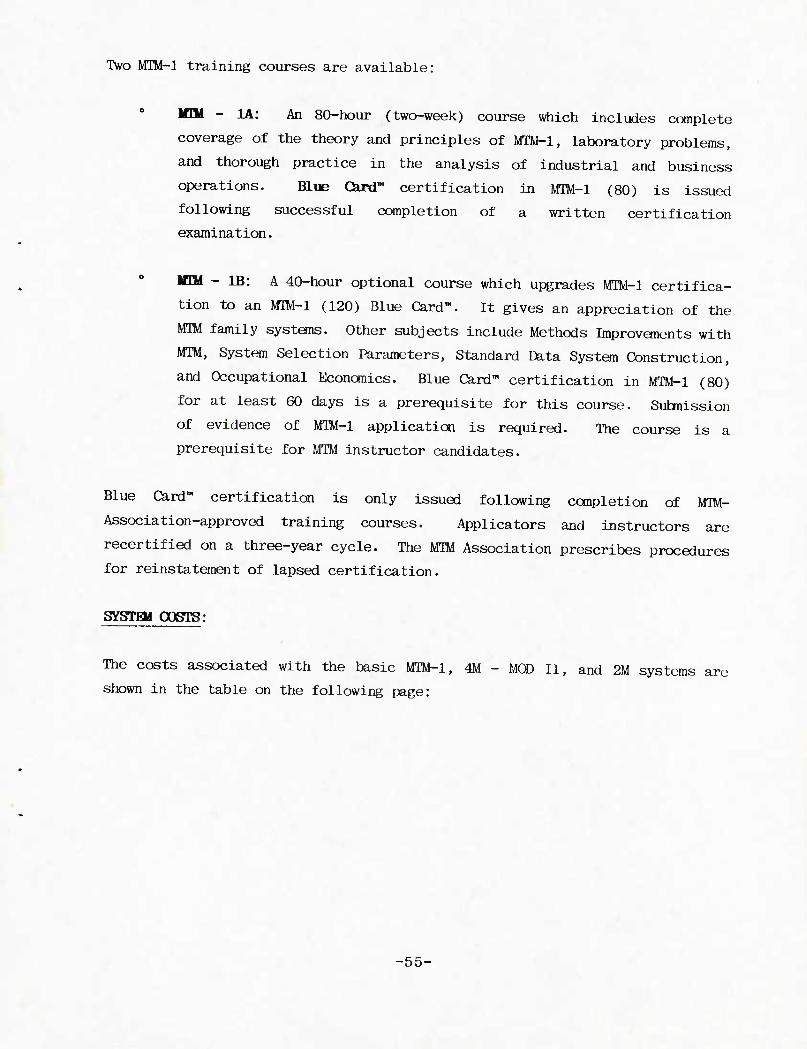
Two MTM-1 training courses are available:
MM - 1A: An 80-hour (two-week) course which includes complete
coverage of the theory and principles of MTM-1, laboratory problems,
and thorough practice in the analysis of industrial and business
operations. Blue QmT certification in MTM-1 (80) is issued
following successful completion of a written certification
examination.
IfEM - IB: A 40-hour optional course which upgrades MTM-1 certifica-
tion to an MTM-1 (120) Blue Card". It gives an appreciation of the
MIM family systans. Other subjects include Methods Improvements with
MIM, System Selection Parameters, Standard Data System Construction,
and Occupational Econonics. Blue Card™ certification in MTM-1 (80)
for at least 60 days is a prerequisite for this course. Submission
of evidence of MIM-l application is required. The course is a
prerequisite for MTM instructor candidates.
Blue Card" certification is only issued following completion of WM-
Association-approved training courses. Applicators and instructors are
recertified on a three-year cycle. The MTM Association prescribes procedures
for reinstatement of lapsed certification.
SYSTHJ ooerrs:
The costs associated with the basic MTM-1, 4M - MOD II, and 2M systems are
shown in the table on the following page:
-55-
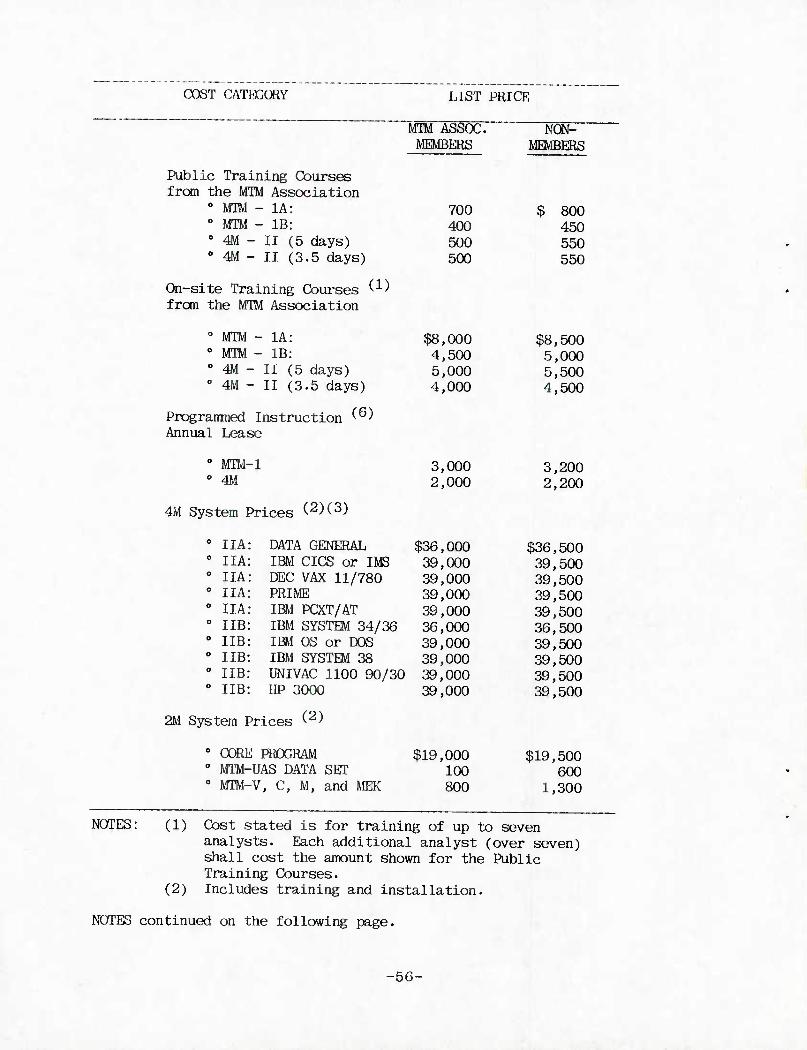
COST CATEGORY LIST PRICE
MTM ASSOC. NON- MEMBERS MEMBERS
Public Training Courses from the MTM Association
0 MIM - 1A: 700 $ 800 0 MTM - IB: 400 450 0 4M - II (5 days) 500 550 0 4M - II (3.5 days) 500 550
On-site Training Courses (•) from the MTM Association
0 MTM - 1A: $8,000 $8,500 0 MTM - IB: 4,500 5,000 0 4M - II (5 days) 5,000 5,500 0 4M - II (3.5 days) 4,000 4,500
Progratrmed Instruction ^ Annual Lease
0 MTU-1 0 4M
4M System Prices (2)(3)
3,000 2,000
3,200 2,200
IIA IIA IIA IIA IIA IIB IIB IIB IIB IIB
DATA GENERAL $36,000 IBM CICS or IMS 39,000 DEC VAX 11/780 39,000 PRIME 39,000 IBM PCXT/AT 39,000 IBM SYSTEM 34/36 36,000 IBM OS or DOS 39,000 IBM SYSTEM 38 39,000 UNIVAC 1100 90/30 39,000 HP 3000 39,000
2M System Prices (2)
0 CORE PROGRAM 0 MTM-UAS DATA SET 0 MTM-V, C, M, and MEK
$19,000 100 800
$36,500 39,500 39,500 39,500 39,500 36,500 39,500 39,500 39,500 39,500
$19,500 600
1,300
NOTES: (1) Cost stated is for training of up to seven analysts. Each additional analyst (over seven) shall cost the amount shown for the Public Training Courses.
(2) Includes training and installation.
NOTES continued on the following page.
-56-
(3) All prices are for the initial CPU and/or PC site. Additional CPUs and/or PC sites may be sold at a reduced price.
(4) Additional entities must pay an access charge of 33.3% of the total system price.
(5) MTM-UAS, V, C, M, and MEK are only available to authorized users of the respective manual system.
(6) Costs stated are for the first year and the initial site.
COMHJAMCE WITH MIL STO 1567A:
The MTM-1/4M predetermined time systems are in compliance with the specific
requirements set forth in MIL STD 1567A. Based on our review of statistical
backup data provided by the vendor, the system will theoretically generate
standards with an accuracy of at least ±10% at a 90% confidence level. (See
System Accuracy Section). Those specific requirements which have been met are
as follows:
All Type I standards must reflect an accuracy of ±10% with a 90% or
greater confidence at the operational level.
0 Documentation of an operations analysis.
A record of standard practice or method followed when the standard
was developed.
0 A record of rating or leveling.
A record of the standard time computation including allowances.
A record of observed or predetermined time system time values used in
determining the final standard time.
Provision of an audit trail down to the elemental standard time
level.
-57-
gTRENGTHS AND WEAKNESSES:
Strengths and weaknesses and/or constraints identified are based on
discussions with users of the MTM-1 predetermined time system in conjunction
with 4M. The comments listed below are based on these discussions and, while
a broad range of industries were sampled, conments should not be considered
universal and therefore may not be applicable to all manufacturing
environments:
0 System is flexible. 0 Standard data can be developed. 0 Updates are provided frequently. 0 Accurate. 0 Human error eliminated.
" Easy to learn and apply.
" Easy to maintain. 0 MTM Association holds a user's conference once a year. 0 Faster than and as accurate as manual MTM-1.
° Many reports can be generated. 0 Saves on writing, typing, and filing. 0 Standards are auditable. 0 MTM provides updates.
Very minute - requires a lot of work to get to a particular
pattern. Is sonewhat cumbersane.
SYSTEM DSEKS:
Because of the large number of users and the fact that MTM-1 is a public
system, the system vendor was unable to provide users by manufacturing type.
-58-
The NfrM-l/4M system is currently being used in 128 plants which represent a
variety of industries including:
0 Defense 0 Aerospace 0 Electronic 0 Medical 0 Appliances 0 Cosmetics
REFERENCE SOURCE:
MTM Association
-59-
MTM-2, ADAM
ODNTACT: Dirk Rauglas, Dir.-Research & Tech. Sup. COMPANY: MTM Association ADDRESS: 1411 Peterson Avenue, Park Ridge, IL 60068 PHONE: (312) 823-7120
SYSTEM HISTORY:
In the development of inM-2, research material was provided principally by the
MTM Data Group in Sweden. MTM analyses from different industries and work
areas were collected, checked, and then processed on a computer progranmed to
yield information about motion sequences and frequencies. The Swedish sample
contained approximately 14,000 motions. Further analyses of sample patterns
wore obtained from the U.S. (about 5,000 motions) and from the U.K. (about
3,000 motions).
Research findings revealed that two main motion sequences offer the best basis
for the conbination of data. These sequences include a REACH, GRASP, RELEASE
sequence and a MOVE, or MOVE and POSITION sequence. MTM-2 was approved by the
International Mm Directorate in 1965, and in 1970 was approved by the
U.S./Canada MTM Association.
SYb'l'm EtSCKIPTICW:
The lffli-2 predetermined time system may be defined as a synthesized system of
MTM data on the second generic level based exclusively on MTM-1 single motions
and motion sequence combinations. The elements employ an alphanumeric coding
system.
There are nine categories of manual motions with 39 time values. The nine
motion categories are:
MOTION SYMBOL Get G Put P Apply Pressure A Regrasp R Eye Action E Crank C Step S Foot Motion F Bend and Arise B
•60-
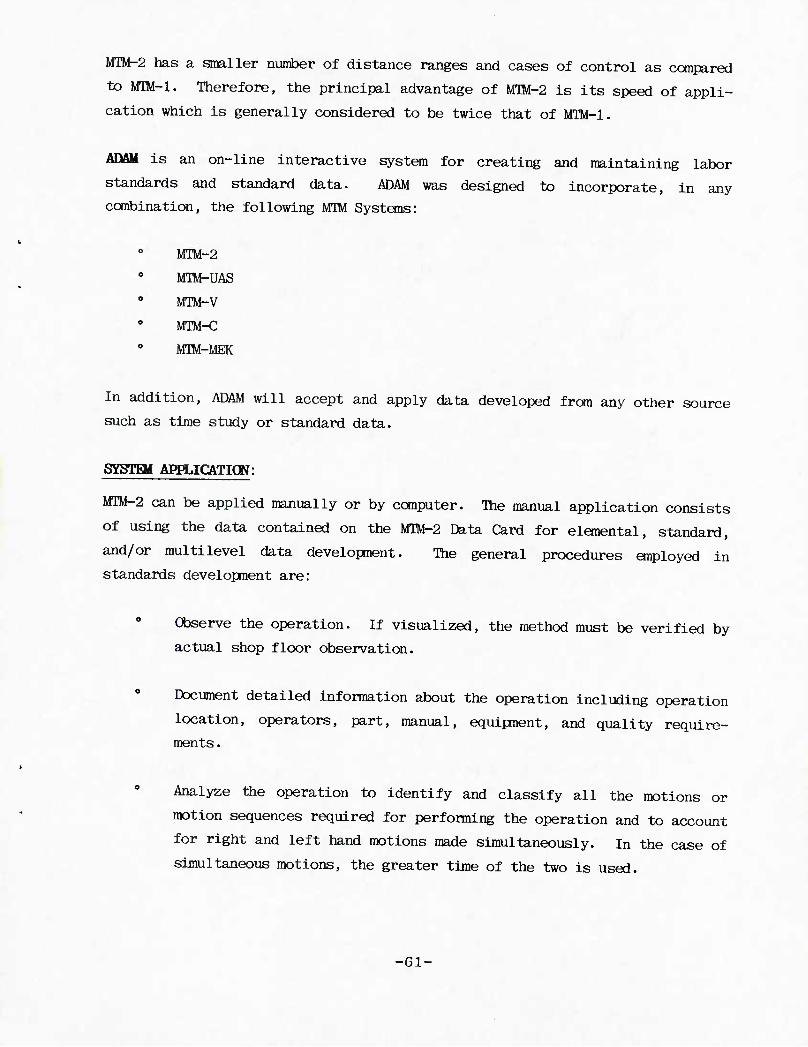
MTM-2 has a smaller number of distance ranges and cases of control as compared
to MTM-1. Therefore, the principal advantage of MTM-2 is its speed of appli-
cation which is generally considered to be twice that of MTM-1.
ADftM is an on-line interactive system for creating and maintaining labor
standards and standard data. ADAM was designed to incorporate, in any
combination, the following MTM Systems:
MTM-2
MTM-UAS 0 MTM-V
MTM-C
MTM-MEK
In addition, ADAM will accept and apply data developed from any other source
such as time study or standard data.
SYSTEM APPLICATION:
MTM-2 can be applied manually or by computer. The manual application consists
of using the data contained on the MTM-2 Data Card for elemental, standard,
and/or multilevel data development. The general procedures employed in
standards development are:
Observe the operation. If visualized, the method must be verified by
actual shop floor observation.
Document detailed information about the operation including operation
location, operators, part, manual, equipment, and quality require-
ments.
Analyze the operation to identify and classify all the motions or
motion sequences required for performing the operation and to account
for right and left hand motions made simultaneously. In the case of
simultaneous motions, the greater time of the two is used.
-61-
Record the motions using the proper l/HM conventions for the system
being used and document them on the MTM Activity Analysis Forms.
Assign Time Values (TMUs) to the motions by entering the proper times
fran the MTM Data Card.
Add up the time values to obtain the total time required for the
operation studied. The time obtained will be the time required for
an operator of average skill working with average effort.
Add the required allowances such as personal, fatigue, unavoidable
delay, etc.
0 Validate and apply the standard.
ADAM, the automated data application and maintenance program, utilizes the
standard MTM-2 notations and applies MTM-2 rules.
The primary features of ADAM are:
System Setup Options: have been provided to allow the user to
custonize keyboard control.
User Variable Options: have been provided to allow the user to
customize the ADAM installation to meet his specific needs.
Simplified Input Effort: has been achieved through the use of free-
format input.
DseiMJefined Elements: are input by keying in the element code,
element time, and element description.
Immediate Error Detection: is provided by routines which check each
entry for validity.
-62-
Internal Time Calculations: are handled by identifying all manual
elements which are internal to a machine cycle. ADAM performs the
necessary analysis and conputes the total time by applying the proper
manual and process allowances to each element.
Data Storage: is accomplished by a single key stroke followed by
inputting an element code of up to 20 characters and a user-created
element description.
Iftiltilevel Data: is supported to higher data levels.
Formula Application: is fully supported by ADAM.
Efeta Base Maintenance: is supported through editing routines which
allow the analyst to get an element; modify, remove or insert data to
the element; and subsequently save the element. A Mass Update Pro-
gram allows the analyst to update all standards effected by editing.
Data Base Review: allows the user to view portions of or the entire
data base.
Activity leg: function provides the user with a conplete listing of
all changes made to the data base.
According to the system vendor, the application time for manual MTM-2 is
conservatively estimated to be 150 times the length of the cycle when the
cycle is non-repetitive and includes method documentation. When applied by
computer using the ADAM software package, the application time is five to 10
times faster.
M1M-2 has been used in a wide variety of applications including: metal-
working and manufacturing industries; electrical and electronic-ccraponent
assemblies; office and clerical applications; and other types of businesses
and industry. The MTM Association states that the MTM-2 system is most
applicable to highly repetitive work with variations from cycle to cycle and
to short-cycle lengths in the one-to-five-minute range.
-63-
ADAM is currently available using the following hardware configurations:
Apple II Plus
Apple HE
Apple III
IBM PC, XT, or compatibles 0 TI Professional Conputer
TBAININS/TBCHNICAL ASSISTANCE:
A lecture approach is used in training individuals in the application of MTM-
2. Training is available from four sources:
The MTU Association
MTM-licensed instructors who are self-employed
MTM-licensed instructors who are employed by consulting firms
MTM-licensed instructors who are employed by private or public-sector
conpanies
The MTM Association determines analyst and instructor training requirements,
maintains certification, and conducts update examinations to assure analyst
and instructor competence. Recertification is required every three years.
Two ym.i-2 Training Courses are available:
inM-2A: BLUE CARD" certification in MTM-1 is a prerequisite. A 40-hour
(one-week) course covering the theory and application of MTM-
2. Opportunity for laboratory instruction and practice in the
use of MTM-2 data is provided. Blue Card" certification in MTM-
2 is issued following successful completion of a written
certification examination.
Ifai-2B: No prerequisite. A 64-hour (eight-day) course containing 24
hours (three days) of methods improvement and work-simplifica-
tion training with relation to MTM. An appreciation of M^l-l is
also provided. The remaining 40 hours (one week) is identical
to MTM-2A. Blue Card" certification in MTM-2 is issued
following successful completion of a written certification
examination.
-64-
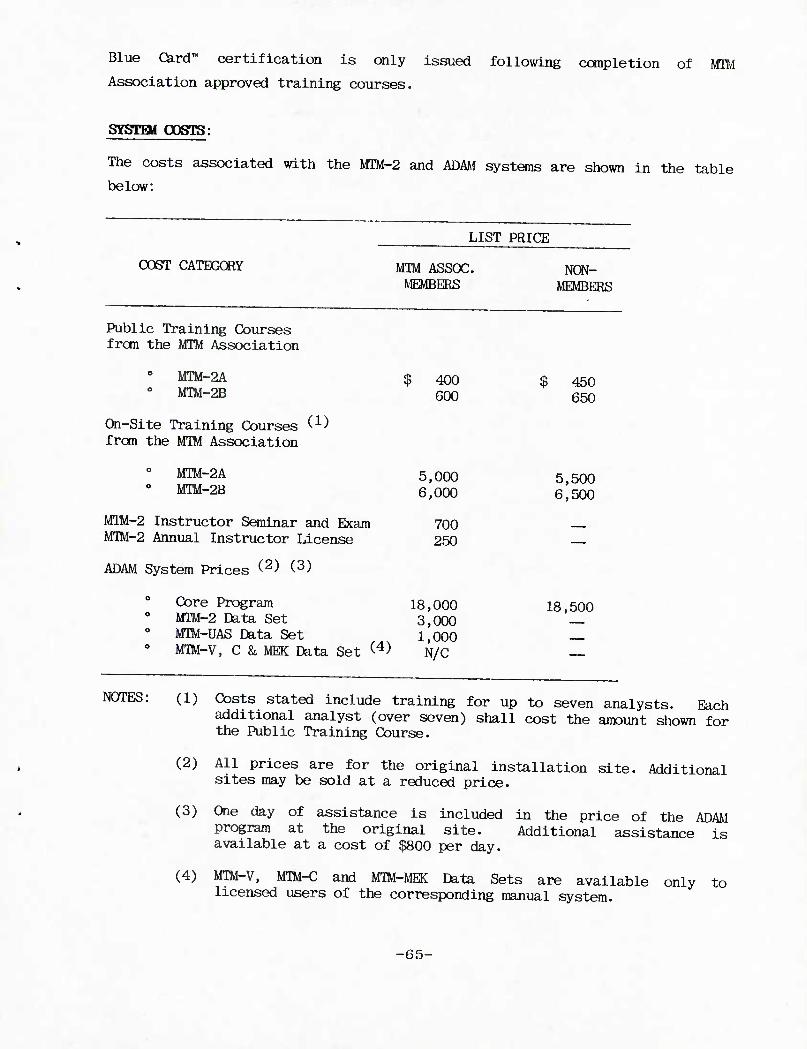
Blue Card™ certification is only issued following completion of MTM
Association approved training courses.
SYSTEM POSTS:
The costs associated with the MTM-2 and ADAM systems are shown in the table
below:
COST CATEGORY
Public Training Courses from the MTM Association
0 MTM-2A MTM-2B
On-Site Training Courses ^ from the MTM Association
LIST PRICE
MTM ASSOC. MEMBERS
$ 400 600
NON- MEMBERS
$ 450 650
MTM-2A MTM-2B
5,000 6,000
5,500 6,500
MIM-2 Instructor Seminar and Exam MTM-2 Annual Instructor License
700 250 z
ADAM System Prices (2) (3)
Core Program MTM-2 Data Set MTM-UAS Data Set MTW-V, C & MEK Data Set (4)
18,000 3,000 1,000 N/C
18,500
NOTES: (1) Costs stated include training for up to seven analysts. Each additional analyst (over seven) shall cost the amount shown for the Public Training Course.
(2) All prices are for the original installation site. Additional sites may be sold at a reduced price.
(3) One day of assistance is included in the price of the ADAM program at the original site. Additional assistance is available at a cost of $800 per day.
(4) M1M-V, WIM-C and MTM-MEK Data Sets are available licensed users of the corresponding manual system.
only to
-65-
OOMFLIANCE WITH MIL STD 1567A:
The MTM-2 predetermined time system is in compliance with the specific
requirements set forth in MIL STD 1567A. Based on our review of statistical
backup data provided by the vendor, the system will theoretically generate
standards with an accuracy of at least ±10% at a 90% confidence level. (See
System Accuracy Section). Those specific requirements which have been met are
as follows:
All Type I standards must reflect an accuracy of ±10% with a 90% or
greater confidence at the operation level.
0 Documentation of an operations analysis.
A record of standard practice or method followed when the standard
was developed.
0 A record of rating or leveling.
A record of the standard time computation including allowances.
A record of observed or predetermined time system time values used in
determining the final standard time.
Provision of an audit trail down to the elemental standard time
level.
STRENGTBS AND WEAKNESSES:
Strengths and weaknesses and/or constraints identified are based on
discussions with users of the MTM-2 predetermined tune system. The carments
listed below are based on these discussions and, while a broad range of
industries were sampled, conments should not be considered universal and
therefore may not be applicable to all manufacturing environments:
0 System is easily learned and applied.
-66-
Computerized application provides improved speed, accuracy and
consistency of application, and enables the user to more easily
modify standards, perform mass updates, and develop and analyze
"what-if" scenarios-
Computerized system will accept and manipulate data developed
utilizing other work measurement systems or techniques.
Past user support provided by the system vendor has been exceptional.
The system generates several types of informational reports for use
by management personnel.
The computer program is written in Pascal and cannot be interfaced
with other systems; however, an interface program is currently being
developed by the system vendor.
Use of the system requires a fundamental knowledge of computers.
SYSTEM USERS:
Because of the large number of users and the fact that MTM-2 is a public
system, the system vendor was unable to provide users by manufacturing type.
The MTM-2/ADAM system is currently being used in 32 plants which represent a
variety of industries as follows:
0 Electronic 0 Defense 0 Computer 0 Medical
° Finance 0 Aerospace
REFERENCE SOURCE:
MTM Association.
■67-

OONTACT GQHPANY ADDRESS
MTM-3
Dirk Rauglas, Dir.-Research & Tech. Sup. MTM Association 1411 Peterson Avenue, Park Ridge, XL G0068
HaONE: (312) 823-7120
SYSTEM HISTOBY:
The METM-a predetermined time system was developed by the Swedish MTM
Association with assistance provided by both the United Kingdon and Finnish
groups. Development began in 1967 and the system was approved by the
International MTM Directorate in 1970.
The primary objective of the system is to cover low-repetition, long-cycle
work.
SYSTEM EESCRIPTICW:
According to the system vendor, the MTM-3 predetermined time system may be
defined as a synthesized system of MTM data based on MTM-l motion sequences or
averaged individual motions.
There are four categories of manual motions as follows:
MQTICN SYMBOL
Handle H
Transport T
Step and Foot Motion SF
Bend and Arise B
Two of these motions, HANDLE and TRANSPORT, have variable categories, case and
distance. Only 10 time values appear on the MTM-3 Data Card, ranging in value
from 7 TMU to 61 TMU.
-68-
SYSTEM AHPLIG&TIOW:
MTM-3 is an entirely manual system which utilizes an MTM-3 Data Card and
Standard Data as its mode of standards development.
The methodology used to apply the MTM-3 system to develop elemental, standard,
and/or multilevel data is as follows:
Observe and document the operation being performed. If visualized,
the method must be verified by actual shop floor observation.
Secure complete and detailed information about the operation,
including the identification of the operation, tools, workplace
layout, and conditions.
Analyze the operation to identify and classify all left/right hand
motions or motion sequences required for performing the operation and
identify simultaneous motions. In the case of simultaneous motions,
the greater time of the two is used.
Record the motions using the proper MTM conventions for the system
being used and document them on the MTM Activity Analysis Forms.
Assign Time Values (TMUs) to the motions by entering the proper times
fron the Mm Data Card.
Add up the time values to obtain the total time required for the
operation studied. The time obtained will be the time required for
an operator of average skill working with average effort.
Add the required allowances such as personal, fatigue, unavoidable
delay, etc.
0 Validate and apply the standard.
-69-
According to the system vendor, the application of MTM-3 has been conserva-
tively estimated to be 50 times the length of the cycle when the cycle is non-
repetitive and includes method documentation.
MW-3 has been used in a wide variety of applications including: metalworking
and manufacturing industries; electrical and electronic-component assemblies;
office and clerical applications; and other types of businesses and industry.
The MTM Association states that the MTM-3 system is most applicable to non-
repetitive work with variations and cycle lengths in the four-to-15-minute
range.
TRAINING/TECHNICAL ASSISTAWCE:
Both lecture and self-paced prograjrmed instruction formats are available for
MTM-3 learning. Training is available fran four sources of licensed MTM
instructors as follows:
0 MTM Association
0 Self-employed
0 Consulting firms
Private or public-sector companies
The MTM Association determines analyst and instructor-training requirements,
maintains certification, and conducts update examinations to assure analyst
and instructor competence.
MTM-2 certification is a prerequisite for MTM-3 certification. Applicators
receive a 24-hour (three-day) course covering the theory and application of
the MTM-3 system. Blue Card" certification is only issued following
completion of MTM-Association-approved training courses. Applicators and
instructors are retested on a three-year cycle.
■70-
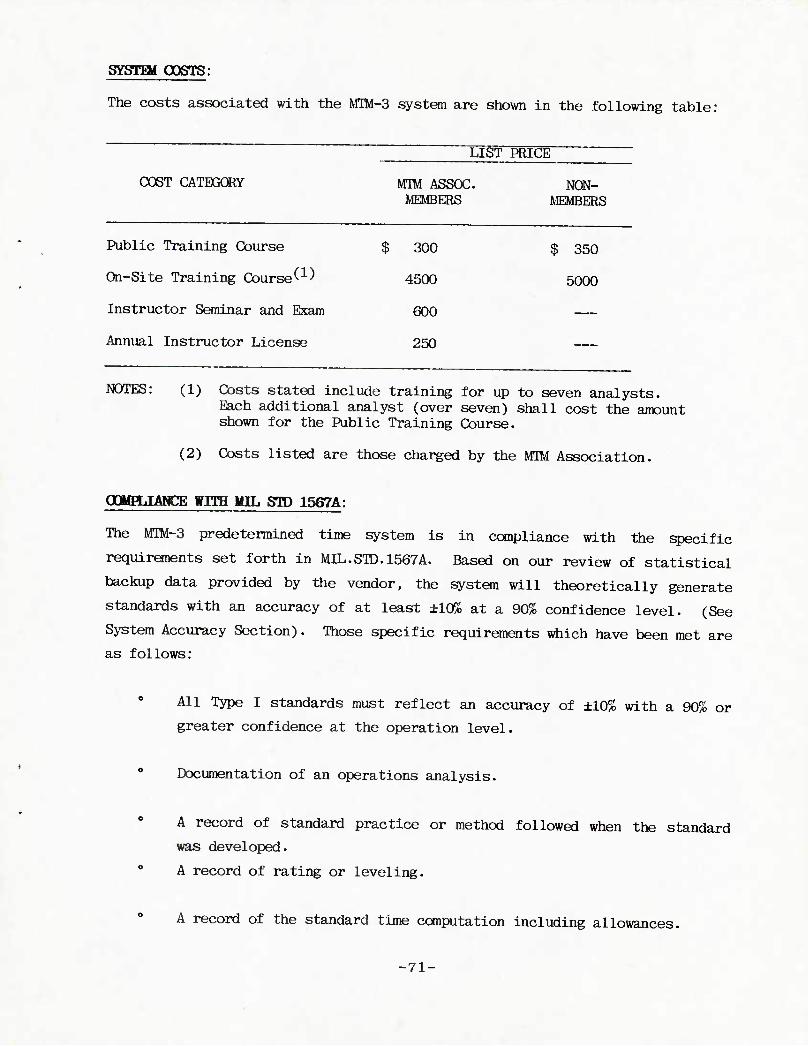
SYSTEM COSTS:
The costs associated with the MTM-3 system are shown in the following table:
LIST PRICE
COST CATEGORY MTM ASSOC. NON- MEMBERS MEMBERS
Public Training Course $ 300 $ 350
Qn-Site Training Course^ 4500 5000
Instructor Seminar and Exam 600
Annual Instructor License 250
NOTES: (1) Costs stated include training for up to seven analysts. Each additional analyst (over seven) shall cost the amount shown for the Public Training Course.
(2) Costs listed are those charged by the MTM Association.
CPMHJAMCE WITH MIL STD 1567A:
The MTM-3 predetermined time system is in compliance with the specific
requirements set forth in MIL.SrID.1567A. Based on our review of statistical
backup data provided by the vendor, the system will theoretically generate
standards with an accuracy of at least ±10% at a 90% confidence level. (See
System Accuracy Section). Those specific requirements which have been met are
as follows:
All Type I standards must reflect an accuracy of ±10% with a 90% or
greater confidence at the operation level.
0 Documentation of an operations analysis.
A record of standard practice or method followed when the standard
was developed. 0 A record of rating or leveling.
A record of the standard time computation including allowances.
-71-
A record of observed or predetermined time system time values used in
determining the final standard time.
Provision of an audit trail down to the elemental standard time
level.
STRENGTOS AND WEAKNESSES:
Since MTM-3 is a public system, the MTM Association was unable to provide any
users of the system. Therefore, no strengths and weaknesses could be
identified.
SYSTEM DSHtS:
Since imi-3 is a public system, the MTM Association is unable to provide
comprehensive records of all users.
REFERHO: SODBCE:
MTM Association
-72-
CONTACT OOMPANY ADDRESS
HTM-HEK
Dirk Rauglas, Dir.-Research & Tech. Sup. MTM Association 1411 Peterson Avenue, Park Ridge, XL 60068
PBONE: (312) 823-7120
SYSTEM HISTORY:
The IflM-MEK predetermined time system was developed by a consortium brought
together by the German MM Association, Swiss MTM Association, and Austrian
MTM Group. MTM-MEK was developed from MTM-1 utilizing statistical analysis
conbined with conventional standard data techniques. The system is suited for
the measurement of one-of-a-kind and small-lot production. Development of the
system occurred during the period of 1975 through 1982.
SYSTHi EESCRIPTICW:
WM-MHC is a two-level data system developed specifically for the measurement
of any activity that has the characteristics of one-of-a-kind or small-lot
production. The statistical concepts utilized in developing MM-MEK preclude
the need to develop organized methods to accurately apply the system. This
allows for the development of both preproduction and production standards in
environments where work organization is minimal or nonexistent.
MTM-MEK can be used to analyze all manual activities as long as the following
characteristic requirements of a low methods level are met:
The task is not highly repetitive or highly organized. The activity
may contain similar elements demanding differing methods. The method
used to perform a given operation will normally vary from cycle to
cycle.
The workplace, tools and equipment used must be universal in
character.
-73-
The task, being complex in nature, requires a high degree of employee
training, while the lack of a specific method to accomplish the task
requires a high degree of versatility on the part of the operator.
In addition, MTM-MEK is specifically applicable:
0 As an analyzing system.
As a method for establishing preproduction labor standards from
drawings and bills of material.
0 To customized products.
As an analyzing system for developing standard data blocks.
To activities with ongoing methods variation.
SYSTEM ARPLICATIOW:
MTM-MEK, rather than focusing on an exact knowledge of the motion sequence
involved in an activity, centers on the peripheral conditions under which the
motion sequence takes place.
It is therefore not stated how complicated a motion sequence is, rather only
that it takes place. The motion sequence is represented by coding indicating
how exact the sequence is, over what distance range it takes place, and how
much weight or bulkiness is involved. These same variables are available
during planning analysis, thereby allowing for the development of pre-
production standards. When preproduction standards are developed, they must
be verified by actual shop floor observation.
MTM-MEK consists of 51 time values in the following categories:
Get and Place » Motion Cycles
Handle Tool • Fasten or Loosen place o Body Motions
Operate • Visual Control
-74-
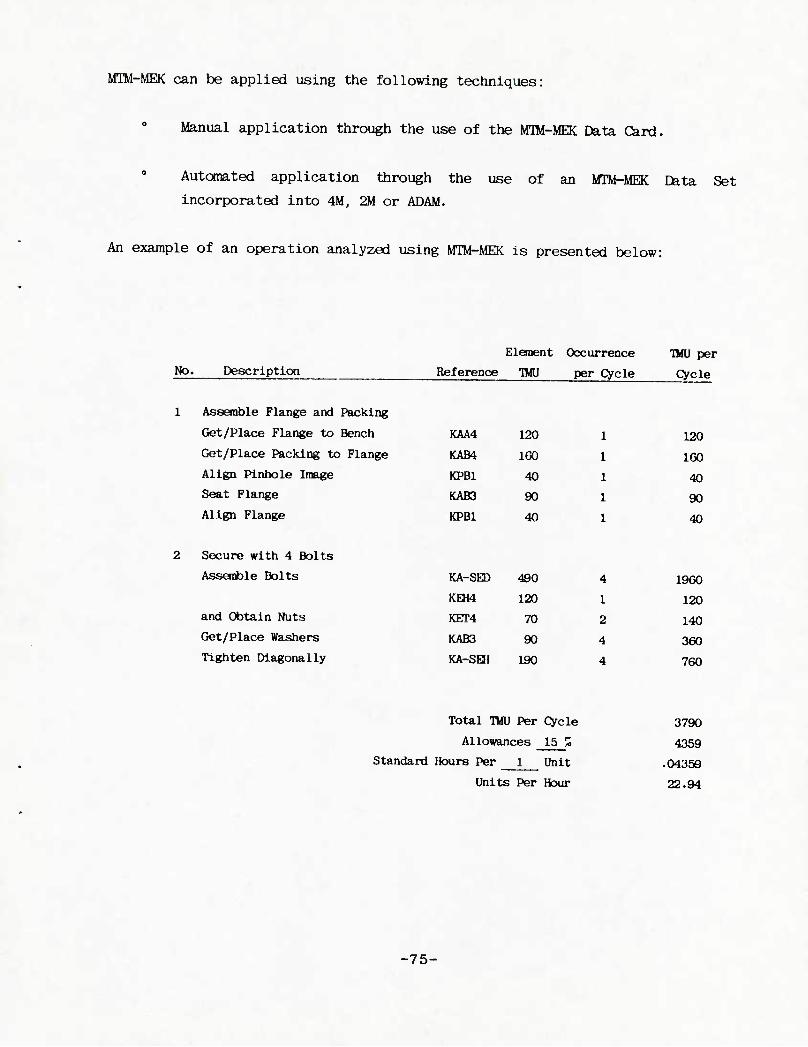
MTM-MEK can be applied using the following techniques:
Manual application through the use of the MTM-MEK Data Card.
Automated application through the use of an MTM-MEK Cata Set
incorporated into 4M, 2M or ADAM.
An example of an operation analyzed using MTM-MEK is presented below:
No. Description
Element Occurrence TMU per
Reference TMU per Cycle Cycle
Assemble Flange and Packing
Get/Place Flange to Bench
Get/Place Packing to Flange
Align Pinhole Image
Seat Flange
Align Flange
KAA4 120
KAB4 ieo KPBi 40
KAB3 90
KPBI 40
120
1G0
40
90
40
Secure with 4 Bolts
Assemble Bolts
and Obtain Nuts
Get/Place Washers
Tighten Diagonally
KA-SED 490 4 19G0
KEH4 120 1 120
KET4 70 2 140
1CAB3 90 4 360
KA-SE31 190 4 760
Total TVU Per Cycle
Allowances 15 %
Standard Hours Per 1 Unit
Units Per Hour
3790
4359
.04359
22.94
-75-
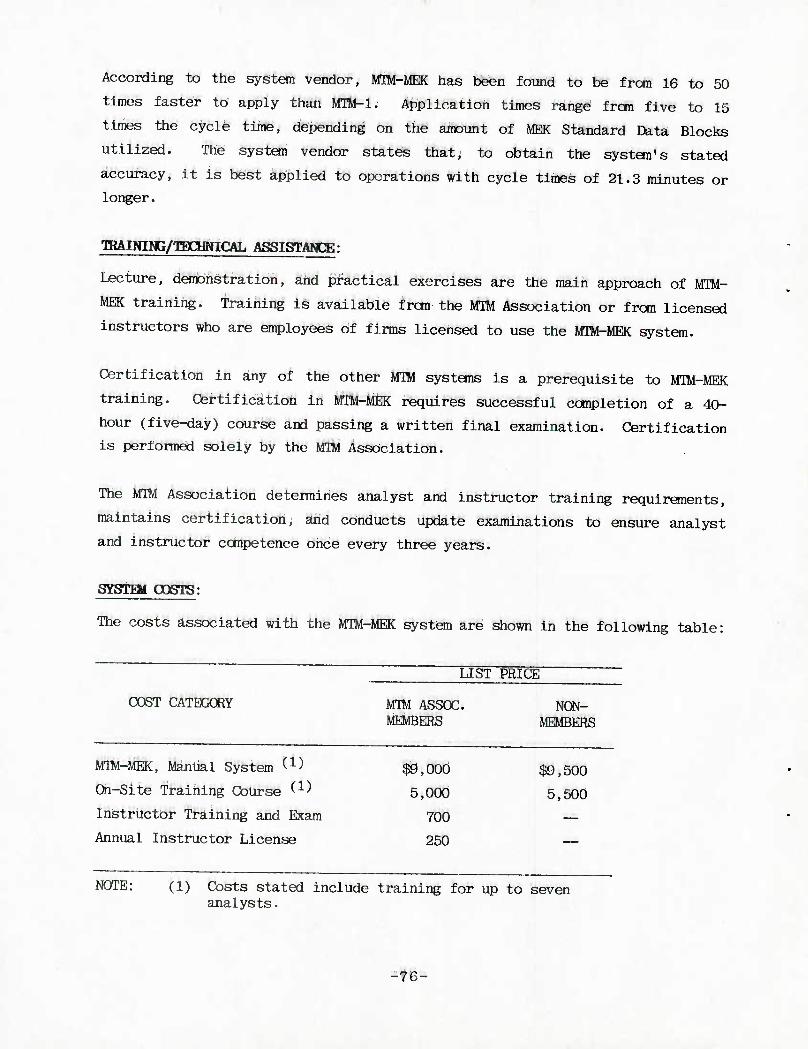
According to the system vendor, MTM-MEK has been found to be from 16 to 50
times faster to apply than MTM-l. Application times range fron five to 15
times the cycle time, depending on the amount of MEK Standard Data Blocks
utilized. The system vendor states that, to obtain the system's stated
accuracy, it is best applied to operations with cycle times of 21.3 minutes or
longer.
TEtAINING/TBCHWICAL ASSISTANCE:
Lecture, demonstration, and practical exercises are the main approach of MTM-
MEK training. Training is available from the MTM Association or from licensed
instructors who are employees of firms licensed to use the MTM-MEK system.
Certification in any of the other MTM systems is a prerequisite to MTM-MEK
training. Certification in MTM-MEK requires successful completion of a 40-
hour (five-day) course and passing a written final examination. Certification
is performed solely by the MTM Association.
The MTM Association determines analyst and instructor training requirements,
maintains certification, and conducts update examinations to ensure analyst
and instructor ccmpetence once every three years.
SYSTEM O0BTS:
The costs associated with the MTM-MEK system are shown in the following table:
LIST PRICE
COST CATEGORY MTM ASSOC NON- MEMBERS MEMBERS
MTO-MEK, Manual System ^ $9,000 $9,500
On-Site Training Course ^ 5,000 5,500
Instructor Training and Exam 700
Annual Instructor License 250
NOTE: (1) Costs stated include training for up to seven analysts.
-76-
OOMHLIANCE WITH MIL STD 1567A:
The MTM-MEK predetermined time system is in compliance with the specific
requirements set forth in MIL STD 1567A. Based on our review of statistical
backup data provided by the vendor, the system will theoretically generate
standards with an accuracy of at least ±10% at a 90% confidence level. (See
System Accuracy Section). Those specific requirements which have been met are
as follows:
All Type I standards must reflect an accuracy of ±10% with a 90% or
greater confidence at the operation level.
0 Documentation of an operations analysis.
A record of standard practice or method followed when the standard
was developed.
0 A record of rating or leveling.
A record of the standard time canputation including allowances.
A record of observed or predetermined time system time values used in
determining the final standard time.
Provision of an audit trail down to the elemental standard time
level.
STRHrerBS AND WEAKNESSES:
Strengths and weaknesses and/or constraints identified are based on
discussions with users of the MTM-MEK predetermined time system. The coranents
listed below are based on these discussions and, while a broad range of
industries were sampled, comnents should not be considered universal and
therefore may not be applicable to all manufacturing environments:
System is accurate for long-cycle, low-repetition tasks.
■77-
NOTE:
Fast application time.
Easy to learn and apply.
Cost-effective.
Easy to audit.
MTM Association provides user conferences.
Allows for variations in job conditions.
Computer descriptions lose some detail as more work is combined into an element.
Need more actual examples in the training manual.
It was found that many companies are using 4M, MTM-UAS, and MTM-MEK as complementary systems with 4M for short-cycle, UAS for medium- cycle and MEK for long-cycle, low-repetition jobs.
SYSTHI USBBS:
MTM-MEK has been or is being used in 19 different companies representing a
variety of industries including:
0 Aerospace 0 Defense
Railroad
HEKKKENCE SODHCE:
MTM Association
-78-
OCWTACT COMPANY ADDRESS
MTM-DAS
Dirk Rauglas, Dir.-Research & Tech. Sup. MM Association 1411 Peterson Avenue, Park Ridge, XL 60068
MCNE: (312) 823-7120
SYSTHI HISTCHY:
IflU-DAS (Universal Analyzing System) was developed by a consortium of members
from the German MTM Association, Swiss MTM Association, and the Austrian MTM
Group during the years 1975-1982.
The original data was developed from MTM-1 analyses of operations filmed in
numerous plants. The operations were chosen to insure that typical character-
istics of batch production were present.
The time elements were developed comprised of well-defined motion sequences.
All time elements contain the required "Auxiliary Motions," (e.g.. Transfer
Grasp, Regrasp, and Disengage). «
MTO-UAS was developed to meet the need for supplying effective work measure-
ment to the area of batch production.
SYSTHI EESCRIPTICW:
IflM-UAS is a system designed for measurement of batch production activities
with the characteristics of similar tasks, designed workstations, organized
work levels, detailed operator instructions, and well-trained operators. The
system allows for the variability inherent in the batch production
environment. MTM-UAS can be applied across industries and across activities.
MTM-UAS has been developed in two levels of data. Level I is public data and
consists of 77 time values in the following motion categories:
Get and Place 0 Motion Cycles
Place » Body Motions
Handle Tool 0 Visual Control 0 Operate
■79-
Level II is proprietary and consists of data sets developed from Level I
data. There are 494 time values relating to the following activities:
0 Fastening Operations 0 Sealing/Plugging Operations 0 Assemble Standard Parts
Transporting Operations 0 Marking Operations
Adhering/Bonding Operations 0 Cleaning Operations 0 Preparing Activities 0 Apply Agents 0 Assemble Cables 0 Clipping Operations
SYSTEM APPLICATICW:
MIM-UAS may be applied in developing standard data and for direct analysis.
MTM-UAS may be used in combination with data developed from other sources.
The system is applied using the following techniques:
Manual application through the use of the MIM-UAS Data Card.
Automated application of MTM-UAS Data Sets can be accomplished using 4M, 2M, or ADAM, three computerized systems developed and supported by the MTM Association.
An example operation analysis using manual MTM-UAS is shown on the following
page.
According to the system vendor, the MTM-UAS system when applied manually has
been deteiroined to be a minimum of eight times faster to apply than MlM-l,
which results in application speeds of a maximum of 30 times the length of the
activity being studied, including method documentation. In practice, it has
been found that, through the use of standard data techniques, significant
reductions in application times have been realized. When MTM-UAS data is
combined with 4M, 2M or ADAM, standard development can be accomplished in
equal or less time than the operation being analyzed requires.
-80-
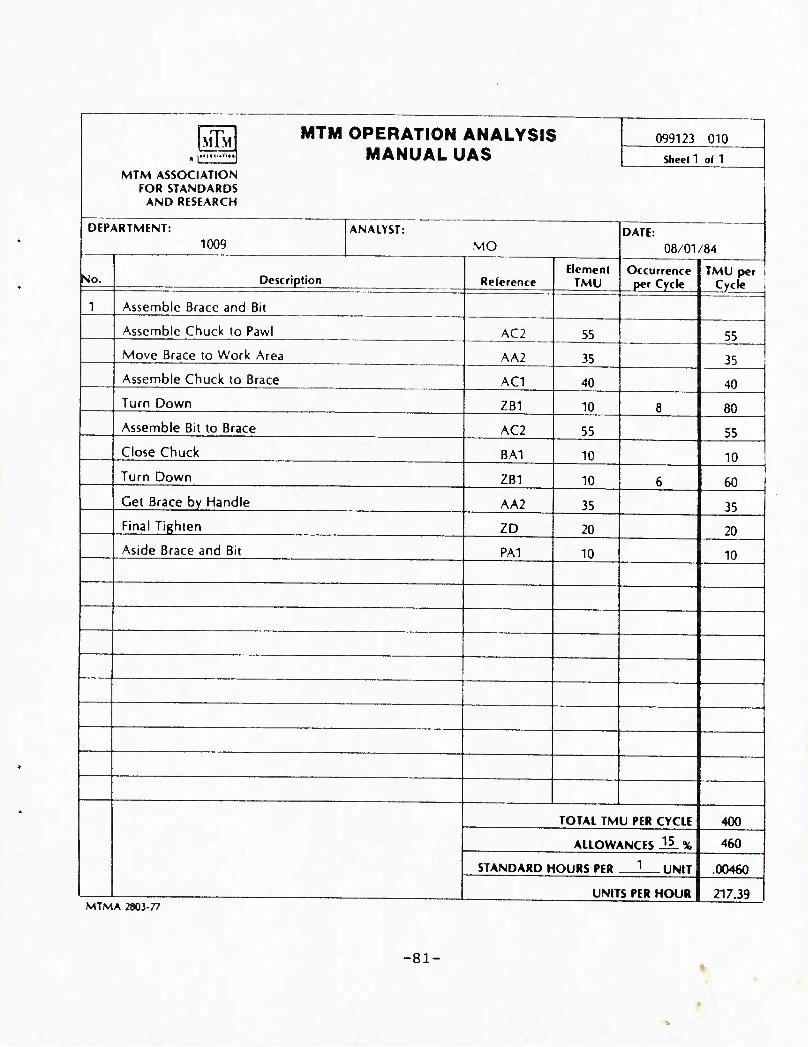
> 099123 010 MTM MTM OPERATION ANALYSIS MANUALUAS She«l1 0(1
MTM ASSOCIATION FOR STANDARD?
AND RESEARCH
i
DEPARTMENT: 1009
ANALYST: MO
DATE: 08/01/84
No. Description Reference Element
TMU Occurrence per Cycle
TMU per ! Cycle
1 Assemble Brace and Bit
Assemble Chuck to Pawl AC2 55 55
Move Brace to Work Area AA2 35 35
Assemble Chuck to Brace AC1 40 40
Turn Down ZB1 10 8 80
Assemble Bit to Brace AC2 55 55
Close Chuck BA1 10 10
Turn Down ZB1 10 6 60
Get Brace by Handle AA2 35 35
Final Tighten ZD 20 20
Aside Brace and Bit PA1 10 10
TOTAL TMU PER CYCLE 400
ALLOWANCES 15 % 460
STANDARD h lOURS PER 1 UNIT | .00460
UNITS PER HOUR 217.39 MTM A 2803-77
-81
The system vendor states that MIM-UAS is universally applicable to activities
in which the following characteristics of batch production are present:
0 Similar tasks 0 Workplaces specifically designed for the task 0 Good levels of work organization 0 Detailed instructions 0 Well-trained operators
Additionally, the MIM-UAS system is best suited for repetitive work with
variations from cycle to cycle or with variations in workplace setup and cycle
lengths in the two-to-seven-minute range.
TOAINING/TECHNICAL ASSISTANCE:
A lecture course is the approach used in training individuals in the
application of MTM-UAS. Training is available fron four sources:
MTM Association
0 MTM-licensed instructors who are self-employed
MTM-licensed instructors who are employed by consulting firms
0 MTM-licensed instructors who are employed by private or public-sector
companies
Two MTM-UAS training courses are available:
0 IfEM-UAS-A: A 32-hour (four-day) course covering the theory and applica-
tion of the system. Opportunity for laboratory instruction and practice
in the use of UAS is provided. Blue Card™ certification in MTM-UAS is
issued following successful completion of a written certification
examination.
-82-
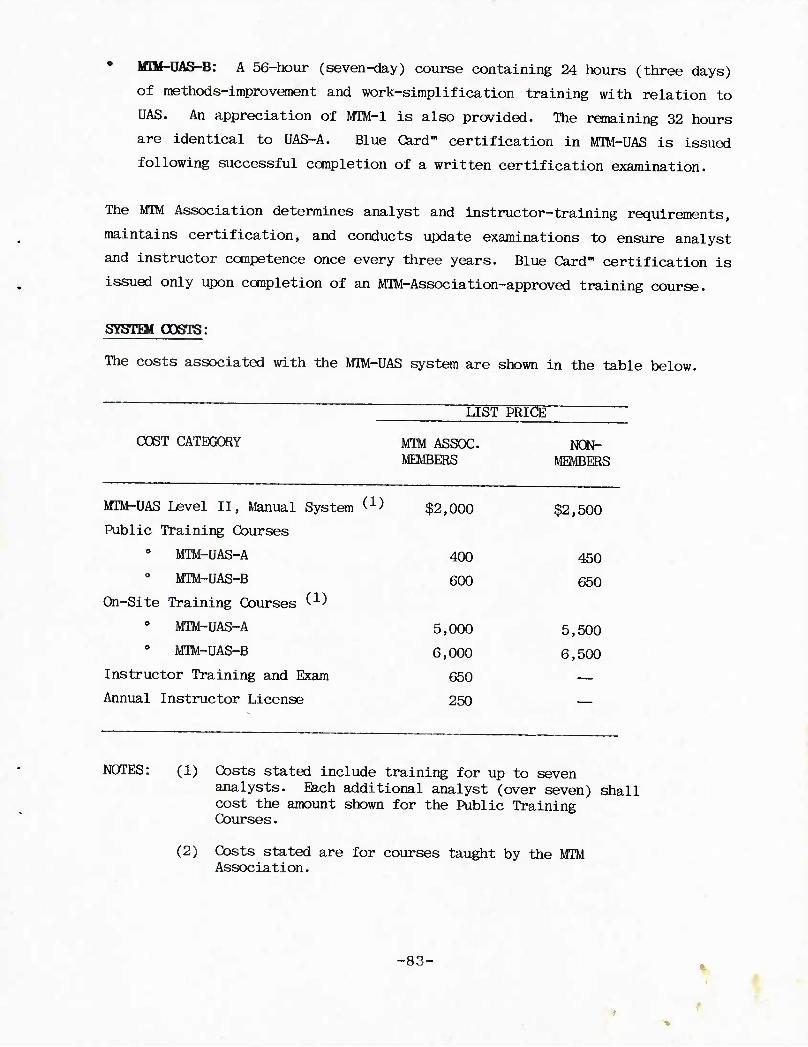
MTM-UAS-B: A 56-hour (seven-day) course containing 24 hours (three days)
of methods-improvement and work-simplification training with relation to
UAS. An appreciation of Mm-1 is also provided. The remaining 32 hours
are identical to UAS-A. Blue Card" certification in MTM-UAS is issued
following successful ccmpletion of a written certification examination.
The M1M Association determines analyst and instructor-training requirements,
maintains certification, and conducts update examinations to ensure analyst
and instructor competence once every three years. Blue Card" certification is
issued only upon ccmpletion of an MTM-Association-approved training course.
sysrai ooerrs:
The costs associated with the MTM-UAS system are shown in the table below.
LIST PRICE
COST CATEGORY MTM ASSOC. NON- MEMBERS MEMBERS
MTM-UAS Level II, Manual System ^ $2,000 $2,500
Public Training Courses 0 MTM-UAS-A
M1M-UAS-B
On-Site Training Courses ^ ^
MTM-UAS-A
MTO-UAS-B
Instructor Training and Exam
Annual Instructor License
400 450
600 650
5,000 5,500
6,000 6,500
650 —
250 —
NOTES: (1) Costs stated include training for up to seven analysts. Each additional analyst (over seven) shall cost the amount shown for the Public Training Courses.
(2) Costs stated are for courses taught by the MTM Association.
-83-
OOilPLIANCE WITH MIL STD 1567A:
The MTM-UAS predetermined time system is in compliance with the specific
requirements set forth in MIL STD 1567A. Based on our review of statistical
backup data provided by the vendor, the system will theoretically generate
standards with an accuracy of at least ±10% at a 90% confidence level. (See
System Accuracy Section). Those specific requirements which have been met are
as follows:
All Type I standards must reflect an accuracy of ±10% with a 90% or
greater confidence at the operation level.
0 Documentation of an operations analysis.
A record of standard practice or method followed when the standard
was developed.
0 A record of rating or leveling.
A record of the standard time computation including allowances. ■
A record of observed or predetemined time system time values used in
determining the final standard time.
Provision of an audit trail down to the elemental standard time
level.
STTBENGTHS AND WEAKNESSES:
Strengths and weaknesses and/or constraints identified are based on
discussions with users of the MIM-UAS predetermined time system. The connents
listed below are based on these discussions and, while a broad range of
industries were sampled, connents should not be considered universal and
therefore may not be applicable to all manufacturing environments: 0 System is accurate. 0 Fast application time. 0 Easy to learn and apply.
*
1
-84-
Cost-effective. 0 Easy to audit.
MTM Association provides user conferences.
Can be applied to a variety of applications.
Computer descriptions lose some detail as more work is combined into
an element (i.e., as compared to 4M).
NOTE: It was found that many companies are using 4M, MTM-UAS, and MTM-MEK
as complementary systems, with 4M for short-cycle, UAS for medium-
cycle and MEK for long-cycle, low-repetition jobs.
SYSTat DSBKS:
M1M-UAS has been or is being used in 25 different companies representing a
variety of industries including:
0 Aerospace 0 Defense
Medical 0 Electronic
REFHtENQE SOURCE:
MTM Association
-85-
\
MTM-V
OONTACT OCMPANY ADDRESS PHONE:
Dirk Rauglas, Dir.-Ilesearch & Tech, Sup. MTM Association 1411 Peterson Avenue, Park Ridge, XL 600G8 (312) 823-7120
SYSTHi HISTORY:
Ifllfr-V was developed by a consortium of organizations involved in a diversity
of machining operations and is based on MlM-l. The development of MTM-V was
under the supervision of the Swedish MTM Association and occurred during the
period of 1967-19C9.
SYSTEM DESCRIPTICW:
IHM-V is a data system developed to provide time standards for the manual
portions of machine-shop operations. Motions involved in setup and production
runs of machines are covered by 12 motion categories. These categories are:
HO - Handle Object 0 MA -
HH - Handle Hand Tool 0 FL -
HL - Handle Latch
SK - Rotate by Hand 0 MT -
GR - Inspect 0 KO -
MR - Use Marking Tools 0 KP -
BE - Blow or Brush off Equipment
Machine Adjustment
Fasten/Loosen with
Hand Tool
Use Measuring Tool
Use Gaging Tools
Couple to Hoist
Light, medium, and heavy manufacturing operations are covered by the MTM-V
system. MTM-V can be applied to all work within the following limits:
The size of the workpiece must not be so small as to require an aid,
such as tweezers, for handling.
The size of the workpiece must not be so large that one man cannot
guide and direct the workpiece when it hangs from an overhead crane
or similar device.
-8G-
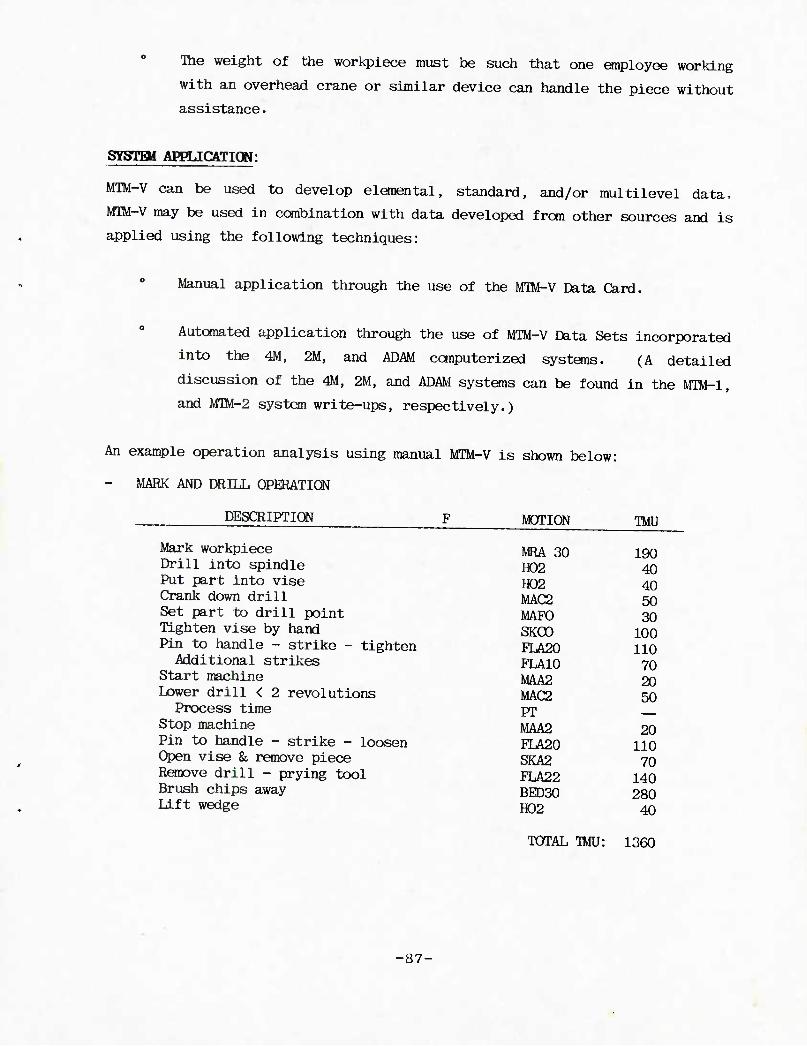
The weight of the workpiece must be such that one employee working
with an overhead crane or similar device can handle the piece without
assistance.
SYSTHI APPUCATIOW:
MTM-V can be used to develop elemental, standard, and/or multilevel data.
MIM-V may be used in combination with data developed from other sources and is
applied using the following techniques:
Manual application through the use of the MTM-V Data Card.
Automated application through the use of MTM-V Data Sets incorporated
into the 4M, 2M, and ADAM conputerized systems. (A detailed
discussion of the 4M, 2M, and ADAM systems can be found in the MTM-1,
and MTM-2 system write-ups, respectively.)
An example operation analysis using manual MTM-V is shown below:
- MARK AND DRILL OPERATION
DESCRIPTION MOTION TMU
Mark workpiece Drill into spindle Put part into vise Crank down drill Set part to drill point Tighten vise by hand Pin to handle - strike - tighten Additional strikes
Start machine Lower drill < 2 revolutions
Process time Stop machine Pin to handle - strike - loosen Open vise & remove piece Remove drill - prying tool Brush chips away Lift wedge
MRA 30 190 H02 40 H02 40 MAC2 50 MAFO 30 SKCO 100 FLA20 110 FLA10 70 MAA2 20 MAC2 50 PT
MAA2 20 FLA20 110 SKA2 70 FLA22 140 BED30 280 HD2 40
TOTAL TMU: 1360
-87-
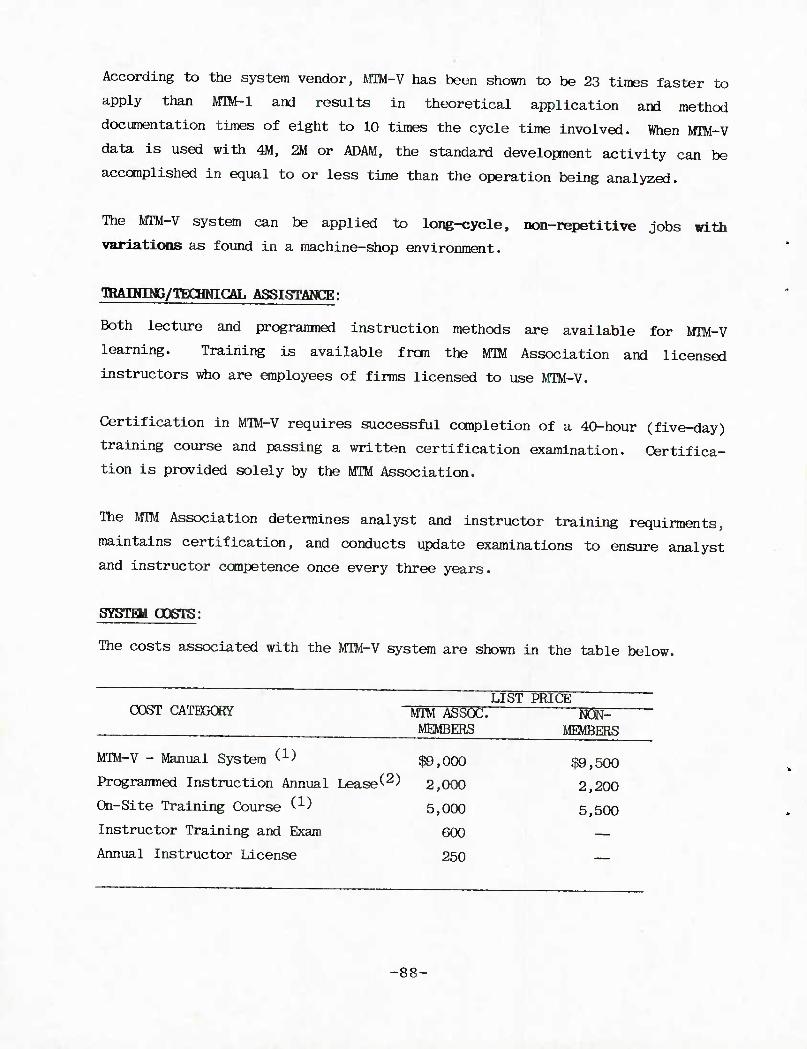
According to the system vendor, MTW-V has been shown to be 23 times faster to
apply than MM-l and results in theoretical application and method
documentation times of eight to 10 times the cycle time involved. When MIM-V
data is used with 4M, 2M or ADAM, the standard development activity can be
accomplished in equal to or less time than the operation being analyzed.
The m^M-V system can be applied to long-cycle, non-repetitive jobs with
variations as found in a machine-shop environment.
TRAINING/TECHNICAL ASSISTAWCE:
Both lecture and progranmed instruction methods are available for MTM-V
learning. Training is available fron the MTM Association and licensed
instructors who are employees of firms licensed to use MTM-V.
Certification in MTM-V requires successful completion of a 40-hour (five-day)
training course and passing a written certification examination. Certifica-
tion is provided solely by the MTM Association.
The MTM Association determines analyst and instructor training requirments,
maintains certification, and conducts update examinations to ensure analyst
and instructor competence once every three years.
SYSTai OOBTTS:
The costs associated with the MIM-V system are shown in the table below.
LIST PRICE COST CATEGORY MTM ASSOC. N(SF~ MEMBERS MEMBERS
MTM-V - Manual System C1) $9,000 $9,500
Programmed Instruction Annual Leased 2,000 2,200
On-Site Training Course W 5,000 5,500
Instructor Training and Exam 600 —
Annual Instructor License 250
-88-
NOTES: (1) Costs stated include training for up to seven
analysts.
(2) Costs stated are for the first year and for the
initial site only.
OOMHJAWCE Wrm MIL STD 1567A:
The MTM-V predetermined time system is in compliance with the specific
requirements set forth in MIL STD 1567A. Based on our review of statistical
backup data provided by the vendor, the system will theoretically generate
standards with an accuracy of at least ±10% at a 90% confidence level. (See
System Accuracy Section). Those specific requirements which have been met are
as follows:
All Type I standards must reflect an accuracy of +10% with a 90% or
greater confidence at the operation level.
Documentation of an operations analysis.
A record of standard practice or method followed when the standard
was developed.
0 A record of rating or leveling.
A record of the standard time computation including allowances.
A record of observed or predetermined time system time values used in
determining the final standard time.
o Provision of an audit trail down to the elemental standard time
level.
-89-
STRENGTHS AND WEAKNESSES:
Strengths and weaknesses and/or constraints identified are based on
discussions with users of the MTM-V predeterroined time system. The coranents
listed below are based on these discussions and, while a broad range of
industries were sampled, coranents should not be considered universal and
therefore may not be applicable to all manufacturing environments:
0 Easy to use.
Cost-effective.
0 Provides accurate standards.
Must use another method for applications not directly related to the machine (i.e., go get blueprint or tools).
SYSTEM USERS:
MTM-V is to be used for the manual portions of machining operations and has
been or is being used in 26 companies representing a variety of industries.
ggnggagaj SOURCE:
MTM Association
-90-
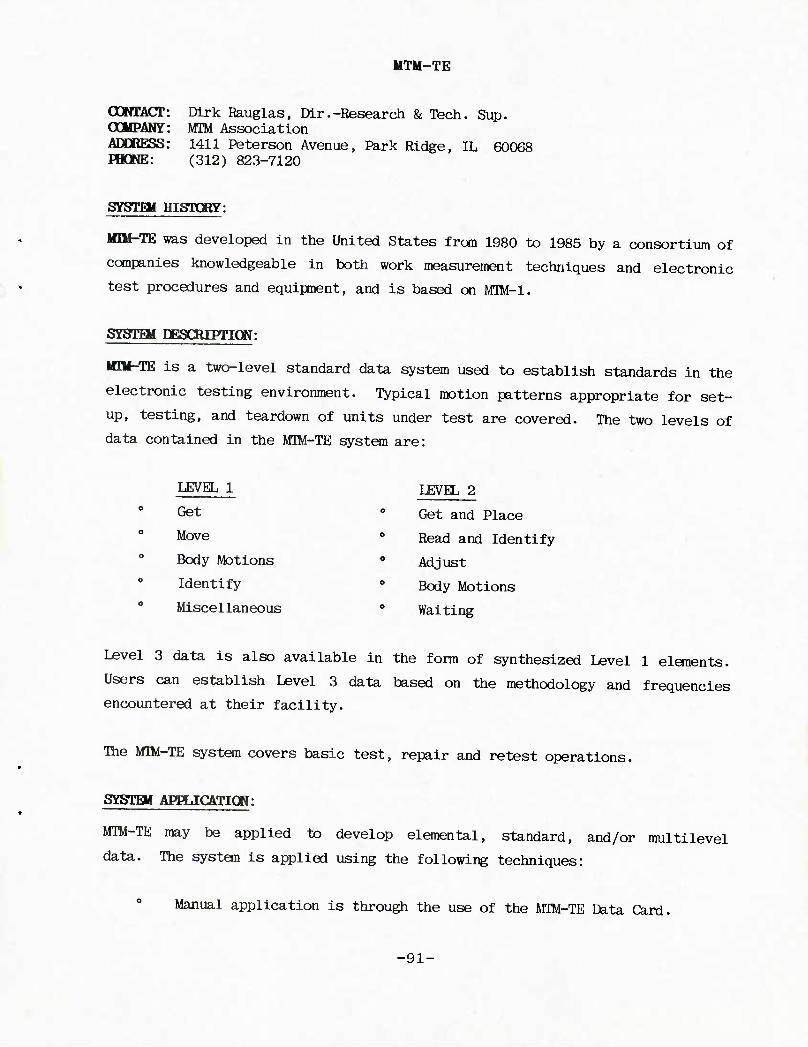
OONTACT OdlPANY ADDRESS
MTM-TE
Dirk Rauglas, Dir.-Research & Tech. Sup. MM Association 1411 Peterson Avenue, Park Ridge, IL 60068
HKWE: (312) 823-7120
SYSTEM HISTORY:
IflM-TE was developed in the United States from 1980 to 1985 by a consortium of
companies knowledgeable in both work measurement techniques and electronic
test procedures and equipment, and is based on MTM-1.
SYSTHi DESCRIPTION:
IflM-TE is a two-level standard data system used to establish standards in the
electronic testing environment. Typical motion patterns appropriate for set-
up, testing, and teardown of units under test are covered. The two levels of
data contained in the MTM-TE system are:
LEVEL 1 LEVEL 2
Get o Get and Place
Move o Read and Identify 0 Body Motions 0 Adjust
Identify • Body Motions 0 Miscellaneous 0 Waiting
L^vel 3 data is also available in the form of synthesized Level 1 elements.
Users can establish Level 3 data based on the methodology and frequencies
encountered at their facility.
The MTM-TE system covers basic test, repair and retest operations.
SYSTEM APHJCATICW:
MTM-TE may be applied to develop elemental, standard, and/or multilevel
data. The system is applied using the following techniques:
Manual application is through the use of the MTM-TE Data Card.
-91-
Autonated application is through the use of the 4M and 2M systems.
The system vendor states that the MSM-TE system is applicable to repetitive
electronic test routines that occur in two-to-10-minute cycle lengths. In
addition, an analyst who is familiar with test operations and related equip-
ment will find the three levels of data easy to apply directly to the detailed
test procedures. The data, however, does not cover "troubleshoot" relative to
electronic test operations. The system does provide guidelines for
investigation and recotimendations for work measurement for this activity.
TOAINING/TECHNICAL ASSISTAWCE:
Lecture, demonstration, and practice exercises are the major training
procedures. Hnployees of the MTM Association are currently the only
authorized instructors, and training in MTM-TE is only available to employees
of firms licensed to use MTM-TE.
Certification requires successful completion of a 32-hour (four-day) course
and passing of a final examination. Certification is provided solely by the
MTM Association.
The MTM Association determines analyst and instructor-training requirements,
maintains certification, and conducts update examinations to assure analyst
and instructor competence once every three years.
S¥STBM COSTS:
System-related costs were not provided by the vendor.
COMHLIANCE WITH MIL gTD 1567A:
The MTM-TE predetermined time system is in compliance with the specific
requirements set forth in MIL.STD.1567A. Based on our review of statistical
backup data provided by the vendor, the system will theoretically generate
standards with an accuracy of at least ±10% at a 90% confidence level. (See
System Accuracy Section). Those specific requirements which have been met are
as follows:
-92-
All Type I standards must reflect an accuracy of +10% with a 90% or
greater confidence at the operation level.
Documentation of an operations analysis.
A record of standard practice or method followed when the standard
was developed.
0 A record of rating or leveling.
A record of the standard time computation including allowances.
A record of observed or predetermined time system time values used in
determining the final standard time.
Provision of an audit trail down to the elemental standard time
level.
STRENGTHS AND WEAKNESSES:
Strengths and weaknesses and/or constraints identified are based an
discussions with users of the MTM-TE predetermined time system. The coranents
listed below are based on these discussions and, while a broad range of
industries were sampled, coranents should not be considered universal and
therefore may not be applicable to all manufacturing environments:
Data was developed from observations and previously developed data in
a broad range of industrial applications and was verified using MTM-
1.
There are three levels of data from which a user can determine which
level is best applicable to his needs.
-93-
The computerized application provides improved speeds, accuracy and
consistency of application, and enables the user to more easily
modify standards, perform mass updates, and develop and analyze
"what-if" methods-improvement scenarios.
Optimum application of the standard data requires that the analyst be
familiar with electronic test equipment and operations.
The system data does not cover automated or computerized electronic
test activities. ■
The third level of data requires initial validation of processes to
ensure that the data included in the standard is consistent with the
operation being analyzed.
SYSTEM USERS:
MTM-TE is being used in eight different companies and is used only within the
electronic testing area.
REFEBEMCE SOURCE:
MTM Association
-94-
CONTACT OlfPANY ADDRESS
MTM-M
Dirk Rauglas, Dir.-Research & Tech. Sup. MTM Association 1411 Peterson Avenue, Park Ridge, IL 60068
PHONE: (312) 823-7120
SYSTHI HISTCBY:
MM-M was developed as a result of a consortium project involving the MTM
Association Magnification Consortium and the Department of Industrial
Engineering at the University of Michigan, conducted during the period of 1968
through 1972.
IflM-M was developed from data collected from the analysis of 20 case studies
in six industrial firms covering 48 operation cycles and is contained in a
computer data bank consisting of 5,000 lines of "sequence" data.
The data was then analyzed and, through the use of statistical techniques,
arranged in tabular data tables for ease of application, supported by
regression equations.
SYSTEM CE8CRIPTI0N:
The MM-M predetermined time system is defined by its vendor as a second-level
functional system of original data, designed for the analysis and measurement
of manual assenbly work performed under stereoscopic nHgnificatioa of 5-to 30-
power.
Elemental data contained in the MTM-M system is directly tied to the portion
of the visual fields concerned and the hand tools employed, with mnemonic
alphabetical coding expressing the variables. Analysis is performed by
utilizing a "direction-of-motion-travel" concept. Consequently, the tables of
data are named for motion direction rather than for the actual motions
performed during the assembly.
MTM-M consists of four major tables and one subtable which contains all of the
data necessary for system application.
-95-
TABLE II (Inside-to-Inside): Contains time data for motions starting and
ending inside the microscopic field of view.
TABLE 10 (Inside-to-Outside): Contains time data for motions starting inside
and ending outside the microscopic field of view.
TABLE 00 (Qitside-to-Outside): Contains time data for motions starting and
ending outside the microscopic field of view.
TABLE 01 (Outside-to-Inside): Contains time data for motions starting outside
and ending inside the microscopic field of view.
TABU? IF (Iirfield-to-Final-Tkrget): Contains time data for motions continuing
inside the microscopic field of view and ending at the final target.
The selection of the appropriate data from the data tables is determined by
considering four variables:
• Type of Tool: Four types of tools are provided for in the data:
Grasping, Probing, Cutting, and Stripping.
0 Cbndition of Tool: Tools may be either Empty or Loaded.
0 Terminating Characteristic of the Motion: The only transporting motion is
Move, since tools are always used (fingers are considered a tool).
Consequently, Reaches need not be considered, and moves are terminated
either by a Grasp or by a Release.
0 Distance/Tolerance Ratio: Is defined as the ratio of the distance moved
to the total clearance (tolerance) at the end of the motion. This ratio,
in effect, describes the degree of difficulty of positioning at the end of
the move. The data tables contain a number of ranges into which a given
distance/tolerance ratio may fall.
■9G-
SYSTBt AFHJGATICW:
MTM-M may be applied to develop elemental, standard, and/or multilevel data.
The system may be applied using the following techniques:
Manual application through the use of the MTM-M Data Card.
Automated application through the use of MTM-4M or M™-2M.
MTM-M is for use in developing standard times for assenbly work performed
under a microscope (stereoscopic) at magnifications of 5- to 30-power. The
system is best suited for short-cycle repetitive operations.
TRAINING/TECHNICAL ASSISTANCE:
A lecture fonnat is used for MIW-M learning. Training is available from the
MTM Association and licensed instructors employed by fims who are licensed to
use MTM-M. Training is only available to employees of firms licensed to use
Mm-M.
Certification in the application of MTM-M requires successful completion of a
40-hour lecture, demonstration, and application course, and passing a certifi-
cation examination administered by the MTM Association.
The MTM Association deteraiines analyst and instructor training requirements,
maintains certification, and conducts update examinations to assure analyst
and instructor competence once every three years.
-97-
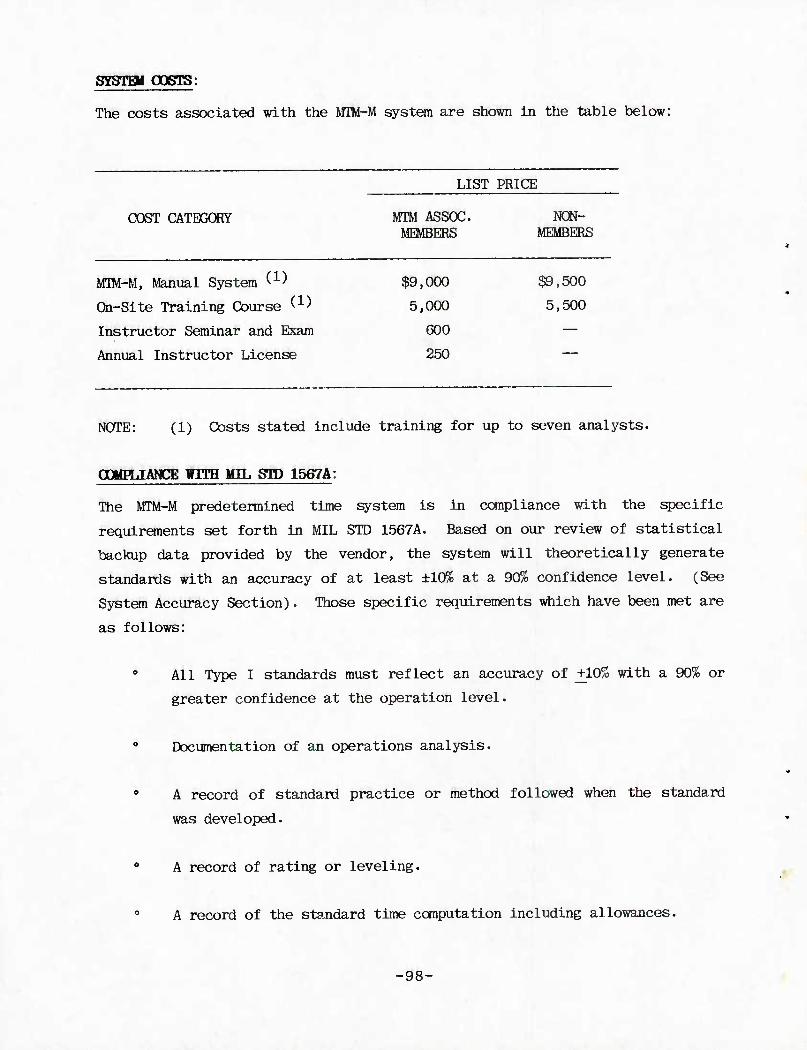
SYSTHi OOgTS:
The exists associated with the MTM-M system are shown in the table below:
COST CATEGORY
M1M-M, Manual System (1)
On-Site Training Course ^
Instructor Seminar and Exam
Annual Instructor License
LIST PR ICE
MTM ASSOC. NON- MEMBERS MEMBERS
$9,000 $9,500
5,000 5,500
600 —
250 —
NOTE: (1) Costs stated include training for up to seven analysts.
OOMHJAHCE WITH MIL STD 1567A:
The MTM-M predetermined time system is in compliance with the specific
requirements set forth in MIL STD 1567A. Based on our review of statistical
backup data provided by the vendor, the system will theoretically generate
standards with an accuracy of at least ±10% at a 90% confidence level. (See
System Accuracy Section). Those specific requirements which have been met are
as follows:
0 All Type I standards must reflect an accuracy of +10% with a 90% or
greater confidence at the operation level.
0 Documentation of an operations analysis.
0 A record of standard practice or method followed when the standard
was developed.
0 A record of rating or leveling.
0 A record of the standard time computation including allowances.
-98-
A record of observed or predetermined time system time values used in
determining the final standard time.
Provision of an audit trail down to the elemental standard time
level.
STRBCEBS AND WEAKNESSES:
Strengths and weaknesses and/or constraints identified are based on
discussions with users of the MTM-M predetermined time system. The coranents
listed below are based on these discussions and, while a broad range of
industries were sampled, comments should not be considered universal and
therefore may not be applicable to all manufacturing environments:
Accurate and appropriate in the application of microscopic work.
Provides for the difference in time required to perform an operation
imder varied degrees of magnification.
MIM Association training includes instruction in methods analysis
specific for microscopes and in the care and use of a microscope.
0 Time-consuming to use.
Good only for magnifications of 30X or less.
SySTEM CSEBS:
MTM-M is currently being used by nine companies in 15 locations and is used
only for stereoscopic assembly.
REFERHCE SODBCE:
MTM Association
-99-
OONTACT OGHPANY ADCflESS
MANPRO'"
Herbert R. Wilkes, President Methods Management 2801 Morgan Territory Road, Clayton, CA 94517
PHONE: (415) 672-3431
SYSTTHI HISTORY:
MANPHtr was developed from micromotion films as a manual predetermined
universal work-measurement system in the early 1960s. The system was further
refined and conputerized in the early 1970s as an in-house consulting tool.
The initial computerization of MANPRO1" was done on a large scale time-sharing
system. In the early 1980s, Methods Management licensed canpanies to utilize
the system as end-users, and in 1986 the MANPRO" system was tailored to run on
IBM personal computers as a stand-alone product.
The evolution of the system was the result of the combined efforts of Methods
Management personnel and computer experts, and its data bases embody 20 years
of industrial and manufacturing exposure.
SYSTai DESCRIPTIOW:
M&NRHO", an acronym for MANufacturing IBOductivity, is a raicroconputer
software program and data base used to analyze and document work activities in
manufacturing, fabrication, process control, test, maintenance, service and
clerical environments, and to generate engineered time standards.
Methods analyses and standards development performed by utilizing the MANPRO"
system are based on the system's Basic Motion and Assentoly Data. This set of
work elements covers the majority of motions performed during general setup,
material retrieval/handling, manual assembly and disassembly, tool use, and
inspection activities. In addition, a variety of standard data packages,
built from the Basic Motion and Assembly Data, and covering a variety of
industrial activities, are available to be used during the standards
development process. Standard data packages available include:
• Mechanical and Electronic Assenfcly
•100-
Printed Circuit Board and Hire/Cable Assenfcly
Sheet Metal Fabrication
Machining Operatioas
Janitorial Services
large-scale Systems Integration
Semiconductor Wafer Fabrication
In addition to these work elements, the MANPRO" system allows the user to
create specialized classifications of "nonstandard" elements identified during
the analysis of performed work.
The MANPRCT system also accepts and manipulates standard data developed by
utilizing other work measurement systems. Similarly, historical or estimated
time elements may be entered into the system to support interim labor
monitoring, while engineered standards are being developed.
Each element contained in the Basic Motion and Assembly Data and standard data
packages incorporates allowances to account for work environment
(normalization), and for personal, fatigue and delay considerations.
Additional user-defined allowances can be added as required. These allowances
can be adjusted depending upon the environment and user preference.
The MANPRO™ system utilizes four major time classifications to identify work required in performing a given activity:
o Direct Labor: Manual labor that directly contributes to the production of
each unit of a product. Elements in this category are totaled into the
overall standard time.
Process Time: Machine-cycle time or process-controlled time involved in
the unit production of a product. These elements are also totaled
directly into the overall standard.
-101-
Internal Labor: Any manual labor performed within the limits of a
machine-controlled cycle. This category of time is not included in the
overall standard unless the internal labor time for an activity exceeds
the process time, in which case the excess time is accounted for as direct
labor.
Setup Tune: Overhead labor expended to prepare for a job prior to actual
production. This time is totaled separately from the overall per-unit
standard, unless the user desires prorating the setup time on a per-unit-
of-output basis.
To accommodate those types of activities which derive their times from
formulas and/or tables of values, the MANPHO" system has the capability to
accept user-defined formulas. This is particularly true for machine-shop
activities where the data has been "distilled" to simplify its use, using such
schemes as broad material classifications, tool-bit classifications, finish
and speeds/feeds groupings (including embedded safety factors), and other
application rules.
In order to define standard terminology used by the user's specific industry
and environment, the MANPRO™ system utilizes a "Ncraenclature Dictiona^y,,. A
generalized data set of industrial terminology is included with the system as
a base from which the user may add to and subtract from to create a customized
vocabulary.
Major reports and features of the MANPRO™ system are summarized below:
0 Operation Smmary - a compilation, from individual standard method
analyses, of work-center and description information, and setup and run-
time standards for each operation within a part, to produce a router or
traveler.
t
-102-
• "What-if" Analyses - Methods Lnprovesaent - the modification of operational
sequences, insertion, and deletion of items of work, changing of factors,
etc., can be analyzed and reports can be generated to show the before,
after and net-change time figures for the standard.
Where-used Reports - a compilation of elemental usage statistics to
evaluate what the total impact editing an element would have on current
standards and operations.
0 Methods Detail Report - a detailed printout of methods sequences.
Summary Listings - report which presents only the overall description and
time sunmary for either the total standard or matching operations.
0 Batch Editing Ovrer the Entire Standards Base - allows for editing the
universe of specific standards in a single batch edit.
SYSTHi APHJCATIOW:
MANPRO", as described by its vendor, is a specialized, precise, flexible
"language" which can be used to describe the sequence of events required to
perform activities. The language consists of two basic components: "verbs,"
or elements of work and motion, and "nouns," the objects which are worked or
acted upon. MANPRO" uses the terminology "WORK KLEMHNTS" and "NOMENCLATURE
INSERTS," respectively. These are combined to form complete descriptive
phrases which accurately document each step in the work sequence or process
being analyzed. To illustrate, the following example has been prepared:
Element (verbs): Pickup and Move * to ♦ (20-30") +
Insert (nouns): Air-driver, Bench
Oompleted Fbrase: Pickup and Move Air-driver to Bench
-103-
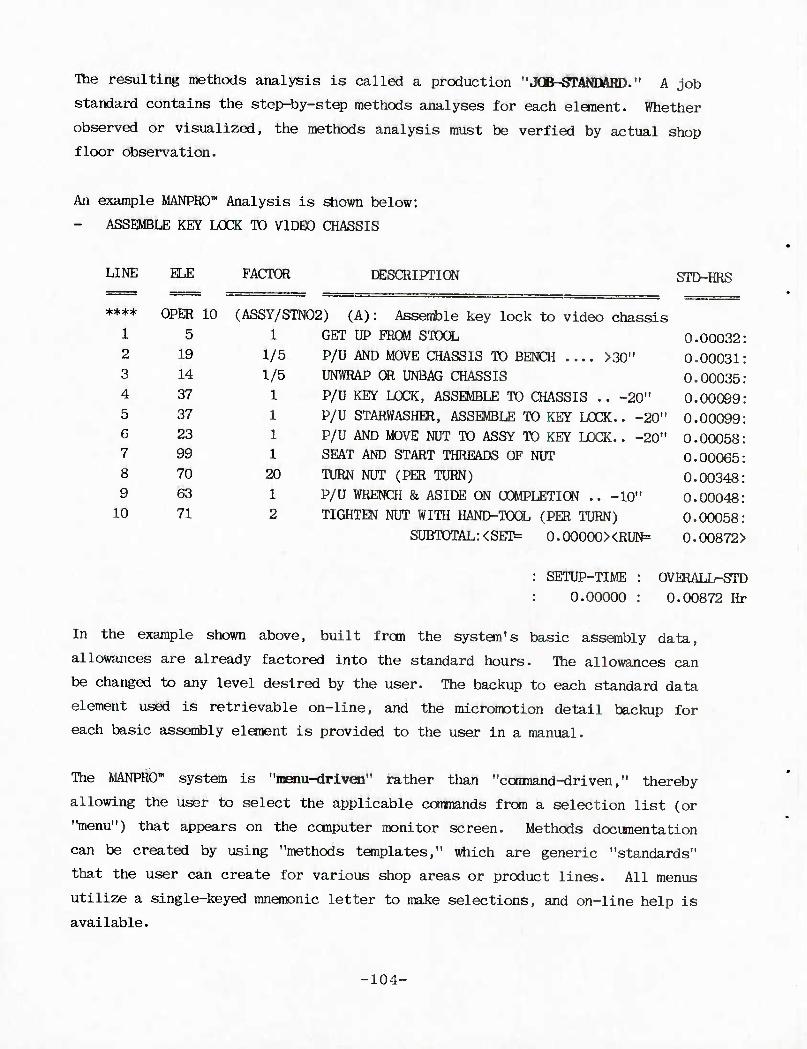
The resulting methods analysis is called a production "JOB-STANDARD." A job
standard contains the step-by-step methods analyses for each element. Whether
observed or visualized, the methods analysis must be verfied by actual shop
floor observation.
An example MANPRO™ Analysis is shown below:
ASSEMBLE KEY LOCK TO VIDEO CHASSIS
LINE
1
2
3
4
5
G
7
8
9
10
ELE FACTOR DESCRIPTION STD-HRS
5
19
14
37
37
23
99
70 63
71
OPER 10 (ASSY/STN02) (A): Assemble key lock to video chassis
1 GET UP FROM STOOL 0.00032:
1/5 P/U AND MOVE CHASSIS TO BENCH >30" 0.00031
1/5 UNWRAP OR UNBAG CHASSIS 0.00035:
1 P/U KEY LOCK, ASSEMBLE TO CHASSIS .. -20" 0.00099;
1 P/U STARWASHER, ASSEMBLE TO KEY LOCK.. -20" 0.00099;
1 P/U AND MOVE NUT TO ASSY TO KEY LOCK.. -20" 0.00058; 1 SEAT AND START THREADS OF NUT 0.00065;
20 TURN NUT (PER TURN) 0.00348:
1 P/U WRENCH & ASIDE ON COMPLETION .. -10" 0.00048:
2 TIGHTEN NUT WITH HAND-TOOL (PER TURN) 0.00058:
SUBTOTAL:<SET= 0.00000><RUN= 0.00872>
SETUP-TIME
0.00000 OVERALL-STD
0.00872 Hr
In the example shown above, built from the system's basic assembly data,
allowances are already factored into the standard hours. The allowances can
be changed to any level desired by the user. The backup to each standard data
element used is retrievable on-line, and the micromotion detail backup for
each basic assembly element is provided to the user in a manual.
The MANPRO1" system is "menu-driven" rather than "command-driven," thereby
allowing the user to select the applicable commands from a selection list (or
"menu") that appears on the computer monitor screen. Methods documentation
can be created by using "methods templates," which are generic "standards"
that the user can create for various shop areas or product lines. All menus
utilize a single-keyed mnemonic letter to make selections, and on-line help is
available.
-104-
The MANPRO" system operates on an IBM-PC/XT or similar IBM-compatible
computer. Basic hardware requirements include at least one floppy-disk drive
and one 10-megabyte fixed disk. A practical memory requirement is 512K bytes,
as the MANPRCr system requires approximately 384K bytes of available memory in
order to execute.
The system can be applied to both stoort- and long-cycle Jobs, whether highly
repetitive with no method variations, or non-repetitive with method
variations.
Although the time may vary depending upon the skill level of the user, the
vendor estimates that the time required to develop a job standard using
MANPHCr is approximately equal to the time required to perform the activity
being studied, assuming the method has been observed and elements documented.
For users who are already using other predetermined time systems. Methods
Management has performed translations of its basic MANPRO™ system data in
terms of some of the other systems. This data may be purchased as reference
manuals.
mAINING/TBCHNICAL ASSISTANCE:
The vendor, Methods Management, provides on-site instruction and training for
potential users and management personnel during the installation period. This
on-site instruction covers the use of the system programs and the application
of the MANPRO Basic Data, and includes 40 hours of instructional time.
-105-
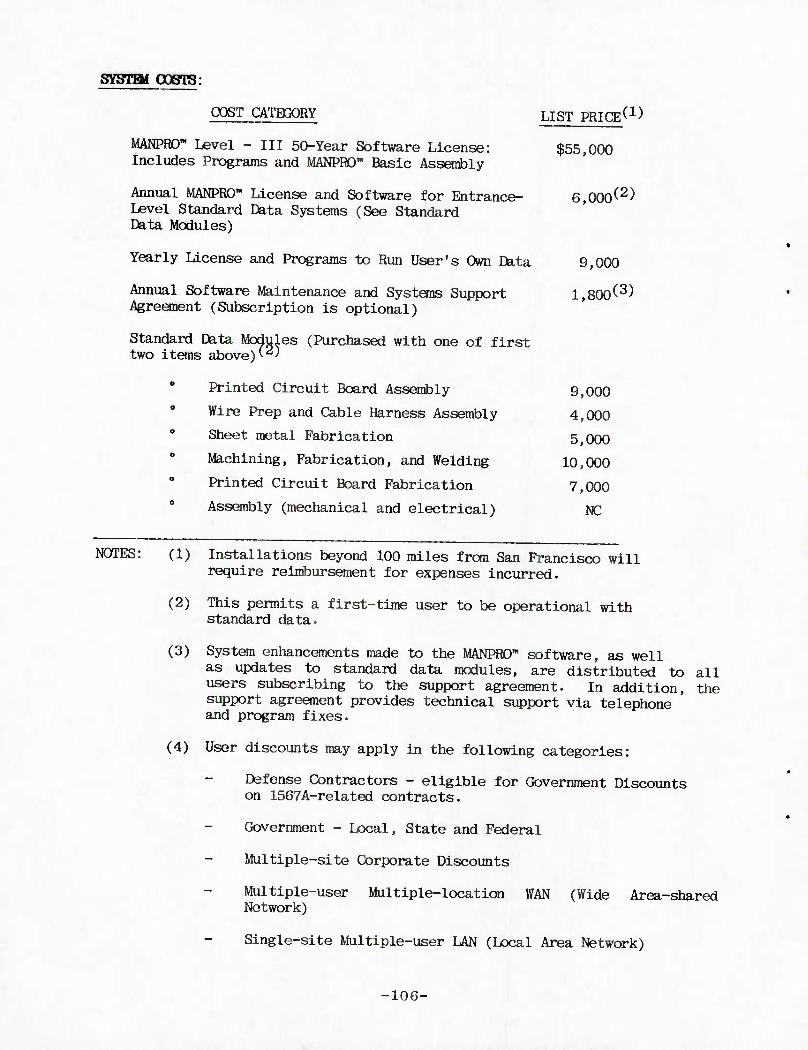
SYsrai POSTS:
COST CATEGORY LIST PRICE C1)
MANPRO™ I^vel - III 50-Year Software License: $55,000 Includes Programs and MANPRO" Basic Assembly
Annual MANPRO" License and Software for Entrance- G.OOO^2) Level Standard Data Systems (See Standard Data Modules)
Yearly License and Programs to Run User's Own Data 9,000
Annual Software Maintenance and Systems Support l,80o(3) Agreement (Subscription is optional)
Standard Data Modules (Purchased with one of first two items above)^
Printed Circuit Board Assembly 9,000
Wire Prep and Cable Harness Assembly 4,000
Sheet metal Fabrication 5,000
Machining, Fabrication, and Welding 10,000
Printed Circuit Board Fabrication 7,000
Assembly (mechanical and electrical) NC
NOTES: (1) Installations beyond 100 miles frcra San Francisco will require reimbursement for expenses incurred.
(2) This permits a first-time user to be operational with standard data.
(3) System enhancements made to the MANPRO" software, as well as updates to standard data modules, are distributed to all users subscribing to the support agreement. In addition, the support agreement provides technical support via telephone and program fixes.
(4) User discounts may apply in the following categories:
Defense Contractors - eligible for Government Discounts on 1567A-related contracts.
Government - Local, State and Federal
Multiple-site Corporate Discounts
Multiple-user Multiple-location WAN (Wide Area-shared Network)
Single-site Multiple-user LAN (Local Area Network)
-106-
OOMFLIANCE WITH MIL STD 1567A:
The MANPRO" predetermined time system is in compliance with the specific
requirements set forth in MIL STD 1567A. Based on our review of statistical
backup data provided by the vendor, the system will theoretically generate
standards with an accuracy of at least ±10% at a 90% confidence level. (See
System Accuracy Section). Those specific requirements which have been met are
as follows:
All Type I standards must reflect an accuracy of ± 10% with a 90% or
greater confidence at the operation level.
Documentation of an operations analysis.
A record of standard practice or method followed when the standard
was developed.
0 A record of rating or leveling.
A record of the standard time computation including allowances.
A record of observed or predetermined time system time values used in
determining the final standard time.
Provision of an audit trail down to the elemental standard time.
STBtMGTBS AND WEAKNESSES:
Strengths and weaknesses and/or constraints identified are based on
discussions with users of the MANPRO" predetermined time system. The comnents
listed below are based on these discussions and, while a broad range of
industries were sampled, connents should not be considered universal and
therefore may not be applicable to all manufacturing environments:
A computerized system which provides improved speed, accuracy, and
consistency of application, and which enables the user to more easily
-107-
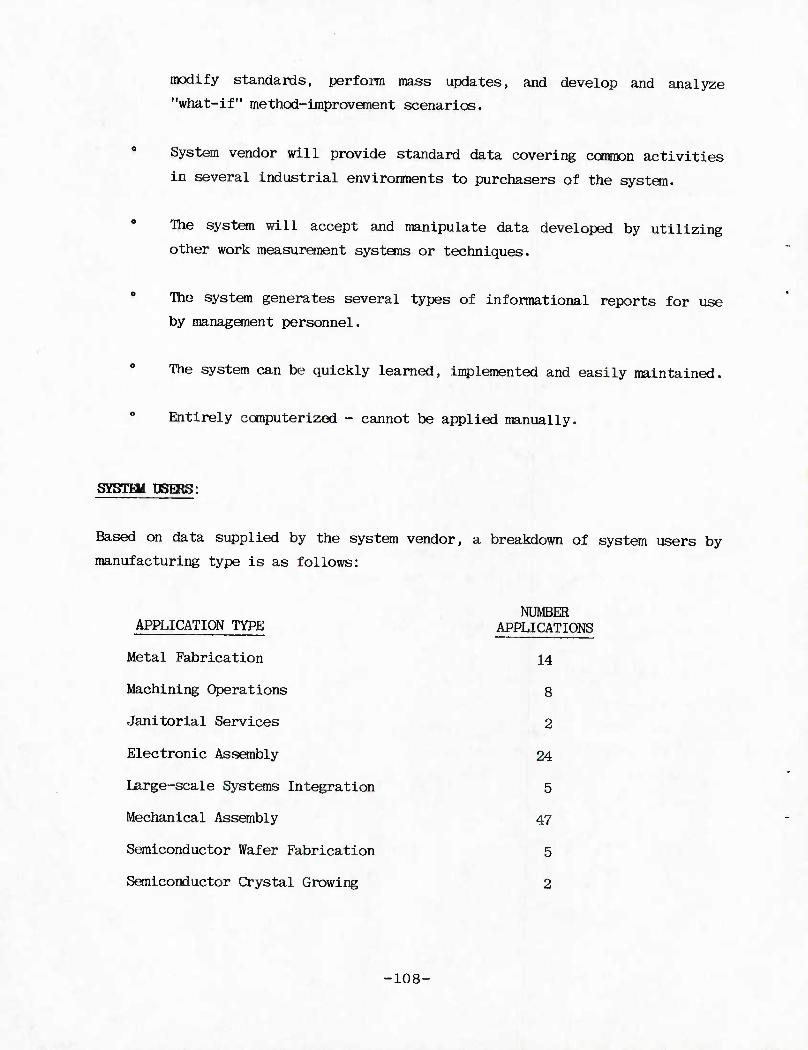
modify standards, perform mass updates, and develop and analyze
"what-if" method-improvement scenarios.
System vendor will provide standard data covering coranon activities
in several industrial environments to purchasers of the system.
The system will accept and manipulate data developed by utilizing
other work measurement systems or techniques.
The system generates several types of informational reports for use
by management personnel.
The system can be quickly learned, implemented and easily maintained.
0 Entirely computerized - cannot be applied manually.
SYbTm OSEBS:
Based on data supplied by the system vendor, a breakdown of system users by
manufacturing type is as follows:
NUMBER APPLICATION TYPE APPLICATIONS
Metal Fabrication 14
Machining Operations 8
Janitorial Services 2
Electronic Assembly 24
Large-scale Systems Integration 5
Mechanical Assembly 47
Semiconductor Wafer Fabrication 5
Semiconductor Crystal Growing 2
■108-

REFERENCE SOURCE:
Methods Management
-109-
BASIC MOST® SYSTEMS
OONTACT: Kjell B. Zandin, Senior Vice President COMPANY: HB Maynard & Co., Inc. ADDBBSS: 235 Alpha Drive, Pittsburgh, PA 15238 FHONE: (412) 963-8100
SYSTOI HISTGeY:
The development of the Basic MOST® System began in the late 1960s under the
direction of the Swedish Division of HB Maynard and Conpany.
The development was the result of an extensive review of MM data in which it
was detected that similarities existed in the sequence of MTM-defined motions
whenever any object was handled. It was found that the same set of basic
motions were used for the same general sequence, raising questions as to
whether this phenomenon could be used to develop a new way to analyze methods
and to measure operations.
Over the next several years, it was determined that the movement of objects
follows certain consistently repeating patterns, such as reach, grasp, move,
and position. These patterns were identified and arranged as a sequence of
events (or subactivities) followed in moving an object. This concept provided
the basis for the MOST® sequence models.
The development initially focused on the isolation and development of nodels
for three motion sequences that could be used to analyze and measure prac-
tically all manual work. later, three additional sequences were developed to
analyze material-handling activities which required mechanical assistance.
Based on MIM data and statistical methods, a set of several index numbers was
developed for use with the sequence models. Utilizing these developments, the
data required to develop Basic MOST® was extracted. Application procedures
were tested in a variety of industries in Sweden and Western Europe.
In 1977, the development of a computer application for Basic MOST® was
initiated. Over the years, the ccraputer system has been continually updated
to its present form which allows the system to be run on mainframe, mini-,
micro-, and/or personal computers.
■110-
SYSTEM EESCRIPTION:
Basic HOST® (Maynard Operation Sequence Technique) is one member of the MOST®
family of predetermined time systems whose basis is to concentrate on the
displacement of objects under the pretnise that units of work are organized for
the purpose of accomplishing some useful result through the movement of
objects. Basic MOST® was designed to measure activities which may vary in
method, covering operations considered to be of average length (normally in
the range of five seconds to five minutes) and which can be applied either
manually or with the use of a computer.
The primary work units are fundamental activities (collections of basic
motions) dealing with the movement of objects. Each of these activities are
described in terras of subactivities fixed in a sequence. Consequently, the
basic pattern of an object's movement is described by universal sequence
models instead of random, detailed basic motions.
The system ascertains that objects are moved in only one of two ways, result-
ing in a different sequence of events; therefore, a separate MOST® activity
sequence model applies. When tools are used, an activity sequence model is
used which allows for the movement and use of a hand tool through a standard
sequence of events.
The Basic MOST® technique is comprised of three basic sequence models:
0 General Move Sequence 0 Controlled Move Sequence
Obol Use Sequence
In addition to the three basic sequence models, an equipment-handling sequence
is available to analyze the raoveraent of heavy objects which require a manually
operated crane (i.e., jib crane).
The sequence models, in addition to describing the motions employed, provide
the total time value for the activities by using index numbers. An index
number is placed after each subactivity in the sequence and represents the
time allowed for that subactivity. The tables shown on the Basic MOST® data
card serve as a reference for identifying the appropriate index values.
-Ill-
According to the system vendor, with Basic MOST®, the analyst does not have to
make "judgment" calls, thereby reducing potential variations and application
errors in applying the system. In applying the system, it is essential that
the workplace and method be well-documented. After conpleting the analysis,
the system assists the analyst in identifying inefficient methods and
potential improvements of the work conditions.
Basic MOST® uses an approach based on a simple construction and the grouping
together of basic motions that frequently occur in sequence. In addition, the
system requires the identification of only seven subactivities, with sequence
models preprinted on the analysis form, requiring the analyst only to fill in
the variable index numbers.
As a computerized system, it offers the major advantage of being consistent in
application through the use of key words to describe methods. The method
description and key words signal the computer as to which sequence model
should be used and which values should be applied, thereby eliminating errors
in calculations. Also, the computer system provides the ability to edit any
data, work-area information, or standards that have been previously input or
calculated. In addition, this provides the engineer with the ability to
simulate potential improvements based on method or work-area changes.
SYSTHI APHJCATION:
Basic MOST® has the capability to be applied either manually or in a
computerized form. Although the same basic principles apply, the method of
application varies as follows:
MANUAL:
To apply the Basic MOST® system, the applicator must first observe and
document the workplace and operation method. If visualized, the method
must be verified by actual shop floor observation. Once the method has
been documented, the appropriate sequence model is selected for each
method step from the following:
General Move Controlled Move Tool Use
-112-
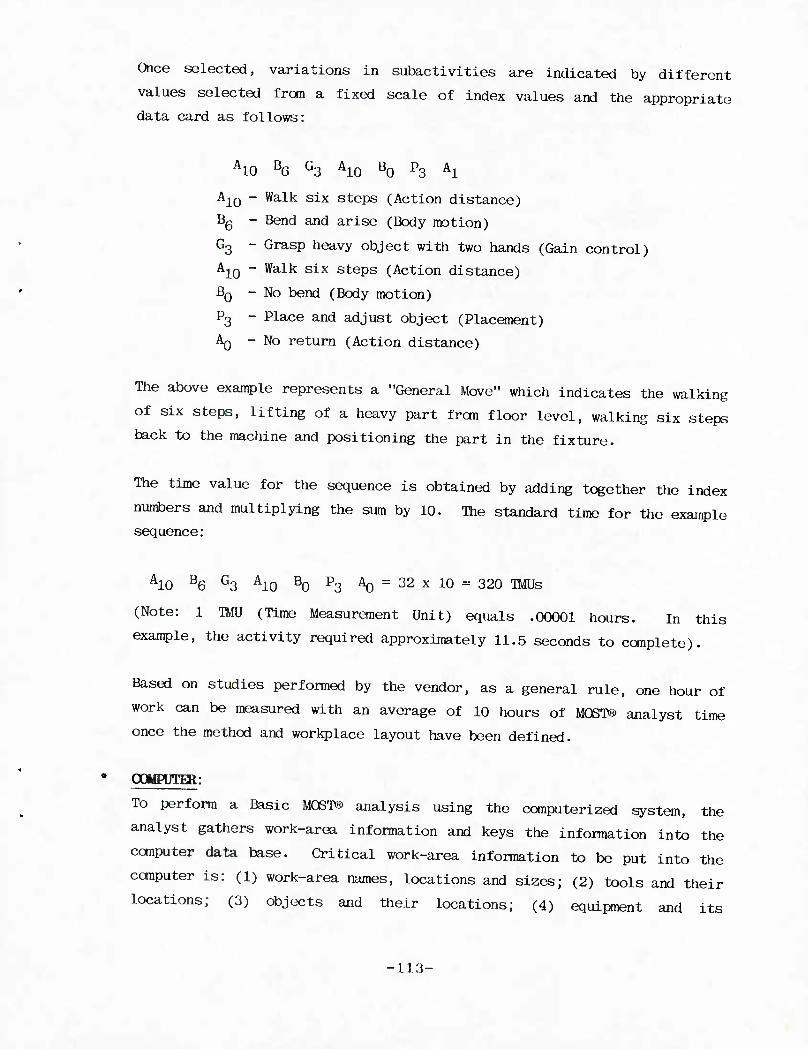
Once selected, variations in subactivities are indicated by different
values selected from a fixed scale of index values and the appropriate
data card as follows:
A10 BG G3 A10 B0 P3 Al
A10 - Walk six steps (Action distance)
BQ - Bend and arise (Body motion) G3 ~ GrasP heavy object with two hands (Gain control) A10 " Walk six stePs (Action distance)
BQ - No bend (Body motion)
P3 - Place and adjust object (Placement)
AQ - No return (Action distance)
The above example represents a "General Move" which indicates the walking
of six steps, lifting of a heavy part from floor level, walking six steps
back to the machine and positioning the part in the fixture.
The time value for the sequence is obtained by adding together the index
numbers and multiplying the sum by 10. The standard time for the example
sequence:
A10 B6 G3 A10 B0 P3 ^ = 32 x 10 = 320 TMUs
(Note: 1 UlU (Time Measurement Unit) equals .00001 hours. In this
example, the activity required approximately 11.5 seconds to complete).
Based on studies performed by the vendor, as a general rule, one hour of
work can be measured with an average of 10 hours of UOBT® analyst time
once the method and workplace layout have been defined.
OOMPOTHt:
To perform a Basic MOST® analysis using the computerized system, the
analyst gathers work-area infomation and keys the information into the
computer data base. Critical work-area information to be put into the
computer is: (1) work-area names, locations and sizes; (2) tools and their
locations; (3) objects and their locations; (4) equipment and its
•113-
location, along with appropriate process times; (5) operator(s) and
starting location(s), and body motions associated with particular work-
places and the distance (in steps) between workplaces.
The activity being studied is documented in sentence format, starting with
a "key word" that designates to the canputer the sequence model to be
used, as well as the values for selected sequence parameters. Key words,
and the method descriptions, conform to basic English sentence structure
and engineering terminology. Utilizing the key words and the work-area
data, the canputer calculates the standard time for the activity being
studied.
It is the vendor's belief that the Basic MOST® canputer system is two to
five times faster than the manual application.
Hardware requirements for the Basic MOST® computer systems vary depending
on the user's needs. Software is available for personal computers, the
IBM XT, AT or compatible microcomputers, and for Digital Equipment
Corporation's minicomputer systems (VAX). An IBM mainframe version is
under development.
Basic MOST®, both manual and computerized, has been applied in a variety
of industries including metalworking, foundries, railcar manufacturing,
textiles, shipbuilding, aerospace and commercial aircraft, automotive,
food processing, agricultural and construction equipment manufacturing,
furniture manufacturing, and steel production.
Basic MOST® was designed to be applied to work in which the method can be
defined and described, and which requires setting labor standards. Such
applications can involve methods which are either repetitive or non-
repetitive and short- or long-cycles with or without variations. However,
Basic MOST® is not recomnended to be used for highly repetitive, short-
cycle operations or for long-cycle, nonidentical operations. (See
separate write-ups on Mini MOST® and Maxi MOST®).
-114-
TRAINING/TECHNICAL ASSISTANCE:
To use the manual Basic MOST® System, the analyst must be certified by
completing a 40-hour training course, which can be acconplished through a
variety of training alternatives:
A 40-hour lecture or self-paced course at one of HB Maynard's two training
facilities.
A 40-hour lecture course taught by HB Maynard personnel at the client's
facility.
A 40-hour lecture course taught by a licensed client instructor.
A self-paced program with guidance from a licensed client instructor.
To become certified in the Basic MOST® computer system, the analyst must first
be certified in manual Basic MOST® and then certified in conputerized Basic
MOST® by completing a 40-hour training course available through the same
variety of alternatives listed above, except that all computer-system training
is lecture-style.
Regardless of the training method selected, a final exam must be taken which
is evaluated by HB Maynard personnel. Based on a score of 75% or greater, the
student is certified. Recertification is required every four years.
HB Maynard personnel are available at the training centers to provide
technical assistance to all clients.
-115-
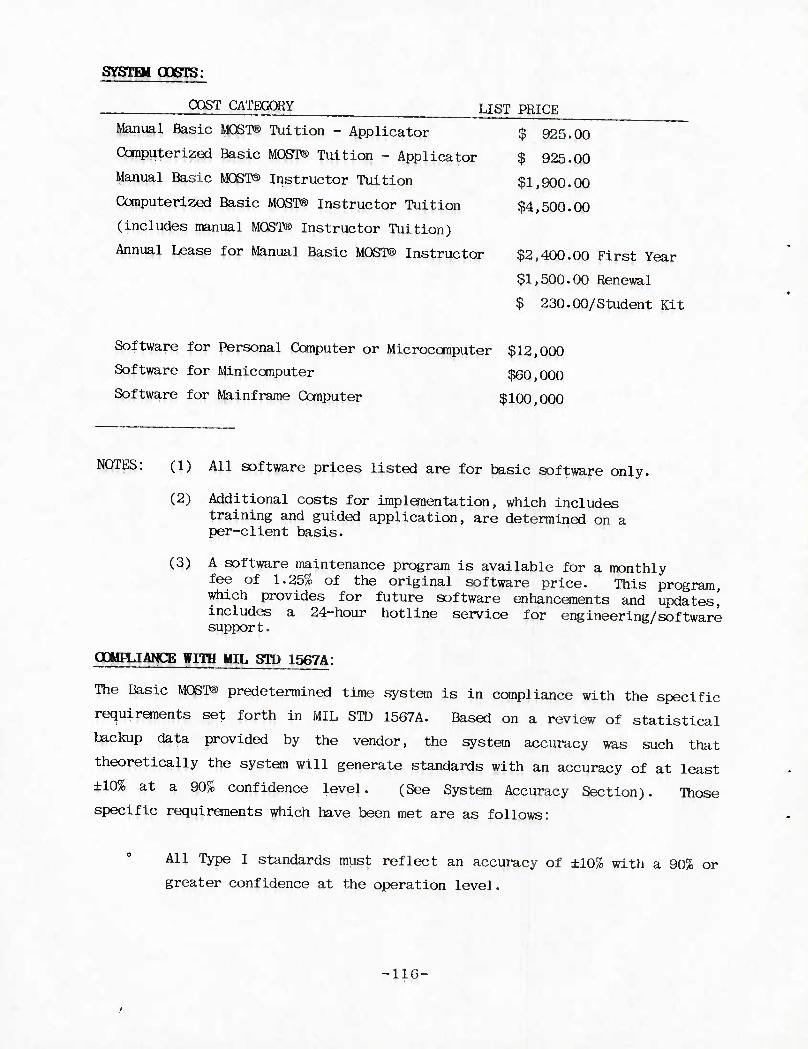
SYSTEM OOSTS:
COST CATEGORY LIST pRICE
Manual Basic MOST® Tuition - Applicator $ 925.00
Computerized Basic MOST® Tuition - Applicator $ 925.00
Manual Basic MOST® Instructor Tuition $1,900.00
Computerized Basic MOST® Instructor Tuition $4,500.00
(includes manual MOST® Instructor Tuition)
Annual Lease for Manual Basic MOST® Instructor $2,400.00 First Year
$1,500.00 Renewal
$ 230.00/Student Kit
Software for Personal Computer or Microcomputer $12,000
Software for Minicomputer $60,000
Software for Mainframe Computer $100,000
NOTES: (1) All software prices listed are for basic software only.
(2) Additional costs for implementation, which includes training and guided application, are determined on a per-client basis.
(3) A software maintenance program is available for a monthly fee of 1.25% of the original software price. This program, which provides for future software enhancements and updates,' includes a 24-hour hotline service for engineering/software support.
ODMHJANCE WITH MIL STD 1567A:
The Basic MOST® predetermined time system is in compliance with the specific
requirements set forth in MIL STD 1567A. Based on a review of statistical
backup data provided by the vendor, the system accuracy was such that
theoretically the system will generate standards with an accuracy of at least
±10% at a 90% confidence level. (See System Accuracy Section). Those
specific requirements which have been met are as follows:
All Type I standards must reflect an accuracy of ±10% with a 90% or
greater confidence at the operation level.
-11G-
0 Documentation of an operations analysis.
A record of standard practice or method followed when the standard
was developed.
0 A record of rating or leveling.
A record of the standard time computation including allowances.
A record of observed or predetermined time system time values used in
determining the final standard time.
Provision of an audit trail down to the elemental standard time
level.
STRENGTHS AND WEAKNESSES:
Strengths and weaknesses and/or constraints identified are based on
discussions with users of the BASIC MOST® predetermined time system. The
comments listed below are based on these discussions and, while a broad range
of industries were sampled, comments should not be considered universal and
therefore may not be applicable to all manufacturing environments:
0 Easy to learn.
0 Fast application time.
Sequence model provides a good methods-analysis tool. Time is a function of method.
Easy to identify time/cost reductions.
0 Standards are traceable to the method.
Not applicable to very short-cycle, highly repetitive operations.
No specific factors for weight considerations although method of application can be adjusted.
Computerized, key words used do not always match the shop-floor language.
-117-
SYSTEM USERS:
Based on information provided by the vendor, manual Basic MOST® is currently
being utilized by approximately 6,000 companies, with more than 100 conpanies
using the computerized version, in a variety of industries including:
0 Aerospace » Automotive 0 Electronics 0 Defense 0 Metal Fabrication & Removal 0 Food Processing 0 Textiles 0 Foundries 0 Furniture • Shipbuilding
" Forging/Casting 0 Utilities 0 General Assembly 0 Finance 0 Farm and Construction Equipment " Medical 0 Warehouse
BEFFKENCE SOURCE:
HB Maynard & Company, Inc.
-118-
MINI MOST® SYSTEMS
OONTACT: Kjell B. Zandin, Senior Vice President COMPANY: HB Maynard & Co., Inc. ADDRESS: 235 Alpha Drive, Pittsburgh, PA 15238 PHONE: (412) 9G3-8100
SYSTEM HISTORY:
See BASIC MOST® for detailed history explanation.
SYSTEM DESCRIPTIOW:
Mini MOSTS) (Maynard Operation Sequence Technique) is one member of the MOST®
family of predetermined time systems whose basis is to concentrate on the
displacement of objects under the premise that units of work are organized for
the purpose of accomplishing sane useful result through the movement of
objects. Mini MOST was specifically designed to measure identical, short-
cycle operations to be applied either manually or with the use of a computer.
The priinary work units are fundamental activities (collections of basic
motions) dealing with the movement of objects. Each of these activities is
described in terras of subactivities fixed in a sequence. Consequently, the
basic pattern of an object's movement is described by two universal sequence
models instead of random, detailed basic motions.
The system ascertains that objects are moved in only one of two ways,
resulting in a different sequence of events; therefore, two separate MOST®
activity sequence models apply.
The Mini MOST® technique is comprised of the following two basic sequence
models: 0 General Move Sequence
• Oontrolled Move Sequence
The sequence models, in addition to describing the motions employed, provide
the total time value for the activities by using index numbers. The index
numbers are placed after each subactivity in the sequence and represent the
time allowed for that subactivity. The tables shown on the Mini MOSTS* data
card serve as a reference for identifying the appropriate index values.
-119-
In Mini MOST®, different motion combinations have different degrees of
difficulty for simultaneous performance. Therefore in addition to the two
basic sequence models, the Mini MOST® data card has a "Simultaneous Motion
Guide" on the back to assist the user in making decisions on whether
simultaneous motions should take place. The three control levels listed on
this card refer to the mental and visual control the operator must exercise to
complete the activity.
Mini MOSTS) is based on only one aspect of the work spectrum, "identical,
short-cycle operations," which means the method is repeated exactly, is highly
repetitive, occurs no less than 1,500 times per week, and requires .25 minutes
or less per cycle.
Mini MOST® is an approach based on simple construction and the grouping
together of basic motions that frequently occur in sequence. In addition, the
system requires the identification of only seven subactivities, with sequence
models preprinted on the analysis form, requiring the analyst only to fill in
the variable index numbers.
As a computerized system, it offers the advantage of being consistent in
application through the use of key words to describe methods. The work-area
data and key words signal the computer as to which sequence model should be
used and which values should be applied, thereby eliminating errors in
calculations. Also, the computer system provides the ability to edit any
data, work-area information, or standards that have been previously input or
calculated. In addition, this provides the engineer the ability to simulate
potential improvements based on methods or work-area changes.
SYSTEM APPLICATION:
Mini MOST® has the capability to be applied either manually or in a
computerized form. Although the same basic principles apply, the method of
application varies as follows:
•120-
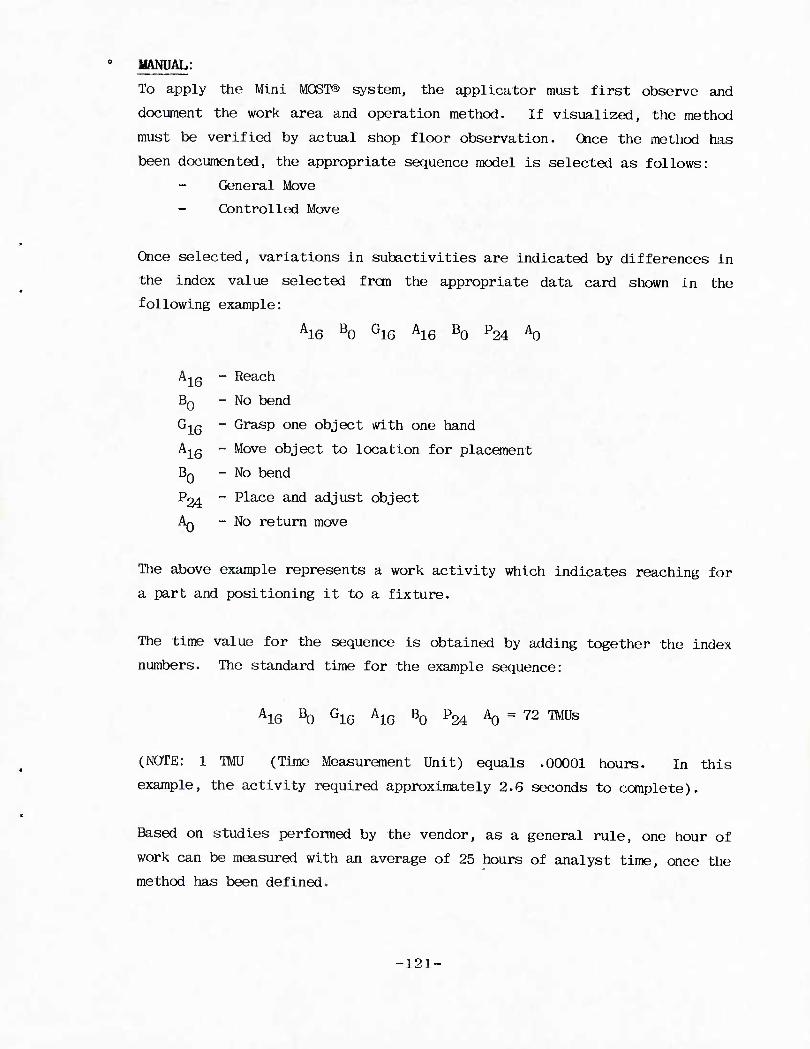
MANUAL:
To apply the Mini MOST® system, the applicator must first observe and
document the work area and operation method. If visualized, the method
must be verified by actual shop floor observation. Once the method has
been documented, the appropriate sequence model is selected as follows:
General Move
- Controlled Move
Once selected, variations in subactivities are indicated by differences in
the index value selected fron the appropriate data card shown in the
following example:
A16 B0 G16 A16 B0 P24 A0
A16 _ Reach
BQ - No bend
G16 - GrasP one object with one hand
A-^g - Move object to location for placement
BQ - No bend
P24 " place ancl adjust object
AQ - No return move
The above example represents a work activity which indicates reaching for
a part and positioning it to a fixture.
The time value for the sequence is obtained by adding together the index
numbers. The standard time for the example sequence:
A16 B0 G16 A16 B0 P24 ^ = 72 ™Us
(NOTE: 1 TMU (Time Measurement Unit) equals .00001 hours. In this
example, the activity required approximately 2.6 seconds to complete).
Based on studies performed by the vendor, as a general rule, one hour of
work can be measured with an average of 25 hours of analyst time, once the
method has been defined.
-121-
CPHTOTHft:
To perform a Mini MOSTi analysis using the computerized system, the
analyst gathers workplace infonnation and keys the infoimation into the
computer data base. Critical workplace information to be input is: 1)
workplace names, locations and sizes; 2) tools and their locations; 3)
objects and their locations; 4) equipment and its location, along with
appropriate process times; 5) operator starting location and body motions
associated with particular workplaces.
The activity being studied is documented in sentence format, starting with
a "key word" that designates to the conputer the sequence model to be
used, as well as the values for selected sequence parameters. Key words
and method descriptions conform to basic English sentence structure and
engineering teminology. Utilizing the key words and the work-area data,
the canputer calculates the standard time for the activity being studied.
It is the vendor's belief that the Mini MOST® computer system is up to 25%
faster than the manual application of Mini MOST®.
Hardware requirements for the Mini MOST® computer systems vary, depending
on the user's needs. Software is available for personal canputers, the
IBM XT, AT or compatible microcomputers, and for Digital Equipment
Corporation's miniconputer systems (VAX). An IBM mainframe version is
under development.
Mini MOST®, both manual and computerized, has been designed for use by
conpanies specializing in the assembly of small canponents or other
activities involving short-cycle identical motions such as small
appliances, some apparel and textile operations, assembly of timing
devices and fusing, and other similar short-cycle tasks. Its use is
intended only for highly repetitive, short-cycle operations with no
variations.
-122-
TRAINING/TECHNICAL ASSISTANCE:
To use the manual Mini MOST® system, the analyst can be certified in Mini
MOST® by completing a 32-hour training course which can be accomplished
through a variety of training alternatives:
A 32-hour lecture or self-paced course at one of HB Maynard's two
training facilities.
A 32-hour lecture course taught by HB Maynard personnel at the
client's facility.
A 32-hour lecture course taught by a licensed client instructor.
A self-paced program with guidance from a licensed client instructor.
To become certified in the Mini MOST® computer system, the analyst must first
be certified in manual Mini MOST® and then certified in computerized Mini
MOST® by completing a 20-hour training course available through the same
variety of training alternatives listed above, except that all conputer-system
training is lecture-style.
Regardless of the training method selected, a formal exam must be taken which
is evaluated by HB Maynard personnel. Based on a score of 75% or greater, the
student is certified. Recertification is required every four years.
HB Maynard personnel are available at the training centers to provide
technical assistance to all clients.
-123-
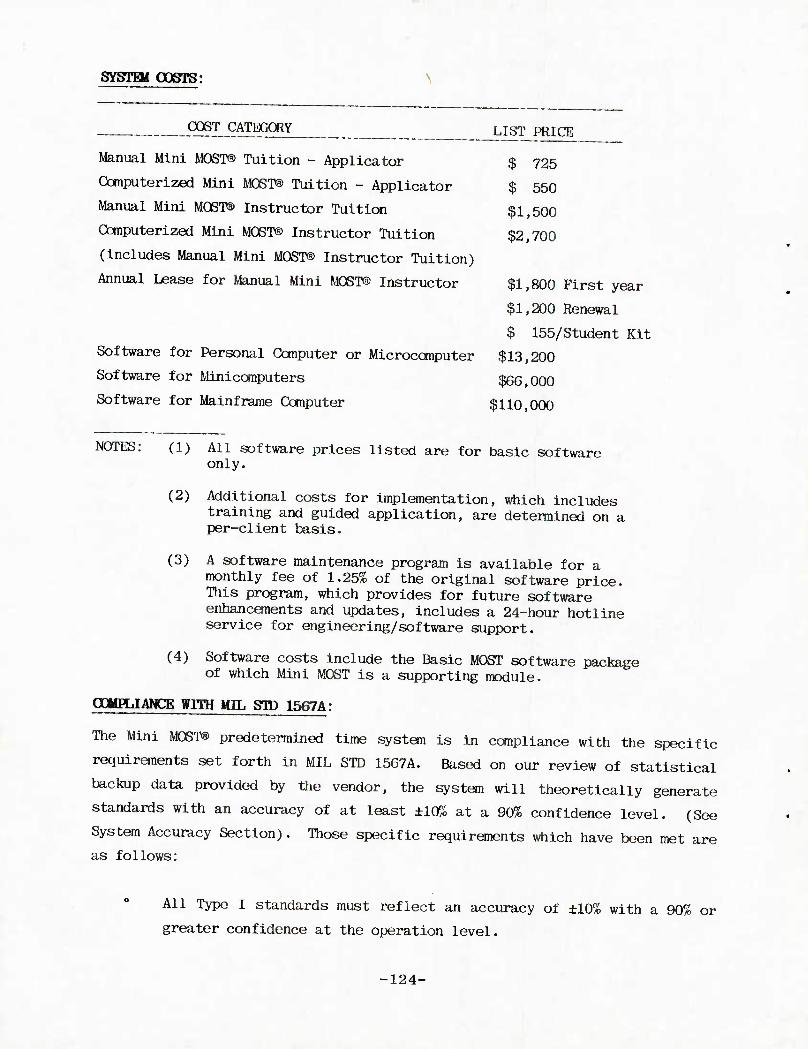
SYSTai COSTS:
COST CATEGORY LIST PRICE
Manual Mini MOST® Tuition - Applicator
Computerized Mini MOST® Tuition - Applicator
Manual Mini MOST® Instructor Tuition
Computerized Mini MOST® Instructor Tuition
(includes Manual Mini MOST® Instructor Tuition)
Annual Lease for Manual Mini MOST® Instructor
Software for Personal Computer or Microconputer
Software for Minicomputers
Software for Mainframe Computer
$ 725
$ 550
$1,500
$2,700
$1,800 First year
$1,200 Renewal
$ 155/Student Kit
$13,200
$66,000
$110,000
NOTES: (1) All software prices listed are for basic software only.
(2) Additional costs for implementation, which includes training and guided application, are determined on a per-client basis.
(3) A software maintenance program is available for a monthly fee of 1.25% of the original software price. This program, which provides for future software enhancements and updates, includes a 24-hour hotline service for engineering/software support.
(4) Software costs include the Basic MOST software package of which Mini MOST is a supporting module.
O0MHJANCE WITH MIL STD 1567A:
The Mini MOST® predetermined time system is in compliance with the specific
requirements set forth in MIL STD 1567A. Based on our review of statistical
backup data provided by the vendor, the system will theoretically generate
standards with an accuracy of at least ±10% at a 90% confidence level. (See
System Accuracy Section). Those specific requirements which have been met are
as follows:
All Type I standards must reflect an accuracy of ±10% with a 90% or
greater confidence at the operation level.
-124-
Documentation of an operations analysis.
A record of standard practice or method followed when the standard
was developed.
A record of rating or leveling.
A record of the standard time computation including allowances.
A record of observed or predetermined time system time values used in
determining the final standard time.
Provision of an audit trail down to the elemental standard time
level.
STOENGTHS AND WEAKNESSES:
Strengths and weaknesses and/or constraints identified are based on
discussions with users of the Mini MOST® predetermined time system. The
comments listed below are based on these discussions and, while a broad range
of industries were sampled, conments should not be considered universal and
therefore may not be applicable to all manufacturing environments:
0 Avoid rating problems of time study. 0 Can set standards prior to operation. 0 Fast application time. 0 Easy to learn.
Standards maintenance easy with computer. 0 Easy to switch from Basic to Mini. 0 Application is consistent. 0 System is accurate.
Can't analyze wrist movement (90° angles) or muscle movement.
Very minute motions sanetimes cannot be accounted for.
May have trouble applying to extremely short cycles (two to three
seconds).
•125-

SYSTEM DSEKS:
No specific user data was provided by the vendor. Approximately 1500
individuals have been trained in the application of the Mini MOST® system.
REFEHENCE SOURCE:
HB Maynard and Company, Inc.
-126-
CONTACT COMPANY ADDRESS
MAXI MOST® SYSTEMS
Kjell B. Zandin, Senior Vice President HB Maynard & Co., Inc. 235 Alpha Drive, Pittsburgh, PA 15238
PHONE: (412) 9G3-8100
SYSTEM HISTCRY:
See BASIC MOST® for detailed history explanation.
SYSTEM DESCRIPTION:
Maxi MOST® (Maynard Operation Sequence Technique) is one member of the MOST®
family of predetermined time systems whose basis is to concentrate on the
displacement of objects under the premise that units of work are organized for
the purpose of accomplishing some useful result by simply moving objects and
operating tools or equipment. Maxi MOST® was specifically designed to
measure nonidentical, long-cycle, heavy assembly or machining operations and
can be applied either manually or with the use of a computer.
The primary work units are fundamental activities (collections of basic
motions) dealing with the movement of objects as well as operating tools,
equipment and machines. Each of these activities is described in terms of
subactivities fixed in a sequence. Consequently, the basic pattern of an
object's movement is described by universal sequence models instead of random,
detailed basic motions.
Maxi MOST® requires the use of five special sequence models for analyzing
long-cycle operations. The five sequence models are as follows:
ABP - Parts Handling
ABT - Tool/Equipment Use 0 ABM - Machine Handling
ATKTPTA - Transport with Powered Crane
ASTLTLTA - Transport with Wheeled Truck
-127-
Each of the parameters represents a particular action and/or tool/equipment
use.
The sequence models, in addition to describing the motions employed, provide
the total time value for the activities by using index numbers. The index
numbers are placed after each subactivity in the sequence and represent the
time allowed for that subactivity. The tables shown on the Maxi MOST® data
cards serve as a reference for identifying the appropriate index values.
Maxi MOST® was designed to provide an efficient work measurement system to be
used to analyze large-scale work where a more precise system might be too
detailed and cumberscme. Each analysis requires the identification of only
three subactivities for the basic sequence models, and seven subactivities for
the powered crane and truck sequence models.
xMaxi MOST® differs from Basic MOST® because it concentrates on one aspect of
the work spectrum: nonidentical, long-cycle operations. It is best-suited
for operations having low unit-production rates and long unit-production
times.
The system vendor states it is best suited for cycles of two minutes or
longer.
SYSTEM APPLICATION:
Maxi MOST® can be applied either manually or in a computerized form. Although
the same basic principles apply, the method of application varies as follows:
0 MANUAL:
To apply the Maxi MOST® system, the applicator must first observe and
document the operation method. If visualized, the method must be verified
by actual shop floor observation. Once the method has been documented,
the appropriate sequence model is selected as follows:
ABP - Parts Handling
ABT - Tool/Equipment Use
ABM - Machine Handling
-128-
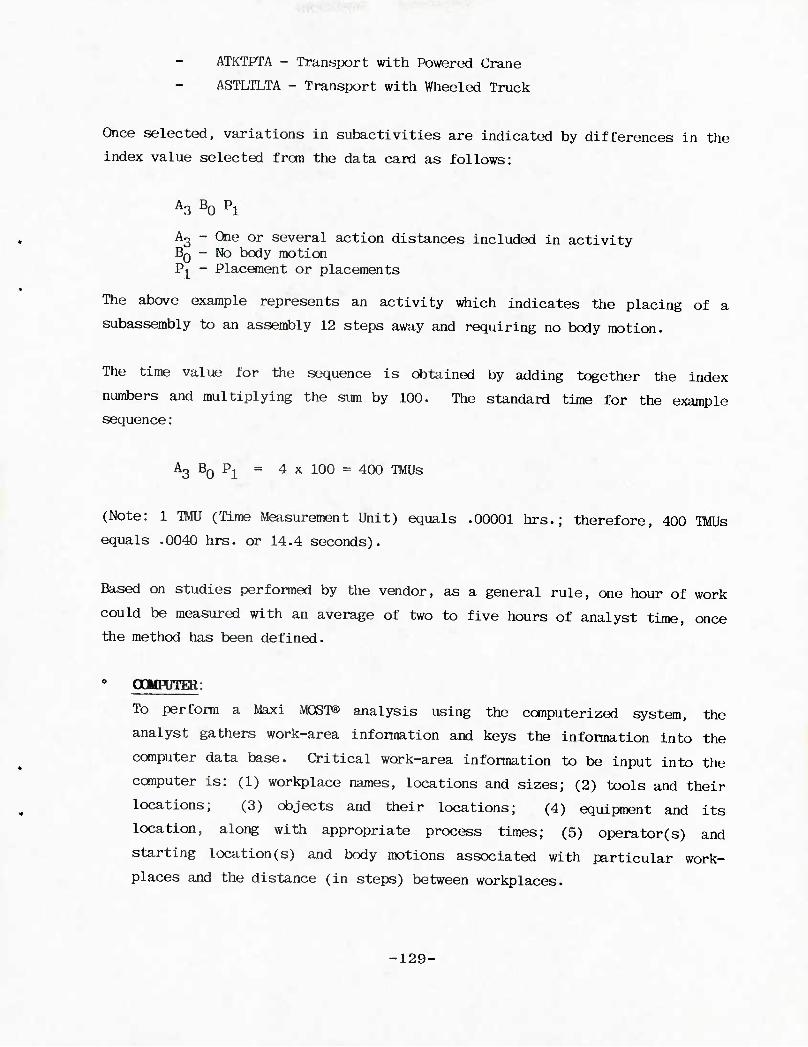
ATKTPTA - Transport with Powered Crane
ASTLTLTA - Transport with Wheeled Truck
Once selected, variations in subactivities are indicated by differences in the
index value selected fron the data card as follows:
A3 B0 P1
A3 - One or several action distances included in activity BQ - No body motion P-^ - Placement or placements
The above example represents an activity which indicates the placing of a
subassembly to an assembly 12 steps away and requiring no body motion.
The time value for the sequence is obtained by adding together the index
numbers and multiplying the sum by 100. The standard time for the example
sequence:
A3 B0 Pl = 4 x 100 = 400 ™Us
(Note: 1 TMU (Time Measurement Unit) equals .00001 hrs.; therefore, 400 TMUs
equals .0040 hrs. or 14.4 seconds).
Based on studies performed by the vendor, as a general rule, one hour of work
could be measured with an average of two to five hours of analyst time, once
the method has been defined.
0 OOMTOTER:
To perform a Maxi MOST® analysis using the computerized system, the
analyst gathers work-area information and keys the information into the
computer data base. Critical work-area information to be input into the
computer is: (1) workplace names, locations and sizes; (2) tools and their
locations; (3) objects and their locations; (4) equipment and its
location, along with appropriate process times; (5) operator(s) and
starting location(s) and body motions associated with particular work-
places and the distance (in steps) between workplaces.
-129-
The activity being studied is documented in sentence format, starting with
a "key word" that designates to the computer the sequence model to be
used, as well as the values for selected sequence parameters. Key words
and method descriptions conform to basic English sentence structure and
engineering terminology. Utilizing the key words and the workplace data,
the computer calculates the standard time for the activity being studied.
Major advantages of the computer system are: the consistency offered by
the key word approach to method descriptions, calculation errors and
errors from selecting wrong values from the charts are eradicated, and the
ability to edit any data, work-area information or standards that have
previously been input or calculated.
It is the vendor's belief that the Maxi MOST® computer system is up to 25%
faster than manual Maxi MOST®.
Hardware requirements for the Maxi MOST® computer systems vary depending
on the user's needs. Software is available for personal conputers, the
IBM XT, AT or compatible microcanputers, and for Digital Equipment
Corporation's minicomputer systems (VAX). An IBM mainframe version is
under development.
Maxi MOST®, both manual and computerized, has been designed to be used by
conpanies whose operations include nonidentical, non-repetitive long-cycle
tasks in industries such as shipyards, railcar fabrication, steel-rolling
mill fabrication and assembly, missile-system production, and chemical-
process operations. Its use is intended only for non-repetitive, long-
cycle operations with variations.
TRAINIMG/TECBNICAL ASSISTANCE:
To use manual Maxi MOST®, the analyst must first be certified in the use of
Basic MOST®. To become certified, a 32-hour training course is required (in
addition to the 40-hour Basic MOST® course) which can be achieved through a
variety of alternatives as follows:
-130-
A 32-hour lecture or self-paced course at one of HB Maynard's two training
facilities.
A 32-hour lecture course taught by HB Maynard personnel at the client's
facility.
A 32-hour lecture course taught by a licensed client instructor.
A self-paced program with guidance from a licensed client instructor.
To become certified in the Maxi MOST® computer system, the analyst must first
be certified in manual Maxi MOST® and then can be certified in computerized
Maxi MOST® by completing a 20-hour training course available through the same
variety of training alternatives listed above except all conputer-system
training is lecture-style.
Regardless of the training method selected, a final exam must be taken which
is evaluated by HB Maynard personnel. Based on a score of 75% or greater, the
student is certified. Recertification is required every four years.
HB Maynard personnel are available at the training centers to provide
technical assistance to all clients.
-131-
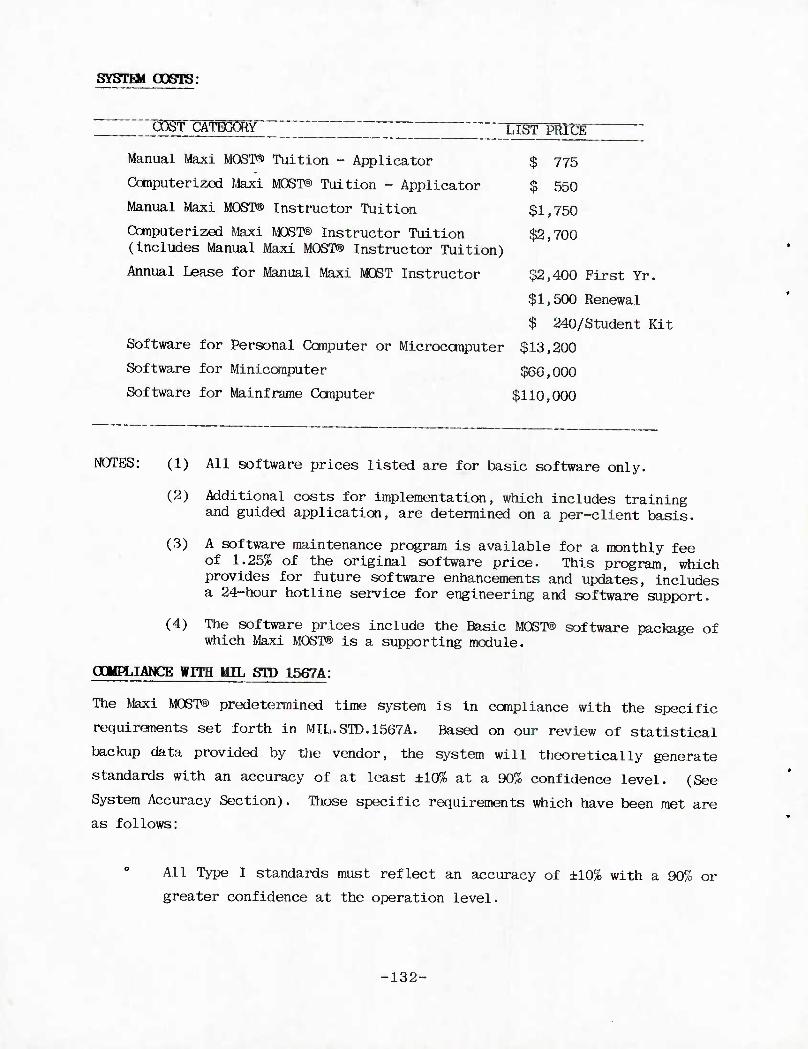
SYSTHi OOOTS:
;^ST CATTERY ' — — LTg^PRIC^
Manual Maxi MOST® Tuition - Applicator $ 775
Conputerized Maxi MOST® Tuition - Applicator $ 550
Manual Maxi MOST® Instructor Tuition $1,750
Computerized Maxi MOST® Instructor Tuition $2,700 (includes Manual Maxi MOST® Instructor Tuition)
Annual laase for Manual Maxi MOST Instructor $2,400 First Yr.
$1,500 Renewal
$ 240/Student Kit
Software for Personal Computer or Microcanputer $13,200
Software for Minicomputer $66,000
Software for Mainframe Computer $110,000
NOTES: (1) All software prices listed are for basic software only.
(2) Additional costs for implementation, which includes training and guided application, are determined on a per-client basis.
(3) A software maintenance program is available for a monthly fee of 1.25% of the original software price. This program, which provides for future software enhancements and updates, includes a 24-hour hotline service for engineering and software support.
(4) The software prices include the Basic MOST® software package of which Maxi MOST® is a supporting module.
OOyFLIAWCE WITH MIL STD 1567A:
The Maxi MOST® predetermined time system is in compliance with the specific
requirements set forth in MIL.STD.1567A. Based on our review of statistical
backup data provided by the vendor, the system will theoretically generate
standards with an accuracy of at least ±10% at a 90% confidence level. (See
System Accuracy Section). Those specific requirements which have been met are
as follows:
All Type I standards must reflect an accuracy of ±10% with a 90% or
greater confidence at the operation level.
-132-
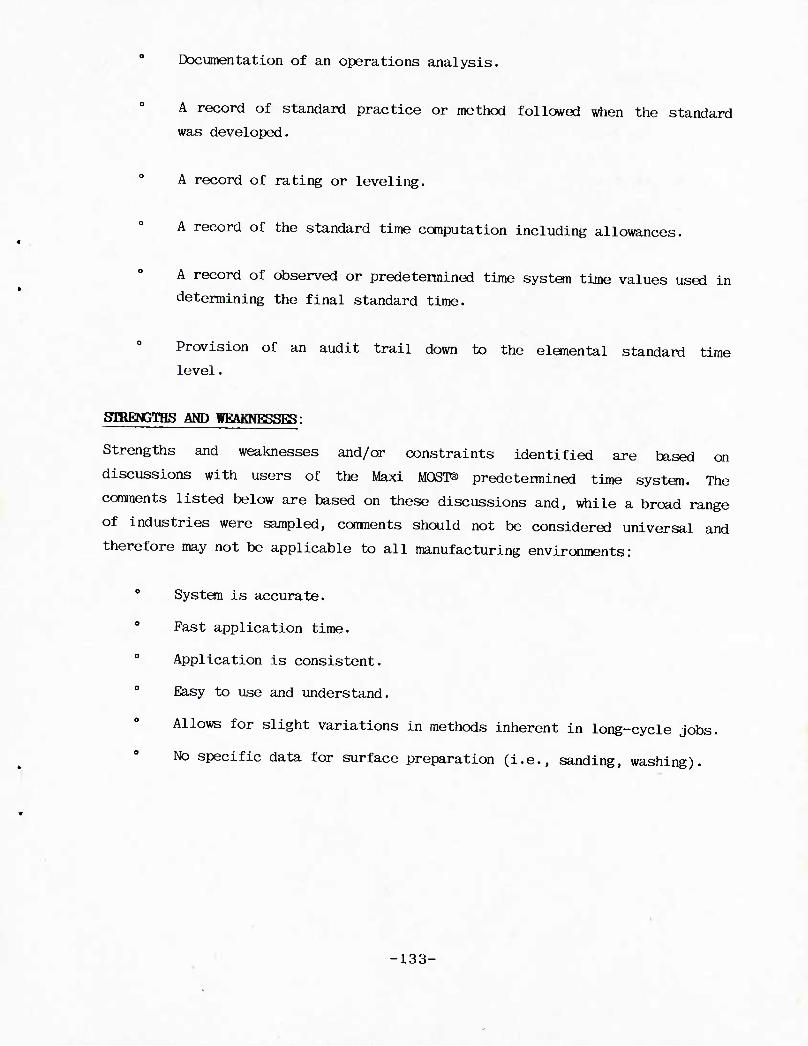
Documentation of an operations analysis.
A record of standard practice or method followed when the standard
was developed.
0 A record of rating or leveling.
A record of the standard time computation including allowances.
A record of observed or predetermined time system time values used in
determining the final standard time.
Provision of an audit trail down to the elemental standard time
level.
STRENGTHS AND WEAKNESSES:
Strengths and weaknesses and/or constraints identified are based on
discussions with users of the Maxi MOST® predetermined time system. The
comments listed below are based on these discussions and, while a broad range
of industries were sampled, conments should not be considered universal and
therefore may not be applicable to all manufacturing environments:
o System is accurate.
Fast application time.
Application is consistent.
Easy to use and understand.
Allows for slight variations in methods inherent in long-cycle jobs.
No specific data for surface preparation (i.e., sanding, washing).
-133-

SYSTEM DSEKS:
No specific user data was provided by the vendor. Approximately 800 indivi-
duals have been trained in the application of the Maxi-MOST® system.
REFERENCE SOURCE:
HB Maynard & Company, Inc.
■134-
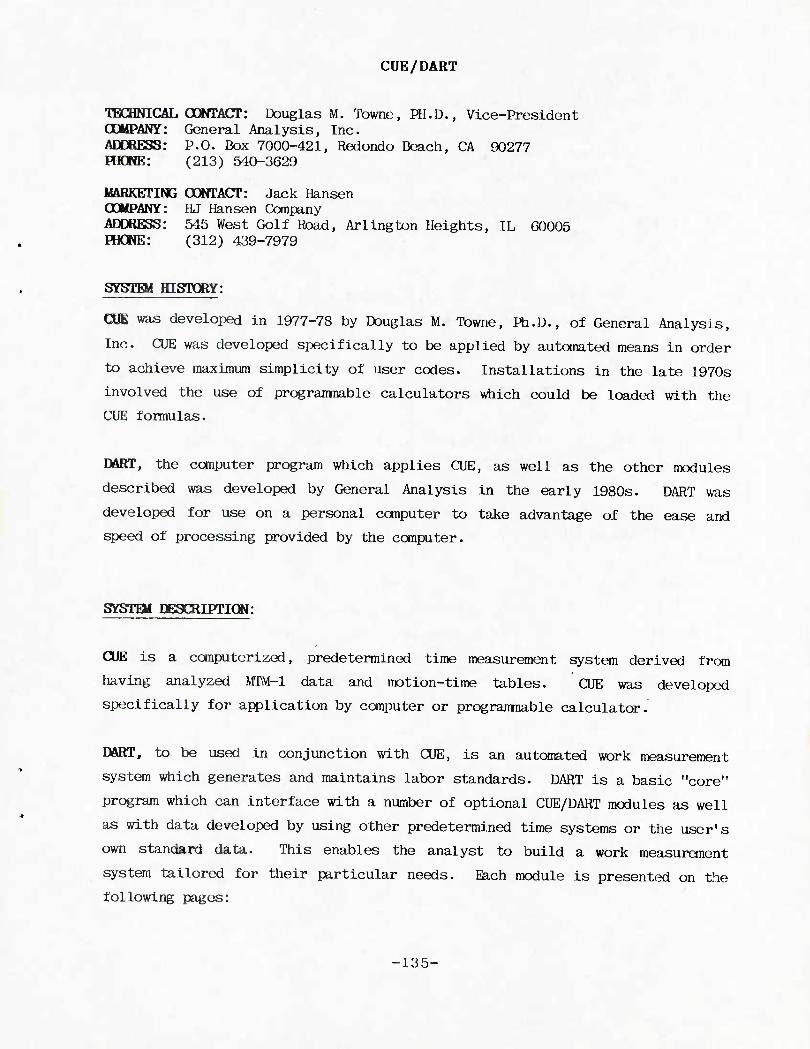
CUE/DART
TBOmCAL OONTACT: Douglas M. Towne, PH.D., Vice-President COMPANY: General Analysis, Inc. ADDRESS: P.O. Box 7000-421, Redondo Beach, CA 90277 HKWE: (213) 540-3629
MARKETING CONTACT: Jack Hansen OOliPANY: HJ Hansen Company ADDRESS: 545 West Golf Road, Arlington Heights, IL 00005 PHCKE: (312) 439-7979
SYSTHt HISTQRY:
OJE was developed in 1977-78 by Douglas M. Towne, Ph.D., of General Analysis,
Inc. CUE was developed specifically to be applied by automated means in order
to achieve maximum simplicity of user codes. Installations in the late 1970s
involved the use of progranmable calculators which could be loaded with the
CUE formulas.
DART, the computer program which applies CUE, as well as the other modules
described was developed by General Analysis in the early 1980s. DART was
developed for use on a personal computer to take advantage of the ease and
speed of processing provided by the computer.
SYSTEM DESCRIPTION:
CUE is a computerized, predetermined time measurement system derived from
having analyzed MTM-1 data and motion-time tables. CUE was developed
specifically for application by computer or progranmable calculator.
DART, to be used in conjunction with CUE, is an automated work measurement
system which generates and maintains labor standards. DART is a basic "core"
program which can interface with a number of optional CUE/DART modules as well
as with data developed by using other predetermined time systems or the user's
own standard data. This enables the analyst to build a work measuranent
system tailored for their particular needs. Each module is presented on the
following pages:
•135-
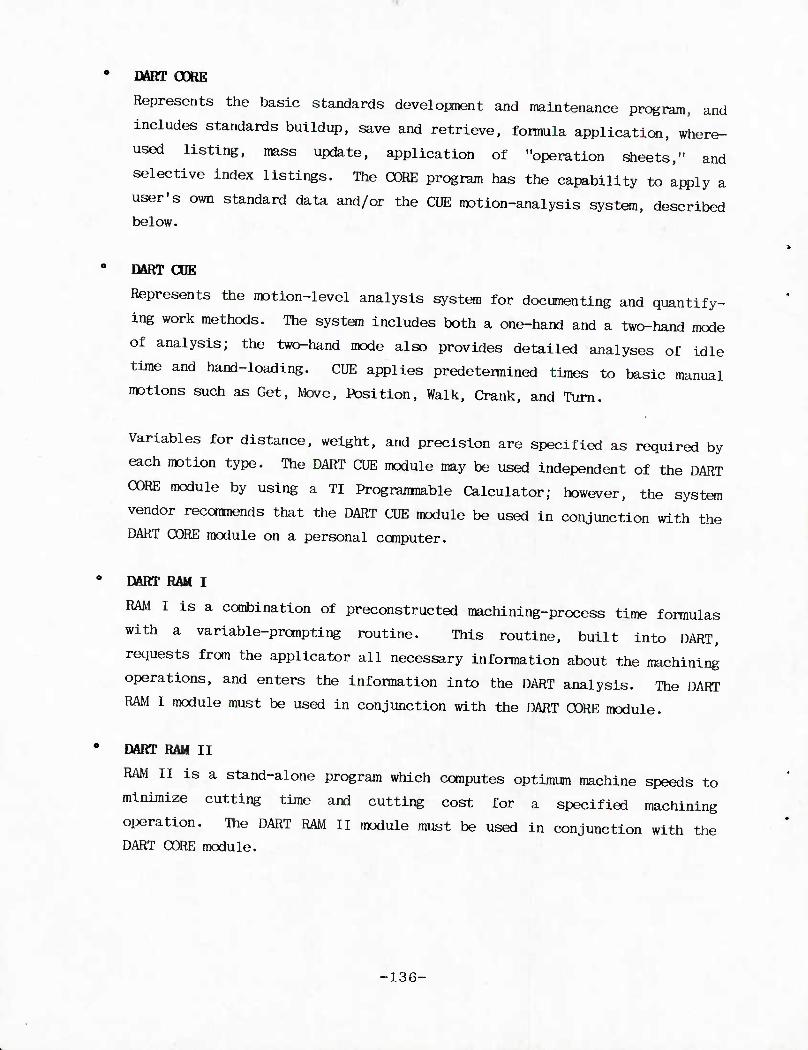
DART GORE
Represents the basic standards development and maintenance program, and
includes standards buildup, save and retrieve, fomula application, where-
used listing, mass update, application of "operation sheets," and
selective index listings. The CORE program has the capability to apply a
user's own standard data and/or the CUE motion-analysis system, described below.
DART ODE
Represents the motion-level analysis system for documenting and quantify-
ing work methods. The system includes both a one-hand and a two-hand mode
of analysis; the two-hand mode also provides detailed analyses of idle
time and hand-loading. CUE applies predetemined times to basic manual
motions such as Get, Move, Position, Walk, Crank, and Turn.
Variables for distance, weight, and precision are specified as required by
each motion type. The DART CUE module may be used independent of the DART
CORE module by using a TI Programmable Calculator; however, the system
vendor recommends that the DART CUE module be used in conjunction with the
DART CORE module on a personal conputer.
DART RAM I
RAM I is a combination of preconstructed machining-process time formulas
with a variable-prompting routine. This routine, built into DART,
requests from the applicator all necessary information about the machining
operations, and enters the information into the DART analysis. The DART
RAM I module must be used in conjunction with the DART CORE module.
DART RAM II
RAM II is a stand-alone program which computes optimum machine speeds to
minimize cutting time and cutting cost for a specified machining
operation. The DART RAM II module must be used in conjunction with the
DART CORE module.
-136-
0 Preconstructed Standards Data:
In addition to the above modules, the system also has the following data
banks which contain pre-analyzed elements recognized by DART and ready for
use in standards buildup:
Machine Tool: manual machine-sfaop elements
- light Assembly: manual assenfely elements
- Printed Circuit Board Assembly
- Wire Harness Fabrication
SYSTEM APHLICATION:
CUE is a data base of predetermined time elements which are input into the
DART CORE program to develop labor standards for manual activities. All
manual work is described to DART/CUE in terms of element codes. These codes
signify what work is accomplished.
The table below summarizes the basic CUE elements available for standards
application.
G - Get
M - Move
P - Position
D - Disengage
C - Crank
F - Finger Motion
H - Horizontal Body Motion (walk, side step, turn)
V - Vertical Body Motion (bend, sit, stand, arise)
E - Eye Action (focus or eye travel)
AP - Apply Pressure
M - Foot Motion
PT - Process Time
In addition to the above elements, user-defined standard data can be used to
supplement the basic elements.
-137-
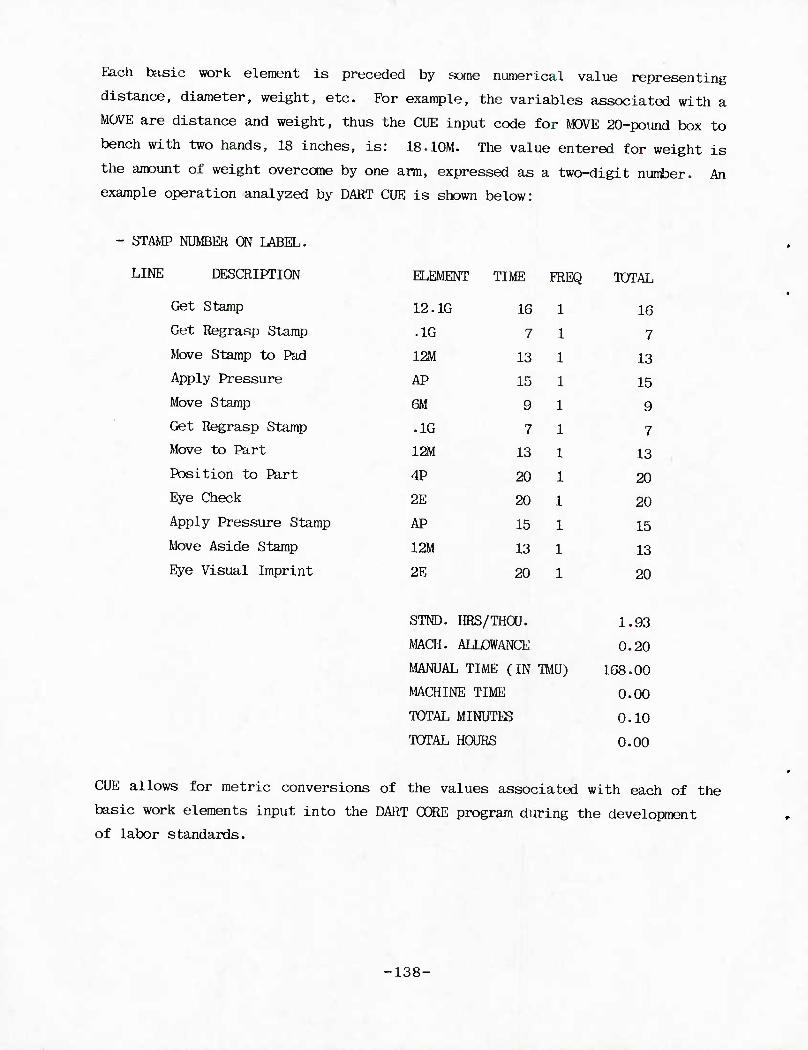
Each basic work element is preceded by some numerical value representing
distance, diameter, weight, etc. For example, the variables associated with a
MOVE are distance and weight, thus the CUE input code for MOVE 20-pound box to
bench with two hands, 18 inches, is: 18.10M. The value entered for weight is
the amount of weight overcome by one arm, expressed as a two-digit nuntoer. An
example operation analyzed by DART CUE is shown below:
STAMP NUMBER ON LABEL.
LINE DESCRIPTION
Get Stamp
Get Regrasp Stamp
Move Stamp to Pad
Apply Pressure
Move Stamp
Get Regrasp Stamp
Move to Part
Position to Part
Eye Check
Apply Pressure Stamp
Move Aside Stamp
Eye Visual Imprint
KI.KMENT TIME FREQ TOTAL
12.1G 16 16
.1G 7 7
12M 13 13 AP 15 15
6M 9 9
.1G 7 7 12M 13 13
4P 20 20
2E 20 20
AP 15 15
12M 13 13
2E 20 20
STND. HRS/THOU. 1 .93
MACH. ALLOWANCE 0 .20
MANUAL TIME (IN TMU) 168 .00
MACHINE TIME 0 .00
TOTAL MINUTES 0 .10
TOTAL HOURS 0, .00
CUE allows for metric conversions of the values associated with each of the
basic work elements input into the DART CORE program during the development
of labor standards.
-138-
The system can be used for both sbort-cycle and long-cycle work activities.
Generally, standard data elements built from CUE basic-motion codes are used
for longer-cycle work. Although CUE is best suited for highly repetitive
activities, with no variations, the system vendor states that the CUE system
can be used effectively in relatively variable environments because of its
speed in application. In addition, the system allows users to analyze several
variations of work content, and then calculate a weighted average to reflect
the average time required.
As previously stated, the CUE system was developed specifically for
application by computer or progranmable calculator and can be used in
conjunction with:
0 TI progranmable calculators 0 Apple II series ccrnputers 0 Apple III canputers
IBM PC/XT/AT series computers
All IBM-compatible computers (i.e., Compaq, Zenith, and Xerox)
TRAXNING/TECHNICAL ASSISTANCE:
General Analysis provides five days of basic system training, which includes
three days of classroom instruction and two days for guided application in the
user's plant. General Analysis recommends an additional two weeks of training
in which to cover standard data development and other general work-measurement
application topics. AIL training is conducted at the client's site and a
certification examination is administered upon completion of the training
course.
Although retraining is available, it has rarely been requested. It is the
vendor's belief that it is conmon practice for users, once trained by General
Analysis instructors, to perform periodic in-house training for additional
users of the CUE system.
•139-
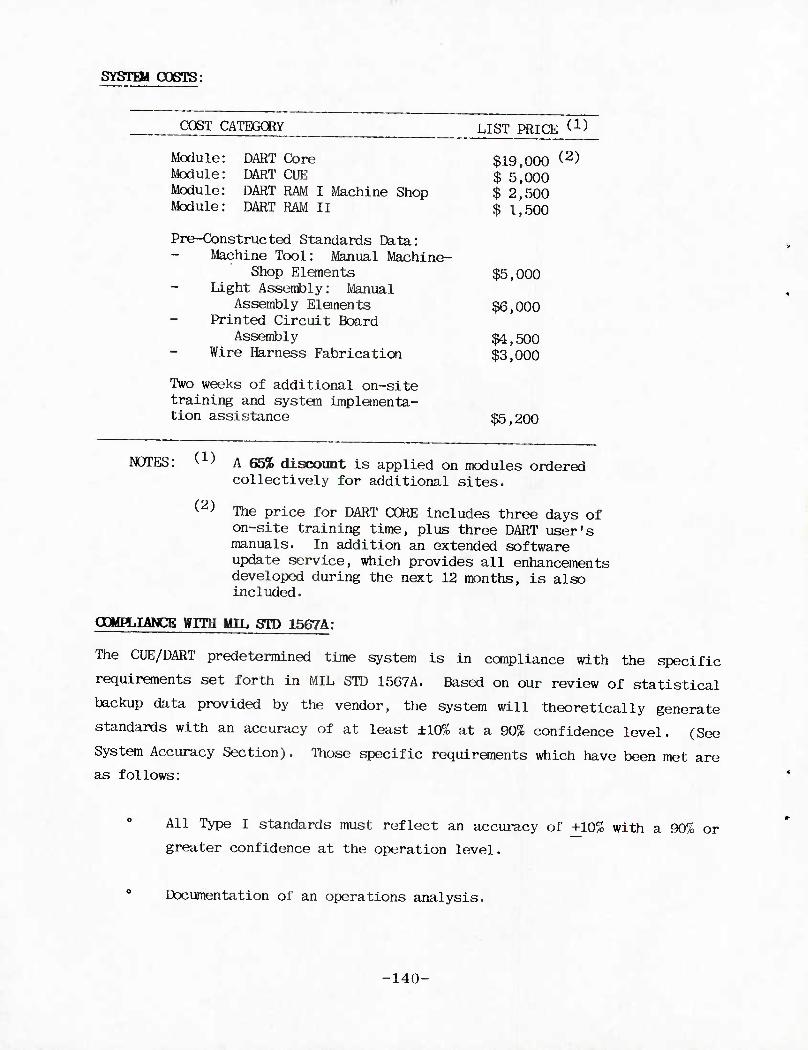
SYSTEM O06TS:
COST CATEGORY LIST PRICE t1)
Module: DART Core Module: DART CUE
$19,000 (2) $ 5,000
Module: DART RAM I Machine Shop Module: DART RAM 11
$ 2,500 $ 1,500
Pre-Constructed Standards Data: Machine Tool: Manual Machine-
Shop Elements Light Assembly: Manual
Assembly Elements Printed Circuit Board
$5,000
$6,000
Assembly Wire Harness Fabrication
$4,500 $3,000
Two weeks of additional on-site training and system implanenta- tion assistance $5,200
NOTES: ^ ' A 65% discount is applied on modules ordered collectively for additional sites.
(2) The price for DART CORE includes three days of on-site training time, plus three DART user's manuals. In addition an extended software update service, which provides all enhancements developed during the next 12 months, is also included.
CDMHLIANCE WITH MIL STD 1567A:
The CUE/DART predetermined time system is in compliance with the specific
requirements set forth in MIL STD 15G7A. Based on our review of statistical
backup data provided by the vendor, the system will theoretically generate
standards with an accuracy of at least ±10% at a 90% confidence level. (See
System Accuracy Section). Those specific requirements which have been met are
as follows:
All Type 1 standards must reflect an accuracy of +10% with a 90% or
greater confidence at the operation level.
0 Documentation of an operations analysis.
-140-
A record of standard practice or method followed when the standard
was developed.
0 A record of rating or leveling.
A record of the standard time canputation including allowances.
A record of observed or predetermined tine system time values used in
determining the final standard time.
Provision of an audit trail down to the elemental standard time
level.
STRENGTHS AND WEAKNESSES:
Strengths and weaknesses and/or constraints identified are based on
discussions with users of the CUE/DART predetermined time system. The comnents
listed below are based on these discussions and, while a broad range of
industries were sampled, ccrnments should not be considered universal and
therefore may not be applicable to all manufacturing environments:
0 Easy to apply.
Computerized application provides improved speed, accuracy, and
consistency of application, and enables the user to more easily
modify standards, perform mass updates, and develop and analyze
"what-if" method-improvement scenarios.
System will accept and manipulate data developed by utilizing other
work measurement systems or techniques.
Mass updating using the computerized version requires substantial
time and effort to code each level of data so as to provide a link of
traceability when mass updating.
System users have experienced slow response from the system vendor.
•141-
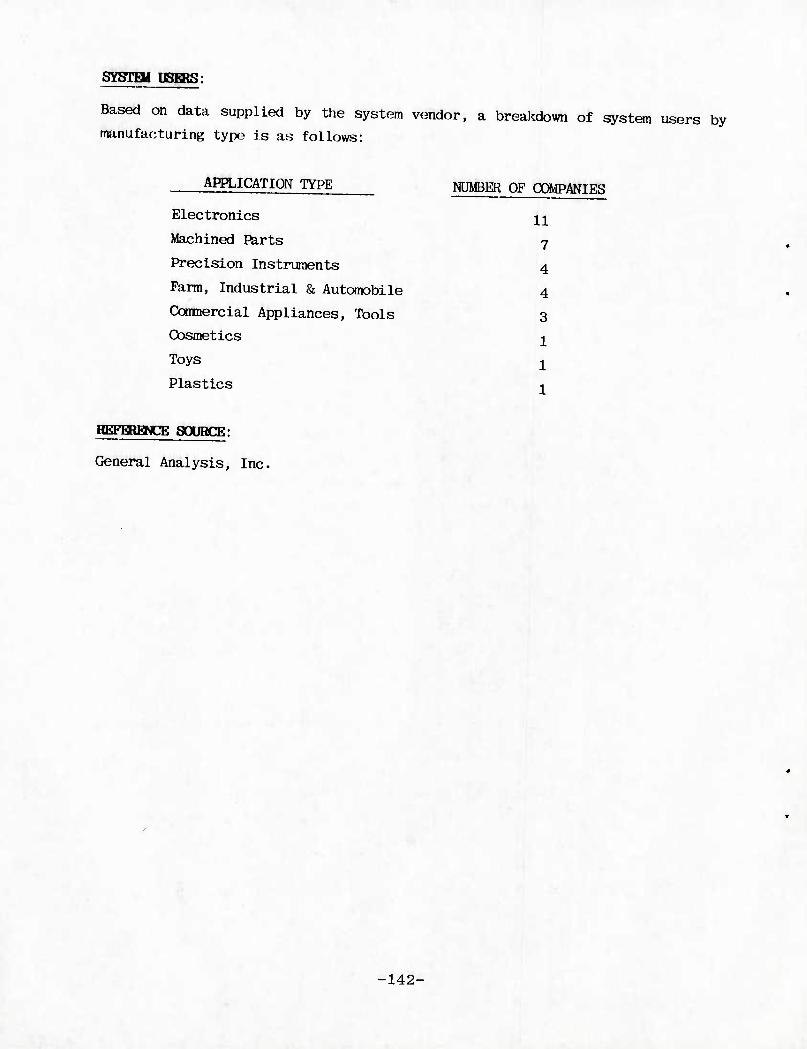
SYSTEM USERS:
Based on data supplied by the system vendor, a breakdown of system users by
manufacturing type is as follows:
APPLICATION TYPE
Electronics 11 Machined Parts 7 Precision Instruments 4 Farm, Industrial & Automobile 4 Coiiiijercial Appliances, Tools 3 Cosmetics 1 Toys 1 Plastics 1
REFERENCE SOURCE:
General Analysis, Inc.
-142-
OONTACT COMPANY ADDRESS
MASTER STANDARD DATA (MSD)
Harold W. Nance, President Serge A. Birn Company, Division of SABCO, Inc. 5328 Wooster Road, Cincinnati, OH 4522G
PHONE: (502) 451-6G40
HISTCRY OP SYSTEM:
The developnent of Master Standard Data (MSD) was initiated in the late 1950s
by analyzing thousands of MTM-1 analyses of individual operations as well as
those used for standard data. Based on these analyses, it was found that
certain basic MTM-1 motion combinations were continually repeated. The basic
MSD card was completed in 1960 and a textbook published in 1962.
The MSD system was developed by the late Richard M. Crossan and Harold W.
Nance of the Serge A. Birn Company. Client facilities were used to test and
validate the resulting data.
SYSTai EESCaiPTION:
MSD is a catalog of fifty-four elements associated with time values based on
combinations of the most commonly used Methods Time Measurement (MTM-1)
motions.
MSD was developed from the concept that there are only two ways of getting
something and only three places to put it. To get something, it is easy (sane
control), or difficult (high control), and it is put in the other hand, in a
general location, or in an exact location.
In addition, MSD is based on four primary concepts, as follows:
,,Horizontal,, Efeta - Time data, or standard data, are developed by type of
activity regardless of where or for what purpose it is performed as
opposed to developing the standard data by department.
"Building Block Concept" - Where the "size" of the blocks (number of
combined time elements) is increased in proportion to the duration of the
work.
-143-
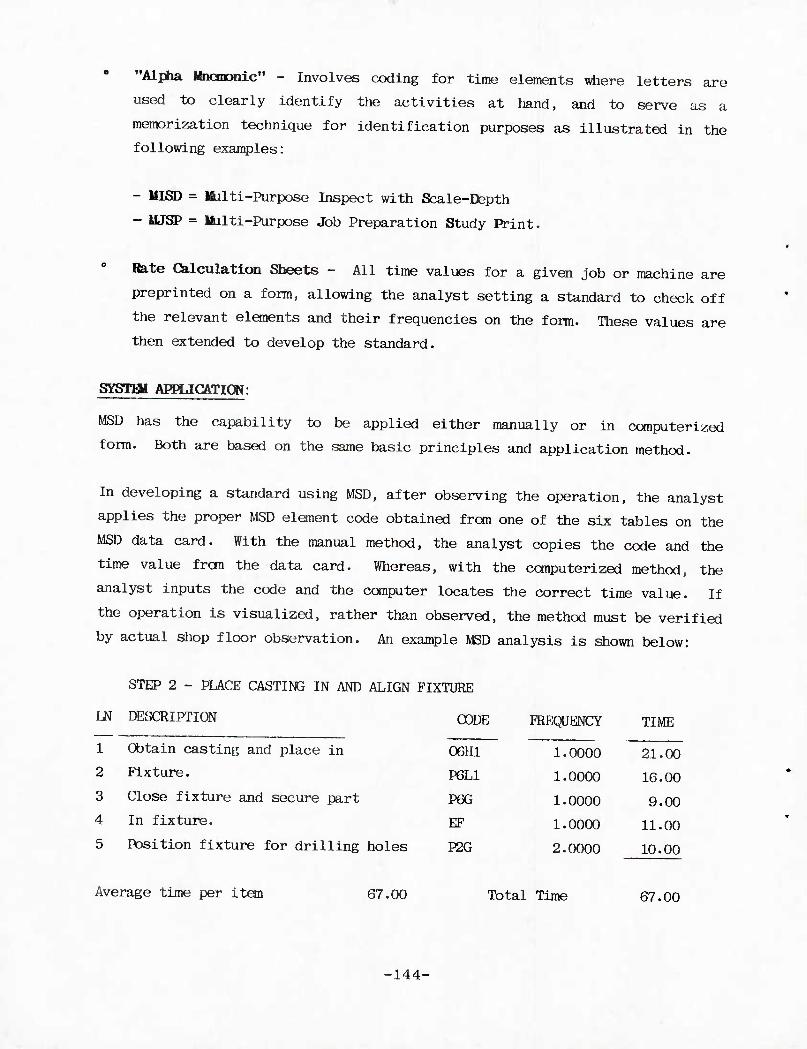
"Alpha Mnemonic" - Involves coding for time elements where letters are
used to clearly identify the activities at hand, and to serve as a
memorization technique for identification purposes as illustrated in the
following examples:
- MISD = Multi-Purpose Inspect with Scale-Depth
- MJSP = Multi-Purpose Job Preparation Study Print.
Rate Calculation Sheets - All time values for a given job or machine are
preprinted on a form, allowing the analyst setting a standard to check off
the relevant elements and their frequencies on the form. These values are
then extended to develop the standard.
SYSTHi APHJC&TION:
MSD has the capability to be applied either manually or in computerized
form. Both are based on the same basic principles and application method.
In developing a standard using MSD, after observing the operation, the analyst
applies the proper MSD element code obtained from one of the six tables on the
MSD data card. With the manual method, the analyst copies the code and the
time value fran the data card. Whereas, with the computerized method, the
analyst inputs the code and the computer locates the correct time value. If
the operation is visualized, rather than observed, the method must be verified
by actual shop floor observation. An example MSD analysis is shown below:
STEP 2 - PLACE CASTING IN AND ALIGN FIXTURE
LN DESCRIPTION
1 Obtain casting and place in
2 Fixture.
3 Close fixture and secure part
4 In fixture.
5 Position fixture for drilling holes
Average time per item 67.00
CODE FREQUENCY TIME
06H1 1.0000 21.00
P6L1 1.0000 16.00
P6G 1.0000 9.00
EF 1.0000 11.00
P2G 2.0000 10.00
Total Time 67.00
-144-
All time values are in time measurement units (TMUs). Once the operation time
has been calculated, the analyst may add any necessary fatigue/delay
allowances to develop the final standard.
The computerized version of MSD, called MDD-II, provides additional features
to the development of standards. It allows for the development and storage of
standard data and for the maintenance (update/delete) of any level of data.
The conputer also provides a mass update function which allows any element or
operation changes to be made universally.
During its application, MSD encourages the use of a "Building Block" approach
to develop standard data and is horizontal rather than the conventional
vertical structure. The first step consists of combining MSD elements into
work elements, which are applicable to most operations performed in a company,
and are called "Multi-Purpoee Elements". The next step is to combine the
Multi-Purpose Elements and MSD elements into elements that apply to a given
category of work, such as Punch Presses, Shears, and Press Brakes. This
combination is called "Lunited Purpose Elements" and contains elements that
are conmon to only that particular group of equipment. Finally, these levels
are combined into "Single Purpose Elements" which apply to a specific land of
operation, such as Punch Presses. When analyzing an operation, the
appropriate elements are placed on a rate calculation sheet to be used in
establishing operation standards, either manually or canputerized.
The MSD system has been applied to sheet metal fabrication, metal working,
assembly, mechanical, and electrical/electronic operations. In addition,
special applications of MSD are used for maintenance work and shipping and
receiving.
The MSD system can be applied to both short or long cycle jobs provided the
short cycle job does not have overlapping motions. If overlapping motions do
exist, then a special version of MSD must be utilized. MSD can be applied to
both highly repetitive, or non-repetitive jobs with or without variations in
method, provided the proper approach is taken in its application. For a
•145-
highly repetitive operation, MSD would be used to measure the best method for
performing the required work. For non-repetitive work, MSD would be used to
measure the probable method by which the work would be performed.
The computer system, HDD-II, has been designed for use on an IBM XT or AT or
compatible hardware, and can be used to mass update standards as well as
develop standard data. In addition, MSD offers a performance reporting
software package, ICD-III, that integrates with MOD-II to create labor
distribution reports.
The system vendor states that utilizing the above concepts can reduce the time
required to set standards by 60 to 80% (exclusive of methods work) when
compared to more conventional means (i.e., time study).
TRAINING/TBCHNICAL ASSISTANCE:
The MSD Training Course requires one week (40 hours) and, upon completion,
each trainee must take a final examination and is certified based on a score
of 80% or better.
The MSD Training Course is presented in a variety of ways, as follows:
A 40-hour lecture course and examination conducted by an MSD-trained
instructor at the client's facilities.
A 40-hour self-paced course and examination monitored by an MSD-trained
instructor at the Serge A. Birn Company Training Center.
Leasing the MSD Self-Paced Training Course and having the training
monitored by a certified user of MSD.
Periodic public lecture courses presented by the Serge A. Birn Company.
All training and examination materials are supplied and graded by the system
manufacturer. Outside trainers must be recertified every four years.
Technical assistance is available from the system manufacturer on an as-needed
basis.
-146-
SYSTH4 OOSTTS:
COST CATEGORY LIST PRICE
MSD Basic Training Course $ 450
MSD Appreciation Training Course $ 130
MQD-II Software System ^ $12,000
Ma>III Software System - stand alone (2) $ 5,000
M0D-III Software - with MOD-II $ 3,000
NOTES: (1) All software prices listed are for software only. In addition, three days of consulting assistance will be supplied at the cost of living and travel expenses to assist in placing it on the computer and in training personnel in its use.
(2) This includes two days of consulting at the cost of living and travel expenses.
OOMPLIANCE WITH MIL STD 1567A:
The MSD predetermined time system is in compliance with the specific
requirements set forth in MIL STD 1567A. Based on our review of statistical
backup data provided by the vendor, the system will theoretically generate
standards with an accuracy of at least ±10% at a 90% confidence level. (See
System Accuracy Section). Those specific requirements which have been met are
as follows:
All Type I standards must reflect an accuracy of ±10% with a 90% or
greater confidence at the operation level.
Documentation of an operations analysis.
A record of standard practice or method followed when the standard
was developed.
0 A record of rating or leveling.
■147-
A record of the standard time computation including allowances.
A record of observed or predetemined time system time values used in
determining the final standard time.
Provision of an audit trail down to the elemental standard time
level.
SIBEMGTBS AND WEAKNESSES:
on Strengths and weaknesses and/or constraints identified are based
discussions with users of the MSD predetermined time system. The ccranents
listed below are based on these discussions and, while a broad range of
industries were sampled, conments should not be considered universal and
therefore may not be applicable to all manufacturing environments:
As a standard data system, it provides a substantial amount of
standard data for conmonly used equipment and operations.
Past technical assistance provided by the system vendor has been
exceptional.
The system is easily applied.
Canputerized application provides improved speed, accuracy and
consistency of application, and enables the user to more easily
modify standards, perform mass updates, and develop and analyze
"what-if" methods improvement scenarios.
Generates good documentation of the work sequence or process being
analyzed.
-148-
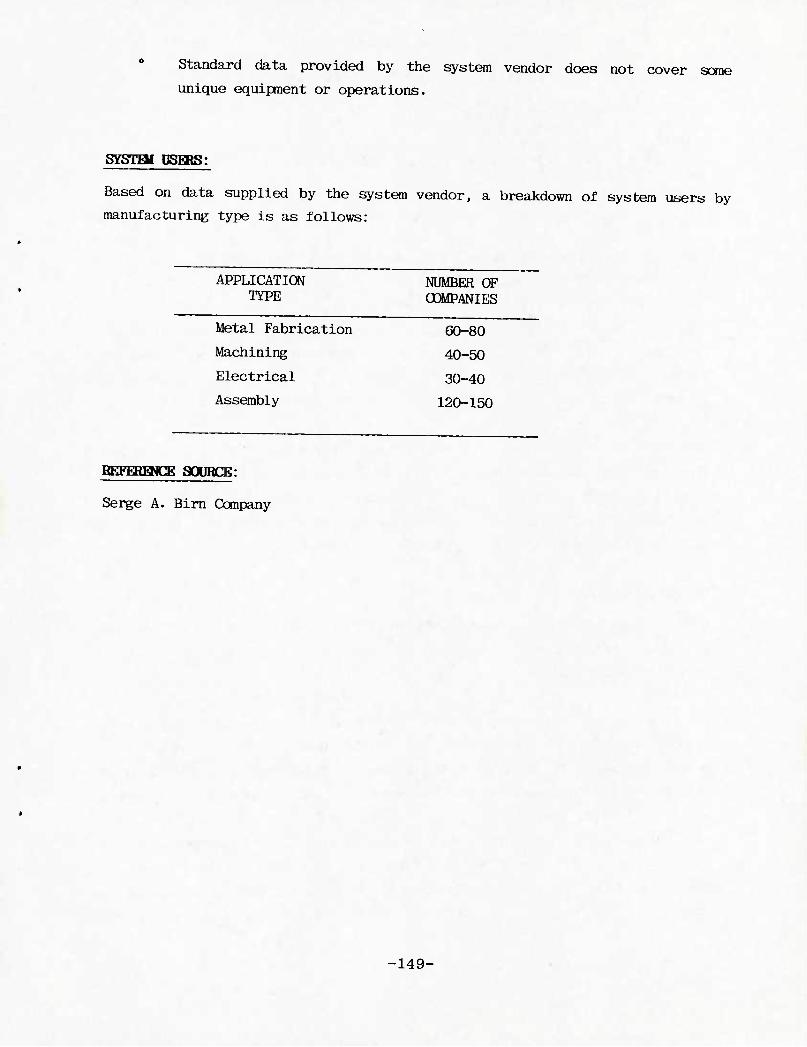
Standard data provided by the system vendor does not cover sane
unique equipment or operations.
SYSTai DSEBS:
Based on data supplied by the system vendor, a breakdown of system users by
manufacturing type is as follows:
APPLICATION NUMBER OF TYPE COMPANIES
Metal Fabrication 60-80
Machining 40-50
Electrical 30-40
Assembly 120-150
REFERENCE SOURCE:
Serge A. Birn Company
-149-
OONTACT COMPANY ADCKESS
NAVAIR - ELEMENTAL STANDARD DATA
David Hordos Naval Air Rework Facility, Code 634 US Naval Air Station, Alameda, CA 94501
HOiE: (415) 869-3447
SYSTEM HISTORY:
The Elemental Standard Data (BSD) System is a composite of Methods Time
Measurement (MTM) and the Naval Aviation Logistics Center (NALC) developed
data. MTM General Purpose Data (GPD) elements, which is the first-level
"building block" in the development of more comprehensive standard data, have
been derived from MTM analysis of repetitive motion patterns. GPD is a
collection of tested data donated through the years by sustaining and
professional members of the MM Association for Standards and Research.
The higher-level standard data used by the ESD System, Qmi-purpoee data and
Specific data, are developed on an ongoing basis at the six Naval Air Rework
Facilities (NARF) and compiled by the NALC as part of that entity's Perfor-
mance Standards Program. The development of the mentioned data began in the
mid 19G0s and Specific Data development continues today.
SYSTEM DESCRIPTICW:
ESD is a predeter-rained time system based on MTM and is composed of two types
of data: Universal and Specific. Both are coded by using a seven-position
mnemonic coding system.
Universal data is composed of three levels of data: Basic-purpose, Multi-
purpose, and Qnni-purpose. B&sic and Multipurpose data are composed of MTM
General Purpose Data (GPD) and Multipurpose level elements provided by the MTM
Association and supplemented with NAlX>developed Multipurpose data. The third
data level, Qmi-purpose data, consists of 829 coded data elements, each
describing within limits the complete accomplishment of an element of work.
Qnni-purpose data elements embody a three-fold concept: (1) the element work
content provides for ready application to the usually observed or synthesized
requirements of a job; (2) elements portray an average of acceptable shop
-150-
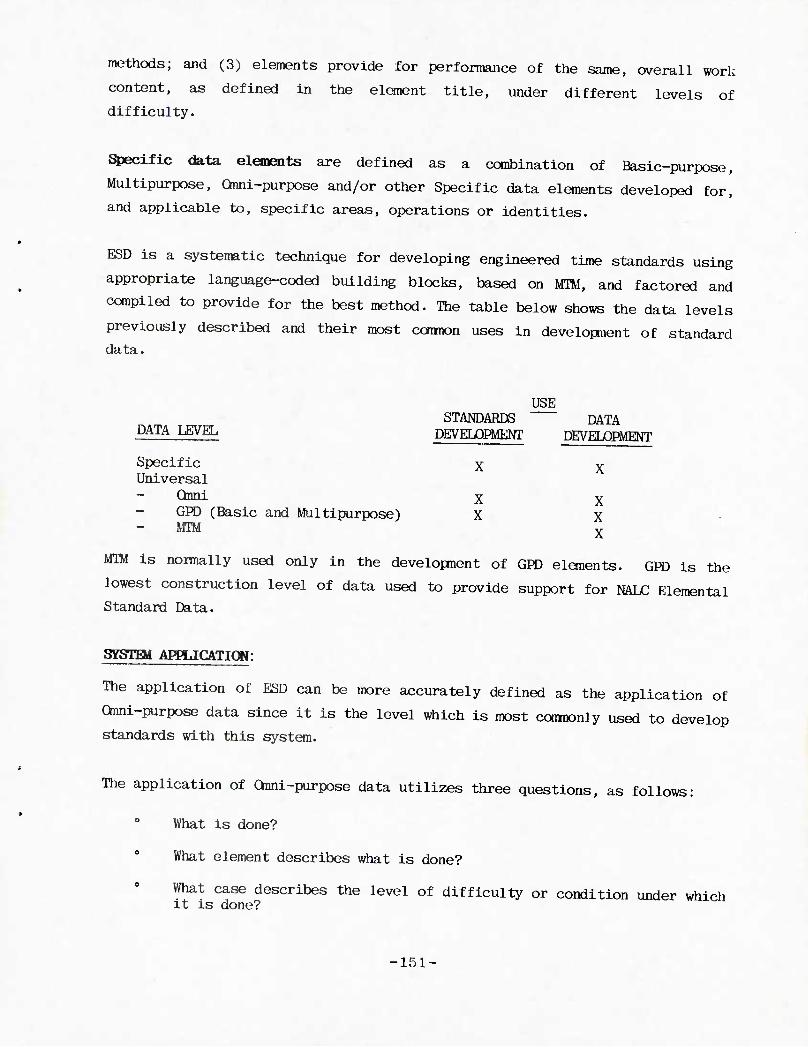
methods; and (3) elements provide for performance of the same, overall work
content, as defined in the element title, under different levels of
difficulty.
Specific data elements are defined as a combination of Basic-purpose,
Multipurpose, Qnni-purpose and/or other Specific data elements developed for,
and applicable to, specific areas, operations or identities.
ESD is a systematic technique for developing engineered time standards using
appropriate language-coded building blocks, based on MTM, and factored and
compiled to provide for the best method. The table below shows the data levels
previously described and their most coiroon uses in development of standard
data.
USE
DATA LEVEL STANDARDS
DEVELOPMENT
X
DATA DEVELOPMEN7
Specific Universal
X
Qnni X x GPD (Basic and Multipurpose) MTM
X X V
MTM is normally used only in the development of GPD elements. GPD is the
lowest construction level of data used to provide support for NALC Elemental
Standard Data.
SYSTHi APPLICATION:
The application of ESD can be more accurately defined as the application of
Qnni-purpose data since it is the level which is most comnonly used to develop
standards with this system.
The application of Qnni-purpose data utilizes three questions, as follows:
What is done?
What element describes what is done?
What case describes the level of difficulty or condition under which it is done?
-151-
Work content may be determined by observing the operation being performed or
by synthesizing the operation content prior to production. The synthesis is
obtained from technical manuals, parts, books, knowledge of shop practice, and
discussions with both shop and staff people. If synthesized, the method must
be verified by actual shop floor observation.
Standard data elements are developed by employing a seven-position mnemonic
code. The first code group is comprised of three alphas with the first alpha
designating the element level. The next two alphas designate the element
category (i.e., AC - Accurate, BM - Body Motion, CL - Clean, CP - Clamp, DP -
Dip).
The second code group. Code Positions 4 and 5, is composed of two alphas, with
the first alpha designating the general component or process category, and the
second alpha designating the specific component or process subcategory.
The third group. Code Positions 6 and 7, is composed of two alphas or an alpha
and a numeric, with the first alpha designating the operation and also whether
the element applies to the first or an additional piece being processed
(i.e., I - Install, first piece; X - Install, additional piece; R - Remove,
first piece; Y - Remove, additional piece; 0 - Other, first piece; Z - Other,
additional piece). The second digit may be an alpha or a numeric and
designates the element case. When the element is developed into a level of
difficulty structure, an alpha is used (i.e., A - Very easy; B - Easy; C -
Moderate; D - Difficult; E - Very Difficult). When the element is developed
in a structure relating to physical limitations such as a size or condition, a
numeric is used.
The development of labor standards using Omni-purpose data of the ESD system
requires defining an activity's work elements in detail by using the previous-
ly discussed seven-position mnemonic code. An example of a coded activity
(and explanation of each code) follows:
-152-
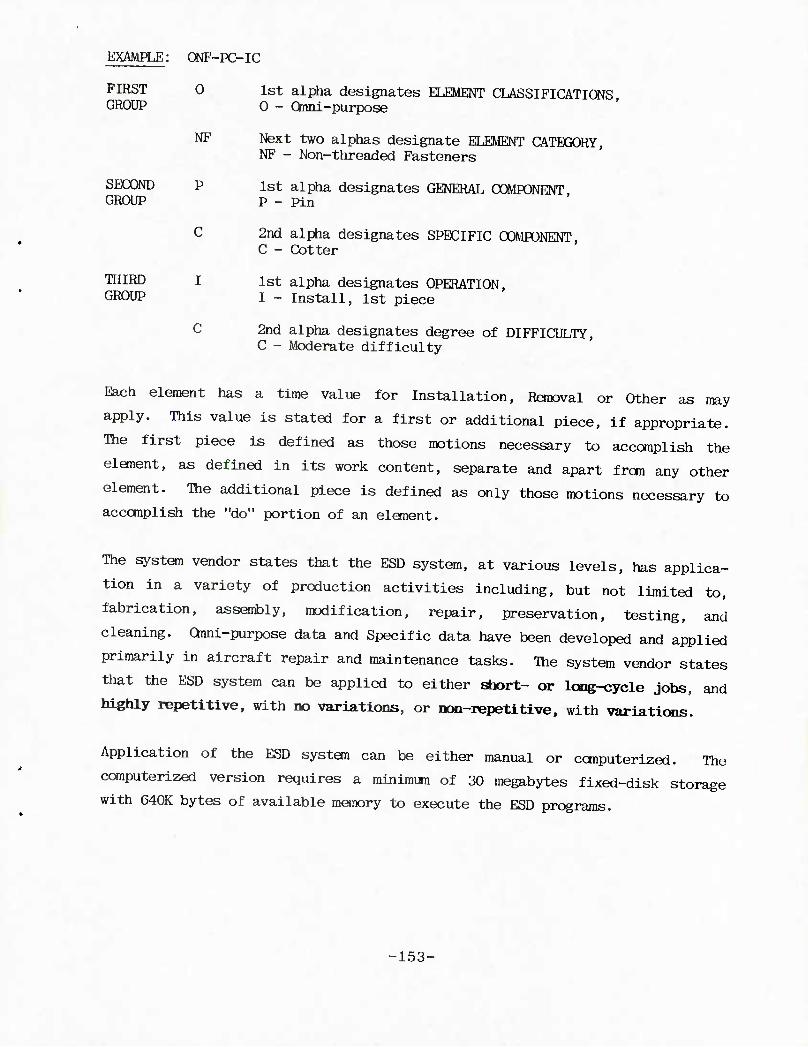
EXAMPLE: ONF-PC-IC
FIRST 0 1st alpha designates ELEMENT CLASSIFICATIONS GROUP 0 - Qnni-purpose
NF Next two alphas designate ELEMENT CATEGORY, NF - Non-threaded Fasteners
SECOND P 1st alpha designates GENERAL COMPONENT. GROUP p - pin
C 2nd alpha designates SPECIFIC COMPONENT, C - Cotter
THJRD I 1st alpha designates OPERATION, GROUP I - Install, 1st piece
C 2nd alpha designates degree of DIFFICULTY, C - Moderate difficulty
Each element has a time value for Installation, Removal or Other as may
apply. This value is stated for a first or additional piece, if appropriate.
The first piece is defined as those motions necessary to accomplish the
element, as defined in its work content, separate and apart frcm any other
element. Hie additional piece is defined as only those motions necessary to
acccmplish the "do" portion of an element.
The system vendor states that the ESD system, at various levels, has applica-
tion in a variety of production activities including, but not limited to,
fabrication, assembly, modification, repair, preservation, testing, and
cleaning. Qnni-purpose data and Specific data have been developed and applied
primarily in aircraft repair and maintenance tasks. The system vendor states
that the ESD system can be applied to either short- or long-cycle jobs, and
highly repetitive, with no variations, or non-repetitive, with variations.
Application of the ESD system can be either manual or conputerized. The
computerized version requires a minimum of 30 megabytes fixed-disk storage
with 640K bytes of available memory to execute the ESD programs.
■153-
TOAINING/TBCHNICAL ASSISTANCE:
Successful application of the ESD work measurement system requires that the
analyst be trained in MlSfr-l prior to being trained in the use of ESD. MTM-1
training is provided by MTM-certified instructors at the MM Association
training site, the user's facility, or at one of the six Naval Air Rework
Facilities. ESD training is provided by NALC instructors at the user's
facilities or at one of the six NARFs. The training course covers the
methodology and application of MTM-GPD, Qnni-purpose, and Specific data. The
ESD course takes four weeks to complete and is followed by a certification
exam.
SYSTEM OOBTS:
The ESD system has been used almost exclusively within the United States
government. It is for this reason that the Naval Aviation Logistics Center
prefers to address system cost information on a per-request basis from
interested ccrapanies.
COMFLIANCE WITH MIL STD 1567A:
Since no statistical backup data was available to verify the theoretical
accuracy of the system, it was impossible to evaluate the ability of the ESD
predetermined time system to comply with specific requirements set forth in
Paragraph 5.1 of MIL STD 1567A for Type I Engineered Labor Standards. Those
basic requirements, as specified in the MIL STD, which are in question are as
follows:
All Type I standards must reflect an accuracy of +10% with a 90% or
greater confidence at the operation level.
Those requirements which the system does meet are as follows:
0 Documentation of an operations analysis.
A record of standard practice or method followed when the standard
was developed.
-154-
0 A record of rating or leveling.
A record of the standard time computation including allowances.
A record of observed or predetermined time system time values used in
determining the final standard time.
Provision of an audit trail down to the elemental standard time
level.
STMMGTHS AND WEAKNESSES:
Strengths and weaknesses and/or constraints identified are based on
discussions with users of the ESD predetemined time system. The comients
listed below are based on these discussions and, while a broad range of
industries were sampled, coranents should not be considered universal and
therefore may not be applicable to all manufacturing environments:
As a standard data system, it provides a substantial amount of data
primarily related to repair and maintenance activities of aircraft,
avionic and ground-support equipment, thereby reducing standards
development efforts.
The system has various levels of data that can be used to develop
standard data for activities not covered by the higher-level standarti
data.
The Department of Defense requires an extremely comprehensive
training and certification program prior to using the system.
The standard data contained in the system lias not been periodically
reviewed to ensure accuracy and consistency of the backup data.
C^timal use of the system requires a knowledge of the repair and
maintenance activities of aircraft, avionic and ground-support
equipment.
-155-
SYSTHI osHts:
The ESD system has been used extensively by defense-related contractors in a
variety of work areas. Specific data has been developed and used primarily by
the Naval Air Rework Facilities in aircraft and avionic equipment repair and
maintenance activities.
REFHffiNCK SOURCE:
Naval Air Rework Facility
-156-
WORK-FACTOR®
OONTACT: James S. McGurk, V. P., Operations OOKPANY: Science Management Corporation ADDRESS: P.O. BOX 0600, 140 Allen Road, Liberty Corners,
Basking Ridge, NJ 07938 PHCNE: (201) 647-7000
SYSTEM HISTORY:
lork-Pactor® research was initiated in 1934 in a large manufacturing
corporation by a group of industrial engineers whose objective it was to
develop a system which would remove the element of human judgment which
existed in stopwatch time study, and caused much labor-management strife.
The Work-Factor® Time Values were developed fron thousands of observations
taken in the shop and checked in the laboratory over a period of several
years. These observations involved the use of special stopwatches,
micromotion analysis of films, stroboscopic-camera measurements, and the use
of special photoelectric timing devices. The research was conducted in
factories and offices, using actual workers performing actual operations under
prevailing working conditions.
Having spent a year checking, correcting, and simplifying the System, it was
placed in general use in 1938. Over the next several years, it was recognized
that less stringent analysis was appropriate in different situations (i.e.,
mass production, medium-quantity production, and small-quantity production.)
To acconmodate this, second and third levels of Work-Factor® were developed.
These are called Ready Work-Factor®, and Brief Work-Factor®.
In addition, a computer application program, W000M II, has been developed to
enhance the Work-Factor® methods. The System may be set up to utilize either
the Detailed, Ready, or Brief Work-Factor® tables or it may utilize any
combination of these methods simultaneously.
-157-
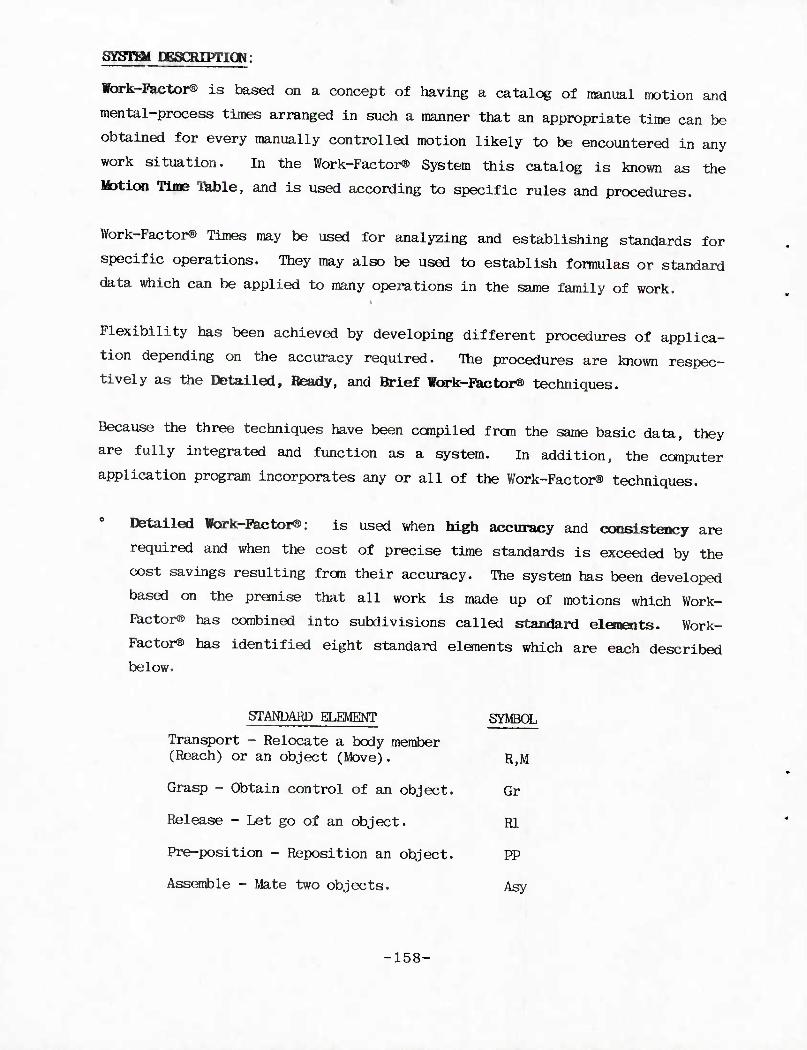
SYSTQI EESCRIPTIOW:
Wbrk-Pactor® is based on a concept of having a catalog of manual motion and
mental-process times arranged in such a manner that an appropriate time can be
obtained for every manually controlled motion likely to be encountered in any
work situation. In the Work-Factor® System this catalog is known as the
Motion Tine Table, and is used according to specific rules and procedures.
Work-Factor® Times may be used for analyzing and establishing standards for
specific operations. They may also be used to establish formulas or standard
data which can be applied to many operations in the same family of work.
Flexibility has been achieved by developing different procedures of applica-
tion depending on the accuracy required. The procedures are known respec-
tively as the Detailed, Ready, and Brief Work-Factor® techniques.
Because the three techniques have been compiled from the same basic data, they
are fully integrated and function as a system. In addition, the computer
application program incorporates any or all of the Work-Factor® techniques.
Detailed Work-Factor®: is used when high accuracy and consistency are
required and when the cost of precise time standards is exceeded by the
cost savings resulting from their accuracy. The system has been developed
based on the premise that all work is made up of motions which Work-
Factor® has combined into subdivisions called standard elements. Work-
Factor® has identified eight standard elements which are each described
below.
STANDARD ELEMENT SYMBOL
Transport - Relocate a body member (Reach) or an object (Move). R,M
Grasp - Obtain control of an object. Gr
Release - Let go of an object. Rl
Pre-position - Reposition an object. PP
Assemble - Mate two objects. Asy
-158-
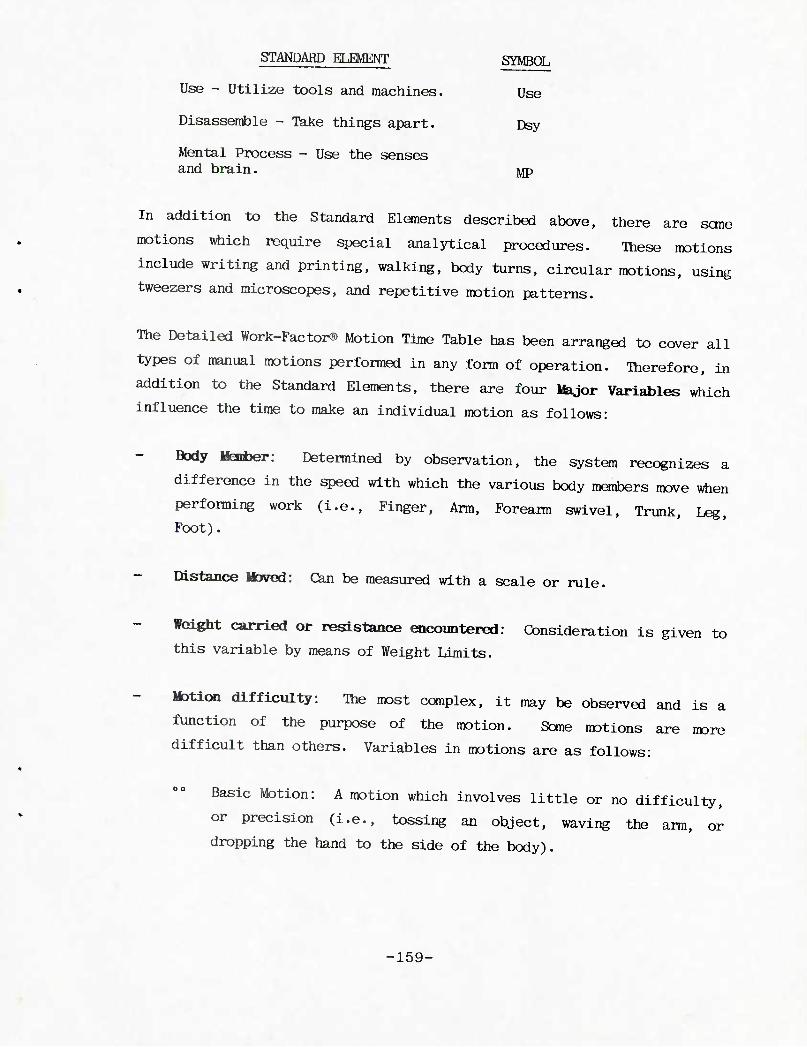
STANDARD ELEMENT SYMBOL
Use - Utilize tools and machines. Use
Disassemble - Take things apart. Dsy
Mental Process - Use the senses and brain. MP
In addition to the Standard Elements described above, there are sane
motions which require special analytical procedures. These motions
include writing and printing, walking, body turns, circular motions, using
tweezers and microscopes, and repetitive motion patterns.
The Detailed Work-Factor® Motion Time Table has been arranged to cover all
types of manual motions perfoiroed in any form of operation. Therefore, in
addition to the Standard Elements, there are four Ifajor Variables which
influence the time to make an individual motion as follows:
Body Menfcer: Deterrolned by observation, the system recognizes a
difference in the speed with which the various body members move when
perfoming work (i.e.. Finger, Arm, Foream swivel. Trunk, Leg,
Foot).
Distance Moved: Can be measured with a scale or rule.
Weight carried or resistance encountered: Consideration is given to
this variable by means of Weight Limits.
Motion difficulty: The most complex, it may be observed and is a
function of the purpose of the motion. Some motions are more
difficult than others. Variables in motions are as follows:
Basic Motion: A motion which involves little or no difficulty,
or precision (i.e., tossing an object, waving the arm, or
dropping the hand to the side of the body).
-159-
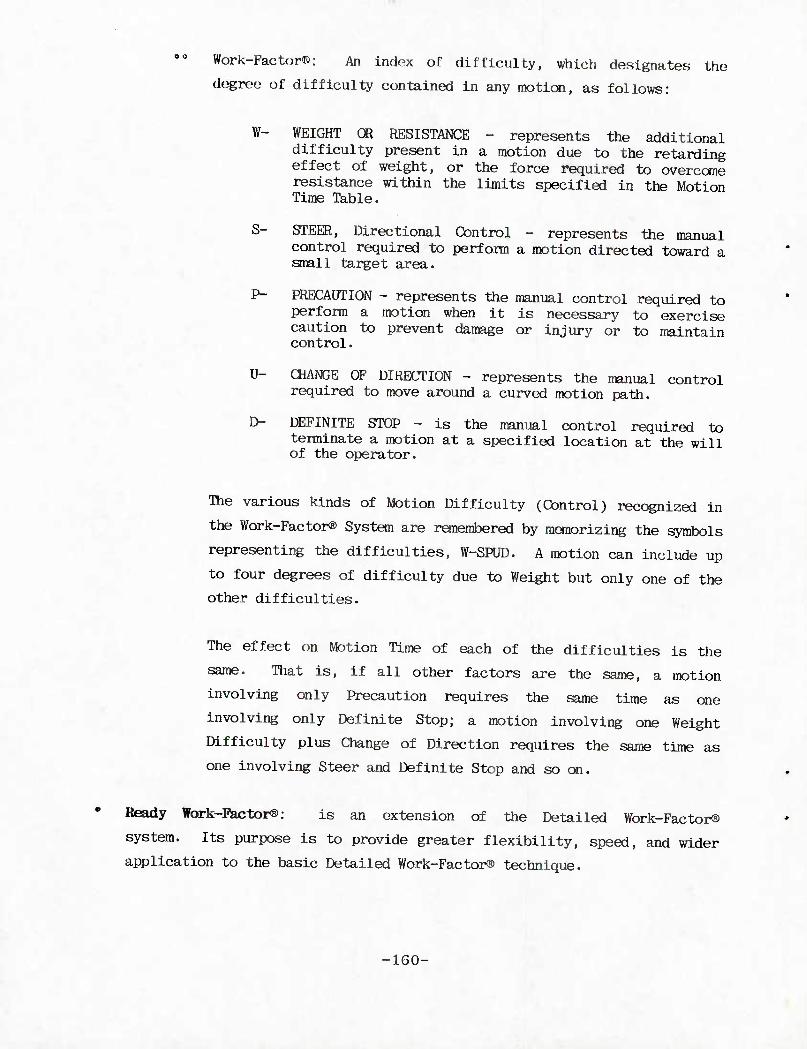
o o Work-Factor®: An Index of difficulty, which designates the
degree of difficulty contained in any motion, as follows:
W- WEIGHT OR RESISTANCE - represents the additional difficulty present in a motion due to the retarding effect of weight, or the force required to overcome resistance within the limits specified in the Motion Time Table.
S- STEER, Directional Control - represents the manual control required to perform a motion directed toward a small target area.
P- PRECAUTION - represents the manual control required to perform a motion when it is necessary to exercise caution to prevent damage or injury or to maintain control.
U- CHANGE OF DIRECTION - represents the manual control required to move around a curved motion path.
D- DEFINITE STOP - is the manual control required to terminate a motion at a specified location at the will of the operator.
The various kinds of Motion Difficulty (Control) recognized in
the Work-Factor® System are remembered by memorizing the symbols
representing the difficulties, W-SPUD. A motion can include up
to four degrees of difficulty due to Weight but only one of the
other difficulties.
The effect on Motion Time of each of the difficulties is the
same. That is, if all other factors are the same, a motion
involving only Precaution requires the same time as one
involving only Definite Stop; a motion involving one Weight
Difficulty plus Change of Direction requires the same time as
one involving Steer and Definite Stop and so on.
Ready Work-Factor®: is an extension of the Detailed Work-Factor®
system. Its purpose is to provide greater flexibility, speed, and wider
application to the basic Detailed Work-Factor® technique.
-160-
The same standard elements as used in Detailed Work-Factor® are also used
in Ready Work-Factor®. The Major Variables identified in Detailed are the
same in Ready. Two of the variables, while using the same rules as in
Detailed, are expressed differently as follows:
Motion Distance: It should be noticed that the Ready Work-Factor®
system describes distances two ways—with words and in inches. A
"very short" motion is any distance up to four inches. A "short"
motion ranges anywhere from over four inches up to and including 10
inches, etc.
Motion Difficulty: is described in the same fashion—in words and in
terms of Work-Factors®. A "Very Easy" motion is a basic motion with
no Work-Factors®, an "Easy" motion has one Work-Factor®, an "Average"
motion has two Work-Factors®, etc.
Through simple graphic terminology and a minimum number of time values,
the Ready Work-Factor® System creates a work-time association in the minds
of its users. Time values become thoughts, easily applied mentally and
conversationally.
Used in conjunction with a few simple rules and guideposts, these time
values are suitable for establishing time standards in almost all
applications, including measured day work and incentive operations.
Brief Work-Eactor®: also based on Detailed Work-Factor®, has been
designed to measure non-repetitive work and provide accuracy with a
minimum of analytical effort and time.
Brief Work-Factor® Time Values are provided for all human work except that
controlled by machines or processes the same as in Detailed and Ready.
There are four simple tables covering the Work-Segments: (1) Pick-up, (2)
Assemble, (3) Move Aside and Move Motions, and (4) Other Work Segments.
-161-
Six different time values (0, .005, .010, .015, .020, and .025) appear on
the table. These are in minutes but appear on the table without the
decimal points and zeros for simplicity.
In addition to regular Brief Work-Factor®, an abridged Brief Work-Factor®
method is used for very rapid application needed for estimating and
similar work. The abridged version uses only three time values (.005,
.010, .020).
SYSTai APHJCATIOW:
In general, Work-Factor® operation times are based on the application of
predetermined times to each individual motion required to perform a segment of
work. To determine the operation time using Work-Factor®:
Analyze the job to determine the necessary motions. Whether observed
or visualized, the method must be verified by actual shop floor
observation.
Apply predetermined elemental times to each necessary motion.
Total the times and make appropriate allowances for personal time,
fatigue, unavoidable delays, and incentive potential.
Detailed Work-Flactor®: When analyzing an operation using this technique,
the analysis for each Standard Element is written using symbols and
numbers which describe the variables involved. All time values used in
Detailed Work-Factor® are found in a single table called the Detailed
Motion Time Table. Some of its features are:
Separate tables are provided for each Standard Element. Eich table
reflects the variables affecting the time for that element. (Times
for parts of sane Standard Elements, Simple Grasp for example, are
obtained iron the Transport Time Table.)
Time values are expressed in Work-Factor® Time Units (W-F Units).
One Work-Factor® Time Unit equals .0001 minutes.
-162-
Dimensional and other limits are expressed in terms of:
-X: Over the previous value, up to and including X; and:
>X: Greater than X.
Having written the elemental descriptions and analyses, the analyst, using
the Time Table, must find the Standard Element involved. Locating the
time value within the Table and using the variables described in the
analysis, the analyst will prepare a standard as follows:
Move bolt to hole in plate
Reach 18 inches to bolts A18D 76 Gr bolt Cyl 1/4x2 36 PP bolt PP-0-50% 24 Move bolt to hole A18SD 98
Total 234 or .0234 minutes
The Reach and Move time values were taken from the Transport Table, the
Grasp (Gr) from the Complex Grasp Table and the Pre-position (PP) from the
Pre-position Table.
When the Motion Time Table for Finger is used, the analysis will appear as
illustrated:
Pick up 4 lb. building block and move it to stack.
Reach 24 inch to brick A24D 86 Grasp brick FIW^ 29 Move brick 35 inches to stack A35W2SD 171
Total 286 or .0286 minutes
The Reach and Move time values were taken fron the Transport Table and the
Grasp time value was taken from the Motion Time Table for the Body Member
used (i.e., finger (F)).
-163-
Heady Work-Factor®: When analyzing an operation using this technique, the
analyst documents each Standard Element using symbols and numbers which
describe the variables involved. All time values used in Ready Work-
Factor® are found in a single table called the Ready Work-Factor® Time
Table. Sane of its features are:
Separate tables are provided for each Standard Element except Disassemble. Each table reflects the variables affecting the time for that element. A section covering Body Motions and a few special motions is also included.
All time values are printed in red and are expressed in Ready Time Units (RU's). One Ready Time Unit equals 0.001 minutes.
Dimensional and other limits are expressed in terms of:
-X: Over the previous value, up to and including X; and
>X: Greater than X.
The time values are all simple numbers which follow an orderly sequence. Thus, frequently used values can be memorized.
Having written the elemental descriptions and analyses, the analyst, using
the Time Table, must find the Standard Element involved. Locating the
time value within the Table and using the variables described in the
analysis, the analyst will prepare a standard as follows:
Move bolt to hole in plate
Reach 18" to bolts 20-1 7 Grasp bolt 2 3 Pre-position bolt 0-50% 2 Move bolt to hole 20-2 9
Total 21 or .021 minutes
The Reach and Move time values were taken fran the Transport Table, the
Grasp from the Grasp table, and the Pre-position time value from the Pre-
position table. The Reach and Move parameters both required the
application of Work-Factors®. The Move required one (20-1) and the Reach
two (20-2). The 20 signifies the distance was within 20 inches (and
greater than 10 inches).
-164-
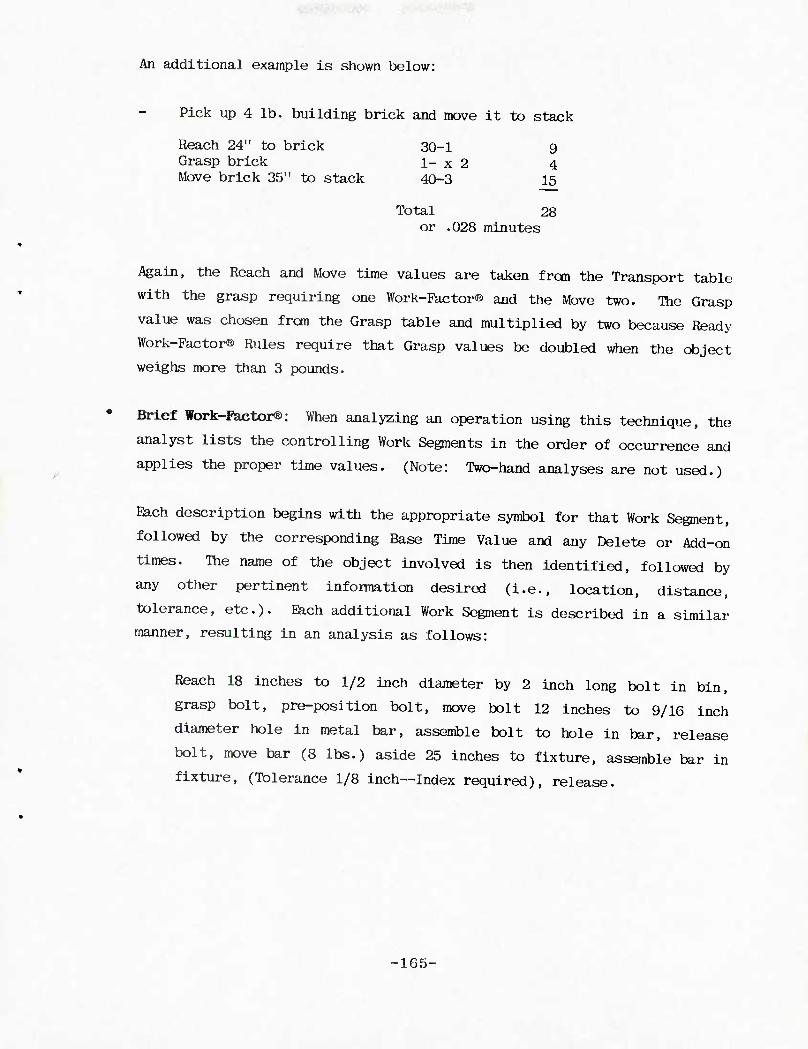
A
An additional example is shown below:
Pick up 4 lb. building brick and move it to stack
Reach 24" to brick 30-1 9 Grasp brick 1- x 2 4 Move brick 35" to stack 40-3 15
Total 28 or .028 minutes
Again, the Reach and Move time values are taken fron the Transport table
with the grasp requiring one Work-Factor® and the Move two. The Grasp
value was chosen fron the Grasp table and multiplied by two because Ready
Work-Factor® Rules require that Grasp values be doubled when the object
weighs more than 3 pounds.
Brief Work-Flactor®: When analyzing an operation using this technique, the
analyst lists the controlling Work Segments in the order of occurrence and
applies the proper time values. (Note: Two-hand analyses are not used.)
Each description begins with the appropriate symbol for that Work Segment,
followed by the corresponding Base Time Value and any Delete or Add-on
times. The name of the object involved is then identified, followed by
any other pertinent infomation desired (i.e., location, distance,
tolerance, etc.). Each additional Work Segment is described in a similar
manner, resulting in an analysis as follows:
Reach 18 inches to 1/2 inch diameter by 2 inch long bolt in bin,
grasp bolt, pre-position bolt, move bolt 12 inches to 9/16 inch
diameter hole in metal bar, assemble bolt to hole in bar, release
bolt, move bar (8 lbs.) aside 25 inches to fixture, assemble bar in
fixture, (Tolerance 1/8 inch—Index required), release.
-165-
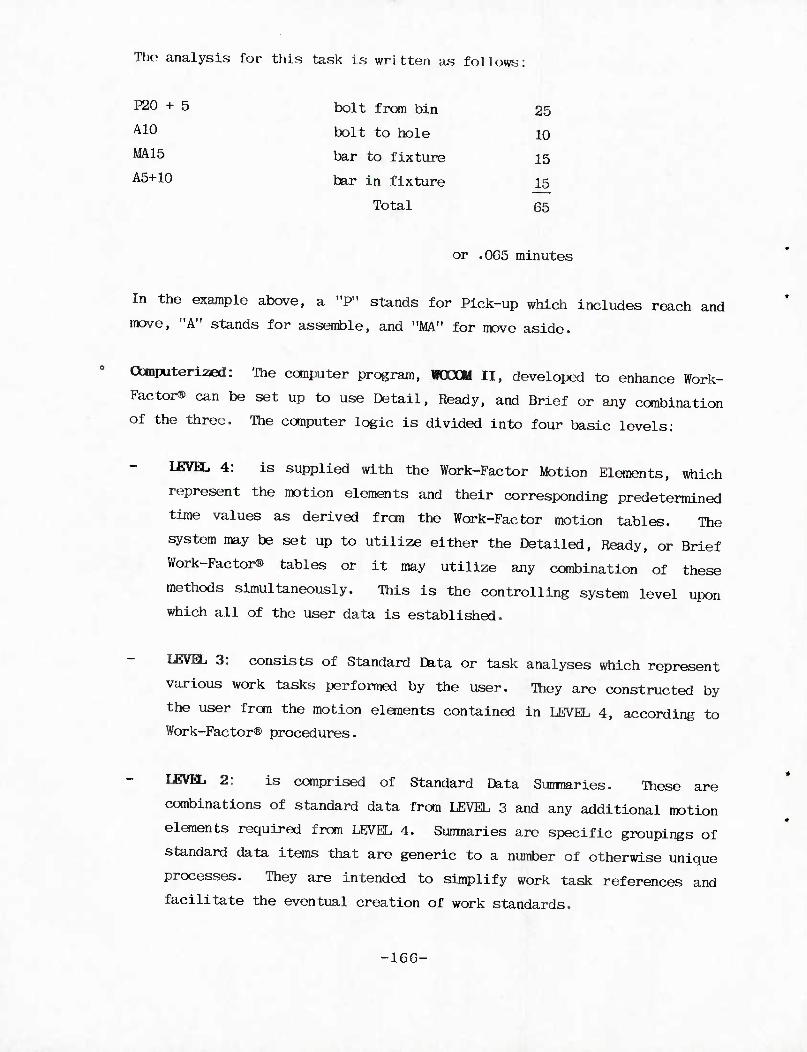
The analysis for this task is written as foil ows:
bolt from bin 25
bolt to hole 10
bar to fixture 15
bar in fixture 15
Total 65
P20 + 5
A10
MA15
A5+10
or .065 minutes
In the example above, a "P" stands for Pick-up which includes reach and
move, "A" stands for assemble, and "MA" for move aside.
Oomputerized: The computer program, W00CM II, developed to enhance Work-
Factor® can be set up to use Detail, Ready, and Brief or any combination
of the three. The computer logic is divided into four basic levels:
LEVEL 4: is supplied with the Work-Factor Motion Elements, which
represent the motion elements and their corresponding predetermined
time values as derived fron the Work-Factor motion tables. The
system may be set up to utilize either the Detailed, Ready, or Brief
Work-Factor® tables or it may utilize any combination of these
methods simultaneously. Ibis is the controlling system level upon
which all of the user data is established.
I£VEL 3: consists of Standard Data or task analyses which represent
various work tasks performed by the user. They are constructed by
the user from the motion elements contained in LEVEL 4, according to
Work-Factor® procedures.
IEVH. 2: is comprised of Standard Data Sumnaries. These are
combinations of standard data from LEVEL 3 and any additional motion
elements required from LEVEL 4. Sunmaries are specific groupings of
standard data items that are generic to a number of otherwise unique
processes. They are intended to simplify work task references and
facilitate the eventual creation of work standards.
-166-
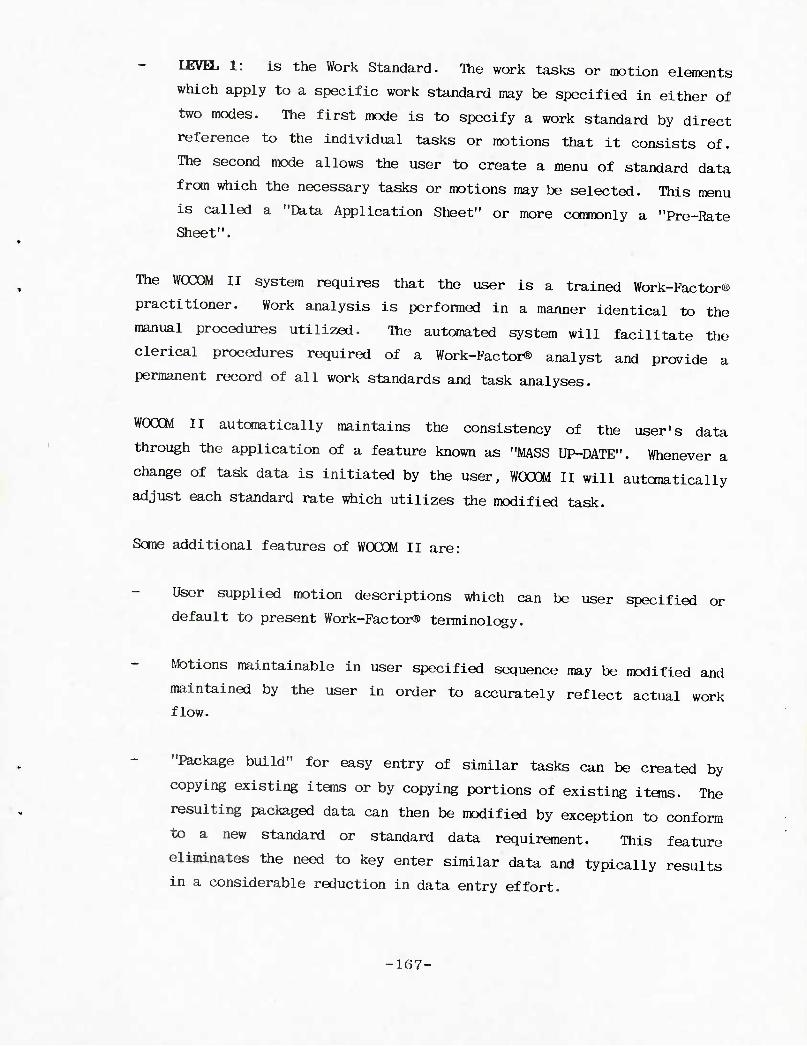
lEVa. 1: is the Work Standard. The work tasks or motion elements
which apply to a specific work standard may be specified in either of
two modes. The first mode is to specify a work standard by direct
reference to the individual tasks or motions that it consists of.
The second mode allows the user to create a menu of standard data
from which the necessary tasks or motions may be selected. This menu
is called a "Data Application Sheet" or more comnonly a "Pre-Rate
Sheet".
The WOCOM 11 system requires that the user is a trained Work-Factor®
practitioner. Work analysis is performed in a manner identical to the
manual procedures utilized. The automated system will facilitate the
clerical procedures required of a Work-Factor® analyst and provide a
permanent record of all work standards and task analyses.
WOOOM II automatically maintains the consistency of the user's data
through the application of a feature known as "MASS UP-DATE". Whenever a
change of task data is initiated by the user, WOCOM II will automatically
adjust each standard rate which utilizes the modified task.
Some additional features of WOOOM II are:
User supplied motion descriptions which can be user specified or
default to present Work-Factor® terminology.
Motions maintainable in user specified sequence may be modified and
maintained by the user in order to accurately reflect actual work
flow.
"Package build" for easy entry of similar tasks can be created by
copying existing items or by copying portions of existing items. The
resulting packaged data can then be modified by exception to conform
to a new standard or standard data requirement. This feature
eliminates the need to key enter similar data and typically results
in a considerable reduction in data entry effort.
-167-
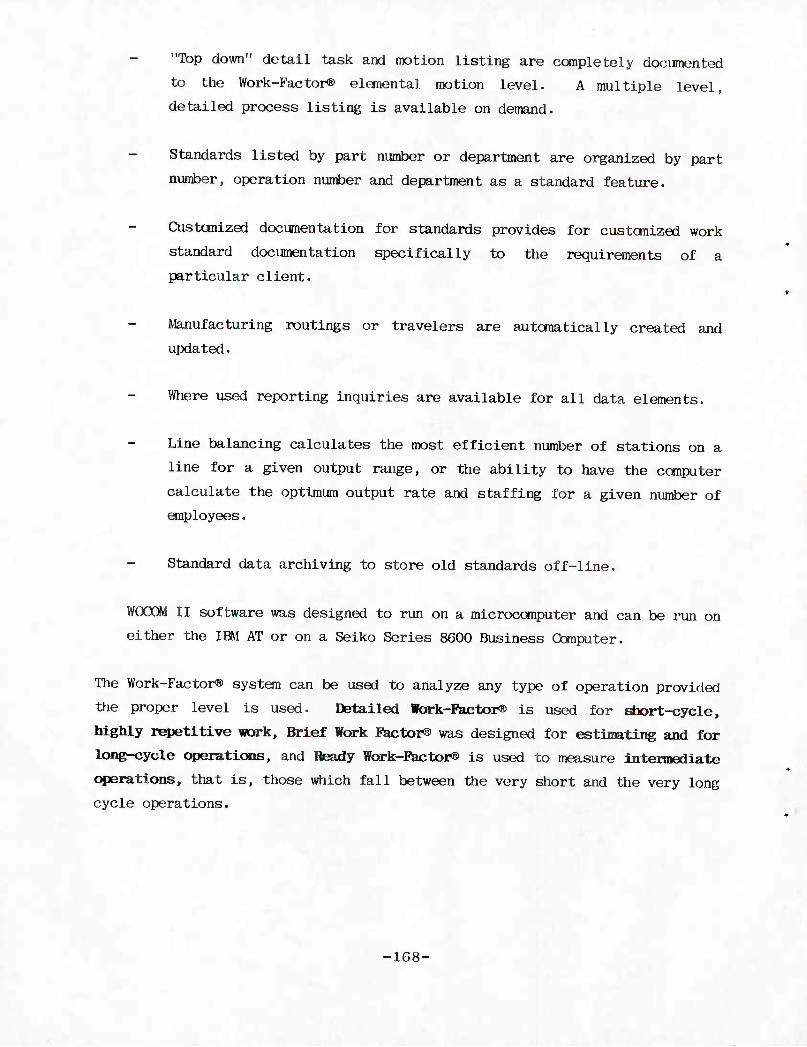
"Top down" detail task and motion listing are completely documented
to the Work-Factor® elemental motion level. A multiple level,
detailed process listing is available on demand.
Standards listed by part number or department are organized by part
number, operation number and department as a standard feature.
Custanized documentation for standards provides for custctnized work
standard documentation specifically to the requirements of a
particular client.
Manufacturing routings or travelers are automatically created and
updated.
Where used reporting inquiries are available for all data elements.
Line balancing calculates the most efficient number of stations on a
line for a given output range, or the ability to have the conputer
calculate the optimum output rate and staffing for a given number of
employees.
Standard data archiving to store old standards off-line.
WOOOM II software was designed to run on a microconputer and can be run on
either the IBM AT or on a Seiko Series 8600 Business Conputer.
The Work-Factor® system can be used to analyze any type of operation provided
the proper level is used. Detailed lark-Rictoi^ is used for sfaort-cycle,
highly repetitive work. Brief Work Factoi® was designed for estimting and for
long-cycle operations, and Beady Work-F!actor® is used to measure intermediate
operations, that is, those which fall between the very short and the very long
cycle operations.
■1G8-
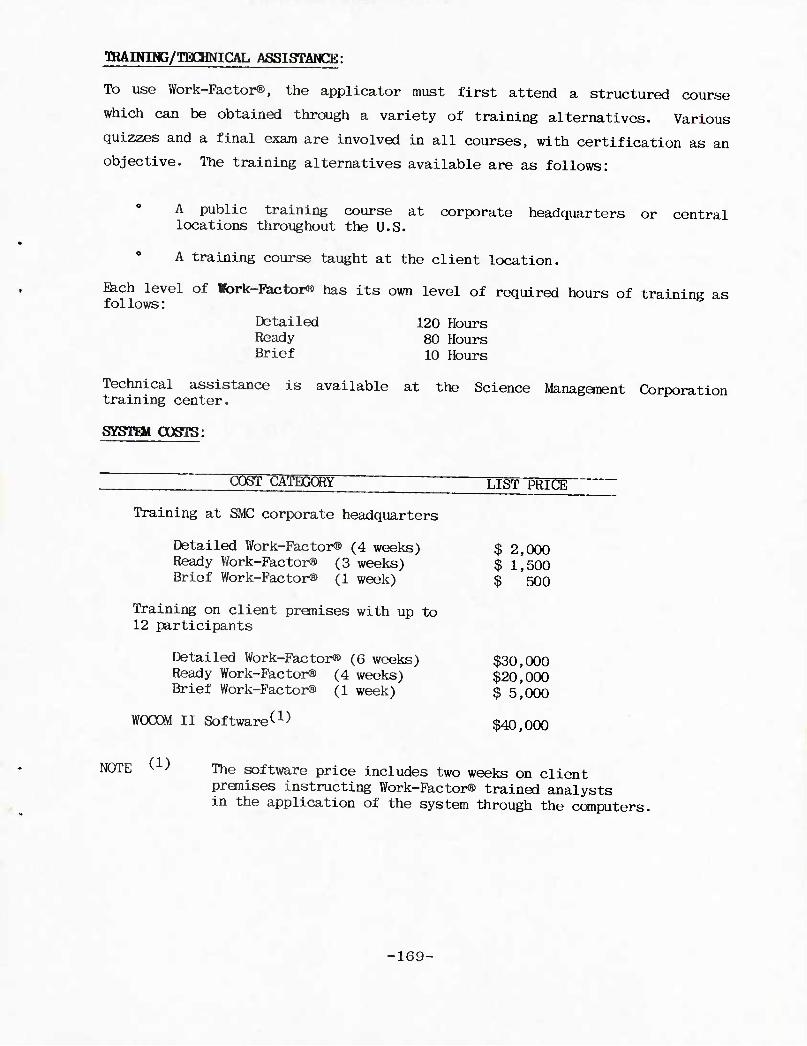
TSAINING/TEaBNICAL ASSISTANCE:
To use Work-Factor®, the applicator must first attend a structured course
which can be obtained through a variety of training alternatives. Various
quizzes and a final exam are involved in all courses, with certification as an
objective. The training alternatives available are as follows:
A public training course at corporate headquarters or central locations throughout the U.S.
A training course taught at the client location.
Each level of Work-Eactor® has its own level of required hours of training as follows:
Detailed 120 Hours Ready 80 Hours Brief 10 Hours
Technical assistance is available at the Science Management Corporation training center.
SYSTHI COSTS:
"C5ST CATEGORY LIST PRICE
Training at SMC corporate headquarters
Detailed Work-Factor® (4 weeks) $ 2,000 Ready Vfork-Factor® (3 weeks) $1,500 Brief Work-Factor® (1 week) $ 500
Training on client premises with up to 12 participants
Detailed Work-Factor® (6 weeks) $30,000 Ready Work-Factor® (4 weeks) $20^000 Brief Work-Factor® (1 week) $ 5,000
WOCQM II Software^1) $40,000
NOTE ( ' The software price includes two weeks on client premises instructing Work-Factor® trained analysts in the application of the system through the computers.
-169-
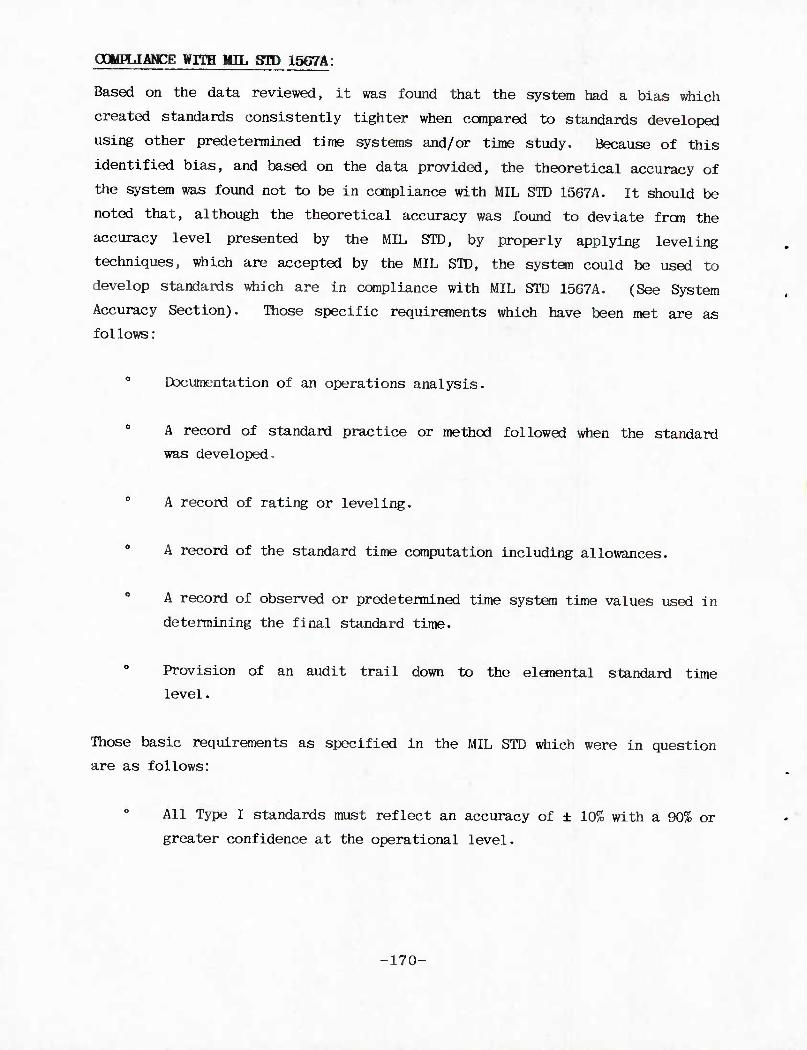
OOMHJANCE WITH MIL STD 1567A:
Based on the data reviewed, it was found that the system had a bias which
created standards consistently tighter when compared to standards developed
using other predetermined time systems and/or time study. Because of this
identified bias, and based on the data provided, the theoretical accuracy of
the system was found not to be in compliance with MIL STD 1567A. It should be
noted that, although the theoretical accuracy was found to deviate fron the
accuracy level presented by the MIL STD, by properly applying leveling
techniques, which are accepted by the MIL STD, the system could be used to
develop standards which are in compliance with MIL STD 1567A. (See System
Accuracy Section). Those specific requirements which have been met are as
follows:
0 Documentation of an operations analysis.
A record of standard practice or method followed when the standard
was developed.
0 A record of rating or leveling.
A record of the standard time computation including allowances.
A record of observed or predetermined time system time values used in
determining the final standard time.
Provision of an audit trail down to the elemental standard time
level.
Those basic requirements as specified in the MIL STD which were in question
are as follows:
All Type I standards must reflect an accuracy of ± 10% with a 90% or
greater confidence at the operational level.
-170-
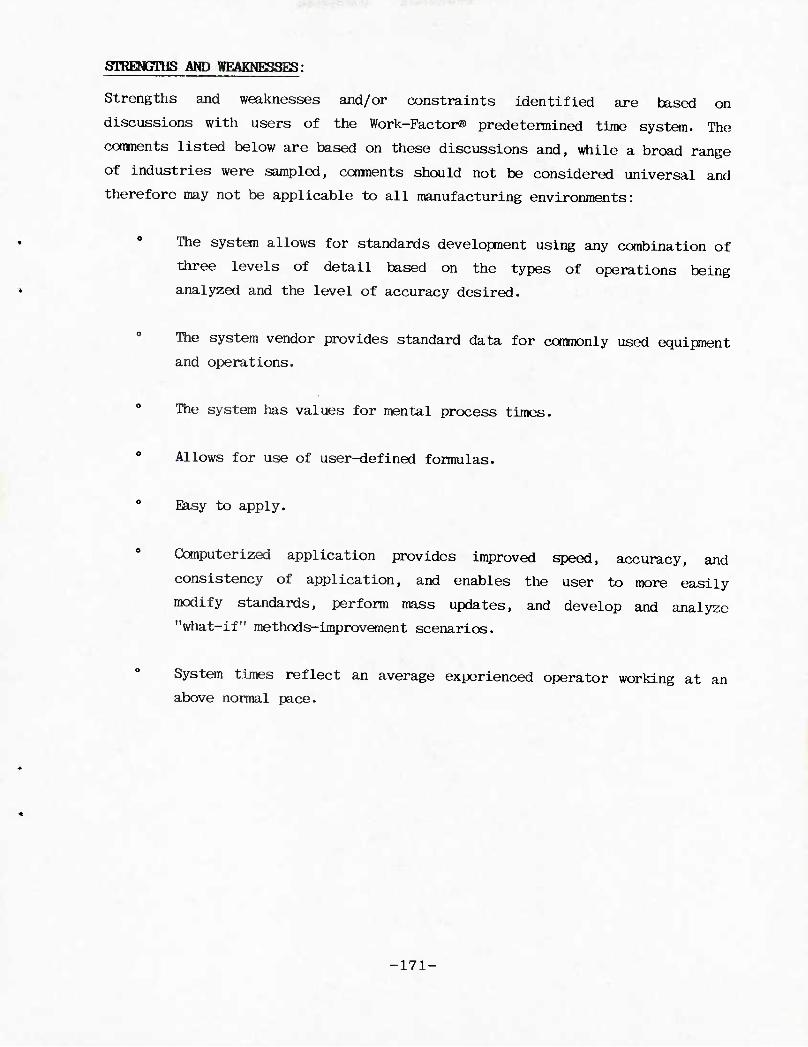
STRENGTHS AND WEAKNESSES:
Strengths and weaknesses and/or constraints identified are based on
discussions with users of the Work-Factor® predetermined time system. The
comments listed below are based on these discussions and, while a broad range
of industries were sampled, conments should not be considered universal and
therefore may not be applicable to all manufacturing environments:
The system allows for standards development using any combination of
three levels of detail based on the types of operations being
analyzed and the level of accuracy desired.
The system vendor provides standard data for commonly used equipment
and operations.
The system lias values for mental process times.
0 Allows for use of user-defined formulas.
0 Easy to apply.
Computerized application provides improved speed, accuracy, and
consistency of application, and enables the user to more easily
modify standards, perform mass updates, and develop and analyze
"what-if" methods-improvement scenarios.
System times reflect an average experienced operator working at an
above normal pace.
-171-
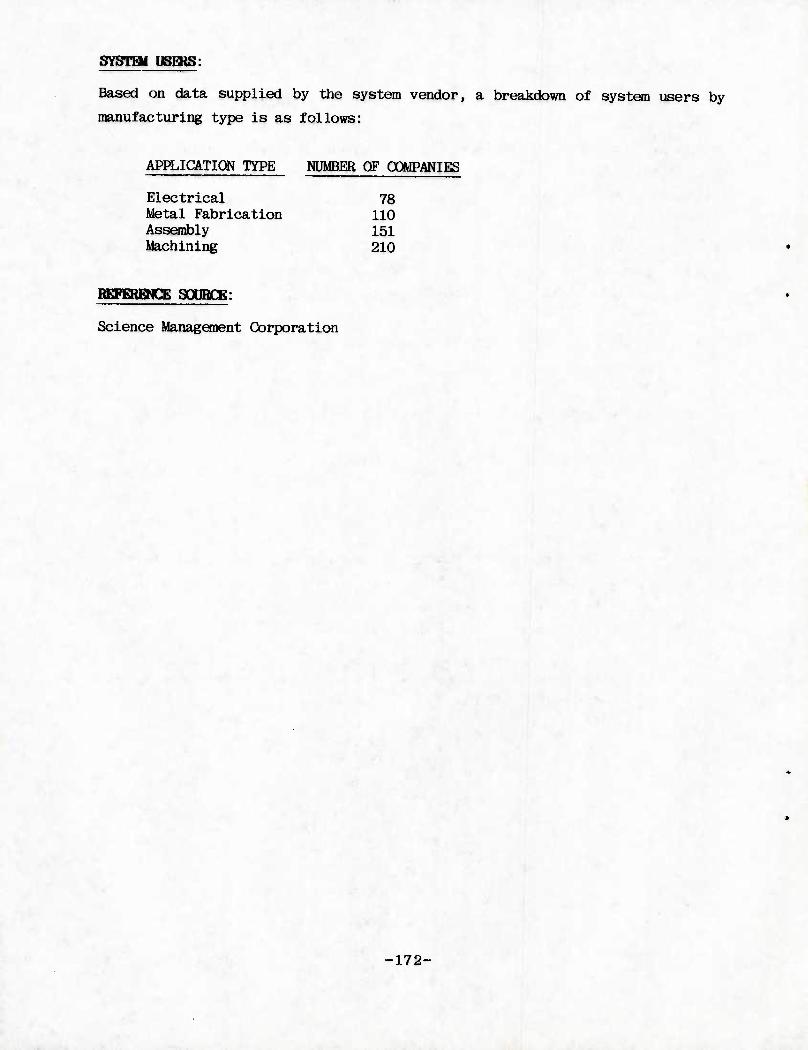
SYSTHi USEHS:
Based on data supplied by the system vendor, a breakdown of system users by
manufacturing type is as follows:
APPLICATION TYPE
Electrical Metal Fabrication Assembly Machining
NUMBER OF COMPANIES
78 110 151 210
BEPERBCE 80DBCE:
Science Management Corporation
-172-
UNIVEL®
OONTACT: Richard T. Jennings, Senior Vice President OCMPANY: Management Science, Inc. ADDRESS: P.O. Box 1310, 591 Alano Pintado Road, Solvang, CA 93463 FHONE: (805) 688-2488
SYSTHI HISTORY:
Developnent of the UNIVHi® system and its universal math models began in 1955
in the United States. The idea of universal formulas stenmed from work being
done on a statistical sampling program to develop time and cost formulae for
material-handling applications.
A group of manufacturing engineers was assigned to develop standard times for
macroscopic, elemental manual work functions. The initial sample studies
consisted of 14,400 elemental observations taken randomly over a period of six
months, and were of 360 different manufacturing operations in machining and
assembly.
Based on these 14,400 elemental observations, geometric formulae and curves
were developed to predict average elemental times within 5%, 99.7% of the
time, according to the system vendor. Originally, comprehensive standard data
books were developed fron these curves, and applications of elemental
standards and methods instruction were developed for machining and assembly
operations.
In 1964, Management Science, Inc. was founded for the purpose of developing
computer software utilizing the universal formulae. The initial installation
of this software, called UNIVEL®, was completed in 1966.
SYSTHI EESCRIPTIOW:
UNIVHiS' is a software system which generates detailed operator instructions
and the associated standard times, and places this information, along with
related cost and engineering infomation, into computer files for use in
manufacturing production planning and control applications. The UNIVEL®
system utilizes a proprietary algorithm to define manual work elements.
-173-
The UNIVED® software system uses group-technology techniques to develop
fajnilies of parts with similar processes, and classifies operations that have
multiple use in fabrication and assembly.
Elemental standard times are generated by the computer, utilizing the
universal formulae. Because the computer recalculates a standard each time it
is accessed, it eliminates the use of standard data. In addition, the system
does not require any averaging due to the fact that exact job variables can be
coded into the system.
When developing standards with UNIVEL®, the universal formulae automatically
compensate for the following: interdependency of elemental functions; weight,
sizes and complexity of objects; hand, body, mental and visual element
combinations; and inertial and reactional circumstances.
UNIVEL® is sold as a module in computer-integrated manufacturing (CIM)
software systems. Management Science, Inc. markets two CIM systems: MICROCAM
for personal computers and microcomputers, and UNIVATION® for mainframe
computers.
MICROCAM is designed to aid in the planning and control of the manufacturing
process. MICROCAM contains seven integrated software modules which can be
used separately or together. The seven modules are as follows:
UNIVHiS): methods instructions, associated standard-time and data-
base generation. The data base has 11 restriction finders by which
it can be accessed (i.e., material, machine, shift, etc.). Mass
updating is also available.
IMICCIIP: adds, deletes, or changes any additional formulae needed in
the development of elemental standard times.
MIMIOOISP: provides the ability to develop, store and retrieve mini
sets of methods and processes that are common to families of parts.
-174-
UNIFORM: allows the simulation of manufacturing procedures which are
long-cycle or non-repetitive in nature (i.e., movement and distribu-
tion of materials, warehousing, material handling).
METSET: allows one to build super sets of manufacturing procedures
by using families of mini sets so that the engineer can input large
fabrication procedures or assembly procedures.
MICBOOOST: provides the capability of generating both standard and
current costs by using material, labor, fixed and variable burden,
and setup rates.
MKUCKTG: stores temporary routing information on parent, machine
used, groups of machines used, labor applied and labor class,
department, division, by individual part operation, part, and
subassembly.
The ONIVATKIP) system utilizes computer software to aid in the design and
modification of products and processes, the operational control of fabrication
and assembly, managenent of resources, and generation of accurate and timely
flow of information. The 10 modules of UNIVATION® can be used separately or
as an integrated system and can be added at any time. These modules are as
follows:
UNIVHiS: Methods instruction, associated standard-time and data-base
generation. The data base has 11 restriction finders by which it can
be accessed, (i.e., shift, machine, part, etc.).
MDLTIOOMP: Mass updating system for methods, standards, and data
bases.
UNIO0MP: An algebraic filter program for formula programming.
VARIO0MP: An automatic, variable-methods input editing system.
-175-
UNIPLAN: Balancing system for assembly line or facility scheduling
and loading for manufacturing operations.
P-A-R: Performance, audit and review system for performance
reporting and trend analysis to reflect current conditions.
HJIPOBM: Statistical linear-regression system to generate standards
for jobs such as shipping, receiving, tool control, etc.
UNIOOST: System for automatically generating direct and standard
product costs at an operational level.
MINIOOIIP: Utilizes engineered methods modules and unique variables
to establish methods and set standards.
UNI-CAM: Interactive variant process-planning system using a unique
data base management system.
SYSTBI APHJCATIQH:
The first step in developing standards using UNIVEL® is to observe and
document the method. If visualization is used, the method must be verified by
actual shop floor observation.
Next, there are five measurements the analyst must document as follows:
Distance from - the distance an object is moved from.
Distance to - the distance an object is moved to.
Weight - of the object.
Location - requires choosing a value of one through six, indicating the type of location. 5
Difficulty - requires choosing a value of one through nine indicating the level of difficulty.
-176-
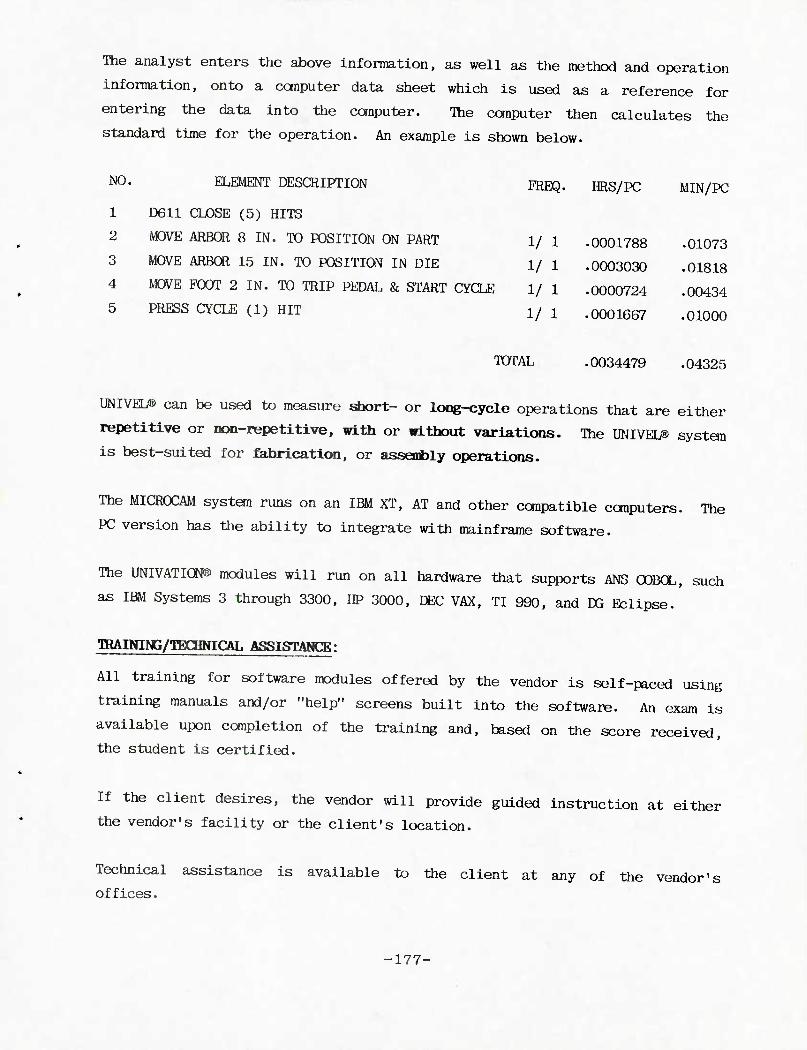
The analyst enters the above information, as well as the method and operation
information, onto a computer data sheet which is used as a reference for
entering the data into the computer. The computer then calculates the
standard time for the operation. An example is shown below.
NO. ELEMENT DESCRIPTION
1 D611 CLOSE (5) HITS
2 MOVE ARBOR 8 IN. TO POSITION ON PART
3 MOVE ARBOR 15 IN. TO POSITION IN DIE
4 MOVE FOOT 2 IN. TO TRIP PEDAL & START CYCLE
5 PRESS CYCLE (1) HIT
FREQ. HRS/PC MIN/PC
TOTAL
1/ 1 .0001788 .01073
1/ 1 .0003030 .01818
1/ 1 .0000724 .00434
1/ 1 .0001067 .01000
L .0034479 .04325
UNIVEL® can be used to measure short- or long-cycle operations that are either
repetitive or non-repetitive, with or without variations. The UNIVEL® system
is best-suited for fabrication, or assenbly operations.
The MICR0CAM system runs on an IBM XT, AT and other ccmpatible computers. The
PC version has the ability to integrate with mainframe software.
The UNIVATION® modules will run on all hardware that supports ANS COBOL, such
as IBM Systems 3 through 3300, HP 3000, DEC VAX, TI 990, and DG Eclipse.
TOAINING/TBCHNICAL ASSISTANCE:
All training for software modules offered by the vendor is self-paced using
training manuals and/or "help" screens built into the software. An exam is
available upon completion of the training and, based on the score received,
the student is certified.
If the client desires, the vendor will provide guided instruction at either
the vendor's facility or the client's location.
Technical assistance is available to the client at any of the vendor's
offices.
-177-

SYgrai POSTS:
Software costs for systems using UNIVEL® range from $16,500 for MICROCAM with
no modules to $200,000 for a mainframe system. Each system is tailored to the
client's specific needs. ■
A maintenance package is available which guarantees the user all system
updates for a fee of 1 percent of the original software cost per month.
Any training desired by the client will be provided at $1500 per week at the
vendor's facility or on a per-client basis at the client location.
OOMTUANCE WITH MIL STO 1567A:
The UNIVED® predetermined time system is in compliance with the specific
requirements set forth in MIL STD 1567A. Based on our review of statistical
backup data provided by the vendor, the system will theoretically generate
standards with an accuracy of at least ±10% at a 90% confidence level. (See
System Accuracy Section). Those specific requirements which have been met are
as follows:
All Type I standards must reflect an accuracy of ±10% with a 90% or
greater confidence at the operation level.
Documentation of an operations analysis.
A record of standard practice or method followed when the standard
was developed.
A record of rating or leveling.
A record of the standard time computation including allowances.
A record of observed or predetermined time system time values used in
determining the final standard time.
178-
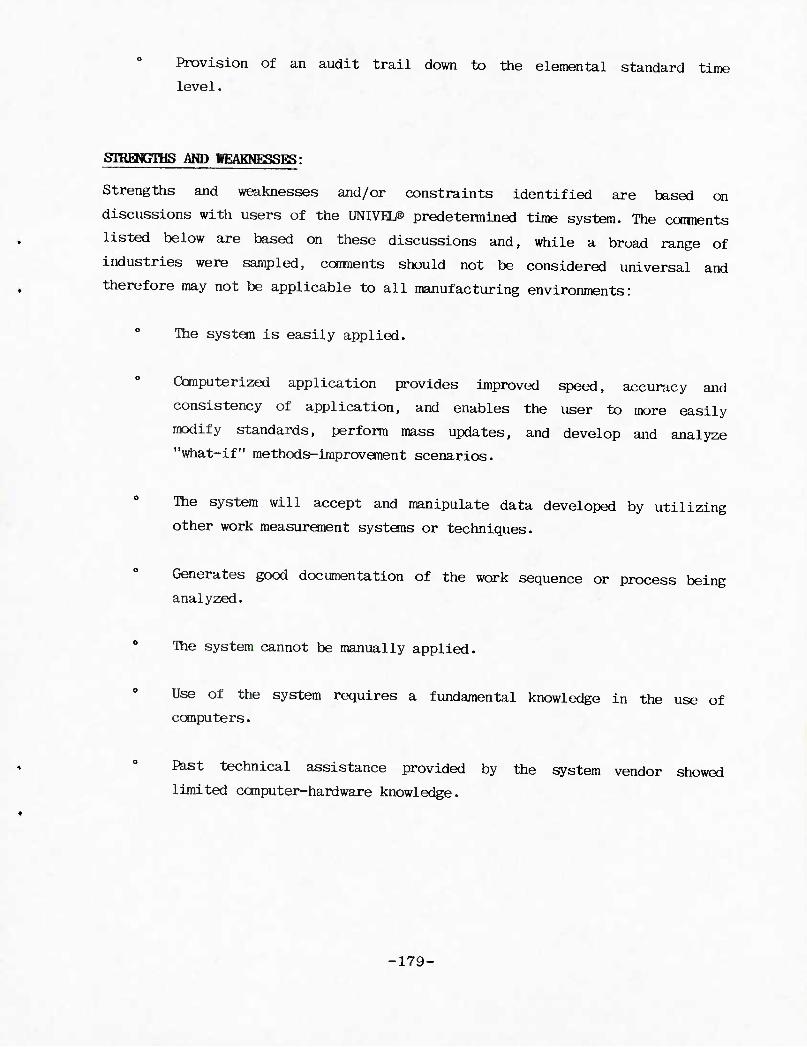
o Provision of an audit trail down to the elemental standard time
level.
gTREMgmS AND WEAKNESSES:
Strengths and weaknesses and/or constraints identified are based on
discussions with users of the UNIVED® predetermined time system. The coranents
listed below are based on these discussions and, while a broad range of
industries were sampled, conments should not be considered universal and
therefore may not be applicable to all manufacturing environments:
0 The system is easily applied.
Computerized application provides improved speed, accuracy and
consistency of application, and enables the user to more easily
modify standards, perform mass updates, and develop and analyze
"what-if" methods-improvement scenarios.
The system will accept and manipulate data developed by utilizing
other work measurement systems or techniques.
Generates good documentation of the work sequence or process being
analyzed.
0 The system cannot be manually applied.
Use of the system requires a fundamental knowledge in the use of
computers.
Rast technical assistance provided by the system vendor showed
limited computer-hardware knowledge.
-179-
SYSTiai DSBBS:
The vendor states that they have served 580 companies in a variety of
applications as follows:
• Aerospace 0 Automotive 0 Electronic
Oil 0 Consumer Products 0 Construction Equipment 0 Gasoline and Diesel Engines 0 Computer Equipment 0 Printing
BEFBRaCB SODHCE:
Management Science, Inc.
-180-
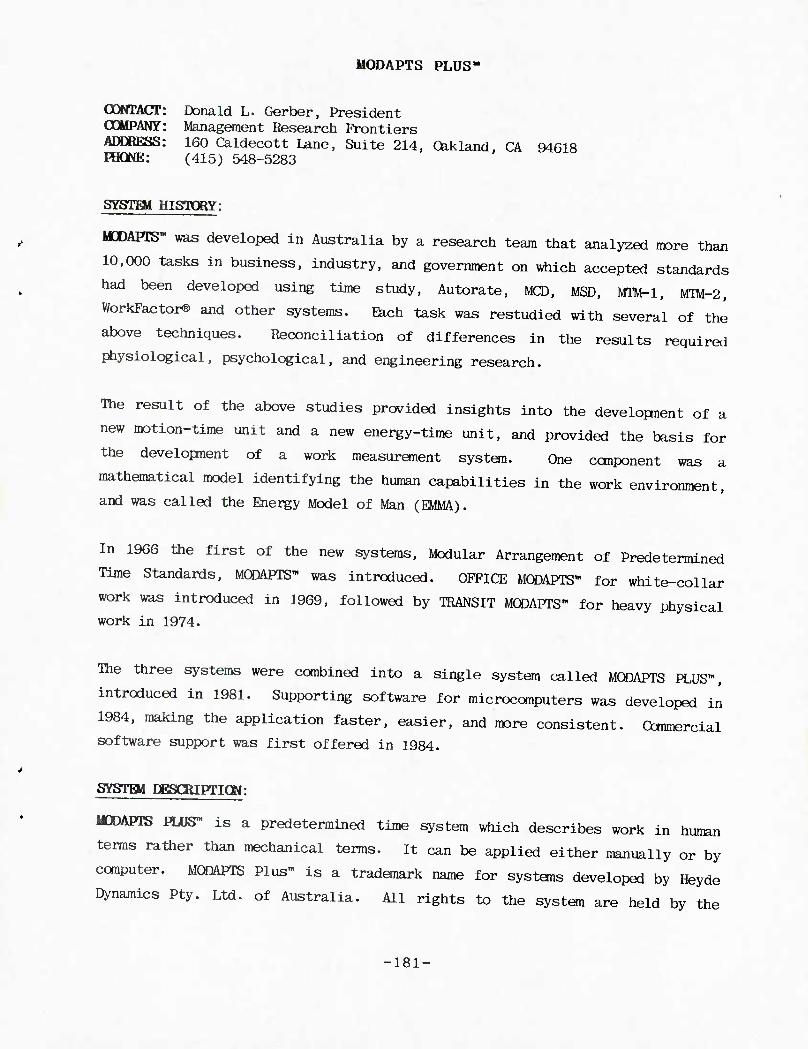
CONTACT COMPANY ADDRESS
MODAPTS PLUS*
Donald L. Gerber, President Management Research Frontiers 160 Caldecott Lane, Suite 214, Oakland, CA 94618
fHONE: (415) 548-5283
SYSTEM HISTORY:
MODAPTS™ was developed in Australia by a research team that analyzed more than
10,000 tasks in business, industry, and government on which accepted standards
had been developed using tune study, Autorate, MCD, MSD, M1M-1, imt-2,
WorkFactor® and other systems. Each task was restudied with several of the
above techniques. Reconciliation of differences in the results required
physiological, psychological, and engineering research.
The result of the above studies provided insights into the development of a
new motion-time unit and a new energy-time unit, and provided the basis for
the development of a work measurement system. One component was a
mathematical model identifying the human capabilities in the work environment,
and was called the Energy Model of Man (EMMA).
In 1966 the first of the new systems, Modular Arrangement of Predetermined
Time Standards, MODAPTS™ was introduced. OFFICE MODAPK™ for white-collar
work was introduced in 1969, followed by TRANSIT MODAPfS™ for heavy physical work in 1974.
The three systems were combined into a single system called MODAPTS PLUS",
introduced in 1981. Supporting software for microcomputers was developed in
1984, making the application faster, easier, and more consistent. Ctmmercial
software support was first offered in 1984.
SYgFBl DESCRIPTICW:
MODAPTS PLDS™ is a predetermined time system which describes work in human
terms rather than mechanical tems. It can be applied either manually or by
computer. MODAPTS Plus™ is a trademark name for systems developed by Heyde
Dynamics Pty. Ltd. of Australia. All rights to the system are held by the
-181-
nonprofit International MODAPrs™ Board, Inc., (IMBI), which has 12 individual
members worldwide. Management Research Frontiers Inc., (MRF) is the North
American publisher of software and distributor of MODAPTS PLUS™ materials, whose president is a member of IMBI.
MODAPTS" is based on the premise that the time taken for any body mavement can
be expressed in terms of a multiple of the time taken for a single finger
move. The time taken for a finger move, and thus the motion-tijne unit, for
MODAPTS'" is called a MOD. A MOD is a unit of work whose value assumes that
the motion is carried out with minimal expenditure of energy and that the time
to move is proportional to the fifth root of the monent of inertia of the body
part moved.
The time value of a single MOD may be altered in order to attain accuracy in a
given situation, but the relative values of different motions remain the same
and are embedded in the codes.
MODAPTS PLUS" is comprised of 21 basic codes which are alpha-mnemonic (i.e., G
= Get). The alpha code is combined with a number which is the motion-time-
unit value, or MOD value, of that particular code (i.e., Gl). A total of 92
alphanumeric codes comprise the entire data table or data card, which may be
applied in almost any work situation.
MCDAPTS PLUS SUITE" is computerized MODAPTS PLUS" and it operates on PC-
compatible computers. IMBI also licenses use of the MODAPTS PLUS" trademark
and MCDAPTS PLUS" table of elements to selected software designers, who offer
other software to support application and maintenance. Among these is
Workfile".
MCDAPTS PUS SUITE" consists of two major sections as follows:
FULL/OOHPACT: used to analyze activities. Two help levels are
provided. The analyst develops a study using menu choices relating to
appropriate boxes on the data card. Element-code generation, simultaneous
motions, load factors, process time, and data derived elsewhere are all
handled autanatically. Titles, comnents, and allowances may be entered to
•182-
produce a documented procedure. The computer makes all calculations
required for measurement and quantitative analysis. Studies may be stored
or printed out. The software allows for the development of "block data"
which may be nested or chained to produce higher-level studies. More than
20 levels may be stored and retrieved.
HBOOVBRY: analyzes energy expenditure and deals with the energy required
to GET an object at any height, gain control of it, carry or move it to
another location, and PUT it where it has to go. Two help levels are
provided.
WOlKFILEris a dedicated data-base management system designed for organizations
which must build and maintain a large library of standards. Workfile" can be
run on IBM PC-XT, AT or compatible computers.
Features included in WCeKFILE"1 are as follows:
Generates new standards using:
a built-in MODAPTS" element generator;
data from any other standards system;
data from time studies; 00 process time.
Uses a building-block approach to develop block data and multilevel
macro standards.
Automatically reflects changes in any block throughout the system.
Incorporates existing work standards.
Incorporates process time and variable allowances.
Allows full description of all work blocks and elements.
Provides automatic professional documentation.
-183-
Prints all blocks or selected groups of blocks.
Perfoms automatic global update of all standards to reflect any
changes in their constituent block data.
Prints blocks affected by an update.
Generates print files which can be printed locally in background mode
or transmitted for remote printing.
Does a recursion check to warn of situations where blocks indirectly
call ("quote") thanselves.
Provides a "Where-found" list showing blocks which call any named
block, both directly or indirectly, through intermediary blocks on
different levels.
In sunmary, MQDAPTS PLUS" has the capability to analyze the majority of work
situations. It is feasible to use the system to evaluate different ways of
performing the same task with proposed changes in method or equipment, and the
way different people perfonn the same task with the same equipment.
SYSTEM AHFLICATIOW:
MQDAPTS PLUS- can be applied either manually or by computer. The same basic
principles apply to both methods except that the conputer provides prcmpts to
aid the user, contains additional features, and is estimated by the vendor to
be 20% to 50% faster than the manual systems.
0 MANDAL:
To initiate a study, the analyst should begin by documenting the method of
operation and then applying the MODAPTS™ codes. Whether observed or
visualized, the method must be verified by actual shop floor observation.
MODAPTS PLUS" requires the use of a single data card which displays ranks
and files of boxes with pictures, alphabetics, and numerics. The pictures
depict parts of the body; the alphabetics are single alphabetics and
-184-
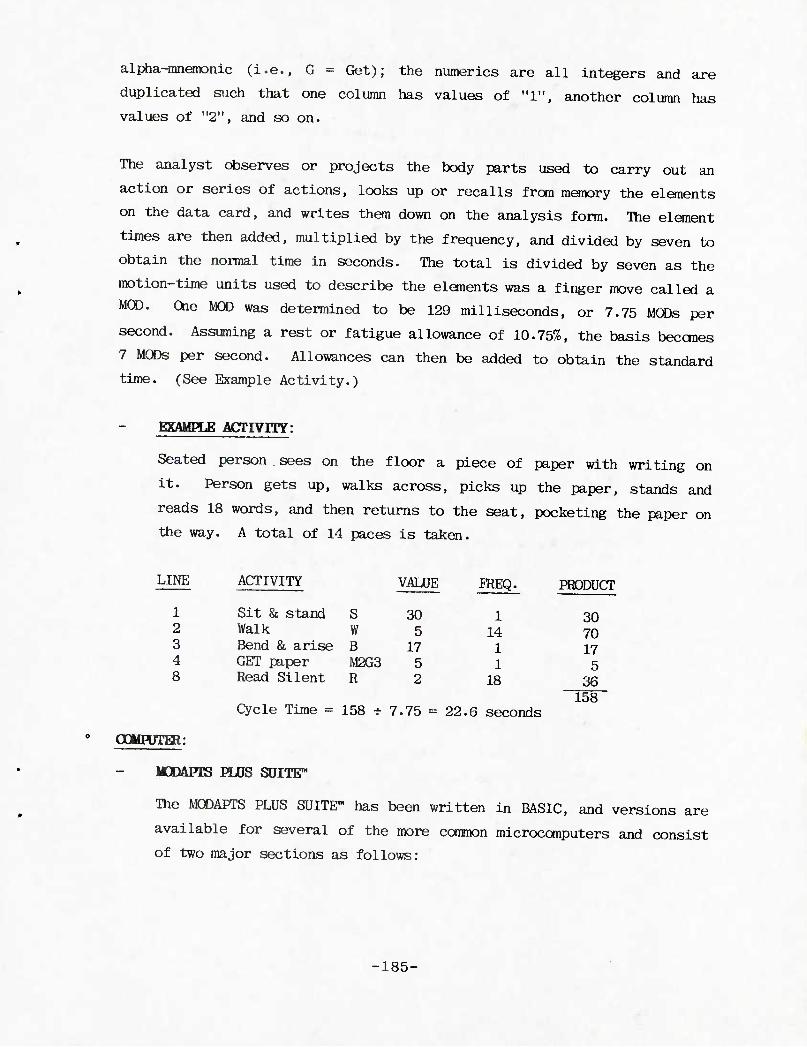
alpha-^memonic (i.e., G = Get); the numerics are all integers and are
duplicated such that one column has values of "1", another column has
values of "2", and so on.
The analyst observes or projects the body parts used to carry out an
action or series of actions, looks up or recalls from memory the elements
on the data card, and writes them down on the analysis form. The element
times are then added, multiplied by the frequency, and divided by seven to
obtain the normal time in seconds. The total is divided by seven as the
motion-time units used to describe the elements was a finger move called a
MOD. Oie MOD was determined to be 129 milliseconds, or 7.75 MODs per
second. Assuming a rest or fatigue allowance of 10.75%, the basis beccmes
7 MODs per second. Allowances can then be added to obtain the standard
time. (See Example Activity.)
KXAMFUE ACTIVITy:
Seated person sees on the floor a piece of paper with writing on
it. Person gets up, walks across, picks up the paper, stands and
reads 18 words, and then returns to the seat, pocketing the paper on
the way. A total of 14 paces is taken.
LINE ACTIVITY
Sit & stand Walk Bend & arise GET paper Read Silent
S W B M2G3 R
VALUE
30 5
17 5 2
FREQ.
1 14 1 1
18
PRODUCT
1 2 3 4 8
30 70 17 5
36
Cycle Time = 158 - 7.75 = 22. 6 seconds 158
OOIIRJTHR:
MDDAPTS PLUS SDITE"
The MODAPTS PLUS SUITE" lias been written in BASIC, and versions are
available for several of the more common microcomputers and consist
of two major sections as follows:
■185-
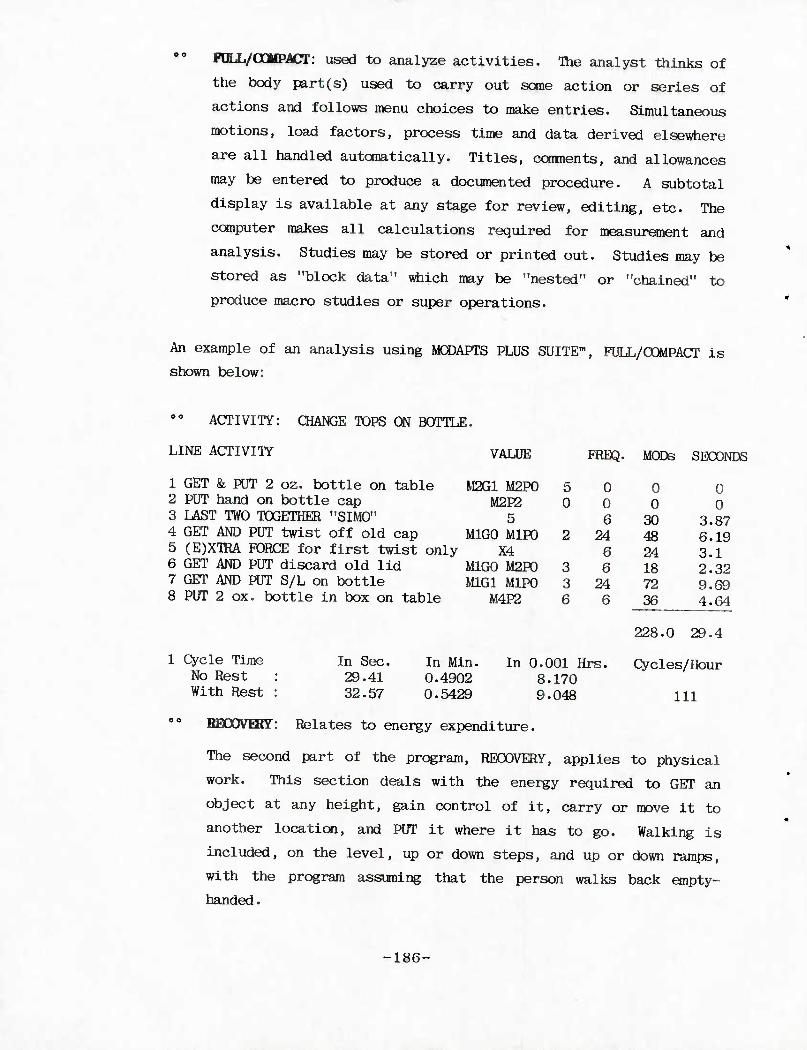
FDLL/aHPACT: used to analyze activities. The analyst thinks of
the body part(s) used to carry out some action or series of
actions and follows menu choices to make entries. Simultaneous
motions, load factors, process time and data derived elsewhere
are all handled automatically. Titles, cotiments, and allowances
may be entered to produce a documented procedure. A subtotal
display is available at any stage for review, editing, etc. The
computer makes all calculations required for measurement and
analysis. Studies may be stored or printed out. Studies may be
stored as "block data" which may be "nested" or "chained" to
produce macro studies or super operations.
An example of an analysis using MODAPTS PLUS SUITE", FULL/OOMPACT is
shown below:
ACTIVITY: CHANGE TOPS Of BOTTLE.
LINE ACTIVITY
1 GET & PUT 2 oz. bottle on table 2 PUT hand on bottle cap 3 LAST TWO TOGETHER "SIMO" 4 GET AND PUT twist off old cap 5 (E)XTRA FORCE for first twist only 6 GET AND PUT discard old lid 7 GET AND PUT S/L on bottle 8 PUT 2 ox. bottle in box on table
VALUE FREQ. MODS SECONDS
M2G1 M2P0 M2P2
5 M1G0 M1P0
X4 M1G0 M2P0 M1G1 M1P0
M4P2
5 0
3 3 6
0 0 6
24 6 6 24 6
0 0 30 48 24 18 72 36
0 0
3.87 6.19 3.1 2.32 9.69 4.64
1 Cycle Time No Rest With Rest
In Sec. 29.41 32.57
In Min. 0.4902 0.5429
In 0.001 Hrs. 8.170 9.048
228.0 29.4
Cycles/Hour
111
RE00VBRY: Relates to energy expenditure.
The second part of the program, RECOVERY, applies to physical
work. This section deals with the energy required to GET an
object at any height, gain control of it, carry or move it to
another location, and PUT it where it has to go. Walking is
included, on the level, up or down steps, and up or down ramps,
with the program assuming that the person walks back empty-
handed.
-186-
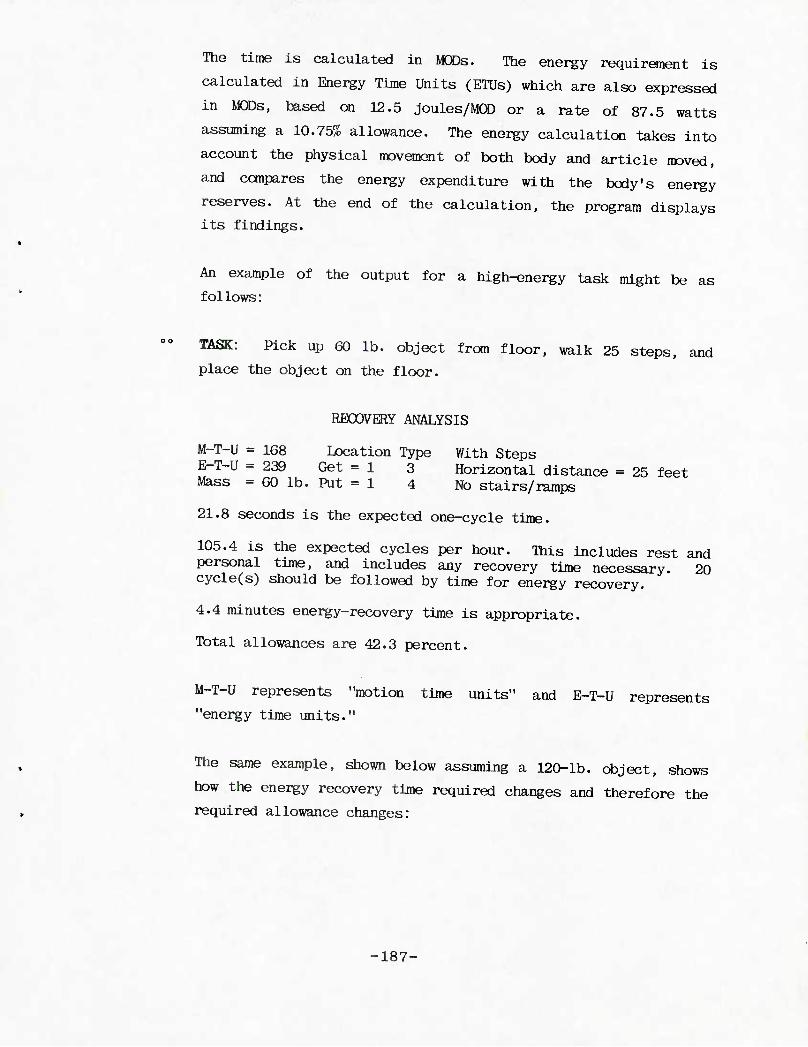
The time is calculated in MODs. The energy requirement is
calculated in Energy Time Units (ETUs) which are also expressed
in MODs, based on 12.5 joules/MQD or a rate of 87.5 watts
assuming a 10.75% allowance. The energy calculation takes into
account the physical movement of both body and article moved,
and compares the energy expenditure with the body's energy
reserves. At the end of the calculation, the program displays
its findings.
An example of the output for a high-energy task might be as
follows:
TASK: Pick up 60 lb. object from floor, walk 25 steps, and
place the object on the floor.
RECOVERY ANALYSIS
M-T-U = 168 Location Type With Steps E-T-U =239 Get = 1 3 Horizontal distance = 25 feet Mass = 60 lb. Put = 1 4 No stairs/ramps
21.8 seconds is the expected one-cycle time.
105.4 is the expected cycles per hour. This includes rest and personal time, and includes any recovery time necessary. 20 cycle(s) should be followed by time for energy recovery.
4.4 minutes energy-recovery time is appropriate.
Total allowances are 42.3 percent.
M-T-U represents "motion time units" and E-T-U represents
"energy time units."
The same example, shown below assuming a 120-lb. object, shows
how the energy recovery time required changes and therefore the
required allowance changes:
-187-
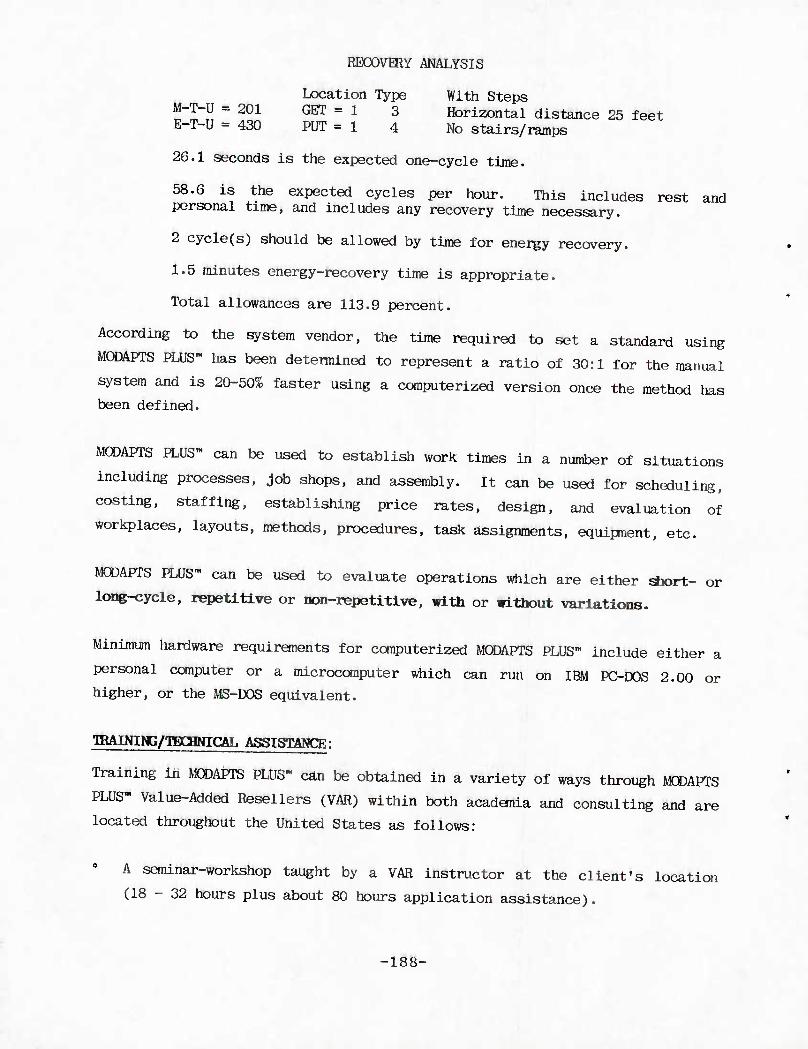
RECDVERY ANALYSIS
Location Type With Steps M-T-U = 201 GET = 1 3 Horizontal distance 25 feet E-T-U = 430 PUT = 1 4 No stairs/raxnps
26.1 seconds is the expected one-cycle time.
58.6 is the expected cycles per hour. This includes rest and personal time, and includes any recovery time necessary.
2 cycle(s) should be allowed by time for energy recovery.
1.5 minutes energy-recovery time is appropriate.
Total allowances are 113.9 percent.
According to the system vendor, the time required to set a standard using
MODAPTS PLUS" has been detennined to represent a ratio of 30:1 for the manual
system and is 20-50% faster using a computerized version once the method has
been defined.
MODAPTS PLUS" can be used to establish work times in a number of situations
including processes, job shops, and assembly. It can be used for scheduling,
costing, staffing, establishing price rates, design, and evaluation of
workplaces, layouts, methods, procedures, task assignments, equipment, etc.
MODAPTS PLUS" can be used to evaluate operations which are either short- or
lone-cycle, repetitive or non-repetitive, with or without variations.
Minimum hardware requirements for computerized MODAPTS PLUS" include either a
personal computer or a microcomputer which can run on IBM PC-DOS 2.00 or
higher, or the MS-DOS equivalent.
TRAINING/TECHNICAL ASSISTANCE:
Training in MODAPTS PLUS" can be obtained in a variety of ways through MODAPTS
PLUS" Value-Added Resellers (VAR) within both academia and consulting and are
located throughout the United States as follows:
A seminar-workshop taught by a VAR instructor at the client's location
(18 - 32 hours plus about 80 hours application assistance).
-188-
A seminar-workshop taught by a VAR instructor at an open-registration
course at an announced location (22-40 hours).
A seminar-workshop taught by a qualified client instructor at the client's
location (18-32 hours plus about 80 hours application assistance).
The vendor recommends that the best approach is to conduct the training at the
client's location with supervised on-the-job training to follow the lecture
course. Each instructor provides his own examination for students, and
certification in MODAPTS PLUS™ is offered but is not required.
Technical assistance is available to users through Management Research
Frontiers (MRF) and the International MODAPTS" Board Incorporated (IMBI).
SYSTHI O0STS:
COST CATEGORY LIST PRICE Training $ Per-cllent"Basis-
License for system use and manual $ 50.00 per student
Software MODAPTS PLUS SUITE" $ 595.00 WQRKFILE" $15,500.00
OOMHLIANCE WITH MIL STD 1567A:
The MODAPTS PLUS" predetermined time system is in compliance with the specific
requirements set forth in MIL STD 1567A. Based on our review of statistical
backup data provided by the vendor, the system will theoretically generate
standards with an accuracy of at least ±10% at a 90% confidence level. (See
System Accuracy Section). Those specific requirements which have been met are
as follows:
All Type I standards must reflect an accuracy of + 10% with a 90% or
greater confidence at the operational level.
Documentation of an operations system.
-189-
A record of standards practice or method followed when the standard
was developed.
A record of rating or leveling.
A record of the standard time computation including allowances.
A record of observed or predetermined time system time values used in
determining the final standard time.
Provision of an audit trail down to the elemental standard time level.
STREMiTHS AND WEAKNESSES:
Strengths and weaknesses and/or constraints identified are based on
discussions with users of the MODAPTS PLUS" predetemined time system. The
coranents listed below are based on these discussions and, while a broad range
of industries were sampled, comnents should not be considered universal and
therefore may not be applicable to all manufacturing environments:
Ccrnputerized application provides improved speed, accuracy and
consistency of application, and enables the user to more easily
modify standards, perform mass updates, and develop and analyze
"what-if" methods-improvement scenarios.
The system will accept and manipulate data developed by utilizing
other work measurement systems or techniques.
Incorporates process-time formulas and variable allowances.
Generates good documentation of the work sequence or process being
analyzed.
Past user support provided by the system vendor has been exceptional.
■190-
The system has a finite number of elements from which to choose for
assignment of time values to an element of work, which causes sane
applicator judgment.
SYSTHJ gaggg;
The vendor was unable to provide users by manufacturing type, but did provide
data which states that MODAPTS PLUS™ is being used in more than 30 countries in a variety of industries as follows:
0 Automotive
Electronic 0 Financial 0 Defense 0 Medical
REFERENCE SODRCE:
Management Research Frontiers
-191-
AM COST ESTIMATOR
OQNTACT: Dr. Phillip F. Ostwald COMPANY: OOSTOOM Inc. ADDBESS: 6682 Whaley Drive, Boulder, 00 80303 FHOfflE: (303) 494-3806 DISTRIBUTOR: American Machinist COMPANY: McGraw-Hill Conpany ADCRBSS: 11 West 19th, New York, NY 10016 PHONE: (212) 512-3100
SYSTEM HISTORY:
The data provided in the AM COST ESTIMATOR book and used in the software
package was initially copyrighted in 1981. It was used for consulting
purposes by the system vendor, OOSTCOM, INC., prior to that time. The data
lias been developed by the author of the system. Dr. Phillip F. Ostwald.
The current version of the book, AM COST ESTIMATOR, is the 1985-1986 edition.
The 1987-1988 edition is being printed and will be available from American
Machinist of McGraw-Hill in early 1987. Both editions are compatible with the
AM COST ESTIMATOR software, which has been available since September 1985.
SYSTHd EESCRDPTION: ■—— _
AM COST ESTIMATOR is a standard data system that provides both cost and time
data for estimating sawing and cutting, molding, presswork, marking, hotwork-
ing, turning, milling, drilling, boring, broaching, grinding, gear cutting,
thread cutting and form rolling, welding and joining, heat treating, deburr-
ing, nontraditional machining, finishing, assembly, inspection, electronic
fabrication, packaging and tooling. The system is available in either a
manual or computerized version.
The manual version is a reference book, AM COST ESTIMATOR, 1985/1986 edition,
by Phillip F. Ostwald, containing tables of data for a wide variety of
production equipment that can be used to estimate both the cost and time
requirements of direct labor for a wide variety of manufacturing activities.
With each new edition, the author introduces new equipment into the data base.
-192-
In the section, "Element Estimating Data", information is provided for
estimating direct-labor setup and cycle time associated with specific
equipment processes, or benchwork applications. The methods of measurement
used to establish the elemental estimates include time study, predetermined
motion-time data systems, laboratory investigation, manufacturer's
recotnnendations, and judgment.
The approach assumes that differences ancng trained operators for specific
setup, machine process, or bench activities are minor for purposes of
estimating. However, for unique or significantly different activities,
dependent upon some special machine process, the book provides individual
treatment.
The AM OOST ESTIMATOR package is a ready-to-use data base containing the
necessary data and application methodology for estimating manufacturing
operations.
The AM OOST ESTIMATOR system contains 26 operations, over 135 equipment types,
and 16,000 elemental data. There are over 700 equations and constants in the
operational cost section. A listing of approximately 75 basic material costs
and 3100 productive-hour costs for the 23 Bureau of Labor standard
metropolitan statistical regions is provided.
The vendor states that the system is suited for fabrication, assembly,
process, and electronic applications.
The time- and cost-estimating data contained in the book and software can be
used for tool and model building, and production-run quantities of one on up
for contract manufacturers. The vendor states that, most generally, the data
relates to mid-sized batches, ranging from 15 to 5000 units. There are
exceptions, depending upon the nature of the fabrication or manufacturing activity.
-193-
#
SYSTEM APPLICATION:
The AM COST ESTIMATOR system can be applied either manually or by computer.
While the specific application procedures differ between the two, the theory
of the system's application is the same. The steps required for developing
work standards using the AM COST ESTIMATOR - Element Estimating Data are as
follows:
Analyze the manufacturing activity and select the operations for
which the standard will be based.
0 Define operational elements.
Match the elements with the system's estimating standard data tables.
Document and/or input the element number; machine, process, or bench;
table number (from book or software); and element description.
Document or input selected setup times.
Document or input selected cycle-element times.
Canpute unit estimate; determine lot size, piece per hour, etc.
Adjust standard for productivity levels.
Verify with actual shop floor observation.
The vendor states that the data is best suited for operations which experience
variations and where an analyst must select those elements which created
variations in the operation.
The hardware required for operating the AM COST ESTIMATOR computerized package
is an IBM Personal Conputer or compatible. The PC can be either fixed-disk or
have two disk drives. The RAM should be at least 250K, although 640K will
allow for the development of longer work standards.
-194-
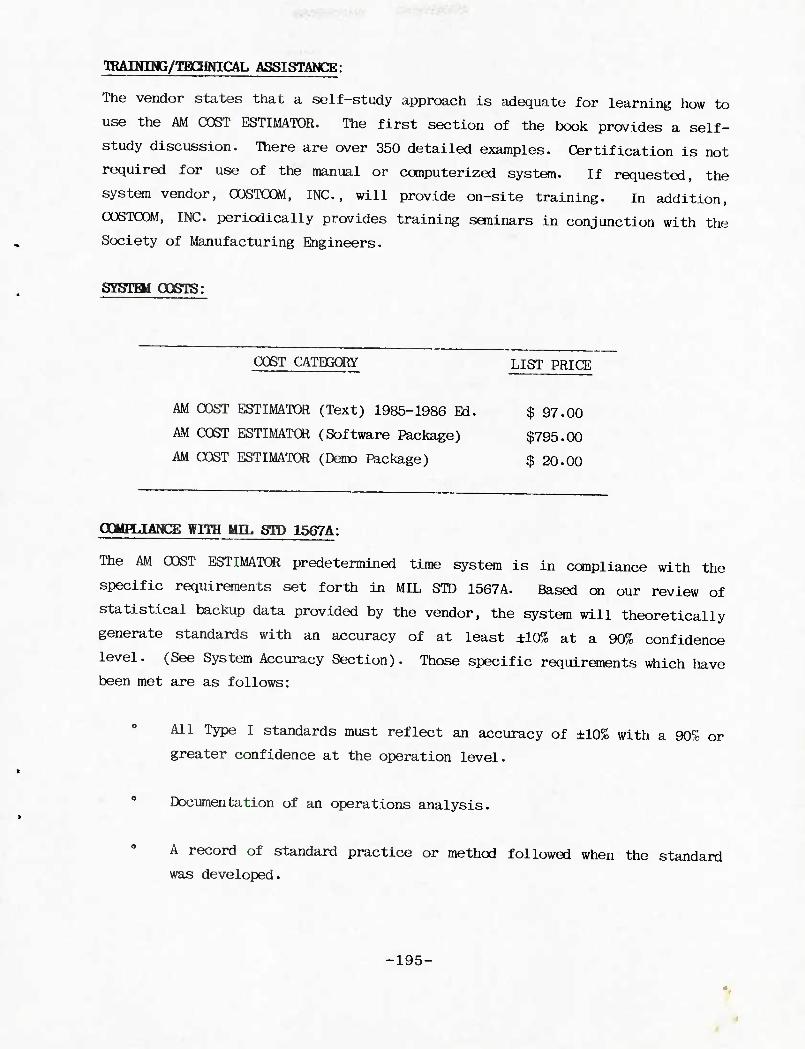
TRAINING/TBCHNICAL ASSISTANCE:
The vendor states that a self-study approach is adequate for learning how to
use the AM COST ESTIMATOR. The first section of the book provides a self-
study discussion. There are over 350 detailed examples. Certification is not
required for use of the manual or computerized system. If requested, the
system vendor, 00STC0M, INC., will provide on-site training. In addition,
C0ST00M, INC. periodically provides training seminars in conjunction with the
Society of Manufacturing Engineers.
SYSTHI COSTS:
COST CATEGORY LIST PRICE
AM COST ESTIMATOR (Text) 1985-1986 Ed. $ 97.00
AM COST ESTIMATOR (Software Package) $795.00
AM COST ESTIMATOR (Dear) Package) $ 20.00
OOMFUANCE WITH MIL STD 1567A:
The AM COST ESTIMATOR predetermined time system is in compliance with the
specific requirements set forth in MIL STD 1567A. Based on our review of
statistical backup data provided by the vendor, the system will theoretically
generate standards with an accuracy of at least ±10% at a 90% confidence
level. (See System Accuracy Section). Those specific requirements which have
been met are as follows:
All Type I standards must reflect an accuracy of ±10% with a 90% or
greater confidence at the operation level.
Documentation of an operations analysis.
A record of standard practice or method followed when the standard
was developed.
•195-
A record of rating or leveling.
A record of the standard time conputation including allowances.
A record of observed or predetermined time system time values used in
determining the final standard time.
Provision of an audit trail down to the elemental standard time
level.
SIBENGTHS AMD WEAKNESSES:
Strengths and weaknesses and/or constraints identified are based on
discussions with users of the AM COST ESTIMATOR predetermined time system. The
comments listed below are based on these discussions and, while a broad range
of industries were sampled, coiments should not be considered universal and
therefore may not be applicable to all manufacturing environments:
0 System is easily learned and applied.
Manual application is cost-effective.
The systan provides extensive cost and time estimates for conmonly
used equipment and operations in the areas of machining, welding,
fabrication and assembly.
Computerized application provides improved speed, accuracy and
consistency of application, and enables the user to more easily
modify standards, perform mass updates, and develop and analyze
"what-if" methods-improvement scenarios.
The system allows for one material rate and one labor rate per
operation estimate, which may affect an estimate's accuracy for
operations involving multiple material or labor rates.
Operations estimates developed by using the conputerized version are
limited in length to approximately eight computer-print pages.
-19G-
No tooling estimate data currently exists; however, the system vendor
states that it is planned.
0 Costing updates occur biannually.
The data in the tables can be modified by the user, which can
eliminate the system's backup data integrity.
SYSTEM USERS:
The AM COST ESTIMATOR standard data system, including both the manual and
computerized versions, has been applied in over 5,000 manufacturing
environments. Current users of the system include: job shops, product
manufacturers, auto industries, sheet-metal concerns, machine shops, original
equipment suppliers, machine-tool builders, aerospace firms, electronic
fabricators/assemblers, and Department of Defense depots and maintenance
facilities.
HKFliMENCE SOURCE:
American Machinist of McGraw-Hill.
-197-
METCUT
Susan M. Moehring, Manager, Machinability Data Center METCUT Research Assoc., Inc., Manufacturing Technology Div. 11240 Cornell Park Dr., Cincinnati, OH 45242-1812
OQNTACT OQMRANY ADDRESS PHONE: (513) 489-6C88
SYSTBi HISTORY:
The development of the Metcut Machining Data began in the 1950s and was
developed frctn two major sources and then sutmitted to industry "experts" for
review. Having verified the data, it was initially published in 1960 in the
book Machining Data Handbook and has been updated and republished in 1966,
1972, and 1980.
The Metcut Machining Data was first computerized in 1984 and enhanced versions
are continually being developed.
SYSTEM EESCRIPTION: —— —
The latest edition of Metcut's Machining Data Bmdbook, published in 1985,
provides machining reconnendations for over 1500 materials and 80 operations.
Materials include various hardness ranges and metallurgical conditions
including heat treatments, and are divided into 61 major material groups and
subgroups. All materials are indexed in alphabetical and numerical listings
and by the material group in which the alloy appears. In addition, where
applicable, the Unified Numbering System designation has been provided.
Data tables presented in the book are organized by material type, hardness,
metallurgical condition, and the desired depth of cut. The data provided for
each variation in both U.S. and metric units includes:
0 Cutting speed 0 Feed rates 0 Tool material type
•198-
Operations represented in the Machining Data Handbook include:
0 Turning
Milling
Drilling, Boring, & Operations on holes 0 Tapping 0 Planing & Broaching
Sawing & Cutoff
Gear Cutting & Gear Grinding 0 Grinding
Mechanical Nontraditional Machining 0 Electrical Nontraditional Machining
Thermal Nontraditional Machining 0 Chemical Nontraditional Machining
Additional inforroation is provided in the handbook regarding areas such as
tool materials and geometry, cutting fluids, power and force requirements,
surface technology, machining guidelines, grinding and abrasive machining,
numerical control machining, canputer-aided manufacturing technologies,
machining standards, and machine chatter and vibration.
In 1985, Metcut published a software program, COTDATA-, which provides a
computerized version of the Machining Data Handbook. CUTDATA" provides
reconmendations for cutting speeds, feed rates, tool material and geometry,
and cutting fluids.
In addition to retrieving machining data, OJTDATA" converts units between
English and metric, and converts standard speed and feed rates to machine
settings in RPM and inches per minute.
CUTDATA" can also interpolate data to obtain machining reconmendations for
depths of cut other than the standard handbook reconmendations using a
preprogrammed computer algorithm.
■199-
Calculation of horsepower requirements for the recomnended machining
conditions is accomplished autonatically. A conparison can be made of the
horsepower required for each cut to the power limitations of the machine tool
to be used.
With OJTDATA'", the data can be updated and expanded to reflect the user's
machining experience. Information specific to the user's machining
operations, such as tooling and vendors used, can be added to the CUTDATA"
data base.
In addition to CUTDATA"1, a second software system available from Metcut is
arrTBOT". CUTTECH" is a software system which uses Metcut's machining data
and can be customized to a specific company or plant. Essentially, it
provides a machining technology data base for detailed planning of machining
operations with the following capabilities:
0 Machine Tool Selection
Cutting Tool Selection 0 Cut Recomnendations
Speed/Feed Reconmendations 0 Machining Time and Cost Estimates
Horsepower, Torque, and Surface Finish Estimates
Information regarding a company's specific machine and tool types and
identifying numbers is incorporated into CUTTECH". In addition, the system
includes a module for manually entering process data for non-machining
operations.
CUTTECn1" can be developed as a stand-alone system or can be interfaced with
other existing CM application software such as process planning, time
standards, or tooling data bases.
In addition to CUTDATA™ and CUTTECH", Metcut has developed the CHTPLAN"
software system. CUTPLAN™ provides a framework to incorporate the operation
planning details, provided by CUTTECH", into a standardized routing. CUTPLAN"
-200-
utilizes a flexible Group Technology coding concept to organize process
plans. CUTPLAN1" is a system of generic process-planning software modules with
tailored applications for specific production facilities.
SYSTBi APHJCATION:
Bandbook
The first step in using the data found in the Machining Data Handbook is
to locate the tables relating to the machining operation being analyzed.
Next, locate the type of material to be used, its hardness and
metallurgical condition, and the desired depth of cut. Once the corres-
ponding location is identified in the table, the user looks across the
data to identify the appropriate speed, feed, and tool material.
- CUTMTA-
In order to find the same information using the CUTDATA" software system,
the user follows interactive prompting messages that lead through the
machinability data retrieval and updating processes.
The information prompted for the user is as follows:
0 Which machining operations? 0 Which workpiece material? 0 Which tool material? 0 What are workpiece and cutting dimensions?
The conputer prompts the user with a question and provides choices which
the user selects with the cursor. A sample of the questions for
retrieving machinability data for a turning operation is illustrated
below.
Which machining operation?
00 For which machining operation group?
00 For which type of this machining operation?
-201-
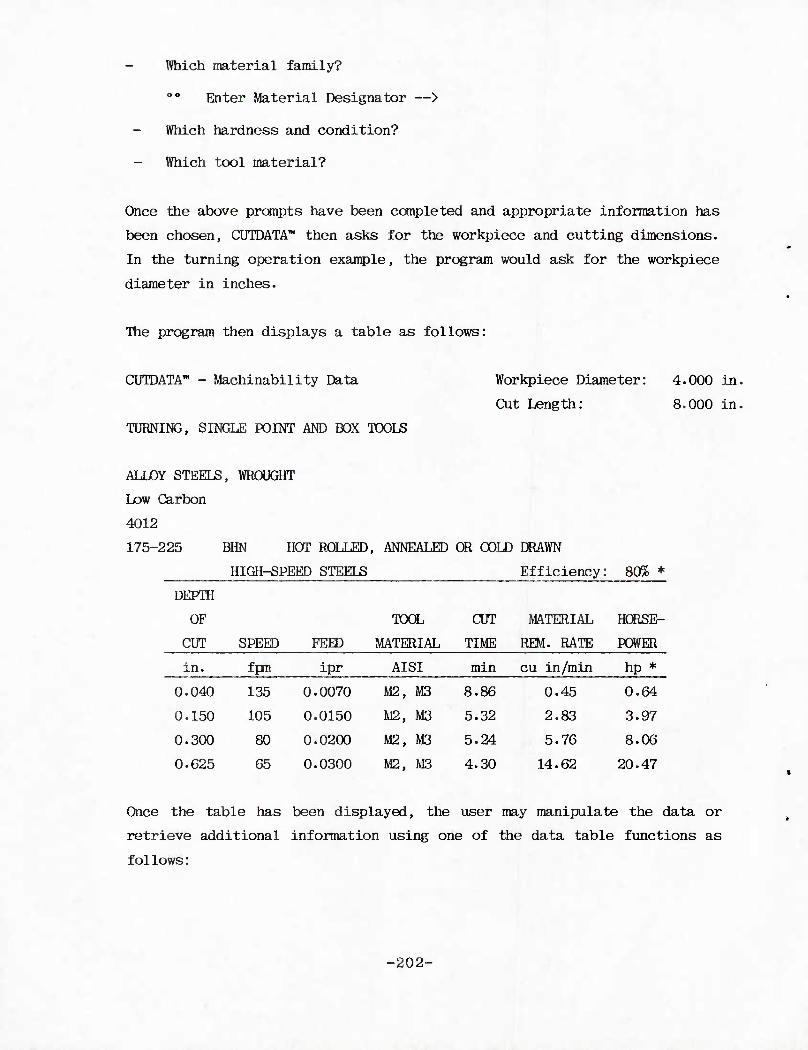
Which material family?
00 Enter Material Designator
Which hardness and condition?
Which tool material?
—>
Once the above prompts have been completed and appropriate information has
been chosen, CUTDATA™ then asks for the workpiece and cutting dimensions.
In the turning operation example, the program would ask for the workpiece
diameter in inches.
The program then displays a table as follows:
CUTDATA" - Machinability Data
TURNING, SINGLE POINT AND BOX TOOLS
Workpiece Diameter: 4.000 in.
Cut Length: 8.000 in,
ALLOY STEELS, WROUGHT
Low Carbon
4012
175-225 BHN
HIGH-SPEED STEELS Efficiency: 80% *
DEPOT
OF TOOL CUT MATERIAL HGRSE-
CUT SPEED FEED MATERIAL TIME REM. RATE POWER
in. fpn ipr AISI min cu in/min hp *
0.040 135 0.0070 M2, M3 8.86 0.45 0.64
0.150 105 0.0150 M2, M3 5.32 2.83 3.97
0.300 80 0.0200 M2, M3 5.24 5.76 8.06
0.625 65 0.0300 M2, M3 4.30 14.62 20.47
Once the table has been displayed, the user may manipulate the data or
retrieve additional information using one of the data table functions as
follows:
■202-
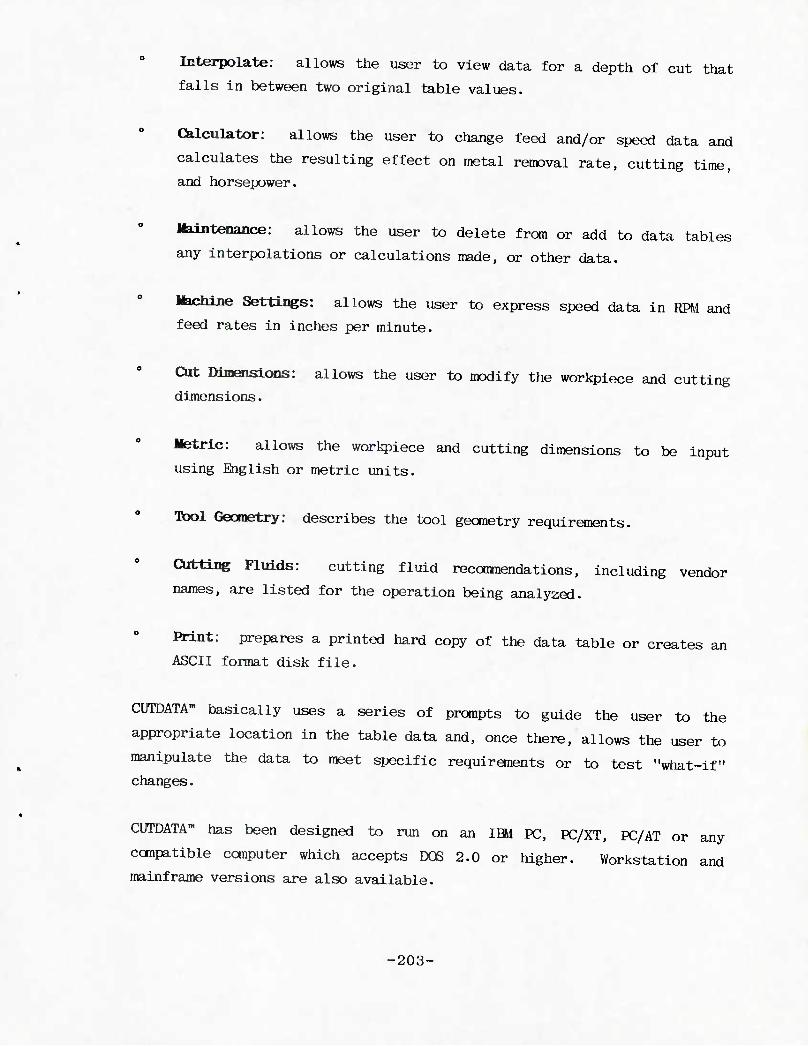
Interpolate: allows the user to view data for a depth of cut that
falls in between two original table values.
Calculator: allows the user to change feed and/or speed data and
calculates the resulting effect on metal removal rate, cutting time,
and horsepower.
Uaintenance: allows the user to delete from or add to data tables
any interpolations or calculations made, or other data.
Machine Settings: allows the user to express speed data in RPM and
feed rates in inches per minute.
Cut mmenslons: allows the user to modify the workpiece and cutting
dimensions.
Metric: allows the workpiece and cutting dimensions to be input
using English or metric units.
Tool Geometry: describes the tool geometry requirements.
Cutting Fluids: cutting fluid recommendations, including vendor
names, are listed for the operation being analyzed.
Print: prepares a printed hard copy of the data table or creates an
ASCII format disk file.
CUTDATA" basically uses a series of prompts to guide the user to the
appropriate location in the table data and, once there, allows the user to
manipulate the data to meet specific requirements or to test "what-if"
changes.
CUTDATA" has been designed to run on an IBM PC, PC/XT, PC/AT or any
compatible computer which accepts DOS 2.0 or higher. Workstation and
mainframe versions are also available.
-203-
COTTBCH™
The CUTTECH" software provides the user with textual descriptions of his
choices and, in some cases, graphical descriptions as well. The software
interactively prompts the user for the type of machine tool, workpiece
material, and cut description. The conputer then automatically selects
machine tools and a specific cutting tool for the operation and asks the
user for approval. Once the selected tools are approved, the software
will divide the volume of material to be removed into individual passes
and assign speeds and feeds for each pass. The horsepower requirements
are then calculated and displayed to the user who then can accept or
reject the cutting conditions. The system displays a table to the user
which shows the machine tool, cutting tool, dimensions of each cut, speeds
and feeds, metal removal rate and machining time and cost. This table can
then be printed and the recomnendations can be incorporated into an NC
program or used to make up the worksheet that the machine operator will
follow.
CUrTECH" is customized for each user so that machine and cutting tool
inforaiation and coding specific to the user is input into the CUTTEOT
data base.
Both CUTDATA" and CUTTEOT have the capability to be interfaced with
existing manufacturing and/or design systems.
TRAINIHG/TECHWICAL ASSISTAWCE:
The Machining Data Handbook and the CUTDATA" software system are both
completely self-taught. Detailed instructions are provided with both. A
user's manual is provided with each CUTDATA" package.
CUTTECH" training is included with the custanizing process as the system is
developed for each user.
-204-
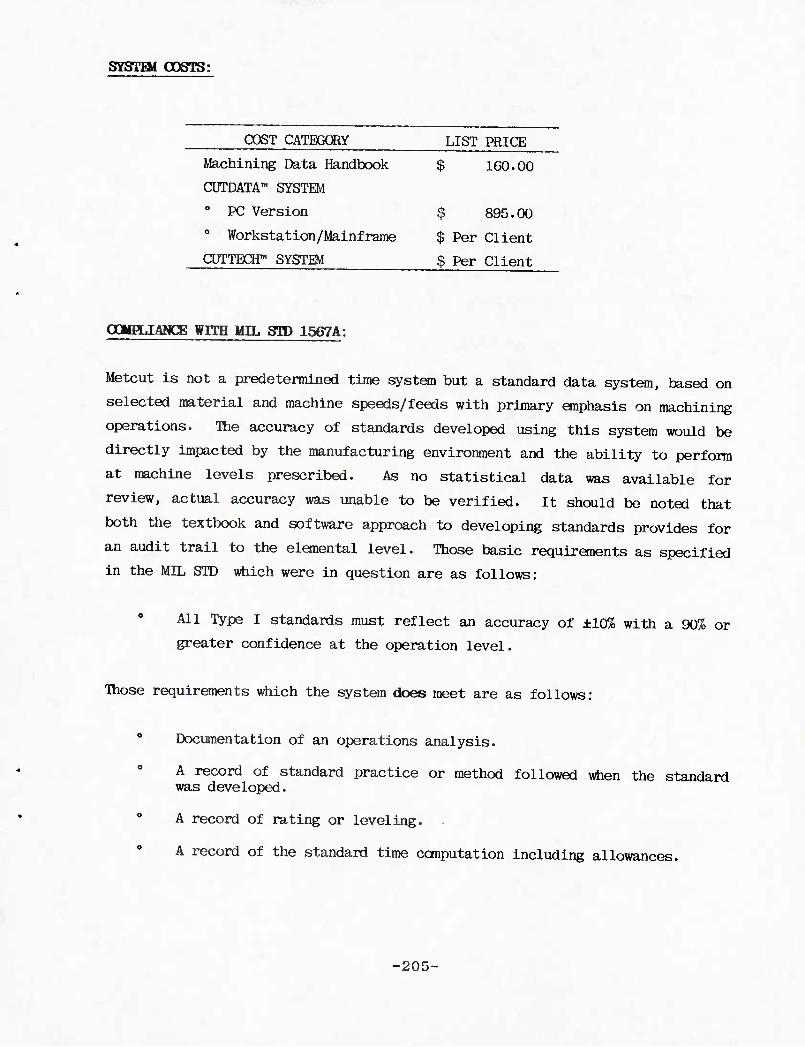
SYSTai COSTS:
COST CATEGORY LIST PRICE
Machining Data Handbook $ 160.00
CUTDATA™ SYSTEM 0 PC Version $ 895.00 0 Workstation/Mainframe $ Per Client
CUTTECH" SYSTEM $ Per Client
OOMPLIANCE WITH MIL STD 1567A:
Metcut is not a predetermined time system but a standard data system, based on
selected material and machine speeds/feeds with primary emphasis on machining
operations. The accuracy of standards developed using this system would be
directly impacted by the manufacturing environment and the ability to perform
at machine levels prescribed. As no statistical data was available for
review, actual accuracy was unable to be verified. It should be noted that
both the textbook and software approach to developing standards provides for
an audit trail to the elemental level. Those basic requirements as specified
in the MIL STD which were in question are as follows:
All Type I standards must reflect an accuracy of ±10% with a 90% or
greater confidence at the operation level.
Those requirements which the system does meet are as follows:
0 Documentation of an operations analysis.
A record of standard practice or method followed when the standard was developed.
0 A record of rating or leveling.
A record of the standard time computation including allowances.
-205-
A record of observed or predetermined time system time values used in determining the final standard time.
Provision of an audit trail down to the elemental standard time level.
SIBBCIBS & WEAKWESSES:
Strengths and weaknesses and/or constraints identified are based on
discussions with users of the METCUT" predetermined time system. The comients
listed below are based on these discussions and, while a broad range of
industries were sampled, comments should not be considered universal and
therefore may not be applicable to all manufacturing environments:
0 System is easily learned and applied.
The system's data on recommended speeds and feeds cover the latest in
machining equipment, material, and process technology.
Computerized application provides improved speed, accuracy and
consistency of application, and enables the user to more easily
modify estimates, perform mass updates, and develop and analyze
"what-if" methods improvement scenarios.
The formulas for calculating metal removal rate, horsepower, and time
required are progranmed into the computer; however, these foimulas
are available in the Machining Data Handbook.
-20G-
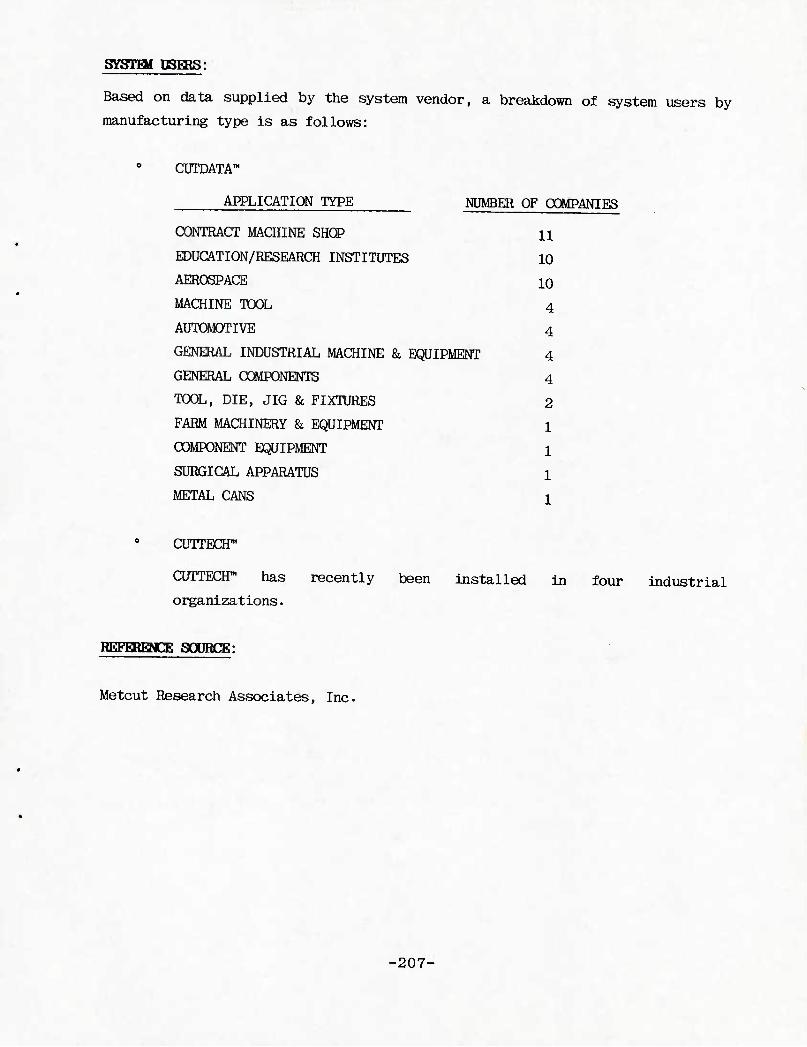
SYSTEM PggjSi
Based on data supplied by the system vendor, a breakdown of system users by
manufacturing type is as follows:
CUTDATA"
APPLICATION TYPE NUMBER OF COMPANIES
CONTRACT MACHINE SHCP
EDUCATION/RESEARCH INSTITUTES
AEROSPACE
MACHINE TOOL
AUTOMOTIVE
GENERAL INDUSTRIAL MACHINE & EQUIPMENT
GENERAL COMPONENTS
TOOL, DIE, JIG & FIXTURES
FARM MACHINERY & EQUIPMENT
COMPONENT EQUIPMENT
SURGICAL APPARATUS
METAL CANS
11
10
10
4
4
4
4
2
1
1
1
1
CUTTEOr
CUTTEOT has recently been installed in four industrial
organizations.
RKFERENCE SOURCE:
Metcut Research Associates, Inc.
-207-
EASE
OONTACT: Trevor McAlester, Owner/Author OOMPANY: EASE, Inc. ADDRESS: 32221 Camino Capistrano, San Juan Gapistrano, CA 92675 HBONE: (714) 493-1862
SYSTHI HISTOeY:
The EASE system was developed during 1985/1986 by Mr. John Shiith and Mr.
Trevor McAlester.
SYSTEII EESGRIPTICK:
EASE (Engineering Assembly Standards and Estimates) is a software package that
utilizes MTM-2 to enable a user to develop the following:
0 Work Standards 0 Detailed Process Plans 0 Manufacturing Costs
Method Improvements
The EASE system allows the user to develop work standards in three ways:
inil-2 Generator: Utilizes Methods Time Measurement-2 (MTM-2) for
elemental standard data development.
EASE Macros: Standard Data Blocks built out of MTM-2 which provide
the user with a more rapid method of element generation. Each Macro
is backed up by an MIM-2 pattern.
o User Form Elements: These elements have their own user defined
questions, variables and formula. Typical applications would be
machining, welding, and any other process times dependent on more
than one variable.
-208-
All three of these approaches can be used in combination to create a work
standard. In addition, available user standard data can be used to develop
work standards for an activity.
Each activity can hold up to 30 elements. The activities themselves are then
grouped into logical Data Groups. Each Data Group can hold up to 30
activities, which means that an operation analysis can access up to 900
elements, plus direct input.
SYSTH* APPLICATION:
EASE is a computerized menu driven system. The elements of an activity are
created utilizing the system's Element Generation Menu. The elements can be
created frcm existing EASE macros or straight from MTM-2 data. The Create
Element Menu contains a number of work element types (i.e., job preparation,
handling, assembly, disassembly, clear, gauge, lubricate, tool use, input
MTM-2, MTM and analysis summary).
A created element consists of all the macros chosen from the various menus and
their frequencies, and any M1M-2 codes used in the analysis.
An activity description and standard is created using the Activity Menu. This
menu allows the analyst to build up an activity by listing previously created
elements of that activity.
The EASE system can be applied to either short or long cycle jobs, and highly
repetitive, with no variations, or non-repetitive, with variations.
The EASE system software was developed specifically for the IBM PC and
compatible computers. The system is designed to be as "user friendly" as
possible, frcm both the systems and engineering points of view. The data base
is structured in such a way as to allow the laser to set up the data at
whatever level is required, with element times ranging from Time Motion Units
to Hours.
-209-
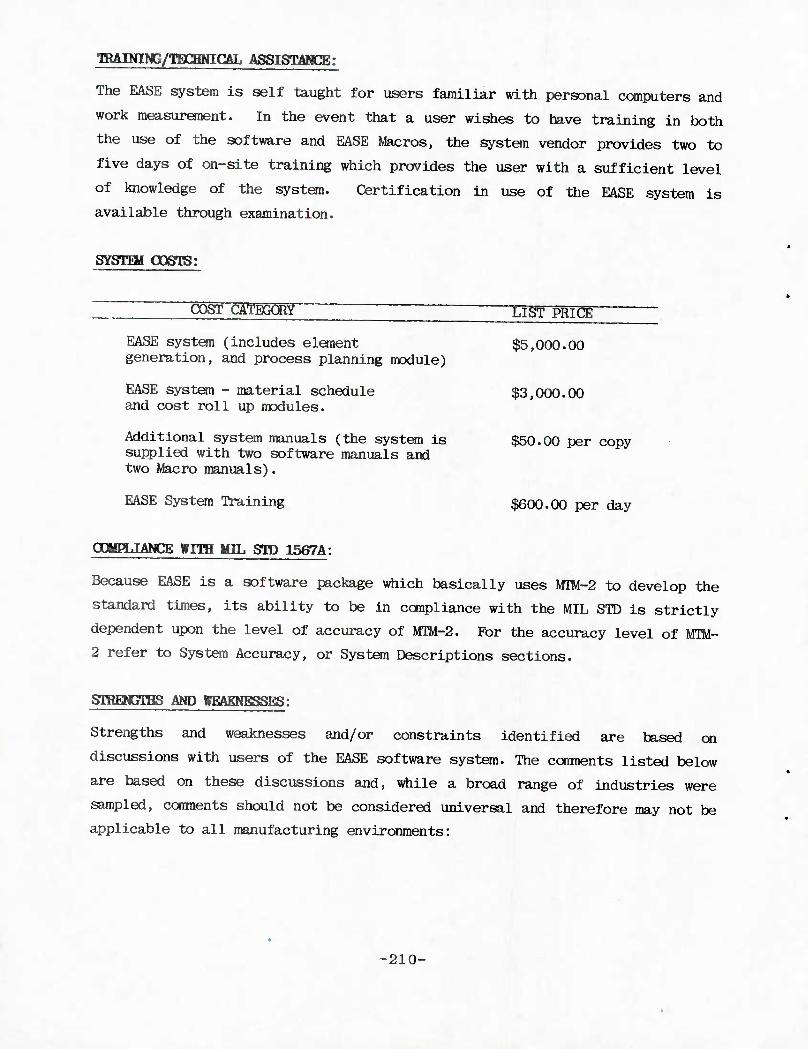
TOAINING/TECBNICAL ASSISTANCE:
The EASE system is self taught for users familiar with personal computers and
work measurement. In the event that a user wishes to have training in both
the use of the software and EASE Macros, the system vendor provides two to
five days of on-site training which provides the user with a sufficient level
of knowledge of the system. Certification in use of the EASE system is
available through examination.
SYSTEM COSTS:
_OOST CATBGSRY LIST PRICE
EASE system (includes element $5,000.00 generation, and process planning module)
EASE system - material schedule $3,000.00 and cost roll up modules.
Additional system manuals (the system is $50.00 per copy supplied with two software manuals and two Macro manuals).
EASE System Training $600.00 per day
OOMPLIAWCE WITH MIL STD 1567A:
Because EASE is a software package which basically uses MTM-2 to develop the
standard times, its ability to be in compliance with the MIL STD is strictly
dependent upon the level of accuracy of MTM-2. For the accuracy level of MTM-
2 refer to System Accuracy, or System Descriptions sections.
STRHCTHS AND WEAKNESSES:
Strengths and weaknesses and/or constraints identified are based on
discussions with users of the EASE software system. The comnents listed below
are based on these discussions and, while a broad range of industries were
sampled, conments should not be considered universal and therefore may not be
applicable to all manufacturing environments:
■210-
Computerized application provides improved speed, accuracy and
consistency of application, and enables the user to more easily
modify standards, perform mass updates, and develop and analyze
"what-if" method improvement scenarios.
System will accept and manipulate data developed utilizing work
measurement systems or techniques other than MTM-2.
0 Cannot be manually applied.
Since the system has been used in industry for approximately 1.5
years, there is little basis for judgment as to the system's
effectiveness.
SYSTEM PBERS:
For a system which is relatively new, the EASE system has five users as
follows:
0 Assembly (2)
Electrical (1) 0 Machining/Fabrication (2)
gggggjCg SOURCE:
EASE, Inc.
-211-
OONTACT OJHPANY
ADDRESS
CSD/AML
Ms. Doris Boudreau, Vice President Rath and Strong, Inc. 21 Worthen Road, Lexington, MA 02173
PHONE: (617) 861-1700
SYSTEM HISTOKy:
CSD (Computerized Standard Data) and GSD/AUL (Advanced Machining Logic) are
two software packages originally developed by Rath and Strong in the 1970s,
redesigned in 1981 and enhanced in 1986. CSD is used for manual operations
and AML is for calculating metal removal processes. The 4M predetermined time
generator became available for CSD and CSD/AML in 1986.
SYSTEM EESCRIPTICN:
CSD is a shop floor control software package which enables the user to
incorporate any predetermined time system or standard data in developing
manual time standards. If no specific predetermined time system or standard
data is specified, CSD can be supplied with MTM's 4M system. Seme of the
features CSD provides are as follows:
0 Operation Standards 0 Routings
Operation Instructions
Operation Cost Estimates
MRP Interface
AML is a software system that enables the user to establish machine time
standards using their own machining data or data supplied with the software.
Data supplied with AML is based on engineering data available to industries
regarding metal removal. AML determines the number of cuts and the feeds and
speeds required to optimize the horsepower used in a particular machining
operation.
-212-
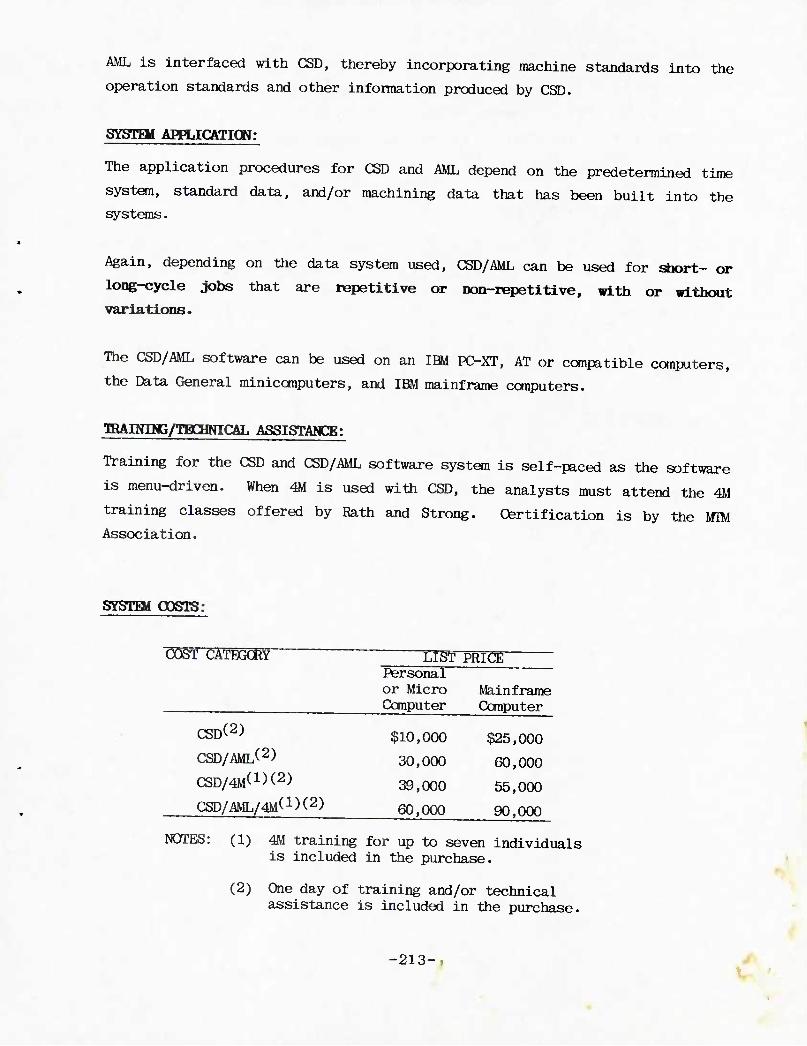
ML is interfaced with CSD, thereby incorporating machine standards into the
operation standards and other information produced by CSD.
SYSTEli APFLICATICN:
The application procedures for CSD and AML depend on the predetermined time
system, standard data, and/or machining data that has been built into the
systems.
Again, depending on the data system used, CSD/AML can be used for short- or
long-cycle jobs that are repetitive or non-repetitive, with or without
variations.
The CSD/AML software can be used on an IBM PC-XT, AT or compatible computers,
the Data General minicomputers, and IBM mainframe computers.
TRAINING/TECHNICAL ASSISTANCE:
Training for the CSD and CSD/AML software system is self-paced as the software
is menu-driven. When 4M is used with CSD, the analysts must attend the 4M
training classes offered by Rath and Strong. Certification is by the MIM
Association.
SYSTHI COSTS:
COST CATBGCRY LIST PRI^ Personal or Micro Mainframe Computer Computer
CSD^2) $10,000
CSD/AML^2) 30,000
CSD^^K2) 39,000
$25,000
60,000
55,000
CSD/AML^1) (2) 60,000 90,000
NOTES: (1) 4M training for up to seven individuals is included in the purchase.
(2) One day of training and/or technical assistance is included in the purchase.
-213-
oamjANCE wrm MIL STD 1567A:
Because CSD/AML is basically a software package which uses other systems to
develop the standard times, its ability to be in compliance is strictly
dependent upon the level of accuracy of the systems used. For the accuracy
level of 4M refer to System Accuracy or System Descriptions sections.
gjgWSljjg AND WEAKNESSES:
No references were provided by the system vendor; therefore, the system's
strengths and weaknesses could not be discussed with an actual user.
SYSTEM DSHBS:
The CSD systems are currently being used in five companies representing a
variety of industries.
REFERENCE SODBCE:
Rath and Strong
. -214-
SDPERCAPES
OONTACT: Alan Sheffield, Marketing & Sales Manager OOMPANY: Systems Control AEORESS: Two Rockledge Center, Suite 750, 6701 Rockledge Drive
Bethesda, MD. 20817 PHCNE: (301) 571-1000
SYSTEM HISTORY:
SOPERCAPES I and II are software packages developed in 1978-79 by Methods
Workshop LTD. in England.
SYSTEM OBSCRIPTICW:
Supercapes I is a software package that enables the user to develop route
cards, operation-standards, and method specifications using a personal
computer or microcomputer. Supercapes II is a software package for mini-
computers and is a multi-user management tool which addresses the following
functions: estimating, costing, process planning, industrial engineering.
Both systems can be used in developing manual and process time standards and
will accommodate any predetermined time system desired or elemental data
developed from other study techniques. In addition. Systems Control has
developed General Assembly Data (GAD) which is standard data based on MTM.
GAD data represent common motion sequences which occur in a light bench or
repetitive assembly environment. Each GAD code has a known Mean and Standard
Deviation thereby providing the basis for determining overall accuracy when a
number of elements are combined together at different frequencies. Because
GAD is standard data, it must be evaluated as to its accuracy in each specific
application.
The system vendor states that backup data for the GAD code can theoretically
be generated using any level of MTM, although current backup data is provided
based on MIM Core Data. MTM Core Data is a permutation of MTM developed in
the United Kingdan which has not yet been officially accepted by the
International MTM Association. The system vendor is currently in the process
of developing backup data based on MIM-2.
-215- I
Supercapes I and II can also be used to develop machine time standards using
the canpany's own machining data or based on engineering data available
through other metal removal resources.
A sunmary of the types of data available for both Supercapes I and II is shown
below:
Machining - Turning, Drilling, Milling, Grinding, Boring, Gear Cutting
General Purpose - Sawing, Shearing, Cutting, Binding, Rolling, Welding, Pressing, Punching, Heavy Fitting, Heat Treatment, and other processes or activities.
Manual - Bench, Line, Sub and Final Assembly
SYSTHi APHJCATICW:
Supercapes I and II are both menu driven; however, the actual method of
application will depend upon the predetermined time system, standard data,
and/or machining data that has been built into the systems.
Again, depending on the measurement system used, Supercapes I and II can be
used for sbort- or long-cycle jobs that are repetitive or non-repetitive with
or without variations.
When GAD is incorporated into Supercapes I and II, the user has a choice of
application methods as follows:
The user can enter the proper GAD codes, chosen from a data card of
30 codes, by following computer prompts. The computer then generates
a methods analysis.
The user can follow pre-programmed question and answer prompts from
which the computer selects the proper GAD codes and then generates a
methods analysis.
GAD was developed only for light bench or repetitive assembly operations.
-216-
*
Supercapes I software can be used on an IBM PC-XT or AT; and, Supercapes II
can be used on Digital's MicroVax or Vax, and HP's 1000 or 3000 models.
TRAINING/TBCHNICAL ASSISTANCE:
Training for Supercapes I and II is performed at the user's site and focuses
on "hands-on" experience. The time frame for training varies as follows:
0 Supercapes I - 3 to 5 weeks 0 Supercapes II - 5 to 8 weeks
If an MM system is used, the above-mentioned time frames assume the user is
certified in the appropriate Mm system.
SYSTHi O0STS:
COST CATEGORY LIST PRICE Supercapes I ~" """"
Training $ 15,000(1) Software $ 30,000^
Supercapes II Training $ 25,000^ Software $ 70,000^
NOTES: (T) Training costs listed are based on an average and may vary with each client.
(2) Software prices listed are based on an average for one location and will increase if more modules and/or locations are required.
COMPLIANCE WITH MIL SID 1567A:
Because Supercapes I and II are basically software packages which use other
systems to develop the standard times, their ability to be in conpliance is
strictly dependent upon the level of accuracy of the systems used.
STRENGTBg & WEAKNESSES:
Strengths and weaknesses aud/or constraints identified are based on
discussions with users of the Supercapes software systems. The coranents
-217-
listed below are based on these discussions and, while a broad range of
industries were sampled, coranents should not be considered universal and
therefore may not be applicable to all manufacturing environments:
The system vendor provides exceptional technical assistance and customizing capabilities.
The system provides for using formulas and prints out detail showing how the formula was used.
0 The system is user friendly.
The system can be networked with other manufacturing or financial systems.
The system provides detailed documentation of standards development.
It is difficult to locate information in the manuals provided with the systems.
There is limited storage space available on the PC version (theoretically 30,000 live route cards).
SYSTEM OSERS:
Based on data supplied by the system vendor, a breakdown of system users, in
the United States, by manufacturing type is as follows:
Application Type Number of Companies
Manufacturing g Electronics Q Aerospace 3 Other 2
In addition, Supercapes is being, or has been used within 82 ccrapanies in the
United Kingdom and Europe.
REFERENCE SODRCE: —————
Systems Control
-218-
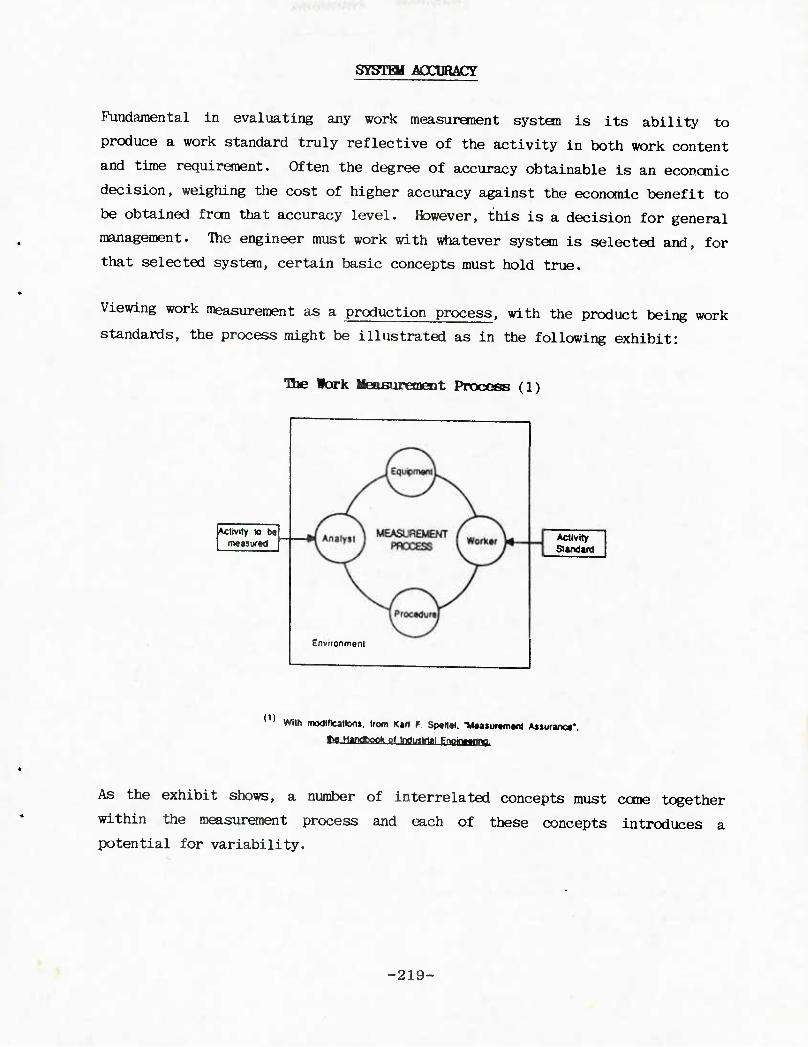
SYSTBI AOCDBACY
Fundamental in evaluating any work measurement system is its ability to
produce a work standard truly reflective of the activity in both work content
and time requirement. Often the degree of accuracy obtainable is an econcmic
decision, weighing the cost of higher accuracy against the economic benefit to
be obtained from that accuracy level. However, this is a decision for general
management. The engineer must work with whatever system is selected and, for
that selected system, certain basic concepts must hold true.
Viewing work measurement as a production process, with the product being work
standards, the process might be illustrated as in the following exhibit:
The fork Measurement Process (1)
Activity » b« measured
Environment
Activity Standard
(D With modlticallon*, Irom Karl f Spertel, -Measurement Aasuranc*-,
tt Handbook Q( MtBttl gnoineenn^
As the exhibit shows, a number of interrelated concepts must cone together
within the measurement process and each of these concepts introduces a
potential for variability.
-219-
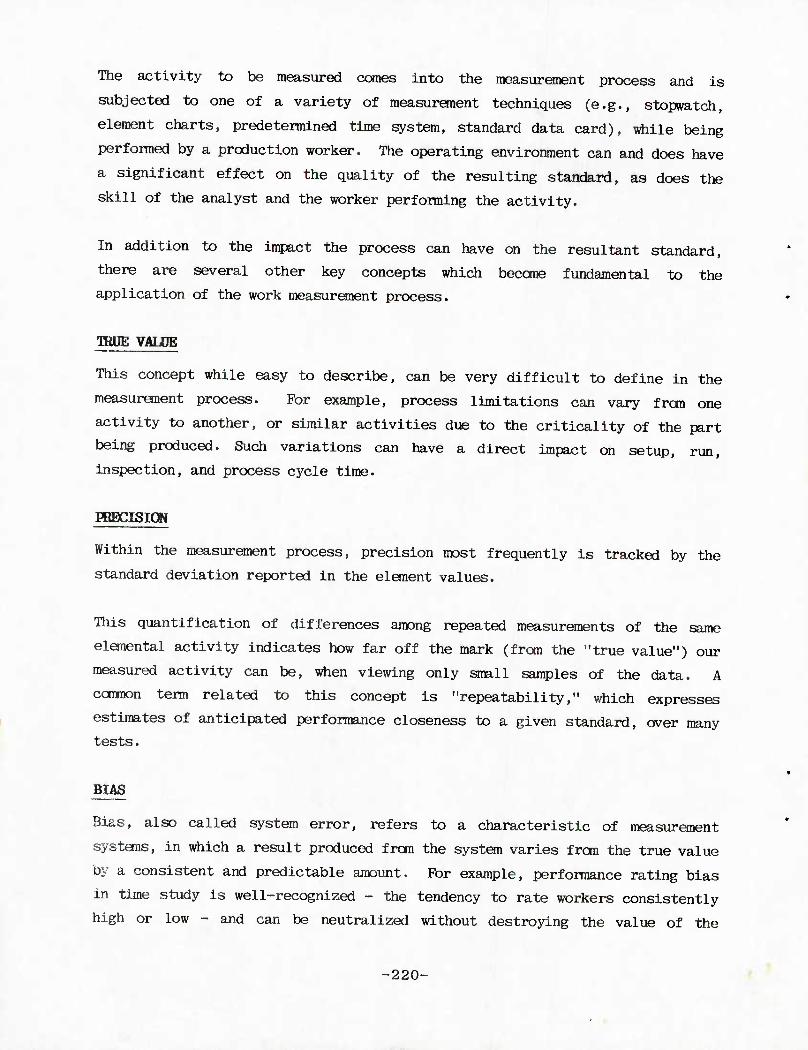
The activity to be measured comes into the measurement process and is
subjected to one of a variety of measurement techniques (e.g., stopwatch,
element charts, predetermined time system, standard data card), while being
performed by a production worker. The operating environment can and does have
a significant effect on the quality of the resulting standard, as does the
skill of the analyst and the worker performing the activity.
In addition to the impact the process can have on the resultant standard,
there are several other key concepts which beccrne fundamental to the
application of the work measurement process.
TBUE VALUE
This concept while easy to describe, can be very difficult to define in the
measurement process. For example, process limitations can vary from one
activity to another, or similar activities due to the criticality of the part
being produced. Such variations can have a direct impact on setup, run,
inspection, and process cycle time.
DECISION
Within the measurement process, precision most frequently is tracked by the
standard deviation reported in the element values.
This quantification of differences among repeated measurements of the same
elemental activity indicates how far off the mark (from the "true value") our
measured activity can be, when viewing only small samples of the data. A
cannon term related to this concept is "repeatability," which expresses
estimates of anticipated performance closeness to a given standard, over many
tests.
BIAS
Bias, also called system error, refers to a characteristic of measurement
systems, in which a result produced fron the system varies from the true value
by a consistent and predictable amount. For example, performance rating bias
in time study is well-recognized - the tendency to rate workers consistently
high or low - and can be neutralized without destroying the value of the
■220-
analysis. Bias, as long as it is consistent and measurable, can be "zeroed
out" in the everyday application of a measurement system.
AOOIRACy
Accuracy refers to the agreement of individual study values with an accepted
true value, when the study method and the sample size of the study have been
predetermined.
Distinctions among the above-defined terms must be clearly understood in order
for a measurement system to receive an accurate assessment, when the engineer
is searching for the most appropriate and usable tool. The following exhibit
reflects the interrelationship of the terms True Value, Precision, Bias, and
Accuracy:
The Accuracy DLagram (2)
«i
In summary, bias indicates definable difference frcm the truth, precision
indicates how close samples center on the truth (with bias), while accuracy
measures the system's closeness to the truth.
-221-
SYSTEM APHJCATIOW
Overlooked many times during the evaluation of the total accuracy of a given
predetermined time system is the applicators' ability to apply the system
properly. While the system's inherent accuracy can be determined statis-
tically, applicator error must be evaluated based on observation and/or
experiences. Applicator accuracy will vary between individuals, depending on
the amount of training and experience each posseses.
One may conclude that as a system becomes more defined it also becomes more
accurate due to less deviations. While this may be true, the more selections
and decision points required of the applicator can create more opportunity for
applicator error.
In the majority of instances, the most frequent type of applicator error has
been related to the oramission of required activites and/or motions or the
inclusion of a motion and/or activity that does not occur during the perfor-
mance of a given operation.
Although very little research has been done in this area, applicator error
influences the total accuracy of a system as much or more than the system
itself. Through proper training and application experience, this opportunity
for applicator error can be significatntly reduced.
TRACKABILITy
Another important concept to be considered when selecting a measurement
systems is traceability. Traceability exists when evidence shows the system
to reproduce measurement results for which the measurable uncertainty to some
standard is quantified (typically ± 5% error, 95% confidence interval).
Since the time elements used by many of the systems presented in this refer-
ence guide can be traced to MTM-1 and since numerous systems compare their
analysis results to similar analyses by using MTM-1, it was necessary to eval-
uate both the level of accuracy of the MT^l predetermined time system and
-222-
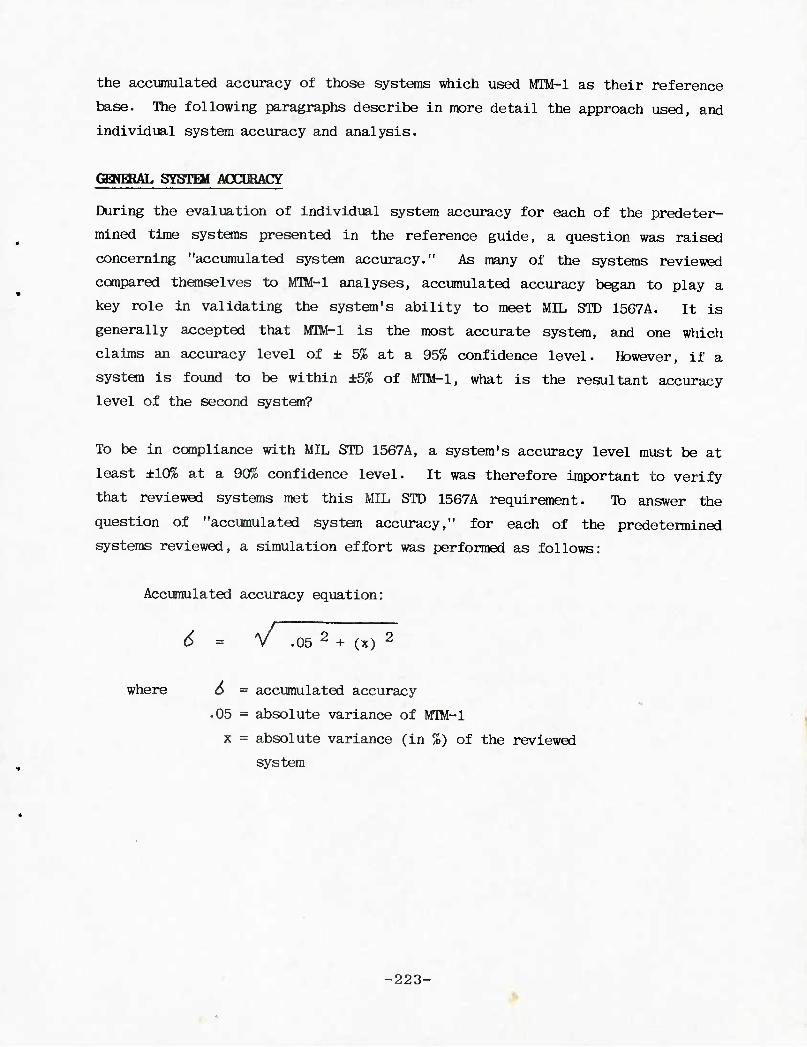
the accumulated accuracy of those systems which used MTM-1 as their reference
base. The following paragraphs describe in more detail the approach used, and
individual system accuracy and analysis.
GBTCRAL SYSTHI ACOIRACY
During the evaluation of individual system accuracy for each of the predeter-
mined time systems presented in the reference guide, a question was raised
concerning "accumulated system accuracy." As many of the systems reviewed
compared themselves to MTM-1 analyses, accumulated accuracy began to play a
key role in validating the system's ability to meet MIL STD 15G7A. It is
generally accepted that MTO-l is the most accurate system, and one which
claims an accuracy level of ± 5% at a 95% confidence level. However, if a
system is found to be within ±5% of MIM-1, what is the resultant accuracy
level of the second system?
To be in compliance with MIL STD 1567A, a system's accuracy level must be at
least ±10% at a 90% confidence level. It was therefore important to verify
that reviewed systems met this MIL STD 1567A requirement. lb answer the
question of "accumulated system accuracy," for each of the predetermined
systems reviewed, a simulation effort was performed as follows:
Accumulated accuracy equation:
6 - V .05 2 + (x) 2
where 6 ■ accumulated accuracy
.05 = absolute variance of MTM-1
x = absolute variance (in %) of the reviewed
system
-223-
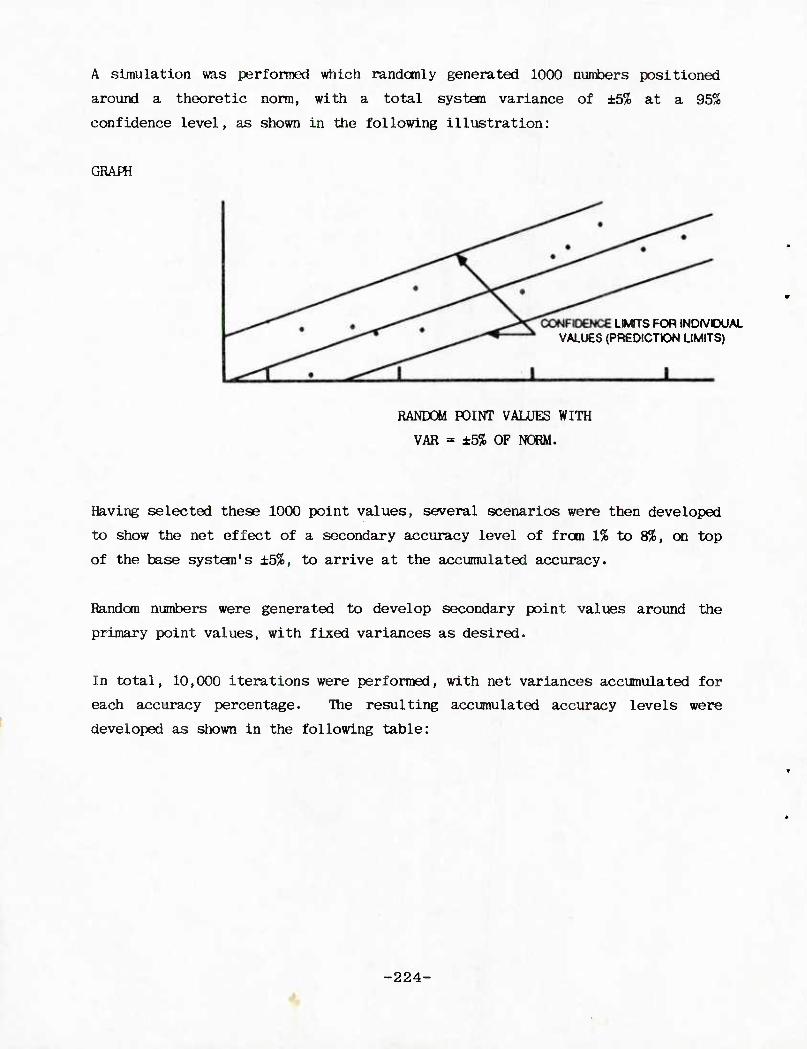
A simulation was performed which randonly generated 1000 numbers positioned
around a theoretic norm, with a total system variance of ±5% at a 95^
confidence level, as shown in the following illustration:
GRAPH
LMTS FOR INDIVIDUAL VALUES (PREDICTION LIMITS)
RANDOM POINT VALUES WITH
VAR = ±5% OF NORM.
Having selected these 1000 point values, several scenarios were then developed
to show the net effect of a secondary accuracy level of from 1% to 8%, on top
of the base system's ±5%, to arrive at the accumulated accuracy.
Random numbers were generated to develop secondary point values around the
primary point values, with fixed variances as desired.
In total, 10,000 iterations were performed, with net variances accumulated for
each accuracy percentage. The resulting accumulated accuracy levels were
developed as shown in the following table:
-224-
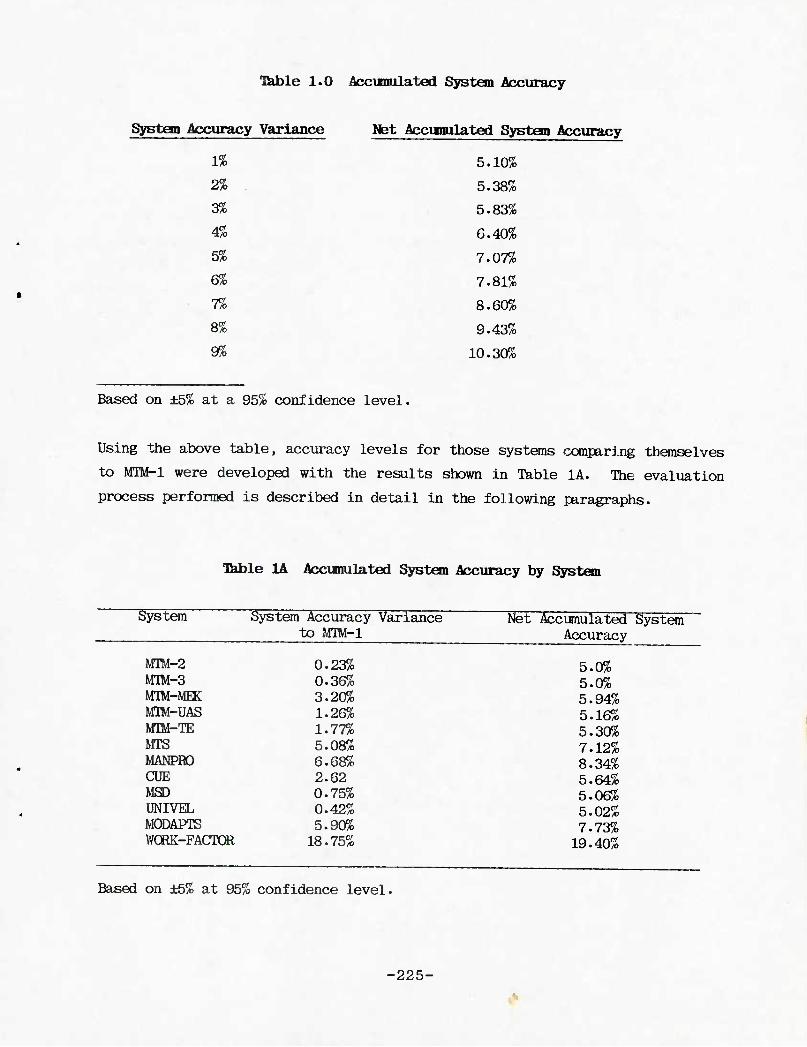
Table 1.0 Accumulated System Accuracy
System Accuracy Variance Net Accuoulated System Accuracy
1% 5.10%
2% . 5.38%
3% 5.83%
4% G.40%
5% 7.07%
6% 7.81%
7% 8.60%
8% 9.43%
9% 10.30%
Based on ±5% at a 95% confidence level.
Using the above table, accuracy levels for those systems comparing themselves
to MTM-1 were developed with the results shown in Table 1A. The evaluation
process performed is described in detail in the following paragraphs.
Table 1A Accumulated System Accuracy by System
System System Accuracy Variance Net Accumulated System to MTM-1 Accuracy
MTM-2 0.23% 5.0% MTM-3 0.36% 5.0% MTM-MEK 3.20% 5.94% MTM-UAS 1.26% 5.16% MTM-TE 1.77% 5.30% MTS 5.08% 7.12% MANPRO 6.68% 8.34% CUE 2.62 5.64% MSD 0.75% 5.06% UNIVEL 0.42% 5.02% M0DAPTS 5.90% 7.73% WCRK-FACTOR 18.75% 19.40%
Based on ±5% at 95% confidence level.
-225-
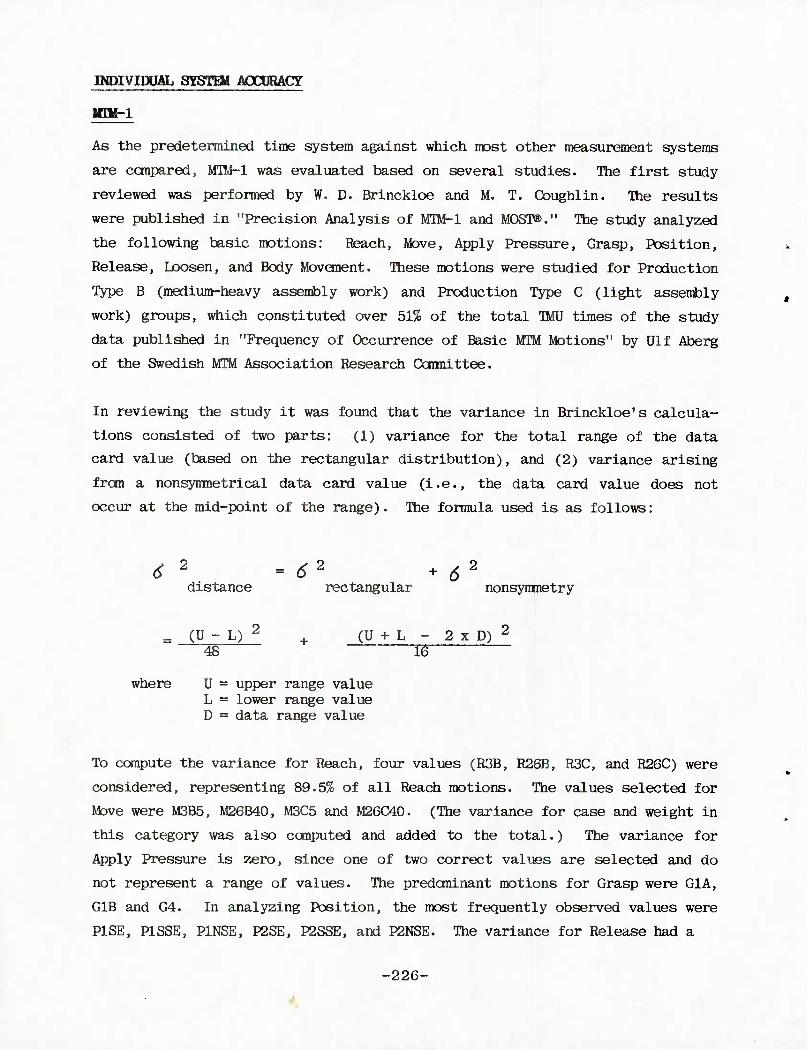
INDIVIDOAL SYSTEM AOCURACY
ICli-l
As the predetermined time system against which most other measurement systems
are canpared, MTM-l was evaluated based on several studies. The first study
reviewed was performed by W. D. Brinckloe and M. T. Coughlin. The results
were published in "Precision Analysis of MTM-l and MOST®." The study analyzed
the following basic motions: Reach, Move, Apply Pressure, Grasp, Position,
Release, Loosen, and Body Movanent. These motions were studied for Production
Type B (medium-heavy assembly work) and Production Type C (light assembly
work) groups, which constituted over 51% of the total TMU times of the study
data published in "Frequency of Occurrence of Basic MTM Motions" by Ulf Aberg
of the Swedish MTM Association Research Caimittee.
In reviewing the study it was found that the variance in Brinckloe's calcula-
tions consisted of two parts: (1) variance for the total range of the data
card value (based on the rectangular distribution), and (2) variance arising
from a nonsymmetrical data card value (i.e., the data card value does not
occur at the mid-point of the range). The formula used is as follows:
6 2
distance - 62 + 62
rectangular nonsynmetry
= (U - L) 2
48 , (U + L-2xD)2
16
where U = upper range value L » lower range value D = data range value
To compute the variance for Reach, four values (R3B, R26B, R3C, and R26C) were
considered, representing 89.5% of all Reach motions. The values selected for
Move were M3B5, M26B40, M3C5 and M26C40. (The variance for case and weight in
this category was also computed and added to the total.) The variance for
Apply Pressure is zero, since one of two correct values are selected and do
not represent a range of values. The predominant motions for Grasp were G1A,
GIB and G4. In analyzing Position, the most frequently observed values were
PISE, P1SSE, P1NSE, P2SE, P2SSE, and P2NSE. The variance for Release had a
-220-
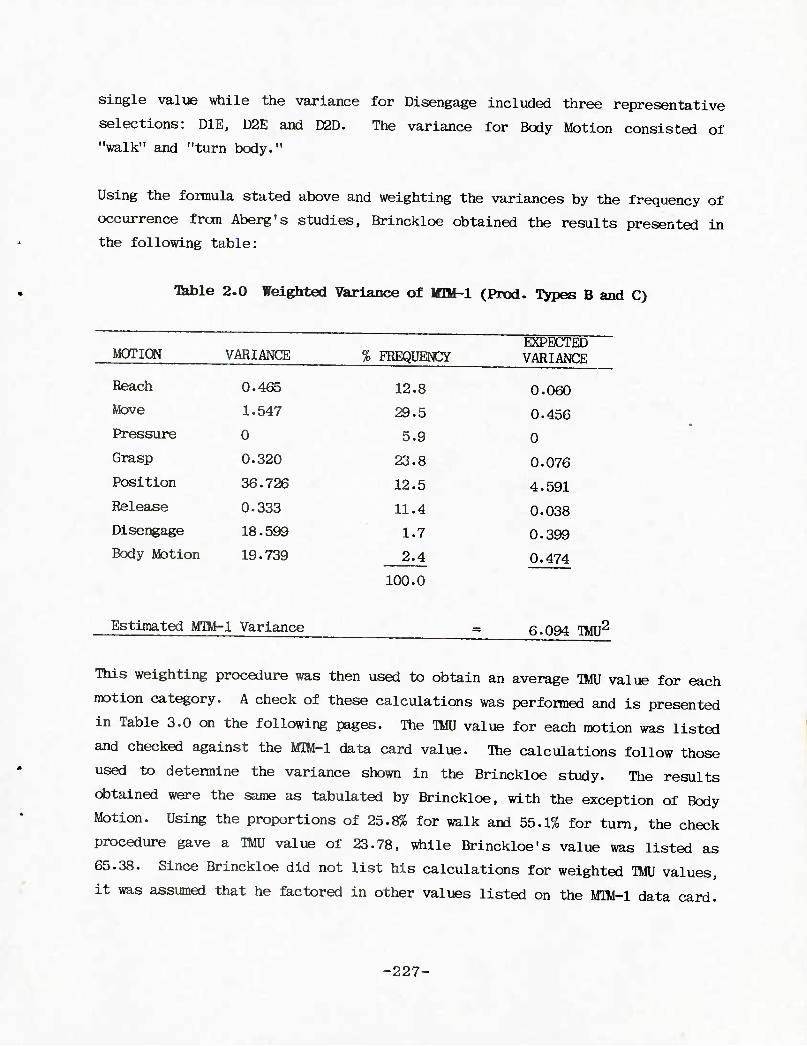
single value while the variance for Disengage included three representative
selections: DIE, D2E and D2D. The variance for Body Motion consisted of
"walk" and "turn body."
Using the formula stated above and weighting the variances by the frequency of
occurrence from Aberg's studies, Brinckloe obtained the results presented in
the following table:
liable 2.0 Weighted Variance of MTM-1 (Prod. Types B and C)
MOTION VARIANCE % FREQUENCY EXPECTED VARIANCE
Reach 0.465 12.8 0.060
Move 1.547 29.5 0.456 Pressure 0 5.9 0 Grasp 0.320 23.8 0.076 Position 36.726 12.5 4.591
Release 0.333 11.4 0.038 Disengage 18.599 1.7 0.399 Body Motion 19.739 2.4 0.474
100.0
Estimated MTM-1 Variance 6.094 TMU2
This weighting procedure was then used to obtain an average TMU value for each
motion category. A check of these calculations was performed and is presented
in Table 3.0 on the following pages. The TW value for each motion was listed
and checked against the MTM-l data card value. The calculations follow those
used to determine the variance shown in the Brinckloe study. The results
obtained were the same as tabulated by Brinckloe, with the exception of Body
Motion. Using the proportions of 25.8% for walk and 55.1% for turn, the check
procedure gave a TMU value of 23.78, while Brinckloe's value was listed as
65.38. Since Brinckloe did not list his calculations for weighted WU values,
it was assumed that he factored in other values listed on the MIM-1 data card.
-227-
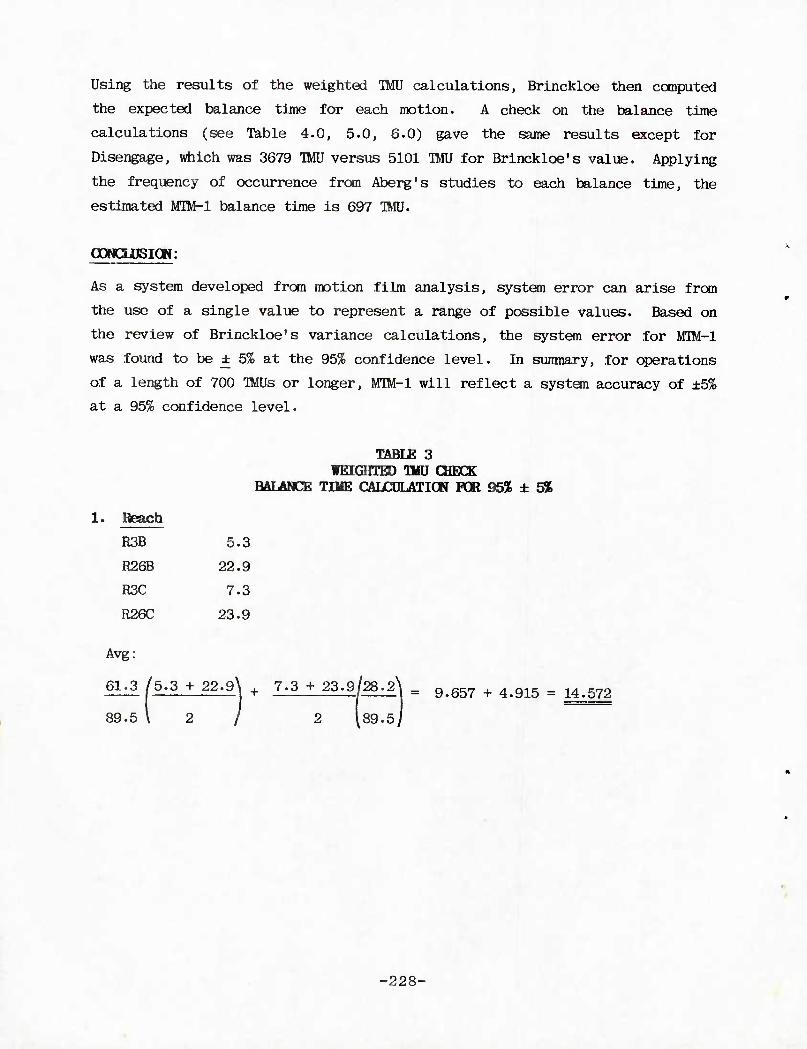
Using the results of the weighted 1MJ calculations, Brinckloe then computed
the expected balance time for each motion. A check on the balance time
calculations (see Table 4.0, 5.0, 6.0) gave the same results except for
Disengage, which was 3679 IMU versus 5101 TMU for Brinckloe's value. Applying
the frequency of occurrence from Aberg's studies to each balance time, the
estimated MTM-l balance time is 697 TMU.
ODMCLDSICH:
As a system developed from motion film analysis, system error can arise from
the use of a single value to represent a range of possible values. Based on
the review of Brinckloe's variance calculations, the system error for MIM-1
was found to be ± 5% at the 95% confidence level. In summary, for operations
of a length of 700 TMJs or longer, MTM-1 will reflect a system accuracy of ±5%
at a 95% confidence level.
TABLE 3 WEIGHTED "BID CHECK
BALANCE TIME CALCIILATICW FOR 95% ± 556
1. Reach
R3B 5.3
R26B 22.9
R3C 7.3
R26C 23.9
Avg:
6L3/5.3 + 22.9\ + 7.3 + 23.9(^2] = ^^ + 4.915 = 14<572
89.5 \ 2 / 2 189.5,
■228-
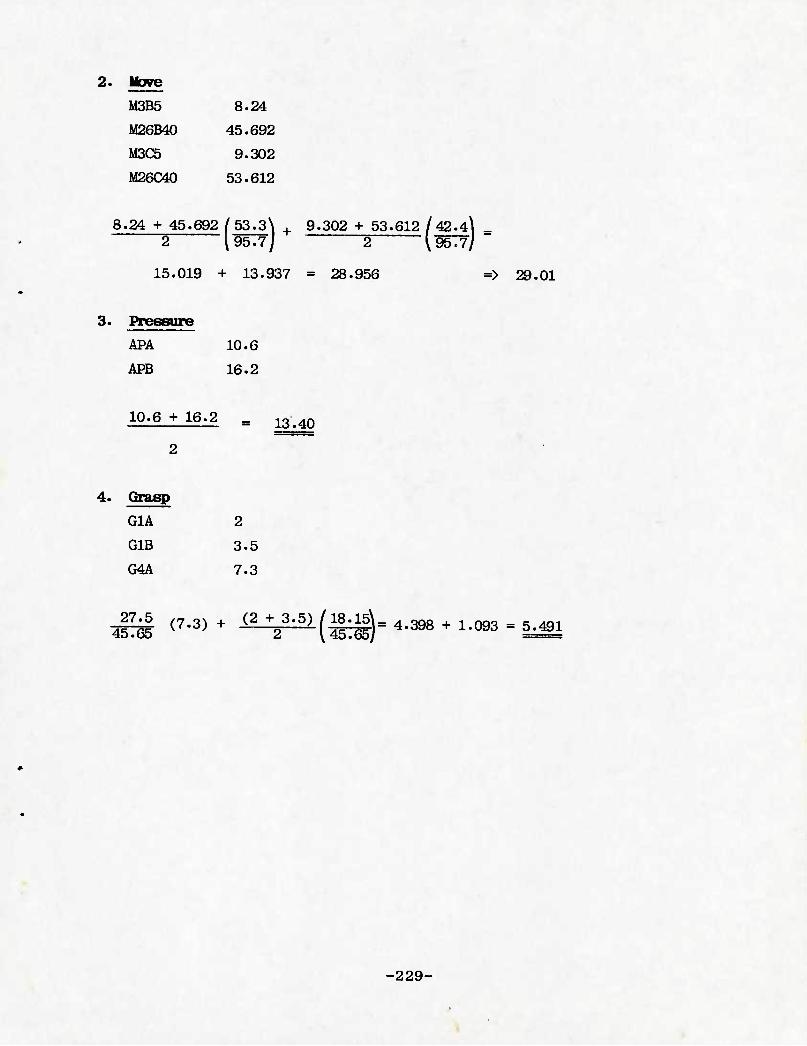
2. Move
M3B5 8.24
M26B40 45.692
M3C5 9.302
M26C40 53.612
i.24 + 45.692 /53.3\ + 9.302 + 53.612 /42.4\ ^ 2 (95.7/ 2 [WTrj
15.019 + 13.937 = 28.956 => 29.01
3. Pressure
APA 10.6
APB 16.2
10.6 + 16.2 _ 13.40
4. Grasp
G1A 2
GIB 3.5
G4A 7.3
27.5 45.65
(7.^) + (2 + 3.5) (18.15\ i 45.65
-229-
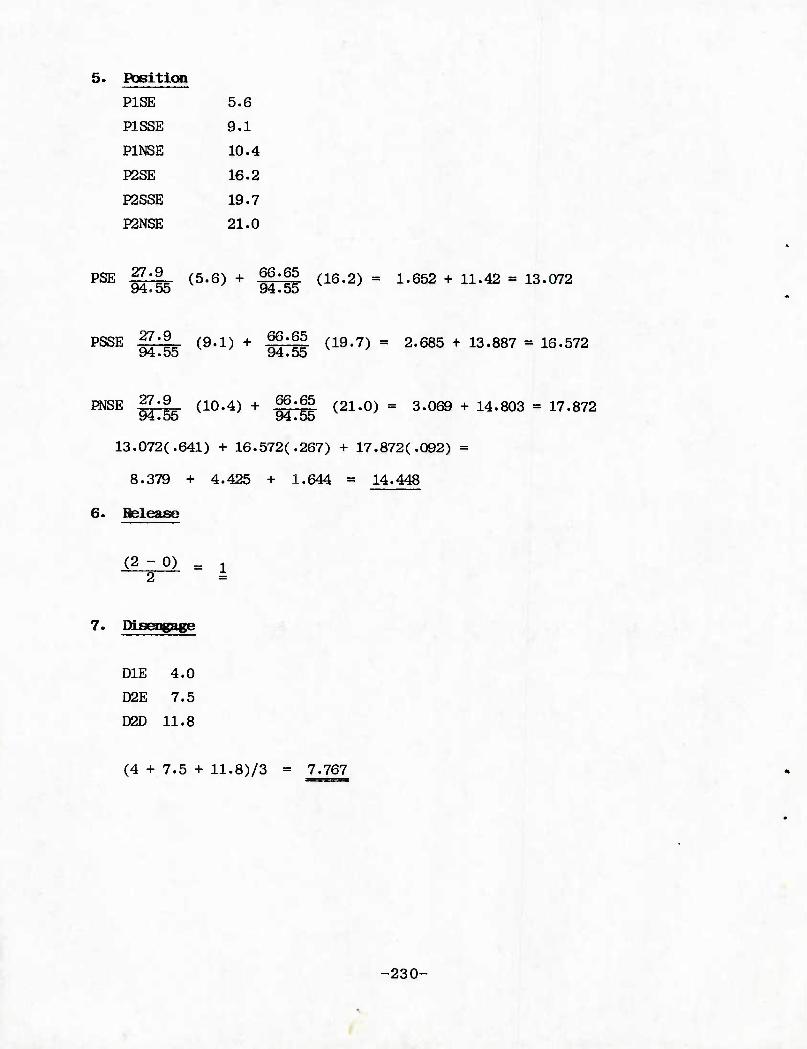
5. RKition
PISE 5.6
P1SSE 9.1
P1NSE 10.4
P2SE 16.2
P2SSE 19.7
P2NSE 21.0
PSE ^-g (5.6) + gg^jj (16.2) = 1.652 + 11.42 = 13.072
PSSE Si- (9-1) + S^S (19-7) ■ 2.685 + 13.887 = 16.572 94.55 94.55
PNSE ^.9 (io,4) + 66.65 (21.0) = 3.069 + 14.803 = 17.872 94.55 94.55
13.072(.641) + 16.572(.267) + 17.872(.092) =
8.379 + 4.425 + 1.644 = 14.448
6. Release
(2 - 0) = * 2
7. Dlsengaee
DIE 4.0
D2E 7.5
020 11.8
(4 + 7.5 + 11.8)/3 = 7.767
-230-
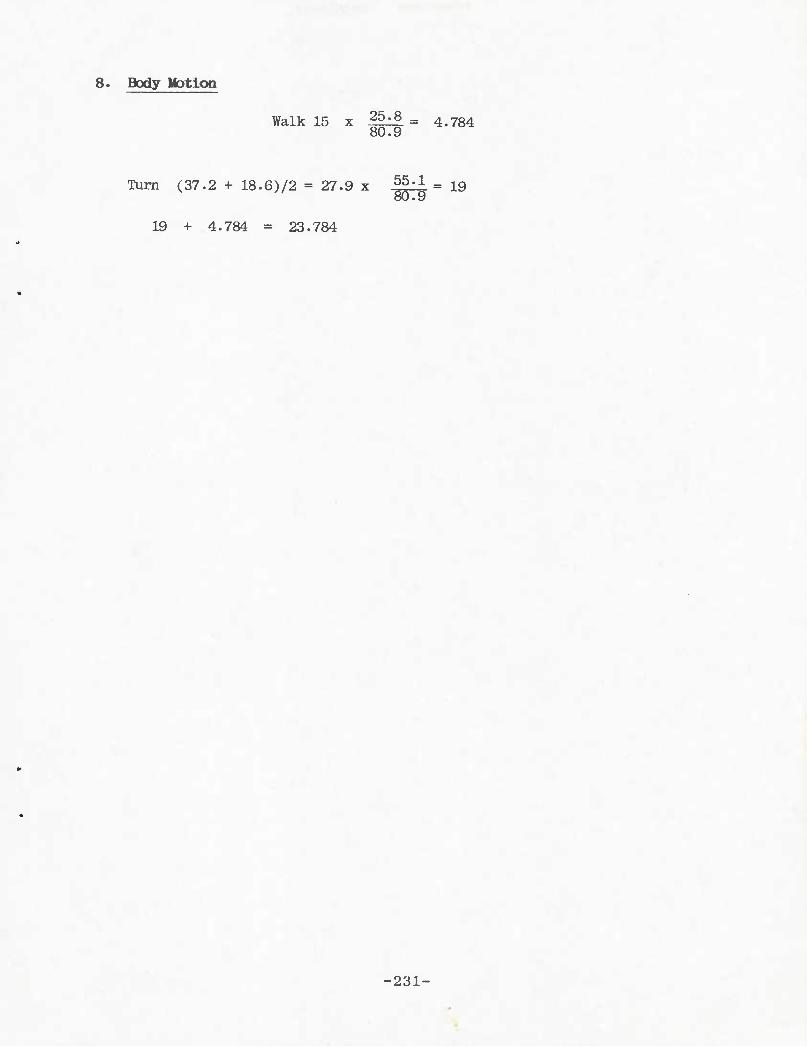
8. Body Motion
Walk 15 x 25,8 = 4.784 80.9
Turn (37.2 + 18.6)/2 = 27.9 x ^ik = 19 80.9
19 + 4.784 = 23.784
-231-
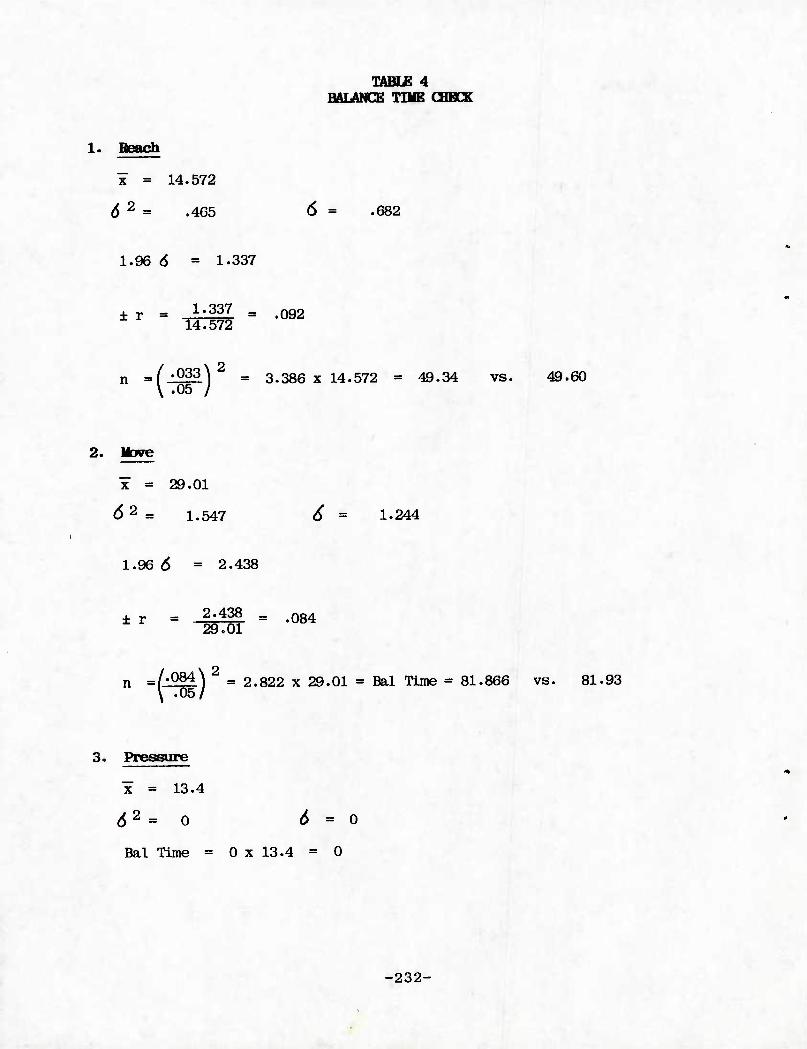
TABLE 4 BALANCE TIME CHECK
1. Beach
x = 14.572
62 = .465 6 = .682
1.96 6 = 1-337
± r = ,1-337 = .092 14.572
" =(#)
2 = 3.386 x 14.572 = 49.34 vs. ^.60
2. Move
x = 29.01
62 = 1.547 6 = 1.244
1.96 6 = 2.438
± r = 2•438 = .084 29.01
n =/-084'\ 2 = 2.822 x 29.01 = Bal Time = 81.866 vs. 81.93 \ -05/
3. Pressure
x = 13.4
62 = o 6 = 0
Bal Time = 0 x 13.4 = 0
-232-
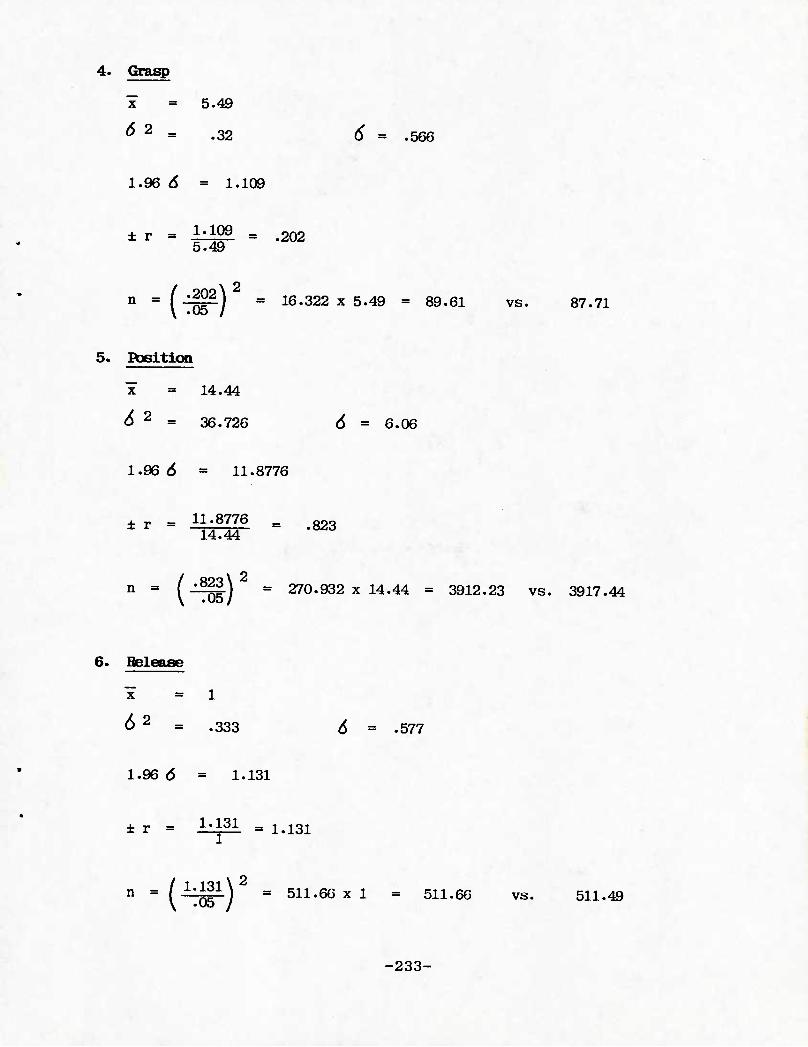
4. Grasp
x = 5.49
^ 2 = .32 6 = .566
1.96 6 = 1.109
± r = I'1™ = .202 5.49
»=0 ^1 ^ = 16.322 x 5.49 = 89.61 vs. 87.71 .05 /
5. Rjsltlon
x = 14.44
6 2 = 36.726 6 = 6.06
1.96 6 = 11.8776
± r - ^fH6 = .823 14.44
n = fjl5||) = 270.932x1,4.44 = 3912.23 vs. 3917.44 .05/
6. Beleaae
x =1
62 = .333 6 = .577
1.96 6 = 1.131
± r = iil31 = ltl31
n = /i^|l\ = 511.60x1 = 511.66 vs. 511.49
-233-
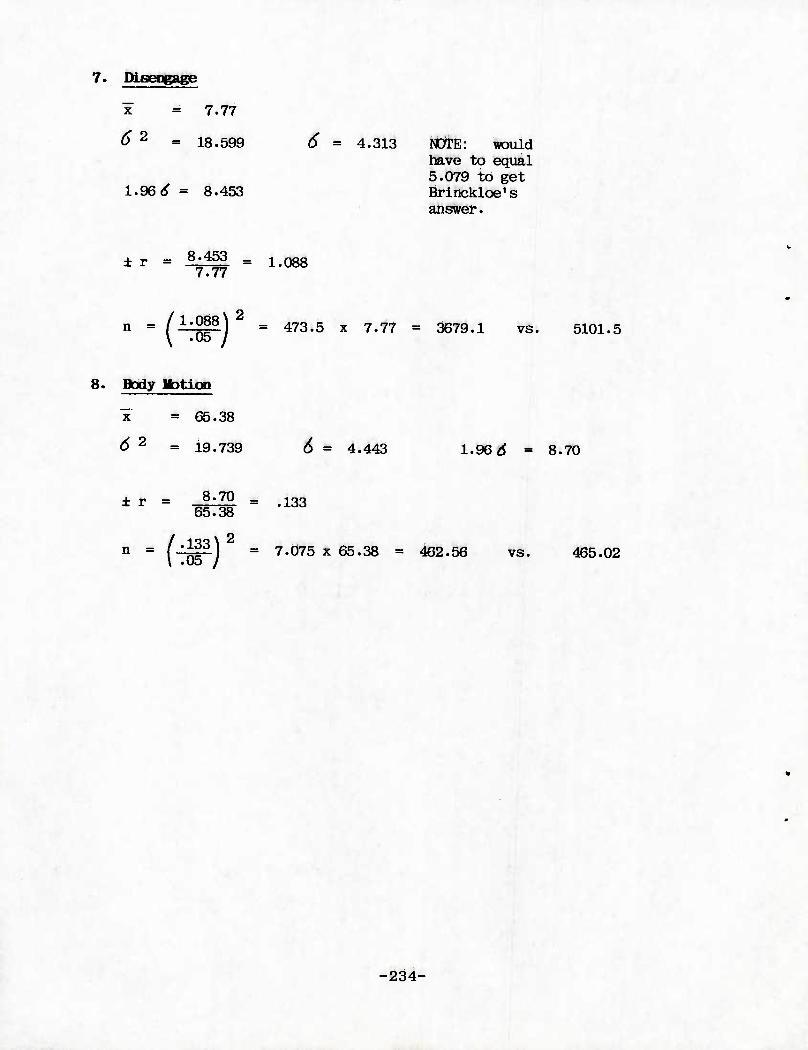
7. Disengage
x = 7.77
^ 2 = 18.599
1.96^ = 8.453
6 = 4.313 NOTE: would have to equal 5.079 to get Brinckloe's answer.
± r = 8I453 = j^.Qgg 7.77
- -(^j = 473.5 x 7.77 = 3679.1 vs. 5101.5
8. Body Motion
¥ = 65.38
d 2 = 19.739 6 * 4. 443 1.96^ = 8.70
± r = 8.70 _ 65.38
133
"-(#) = 7.075 x 65.38 = 462.56 vs. 465.02
-234-
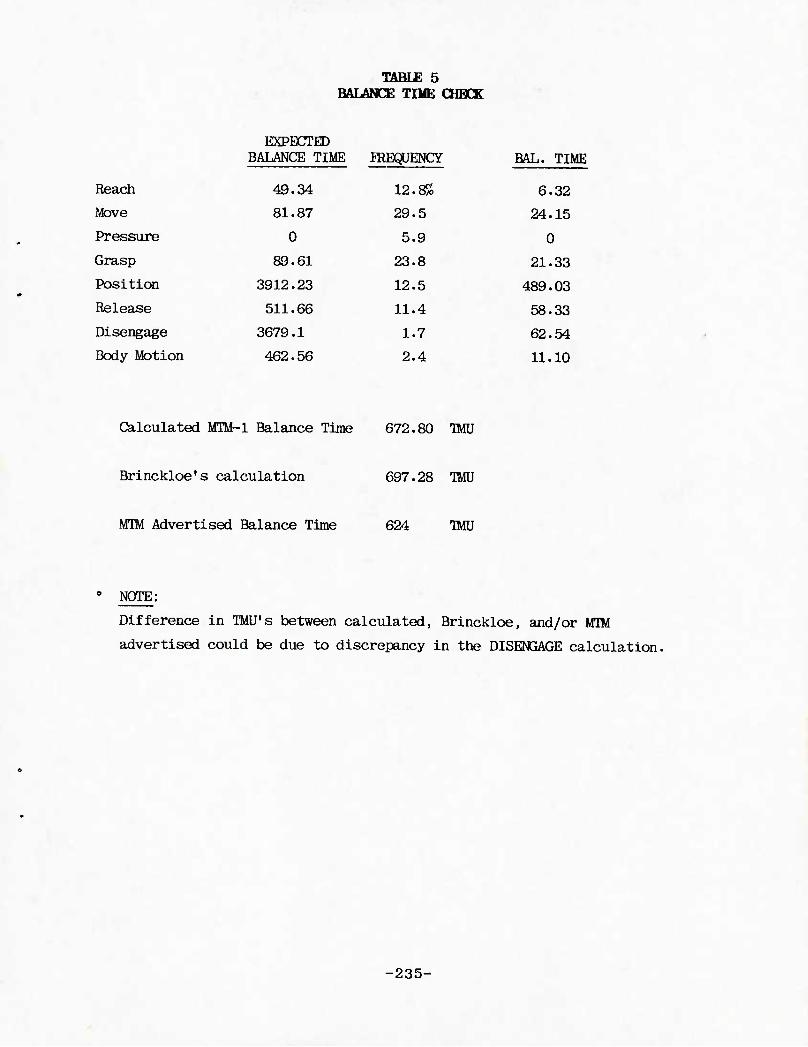
TABTK 5 BALANCE TIME CHECK
EXPECTED BALANCE TIME PREQUENCY BAL. TIME
Reach 49. .34 12.8% 6 .32
Move 81. .87 29.5 24. .15
Pressure 0 5.9 0
Grasp 89. .61 23.8 21. .33
Position 3912. .23 12.5 489. .03
Release 511. .66 11.4 58. .33
Disengage 3679 ,1 1.7 62. .54
Body Motion 462. .56 2.4 11. .10
Calculated MTM-1 Balance Time 672.80 TMU
Brinckloe's calculation 697.28 TMU
MTM Advertised Balance Time 624 TMU
NOTE:
Difference in TMU's between calculated, Brinckloe, and/or MTM
advertised could be due to discrepancy in the DISENGAGE calculation.
-235-
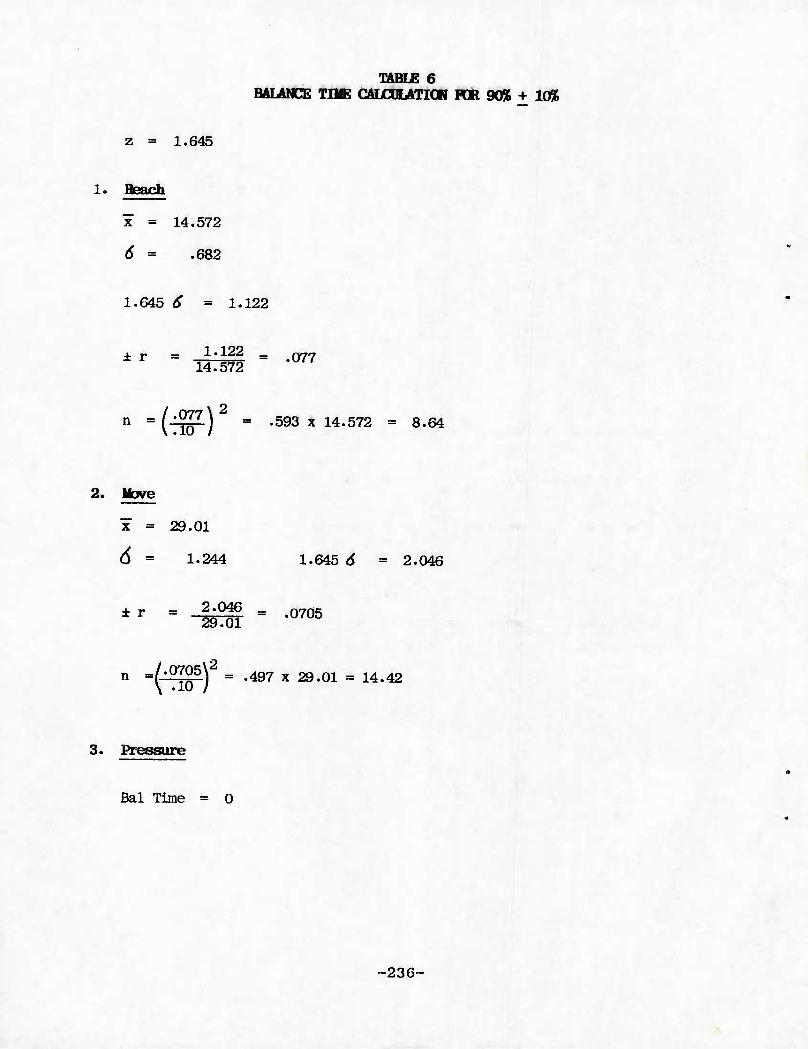
TABLE 6 BALANCE THE CALCDEATIGN PCR 90% + 10%
z = 1.645
1. Beach
x = 14.572
6 = .682
1.645 ^ = 1.122
± r = AlJM = .077 14.572
" -&) 2
= .593 x 14.572 = 8.64
2. Move
x = 29.01
6 = 1.244 1.645 6 = 2.046
ir '-S = •<*»
n =(,^TQ
5) = -497 x 29.01 = 14.42
3. Pressure
Bal Time = 0
-236-
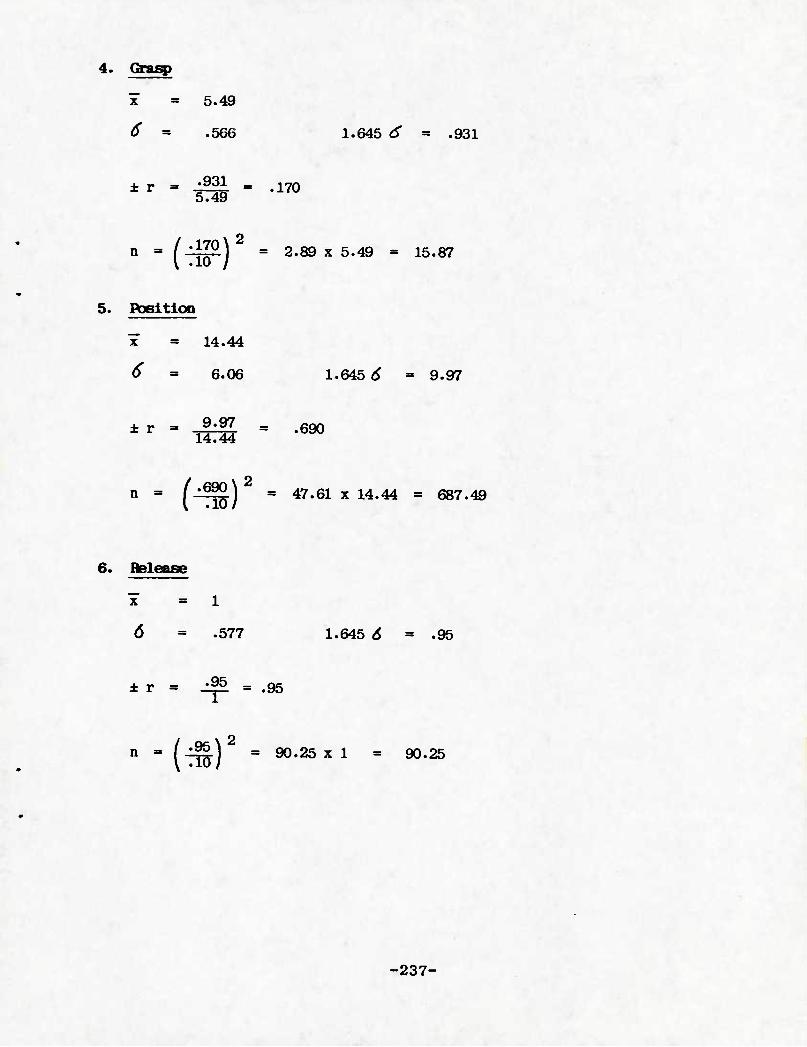
4. Grasp
x" = 5.49
6 = .566 1.645 d" = .931
± r = .931 _ 5.49
.170
'"(• .170 \ 2
.10 / ■ 2.89 x 5.49 • 15.87
5. POBltlOO
X = 14.44
6 = 6.06 1.645^ = 9.97
± r = 9.97 14.44
= .690
n . / ' .690 \ 2
TTT 1 = 47.61 x 14.44 = 687.49
6. Release
"x =1
6 = .577 1.645 6 = .95
± r = -l|l^ = .95
n = (-^] = 90.25x1 = 90.25
-237-
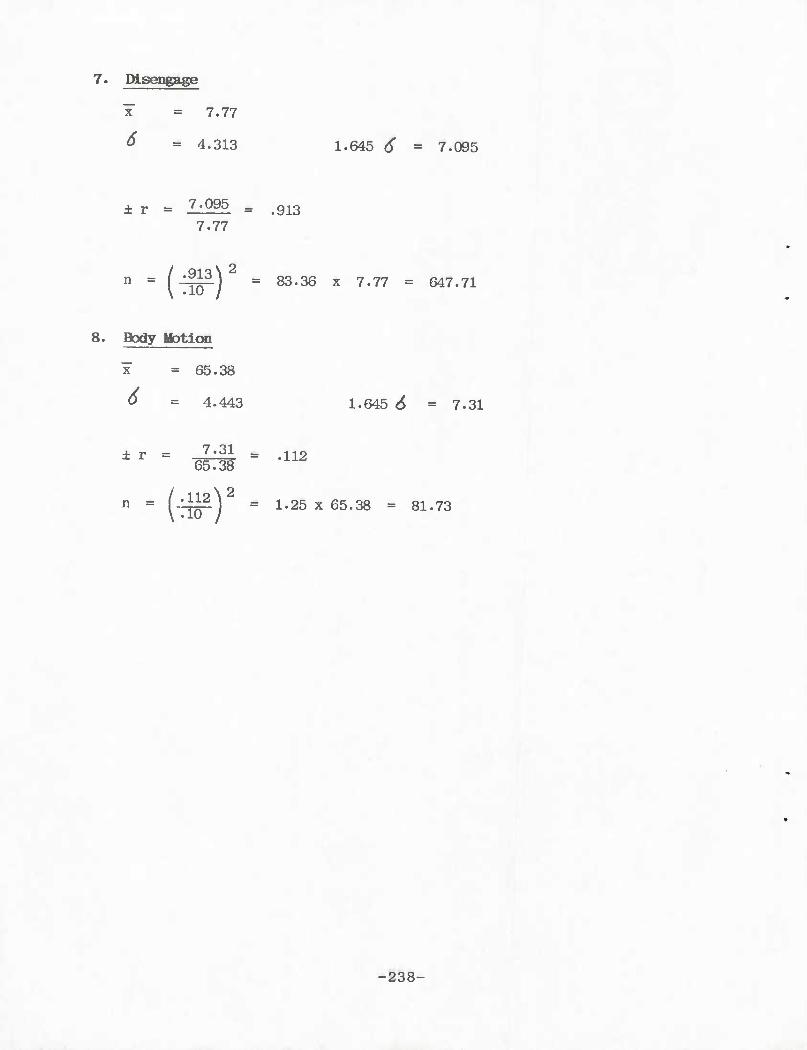
7. Disengage
x = 7.77
^ = 4.313 1.645 6 = 7.095
± T = 7.095
7.77 = .913
- -(^) = 83.36 x 7.77 = 647.71
8. Body Motion
X = 65.38
6 = 4.443
± T 7.31 65.38
n = i.wY
1.645 6 = 7.31
.112
1.25 x 65.38 = 81.73
-238-
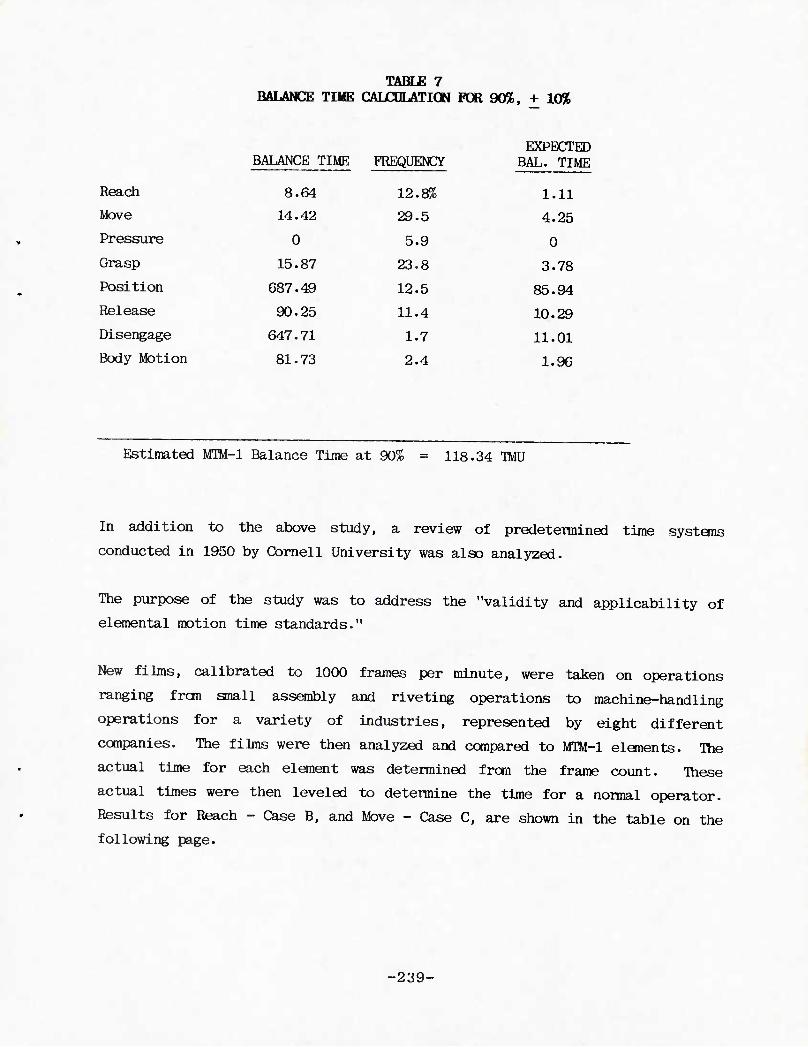
TABLE 7 BALANCE TIME CALCULATION FOR 90%, + 10%
Reach
Move
Pressure
Grasp
Position
Release
Disengage
Body Motion
BALANCE TIME FREQUENCY
8 .64 12.8%
14, .42 29.5
0 5.9
15. .87 23.8
687, .49 12.5
90. ,25 11.4
647. .71 1.7
81. 73 2.4
EXPECTED BAL. TIME
1.11
4.25
0
3.78
85.94
10.29
11.01
1.96
Estimated MTM-1 Balance Time at 90% = 118.34 TMU
In addition to the above study, a review of predetermined time systems
conducted in 1950 by Cornell University was also analyzed.
The purpose of the study was to address the "validity and applicability of
elemental motion time standards."
New films, calibrated to 1000 frames per minute, were taken on operations
ranging fran anall assembly and riveting operations to machine-handling
operations for a variety of industries, represented by eight different
companies. The films were then analyzed and compared to MTM-1 elements. The
actual time for each element was determined from the frame count. These
actual times were then leveled to detennine the time for a normal operator.
Results for Reach - Case B, and Move - Case C, are shown in the table on the
following page.
-239-
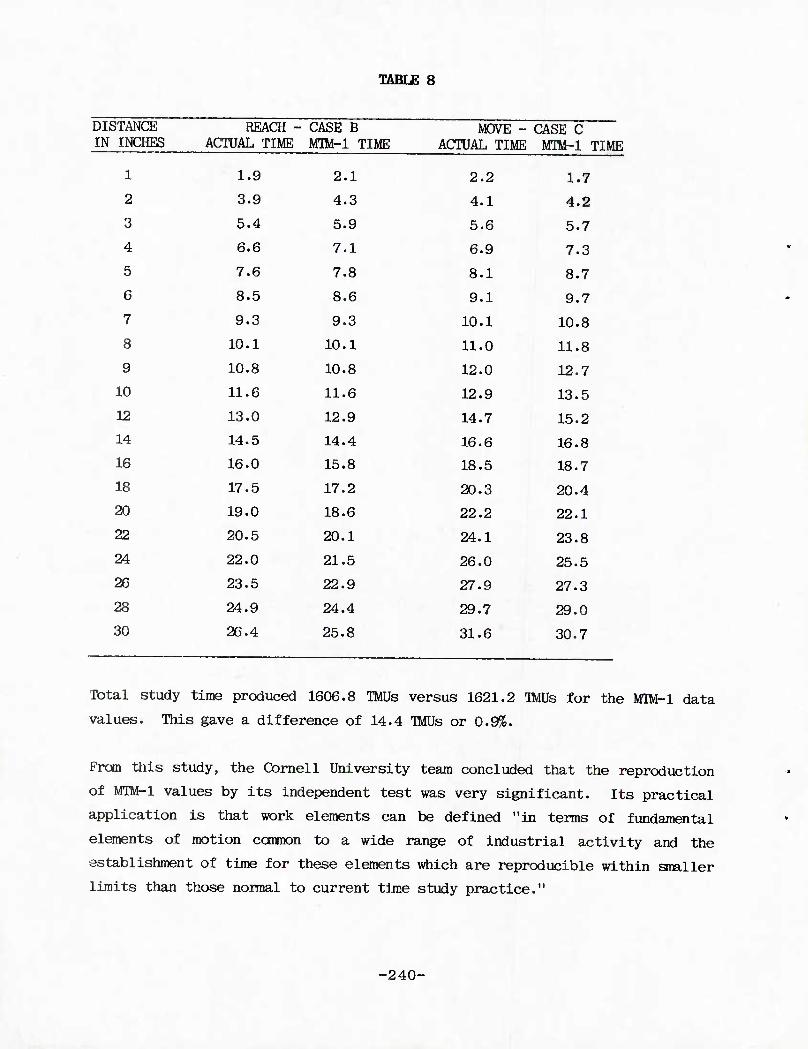
TABLE 8
DISTANCE REACH - CASE B MOVE - CASE C IN INCHES ACTUAL TIME MTM-1 TIME ACTUAL TIME MTM-1 TIME
1 1.9 2.1 2.2 1.7 2 3.9 4.3 4.1 4.2 3 5.4 5.9 5.6 5.7 4 6.6 7.1 6.9 7.3 5 7.6 7.8 8.1 8.7 6 8.5 8.6 9.1 9.7
7 9.3 9.3 10.1 10.8
8 10.1 10.1 11.0 11.8
9 10.8 10.8 12.0 12.7
10 11.6 11.6 12.9 13.5
12 13.0 12.9 14.7 15.2
14 14.5 14.4 16.6 16.8
16 16.0 15.8 18.5 18.7
18 17.5 17.2 20.3 20.4
20 19.0 18.6 22.2 22.1
22 20.5 20.1 24.1 23.8
24 22.0 21.5 26.0 25.5
26 23.5 22.9 27.9 27.3
28 24.9 24.4 29.7 29.0
30 26.4 25.8 31.6 30.7
Total study time produced 1606.8 TMUs versus 1621.2 TMUs for the MTM-1 data
values. This gave a difference of 14.4 IMUs or 0.9%.
From this study, the Cornell University team concluded that the reproduction
of MTM-1 values by its independent test was very significant. Its practical
application is that work elements can be defined "in terms of fundamental
elements of motion cannon to a wide range of industrial activity and the
establishment of time for these elements which are reproducible within snaller
limits than those normal to current time study practice."
-240-
Mm-2
lfM-2 groups sets of motions from MTM-l to obtain its values. In the paper
"Precision Analysis of MTM-211 by W. D. Brinckloe, the design of the nine MTM-2
motion categories was reviewed. These categories are Get, Put, Apply
Pressure, Regrasp, Eye Action, Crank, Step, Foot Motion, and Bend and Arise.
After analyzing the derivation of iinM-2 from imi-l, Brinckloe calculated the
variance and balance time for Nrm-2. The frequency data used in Brinckloe's
study was drawn iron the report "MrIM-2 Project" by the International M1M
Directorate.
The first MrM-2 motion category. Get, incorporates three MM-l motion
categories — Grasp, Reach and Release. There are three cases for Get: (1) A
- no grasping required, (2) B - single grasping motion, and (3) C - all other
motions. Get Case A (GA) corresponds to G5 in MTM-l, Get Case B (GB)
corresponds to G1A in MTM-l, and Get Case C (GC) corresponds to all remaining
Grasp motions in MTM-l. The grasp value for GA is 0 TMU; the grasp value for
GB is 2 TMU; and the grasp value for GC is 8.95 TMU, which is a weighted
average of the MTii-l grasp values (GIB, G1C1, G1C2, G1C3, G4A, G4B, and
G4C). For the Reach component of Get, a weighted value based on the observed
frequencies of occurrence was calculated for the three cases (GA, GB, and GC)
from the MTM-l Reach categories of R-A, R-B, and R-C. Finally, for the
Release component of Get, a statistical analysis revealed 95% of all G1A and
all other Grasps were followed by RL1. This corresponds to an applied value
of 0 IMJ to GA, and a value of 2 TMU to GB and to GC. The TMU values for the
components Grasp, Reach and Release were summed for each Get case. Then the
number of distance classes was calculated for MTM-2, resulting in five. The
optimum distances for the five classes were calculated and rounded to 2", 6",
12", 18", and 32". The resulting values for the three cases of Get at these
five distances, are shown in Table 9.0 below.
-241-
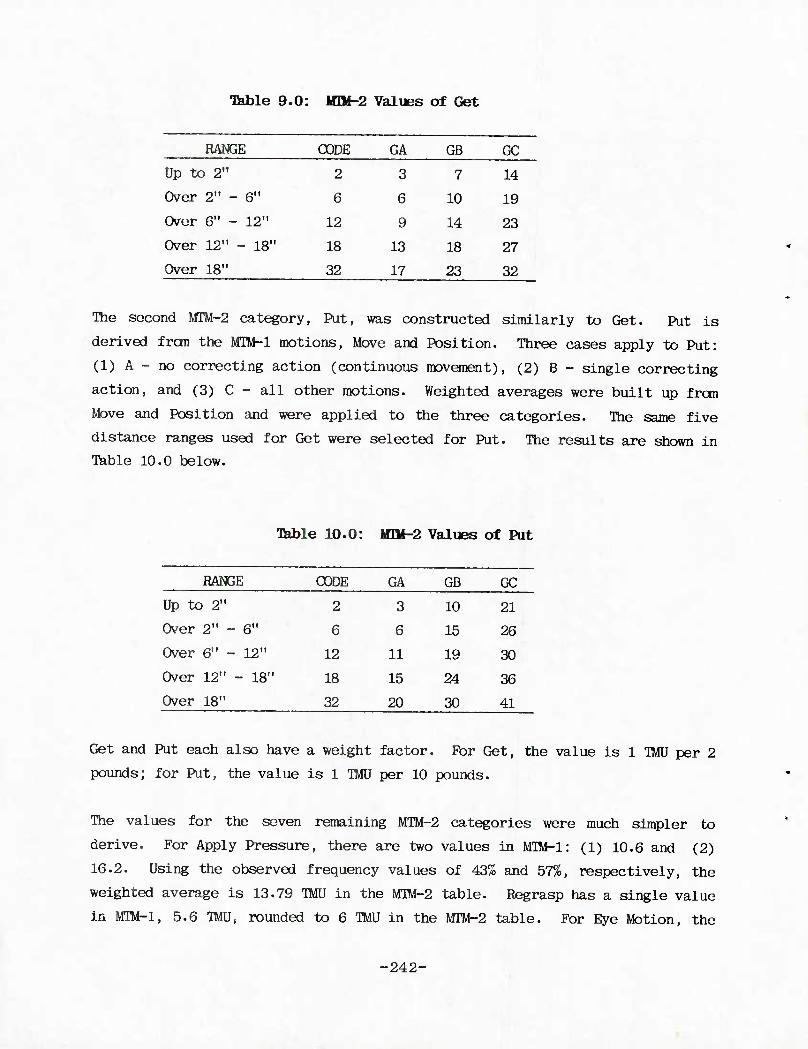
•Cable 9.0: MII4-2 Values of Get
RANGE CODE GA GB GC
Up to 2" 2 3 7 14
Over 2" - 6" 6 6 10 19
Over 6" - 12" 12 9 14 23
Over 12" - 18" 18 13 18 27
Over 18" 32 17 23 32
The second MTM-2 category, Put, was constructed similarly to Get. Put is
derived fron the MTM-l motions, Move and Position. Three cases apply to Put:
(1) A - no correcting action (continuous movement), (2) B - single correcting
action, and (3) C - all other motions. Weighted averages were built up from
Move and Position and were applied to the three categories. The same five
distance ranges used for Get were selected for Put. The results are shown in
Table 10.0 below.
Tkble 10.0: III1I-2 Values of Put
RANGE 00DE GA GB GC
Up to 2" 2 3 10 21
Over 2" - 6" 6 6 15 26
Over 6" - 12" 12 11 19 30
Over 12" - 18" 18 15 24 36
Over 18" 32 20 30 41
Get and Put each also have a weight factor. For Get, the value is 1 TMU per 2
pounds; for Put, the value is 1 TMU per 10 pounds.
The values for the seven remaining MTM-2 categories were much simpler to
derive. For Apply Pressure, there are two values in MTM-l: (1) 10.6 and (2)
16.2. Using the observed frequency values of 43% and 57%, respectively, the
weighted average is 13.79 TMU in the MIM-2 table. Regrasp has a single value
in MTM-l, 5.6 TMU, rounded to 6 TMU in the MrM-2 table. For Eye Motion, the
-242-
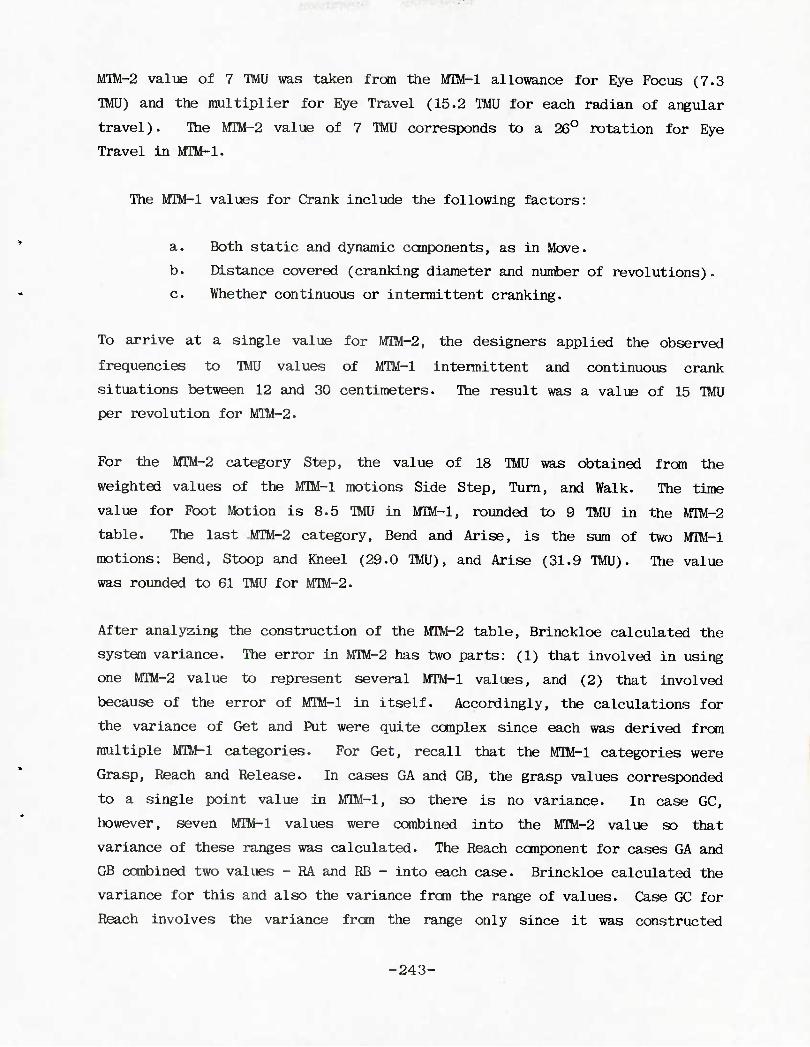
MTM-2 value of 7 TMU was taken from the MTM-l allowance for Eye Focus (7.3
TMU) and the multiplier for Eye Travel (15.2 TMU for each radian of angular
travel). Ihe MrM-2 value of 7 TMU corresponds to a 26° rotation for Eye
Travel in MTM-l.
The MTM-l values for Crank include the following factors:
a. Both static and dynamic components, as in Move.
b. Distance covered (cranking diameter and number of revolutions).
c. Whether continuous or intermittent cranking.
To arrive at a single value for MTM-2, the designers applied the observed
frequencies to TMU values of MTM-l intermittent and continuous crank
situations between 12 and 30 centimeters. The result was a value of 15 TMU
per revolution for MTM-2.
For the MTM-2 category Step, the value of 18 TMU was obtained from the
weighted values of the MTM-l motions Side Step, Turn, and Walk. The time
value for Foot Motion is 8.5 TMU in MTM-l, rounded to 9 TMU in the MTM-2
table. The last MTM-2 category. Bend and Arise, is the sum of two MTM-l
motions: Bend, Stoop and Kneel (29.0 TMU), and Arise (31.9 TMU). The value
was rounded to 61 TMU for MTM-2.
After analyzing the construction of the MTM-2 table, Brinckloe calculated the
system variance. The error in MTM-2 has two parts: (1) that involved in using
one MTM-2 value to represent several MTM-l values, and (2) that involved
because of the error of MTM-l in itself. Accordingly, the calculations for
the variance of Get and Put were quite complex since each was derived from
multiple MTM-l categories. For Get, recall that the MTI^l categories were
Grasp, Reach and Release. In cases GA and GB, the grasp values corresponded
to a single point value in MTM-l, so there is no variance. In case GC,
tiowever, seven MM-l values were combined into the MTM-2 value so that
variance of these ranges was calculated. The Reach conponent for cases GA and
GB combined two values - RA and RB - into each case. Brinckloe calculated the
variance for this and also the variance from the range of values. Case GC for
Reach involves the variance from the range only since it was constructed
-243-
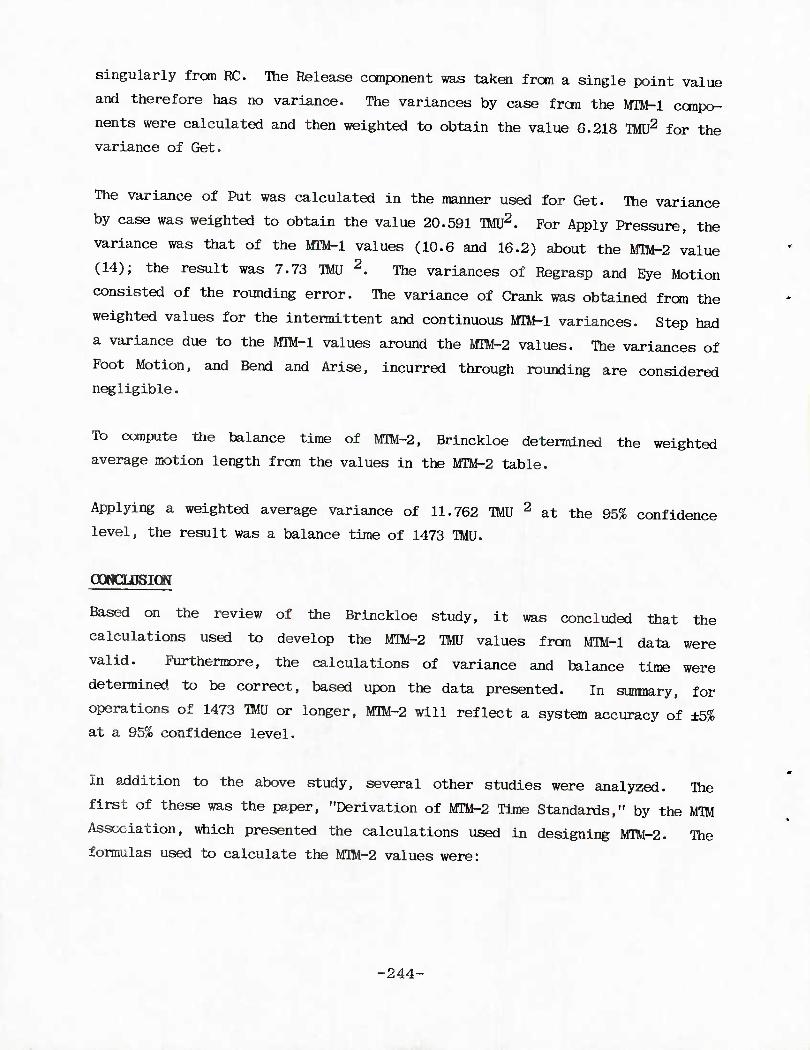
singularly from RC. The Release component was taken from a single point value
and therefore has no variance. The variances by case from the MTM-1 ccrapo-
nents were calculated and then weighted to obtain the value 6.218 TMJ2 for the
variance of Get.
The variance of Put was calculated in the manner used for Get. The variance
by case was weighted to obtain the value 20.591 TMU2. For Apply Pressure, the
variance was that of the AfTM-l values (10.6 and 16.2) about the M1M-2 value
(14); the result was 7.73 TMJ 2. The variances of Regrasp and Eye Motion
consisted of the rounding error. The variance of Crank was obtained from the
weighted values for the intermittent and continuous im-l variances. Step had
a variance due to the MJM-l values around the MrM-2 values. The variances of
Foot Motion, and Bend and Arise, incurred through rounding are considered
negligible.
To compute the balance time of MTM-2, Brinckloe determined the weighted
average motion length from the values in the MTM-2 table.
Applying a weighted average variance of 11.762 TMU 2 at the 95% confidence
level, the result was a balance time of 1473 TMU.
OOWCLDSION
Based on the review of the Brinckloe study, it was concluded that the
calculations used to develop the MTM-2 TMU values from MIM-1 data were
valid. Furthermore, the calculations of variance and balance time were
determined to be correct, based upon the data presented. In sunmary, for
operations of 1473 TMJ or longer, MTM-2 will reflect a system accuracy of ±5%
at a 95% confidence level.
In addition to the above study, several other studies were analyzed. Ihe
first of these was the paper, "Derivation of lflM-2 Time Standards," by the MTM
Association, which presented the calculations used in designing MrM-2. The
formulas used to calculate the MIII-2 values were:
-244-
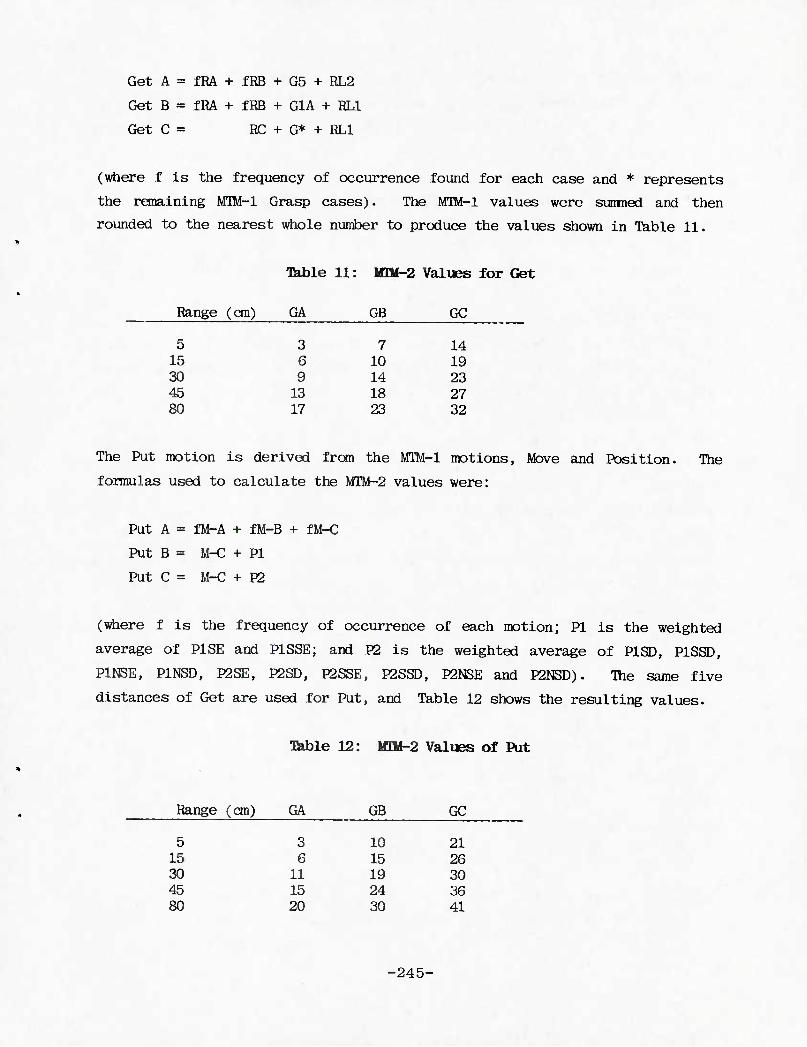
Get A = fRA + fRB + G5 + RL2
Get B = fRA + fRB + G1A + RL1
Get C = RC + G* + RL1
(where f is the frequency of occurrence found for each case and ♦ represents
the remaining MTM-1 Grasp cases). The MTM-l values were sunmed and then
rounded to the nearest whole number to produce the values shown in Table 11.
Table 11: lflM-2 Values for Ge
Range (cm) GA GB GC
5 3 7 14 15 6 10 19 30 9 14 23 45 13 18 27 80 17 23 32
The Put motion is derived from the MTM-1 motions, Move and Position. The
formulas used to calculate the MTM-2 values were:
Put A = fM-A + fM-B + fM-C
Put B = M-C + PI
Put C = M-C + P2
(where f is the frequency of occurrence of each motion; PI is the weighted
average of PISE and P1SSE; and P2 is the weighted average of P1SD, P1SSD,
P1NSE, P1NSD, P2SE, P2SD, P2SSE, P2SSD, P2NSE and P2NSD). The same five
distances of Get are used for Put, and Table 12 shows the resulting values.
Tkble 12: lflM-2 Values of Put
Range (cm) GA GB GC
5 3 10 21 15 6 15 26 30 11 19 30 45 15 24 36 80 20 30 41
-245-
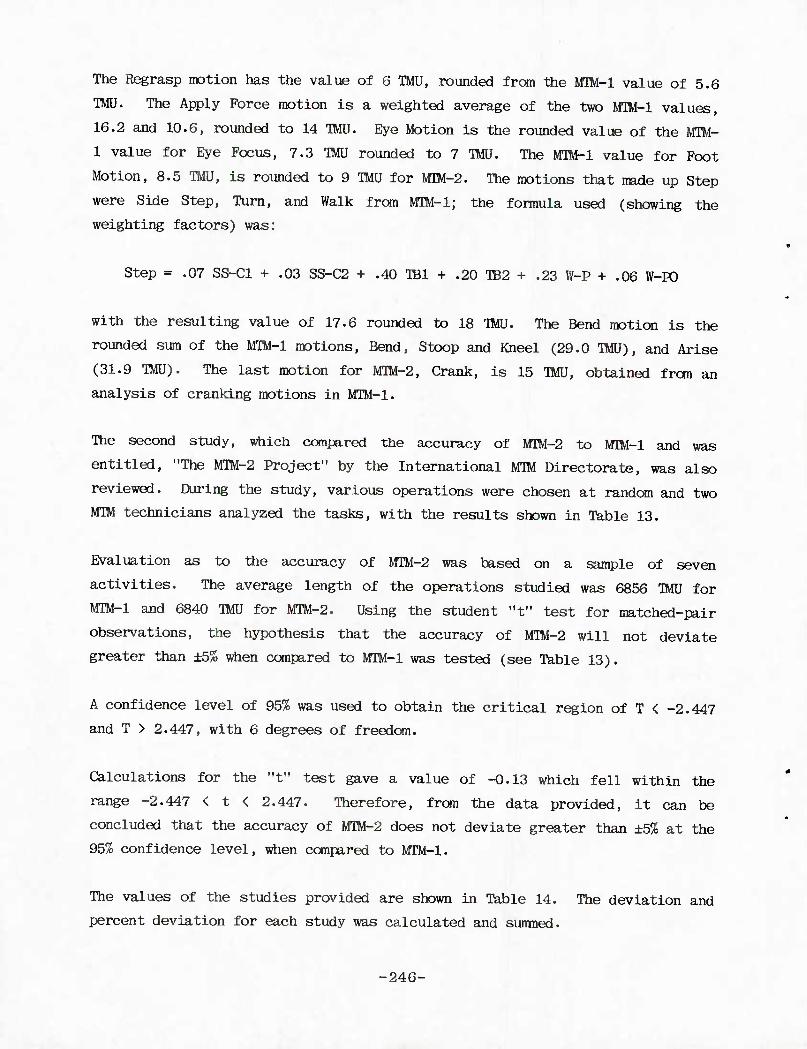
The Regrasp motion has the value of 6 TMU, rounded from the MIM-l value of 5.6
IMJ. The Apply Force motion is a weighted average of the two MTM-l values,
16.2 and 10.6, rounded to 14 TMU. Eye Motion is the rounded value of the MTM-
1 value for Eye Focus, 7.3 TMU rounded to 7 IMU. The MTM-l value for Foot
Motion, 8.5 TMU, is rounded to 9 TMU for MrM-2. The motions that nade up Step
were Side Step, Turn, and Walk from MTM-l; the formula used (showing the
weighting factors) was:
Step = .07 SS-C1 + .03 SS-C2 + .40 TB1 + .20 TB2 + .23 W-P + .06 W-FO
with the resulting value of 17.6 rounded to 18 TMU. The Bend motion is the
rounded sum of the MIM-l motions. Bend, Stoop and Kneel (29.0 TMU), and Arise
(31.9 IMU). The last motion for MTM-2, Crank, is 15 TMU, obtained fron an
analysis of cranking motions in MTM-l.
The second study, which compared the accuracy of MTM-2 to MM-l and was
entitled, "The MTM-2 Project" by the International MTM Directorate, was also
reviewed. During the study, various operations were chosen at randan and two
MTM technicians analyzed the tasks, with the results shown in Table 13.
Evaluation as to the accuracy of MTM-2 was based on a sample of seven
activities. The average length of the operations studied was 6856 TMU for
MTM-l and 6840 TMU for MTM-2. Using the student "t" test for matched-pair
observations, the hypothesis that the accuracy of MTM-2 will not deviate
greater than ±5% when compared to MTM-l was tested (see Table 13).
A confidence level of 95% was used to obtain the critical region of T < -2.447
and T > 2.447, with 6 degrees of freedom.
Calculations for the "t" test gave a value of -0.13 which fell within the
range -2.447 < t < 2.447. Therefore, from the data provided, it can be
concluded that the accuracy of MIM-2 does not deviate greater than ±5% at the
95% confidence level, when conpared to MTM-l.
The values of the studies provided are shown in Table 14. The deviation and
percent deviation for each study was calculated and surnned.
-240-
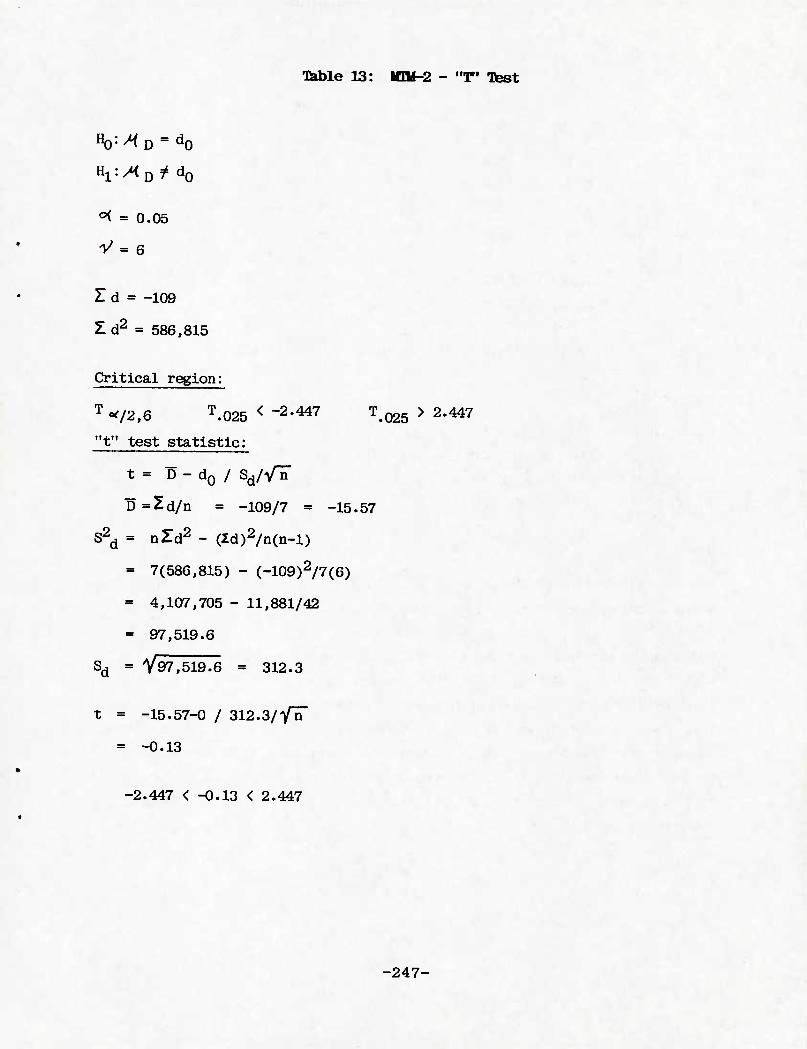
"toble 13: llIlft-2 - "T" Test
Ho:XD = dO
Hi^D^dQ
^ = 0.05
V = 6
I d = -109
I d2 = 586,815
Critical region:
T ^/2,6 T.025
"t" test statistic:
< -2.447 T>025 > 2.447
t = D - d0 / sd/V15"
D=Zd/n = -109/7 - -15.57
S2d = nZd2 - (Id)2/n(n-l)
= 7(586,815) - (-109)2/7(6)
- 4,107,705 - 11,881/42
= 97,519.6
Sd = V97,519.6 = 312.3
t = -15.57-0 / 312.3/Vn"
= -0.13
-2.447 < -0.13 < 2.447
-247-
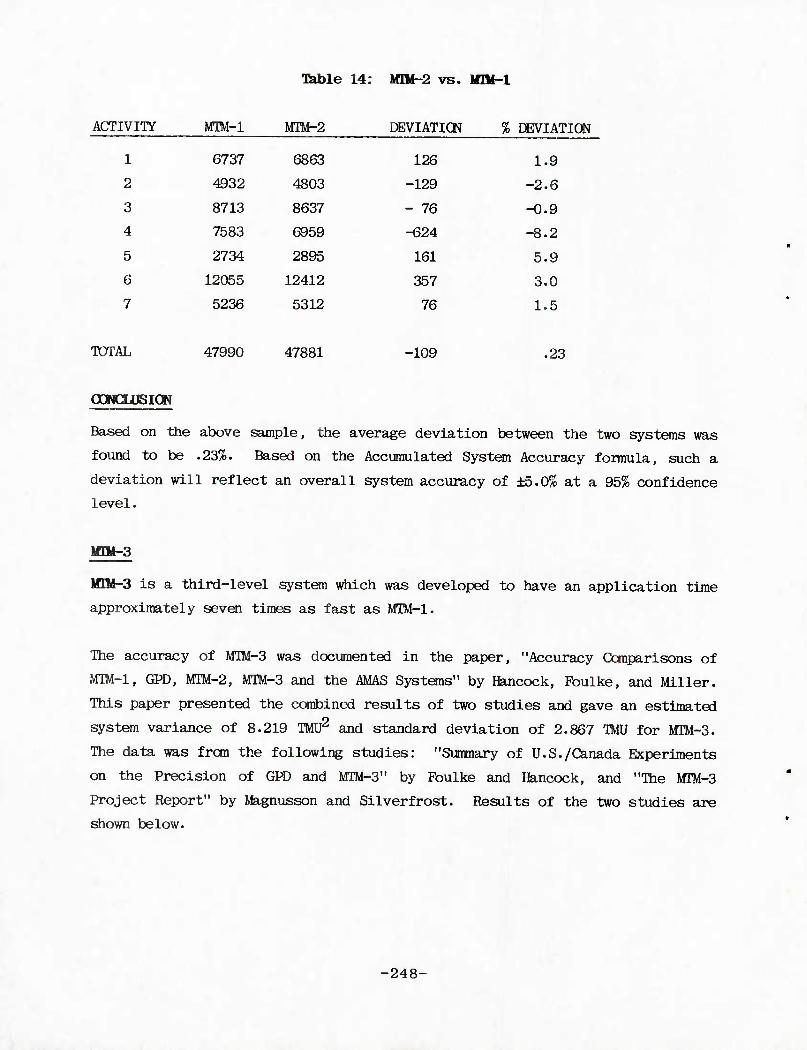
'Table 14: NfIM-2 vs. MTM-1
ACTIVITY MTM-1 MTM-2 DEVIATICN % DEVIATION
1 6737 6863 126 1.9
2 4932 4803 -129 -2.6
3 8713 8637 - 76 -0.9
4 7583 6959 -624 -8.2
5 2734 2895 161 5.9
6 12055 12412 357 3.0
7 5236 5312 76 1.5
TOTAL 47990 47881 -109 .23
OCMmJSION
Based on the above sample, the average deviation between the two systems was
found to be .23%. Based on the Accumulated System Accuracy foimula, such a
deviation will reflect an overall system accuracy of ±5.0% at a 95% confidence
level.
Mm-3
MIM^3 is a third-level system which was developed to have an application time
approximately seven times as fast as MTM-1.
The accuracy of MTM-3 was documented in the paper, "Accuracy Ccraparisons of
MIM-l, GPD, 1011-2, MTM-3 and the AMAS Systems" by Hancock, Foulke, and Miller.
This paper presented the combined results of two studies and gave an estimated
system variance of 8.219 TMU2 and standard deviation of 2.867 TMU for MTM-3.
The data was from the following studies: "Suranary of U.S./Canada Experiments
on the Precision of GPD and MTM-3" by Foulke and Hancock, and "The MrM-3
Project Report" by Magnusson and Silverfrost. Results of the two studies are
shown below.
-248-
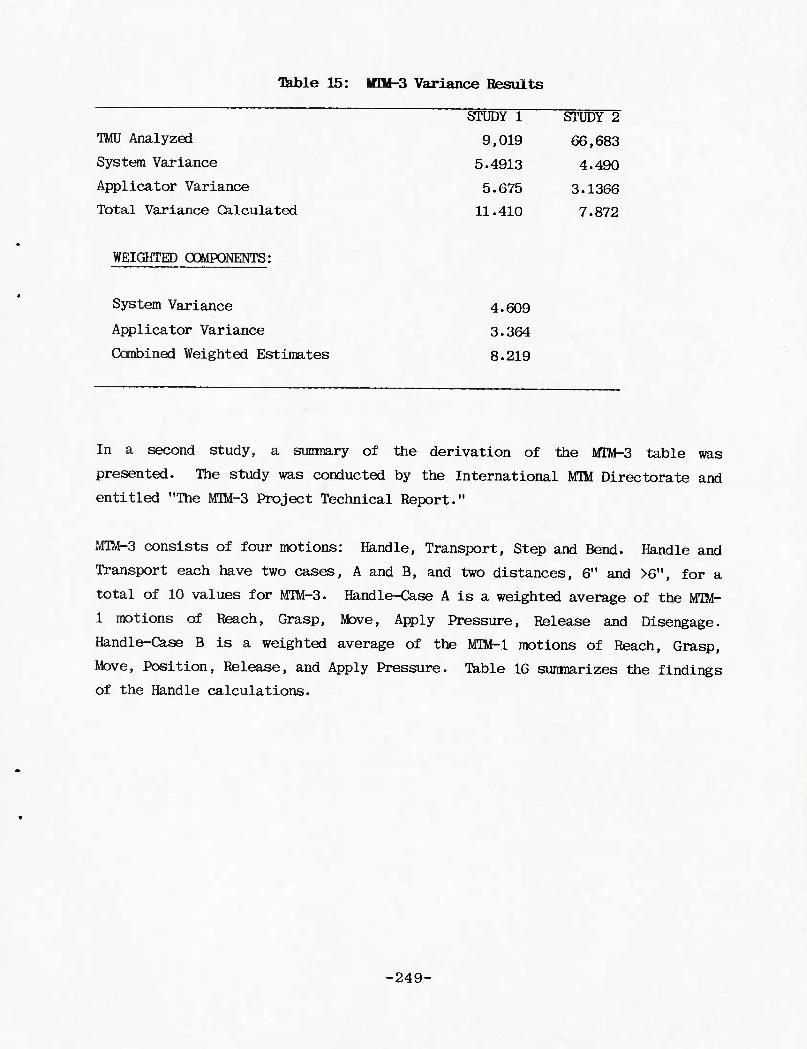
Table 15: 11114-3 Variance Results
TMU Analyzed
System Variance
Applicator Variance
Total Variance Calculated
WEIGHTED COMPONENTS:
System Variance 4.609
Applicator Variance 3.364
Ccrabined Weighted Estimates 8.219
STUDY 1 STUDY 2
9,019 66,683
5.4913 4.490
5.675 3.1366
11.410 7.872
In a second study, a sunmary of the derivation of the MrM-3 table was
presented. The study was conducted by the International MIM Directorate and
entitled "The MTlvHS Project Technical Report."
MTM-3 consists of four motions: Handle, Transport, Step and Bend. Handle and
Transport each have two cases, A and B, and two distances, 6" and >6", for a
total of 10 values for wm-3. Handle-Case A is a weighted average of the MTM-
1 motions of Reach, Grasp, Move, Apply Pressure, Release and Disengage.
Handle-Case B is a weighted average of the MTM-1 motions of Reach, Grasp,
Move, Position, Release, and Apply Pressure. Table 16 summrizes the findings
of the Handle calculations.
•249-
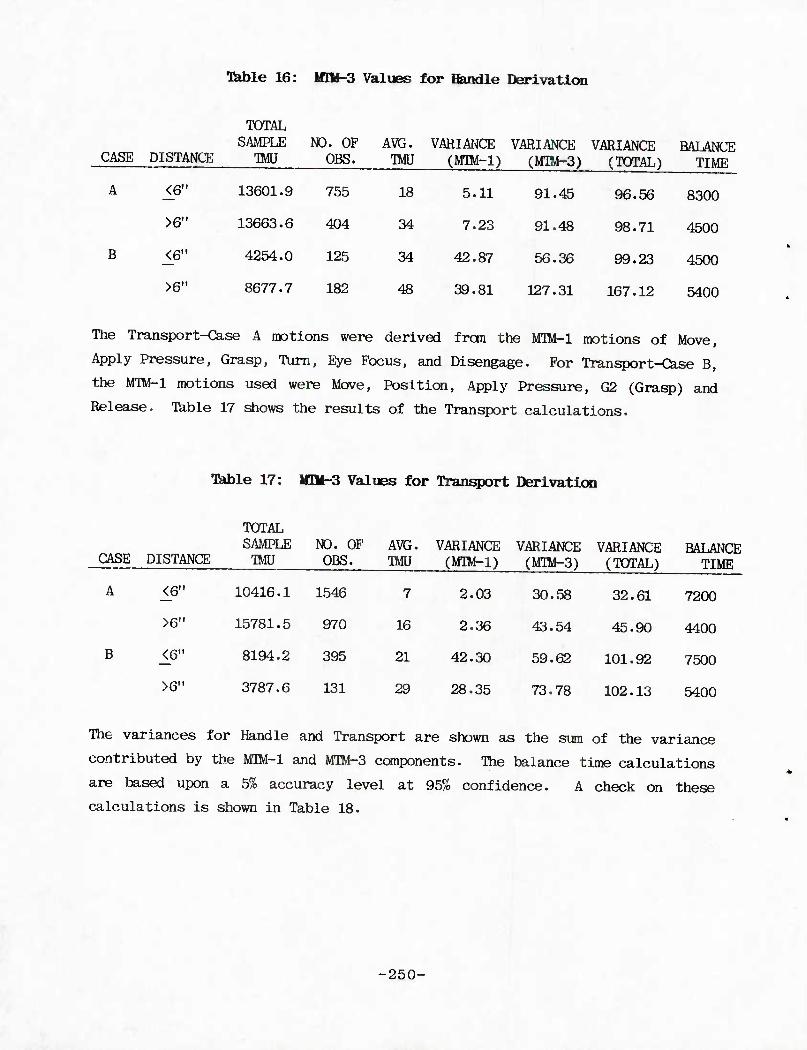
TSible 16: KQt-S Values for Handle Derivation
CASE DISTANCE
03"
TOTAL SAMPLE
TMU
13601.9
NO. OF OBS.
755
AVG. TMJ
VARIANCE (Mm-1)
VARIANCE VARIANCE (TOTAL)
BALANCE TIME
A 18 5.11 91.45 96.56 8300
>6,, 13663.6 404 34 7.23 91.48 98.71 4500
B <&' 4254.0 125 34 42.87 56.36 99.23 4500
>6" 8677.7 182 48 39.81 127.31 167.12 5400
The Transport-Case A motions were derived from the MTM-l motions of Move,
Apply Pressure, Grasp, Turn, Eye Focus, and Disengage. For Transport-Case B,
the MIM-1 motions used were Move, Position, Apply Pressure, G2 (Grasp) and
Release. Table 17 shows the results of the Transport calculations.
Table 17: ICOi-S Values for Transport Derivatioa
TOTAL
CASE DISTANCE
<6M
SAMPLE TMJ
10416.1
NO. OF OBS.
1546
AVG. IMU
VARIANCE (MTM-l)
VARIANCE (Mm-3)
VARIANCE (TOTAL)
BALANCE TIME
A 7 2.03 30.58 32.61 7200
>6" 15781.5 970 16 2.36 43.54 45.90 4400
B <6" 8194.2 395 21 42.30 59.62 101.92 7500
>6" 3787.6 131 29 28.35 73.78 102.13 5400
The variances for Handle and Transport are shown as the sum of the variance
contributed by the MTM-l and MTM-3 components. The balance time calculations
are based upon a 5% accuracy level at 95% confidence. A check on these
calculations is shown in Table 18.
-250-
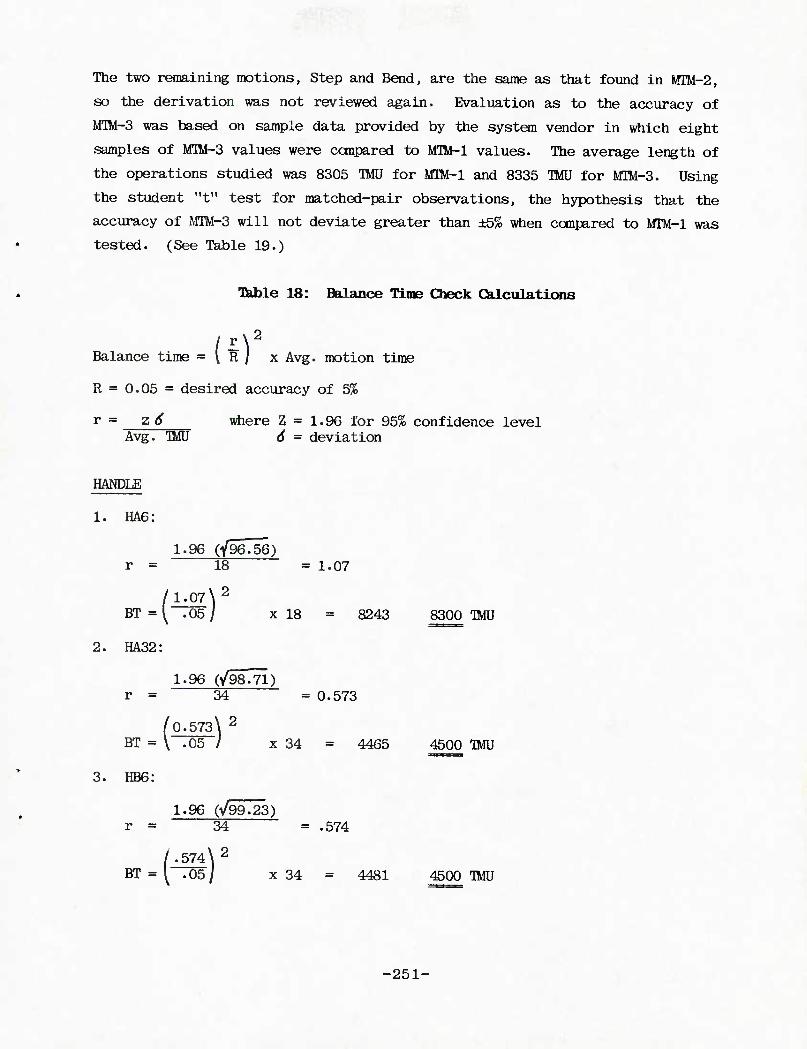
The two remaining motions, Step and Bend, are the same as that found in Mm-2,
so the derivation was not reviewed again. Evaluation as to the accuracy of
MIM-3 was based on sample data provided by the system vendor in which eight
samples of MTM-3 values were conpared to MTM-l values. The average length of
the operations studied was 8305 TMU for MTM-l and 8335 TMJ for MTM-3. Using
the student "t" test for matched-pair observations, the hypothesis that the
accuracy of MTM-3 will not deviate greater than ±5% when compared to MTM-l was
tested. (See Table 19.)
Table 18: Balance Tiine Check Calculations
-(1) 2
Balance time = \ R / x Avg. motion time
R = 0.05 = desired accuracy of 5%
r = z^ where Z - 1.9G for 95% confidence level Avg. TMJ d = deviation
HANDLE
1. HA6:
1.96 (f96.56) r = 18 = 1.07
/1.07\2
BT = ^ .05 / x 18 = 8243 8300 IMU
2. HA32:
1.96 (/98.71) r = 34 = 0.573
/0.573\ 2
BT = V .05 / x 34 - 4465 4500 IMU
3. HB6:
1.96 C/99.23) r = 34 = .574
/.574\2
BT = l .05/ x 34 = 4481 4500 IMU
-251-
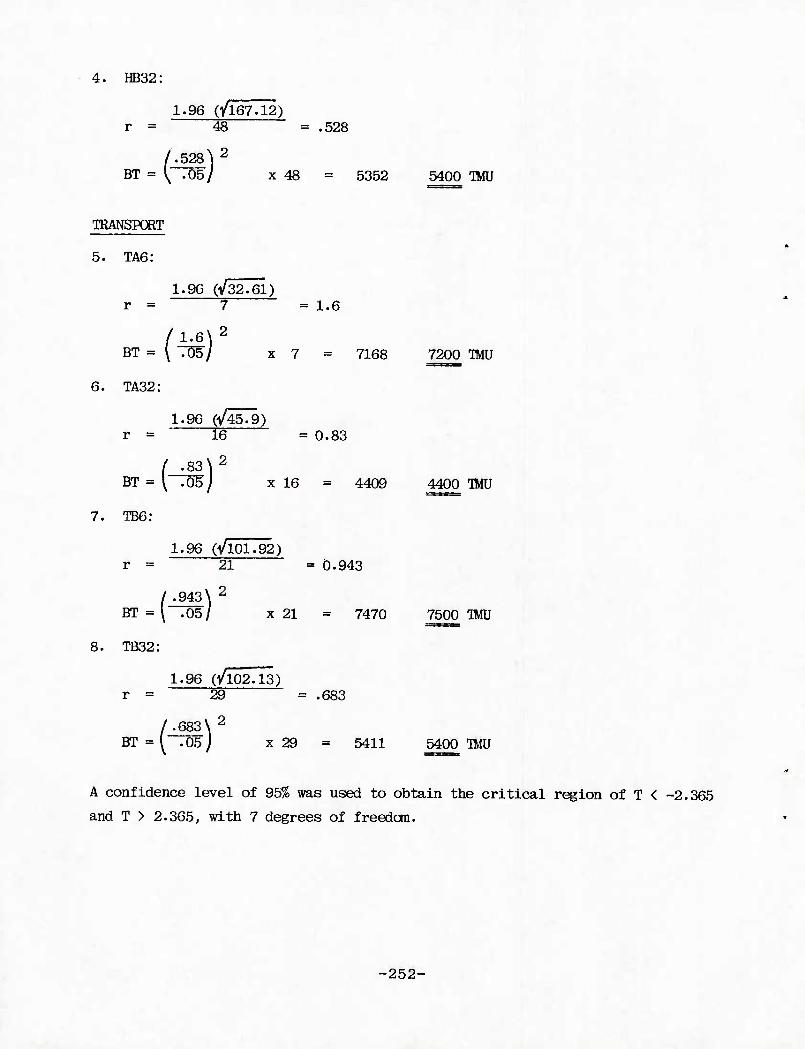
4. HB32:
1.96 C/167.12) r = 48 = .528
BT / .528] \ -05/ x 48 = 5352 5400 IMU
TRANSPOIT
5. TA6:
1.96 (V32.61) r ■ 7 =1.6
BT
6. TA32:
" (^1) x 7 = 7168 7200 IMU
1.96 (V45.9) r = 16 = 0.83
BT
7. TB6
-(-^) x 16 = 4409 4400 TMU
r = 1.96 (VlOl.92)
21 = 0.943
BT
8. TB32:
/ .943\ -\ -05/ x 21 = 7470 7500 IMU
1.96 (/102.13) r = 29 - .683
/.683\ 2
BT = ^ .05j x 29 = 5411 5400 TMU
A confidence level of 95% was used to obtain the critical region of T < -2.365
and T > 2.365, with 7 degrees of freedom.
-252-
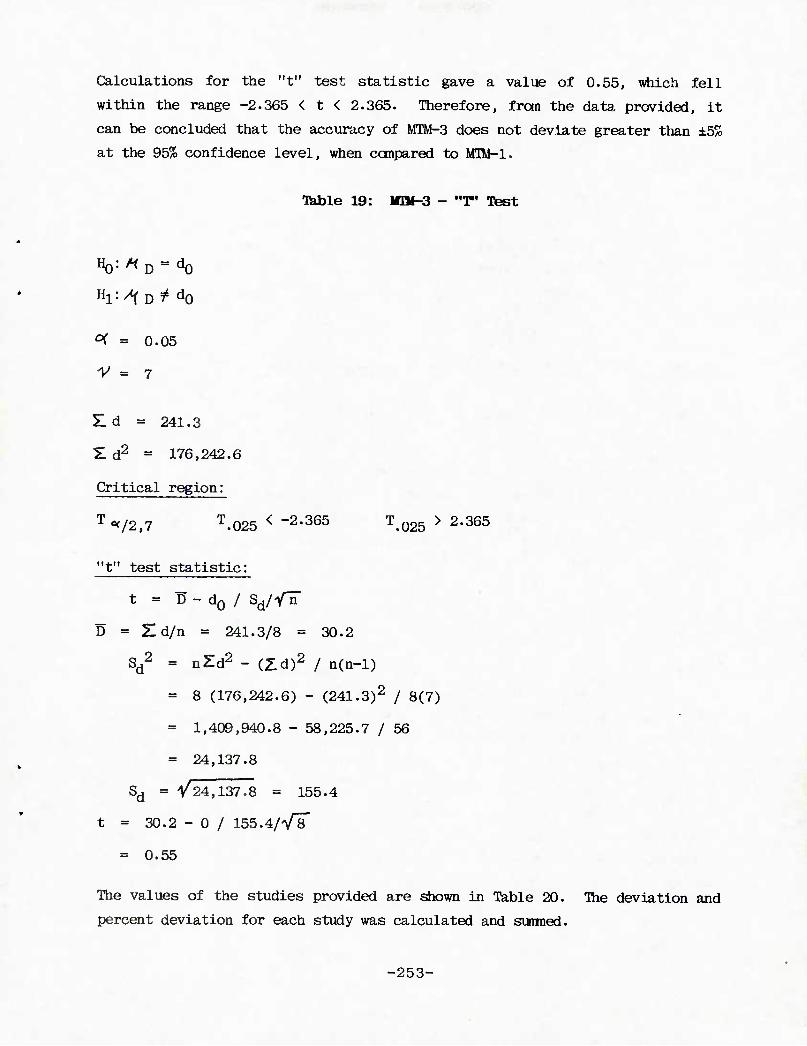
Calculations for the "t" test statistic gave a value of 0.55, which fell
within the range -2.365 < t < 2.365. Therefore, from the data provided, it
can be concluded that the accuracy of MTM-3 does not deviate greater than ±5%
at the 95% confidence level, when conpared to MTM-l.
Tkble 19: HItf-3 - "T" Ttest
EQ: M D = d0
^ - 0.05
V = 7
51 d = 241.3
Z d2 = 176,242.6
Critical region:
T ^/2,7 T.025 < -2'365 T.025 > 2'365
"t" test statistic:
t = D - d0 / sd//F
D = Zd/n = 241.3/8 = 30.2
Sd2 = nZd2 - (Zd)2 / n(n-l)
- 8 (176,242.6) - (241.3)2 / 8(7)
= 1,409,940.8 - 58,225.7 / 56
= 24,137.8
Sd = V24,137.8 = 155.4
t = 30.2 - 0 / 155.4/Vir
= 0.55
The values of the studies provided are shown in Table 20. The deviation and
percent deviation for each study was calculated and sunroed.
-253-
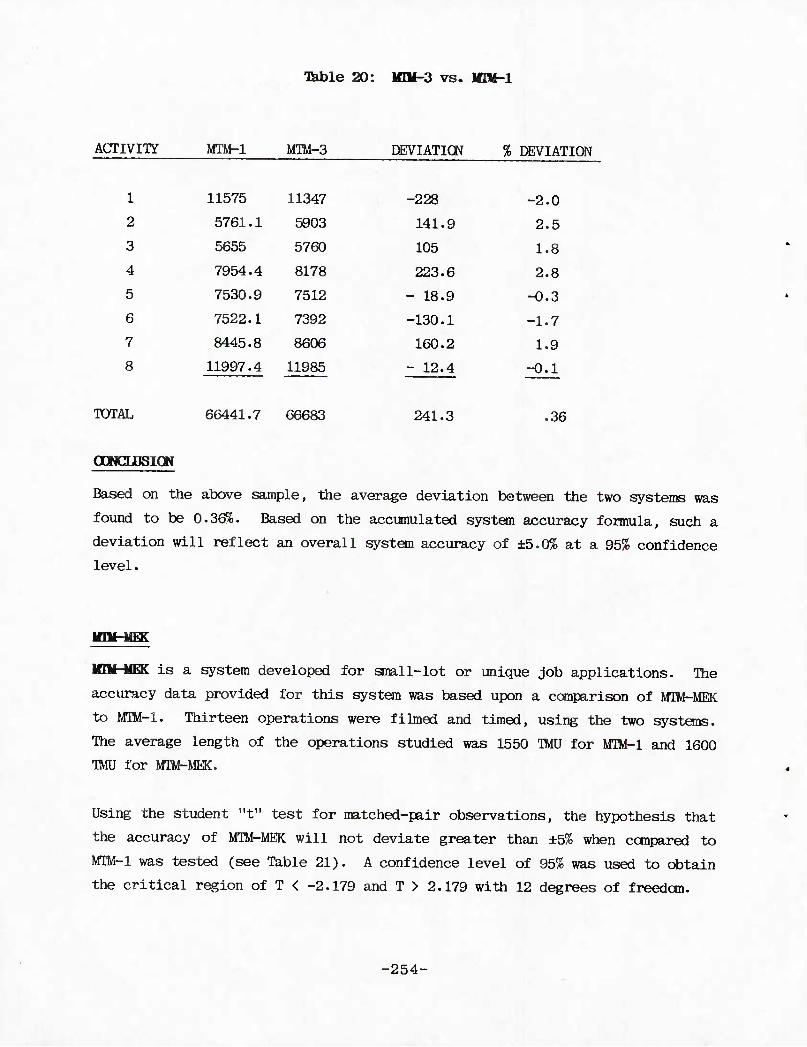
Table 20: lfDf-3 vs. IfDf-l
ACTIVITY MTM-1 MTM-3 DEVIATICN % DEVIATION
1 11575 11347 -228 -2.0
2 5761.1 5903 141.9 2.5
3 5655 5760 105 1.8 4 7954.4 8178 223.6 2.8
5 7530.9 7512 - 18.9 -0.3
6 7522.1 7392 -130.1 -1.7
7 8445.8 8606 160.2 1.9
8 11997.4 11985 - 12.4 -0.1
TOTAL 66441.7 G6683 241.3 .36
ODNCUDSION
Based on the above sample, the average deviation between the two systems was
found to be 0.36%. Based on the accumulated system accuracy formula, such a
deviation will reflect an overall system accuracy of ±5.0% at a 95% confidence
level.
Mnma:
Mni~MEK is a system developed for small-lot or unique job applications. The
accuracy data provided for this system was based upon a comparison of MTM-MEK
to MTM-l. Thirteen operations were filmed and timed, using the two systems.
The average length of the operations studied was 1550 TMU for MTM-1 and 1600
TMJ for MTM-MEK.
Using the student "t" test for matched-pair observations, the hypothesis that
the accuracy of MTM-MEK will not deviate greater than ±5% when canpared to
MTM-l was tested (see Table 21). A confidence level of 95% was used to obtain
the critical region of T < -2.179 and T > 2.179 with 12 degrees of freedom.
-254-
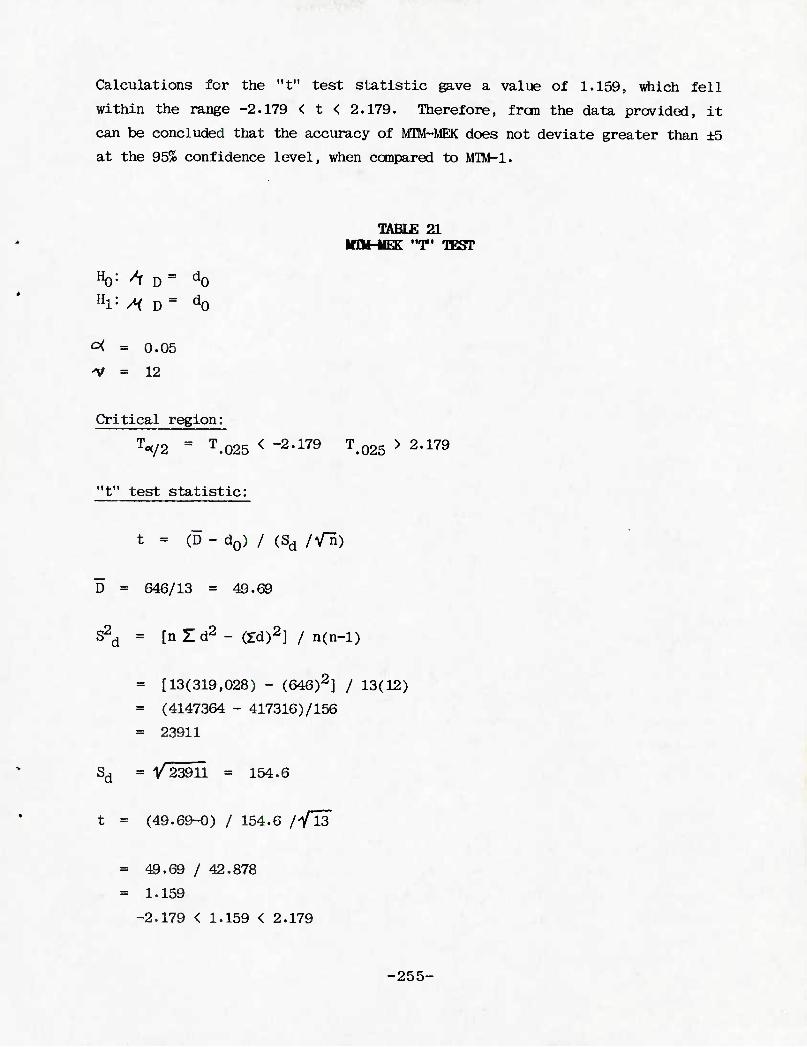
Calculations for the "t" test statistic gave a value of 1.159, which fell
within the range -2.179 < t < 2.179. Therefore, fran the data provided, it
can be concluded that the accuracy of MTM-MEK does not deviate greater than ±5
at the 95% confidence level, when compared to MTM-l.
TABLE 21 IfTM-MEK "T' TEST
%: ^ D = d0 Hl: /H D= d0
0< - 0.05
^ = 12
Critical region:
T*/2 ~ T.025 < -2-179 T.025 > 2-179
"t" test statistic:
t = (D - d0) / (Sd /Vn)
D = 646/13 = 49.69
&. = [n Z d2 - (Xd)2] I n(n-l)
= [13(319,028) - (646)2] / 13(12)
= (4147364 - 417316)/156
= 23911
Sd = V 23911 = 154.6
t = (49.69-0) / 154.6 /Vl3
= 49.69 / 42.878
= 1.159
-2.179 < 1.159 < 2.179
■255-
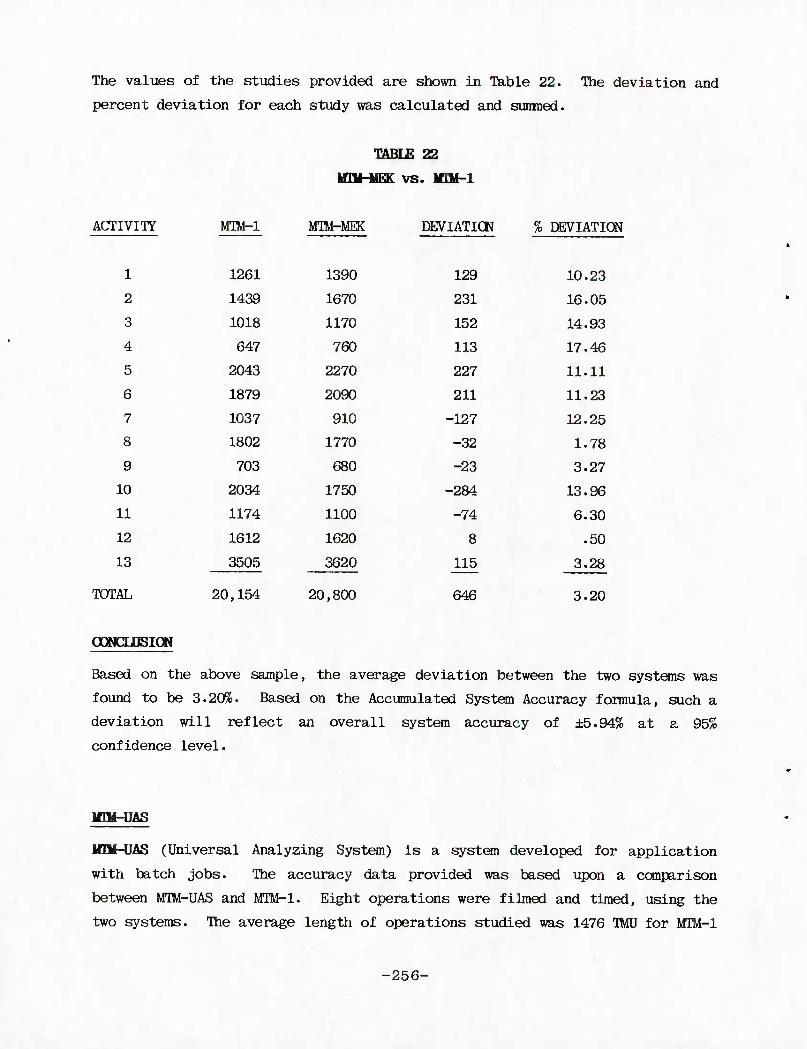
The values of the studies provided are shown in Table 22. The deviation and
percent deviation for each study was calculated and surnned.
TARTK 22
mM-HEK vs. lOM-l
ACTIVIIY M-m-i MTM-MHC DEVIATION % DEVIATION
1 1261 1390 129 10.23
2 1439 1670 231 16.05
3 1018 1170 152 14.93
4 647 760 113 17.46
5 2043 2270 227 11.11
6 1879 2090 211 11.23
7 1037 910 -127 12.25
8 1802 1770 -32 1.78
9 703 680 -23 3.27
10 2034 1750 -284 13.96
11 1174 1100 -74 6.30
12 1612 1620 8 .50
13 3505 3620 115 3.28
TOTAL 20,154 20,800 646 3.20
oowcmsicw
Based on the above sample, the average deviation between the two systems was
found to be 3.20%. Based on the Accumulated System Accuracy formula, such a
deviation will reflect an overall system accuracy of ±5.94% at a 95%
confidence level.
tfTK-OAS (Universal Analyzing System) is a system developed for application
with batch jobs. The accuracy data provided was based upon a conparison
between MTM-UAS and MTM-1. Eight operations were filmed and timed, using the
two systems. The average length of operations studied was 1476 TMU for MTM-l
-256-
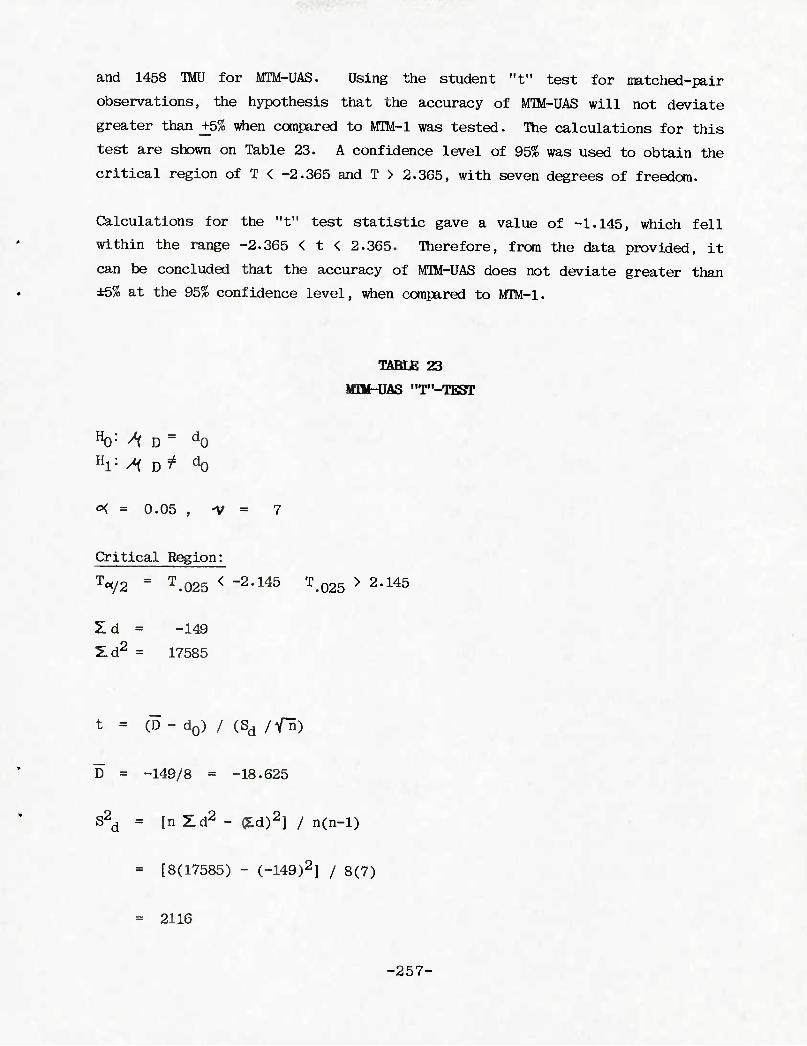
and 1458 TMU for MTM-UAS. Using the student "t" test for matched-pair
observations, the hypothesis that the accuracy of MTM-UAS will not deviate
greater than +5% when compared to MTM-1 was tested. The calculations for this
test are shown on Table 23. A confidence level of 95% was used to obtain the
critical region of T < -2.365 and T > 2.365, with seven degrees of freedom.
Calculations for the "t" test statistic gave a value of -1.145, which fell
within the range -2.365 < t < 2.365. Therefore, from the data provided, it
can be concluded that the accuracy of MTM-UAS does not deviate greater than
±5% at the 95% confidence level, when conpared to MTM-1.
TABUS 23
IHII-UAS "T'-TEST
Ho1 ^ D = d0 Hl: ^ D?4 ^
o< = 0.05 , 'V = 7
Critical Region:
T«/2 = T.025 < -2-145 T.025 > 2-145
1 d = -149
51 d2 = 17585
t = (D- d0) / (Sd /V5)
D = -149/8 = -18.625
S2d = [n Zd2 - Otld)2] / n(n-l)
= [8(17585) - (-149)2] / 8(7)
= 2116
-257-
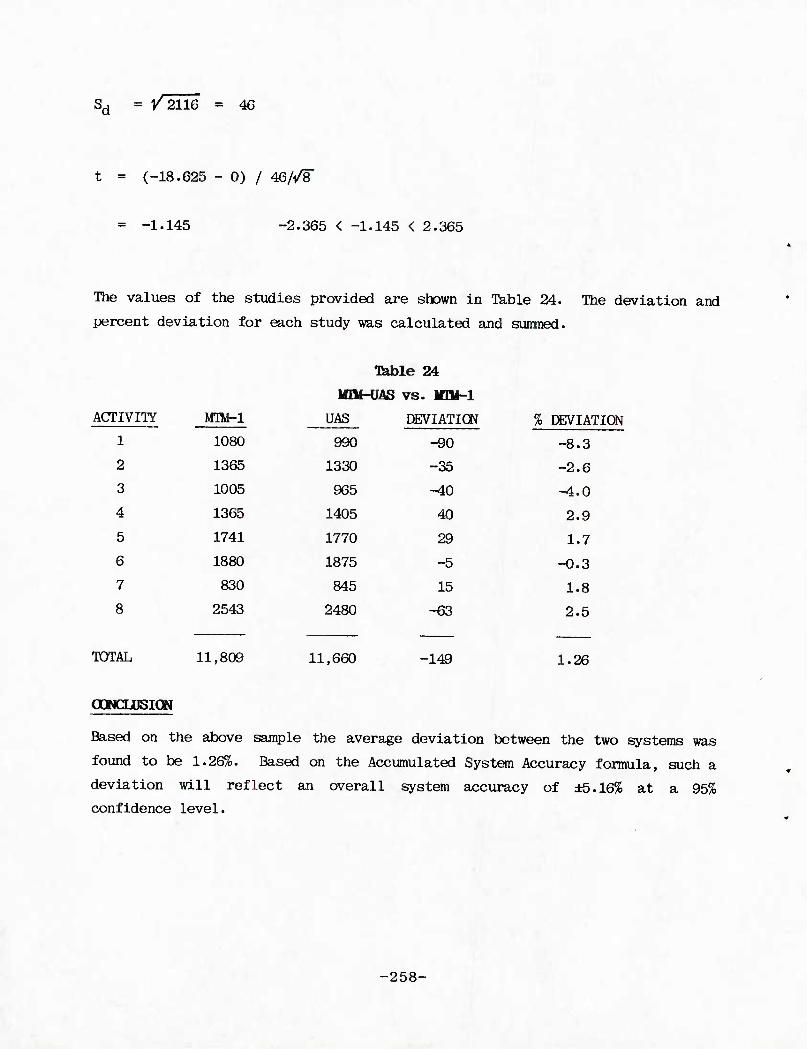
Sd - V2116 - 46
t - (-18.G25 - 0) / 46/1/8"
-1.145 -2.365 < -1.145 < 2.365
The values of the studies provided are shown in Table 24. The deviation and
percent deviation for each study was calculated and sunmed.
ACTIVITY MTM-l
1 1080
2 1365
3 1005
4 1365
5 1741
6 1880
7 830
8 2543
Tab le 24
MM-D4S vs. imi-i UAS DEVIATION % DEVIATION
990 -90 -8.3
1330 -35 -2.6
965 -10 -4.0
1405 40 2.9
1770 29 1.7
1875 -5 -0.3
845 15 1.8
2480 -63 2.5
TOTAL 11,809 11,660 -149 1.26
OGNCLDSION
Based on the above sample the average deviation between the two systems was
found to be 1.26%. Based on the Accumulated System Accuracy formula, such a
deviation will reflect an overall system accuracy of ±5.16% at a 95%
confidence level.
-258-
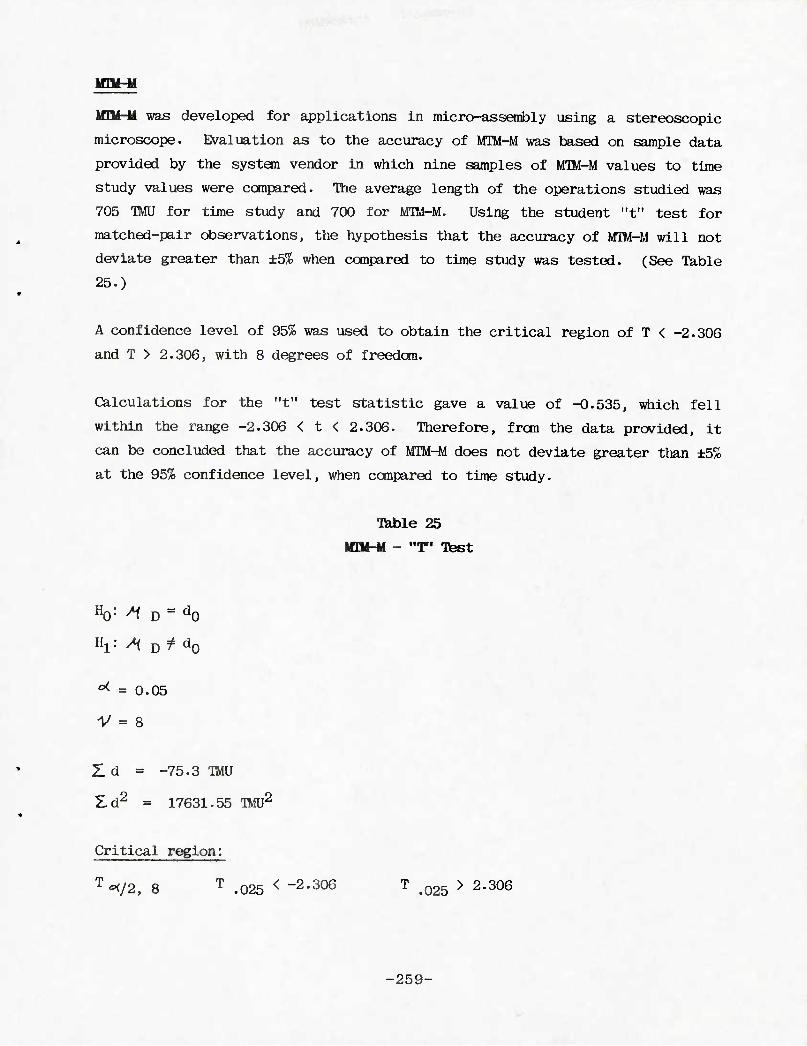
imt-M
ItOi-U was developed for applications in micro-assembly using a stereoscopic
microscope. Evaluation as to the accuracy of MTM-M was based on sample data
provided by the system vendor in which nine samples of MTM-M values to time
study values were compared. The average length of the operations studied was
705 TMU for time study and 700 for MTM-M. Using the student "t" test for
matched-pair observations, the hypothesis that the accuracy of MTM-M will not
deviate greater than ±5% when compared to time study was tested. (See Table
25.)
A confidence level of 95% was used to obtain the critical region of T < -2.306
and T > 2.306, with 8 degrees of freedom.
Calculations for the "t" test statistic gave a value of -0.535, which fell
within the range -2.306 < t < 2.306. Therefore, from the data provided, it
can be concluded that the accuracy of MTM-M does not deviate greater than ±5%
at the 95% confidence level, when compared to time study.
Table 25
ICDUhH - "T" Test
%: ^ D = d0
Hl: ^ D^d0
"< = 0.05
V = 8
21 d = -75.3 TMU
Ed2 = 17631.55 TMJ2
Critical region:
T^/2. 8 T .025 < -2-306 T .025 > 2-306
-259-
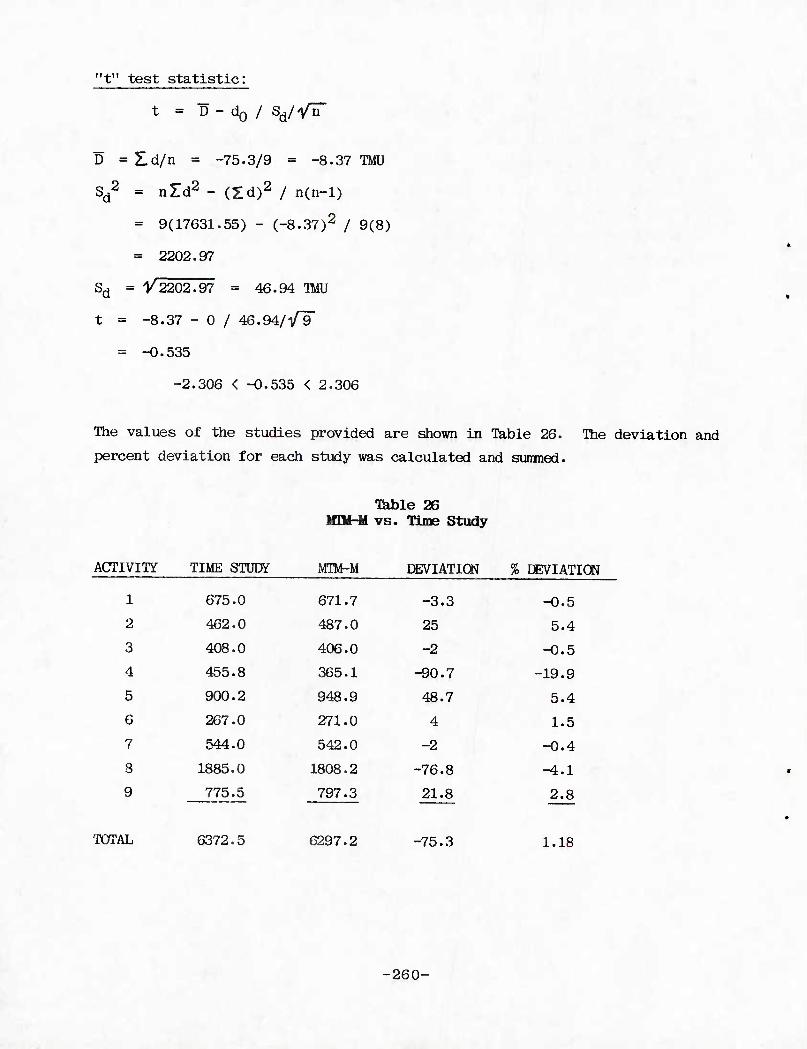
"t" test statistic:
t = D - d0 / sd/^T
D = Z.d/n - -75.3/9 = -8.37 TMU
Sd2 = nld2 - (Zd)2 / n(n-l)
= 9(17631.55) - (-8.37)2 / 9(8)
» 2202.97
Sd = V2202.97 = 46.94 TMU
t = -8.37 - 0 / 46.94/Vir
= -0.535
-2.306 < -0.535 < 2.306
*
The values of the studies provided are shown in Table 26. The deviation and
percent deviation for each study was calculated and sunmed.
TVihle 26 MTO-M vs. Time Study
ACTIVITY TIME STUDY MTM-M DEVIATION % DEVIATION
1 675.0 671.7 -3.3 -0.5
2 462.0 487.0 25 5.4
3 408.0 406.0 -2 -0.5
4 455.8 365.1 -90.7 -19.9
5 900.2 948.9 48.7 5.4
6 267.0 271.0 4 1.5
7 544.0 542.0 -2 -0.4
8 1885.0 1808.2 -76.8 ^.1
9 775.5 797.3 21.8 2.8
TOTAL 0372.5 6297.2 -75.3 1.18
-260-
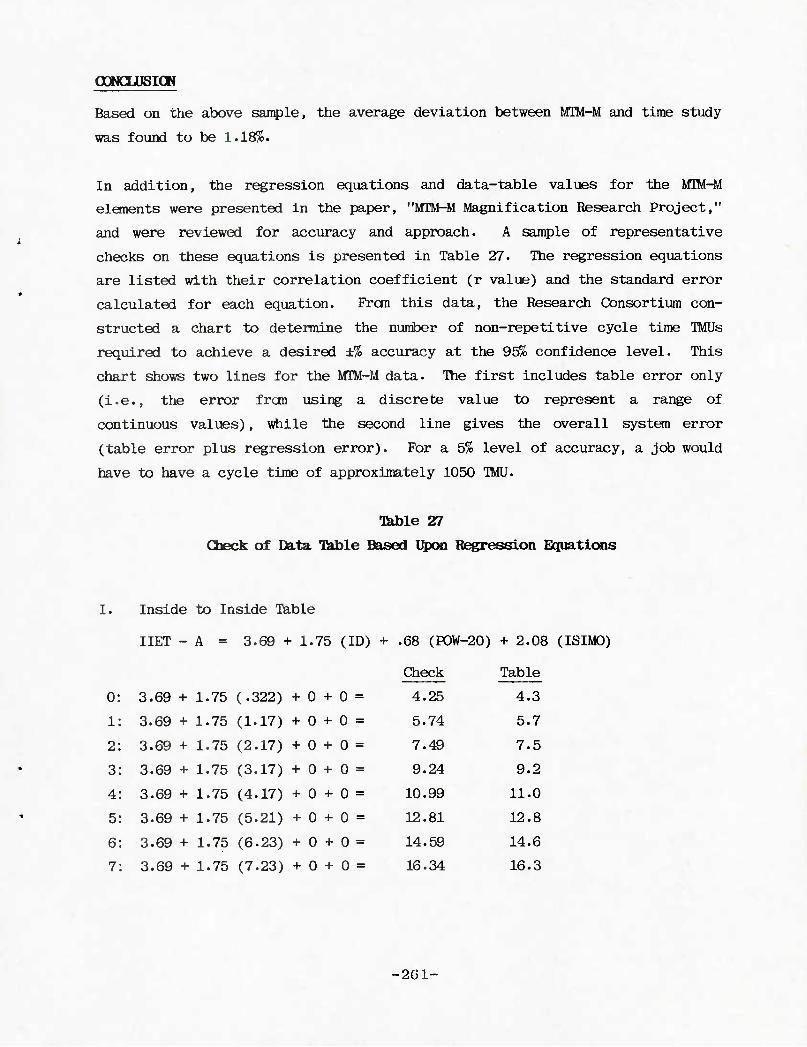
OOKUJSICM
Based on the above sample, the average deviation between MTM-M and time study
was found to be 1.18%.
In addition, the regression equations and data-table values for the MTM-M
elements were presented in the paper, "MTM-M Magnification Research Project,"
and were reviewed for accuracy and approach. A sample of representative
checks on these equations is presented in Table 27. The regression equations
are listed with their correlation coefficient (r value) and the standard error
calculated for each equation. Fran this data, the Research Consortium con-
structed a chart to determine the number of non-repetitive cycle time TMUs
required to achieve a desired ±% accuracy at the 95% confidence level. This
chart shows two lines for the MTM-M data. The first includes table error only
(i.e., the error from using a discrete value to represent a range of
continuous values), while the second line gives the overall system error
(table error plus regression error). For a 5% level of accuracy, a job would
have to have a cycle time of approximately 1050 IMU.
■Bible 27
Check of Data Table Based Upon Regression Equations
I. Inside to Inside Table
IIET - A = 3.69 + 1.75 (ID) + .68 (P0W-20) + 2.08 (ISIMO)
Check Table
0: 3.69 + 1.75 (.322) + 0 + 0 =
1: 3.69 + 1.75 (1.17) + 0 + 0 =
2: 3.69 + 1.75 (2.17) + 0 + 0 =
3: 3.69 + 1.75 (3.17) + 0 + 0 =
4: 3.69 + 1.75 (4.17) + 0 + 0 =
5: 3.69 + 1.75 (5.21) + 0 + 0 =
6: 3.69 + 1.75 (6.23) + 0 + 0 =
7: 3.69 + 1.75 (7.23) + 0 + 0 =
4.25 4.3
5.74 5.7
7.49 7.5
9.24 9.2
10.99 11.0
12.81 12.8
14.59 14.6
16.34 16.3
-201-
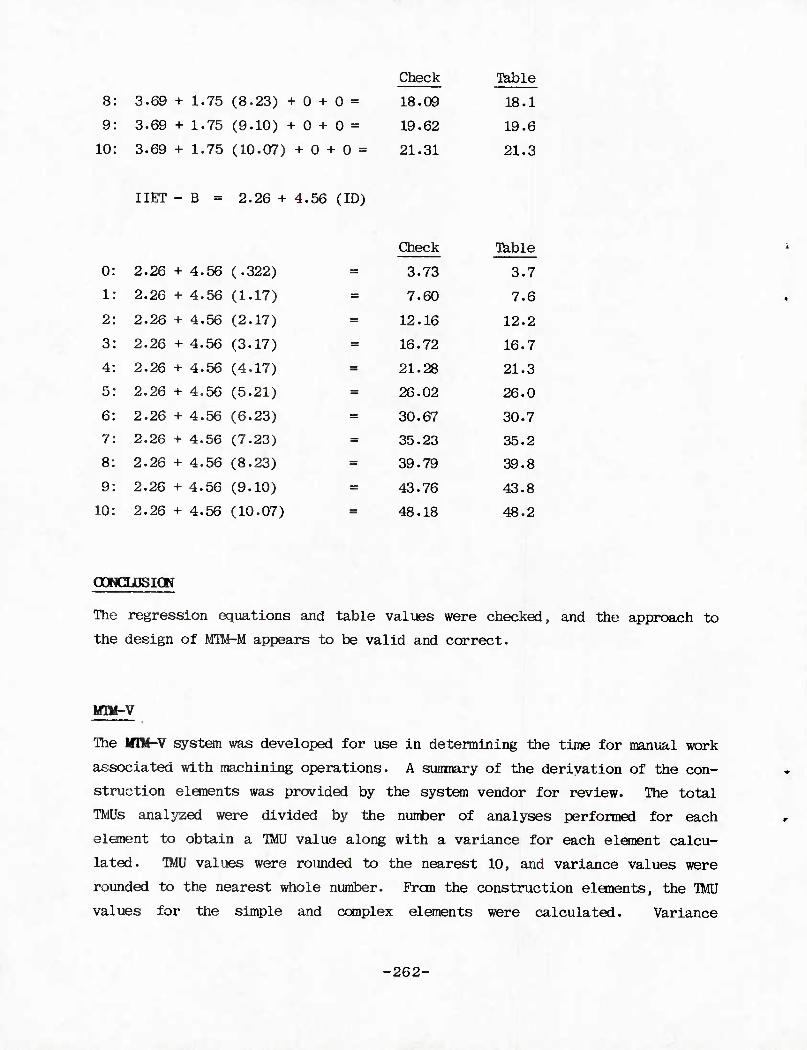
Check Table
8
9
10
0
1
2
3
4
5
6
7
8
9
10
3.69 + 1.75 (8.23) + 0 + 0 =
3.69 + 1.75 (9.10) + 0 + 0 =
3.69 + 1.75 (10.07) + 0 + 0 =
IIET - B = 2.26 + 4.56 (ID)
2.26 + 4.56 (.322)
2.26 + 4.56 (1.17)
2.26 + 4.56 (2.17)
2.26 + 4.56 (3.17)
2.26 + 4.56 (4.17)
2.26 + 4.56 (5.21)
2.26 + 4.56 (6.23)
2.26 + 4.56 (7.23)
2.26 + 4.56 (8.23)
2.26 + 4.56 (9.10)
2.26 + 4.56 (10.07)
18.09 18.1
19.62 19.6
21.31 21.3
Check Table
3.73 3.7
7.60 7.6
12.16 12.2
16.72 16.7
21.28 21.3
26.02 26.0
30.67 30.7
35.23 35.2
39.79 39.8
43.76 43.8
48.18 48.2
OOHCLDSICW
The regression equations and table values were checked, and the approach to
the design of MUt-M appears to be valid and correct.
MTM-V
The Iflll-V system was developed for use in determining the time for manual work
associated with machining operations. A suranary of the derivation of the con-
struction elements was provided by the system vendor for review. The total
TMUs analyzed were divided by the nuirber of analyses performed for each
element to obtain a TMU value along with a variance for each element calcu-
lated. TMU values were rounded to the nearest 10, and variance values were
rounded to the nearest whole number. Fran the construction elements, the IMJ
values for the simple and complex elements were calculated. Variance
-262-
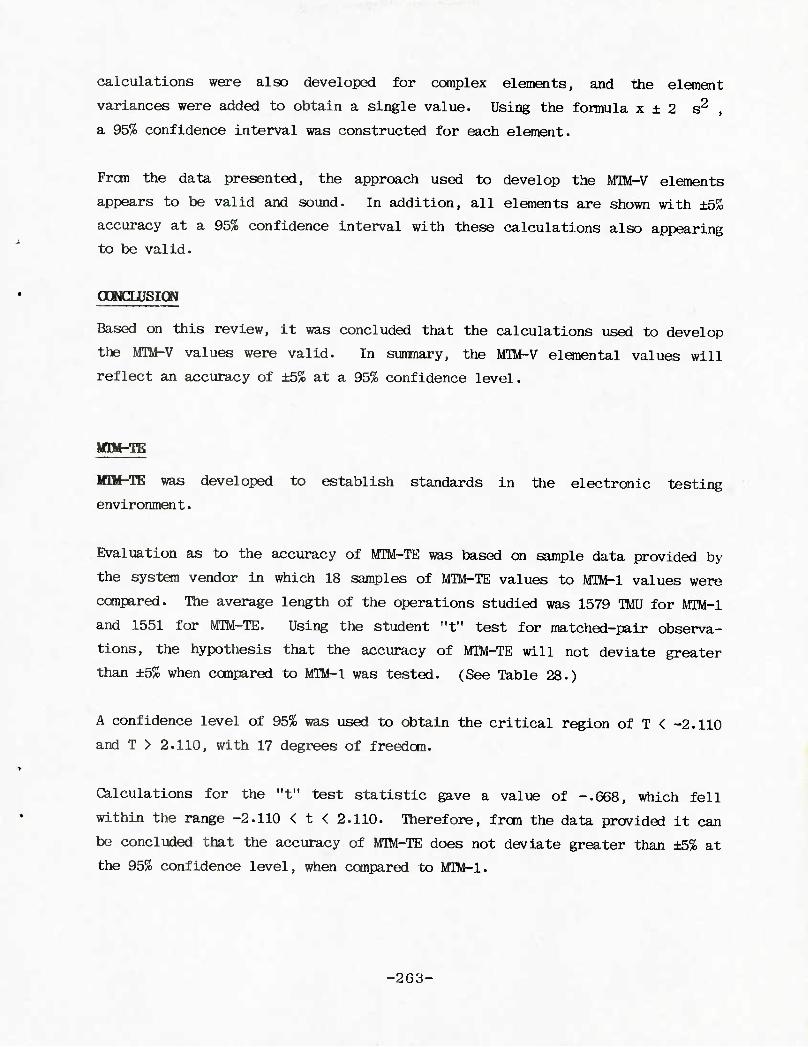
calculations were also developed for complex elements, and the element
variances were added to obtain a single value. Using the formula x ± 2 s2 ,
a 95% confidence interval was constructed for each element.
Fran the data presented, the approach used to develop the M1M-V elements
appears to be valid and sound. In addition, all elements are shown with ±5%
accuracy at a 95% confidence interval with these calculations also appearing
to be valid.
OOMCUJSICW
Based on this review, it was concluded that the calculations used to develop
the MTM-V values were valid. In summary, the MTM-V elemental values will
reflect an accuracy of ±5% at a 95% confidence level.
IflM-TE
MIM-TE was developed to establish standards in the electronic testing
environment.
Evaluation as to the accuracy of MTM-TE was based on sample data provided by
the system vendor in which 18 samples of MTM-TE values to IflM-l values were
compared. The average length of the operations studied was 1579 TMU for MTM-1
and 1551 for MTM-TE. Using the student "t" test for matched-pair observa-
tions, the hypothesis that the accuracy of MTM-TE will not deviate greater
than ±5% when compared to MIM-1 was tested. (See Table 28.)
A confidence level of 95% was used to obtain the critical region of T < -2.110
and T > 2.110, with 17 degrees of freedom.
Calculations for the "t" test statistic gave a value of -.668, which fell
within the range -2.110 < t < 2.110. Therefore, from the data provided it can
be concluded that the accuracy of MTM-TE does not deviate greater than ±5% at
the 95% confidence level, when compared to MIM-1.
-203-
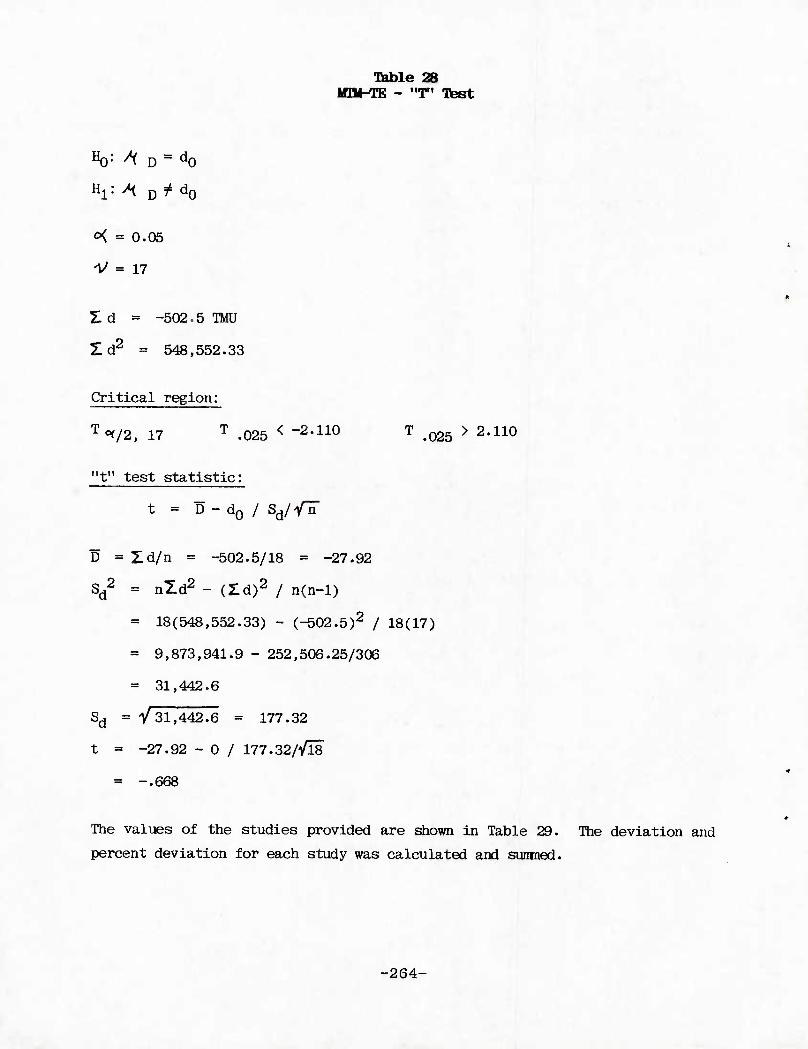
Table 28 Iflli-TE - "T" Ttest
Ho1 A D = d0
o{ = 0.05
V = 17
21 d = -502.5 TMU
£d2 = 548,552.33
Critical region:
0(/2, 17 T .025 < -2-110
"t" test statistic:
T i025 > 2.110
t = D - d0 / s^yr
D = Zd/n = -502.5/18 - -27.92
Sd2 - nld2 - (Hd)2 / n(n-l)
" 18(548,552.33) - (-502.5)2 / 18(17)
= 9,873,941.9 - 252,506.25/306
= 31,442.6
Sd = V 31,442.6 = 177.32
t = -27.92 - 0 / 177.32/'/l8
- -.668
The values of the studies provided are shown in Table 29. The deviation and
percent deviation for each study was calculated and sunined.
-264-
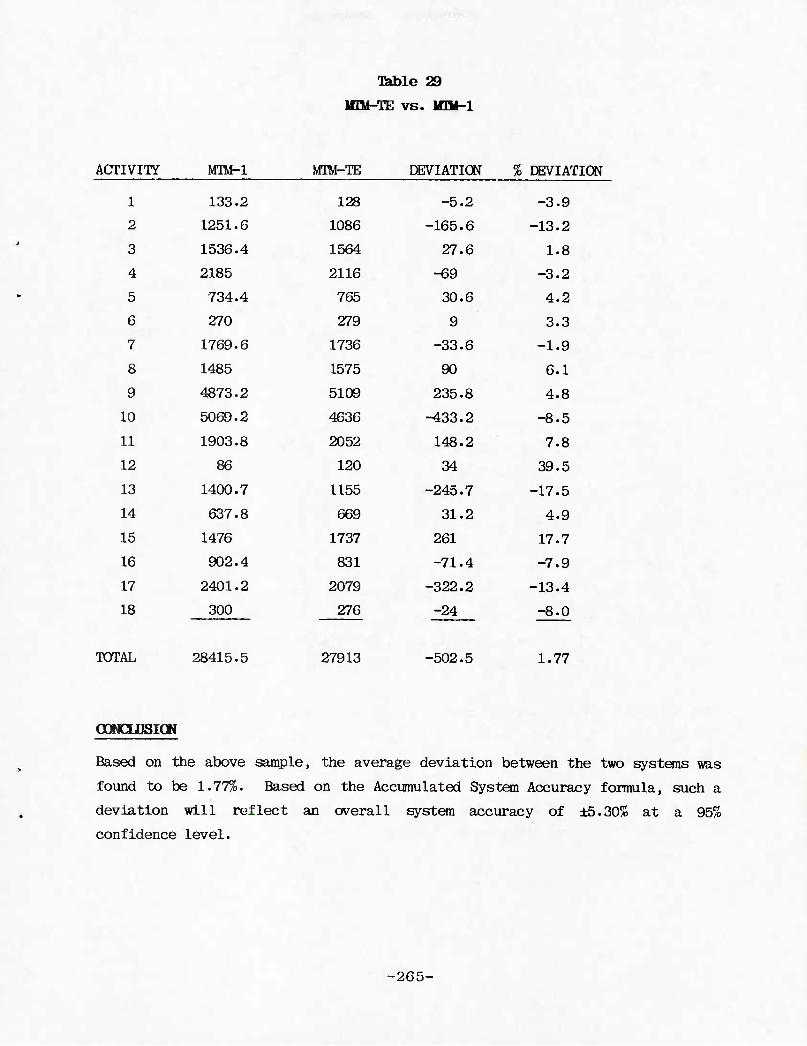
Table 29
irat-TE vs. imi-i
ACTIVITY MTM-l MTM-TE DEVIATION % DEVIATION
1 133.2 128 -5.2 -3.9
2 1251.6 1086 -165.6 -13.2
3 1536.4 1564 27.6 1.8
4 2185 2116 -69 -3.2
5 734.4 765 30.6 4.2
6 270 279 9 3.3
7 1769.6 1736 -33.6 -1.9
8 1485 1575 90 6.1
9 4873.2 5109 235.8 4.8
10 5069.2 4636 -433.2 -8.5
11 1903.8 2052 148.2 7.8
12 86 120 34 39.5
13 1400.7 1155 -245.7 -17.5
14 637.8 669 31.2 4.9
15 1476 1737 261 17.7
16 902.4 831 -71.4 -7.9
17 2401.2 2079 -322.2 -13.4
18 300 276
27913
-24
-502.5
-8.0
TOTAL 28415.5 1.77
OOMCUJSICM
Based on the above sample, the average deviation between the two systems was
found to be 1.77%. Based on the Accumulated System Accuracy formula, such a
deviation will reflect an overall system accuracy of ±5.30% at a 95%
confidence level.
-265-
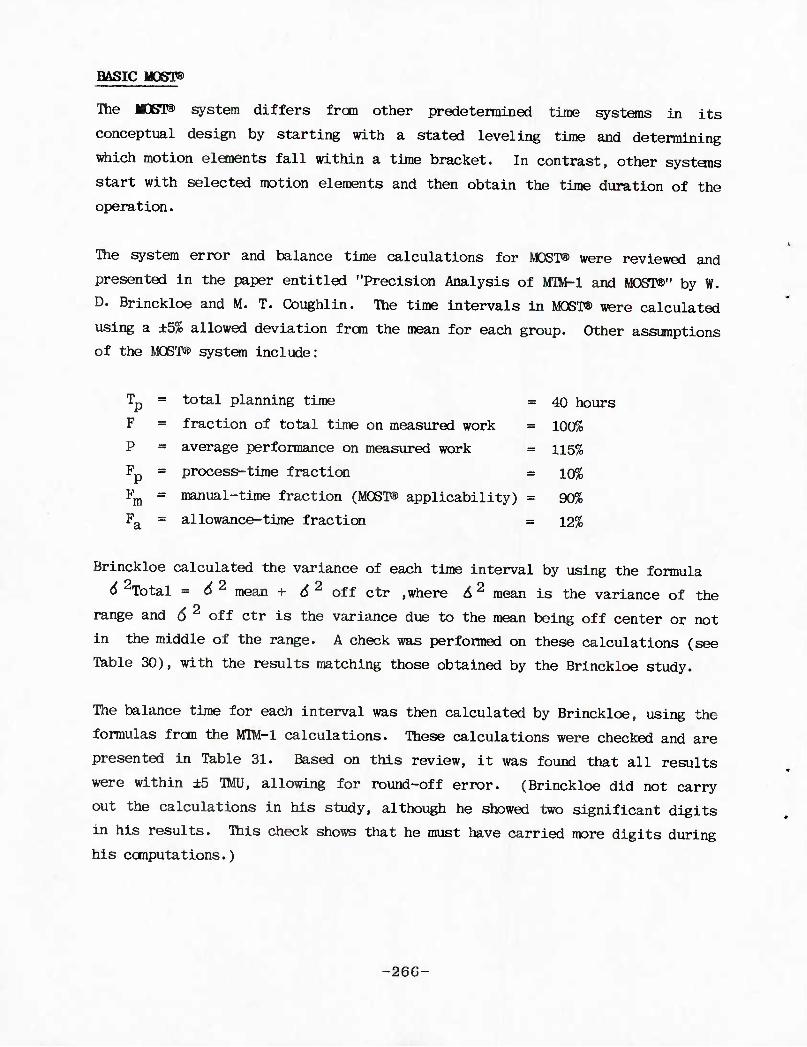
BASIC MQgPS
The MOST® system differs from other predetermined time systems in its
conceptual design by starting with a stated leveling time and determining
which motion elements fall within a time bracket. In contrast, other systems
start with selected motion elements and then obtain the time duration of the operation.
The system error and balance time calculations for MOST® were reviewed and
presented in the paper entitled "Precision Analysis of MTM-1 and MOST®" by W.
D. Brinckloe and M. T. Coughlin. The time intervals in MOST® were calculated
using a ±5% allowed deviation frcm the mean for each group. Other assumptions of the MOST® system include:
T = total planning time = 40 hours
F = fraction of total time on measured work = 100%
P = average performance on measured work = 115%
Fp = process-time fraction = 10%
Fm = manual-time fraction (MOST® applicability) = 90%
Fa = allowance-time fraction = 12%
Brinckloe calculated the variance of each time interval by using the formula
6 2Total = 62 mean + 62 oft ctr .where 62 mean is the variance of the
range and 6 off ctr is the variance due to the mean being off center or not
in the middle of the range. A check was performed on these calculations (see
Table 30), with the results matching those obtained by the Brinckloe study.
The balance time for each interval was then calculated by Brinckloe, using the
formulas frcm the MTM-1 calculations. These calculations were checked and are
presented in Table 31. Based on this review, it was found that all results
were within ±5 HID, allowing for round-off error. (Brinckloe did not carry
out the calculations in his study, although he showed two significant digits
in his results. This check shows that he must have carried more digits during his computations.)
-266-
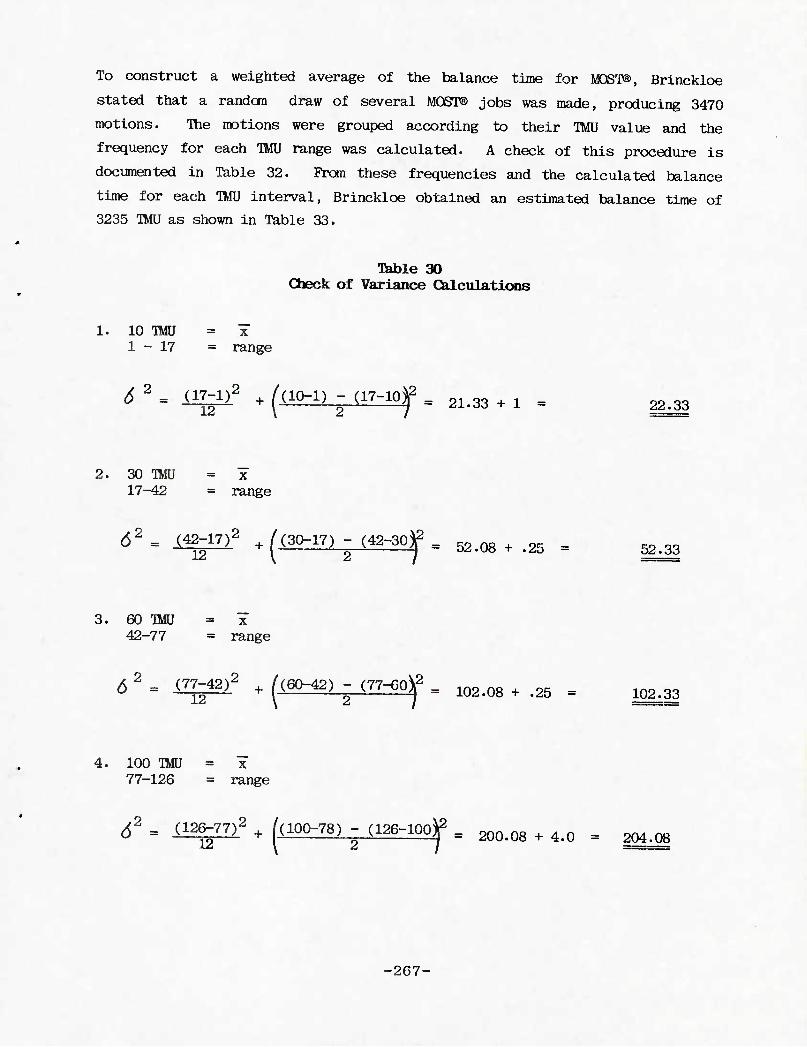
To construct a weighted average of the balance time for MOST®, Brinckloe
stated that a randan draw of several MOST® jobs was made, producing 3470
motions. The motions were grouped according to their TMU value and the
frequency for each TMU range was calculated. A check of this procedure is
documented in Table 32. From these frequencies and the calculated balance
time for each TMU interval, Brinckloe obtained an estimated balance time of
3235 TMU as shown in Table 33.
Table 30 Check of Variance Calculations
1. 10 TMJ = x 1-17 = range
6 2. ogii2 + (do-i) - (17-ioy. 21.33 +1 , mM
2. 30 TMJ = x 17-42 = range
d2 . I^lTi2 ^(30-17) - (42-30^ . 52.08 + .25 = mM
3. 60 TMU = x 42-77 = range
2 ,«, .ON2 6 m i71£2f + ((60-42) - (77-60^ = ^ ^ + ^ = ^^
4. 100 TMU - x 77-126 = range
62 m a^m2 + (aoo.78) - (i26-iooy . 200.08 + 4>0 = 204>08 /(100-78) - (126-100)|2
-267-
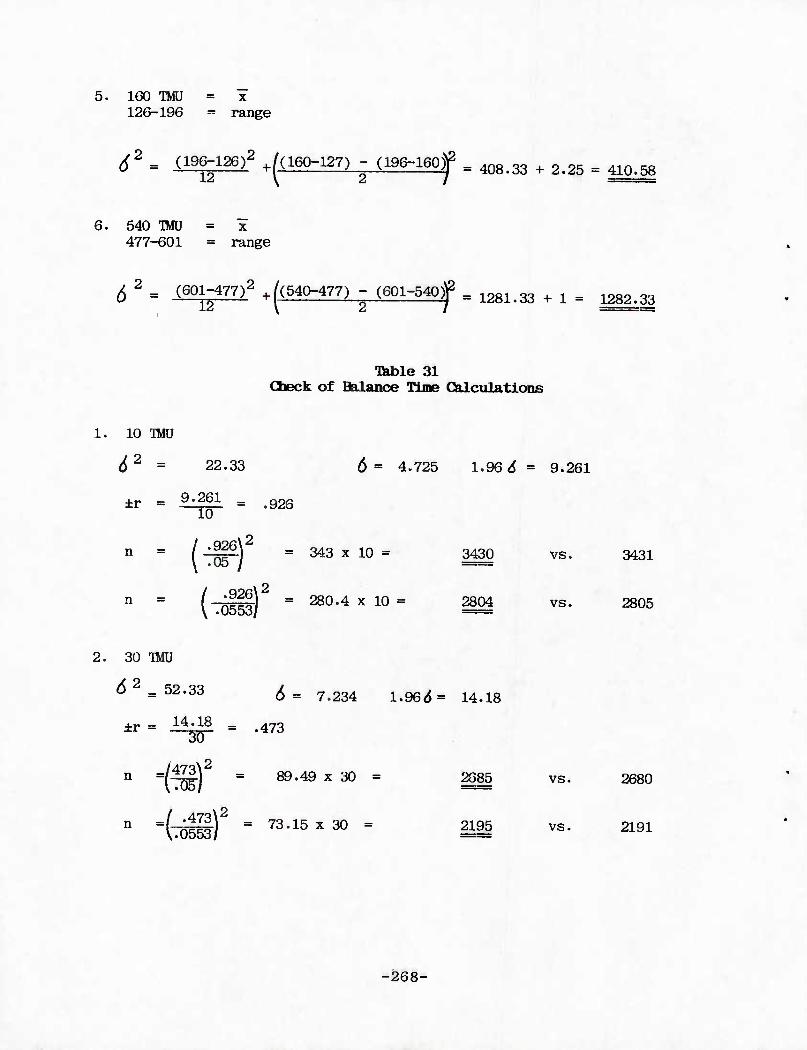
5. 160 TMU ■ x 126-196 = range
62 = (196-126)2 ^(160-127) - (196-160)jP = 408.33 + 2^ = ^^
6. 540 TMU = x 477-601 = range
6 2 = (601^77)2 + ((540-477) - (601-540)jp , 1281>33 + , = ^^
Ttole 31 Check of Balance Ttme QLLcnlations
1. 10 TMU
62 = 22.33 6= 4-725 1.96 6= 9.261
±r = ll2^! - .926 10
; ^ = 343 x 10 = 3430 vs. 3431 \ -05/
n = (T^H) = ^O'4 x 10 = ^^ vs. 2805
2. 30 TMU
0 = 52.33 ^ = 7>234 1.96^= 14. 18
±r = 14:18 = .473 ^0^
n =/-^g]
i2 n "(TDSI)
= 73"15 x 30 = WL VS-
2191
-268-
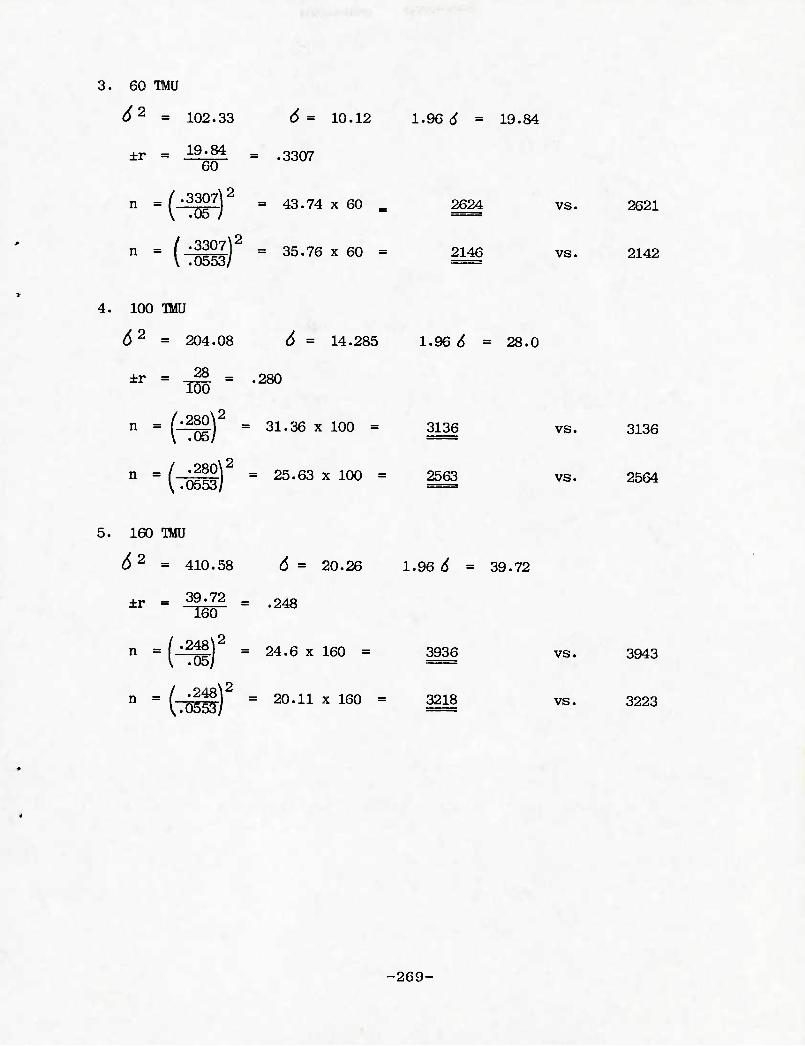
3. 60 TMU
62 = 102.33 6= 10.12 1.96 4 = 19.84
±r = i9,84 = .3307 60
n = ( •3^7| = 43.74 x 60 _ 2624 vs. 2621 \ .05 y ==
n = f-L5|gj) = 35.76 x 60 = 2146 vs. 2142
4. 100 TMU
62 = 204.08 6 = 14.285 1.96 6 = 28.0
±r = 28 = >280 100
n = /ji^OJ = 31.36 x 100 = 3136 vs. 3136
.2
^.0553/ = 25.63 x 100 = 2563 vs. 2564
5. 160 TMU
62 = 410.58 6 = 20.26 1.96 6 = 39.72
±r = 39r72 = .248 160
n = (-^g|) = 24.6 x 160 = 3936 vs. 3943
n = ( •24^\ 1,705557
2 = 20.11 x 160 = 3218 vs. 3223
•269-
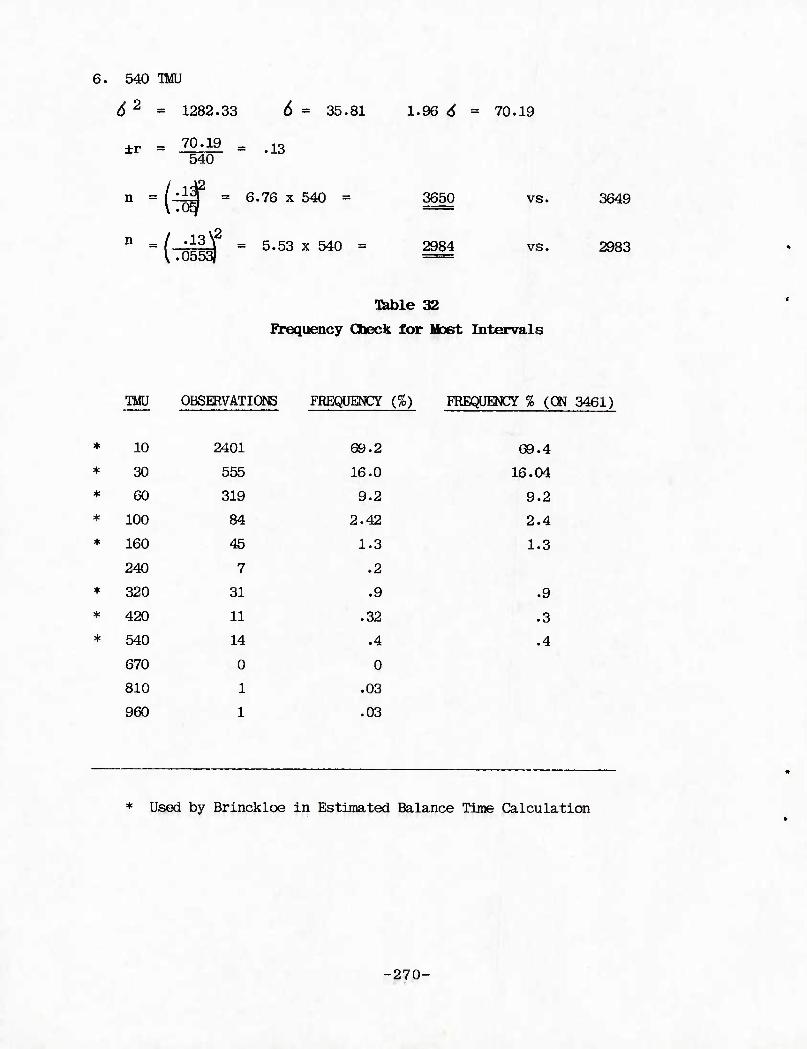
6. 540 TMJ
62 = 1282.33 6 = 35.81 1.96 6 = 70.19
±r = 70^19 . .^ 540
n = (-^a^ = 6.76 x 540 = 3650 vs. 3649
n = / l^jy = 5.53 x 540 = ^84 vs. 2983
•Gable 32
Frequency Check for Most Intervals
IMU OBSERVATIONS FREQUENCY (%) FREQUENCY % (ON 3461)
♦ 10 2401 69.2 09.4 ♦ 30 555 16.0 16.04 * 60 319 9.2 9.2 * 100 84 2.42 2.4 ♦ 160 45 1.3 1.3
240 7 .2 * 320 31 .9 .9 * 420 11 .32 .3 * 540 14 .4 .4
670 0 o 810 1 .03
960 1 .03
♦ Used by Brinckloe in Estimated Balance Time Calculation
■270-
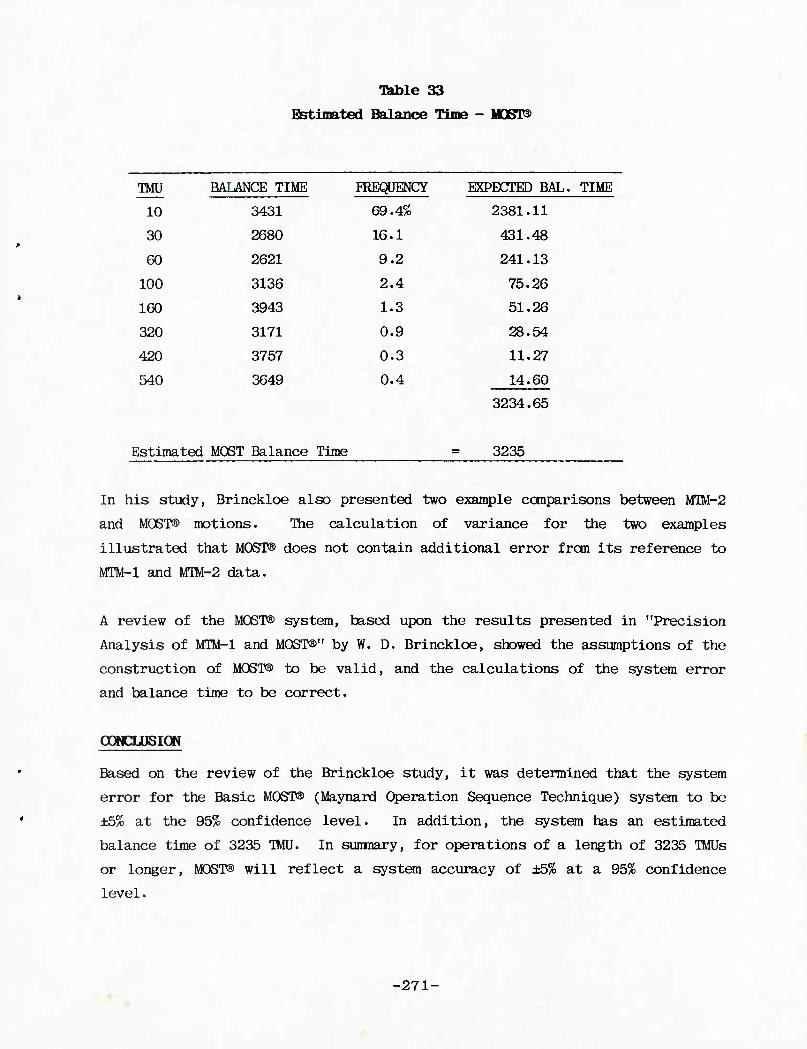
Table 33
Estimated Balance Time - MOST®
TMU BALANCE TIME FREQUENCY EXPECTED BAL. TIME
10 3431 69.4% 2381.11
30 2680 16.1 431.48
60 2621 9.2 241.13
100 3136 2.4 75.26
160 3943 1.3 51.26
320 3171 0.9 28.54
420 3757 0.3 11.27
540 3649 0.4 14.60
3234.65
Estimated MOST Balance Time 3235
In his study, Brinckloe also presented two example comparisons between MrIM-2
and MOST® motions. The calculation of variance for the two examples
illustrated that MOST® does not contain additional error from its reference to
MTM-1 and MTM-2 data.
A review of the MOST® system, based upon the results presented in "Precision
Analysis of MTM-1 and MOST®" by W. D. Brinckloe, showed the assumptions of the
construction of MOST® to be valid, and the calculations of the system error
and balance time to be correct.
OOtOJJSION
Based on the review of the Brinckloe study, it was determined that the system
error for the Basic MOST® (Maynard Operation Sequence Technique) system to be
±5% at the 95% confidence level. In addition, the system has an estimated
balance time of 3235 TMU. In sunmary, for operations of a length of 3235 TMUs
or longer, MOST® will reflect a system accuracy of ±5% at a 95% confidence
level.
-271-
MINI MPBTS
Mini MOST® consists of the same sequence models and index numbers as Basic
MOST®, but is used with a multiplier of one instead of 10. In the paper,
"Precision Analysis of Short-Cycle MOST®," W. D. Brinckloe reviews the backup
benchmark analysis and basic motions from MTM-1 that make up Mini MOST®. The
four motions of Action Distance (A), Body Motion (B), Gain Control (G), and
Place (P) from the General Move category have been modified to be used for
work of short duration. The accuracy of each of these motions was calculated.
Using the frequency data from "The MTM-2 Project," Brinckloe then calculated
the balance time for Mini MOST®.
The Action Distance motion consists of three categories: hand movement,
linear; hand movement, angular; and leg movement. The hand movement, linear
times are derived from the MTM-1 motions of Reach-Cases A and B and Move-Cases
A and B. The weighted IMU and variance for this category was found to be p
6.813 IMU and 1.611 IMU , respectively. The hand movement, angular, category
is taken frcm the MIM-l Turn motion with the 30 time value deleted. The
overall weighted TMU and variance calculated was 4.815 IMU and 0.781 IMU2.
The leg movement category consists of the MTM-1 leg motion and horizontal
motions (SS-C1, SS-C2, TBC1, TBC2, W-P and WPO) for one and two steps. The
overall weighted TMU and variance was 17.6 TMU and 9.218 TMU2. Next,
Brinckloe calculated the probability that the underlying MTM-1 error would
push the correct elemental motion time into the next lower or higher index
range. Combining these results with the previous calculations, Brinckloe
arrives at a balance time of 401 TMU for Action Distance, with a variance of
2.293 IMU2.
The next motion. Body Movement, consists of only one index value. This was
derived frcm the MTM-1 motions of Bend (29.0 IMU) and Arise (31.9 RMU). The
calculated balance time is 216 TMU with a variance of 4.505 IMU . The Gain
Control motion has five index values. Each of these index values were
analyzed separately and then combined with a weighted average to obtain the
balance time. The variance for the index value was combined with the
calculated variance from the MTM-1 data card value (as was done for Action
Distance). Total balance time was 656 TMU, with a variance of 3.628 IMU .
-272-
The data for the fourth motion, Place, was not available for review. Based on
discussions with Brinckloe, he substantiated that the computations had been
performed in the same manner and had resulted in a balance time of
approximately 400 TMU.
Using the frequency data, an overall system balance time for Mini MOST® was
calculated and the result was 501.4 TMU (rounded to 500 IMU). Fran the review
of the available data, the construction of the Mini MOST® index values appears
valid and correct. For operations totaling 500 TMU, the accuracy would be ±5%
at the 95% confidence level.
MAXI MCggP
llaxi MOST® was developed to be used for long-cycle jobs such as shipbuilding
or large-truck assembly. An evaluation as to the accuracy of Maxi MOST® was
based on sample data provided by the system vendor in which 35 samples of Maxi
MOST® values were compared to Basic MOST® values. The average length of the
operations studied was 6512 TMU for Basic MOST®, and 6558 TMU for Maxi
MOST®. Using the student "t" test for matched-pair observations, the
hypothesis that the accuracy of Maxi MOST® will not deviate greater than ±5%
when compared to Basic MOST® was tested. (See Table 34.)
A confidence level of 95% was used to obtain the critical region of T < -2.042
and T > 2.042, with 34 degrees of freedom.
Calculations for the "t" test statistic gave a value of 0.72, which fell
within the range -2.042 < t < 2.042. Therefore, from the data provided, it
can be concluded that the accuracy of Maxi MOST® does not deviate greater than
±5% at the 95% confidence level, when compared to Basic MOST®.
',
-273-
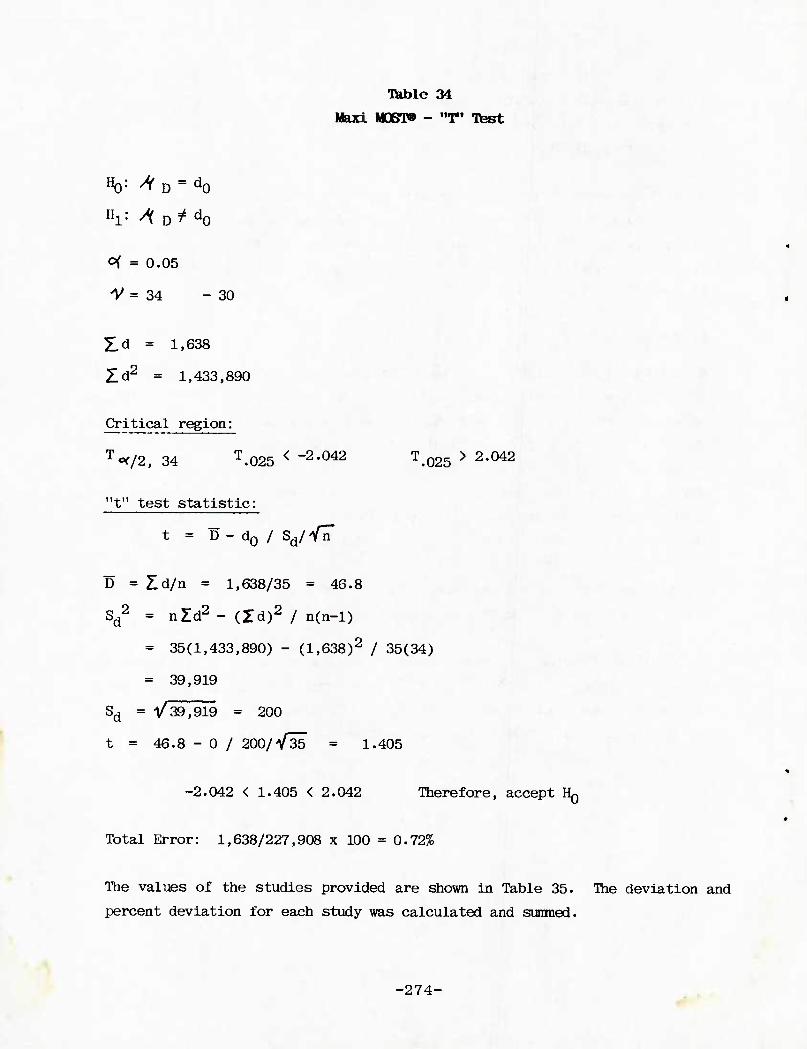
•Eable 34
Maxi MOBT» - "T"' Ttest
H0: ^ D = d0
Hl: 4 D^d0
^ = 0.05
V = 34 - 30
51 d = 1,638
Id2 = 1,433,890
Critical region:
T^/2, 34 T.025 < -2-042 T.025 > 2-042
"t" test statistic:
t = D- d0 / sd/Yr
D = Zd/n = 1,638/35 = 46.8
Sd2 = nld2 - (Id)2 / n(n-l)
» 35(1,433,890) - (1,638)2 / 35(34)
= 39,919
Sd = V 39,919 = 200
t = 46.8 - 0 / 200/V35 = 1.405
-2.042 < 1.405 < 2.042 Therefore, accept HQ
Total Error: 1,638/227,908 x 100 = 0.72%
The values of the studies provided are shown in Table 35. The deviation and
percent deviation for each study was calculated and sunined.
-274-
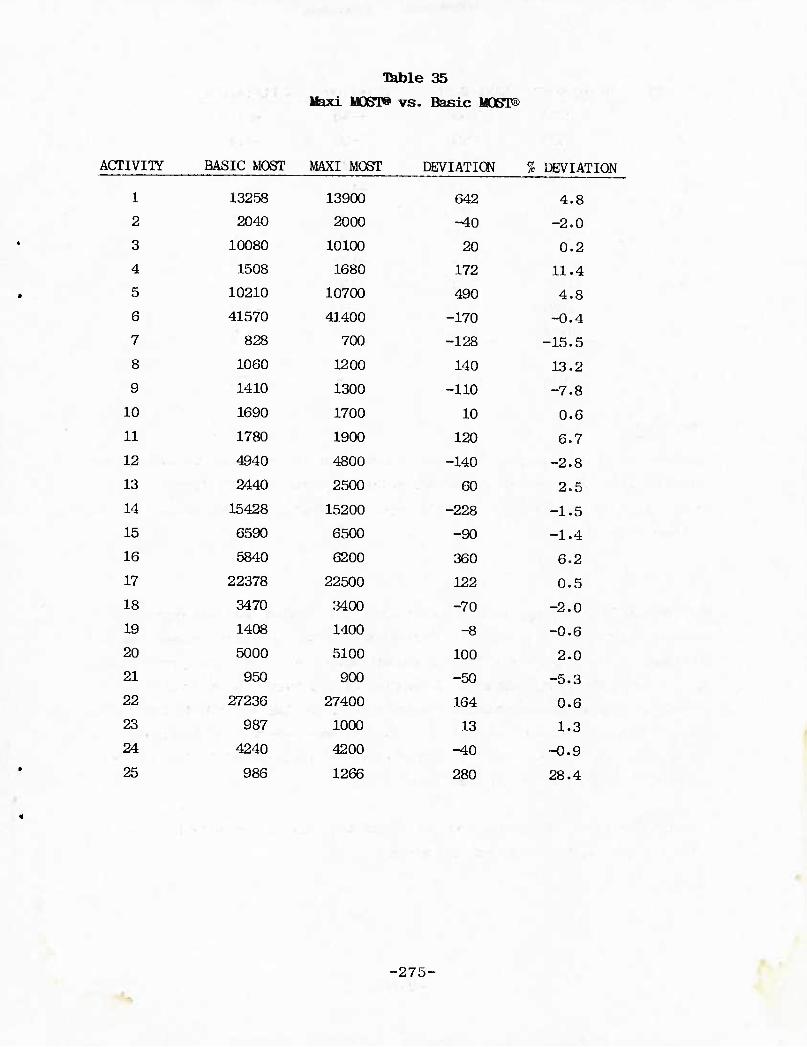
Table 35
Maxi liOST» vs. Basic MOST®
ACTIVITY BASIC MOST MAXI MOST DEVIATICN % DEVIATION
1 13258 13900 642 4.8
2 2040 2000 -40 -2.0
3 10080 10100 20 0.2
4 1508 1680 172 11.4
5 10210 10700 490 4.8
6 41570 41400 -170 -0.4
7 828 700 -128 -15.5
8 1060 1200 140 13.2
9 1410 1300 -110 -7.8
10 1690 1700 10 0.6
11 1780 1900 120 6.7
12 4040 4800 -140 -2.8
13 2440 2500 60 2.5
14 15428 15200 -228 -1.5
15 6590 6500 -90 -1.4
16 5840 6200 360 6.2
17 22378 22500 122 0.5
18 3470 ■
3400 -70 -2.0
19 1408 1400 -8 -0.6
20 5000 5100 100 2.0
21 950 900 -50 -5.3
22 27236 27400 164 0.6
23 987 1000 13 1.3
24 4240 4200 -40 -0.9
25 986 1266 280 28.4
-275-
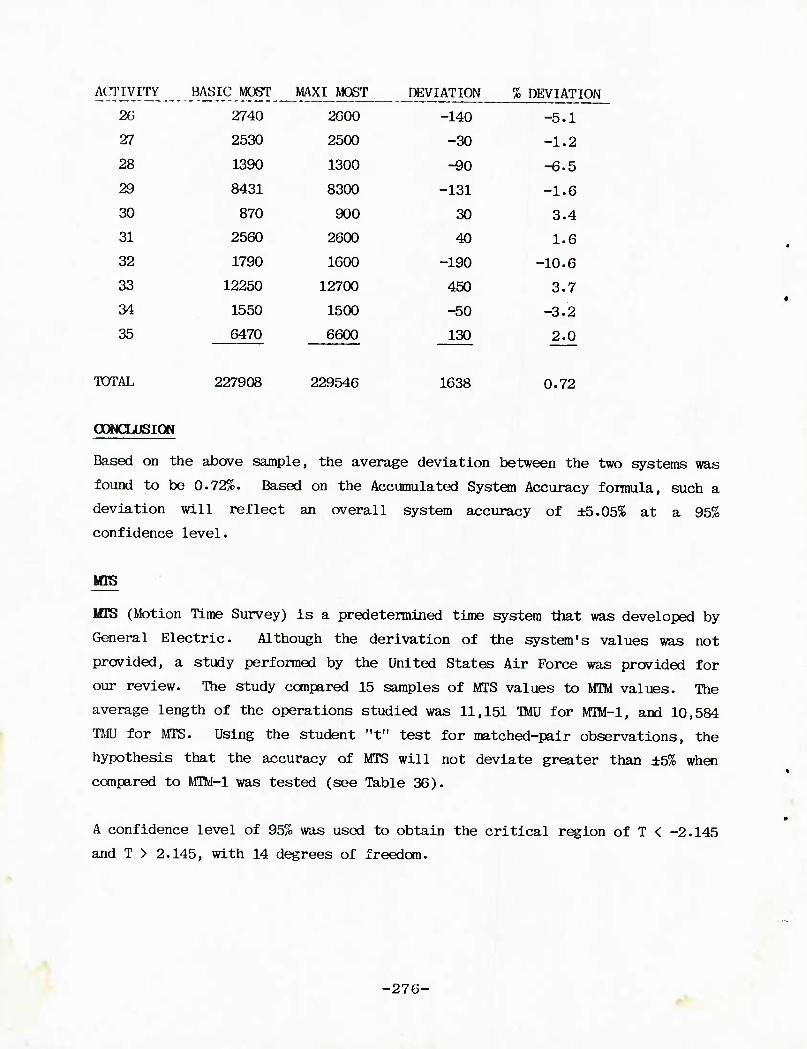
ACTIVITY BASIC MOST MAXI MOST DEVIATION % DEVIATION
20 2740 2000 -140 -5.1
27 2530 2500 -30 -1.2
28 1390 1300 -90 -6.5
29 8431 8300 -131 -1.6
30 870 900 30 3.4
31 2560 2600 40 1.6
32 1790 1600 -190 -10.6
33 12250 12700 450 3.7
34 1550 1500 -50 -3.2
35 6470 6600 130 2.0
TOTAL 227908 229540 1638 0.72
OOMCLUSION
Based on the above sample, the average deviation between the two systems was
found to be 0.72%. Based on the Accumulated System Accuracy fonnula, such a
deviation will reflect an overall system accuracy of ±5.05% at a 95%
confidence level.
ins
MTS (Motion Time Survey) is a predetermined time system that was developed by
General Electric. Although the derivation of the system's values was not
provided, a study performed by the United States Air Force was provided for
our review. The study compared 15 samples of MTS values to MTM values. The
average length of the operations studied was 11,151 TMJ for MTM-1, and 10,584
TMU for MTS. Using the student "t" test for matched-pair observations, the
hypothesis that the accuracy of MTS will not deviate greater than ±5% when
compared to MTM-1 was tested (see Table 36).
A confidence level of 95% was used to obtain the critical region of T < -2.145
and T > 2.145, with 14 degrees of freedom.
•276-
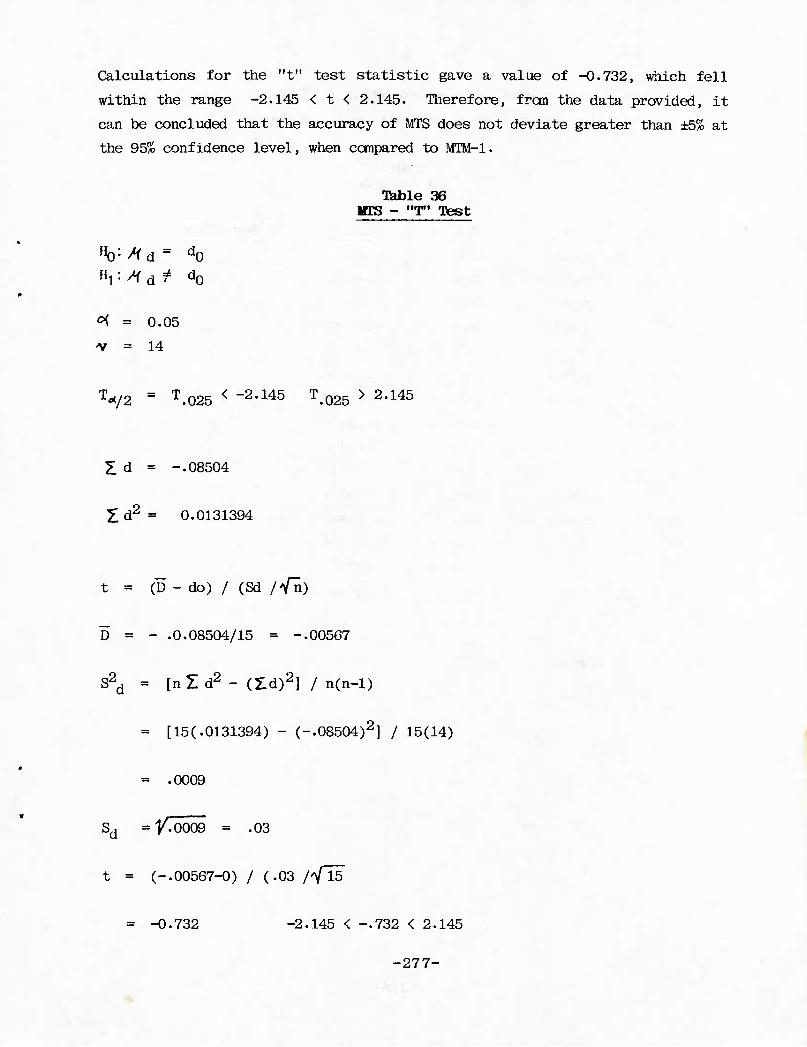
Calculations for the "t" test statistic gave a value of -0.732, which fell
within the range -2.145 < t < 2.145. Therefore, fran the data provided, it
can be concluded that the accuracy of MTS does not deviate greater than i5% at
the 95% confidence level, when compared to MTM-1.
'teble 36 MTS - "T" Ttest
BQ'-Sid" d0
"l^d^4 d0
cK = 0.05
V = 14
T-</2 " T.025 < -2-145 T.025 > 2-145
^ d = -.08504
Z d2 = 0.0131394
t = (D - do) / (Sd ffa)
D = - .0.08504/15 = -.00507
S2d = [nld2 - (Xd)2] / n(n-l)
[15(.0131394) - (-.08504)^] / 15(14)
= .0009
Sd = y.0009 = .03
t = (-.00567-0) / (.03 /VTs
= -0.732 -2.145 < -.732 < 2.145
-277-
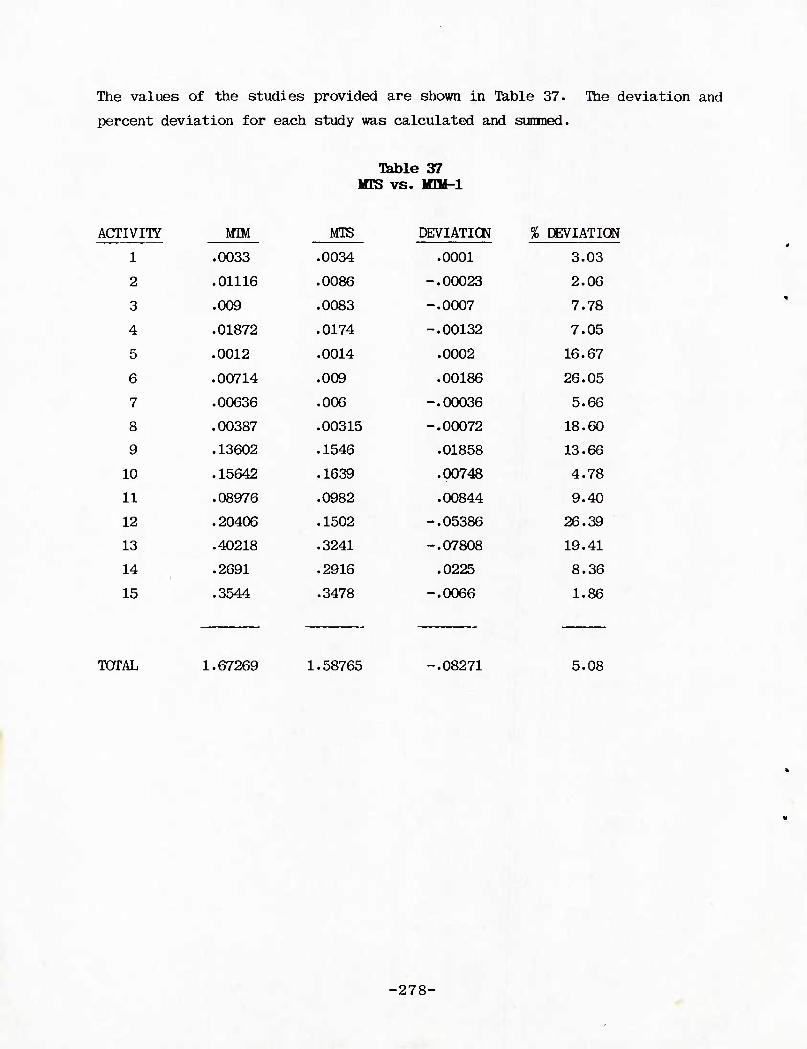
The values of the studies provided are shown in Table 37. The deviation and
percent deviation for each study was calculated and summed.
Table 37 MS vs. imii-i
ACTIVITY MTM M'ib DEVIATION % DEVIATION
1 .0033 .0034 .0001 3.03
2 .01116 .0086 -.00023 2.06
3 .009 .0083 -.0007 7.78
4 .01872 .0174 -.00132 7.05
5 .0012 .0014 .0002 16.67
6 .00714 .009 .00186 26.05
7 .00636 .006 -.00036 5.66
8 .00387 .00315 -.00072 18.60
9 .13602 .1546 .01858 13.66
10 .15642 .1639 .00748 4.78
11 .08976 .0982 .00844 9.40
12 .20406 .1502 -.05386 26.39
13 .40218 .3241 -.07808 19.41
14 1
.2691 .2916 .0225 8.36
15 .3544 .3478 -.0066 1.86
TOTAL 1.67269 1.58765 -.08271 5.08
-278-
OOWaJDSION
Based on the above sample, the average deviation between the two systems was
found to be 5.08%. Based on the Accumulated System Accuracy formula, such a
deviation will reflect an overall system accuracy of ±7.12% at a 95%
confidence level.
UANPRO"
MANPfiD" is a generalized standard data system which uses composite work and
motion patterns that are applied to the work being analyzed. There are 100
elements contained within nine categories. The standard hours for each of
these elements were derived from micromotion analysis, which was not available
for review.
The accuracy data provided was based upon a comparison between MANPRO" and
MTM-l. The study compared nine samples of MANPRO" values to Mltf-1 values. It
should be noted that MANPRO" shows a systematic bias to underestimate the MTM-
1 elemental value. The average length of the operations studied was 52 TMU
for MTM-l and 48 TMU for MANPRO". Using the student "t" test for matched-pair
observations, the hypothesis that the accuracy of MANPRO" will not deviate
greater than ±5% when compared to MTM-l was tested (see Table 38). A
confidence level of 95% was used to obtain the critical region of T < -2.306
and T > 2.306 with 8 degrees of freedom. Calculations for the "t" test
statistic gave values of -3.259, which fell outside the range <-2.306.
Therefore, from the data provided, it can be concluded that the accuracy of
MANPRO" deviates greater than ±5% at the 95% confidence level, when canpared
to MTM-l.
■279-
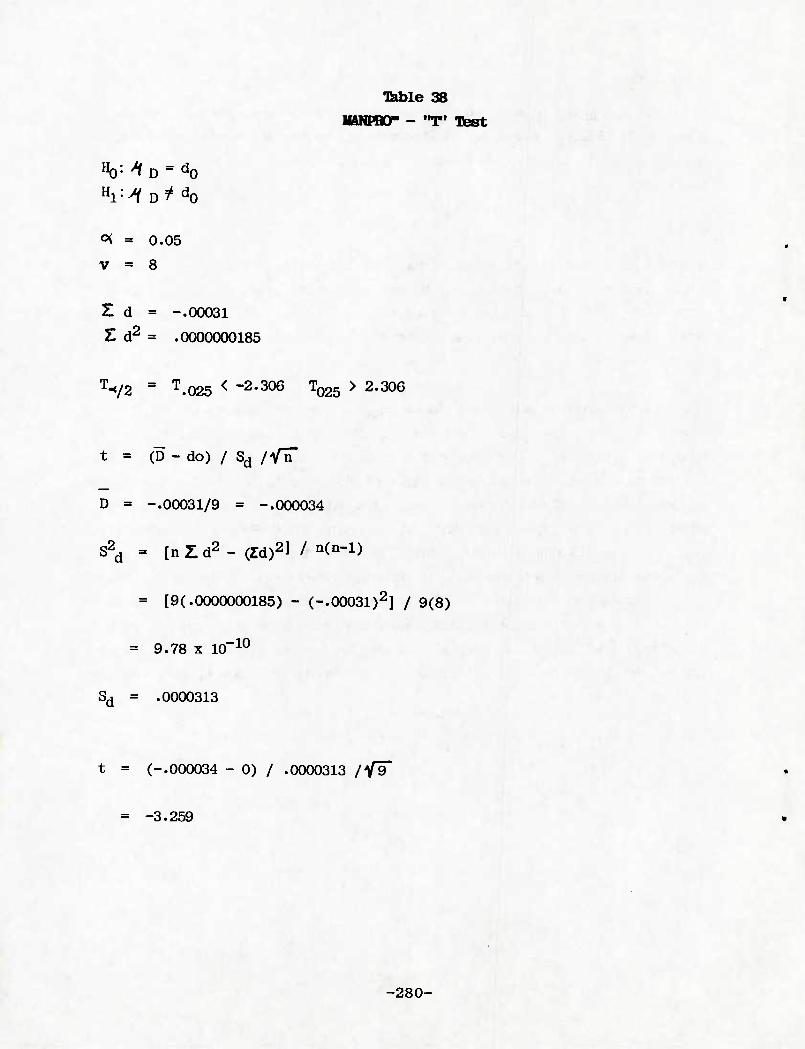
Table 38
MNPBO- - "T" Ttest
HQ: ^f D = d0
^ = 0.05
V = 8
Z d = -.00031
E d2 = .0000000185
T-</2 " T.025 < -2-306 T025 > 2-306
t = (D - do) / sd /VT
D = -.00031/9 = -.000034
S^ = [n Z d2 - (Zd)2! / n(n-1)
= [9(.0000000185) - (-.00031)2] / 9(8)
= 9.78 x 10"10
Sd = .0000313
t = (-.000034 - 0) / .0000313 /VJT
= -3.259
-280-
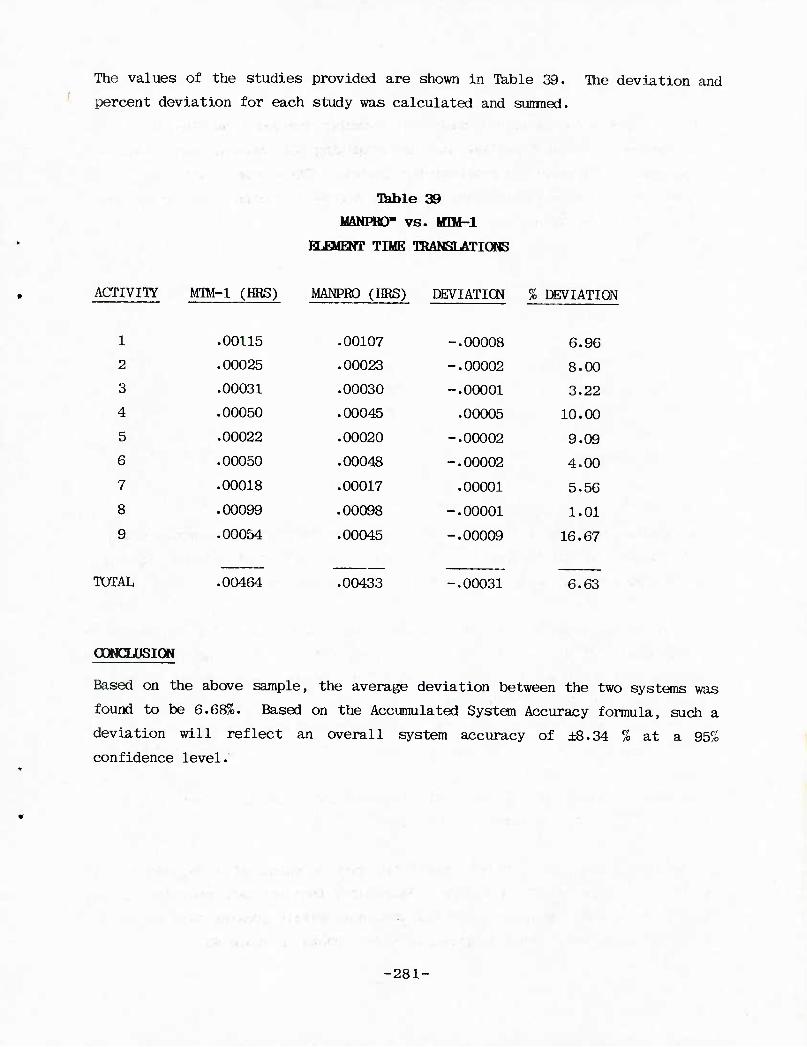
The values of the studies provided are shown in Table 39. The deviation and
percent deviation for each study was calculated and suimed.
TSible 39
MANPfiO- vs . IflM-l
Fi.raffiNrr TIME TBANSLATIONS
ACTIVITY MTM-1 (HRS) MANPRO (HRS) DEVIATION
1 .00115 .00107 -.00008
2 .00025 .00023 -.00002
3 .00031 .00030 -.00001
4 .00050 .00045 .00005
5 .00022 .00020 -.00002
6 .00050 .00048 -.00002
7 .00018 .00017 .00001
8 .00099 .00098 -.00001
9 .00054 .00045 -.00009
% DEVIATION
G.96
8.00
3.22
10.00
9.09
4.00
5.5G
1.01
16.67
TOTAL .00464 .00433 -.00031 6.63
ODWCIJJSIQN
Based on the above sample, the average deviation between the two systems was
found to be 6.68%. Based on the Accumulated System Accuracy formula, such a
deviation will reflect an overall system accuracy of ±8.34 7o at a 95%
confidence level.
-
■281-
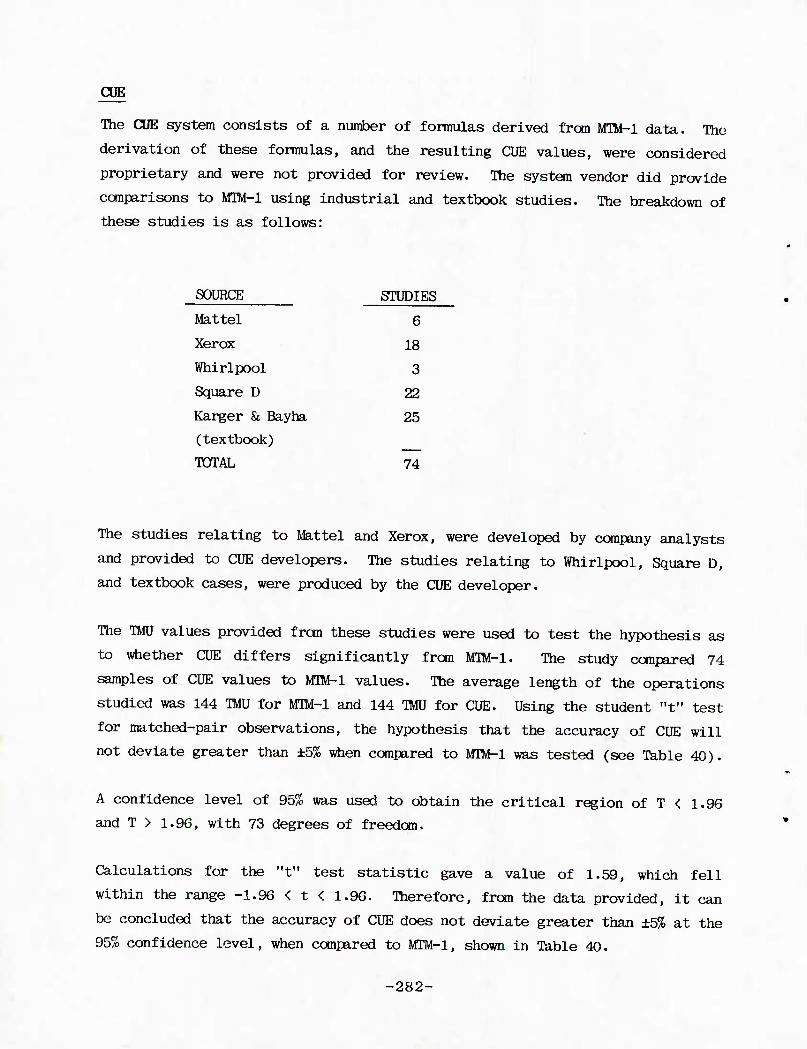
CUE
The CUE system consists of a number of formulas derived from MTM-1 data. The
derivation of these formulas, and the resulting CUE values, were considered
proprietary and were not provided for review. The system vendor did provide
comparisons to MTM-1 using Industrial and textbook studies. The breakdown of
these studies Is as follows:
SOURCE STUDIES
Mattel 6
Xerox 18
Whirlpool 3
Square D 22
Karger & Bayha 25
(textbook)
TOTAL 74
The studies relating to Mattel and Xerox, were developed by company analysts
and provided to CUE developers. The studies relating to Whirlpool, Square D,
and textbook cases, were produced by the CUE developer.
The TMU values provided from these studies were vised to test the hypothesis as
to whether CUE differs significantly from MTM-1. The study compared 74
samples of CUE values to M3M-1 values. The average length of the operations
studied was 144 TMU for MTM-1 and 144 TMJ for CUE. Using the student "t" test
for matched-pair observations, the hypothesis that the accuracy of CUE will
not deviate greater than ±5% when compared to MTM-l was tested (see Table 40).
A confidence level of 95% was used to obtain the critical region of T < 1.96
and T > 1.9G, with 73 degrees of freedom.
Calculations for the "t" test statistic gave a value of 1.59, which fell
within the range -1.96 < t < 1.96. Therefore, from the data provided, it can
be concluded that the accuracy of CUE does not deviate greater than ±5% at the
95% confidence level, when compared to MTM-l, shown in Ikble 40.
-282-
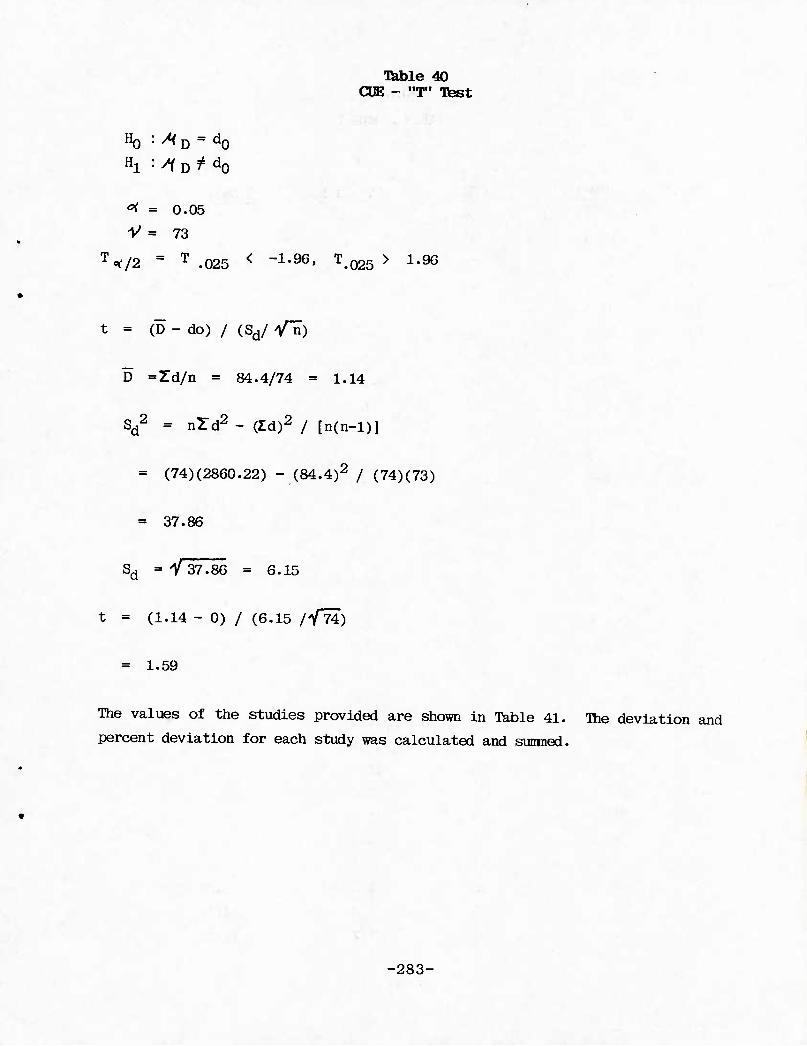
Table 40 CUE - "T" Test
HQ :/<D = d0 Hl :A D ^ d0
^ = 0.05
V = 73
%/2 = T .025 < -1-96' T.025 > i-96
t = (D - do) / (Sd/ V^)
D =Zd/n = 84.4/74 = 1.14
Sd2 = nXd2 - (Zd)2 / [n(n-l)]
= (74)(2860.22) - (84.4)2 / (74)(73)
= 37.86
Sd = Y 37.86 = 6.15
t = (1.14 - 0) / (6.15 /V74)
= 1.59
The values of the studies provided are shown in Table 41. The deviation and
percent deviation for each study was calculated and sumned.
-283-
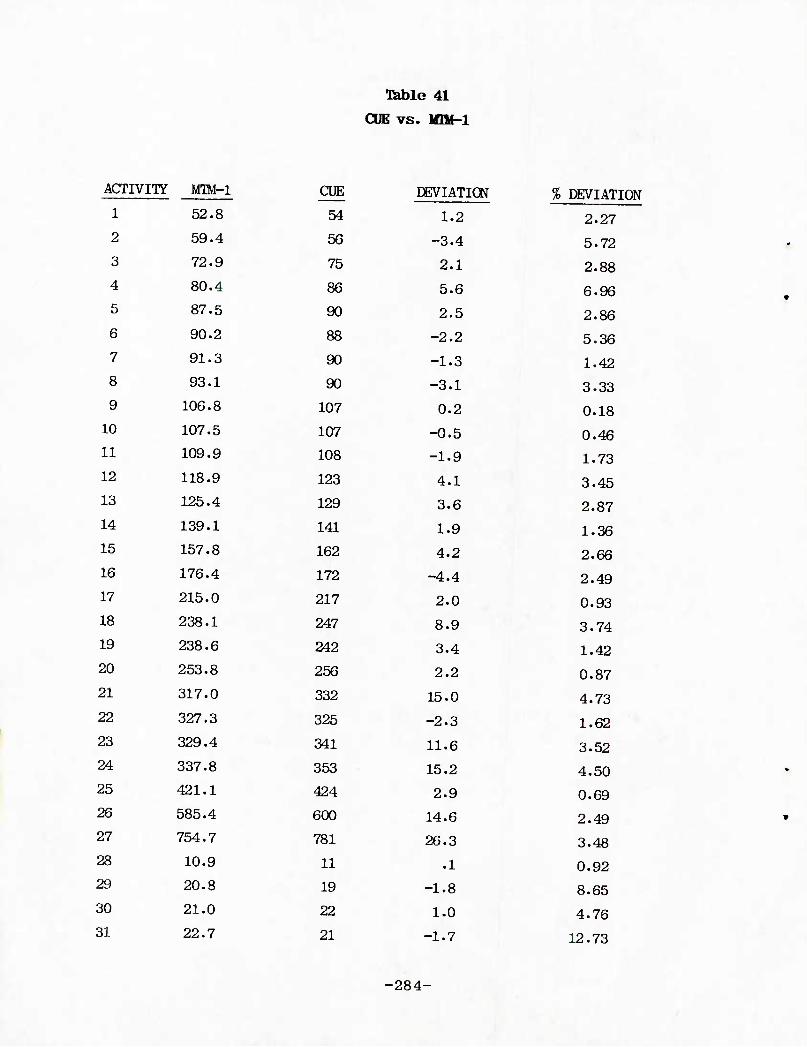
Table 41
CUE vs. lOM-l
ACTIVITy IfflM-l CUE DEVIATION % DEVIATION 1 52.8 54 1.2 2.27 2 59.4 56 -3.4 5.72 3 72.9 75 2.1 2.88 4 80.4 86 5.6 6.96 5 87.5 90 2.5 2.86 6 90.2 88 -2.2 5.36 7 91.3 90 -1.3 1.42 8 93.1 90 -3.1 3.33 9 106.8 107 0.2 0.18
10 107.5 107 -0.5 0.46 11 109.9 108 -1.9 1.73 12 118.9 123 4.1 3.45 13 125.4 129 3.6 2.87 14 139.1 141 1.9 1.36 15 157.8 162 4.2 2.66 16 176.4 172 -4.4 2.49 17 215.0 217 2.0 0.93 18 238.1 247 8.9 3.74 19 238.6 242 3.4 1.42 20 253.8 256 2.2 0.87 21 317.0 332 15.0 4.73 22 327.3 325 -2.3 1.62 23 329.4 341 11.6 3.52 24 337.8 353 15.2 4.50 25 421.1 424 2.9 0.69 26 585.4 600 14.6 2.49 27 754.7 781 26.3 3.48 28 10.9 11 .1 0.92 29 20.8 19 -1.8 8.65 30 21.0 22 1.0 4.76 31 22.7 21 -1.7 12.73
-284-
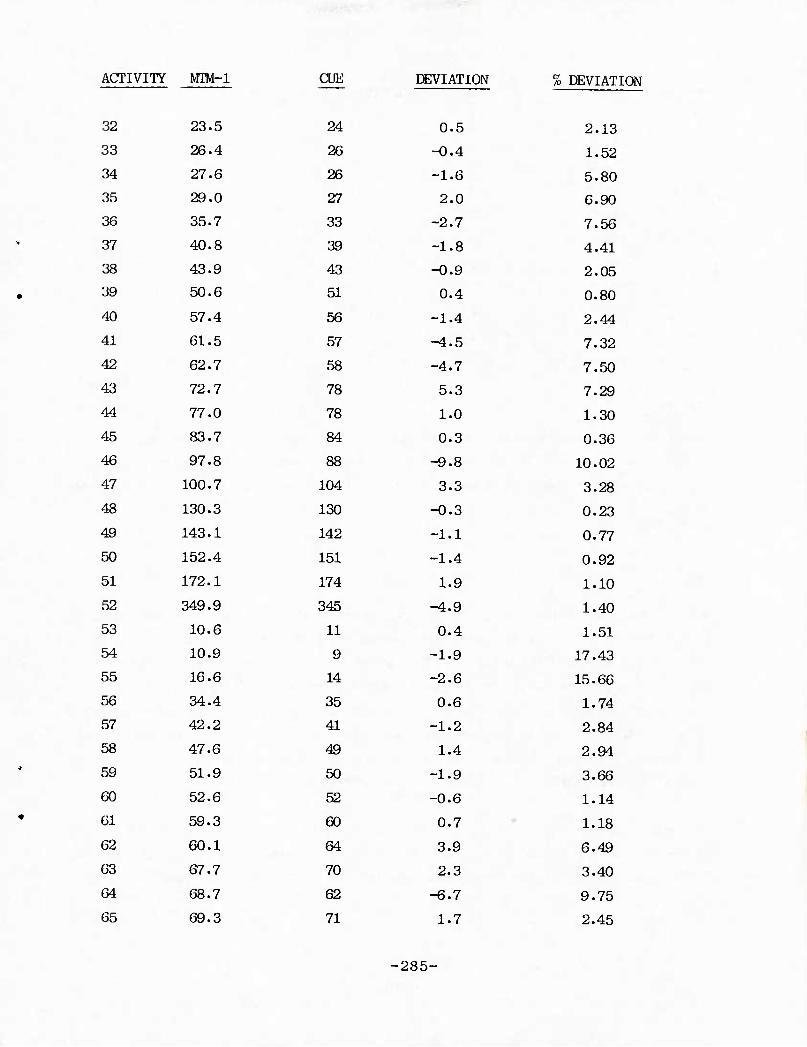
ACTIVITY IflM-l
32 23.5
33 26.4
34 27.6
35 29.0
36 35.7
37 40.8
38 43.9
39 50.6
40 57.4
41 61.5
42 62.7
43 72.7
44 77.0
45 83.7
46 97.8
47 100.7
48 130.3
49 143.1
50 152.4
51 172.1
52 349.9
53 10.6
54 10.9
55 16.6
56 34.4
57 42.2
58 47.6
59 51.9
60 52.6
61 59.3
62 60.1
63 67.7
64 68.7
65 69.3
CUE
24
26
26
27
33
39
43
51
56
57
58
78
78
84
88
104
130
142
151
174
345
11
9
14
35
41
49
50
52
60
64
70
62
71
DEVIATION
0 .5
-0 .4
-1 .6
2 .0
-2 .7
-1 .8
-0 .9
0.4
-1 .4
-4 • 5
-4.7
5 .3
1 .0
o. .3 -9 .8
3 .3
-0 .3
-1. .1
-1 .4
1. .9
-4. .9
0.4
-1. .9
-2. .6
0. .6
-1. .2
1. .4
-1. 9
-0. 6
0. 7
3. 9
2. 3
-6. .7
1. 7
1o DEVIATION
2.13
1.52
5.80
6.90
7.56
4.41
2.05
0.80
2.44
7.32
7.50
7.29
1.30
0.36
10.02
3.28
0.23
0.77
0.92
1.10
1.40
1.51
17.43
15.66
1.74
2.84
2.94
3.66
1.14
1.18
6.49
3.40
9.75
2.45
-285-
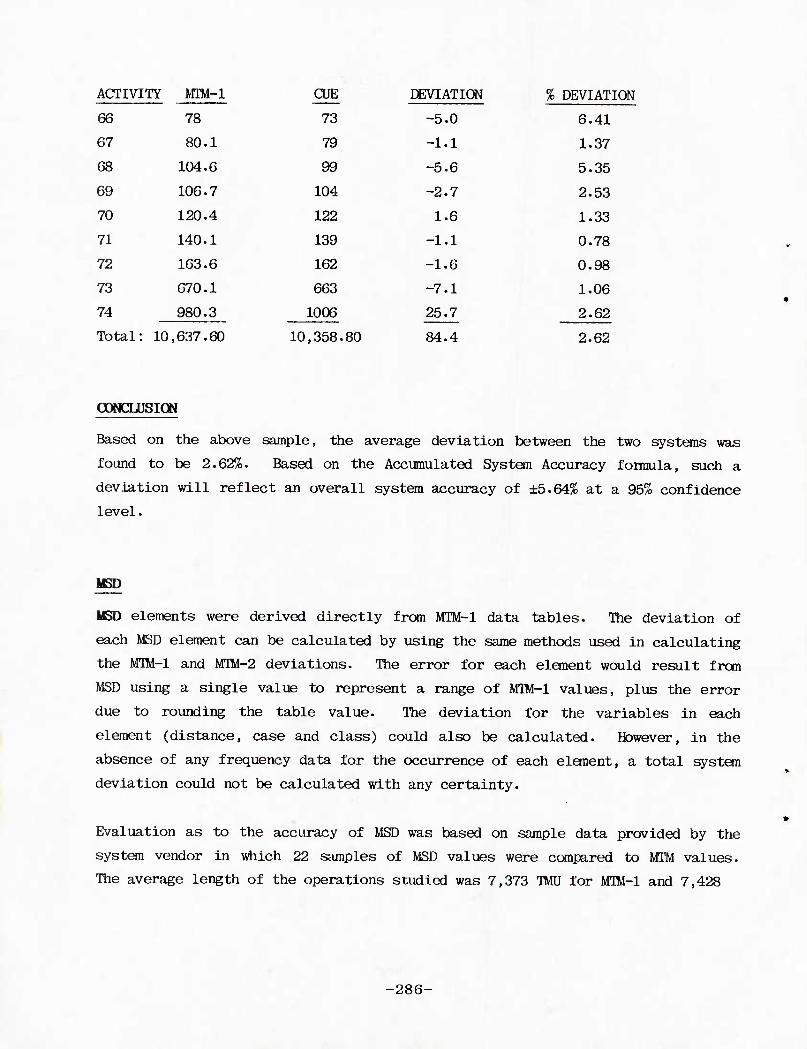
ACTIVITY IflM-l CUE DEVIATION % DEVIATION
66 78 73 -5.0 6.41
67 80.1 79 -1.1 1.37
68 104.6 99 -5.6 5.35
69 106.7 104 -2.7 2.53
70 120.4 122 1.6 1.33
71 140.1 139 -1.1 0.78
72 163.6 162 -1.6 0.98
73 670.1 663 -7.1 1.06
74 980.3 1006 25.7 2.62
Total: 10 ,637.60 10,358.80 84.4 2.62
oowcmsiow
Based on the above sample, the average deviation between the two systems was
found to be 2.62%. Based on the Accumulated System Accuracy foiroula, such a
deviation will reflect an overall system accuracy of ±5.64% at a 95% confidence
level.
MED
USD elements were derived directly from MTM-1 data tables. The deviation of
each MSD element can be calculated by using the same methods used in calculating
the MlM-l and WIM-2 deviations. The error for each element would result from
MSD using a single value to represent a range of MTM-1 values, plus the error
due to rounding the table value. The deviation for the variables in each
element (distance, case and class) could also be calculated. However, in the
absence of any frequency data for the occurrence of each element, a total system
deviation could not be calculated with any certainty.
Evaluation as to the accuracy of MSD was based on sample data provided by the
system vendor in which 22 samples of MSD values were compared to MTM values.
The average length of the operations studied was 7,373 TMU for MTM-1 and 7,428
-286-
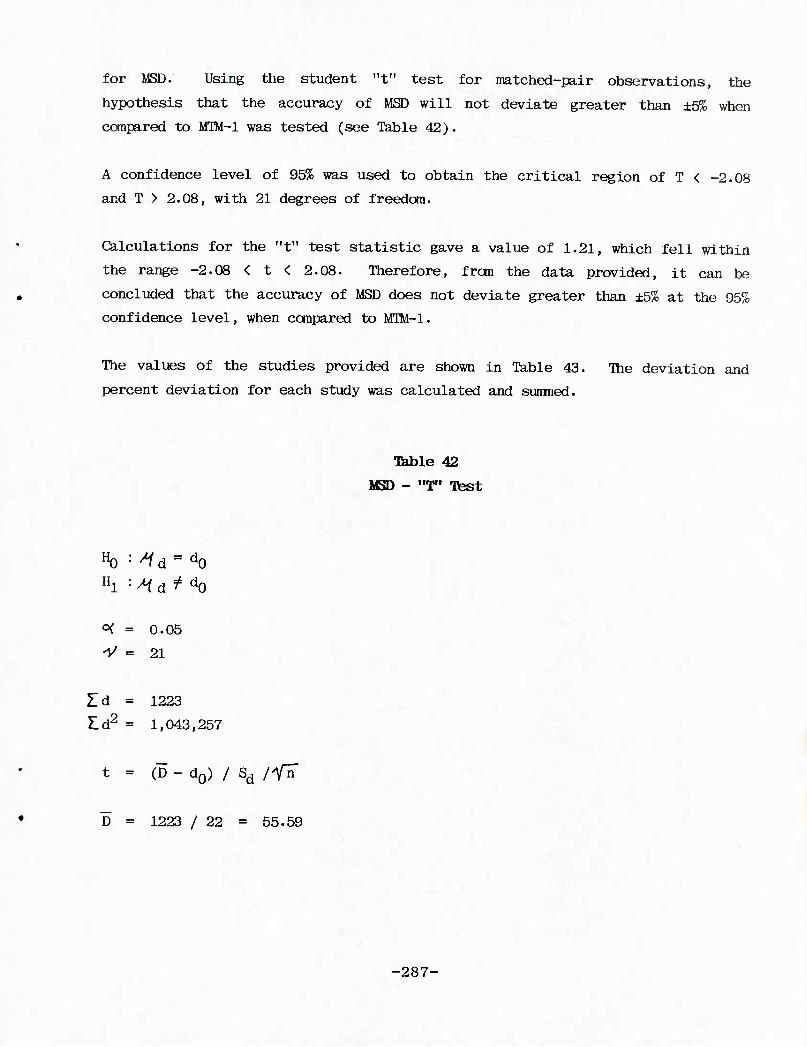
for MSD. Using the student "t" test for raatched-pair observations, the
hypothesis that the accuracy of MSD will not deviate greater than ±5% when
compared to MTM-l was tested (see Table 42).
A confidence level of 95% was used to obtain the critical region of T < -2.08
and T > 2.08, with 21 degrees of freedom.
Calculations for the "t" test statistic gave a value of 1.21, which fell within
the range -2.08 < t < 2.08. Therefore, from the data provided, it can be
concluded that the accuracy of MSD does not deviate greater than ±5% at the 95%
confidence level, when compared to MTM-1.
The values of the studies provided are shown in Table 43. The deviation and
percent deviation for each study was calculated and sunmed.
Table 42
MSD - "T" Ttest
"0 :^d = d0 Hl : ^ d ^ d0
^ = 0.05
V = 21
Id = 1223
£d2 = 1,043,257
t = (D - d0) / Sd ffZ
D = 1223 / 22 = 55.59
-287-
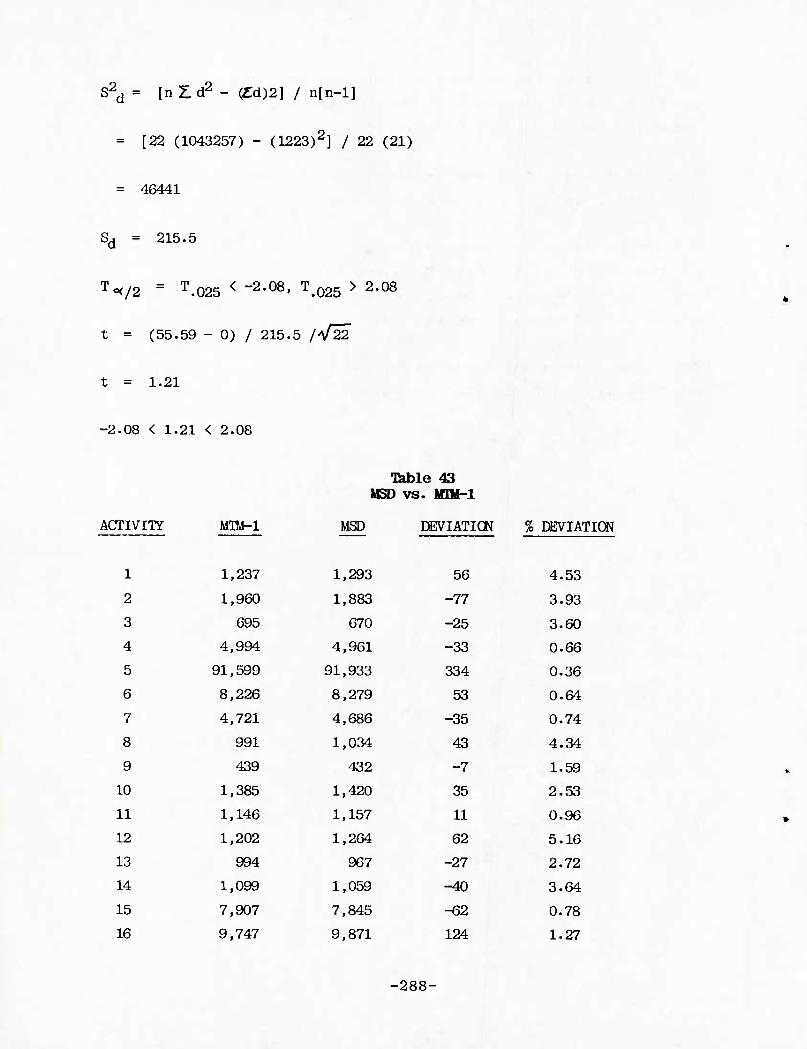
S2d = [nZd2 - (Cd)2] / n[n-l]
= [22 (1043257) - (1223)2] / 22 (21)
= 46441
Sd = 215.5
To</2 ~ T.025 < ~2-08> T.025 > 2'08
t = (55.59 - 0) / 215.5 /V22
t - 1.21
-2.08 < 1.21 < 2.08
ACTIVIIY wm-i
1 1,237
2 1,960
3 695
4 4,994
5 91,599
6 8,226
7 4,721
8 991
9 439
10 1,385
11 1,146
12 1,202
13 994
14 1,099
15 7,907
16 9,747
Table 43 IKD vs. MTM-l
MSD DEVIATION % DEVIATION
1,293 56 4.53
1,883 -77 3.93
670 -25 3.60
4,961 -33 0.66
91,933 334 0.36
8,279 53 0.64
4,686 -35 0.74
1,034 43 4.34
432 -7 1.59
1,420 35 2.53
1,157 11 0.96
1,264 62 5.16
967 -27 2.72
1,059 -40 3.64
7,845 -62 0.78
9,871 124 1.27
-288-
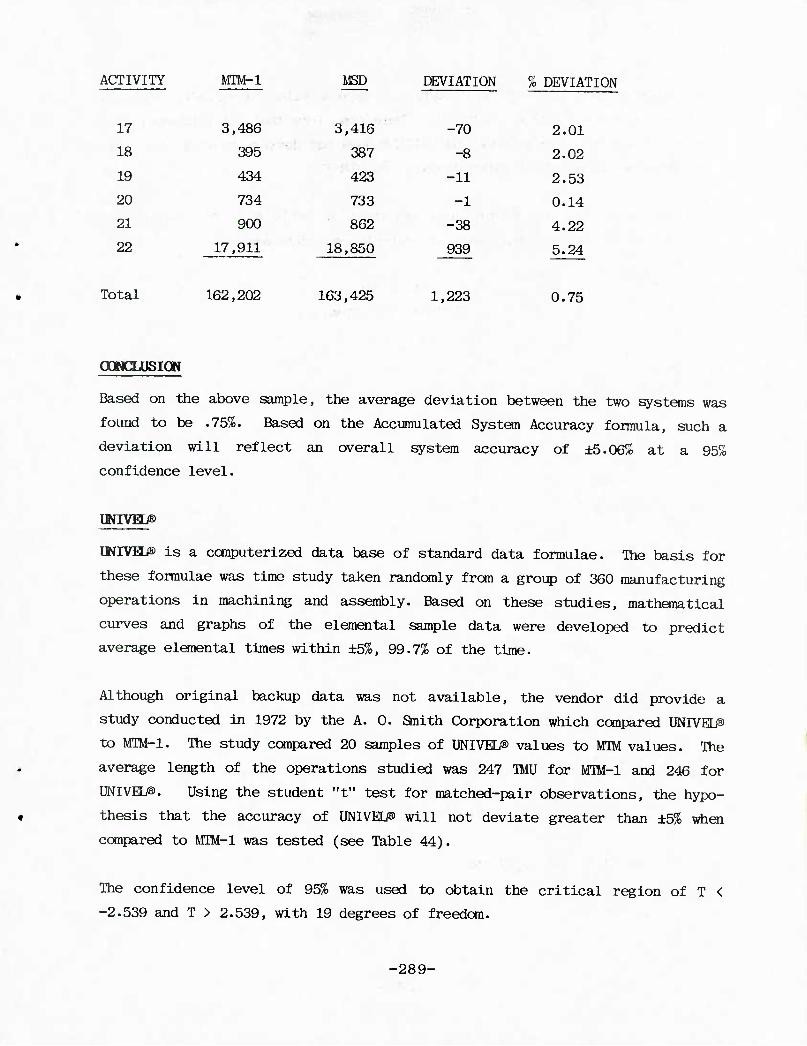
ACTIVITY MTM-1 MSD DEVIATION % DEVIATION
17 3,486 3,416 ■
-70 2.01
18 395 387 -8 2.02
19 434 423 -11 2.53
20 734 733 -1 0.14
21 900 862 -38 4.22
22 17,911 18,850 939 5.24
Total 162,202 163,425 1,223 0.75
OOMCLUSION
Based on the above sample, the average deviation between the two systems was
found to be .75%. Based on the Accumulated System Accuracy formula, such a
deviation will reflect an overall system accuracy of ±5.06% at a 95%
confidence level.
IWrVHi® is a conputerized data base of standard data formulae. Ihe basis for
these formulae was time study taken randomly from a group of 360 manufacturing
operations in machining and assembly. Based on these studies, mathematical
curves and graphs of the elemental sample data were developed to predict
average elemental times within ±5%, 99.7% of the time.
Although original backup data was not available, the vendor did provide a
study conducted in 1972 by the A. 0. anith Corporation which compared UNIVED®
to MTM-1. The study compared 20 samples of UNIVEL^ values to MTM values. The
average length of the operations studied was 247 TMU for MTM-1 and 246 for
UNIVEL®. Using the student "t" test for matched-pair observations, the hypo-
thesis that the accuracy of UNIVEL/® will not deviate greater than ±5% when
conpared to MIM-l was tested (see Table 44).
The confidence level of 95% was used to obtain the critical region of T <
-2.539 and T > 2.539, with 19 degrees of freedom.
•289-
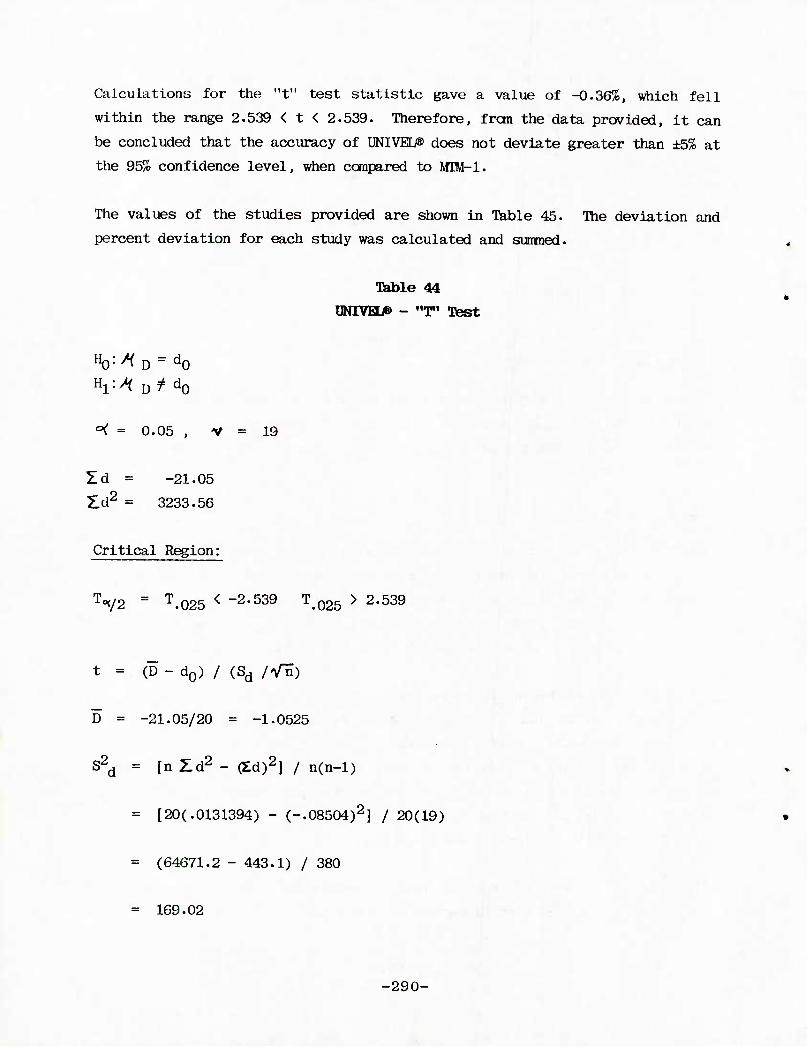
Calculations for the "t" test statistic gave a value of -0.36%, which fell
within the range 2.539 < t < 2.539. Therefore, from the data provided, it can
be concluded that the accuracy of UNIVEL/® does not deviate greater than ±5% at
the 95% confidence level, when compared to MTM-1.
The values of the studies provided are shown in Table 45. The deviation and
percent deviation for each study was calculated and surrmed.
Table 44
UNIVHJ8> - "T" Test
H0:AD = d0 Hl:>( D^d0
<=< - 0.05 , V = 19
Zd = -21.05
£d2 = 3233.56
Critical Region:
TV2 = T.025 < -2-539 T.025 > 2-539
t = (D - d0) / (Sd /Vn)
D = -21.05/20 = -1.0525
S2d = [nZd2 - (Zd)2] / n(n-l)
= [20(.0131394) - (-.08504)2] / 20(19)
= (64671.2 - 443.1) / 380
= 169.02
-290-
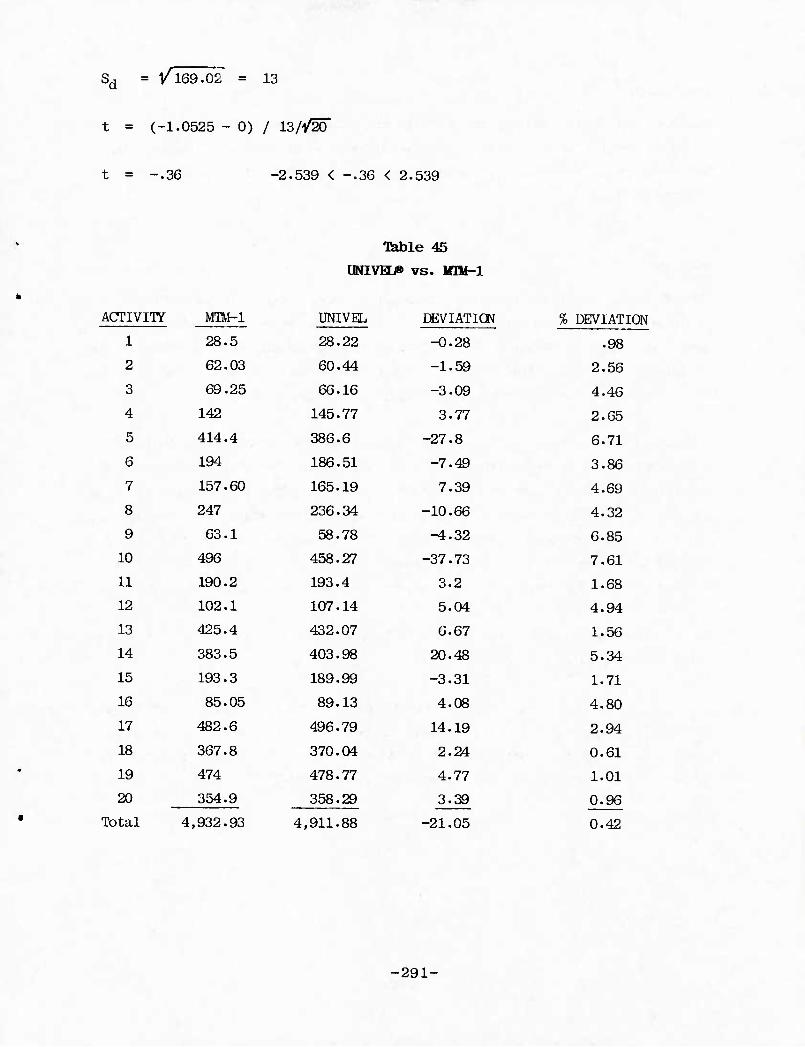
Sd = V 169.02 = 13
t = (-1.0525 - 0) / 13/V20
t - -.36 -2.539 < -.36 < 2.539
Table 45
UMIVFI/» vs. MTM-1
ACTIVITY M3M-1
28.5
UNIVEL
28.22
DEVIATION
-0.28
% DEVIATION
1 .98
2 62.03 60.44 -1.59 2.56
3 69.25 66.16 -3.09 4.46
4 142 145.77 3.77 2.65
5 414.4 386.6 -27.8 6.71
6 194 186.51 -7.49 3.86
7 157.60 165.19 7.39 4.69
8 247 236.34 -10.66 4.32
9 63.1 58.78 ^.32 6.85
10 496 458.27 -37.73 7.61
11 190.2 193.4 3.2 1.68
12 102.1 107.14 5.04 4.94
13 425.4 432.07 6.67 1.56
14 383.5 403.98 20.48 5.34
15 193.3 189.99 -3.31 1.71
16 85.05 89.13 4.08 4.80
17 482.6 496.79 14.19 2.94
18 367.8 370.04 2.24 0.61
19 474 478.77 4.77 1.01
20 354.9 358.29 3.39 0.96
Total 4,932.93 4,911.88 -21.05 0.42
-291-
OOMCIiJSICW
Based on the above sample, the average deviation between the two systems was
found to be 0.42%. Based on the Accumulated System Accuracy formula, such a
deviation will reflect an overall system accuracy of ±5.02% at a 95%
confidence level.
MODAFTS"
MCDAFTS" was based on research findings of the Australian Association for
Predetermined Time Standards and Research. Basic motion time elements were
developed from time study and existing predetermined time systans. The
"modularity" of the system refers to the findings that all hand, arm, foot and
body motions can be expressed as multiples of finger motions.
Although the results of a study which established the accuracy of the MODAPTS"
system would not be released by the firm conducting the study, the vendor did
provide data which compared MODAPTS" to MTM-1. The study compared five
samples of MODAPTS'" values. The average length of the operations studied was
689 TMU for MTM-1 and 730 TMU for MODAPTS"'. Using the student "t" test for
matched-pair observations, the hypothesis that the accuracy of MODAPTS" will
not deviate greater than ±5% when conpared to MTM-1 was tested (see Table 46).
A confidence level of 95% was used to obtain the critical region of T < -2.776
and T > 2.776, with 4 degrees of freedom.
Calculations for the "t" test statistic gave a value of 2.235, which fell
within the range -2.776 < t < 2.776. Therefore, from the data provided, it
can be concluded that the accuracy of MODAPTS" does not deviate greater than
±5% at the 95% confidence level, when compared to MTM-1.
-292-
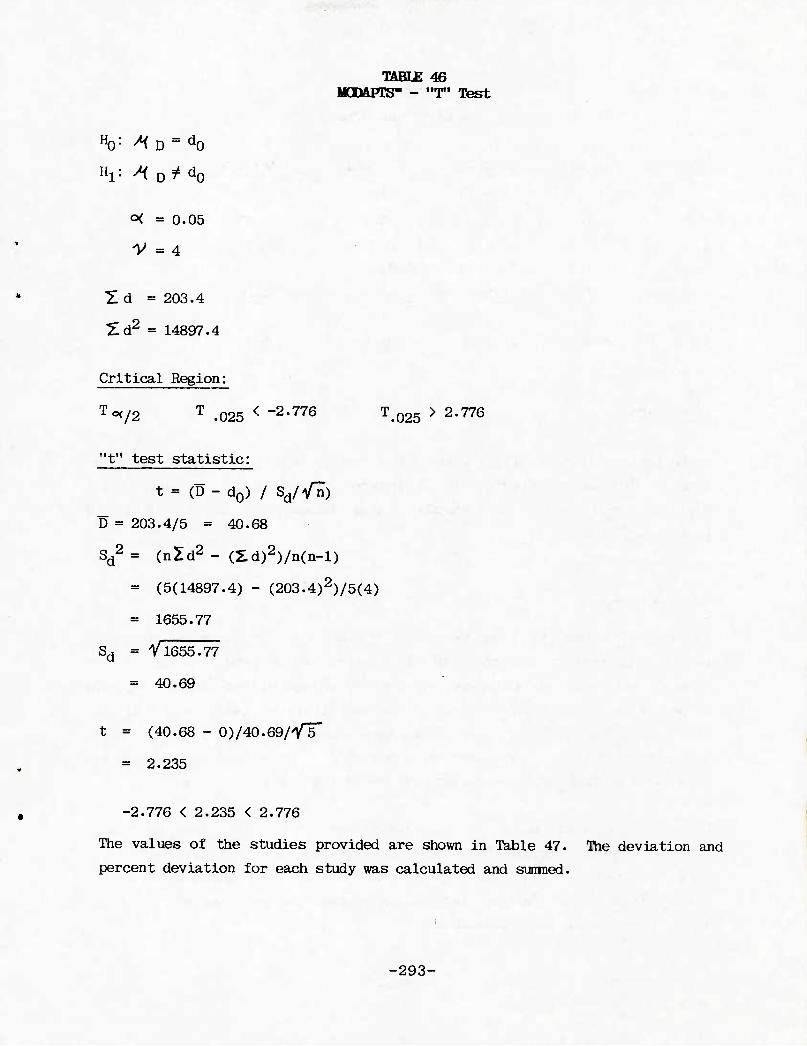
TABLE 46 MCDAFTS- - "T" "test
%= ^D = d0
Hl: ^D ̂ d0
o< = 0.05
V = 4
T d = : 203.4
Z. d2 = : 14897.4
Critical Region:
To* /2 T .025 < ~2'
"t" test statistic:
T.025 > 2-776
t = (D - d0) / Sd/V^)
D = 203.4/5 ■ 40.68
Sd2 = (nZd2 - (2:d)2)/n(n-l)
= (5(14897.4) - (203.4)2)/5(4)
= 1655.77
Sd = V1655.77
= 40.69
t = (40.68 - 0)/40.69/YT'
- 2.235
-2.776 < 2.235 < 2.776
The values of the studies provided are shown in Table 47. The deviation and
percent deviation for each study was calculated and sunmed.
-293-
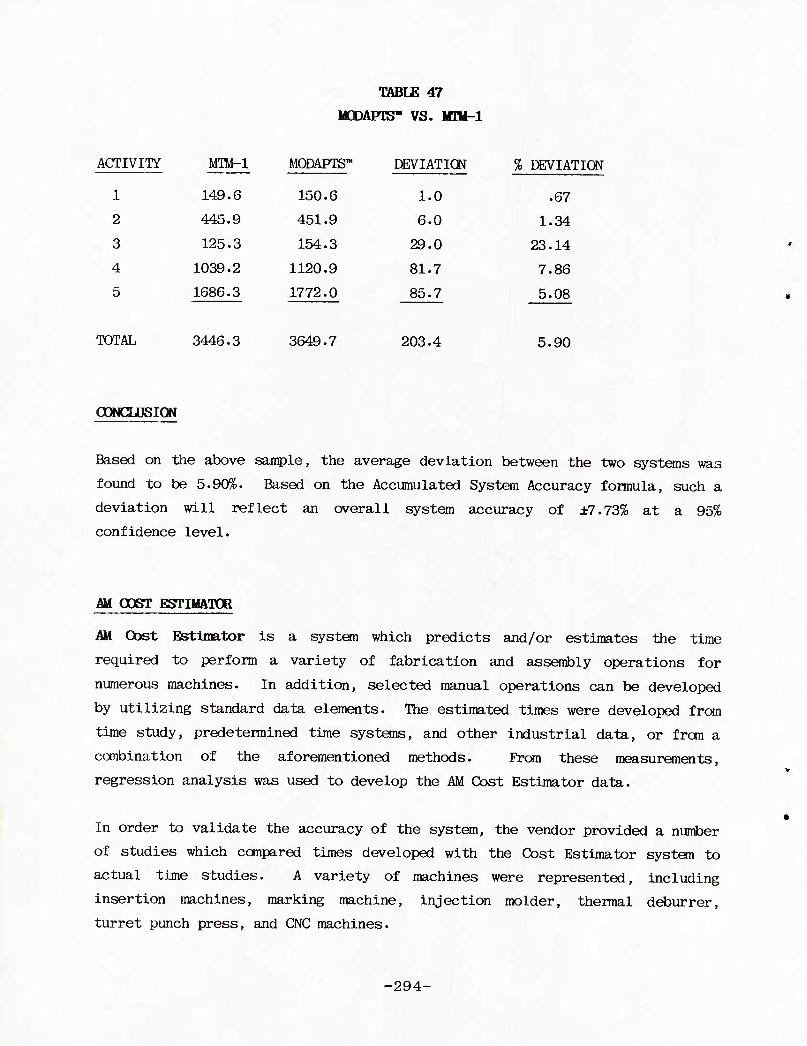
TABLE 47
MODAPTS- VS. IfM-l
ACTIVITY MTM-l MODAPTS" DEVIATICN % DEVIATION
1 149.6 150.6 1.0 .67
2 445.9 451.9 6.0 1.34
3 125.3 154.3 29.0 23.14
4 1039.2 1120.9 81.7 7.86
5 1686.3 1772.0 85.7 5.08
TOTAL 3446.3 3649.7 203.4 5.90
CGNCUJSIGN
Based on the above sample, the average deviation between the two systems was
found to be 5.90%. Based on the Accumulated System Accuracy formula, such a
deviation will reflect an overall system accuracy of ±7.73% at a 95%
confidence level.
AM OQgr ESTIMATOR
AM Cost Estimator is a system which predicts and/or estimates the time
required to perform a variety of fabrication and assembly operations for
numerous machines. In addition, selected manual operations can be developed
by utilizing standard data elements. The estimated times were developed from
time study, predetermined time systems, and other industrial data, or from a
combination of the aforementioned methods. From these measurements,
regression analysis was used to develop the AM Cost Estimator data.
In order to validate the accuracy of the system, the vendor provided a number
of studies which compared times developed with the Cost Estimator system to
actual time studies. A variety of machines were represented, including
insertion machines, marking machine, injection molder, thermal deburrer,
turret punch press, and CNC machines.
-294-
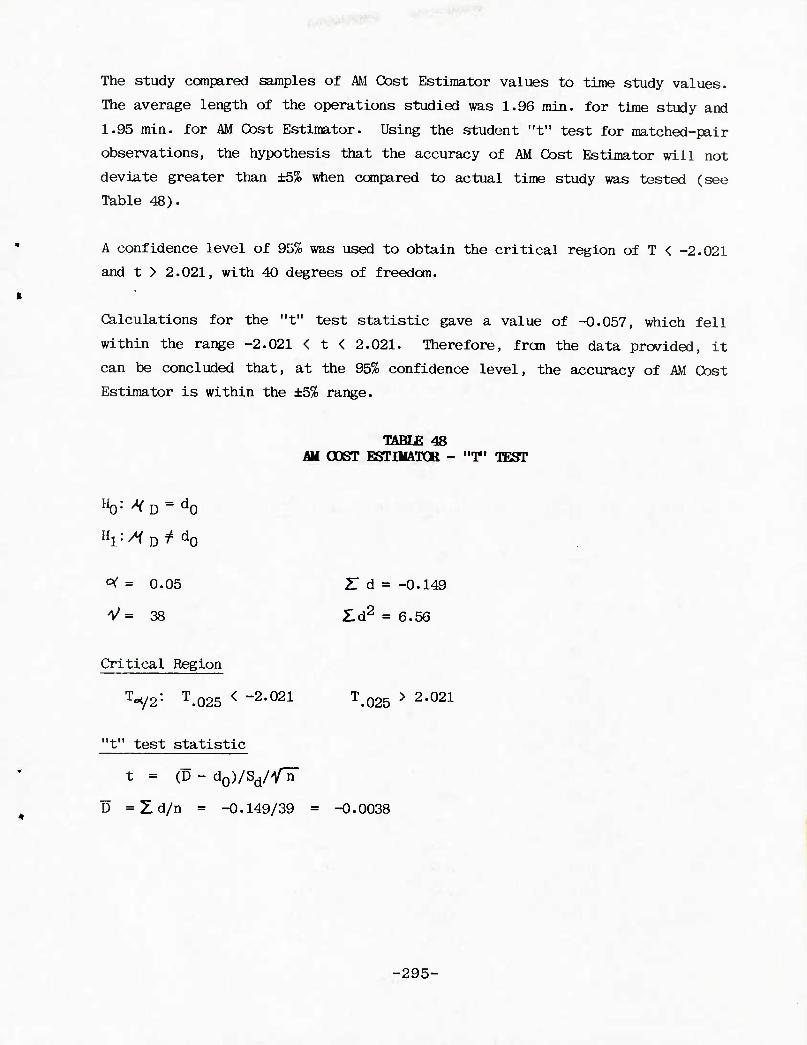
The study compared samples of AM Cost Estimator values to time study values.
The average length of the operations studied was 1.96 min. for time study and
1.95 rain, for AM Cost Estimator. Using the student "t" test for matched-pair
observations, the hypothesis that the accuracy of AM Cost Estimator will not
deviate greater than ±5% when compared to actual time study was tested (see
Table 48).
A confidence level of 95% was used to obtain the critical region of T < -2.021
and t > 2.021, with 40 degrees of freedom.
Calculations for the "t" test statistic gave a value of -0.057, which fell
within the range -2.021 < t < 2.021. Therefore, from the data provided, it
can be concluded that, at the 95% confidence level, the accuracy of AM Cost
Estimator is within the ±5% range.
TABLE 48 AM COST ESmiATCR - "T" TEST
H0: ^D ~ d0 Hl:AD^d0
<* = 0.05 Z d = -0.149
V= 38 £d2 = 6.56
Critical Region
T-</2: T.025 < -2-021 T.025 > 2-021
"t" test statistic
t = (D - d0)/sd/>/T
D =Zd/n = -0.149/39 = -0.0038
-295-
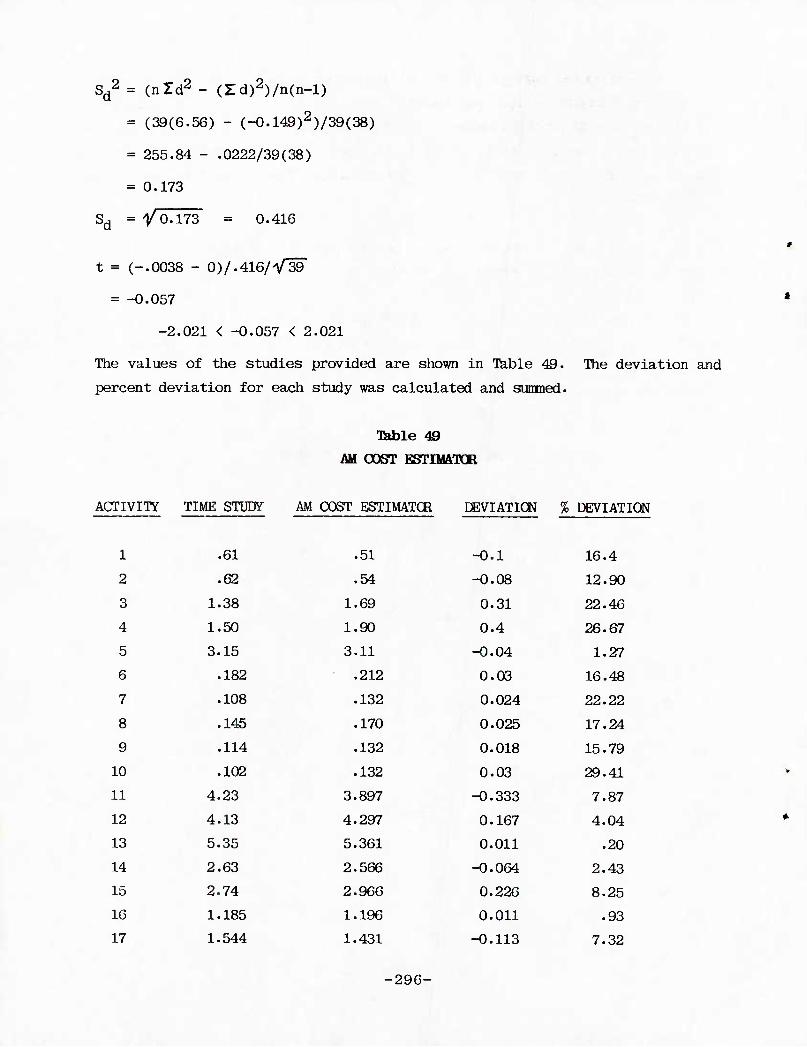
Sd2 = (nld2 - (2:d)2)/n(n-l)
» (39(6.56) - (-0.149)2)/39(38)
= 255.84 - .0222/39(38)
= 0.173
Sd = y0.173 = 0.416
t = (-.0038 - 0)/.416/V39
= -0.057
-2.021 < -0.057 < 2.021
The values of the studies provided are shown in Table 49. The deviation and
percent deviation for each study was calculated and sumned.
Table 49
AM COST ESTIMATOR
ACriVITY TIME STUDY AM COST ESTIMATCR DEVIATION % DEVIATION
1 .61 .51 -0.1 16.4
2 .62 .54 -0.08 12.90
3 1.38 1.69 0.31 22.46
4 1.50 1.90 0.4 26.67
5 3.15 3.11 -0.04 1.27
6 .182 .212 0.03 16.48
7 .108 .132 0.024 22.22
8 .145 .170 0.025 17.24
9 .114 .132 0.018 15.79
10 .102 .132 0.03 29.41
11 4.23 3.897 -0.333 7.87
12 4.13 4.297 0.167 4.04
13 5.35 5.361 0.011 .20
14 2.63 2.566 -0.064 2.43
15 2.74 2.960 0.226 8.25
10 1.185 1.196 0.011 .93
17 1.544 1.431 -0.113 7.32
-296-
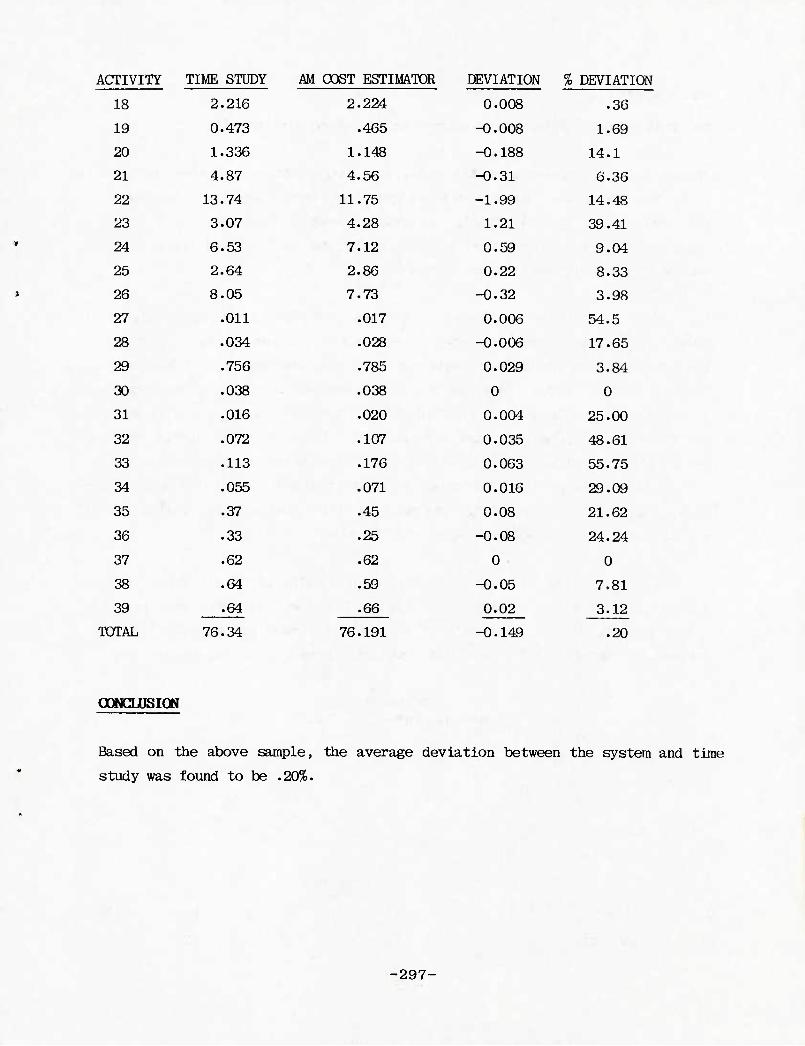
ACTIVITY TIME STUDY AM COST ESTIMATOR DEVIATION % DEVIATION
18 2 .216 2.224 0.008 .36
19 0 .473 .465 -0.008 1.69
20 1 .336 1.148 -0.188 14.1
21 4 .87 4.56 -0.31 6.36
22 13 .74 11.75 -1.99 14.48
23 3 .07 4.28 1.21 39.41
24 6 .53 7.12 0.59 9.04
25 2 .64 2.86 0.22 8.33
26 8 .05 7.73 -0.32 3.98
27 .011 .017 0.006 54.5
28 .034 .028 -0.006 17.65
29 .756 .785 0.029 3.84
30 .038 .038 0 0
31 .016 .020 0.004 25.00
32 .072 .107 0.035 48.61
33 .113 .176 0.063 55.75
34 .055 .071 0.016 29.09
35 .37 .45 0.08 21.62
36 .33 .25 -0.08 24.24
37 .62 .62 0 0
38 .64 .59 -0.05 7.81
39 .64 .66 0.02 3.12
TOTAL 76 .34 76.191 -0.149 .20
OOWCUUSICW
Based on the above sample, the average deviation between the system and time
study was found to be .20%.
-297-
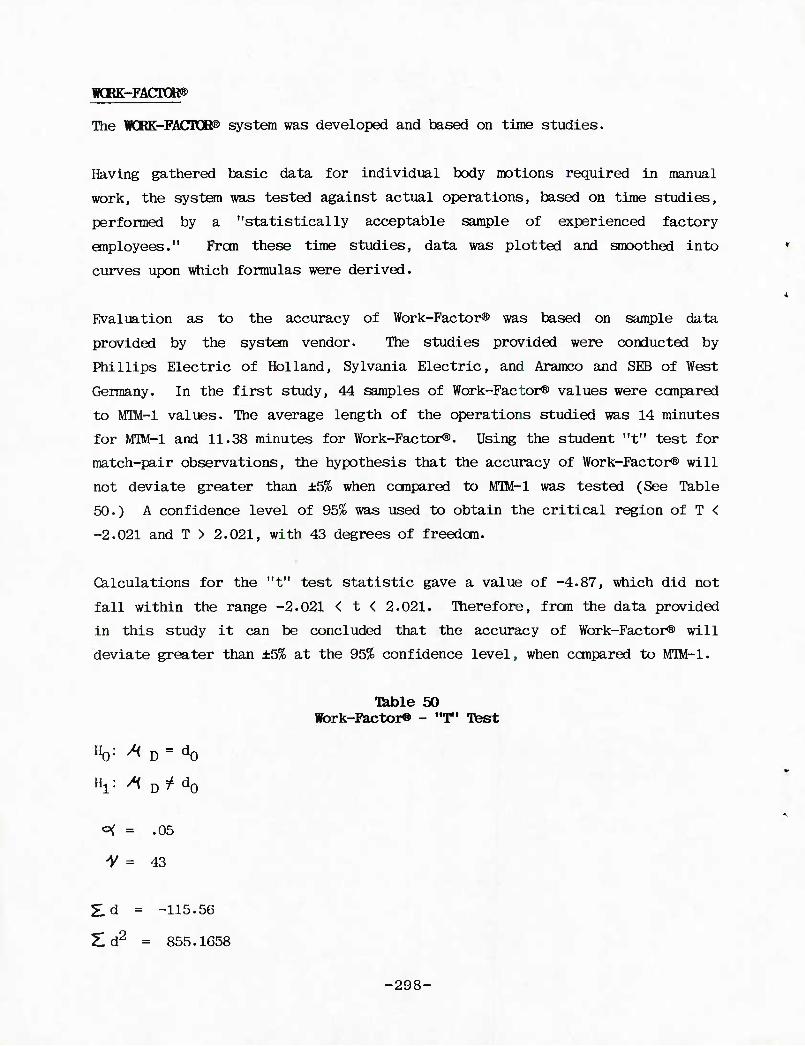
KBK-FACTOBg'
The ICBK-FACPOBS' system was developed and based on tune studies.
Having gathered basic data for individual body notions required in manual
work, the system was tested against actual operations, based on time studies,
performed by a "statistically acceptable sample of experienced factory
employees." Fran these time studies, data was plotted and smoothed into
curves upon which formulas were derived.
Evaluation as to the accuracy of Work-Factor® was based on sample data
provided by the system vendor. The studies provided were conducted by
Phillips Electric of Holland, Sylvania Electric, and Aramco and SEE of West
Germany. In the first study, 44 samples of Work-Factor® values were ccmpared
to M1M-1 values. The average length of the operations studied was 14 minutes
for MTM-1 and 11.38 minutes for Work-Factor®. Using the student "t" test for
match-pair observations, the hypothesis that the accuracy of Work-Factor® will
not deviate greater than ±5% when ccmpared to MIM-l was tested (See Table
50.) A confidence level of 95% was used to obtain the critical region of T <
-2.021 and T > 2.021, with 43 degrees of freedcrn.
Calculations for the "t" test statistic gave a value of -4.87, which did not
fall within the range -2.021 < t < 2.021. Therefore, fran the data provided
in this study it can be concluded that the accuracy of Work-Factor® will
deviate greater than ±5% at the 95% confidence level, when ccmpared to MTM-1.
Table 50 Wbrk-F&ctor® - "T" Test
%: /< D = d0
%: A D^d0
o< = .05
y = 43
Ed = -115.56
Ed2 = 855.1G58
-298-
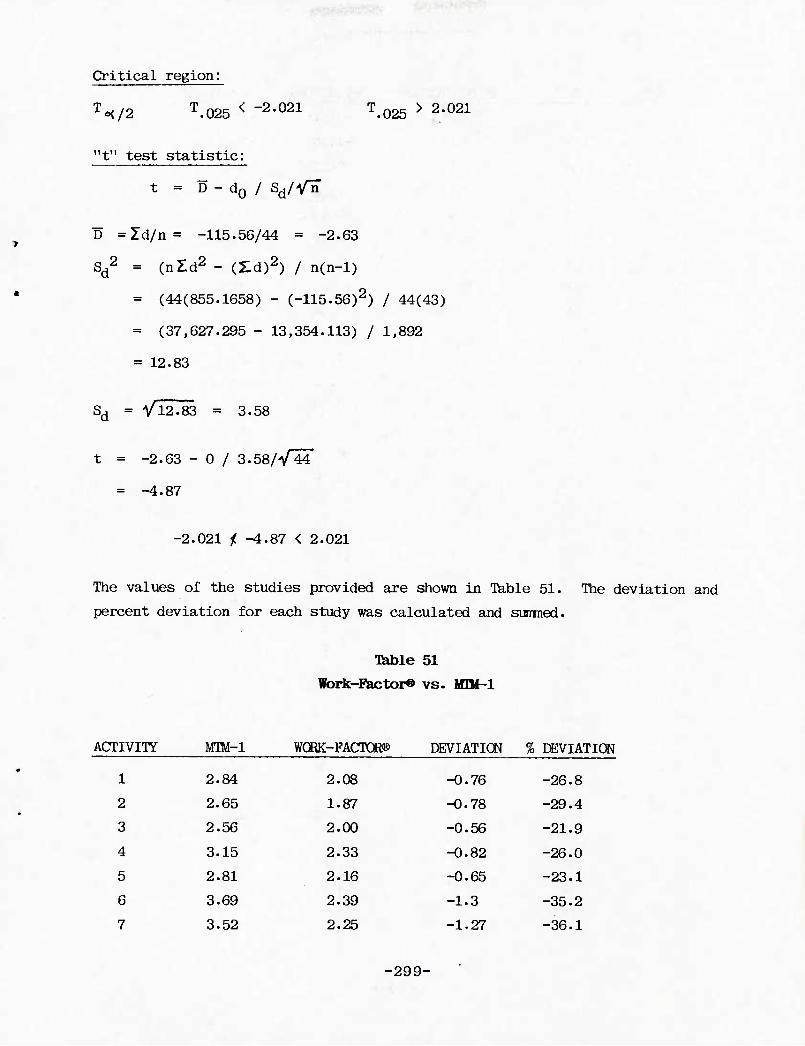
Critical region:
To</2 T.025 < -2-021 T.025 > 2-021
't" test statistic:
t = D - d0 / sd/Anr
D -Zd/n- -115.56/44 = -2.63
Sd2 - (nld2 - (Zd)2) / n(n-l)
= (44(855.1658) - (-115.56)2) / 44(43)
= (37,627.295 - 13,354.113) / 1,892
« 12.83
Sd = V12.83 - 3.58
t = -2.63 - 0 / 3.58/^44
= -4.87
-2.021 i -4.87 < 2.021
The values of the studies provided are shown in Table 51. The deviation and
percent deviation for each study was calculated and sunmed.
TYible 51
Work-Eactor« vs . MITil-l
ACTIVITY MTM-1 WORK-FACTORS DEVIATION % DEVIATION
1 2.84 2.08 -0.76 -26.8
2 2.65 1.87 -0.78 -29.4
3 2.56 2.00 -0.56 -21.9
4 3.15 2.33 -0.82 -26.0
5 2.81 2.16 -0.65 -23.1
6 3.69 2.39 -1.3 -35.2
7 3.52 2.25 -1.27 -36.1
-299-
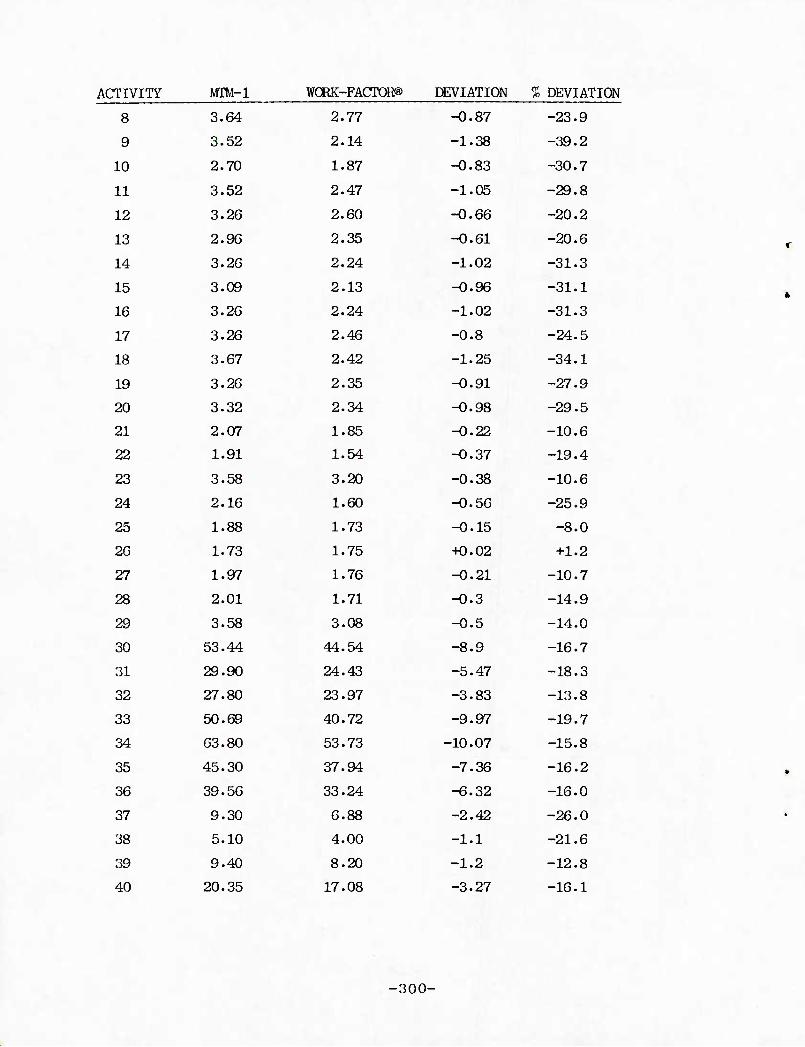
ACTIVITY MTM-1 WORK-FACTOR® DEVIATION % DEVIATION
8 3.64 2.77 -0.87 -23.9
9 3.52 2.14 -1.38 -39.2
10 2.70 1.87 -0.83 -30.7
11 3.52 2.47 -1.05 -29.8
12 3.26 2.60 -0.66 -20.2
13 2.96 2.35 -0.61 -20.6
14 3.26 2.24 -1.02 -31.3
15 3.09 2.13 -0.96 -31.1
16 3.26 2.24 -1.02 -31.3
17 3.26 2.46 -0.8 -24.5
18 3.67 2.42 -1.25 -34.1
19 3.26 2.35 -0.91 -27.9
20 3.32 2.34 -0.98 -29.5
21 2.07 1.85 -0.22 -10.6
22 1.91 1.54 -0.37 -19.4
23 3.58 3.20 -0.38 -10.6
24 2.16 1.60 -0.56 -25.9
25 1.88 1.73 -0.15 -8.0
26 1.73 1.75 +0.02 +1.2
27 1.97 1.76 -0.21 -10.7
28 2.01 1.71 -0.3 -14.9
29 3.58 3.08 -0.5 -14.0
30 53.44 44.54 -8.9 -16.7
31 29.90 24.43 -5.47 -18.3
32 27.80 23.97 -3.83 -13.8
33 50.69 40.72 -9.97 -19.7
34 63.80 53.73 -10.07 -15.8
35 45.30 37.94 -7.36 -16.2
36 39.56 33.24 -6.32 -16.0
37 9.30 6.88 -2.42 -26.0
38 5.10 4.00 -1.1 -21.6
39 9.40 8.20 -1.2 -12.8
40 20.35 17.08 -3.27 -16.1
-300-
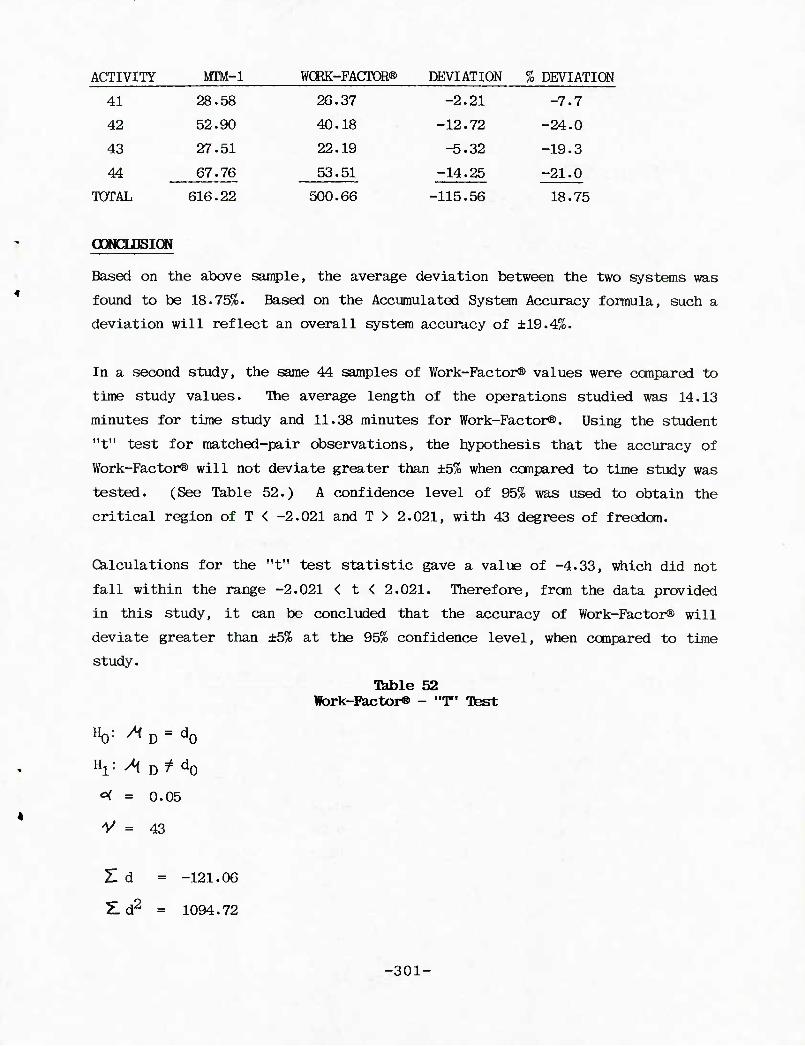
ACTIVITY MTM-1 WCRK-FACTOR® DEVIATION % DEVIATION
41 28.58 26.37 -2.21 -7.7
42 52.90 40.18 -12.72 -24.0
43 27.51 22.19 -5.32 -19.3
44 67.76 53.51 -14.25 -21.0
TOTAL 616.22 500.66 -115.56 18.75
OONCLDSION
Based on the above sample, the average deviation between the two systems was
found to be 18.75%. Based on the Accumulated System Accuracy formula, such a
deviation will reflect an overall system accuracy of ±19.4%.
In a second study, the same 44 samples of Work-Factor® values were canpared to
time study values. The average length of the operations studied was 14.13
minutes for time study and 11.38 minutes for Work-Factor®. Using the student
"t" test for matched-pair observations, the hypothesis that the accuracy of
Work-Factor® will not deviate greater than ±5% when canpared to time study was
tested. (See Table 52.) A confidence level of 95% was used to obtain the
critical region of T < -2.021 and T > 2.021, with 43 degrees of freedom.
Cklculations for the "t" test statistic gave a value of -4.33, which did not
fall within the range -2.021 < t < 2.021. Therefore, fron the data provided
in this study, it can be concluded that the accuracy of Work-Factor® will
deviate greater than ±5% at the 95% confidence level, when canpared to time
study.
Tfeible 52 Hork-Fiactor® - "T" Test
Ho: /< D - d0
Hl: -^ D^ d0
^ = 0.05
V = 43
2! d = -121.06
Zd2 = 1094.72
-301-
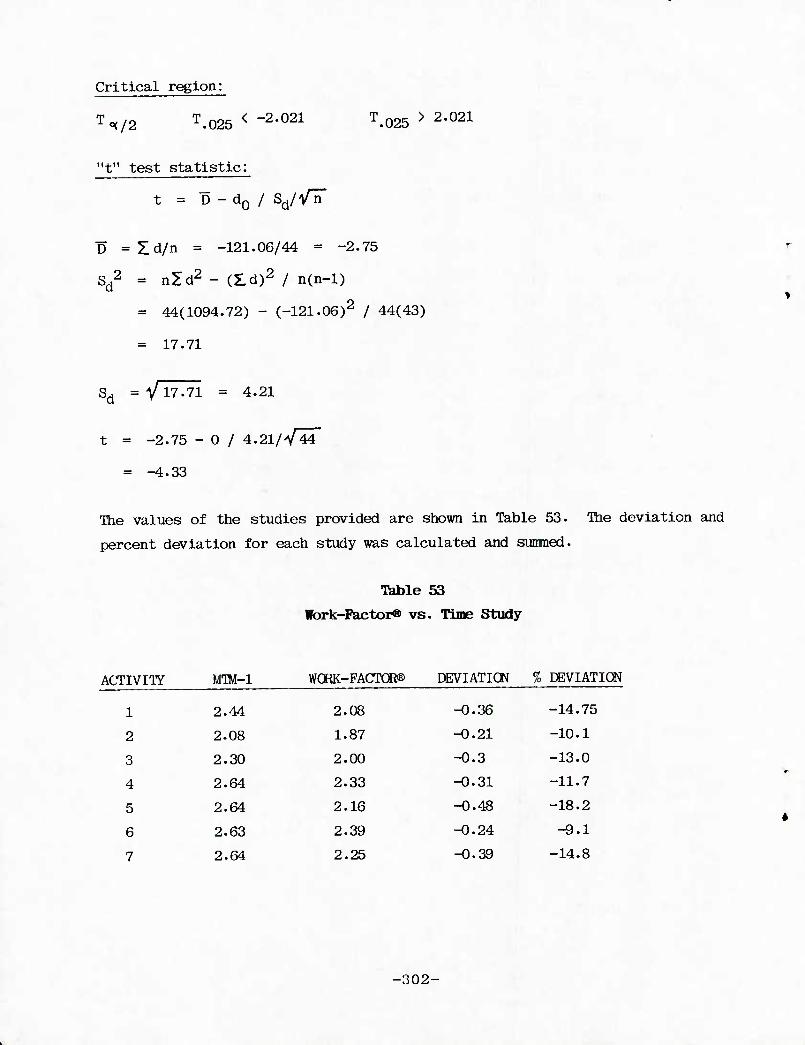
Critical region:
T<x/2 T.025< -2.021 T<025> 2.021
"t" test statistic:
t = D - d0 / sd//r
D =Zd/n = -121.06/44 = -2.75
Sd2 = nld2 - (Ed)2 / n(n-l)
= 44(1094.72) - (-121.06)2 / 44(43)
= 17.71
Sd = V 17-71 = 4.21
t = -2.75 - 0 / 4.21/V44"
= -4.33
The values of the studies provided are shown in Table 53. The deviation and
percent deviation for each study was calculated and sunraed.
Table 53
Work-Eactor® vs . Time Study
ACTIVI1Y MTM-l WORK-FACTOR!© DEVIATION 7o DEVIATION
1 2.44 2.08 -0.36 -14.75
2 2.08 1.87 -0.21 -10.1
3 2.30 2.00 -0.3 -13.0
4 2.64 2.33 -0.31 -11.7
5 2.64 2.16 -0.48 -18.2
6 2.63 2.39 -0.24 -9.1
7 2.64 2.25 -0.39 -14.8
-302-
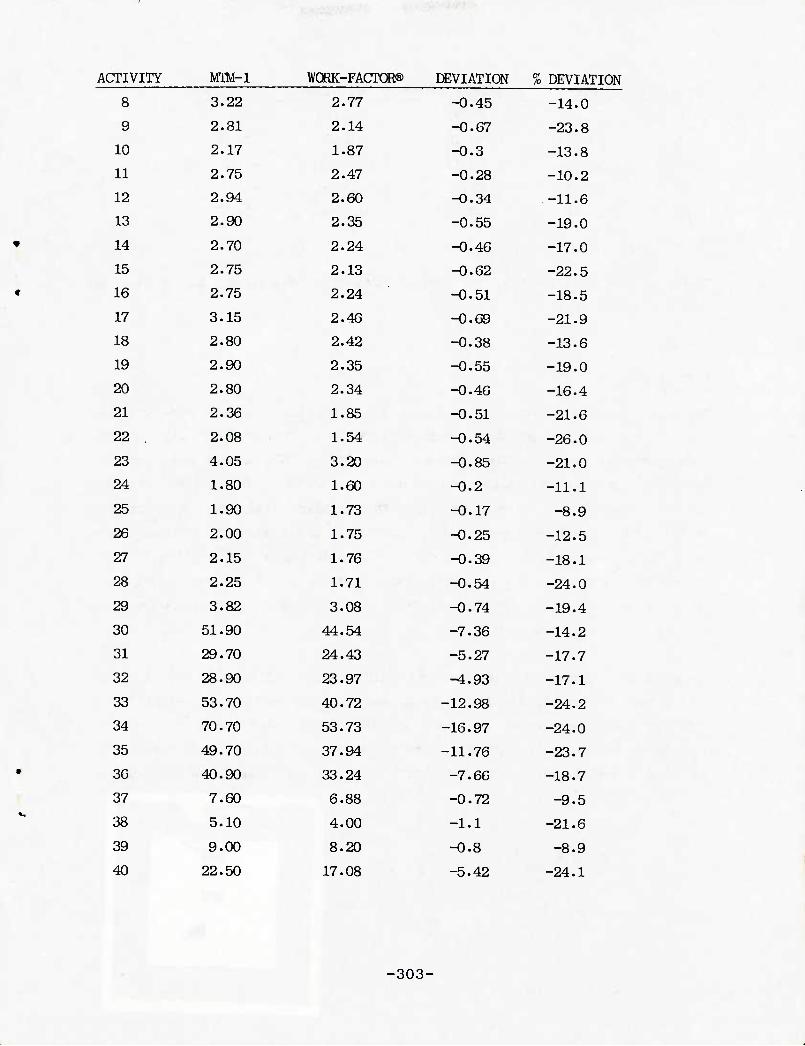
ACTIVITY MTM-1 WORK-FACTOR® DEVIATION % DEVIATION
8 3.22 2.77 -0.45 -14.0
9 2.81 2.14 -0.67 -23.8
10 2.17 1.87 -0.3 -13.8
11 2.75 2.47 -0.28 -10.2
12 2.94 2.60 -0.34 -11.6
13 2.90 2.35 -0.55 -19.0
14 2.70 2.24 -0.46 -17.0
15 2.75 2.13 -0.62 -22.5
16 2.75 2.24 -0.51 -18.5
17 3.15 2.46 -0.69 -21.9
18 2.80 2.42 -0.38 -13.6
19 2.90 2.35 -0.55 -19.0
20 2.80 2.34 -0.46 -16.4
21 2.36 1.85 -0.51 -21.6
22 . 2.08 1.54 -0.54 -26.0
23 4.05 3.20 -0.85 -21.0
24 1.80 1.60 -0.2 -11.1
25 1.90 1.73 -0.17 -8.9
26 2.00 1.75 -0.25 -12.5
27 2.15 1.76 -0.39 -18.1
28 2.25 1.71 -0.54 -24.0
29 3.82 3.08 -0.74 -19.4
30 51.90 44.54 -7.36 -14.2
31 29.70 24.43 -5.27 -17.7
32 28.90 23.97 -4.93 -17.1
33 53.70 40.72 -12.98 -24.2
34 70.70 53.73 -16.97 -24.0
35 49.70 37.94 -11.76 -23.7
36 40.90 33.24 -7.60 -18.7
37 7.60 6.88 -0.72 -9.5
38 5.10 4.00 -1.1 -21.6
39 9.00 8.20 -0.8 -8.9
40 22.50 17.08 -5.42 -24.1
-303-
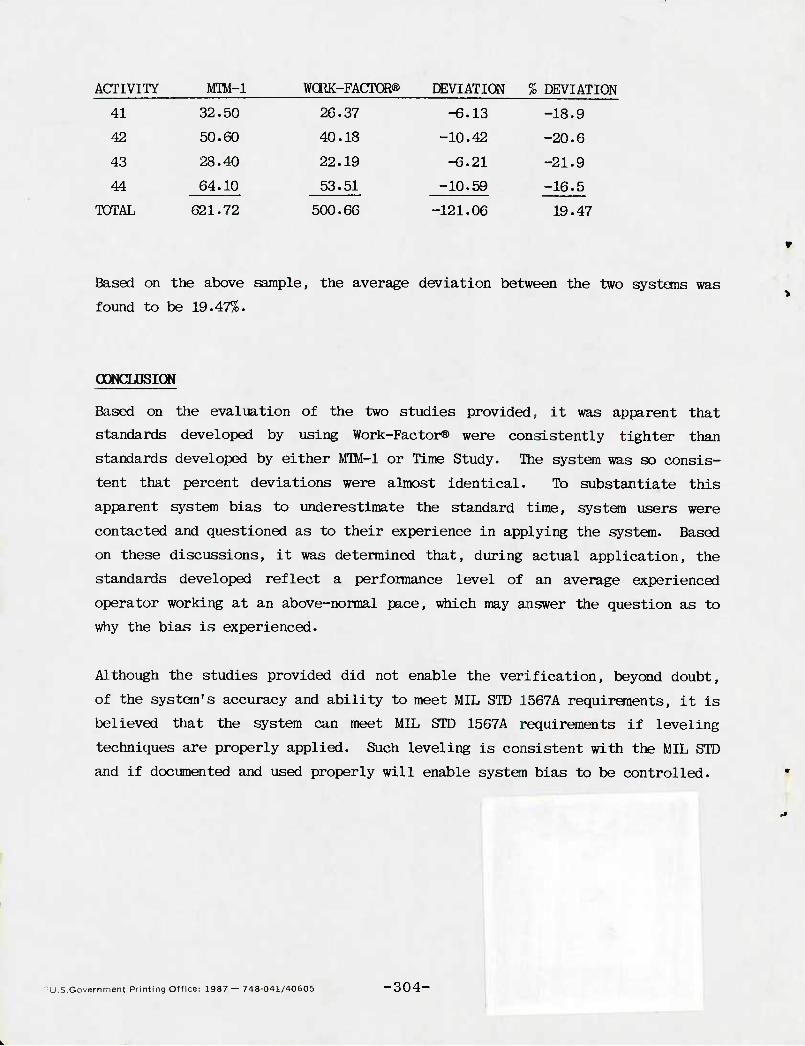
ACTIVITY MTM-1 W(HK-FACrOR<& DEVIATION % DEVIATION
41 32.50 26.37 -6.13 -18.9
42 50.60 40.18 -10.42 -20.6
43 28.40 22.19 -6.21 -21.9
44 64.10 53.51 -10.59 -16.5
TOTAL 621.72 500.66 -121.06 19.47
Based on the above sample, the average deviation between the two systems was
found to be 19.47%.
oowcmsiON
Based on the evaluation of the two studies provided, it was apparent that
standards developed by using Work-Factor® were consistently tighter than
standards developed by either MTM-1 or Time Study. The system was so consis-
tent that percent deviations were almost identical. To substantiate this
apparent system bias to underestimate the standard time, system users were
contacted and questioned as to their experience in applying the system. Based
on these discussions, it was determined that, during actual application, the
standards developed reflect a performance level of an average experienced
operator working at an above-normal pace, which may answer the question as to
why the bias is experienced.
Although the studies provided did not enable the verification, beyond doubt,
of the system's accuracy and ability to meet MIL STD 1567A requirements, it is
believed that the system can meet MIL STD 1567A requirements if leveling
techniques are properly applied. Such leveling is consistent with the MIL STD
and if documented and used properly will enable system bias to be controlled.
U.S.Government Printing Office; 1987 — 748-041/40605 -304-