volume 05 issue 05 may 2022
TRANSCRIPT

International Journal of Multidisciplinary Research andAnalysis is a leading international journal for publication of
new ideas in Multidisciplinary area.
E x p l o r e y o u r R e s e a r c h t o t h e w o r l d . . . . . .
W W W . I J M R A . I N / I N D E X . P H P E M A I L : E D I T O R @ I J M R A . I N
INTERNATIONALJOURNAL OF
MULTIDISCIPLINARYRESEARCH AND
ANALYSIS
ISSN[ONLINE] : 2643-9875 ISSN[PRINT] : 2643-9840
SJIF IMPACT FACTOR : 6.261
CROSSREF DOI10.47191/IJMRA
VOLUME 05 ISSUE 05MAY 2022
IJMRA ASISCORE : 04

International Journal of Multidisciplinary Research and Analysis ISSN[Online] : 2643-9875 ISSN[Print] : 2643-9840
www.ijmra.in
Editorial Team Member
Dr. V. Mohana Sundaram (Ph.D. (Management))
Professor, Department of Management Studies, Vivekanandha Institute of Information and Management Studies.
Dr. Murod Barakaev(Candidate of Pedagogical Sciences(13.00.02 - Methods of teaching mathematics))
Associate Professor of “Mathematics and Methods of Teaching” TSPU named after Nizami
Uzbekistan
Karimov Nodir Rakhmonqulovich (Pursuing Ph. D.)
Ph.D. Student, Tashkent State University of Oriental Studies, Tashkent, Uzbekistan
Tashkent, Uzbekistan
Anshika Bansal (N.E.T,U-SET)
Asst. Professor Department of Commerce,
Govt P.G. College, Kotdwara, Uttarakhand, INDIA
Dr. Dinh Tran Ngoc Huy (MBA (Finance and Management electives))
PhD candidate, Banking University, HCM city
Cach Mang Thang Tam Street, Ward 11, Dist 3, Ho Chi Minh City, Viet Nam
Dr. Islam-ul-Haque (MBA (24 project management subjects- AIOU))
PhD Environmental Engineering and sciences
House No. 12, Al-Ghani Street, IFCOS, Sector D-17, Islamabad
Dr. Alisher Doniyorov (Doctor of Sciences in Historical Sciences)
Professor-Tashkent State University of Oriental studies,Tashkent, Uzbekistan
Tashkent, Uzbekistan
Manish Soni (Ph.D in Computer Science and Application)
Assistant Professor, Department of Computer Science, Govt. P.G College
Mandsaur, India
Dr Bakhodir K. Mirzaev (Doctor of Philosophy in Technical Sciences)
Senior Lecturer, Department of “Manufacture of building materials, products and structures” Fergana Polytechnic Institute
Fergana Region, Kushtepa District
Dr Abdulkhamid R. Yusupov (Technical Sciences)
Associate Professor of the Department of Production of Building Materials, Products and Structures of Fergana Polytechnic Institute
Fergana City, Behbudi Street
Dr Nodira B. Alimova (Doctor of Technical Sciences)
Associate Professor of the Department of "Mechatronics and Robotics", Tashkent State Technical University
Tashkent City, Mirzo Ulugbek
Dr Kuysin D. Tukhtaeva (Doctor of Philological Sciences)
Navoi State Pedagogical Institute, Faculty of Foreign Languages, Associate Professor of English Language and Literature,
Candidate of Philological Sciences
Navoi Region, Navoi City

Dr.Umesh Sehgal(Ph.D. (Computer Science))
Assistant Professor and Department Head (GNA University, Phagwara),Bundelkhand University, Jhansi
India
Dr. Grebenisan Gavril ( PhD. Eng)
Assoc. Prof. University of Oradea, 1 Universitatii str., 410089, Oradea, Romania
Professor Ibrahim Ormanovich Darvishov (Doctor of Philosophy in Philology, (PhD))
Acting Associate Professor of Uzbek Language and Literature, Namangan State University
Namangan Region, Mingbulak District
Professor Abdulvohid Khabibullevich Abdullazizov
Acting Head of the Department of Russian Language and Literature, Namangan State University
Namangan Region, Uychi District
Dr. Bogdan Constantin Ungurean (PhD Biology)
Lector, Faculty of Physical Education and Sport of “Al. I. Cuza” University
Str. Toma Cozma Nr. 3, Iasi 700554, Romania
Dr Kadir Shukurlaev (DCs)
Head of the Department of Physiology and Pathological Physiology, Urgench branch of the Tashkent Medical Academy
Republic Of Karakalpakstan, Amudarya District
Dr Bakhromjon A. Otakulov (Doctor of Philosophy in Technical Sciences)
Senior Lecturer of the department “Manufacture of building materials, products and structures” Fergana Polytechnic Institute
Fergana Region, Fergana District
Dr. Abdirashid M. Babadjanov (Candidate of Economic Sciences)
Associate Professor of the Department “Аccounting and audit” of the Tashkent Institute of irrigation and agricultural engineers.
Tashkent City, Sergeli District
Professor Karimkhodjaev Nazirjon,
Associate Professor of the Andijan Machine-Building Institute. Department of "Avtomotive"
Uzbekistan
Dr. P.Ganesh Kumar (Doctorate(PhD))
Professor in Networking, K.L.N College of Engineering, Anna University
Anna University, Chennai, Tamil Nadu, India, 2009
Dr Durdana E. Lutfullayeva (Doctor of Philological Sciences)
Leading Researcher of the Department of Modern Uzbek Language of the Institute of Uzbek Language, Literature and Folklore of
the Academy of Sciences
Tashkent City, Shayhontohur District
Dr. Rano Kh. Davlatova(Doctor of Philological Sciences)
Head of the Department of Preschool Education, Navoi State Pedagogical Institute
Navoi City, Lomonosova Street
Dr. Gulmira K. Obidova(Ph.D. in Pedagogical Sciences)
Assistant of the Department of Languages and Sports, Fergana Branch,Tashkent University of Information Technologies
Fergana Region, Fergana City
Dr. Md. Amir Hossain (PhD)
Assistant Professor, Department of English IBAIS University (International Business Administration and Information System)
Bangladesh
Dr. Parizod Sh. Turopova(Doctor of Philosophy in Philology)
Senior Lecturer of the department of teaching methods of Uzbek literature of Jizzakh State Pedagogical Institute
Jizzakh City, Uratepalik Mahalla

Dr. Nodira I. Soatova (Philological Sciences)
Associate Professor of the Department of Methods of Teaching Uzbek Literature at Jizzakh State Pedagogical Institute
Sh.Rashidov District, Uzbekistan
Tahir, Nura Musa (B. Eng. (BUK), M Eng. (UTM, Malaysia).)
Department of Mechatronics and System Engineering, Faculty of Engineering and Engineering Technology, Abubakar
TafawaBalewa University, Bauchi,
P.M.B 0248, Bauchi, Bauchi State, Nigeria
Dr. Saida I. Sadiqova(PhD)
Associate Professor of the Department of Internal Medicine No. 2 of the Tashkent Medical Academy
Namangan City, Namangan Region
Dr. Manoj Kumar Rastogi (Ph.D. (Statistics))
Assistant Professor Department of Statistics Patna University,
Department Of Statistics, Patna University, Patna-05, Bihar
Dr. Mourad Hebali (Ph.D. in Electrical Engineering)
Professor Assistant in University Mustapha STAMBOULI Mascara
Mascara 29000, Algeria.
Dr. Shaimardan K. Hudjanov (Candidate of Medical Sciences)
Associate Professor of ENT Diseases, Tashkent Medical Academy
Tashkent Region, Zangiota District
Dr. Devarani Devi Ningombam (Ph. D.Computer Engineering)
Post-doctoral fellow,Department of Information strategy, Electronics and Telecommunications Research Institute (ETRI)
Electronics And Telecommunications Research Institute (ETRI) Dormitory, Gajeong-Dong,Yuseong-Gu, Daejeon 34129, South
Korea
Dr. Shakhnoza Mukhamedjanovna Jalolova (Doctor of Philosophy in Philology)
Acting Associate Professor of English Philology, National University of Uzbekistan named after Mirzo Ulugbek
Tashkent City, Chilanzar District, Kyzyl Sharq District, Uzbekistan
Dr. Suheela Shabir (Doctorate (PhD) in Marketing)
Asst. Prof. in College of Business and Administration in PRINCESS NOURA BINT ABDUL RAHMAN UNIVERSITY, Riyadh
Saudi Arabia
Dr. Abdilatip Abdirakhimovich Sarimsokov (Historical Sciences)
Acting Head of the Department of Archeology, Namangan State University
Namangan City, Porloq MCM, 3rd Micro-District, 3rd House, 8th Apartment
Dr. Dharmendra Singh (PhD, CFP, CFA, Associate-life, UGC-NET)
Assistant Professor, Modern College of Business and Science (MCBS), Sultanate of Oman
Oman
Dr. Ayman Shehata Mohammed Ahmed Osman Mohammed El-Shazly (Ph.D. (Pure Mathematics- Mathematical Analysis
- Complex Analysis))
Lecturer, Department of Mathematics, Faculty of Science, Assiut University, Assiut 71516,
Egypt
Dr. Jamila Sharipovna Jumabayeva (Doctor of Philological Sciences)
Head of the Department of English Philology, Faculty of Foreign Philology, National University of Uzbekistan named after Mirzo
Ulugbek Tashkent
Dr. Lola S. Ortikova (Doctor of Philosophy in Agricultural Sciences)
Lecturer of the Department of Biology Teaching Methods, Jizzakh State Pedagogical Institute
Jizzakh City, Almazar Mahalla,

Farisa T S(M.Tech (CSE))
Digital signal processing, Data Mining, Natural Language Processing INDIA
Dr. G.RakeshP.hd(Computer Science & Application)
Dean of Science JAIRAMS COLLEGE OF ARTS & SCIENCE, KARUR.INDIA
Dr. Shamsiddin A. Allayarov(Ph.D.)(Candidate of Economic Sciences)
Head of the Department of Management and Marketing, Tashkent Financial Institute
Tashkent City, Mirzo Ulugbek District
Dr. Rashmi Rai(Ph. D,(Quality of Work-Life and Job Performance))
Assistant Professor , Management Department , Christ University, Bangalore,INDIA
Dr. Ravshan Khudayberganov(PhD on historical sciences)
Senior scientific researcher, Al-Beruni Institute of Oriental Studies, Academy of Sciences of the Republic of Uzbekistan, Tashkent,
Tashkent, Uzbekistan
Dr. Mohammed Nader Shalaby(Ph.D. Degree of Pathobiology and Physiology)
Associate Prof. of Biological Sciences and Sports Health Department, Faculty of Physical Education, Suez Canal University
Egypt, Ismailia
Dr.Mona Mostafa Abdo Sakoury(P.hd)
Associate Professor, Faculty of Applied Studies and Community, Service, Imam Abdulrahman Bin Al- Faisal University.
Saudi Arabia
Dr. Rita Greengold(Ph. D, Histroy)
College of William & MaryLyon G. Tyler Department of History.
Dr. Nargiza Sharopalievna Mullaboeva(Doctor of Philosophy in Psychology (PhD))
Senior Lecturer of Namangan Institute of Engineering and Technology, Uzbekistan
Dr. Shuchi Gupta(PhD (Commerce))
Associate Professor,University of Hail, KSA
Haryana, India
Dr. P.Malyadri(Ph.D. (Bank Finance for Rural Development))
Principal for 11 Years in Government Degree Colleges,Srisailam,Patancheru, Tandur,Chevella,Serilingampally,Kukatpally
Hyderabad, INDIA
Dr. Makhmud Akhmedovich Shakhodjaev
Associate Professor of Fergana Polytechnic Institute, Faculty of Energy, “EEE”
Fergana Region, Margilan City, M.Khofiz Street
Dr. Xaynazarov Baxromjon (Phd In History)
Faculty of History,National University of Uzbekistan
Tashkent, Uzbekistan
Dr. Dildora Bakhadirjanovna Agzamova
Associate Professor of “Translation Theory and Comparative Linguistics” of the National University of Uzbekistan named after
Mirzo Ulugbek
Dr. Izzatilla Makhmutalievich Khaydarov
Associate Professor of “History and Ethnology of the Peoples of Central Asia” Tashkent State University of Oriental Studies
Dr. Khurshida Erkinovna Yunusova(Doctor of Historical Sciences)
Professor of the Department of History of Uzbekistan, National University of Uzbekistan named after Mirzo Ulugbek
Tashkent City, Chilanzar District , Uzbekistan

Dr. Ravshan Berdimurodovich Siddikov(Doctor of Historical Sciences)
Associate Professor of History of Uzbekistan, National University of Uzbekistan named after Mirzo Ulugbek
Tashkent City, Almazar District, Uzbekistan
Dr. Ijod Narziqul ugli Akhmedov(Doctor of Philosophy (PhD) in Philosophy)
Head of the Department of Distance Education in Social Sciences and Humanities Jizzakh State Pedagogical Institute
Dr.Moise Adrian Cristian (Doctorate(PhD))
Associate Professor, Spiru Haret University of Bucharest, Romania
Dr. Umidjon Yandashalievich Kuziev
Acting Head of Department of Uzbek Language and Literature, Namangan State University
Namangan Region, Chust District
Akpojaro Ogheneochuko Owens (Msc, PGD,HND, ND)
Assistant Lecturer, School of Basic ScienceProgramme(Mathematics Unit), Nigeria
Dr. Prof. Shoeb Ahmad (Ph.D.)
PROFESSOR, Al Zahra College for Women, (Muscat) Oman
(Muscat) Oman
Rajibkumar Sanyal (M.Sc., PGDM, Ph.D., D.Sc. (Honoris Causa))
Associate Professor & Senior Researcher of Economics
Amity University, Kolkata Action Area II, Major Arterial Road, New Town
Dr. Askar R. Babaev
Acting Associate Professor
Tashkent City, Mirabad District,
Dr. Thirupathi Dongala(Ph.D, M.Sc. B.Sc. IT)
Working as Analytical Scientist-I with AUREX LABORATORIES LLC, 10 Lake drive, East Windsor, NJ, 08520 USA
Dr. Samuel Jacob Bunu (Doctor of Pharmacy)
Department of Pharmaceutical and Medicinal Chemistry, Faculty of Pharmacy, Niger Delta University, Wilberforce Island, Bayelsa
State, Nigeria.
Chibuisi C. Okorieimoh Doctoral Researcher)
Assistant lecturer School of Multidisciplinary Technologies, Technological University Dublin
Dr. G.V.P. Samaranayake
Lecturer (Probationary), Department of Ayurveda Basic Principles, GampahaWickramarachchi Ayurveda Institute, University of
Kelaniya, Sri Lanka
Khalid Zemam Amer
Responsible for the Division of Marketing of Scientific Products / Department of Scientific Affairs / Presidency of Mustansiriyah
University
Dr.Wafaa Mohamed Mohamed Moustafa(M.Sc., B.Sc., Ph.D, chemical engineering)
Head of the Central Laboratory of Environmental Isotope Hydrology, Egypt
Dr. Chandramohan Andavar(Doctorate in Biochemistry. M.Sc., M.Tech)
Associate Professor and Head in the Department of Biochemistry Annai Violet College of Arts and Science Menambedu, Ambattur,
Chennai, India.
Dr. Oyepata Simeon Joseph (Ph. D in Pharmacology and Toxicology)
Senior Lecturer, Department of Pharmacology, Faculty of Pharmaceutical Sciences, Bingham University, Karu, Nasarawa State,
Nigeria

Dr. Janna A. Nazarova(Doctor of Medical Sciences)
Doctor of Medical Sciences
Tashkent City, Chilanzar District
Dr. Amadou Danlami(Ph. D in Commonwealth Literature and culture)
University of Dschang, Faculty of Arts, Letters and Social Sciences, Department of Applied Foreign Languages
Dr.Ramesh Prasad Adhikary(Ph.D)
Assistant Professor (English) Tribhuvan University, M.M. Campus, Nepalgunj
Dr Kholida K. Matjanova(Postgraduate, student of the Institute of Bioecology of the Karakalpak branch of the Uzbek
Academy of Sciences )
Associate Professor
Republic Of Karakalpakstan, Amudarya District
Dr.Ali Adel Dawood(Ph.D,)
Lecturer, College of Medicine, Mosul, Iraq Course Unit Director, College of Medicine, Uni. of Mosul
IRAQ
Dr Raushana K. Kurbaniyazova(Doctor of Philosophy in Philosophy)
Senior Lecturer of the Department of Social Sciences, Urgench Branch of the 1st Tashkent State Medical Institute
Republic Of Karakalpakstan, Amudarya District
Dr. Kamila K. Juraeva ( Ph.D.)
Associate Professor of Power Supply, Tashkent State Transport University
Tashkent
Dr. Wan Ainun Binti Mior Othman(Ph.D)
Associate Professor Institute of Mathematical Sciences, Faculty of Science, University of Malaya, 50603 Kuala Lumpur, Malaysia.
Dr. Dharmendra S. Mistry (Ph.D.)
Prin. M. C. Shah Commerce College (Navgujarat Campus),( Affiliated toGujarat University)
Ahmedabad, INDIA
Dr. Murodulla A. Juraev(Doctor of Philosophy in Philology)
Senior Lecturer of the Department of Methods of Teaching Uzbek Literature of Jizzakh State Pedagogical Institute
Jizzakh City, Ittifaq Mahalla
Dr. Surayyo I. Eshonkulova(Philological Sciences)
Associate Professor of Teaching Methods of Uzbek Literature, Jizzakh State Pedagogical Institute
Jizzakh Region, Jizzakh City
Dr. Namrata Raviraj Vaishamapayan(MD, PGDHA, BHMS)
Assistant Professor(Practice of Medicine),MNR Homoeopathic Medical College, Sangareddy, Telangana
Prof. Dr. Majid Mohammed Mahmood(Ph.D,)
A University professor of Immunology Mustansiriyah University – College of Science, Baghdad
Dr. Yelimbet K. Sultanov(Technical Sciences)
Associate Professor of "Agricultural Mechanization and Investment Activity" Nukus branch of Tashkent State Agrarian University.
Dr. Durdona A. Akhatova(Pedagogical Sciences)
Associate Professor of General Pedagogy and Psychology, Navoi State Pedagogical Institute
Professor Zulkhumor N. Tojieva
Professor of Economic and Social Geography
Tashkent City, Yashnaabad District, Baku 1-Berk Street

Dr. Ulughbek M. Ergashev(PhD in Medical Sciences)
Senior Lecturer of the Department of Otorhinolaryngology and Dentistry, Tashkent Medical Academy
Tashkent City, Yashnabad District
Dr. Jamolbek A. Djuraev(Doctor of Philosophy in Medical Sciences)
Senior Lecturer, Department of Otolaryngology and Dentistry, Tashkent Medical Academy
Tashkent City, Almazar District
Dr. Lola S. Ortikova Senior Lecturer of the Department of Otolaryngology and Dentistry, Tashkent Medical Academy
Tashkent City, Mirabad District, Sadyk Azimov Street
Dr Ziyoda G. Mukhamedova(Doctor of Sciences in Technics)
Doctoral student of the Department of Freight Transport Systems, Tashkent State University of Transport (DSc)
Tashkent City, Yunusabad District
Dr. Shahzada Mudasir Rashid(PhD)
Assistant Professor (Scientist) Division of Veterinary Biochemistry, Faculty of Veterinary Sciences, SKUAST-K, Shuhama,
Alustang, Srinagar.
Professor Rustam Djumayev
Professor of the Department of "Oriental Policy and International Relations" of the Tashkent State University of Oriental Studies
Uzbekistan
Dr. Karno Kumar Mondal(Ph.D)
Teaching Assistantship Undergraduate Lab Department of Physics Khulna University of Engineering & Technology, Khulna-9203
Dr. Begzodbek Kh. Abdullaev(Doctor of Philosophy in Philology)
Associate professor , Andijan State Universitys
Andijan Region, Altynkul District
Dr Farida T. Rabbimova(Doctor of Pedagogical Sciences)
Senior Lecturer of the Department of General Biology and Methods of Teaching ,Jizzakh State Pedagogical Institute
Dr. Rakhimjon Kh. Muradov(Doctor of Philosophy in Technical Sciences)
Senior Lecturer, Namangan Institute of Civil Engineering
Namangan Region, Mingbulak District
Dr.Vishal Dubey (Ph.D)
Director, Department of Pharmaceutical Sciences, Naraina Vidya Peeth Group of Institutions, INDIA
Dr. Venkataraman Mugundan(PhD in Mathematics)
Math Lecturer in ‘INSTITUTE OF APPLIED TECHNOLOGY’,(GOVERNMENT OF ABU DHABI), Fujairah, United Arab
Emirates, U.A.E.
Dr Muzraf T. Rabbimov(Ph.D)
Associate Professor at the Department of Primary Education at Jizzakh State Pedagogical Institute
Dr Otabek Sh. Ochildiev(Doctor of Philosophy in Technical Sciences)
Head of the Laboratory “Software Management and Mechatronics”of the Research Institute of Agricultural Mechanization
Tashkent Region, Yangiyul District,
Dr Umidbek B. Yusupov(Doctor of Philosophy in Technical Sciences)
Acting Associate Professor of “Vehicle Engineering” Tashkent State Transport University
Tashkent City, Sergeli District,
Dr Abdirasuli A. Ibragimov(Doctor of Philosophy in Technical Sciences)
Scientific Secretary of the Research Institute of Agricultural Mechanization and Electrification
Tashkent Region, Yangiyul District,

Dr. Altinoy Masalieva (Associate Professor Candidate of Historical Sciences)
Uzbek State University of World Languages, Associate Professor of History of Uzbekistan
Dr. Yusup Kh. Manzarov(Associate Professor Candidate of Historical Sciences)
Assistant of the Department of Social Sciences at Karshi Engineering and Economics Institute.
Dr. Durdona A. Mustafoeva(Doctor of Philosophy in Pedagogical Sciences)
Associate Professor (PhD), Department of “Professional Education and Physical Culture”,Tashkent Institute of Irrigation and
Agricultural Mechanization Engineers,
Tashkent Region, Tashkent District,
Dr. Mamurzhan A. Mirzazhanov(Candidate of Technical Sciences)
Associate Professor of Production of Products and Structures, Fergana Polytechnic Institute of Building Materials
Fergana Region, Oltiariq District
Dr. Mahmudjon M. Ergashev(Candidate of Technical Sciences)
Head of the Department of Production of Building Materials, Products and Structures of Fergana Polytechnic Institute
Fergana Region, Quvasoy City
Dr. Iyanda Kamoru Ahmed (Doctor of Philosophy (Legal and Social History))
Department of History and International Studies, Federal University Gashua, Yobe State, Nigeria
Dr. J.GAJENDRA NAIDU (Ph.D In Finance)
Head of the Department, Faculty of Finance Botho university: Gaborone Campus: Botswana
Dr Nilufar M. Turdieva (Doctor of agricultural science)
Chairperson of laboratory Scientific research Institute protection of plants
Uzbekistan
Dr. Kutbiddin B. Imomkulov (Doctor of Technical Sciences)
Trade Specialist for Innovative Projects of Agricultural Research Institute
Tashkent Region, Yangiyul District
Dr. Omer Allagabo Omer Mustafa (PhD. in Economics)
Assistant professor of Economics, Banking and Finance, Sudan Academy for Banking and Financial Sciences (SABFS-Sudan)
Sudan, North Africa
Dr. Cristobal Millenes Ambayon (Doctor of Education)
Associate Professor V Sultan Kudarat State University, College of Teacher Education ACCESS, EJC Montilla, Tacurong City
Tacurong, Philippines
Dr. Khamid M. Sodikov (Doctor of Philosophy in Pedagogical Sciences)
Dean of the Faculty of Physics and Technological Education of Jizzakh State Pedagogical Institute
Jizzakh District, Navoi SFU
Dr. Nazokat G. Juraeva (Doctor of Philological Sciences)
National Institute of Arts and Design named after K.Bekzod, Tashkent
Dr. Nwodim Obinna (Doctor of Philosophy (Development Studies))
Department of Political and Administrative Studies, Faculty of Social Sciences, University of Port Harcourt
Nigeria
Dr. Atalla Fahed Al-Serhan (PhD)
Assistant Professor, Department of Business Administration, Al Albayt University, Mafraq, Jordan
Dr Nasiba N. Panjieva(Doctor of Philological Sciences)
Associate Professor of English Language and Literature, Termez State University
Surkhandarya Region, Termez City

Dr. Shakhlo B. Samanova (Doctor of Philosophy)
Associate Professor of “Theory of building a democratic society in Uzbekistan.” Urgench State University.
Khorezm Region, Urgench District
Dr. Abderraouf Mtiraoui (Ph.D in Economics)
Assistant Professor in Economics at the Higher Institute of Finance and Taxation (HIFT)-Sousse- Tunisia
Dr. Muhammad Faizal bin Samat (Doctor of Philosophy (Marketing Communication))
Senior Lecturer at Malaysian Academy of SME & Entrepreneurship Development, Universiti Teknologi MARA, Shah Alam
Malaysia
Dr. Wulan Rahmadhani (Doctor in Public Health)
Lecturer, Department of Midwifery, Sekolah Tinggi Ilmu Kesehatan Muhammadiyah Gombong, Indonesia
Dr. Adeboye, N. Olawale (Doctor of Philosophy (PhD))
Department of Mathematics & Statistics, Federal Polytechnic Ilaro, Nigeria
Ewa, Moses Apie (Ph.D)
Lecturer Department of Educational Foundations & Childhood Education, Faculty of Education, Cross River University of
Technology (CRUTECH), Calabar, Nigeria
Shaimaa Mohamed Hassanin (Ph.D in English Literature)
Lecturer of English language and American literature at Horus University
Damietta, Egypt
Dr. Dildora S. Davronova (Doctor of Philosophy in Pedagogical Sciences)
Associate Professor of “Pedagogy and Psychology” at the Uzbek State University of World Languages
Chilonzor Region Tashkent, Uzbekistan
Dr. Karima J. Tulenova(Doctor of Philosophy)
Acting Head of the Department of Social Sciences, Tashkent State Pedagogical University named after Nizami
Tashkent City, Yakkasaray District
Yannick Boum (Ph.D in English Language)
A researcher from the University of Yaounde Cameroon, Central Africa
Dr. Rashmi S (Doctor of Philosophy in Botany)
Assistant Professor, Post Graduate Department of Botany, JSS College of Arts, Commerce and Science (Autonomous) Ooty Road,
Mysore, Karnataka, India
Dr Abdimurot U. Kuziev(Candidate of Technical Sciences)
Head of the Department of Transport Systems and Structures of Termez State University
Surkhandarya Region, Termez City
Dr. Normakhmat P. Panjiev (Doctor of Philological Sciences)
Head of the Department of Russian Linguistics, Termez State University
Surkhandarya Region, Termez City
Rawda Bashir Abdulla (Ph.D.)
Assistant Professor in Teaching English language and Applied Linguistics, Department of English Language Skills Jouf University
Kingdom of Saudi Arabia
Dr. Nemat Kh. Kushvaktov( Ph.D Pedagogical Sciences)
Head of the Department of General Pedagogy of Jizzakh State Pedagogical Institute.
Jizzakh City, Navruz Mahalla
Dr Khurshid A. Sattarov (Ph.D.)
Head of the Department of Electronics and Radio Engineering, Tashkent University of Information Technologies named after
Muhammad al-Khwarizmi, Tashkent City, Mirabad District

Dr. Manoj Kumara.N.V (Ph.D in Finance)
Associate Professor in Department of Management Sciences, Maharaja Institute of Technology- Mysore.
Karnataka, India
Jupeth Toriano Pentang (Doctor of Philosophy Major in Educational Management)
Mathematics Educator, Researcher and Extensionist, College of Education, Western Philippines University Puerto Princesa City,
Philippines
Housseine Bachiri (Ph.D)
Assistant Professor at the Faculty of Sciences and Technologies, Tangier
Tangier (Morocco)
Dr. Sarvarbek Kh. Jumaboev(Doctor of Philosophy in Technical Sciences)
Acting Associate Professor of Power Supply, Tashkent State Transport University
Uchtepa District
Dr. Gulmira J. Tulenova
Professor,Tashkent University of Information Technologies named after Muhammad al-Khwarizmi, Tashkent, Uzbekistan
Uzbekistan
Seham Ismail (Doctor Philosophy in Agricultural Sciences)
Head of Department of Insect Population Toxicology, Central Agricultural Pesticides Laboratory, Agriculture Research Center,
Dokki, Giza, Egypt
Egypt
Dr. Veena N (Ph.D. in Educational Psychology)
Associate Professor, Christ Academy Institute for Advanced Studies (CAIAS), Bangalore
Bangalore
Dr. Djuraev Jamolbek Abdukakharovich (Ph.D.)
Senior Lecturer Department of Otolaryngology and Dentistry TMA
Tashkent
Dr. V.KIRUTHIGA (Ph.D)
Assistant Professor, Department of Management Studies, Faculty of Engineering and Technology, Jawaharlal Nehru Salai, 100 Feet
Road, Vadapalani, Chennai-600026
Chennai
Dr. Govind Shinde (Ph.D.)
Professor, Babasaheb Gawde Institute of Management Studies. (Approved Associate Professor Finance Faculty University of
Mumbai)
Mumbai
Prof. Dr. Nagham Mahmood Aljamali (Ph.D.)
Professor in organic chemistry, Department of Chemistry, Synthetic Organic Field, IRAQ
Iraq
Dr. Tiziana Ciarambino (Ph.D. in Geriatrics Phisiopathology)
Teacher at the University of Campania
Campania
Dr. Kalandarov Palvan Iskandarovich (Doctor of Technical Sciences)
Professor at the Tashkent Institute of Irrigation and Agricultural Mechanization Engineers in Tashkent
Tashkent, Uzbekistan
Dr. MC Manjunatha (Phd.)
Assistant Professor, Department of Civil Engineering, Maharaja Institute of Technology, Thandavapura, Mysuru -571 302
Mysuru

Dr. Sourabodhi Bhattacharyya (Ph.D)
Assistant Professor of Sanskrit (Stage II) Galsi Mahavidyalaya, B.U, Galsi,Purba Bardhaman , W.B-713406
India
Dr. Naftaly Gisore Mose (Ph.D in Economics)
Lecturer (Economics) University of Eldoret
Kenya
Dr. ARTI (Ph.D. in Law)
Assistant Professor, Desh Bhagat University, Punjab
INDIA
Dr. MOTHUKURI ANJAIAH (Ph.D. In Library Science)
Assistant Professor (Dept. of Library and Information Science)
INDIA
Dr. Youssif Zaghwani Omar (PhD in English Education)
General Director of the Institute of Human Resources Development at the Libyan Academy
Libya
Dr. Ndubuisi-Okolo (Ph. D)
Lecturer, Nnamdi Azikiwe University
Nigeria
Dr. Mourad Romdhani (Ph.D. in English Literature)
Assistant Professor, the Faculty of Letters and Humanities, University of Sousse, Tunisia
Tunisia
Dr. Utemuratova Gulshirin Najimatdinovna(PHD in Biological Science)
Karakalpak Scientific Research Institute of Natural Sciences Laboratory of Animal Science, Doctor of Philosophy PHD, Biological
Science, Uzbekistan
Uzbekistan
Dr. Tureyev Abat Arisovich, PhD(Doctor of Philosophy (Tourism))
lecturer of technology of storage and processing of agricultural crops, philosopher of Biological Sciences ,Karakalpakstan Institute
of Agriculture and Agrotechnology,
Uzbekistan
Dr. Rico Paulo G. Tolentino (PhD in Development Education)
School Principal, Department of Education, Schools Division of Bulacan, Philippines
Philippines
Dr. Nik Alif Amri Bin NikHashim (Doctor of Philosophy (Tourism))
Senior Lecturer (DS51), Faculty of Hospitality, Tourism & Wellness, University Malaysia Kelantan
Australia
Shuang Li (Ph.D. in Sociology)
Sociology Lecturer, Department of Sociology and Social Work University of Wisconsin-Stevens Point
Wisconsin
Dr. V.KAVITHA (Ph.D. in English Literature)
Assistant Professor of English, Nehru Arts and Science College (Autonomous), Coimbatore
Coimbatore
Dr. Samieva Gulnoza Utkurovna
Doctor of medical sciences (DSC), Samarkand State medical institute, Uzbekistan
Uzbekistan

ANOKE, Amechi Fabian (Ph.D)
Lecturer, Department of Business Administration, Faculty of Management Sciences; Nnamdi Azikiwe University,
Awka, Anambra State Nigeria
Dr..L.Bhuvana (Ph.D)
Assistant Professor of Chemistry, Shrimati Indira Gandhi College, Tiruchirappalli
Tamil Nadu, India
Dr. Norjigit T. Nishonov(Candidate of Agricultural Sciences)
Senior Lecturer, Department of Agrochemistry, Soil Science, Plant Protection and Quarantine, Samarkand Veterinary Medical
Institute Samarkand Region
Dr. Esirgap I. Turapov(Ph.D)
Associate professor of the Department of "Machine Engineering Technology" at the Almalyk Branch
Jizzakh Region, Galla-Aral District
Dr Alisher J. Shokirov(Doctor of Agricultural Sciences)
Dean of the Faculty of Storage and Processing of Agricultural Products, Tashkent State Agrarian University
Tashkent Region, Yunusobod District
Dr. Patkhillo Siddikov(Doctor of Technical Sciences)
Professor of "Technology of textile fabrics" of the Tashkent Institute of Textile and Light Industry
Tashkent City, Chilanzar District

International Journal of Multidisciplinary Research and Analysis
ISSN[Online] : 2643-9875 || ISSN[Print] : 2643-9840
Table of Contents IJMRA Volume 05 Issue 05 May 2022
S.no. Article Authors Page no.
1. Indicators of Sustainability Reporting and Performance of
Non-Financial Companies in Nigeria
Ogiriki Tonye PhD,
Igo Oyeintare Kennedy 890-897
2. Governance Structure and Quality of Accounting Reports
in Covid 19 Era
Ihenyen, Confidence Joel PhD,
Igo Oyeintare Kennedy 898-906
3. Research on Data Visualization Technology Based on
Python Feng Li, Lingling Wang 907-910
4. Four Noble Truths and Fo Guang Entrepreneur Lung-Tan Lu 911-915
5. ICT-Based Needs Assessment Analysis in Partner
Community
Sharra Mae B. Fernandez,
Sheila Mae S. Pagayonan 916-920
6. Smart Irrigation for Crop Management Using IoT Mohamed Fazil, Rohan S, Ashritha C,
Nagesh Shetty, Ramalingam H M 921-928
7. Rationing of Tire Mileage in the Operating Conditions of
the Kalmakyr Quarry
Umidbek Yusupov, Akmal
Muxitdinov, Feruz Otamuradov 929-934
8.
Archaeological Research is an Important Source in the
Study of Traditional Economic Activities of the Uzbek
People (On the Example of SomeResearchers of the
Twentieth Century)
Bobir Odilov, Nodir Karimov 935-939
9.
Best Practices in Implementing Modular Distance Learning to Indigenous People (IP) Students in Olongapo
City
Merlyn M. Seridon 940-948
10. Validation of modified Children’s Health Survey for
Asthma (CHSA) Questionnaire for the Sri Lankan setting
Samarasinghe AIP, Arnold SM ,
Fonseka Pushpa 949-955
11. A Study of Donation-Based Crowd Funding Platforms Dr. Amol Mane 956-964
12. A Study of Speech Recognition with Deep Learning Feng Li, Yiyang Wei 965-970
13.
Relationships Between the Achieved Target Levels of LDL Cholesterol and the State of Various Types of LV EF in
Patients with Coronary Artery Disease and Type 2 Diabetes.
Mukharram A.Musaeva, Dinara
A.Parpibaeva, Muborak S.Salaeva,
Nargiza D.Salimova
971-974
14. The Network EPES8–2 Abdumannon Kodirjonovich
Jumakulov 975-982
15.
ICT Skills, E-Supervision Scheme of School Heads, And
Teacher Development in Distance Learning Among
Selected Private Schools in Cainta
Ruel G. Gerona, Susana C. Bautista 983-993
16.
Working Capital Strategy on Profitability before and During the Covid-19 Pandemic in the Indonesia Stock
Exchange
Ervita Safitri, Dhea Seftiani, Abdul
Basyith 994-1002
17. Influence of COVID-19 on Student’s Classroom Learning
and Their Academic Performance
Dr. Ms. Shabnam S. Mahat, Dr. S. B.
Sawant, Ms.Ummemisbah M. Bhisti 1003-1008

18. Prison Administration in context with Prisoner’s rights in
India
Dr. Shikha Mishra, Dr. Uday Veer
Singh 1009-1016
19.
Total Quality Management School Practices,
Implementation of ISO 9001: 2015 Quality Management
System and Performance of Schools in the Division of
Santa Rosa City, Laguna
May B. Basbas, LPT PhD 1017-1029
20. The Effect of Teenage Girls Class Model to Reduce
Anxiety Symptoms of Premenstrual Syndrome
Alice Leiwakabessy, Henny Novita,
Endah Dian Marlina, Yuliana 1030-1037
21.
Servant Leadership, Decision Making, and Instructional
Leadership Practices of School Heads in Selected
Elementary Schools in Deped Cabuyao
Dearborn E. Villafranca LPT, MAEd 1038-1050
22. Impact of Perceived Benefits, Security, and Privacy on
Interest in Using E-Wallet in Millennial Generation
Tri Kartika Pertiwi, Eko Purwanto,
Irma Dwi Kusuma, Sinta Dewi, Lelli
Kisdayanti
1051-1057
23.
Service Quality, Customer Satisfaction, Consumer
Behavior and Business Performance of Health and Fitness
Center in Kuwait, UAE
Lino Rosete 1058-1069
24.
Evaluation of Teaching Specialty in Head and Neck
Surgery in the Curriculum of Medical Courses in
Fortaleza, Ceará
Larissa Albuquerque Oliveira,
Monalisa Emillene Nunes Ribeiro,
Lara Hannyella Gouveia Duarte,
Lauhelia Mauriz Marques, Jonatas
Catunda Freitas
1070-1076
25. Role of NITI Aayog in Relation to Indian Public Policies: A
Study Amritanshu Pandey, S.P. Shukla 1077-1083
26.
Indigenousism, Hinduism and Christianism
A Glimpse of Religious Transformation of the North East
Indian Tribes of Tripura
Dr. Nirmal Bhadra 1084-1089
27.
Development of Student Worksheets (LKPD) Based on
Learning Models Guided Inquiry to Improve Students
Critical Thinking Ability in Materials Cells and Plant Tissue
Class XI SMA/MA
Fanni Syahuri Tinambunan, Lufri 1090-1095
28.
Teachers’ Use 0f Higher-Order Cognitive Skills,
Instructional Skills in Online Science Teaching and
Students’ Achievement in Elementary Science
Remilyn Nacario-Arce 1096-1100
29.
Biology Practicum Guides Problem Based Learning-Based
to Improve Critical Thinking Skills for Class XI Students of
SMA
Widia Rahayu Safitri, Yuni Ahda 1101-1106
30. Viability, Prospects and Challenges of Ecotourism in Lobo,
Batangas
Rizza Ramos-Gonzales, Dr. Pedrito
Jose V. Bermudo 1107-1124
31. Perception of Secondary School Teachers on Examination
Malpractice in Ibadan Metropolis, Ibadan, Nigeria
Prof. Babatunde Adeniyi Adeyemi,
Dr. Monilola Dasola Oyetade 1125-1132
32. Stress, Techno-Pedagogical Skills, and Quality of Life
among Faculty of a Local University in Laguna
Ma. Gloria G. Greganda, Antonio R.
Yango, PhD 1133-1141

33. Wellbeing, Online Course Delivery, and Learning Loss of
College Students in a Local University in Laguna
Edgardo C. Salazar, LPT, MAT,
Antonio R. Yango, LPT, PhD 1142-1151
34. Dean’s Visionary Leadership, Institution’s Academic
Culture and Faculty Performance of a Hei in Laguna
Emirose B. Gonzales, LPT PhD,
Antonio R. Yango, LPT PhD 1152-1158
35.
21st Century Digital Skills, Technology Integration in
Instruction and Challenges Encountered by Senior High
School Teachers in Muntinlupa National High School
Hazel Jhoy C. Del Mundo 1159-1172
36. Linguistic Anxiety in Foreign Language Learning Process
Preuniversity Level Dominican Students
Santa Cabrera, Teofilo Diaz,
Issa Morillo 1173-1179
37. The Role of Customer-Based Brand Equity on Customer
Loyalty in Employees’ Social Security Luki Dwi Setiyawan, Ratna Roostika 1180-1187
INTERNATIONAL JOURNAL OF MULTIDISCIPLINARY RESEARCH AND ANALYSIS
ISSN(print): 2643-9840, ISSN(online): 2643-9875
Volume 05 Issue 05 May 2022
DOI: 10.47191/ijmra/v5-i5-01, Impact Factor: 6.261
Page No. 890-897
IJMRA, Volume 5 Issue 05 May 2022 www.ijmra.in Page 890
Indicators of Sustainability Reporting and Performance of Non-
Financial Companies in Nigeria
Ogiriki, Tonye PhD1, Igo, Oyeintare Kennedy2
1,2Department of Accounting, Niger Delta University, Wilberforce Island, Bayelsa State, Nigeria
ABSTRACT: This research looked into the indicators of sustainability reporting and the performance of non-financial Companies
in Nigeria. The researchers looked at the impact of sustainability reporting indicators on the Return on Asset (ROA), Return on
Equity (ROE), and Net Profit Margin (NPM) performance indicators all at the same time. Ex-post facto design was used in this
study. Out of 168 non-financial companies listed on the Nigerian Stock Exchange, a total of 64 listed enterprises were researched,
and secondary data was taken from their yearly financial statements as presented in the fact book. The data was analyzed using
the ordinary least squares (OLS) regression model. The probability value p-value was the statistical technique used to assess the
hypotheses. Findings from this study show that Sustainability reporting indicators impacted positively but not statistically
significant on Return on Asset (ROA), Return on Equity (ROE) and Net Profit Margin (NPM) of non-financial companies investigated.
Companies are therefore, encouraged to align sustainability disclosure objectives with other performance and shareholders profit
maximization objectives of the firm.
1. INTRODUCTION
The concept of sustainability disclosure is gaining traction around the world. A firm's ultimate goal is commonly thought to be to
increase profit and provide greater value to its shareholders in a normal range. To attain these objectives, the business sector
frequently breaches company policies, harms the environment and ecological system, and jeopardizes employee safety
(Skouloudis et al., 2019). Customers, suppliers, governments, and employees should all be worried. All of these parties compel
management to go above and above in terms of being more ethical and socially responsible. Businesses are increasingly being
criticized for the negative impacts of their actions on society, employees, and the environment, putting these stakeholders at
danger. Extortion of employees and bookkeeping are to blame.
All business enterprise systems, including the organization's strategic, legal, people, and functional management areas, are
covered by sustainability. The institutionalization of ecological initiatives and the corporate governance policies of business
organizations are reflected in sustainability responsibilities. Corporate reports are used by executives to communicate their
actions to a wide range of stakeholders who are not directly involved in the day-to-day operations of businesses. Some of these
companies' operations will have an impact on society, the environment, and the economy in the future, affecting future
generations' ability to meet their needs. As a result, the public wants to know which corporations it can trust and, more crucially,
which it should avoid based on disclosures. Sustainability reporting is concerned with measuring and disclosing various non-
financial information and firm performance in relation to the goal of sustainable development. It frequently overlaps with various
terms/approaches such as triple bottom line reporting, corporate responsibility reporting, and ESG reporting. It entails
incorporating environmental, social, and governance considerations into investment analysis, security selection, portfolio
development, and risk management processes (Khan, 2019).
Unfortunately, the traditional corporate report lacks the information necessary for investors to assess all of the key risks associated
with a company's operations. Many value drivers go unaccounted for in traditional business reports. There has been growing
concern that the current corporate reporting structure lacks transparency and no longer provides all of the information
stakeholders require to assess the company's performance and worth. The existing financial reporting approach has been criticized
and found to have shortcomings in numerous studies (Feyitimi, 2014). Accounting innovations are the consequence of an
organization's growth, development, and transformation processes. Sustainability accounting is a new accounting concept that
arose from organizational change. As the demand for openness from their communities develops, organizations are adopting

Indicators of Sustainability Reporting and Performance of Non-Financial Companies in Nigeria
IJMRA, Volume 5 Issue 05 May 2022 www.ijmra.in Page 891
innovation to offer new means of exposing information to their constituents. Accounting innovations are the product of
organizational growth, development, and transformation processes. Organizations build accounting processes over time that,
among other things, contribute to maintain functional stability and performance (Chen; Feldmann & Tang, 2015). Organizations
develop accounting processes throughout time that, among other things, serve to preserve functional stability and performance.
Transformational changes are required by evolutionary processes, which necessitate structural and systemic alterations. The
present accounting rules and regulations are being overhauled, and new accounting rules and processes are being born as a result
of these changes. Sustainability accounting is a relatively recent accounting concept that arose from organizational change. As the
demand for openness from their communities develops, organizations are adopting innovation to offer new means of exposing
information to their constituents (Ringelet al., 2018).
Meanwhile, global climate change and the resulting depletion of natural resources, as well as the financial and economic
meltdown, have raised fundamental questions about how capital markets work and how well existing corporate disclosures
highlight systemic risks and the true cost of doing business in today's world. The apex of the critique is the crisis of confidence and
credibility that has characterized the investment scene since the collapse of well-known corporations in developed and developing
countries, as well as the resulting loss of confidence in the capital markets (Abubakar, Garba, Sokoto, & Maishnu, 2014). To address
the critiques of the traditional corporate report and the resulting lack of trust, many are now advocating for the implementation
of a reporting model that presents a strategic picture of the company, focused on the triple bottom line.
1.2 Objectives of the Study
The main purpose of this study is to examine the indicators of sustainability reporting and performance of non-financial companies
in Nigeria. The study focused on various secondary research objectives that supported the achievement of the primary aim in
order to attain the primary goal. The supplementary questions are intended to;
1. Examine the association between indicators of sustainability reporting and Return on Asset (ROA) of non-financial
companies in Nigeria.
2. Examine the association between indicators of sustainability reporting and Return on Equity (ROE) of non-financial
companies in Nigeria.
3. Examine the association between indicators of sustainability reporting and Net Profit Margin (NPM) non-financial
companies in Nigeria.
1.3 Research Hypotheses
The following hypotheses were developed in null form:
Ho1: indicators of sustainability reporting has no significant association with Return of Asset (ROA)
Ho2: indicators of sustainability reporting has significant association with Return on Equity (ROE)
H03: indicators of sustainability reporting and Net Profit Margin (NPM) are not significantly associated
2.0 LITERATURE REVIEW
2.1 Conceptual and theoretical Framework
The key technique for sharing unbiased knowledge about the organization in an instructive manner is through sustainability
reports. Investors, creditors, regulators, and other financial report users use business reports to make informed economic
decisions. The adaptation of corporate processes and strategies to sustainable development is referred to as corporate
sustainability. Reporting on how a corporation displays itself responsibly in terms of environmental, social, and governance issues
is what sustainability disclosure is all about. Previously, the term was used to describe a company's voluntary efforts to reduce its
environmental and social impact while also increasing its positive contribution to society (Khan, 2019). Quantitative and qualitative
data are frequently combined in sustainability statements. There are several standards and guidelines by various organizations
regarding the form and quality of sustainability reporting in order to improve comparability and reliability of sustainability
disclosures. Companies reporting their sustainability operations using a variety of frameworks has resulted in not only a lack of
uniformity, but also a considerable heterogeneity in the structure and substance of such reports (Cortez & Cudia, 2011).
Sustainability issues are complicated, and quantifying them presents numerous challenges, as there are no standard
measurements available, such as those for financial transparency; nonetheless, prior studies have employed a variety of indicators
and principles. Specific sustainability disclosures will be measured using ESG dimensions for the purposes of this study. Sustainable
Asset Management (SAM) is a comparable concept that focuses on eco-efficiency and environmental reporting, as well as industry-
specific standards (Delmas & Blass, 2010). In keeping with the overall tendency, governance is employed in place in the economic
dimension. The governance dimension is equally significant because it entails enforcement procedures. It's no surprise that

Indicators of Sustainability Reporting and Performance of Non-Financial Companies in Nigeria
IJMRA, Volume 5 Issue 05 May 2022 www.ijmra.in Page 892
Osisioma (2013) defines it as the method by which a company's stakeholders exercise influence over corporate managers and
provide general direction to the corporation. Observing the significance
Investors' perceptions of the firm's managers' ability to anticipate and respond to future changes in the firm's economic
environment are influenced by investors' perceptions of the firm's managers' ability to anticipate and respond to future changes
in the firm's economic environment, according to Emeka and Nwokeji (2019). Tobin's q is a forward-looking, capital market-based
measure of a firm's value that was used in this study. Tobin's q is a measure of how investors perceive a company's market worth
in relation to its book value. Tobin's Q is the ratio of total assets to market value of equity (fiscal year-end price times number of
outstanding shares) plus book value of debt (total assets minus book value of equity) (Albuquerque, Durnev, & Koskinen, 2013).
It is an excellent proxy for firm value since it reflects the market's expectations for future earnings (Campbell & Mnguez-Vera,
2008).
The theories of agency, stakeholders, and legitimacy provided essential theoretical foundations for sustainability disclosure
research and are utilized to explain the purpose for this study. The study's underlying assumptions are that providing sustainability-
related information is critical to a firm's ability to reduce information asymmetry between agent and principal (agency),
accommodate information needs of a variety of stakeholders with sometimes conflicting demands (stakeholders), and operate
within society's bounds and norms (legitimacy) to gain acceptance while improving overall value of the firm.
2.2 Empirical Review of Literature
For well over a decade, sustainability reporting has been a feature of corporate reporting in both established and emerging
nations. There has been a significant growth in academic literature on sustainability reporting in industrialized nations over this
time, however empirical investigations on responsibility/sustainability reporting in Africa are few and far between (Fifka & Meyer,
2013). Because there is a scarcity of literature on aggregate sustainability disclosure and company performance, empirical
references will be gathered from both aggregate sustainability disclosure studies and component of sustainability (environmental,
social, and governance)
Xie H. & Bilal A. et al (2020), examined Sustainability Reporting and Firm Performance: The Demonstration of Pakistani Firms. The
goal of this study was to look at the level and scope of sustainable financial reporting for non-financial companies in Pakistan, as
well as the influence of sustainable financial reporting on business performance. For the year 2013 to 2017, data was gathered
from the sustainability reports and annual reports of 50 non-financial public limited firms listed on the Pakistan Stock Exchange.
A content analysis approach was used to create the sustainability reporting index, which was based on 42 indicators.
Environmental, health and safety, and social characteristics were used to create the index. The findings show that all three
individual indicators, as well as the composite version of the sustainability reporting index, have a favourable impact on company
performance.
The impact of sustainable accounting and reporting on financial performance was investigated by Nnaman, Onyekwelu, and Ugwu
(2017). To measure sustainability reporting, the study employed the social responsibility cost and total personal cost to turnover
ratio, as well as Return on Assets and Return on Equity to reflect financial performance. According to the findings, the total equity
to total asset ratio has no bearing on the return on asset.
Usman and Amran (2015) investigated the link between CSR disclosure aspects and corporate financial performance (CFP) among
Nigerian publicly traded companies. As a metric of sustainability disclosure, the study looked at environmental disclosure,
community engagement disclosure, human resource disclosure, and product disclosures. The findings suggest that providing
environmental information in a corporation's annual report lowers both accounting and market-based financial performance. This
suggests that environmental disclosure among Nigerian businesses may be detrimental to their value. The research also
discovered a large positive association between community participation disclosure and accounting-based performance (Return
on Assets), but a minor negative relationship with market-based performance indicators (Share Price). Human resource disclosures
have a large positive link with ROA, but a neutral relationship with share price.
Garg (2015) used five-year data from significant Indian corporations to examine the impact of sustainability reporting on firm
performance. The study found that a company's sustainability reporting methods had a negative influence on both ROA and
Tobin's Q in the short term, but have no effect on both metrics in the long run. Using the sustainability materiality index,
sustainability immaterial index, and accounting performance indicators to investigate the relationship between sustainable
business practices and financial performance. The study discovered that companies with high ratings on material sustainability
issues perform better in the future than companies with low ratings on the same issues. Furthermore, organizations with good
material issue ratings and bad immaterial problem ratings have the best future performance.

Indicators of Sustainability Reporting and Performance of Non-Financial Companies in Nigeria
IJMRA, Volume 5 Issue 05 May 2022 www.ijmra.in Page 893
Aondoakaa (2015) examines the impact of sustainability reporting on the financial performance of a group of Nigerian publicly
traded companies. For reasons that have not been fully explained, the study uses four measures to mimic company performance
(ROA, ROE, Net Profit Margin (NPM), and Earnings Per Share (EPS), but only one measure to proxy sustainability reporting (SRI)
for the four models studied. Sustainability Reporting is favorably associated to ROA, according to research. ROE and NPM are
favorably associated to sustainability indexes. Sustainability reporting has a positive relationship with EPS, however the
environmental index has a negative relationship with EPS. Nwobu (2015) studied the relationship between corporate sustainability
reporting and profitability in Nigerian banks. The study provided empirical evidence that the small positive correlation between
sustainability reporting index and Profit After Tax (PAT). The study also found a small positive correlation between sustainability
reporting index and shareholders fund.
Bhatia and Tuli (2014) used companies that provide separate sustainability reports to analyze the extent and level of sustainability
reporting in India. The study revealed that the inter-industry disclosure ratings are not significantly different. The mean disclosure
scores of several industrial groupings revealed no statistically significant variance, according to one-way ANOVA.
Eccles, Ioannou, and Serafeim (2014) found a positive and significant relationship between Tobin's Q and the predicted component
of the ESG disclosure in a study on the effects of mandatory corporate sustainability reporting, implying that the effect of
mandating sustainability reporting is, on average, value enhancing rather than value destroying for the treated firms in our sample.
According to Tobin's Q. Study, increased disclosures are linked to higher firm valuation.
Eze, Nweze, & Enekwe (2016) examine the effects of environmental accounting on a developing nation with emphasis on Nigerian
and discovered that Environmental information in the annual report is positively related to a firm’s size.
Bhatia and Tuli (2014) used companies that provide separate sustainability reports to analyze the extent and level of sustainability
reporting in India. Plumlee, Brown, Hayes, and Marshall (2015) use both cost of equity capital and projected cash flow components
to analyze the link between environmental disclosure quality and firm value. In order to distinguish between numerous possible
causes for the sometimes-contradictory findings from earlier research, the study controls for environmental performance and
partitions environmental disclosures by type and substance in the analysis. They show that the cash flow and cost of capital
components of voluntary disclosure have a positive relationship with firm value.
Hussain (2015) investigated the impact of sustainability performance on financial performance of Global Fortune corporations,
concluding that economic sustainability has no meaningful association with both market performance and financial performance.
On a sample of 168 firm-year data from South Africa and Morocco from 2004 to 2009, Khlif, Guidara, and Souissi (2015) utilize a
coding index approach to quantify the level of annual reports' social and environmental disclosure and its relationship on a sample
of 168 firm-year observations. They show that social and environmental disclosure has a considerable positive impact on
corporation financial performance.
Nnamani et al (2017) investigated the impact of sustainability accounting and reporting on financial performance using data from
the Nigerian brewery industry from 2010 to 2014. To measure sustainability reporting, the study employed the social responsibility
cost and total personal cost to turnover (TPCT) ratio, as well as Return on Assets and Return on Equity to indicate financial success.
Total equity to total asset (TETA) was discovered in the study.
Vujicic (2015) investigated the connections between corporate social responsibility and financial performance as measured by
stock returns for a sample of US companies over a two-year period. The study compares the outcomes to an overall corporate
social responsibility score using a set of disaggregated social responsibility metrics for the environment, community, and
employment. In both aggregate and individually evaluated measures, the study finds that enterprises with higher social
responsibility scores have lower stock returns.
4. METHODOLOGY
The study's population consists of non-financial companies that are listed on the Nigerian Stock Exchange (NSE) floor as of 2019
and have consistently submitted annual reports to the NSE since 2005. According to the NSE fact book 2019, there are 168 firms
in this category. Some of these businesses are multinational, and as a result, they have adopted worldwide best practices for
sustainability disclosure. In their yearly reports, they include information on sustainability. From the 168 companies, a sample for
this study is selected using the formula (Yamane, 1967)
𝒏 =𝑵
𝟏 + 𝑵(𝒆)𝟐
where;

Indicators of Sustainability Reporting and Performance of Non-Financial Companies in Nigeria
IJMRA, Volume 5 Issue 05 May 2022 www.ijmra.in Page 894
n = sample size
N = Population size
e = Level of precision (margin of error)
Given a population of 168, the researcher assumes a margin of error of 5%. Therefore;
𝑛 =168
1+168(0.05)2
𝑛 =168
1.42
n = 118.32
n = 118 approx.
The selection of the 118 companies out of the 168 follows judgmental or purposive non-probability sampling technique. Out of
this 118 select 64 listed companies for easy analysis.
4.1 Model Specification
The following model (Regression model) was used for the respective variables and hypotheses in order to test for the relevance
of the hypotheses regarding sustainability disclosure and firm value of companies listed on the Nigerian Stock Exchange, as
described by Onwumere (2009). This model examines the relationship between a dependent variable and two or more regressors
or independent variables.
𝑌𝑡 = 𝛽0 + 𝛽1𝑋1 + 𝛽2𝑋2 + 𝛽3𝑋3 + 𝜇𝑡 ………………………………..………. (1)
Where Y is the dependent variable which describes sustainability performance indicators such as;
Return on asset
Return on Equity and
Net profit margin
X is the independent variables which represent the components of Sustainability disclosure;
X1 = Economic sustainability disclosure
X2 = Social sustainability disclosure
X3 = Environmental sustainability disclosure
u is the error term capturing other explanatory variables not explicitly included in the model. bo is the intercept of the regression.
b1, b2 and b3 are the coefficients of the regression.
From the above three models will be formulated.
𝑅𝑂𝐴𝑡 = 𝛽0 + 𝛽1𝐸𝐶𝑁𝑡 + 𝛽2𝑆𝑂𝐶𝑡 + 𝛽3𝐸𝑁𝑉𝑡 + 𝜇𝑡 …..………………...….…. (2)
𝑅𝑂𝐸𝑡 = 𝛽0 + 𝛽1𝐸𝐶𝑁𝑡 + 𝛽2𝑆𝑂𝐶𝑡 + 𝛽3𝐸𝑁𝑉𝑡 + 𝜇𝑡 …..…………...……….…. (3)
𝑁𝑃𝑀𝑡 = 𝛽0 + 𝛽1𝐸𝐶𝑁𝑡 + 𝛽2𝑆𝑂𝐶𝑡 + 𝛽3𝐸𝑁𝑉𝑡 + 𝜇𝑡 …..………………..….…. (4)
Secondary data was used in this study. Annual reports and accounts of companies selected from the Nigerian stock exchange were
used as data sources for this study. Textbooks, magazines, and the internet are some of the other resources available. Ordinary
Least Square (OLS) regression analysis is the data analysis approach.
5. ANALYSIS AND DISCUSSION OF FINDING
In this section, the critical or table values are compared with the computed t value to decide whether to reject or accept a
hypothesis
H01: Sustainability disclosure does not impact positively on return on assets of companies listed on the Nigeria Stock Exchange.
Table 5.1 Regression Result of Sustainability Reporting Indicators and Return of Asset (ROA)
Variable Coefficient Std. Error t-Statistic Prob.
C -0.043436 0.389787 -0.111434 0.9116
ECN 0.071893 0.197282 0.364419 0.7168
SOC 0.029342 0.035103 0.835875 0.4065
ENV -0.017234 0.037896 -0.454772 0.6509
R-Square = 0.019143, F-Stat = 0.390339, Prob(F-statistic) = 0.760372, Durbin-Watson stat = 1.730114
Source: Authors own computation using E View 10
ROA, is shown in Table 5.1. It demonstrates that if one unit of the economic index is increased while the others remain unchanged,
ROA will improve by 7.2 percent. It also shows that increasing the social index by one unit while keeping the rest fixed increases

Indicators of Sustainability Reporting and Performance of Non-Financial Companies in Nigeria
IJMRA, Volume 5 Issue 05 May 2022 www.ijmra.in Page 895
ROA by 2.9 percent. A unit increase in the environmental index, on the other hand, reduces ROA by 1.7 percent. Overall, economic
and social indices have a favorable impact on ROA, whereas environmental indices have a negative impact on ROA. As shown in
Table 5.1, the p-values for all of the Sustainability disclosures employed in this study are statistically insignificant at the 5% level
of significance. Furthermore, the R-Square reveals that the Sustainability disclosure index explains just 2% of the variation in ROA,
while the remaining 98% is explained by factors other than the Sustainability disclosure index. The regression result is not well-
fitting.
Decision
Since the p-value of sustainability disclosure index are greater 5%, the null hypothesis is accepted at 5% level of significance
implying that, Sustainability disclosure has not impacted significantly on return on assets of companies listed on the Nigeria Stock
Exchange
H02: Sustainability disclosure does not impact positively on return on equities of companies listed on the Nigeria Stock
Exchange.
Table 5.2 Regression Result of Sustainability Reporting Indicators and Return on Equity (ROE)
Variable Coefficient Std. Error t-Statistic Prob.
C 2.045906 1.278472 1.600274 0.1148
ECN -1.082858 0.647069 -1.673481 0.0994
SOC 0.139888 0.115136 1.214976 0.2291
ENV 0.040643 0.124295 0.326987 0.7448
R-Square = 0.058971, F-Stat = 1.253321, Prob(F-statistic) = 0.298535, Durbin-Watson stat = 2.091139
Source: Authors own computation using E View 10
The regression result of Sustainability disclosure and ROE is shown in Table 5.2. It illustrates that if the economic index is increased
by one unit, the return on investment (ROI) will fall by 108 percent. If the social index rises by one unit and all other factors remain
constant, the return on investment (ROI) will rise by 14%. It also demonstrates that increasing the environmental index by one
unit raises ROE by 4%. Overall, an increase in the economic index will lower the performance of sustainability disclosure, whereas
an increase in environmental and social factors will boost ROE. Furthermore, the R-Square demonstrates that the Sustainability
disclosure index explains just 6% of the variation in ROE, while the remaining 94% is explained by factors other than the
Sustainability disclosure index. The regression result is not well-fitting.
Decision
Since the p-value of sustainability disclosure index are greater 5%, the null hypothesis is accepted at 5% level of significance
implying that, Sustainability disclosure has not impacted significantly on return on equities of companies listed on the Nigeria
Stock Exchange.
H03: Sustainability disclosure does not impact positively on net profit margin of companies listed on the Nigeria Stock
Exchange.
Table 5.3 Regression Result of Sustainability Reporting Indicators and Net Profit Margin (NPM)
Variable Coefficient Std. Error t-Statistic Prob.
C -0.713155 0.760009 -0.938351 0.3518
ECN 0.284858 0.384661 0.740543 0.4619
SOC 0.017167 0.068445 0.250823 0.8028
ENV 0.024309 0.073889 0.328996 0.7433
R-Square = 0.015854, F-Stat = 0.322184, Prob(F-statistic) = 0.809291, Durbin-Watson stat = 2.273843
Source: Authors own computation using E View 10
The regression result between sustainability metrics and NPM is shown in Table 5.3. It reveals that a one-unit increase in the
economic index causes NPM to fall by 2.8 percent, whereas a one-unit increase in the social index causes performance (NPM) to
rise by 2%. An increase in the environment index, on the other hand, will result in a 0.2 percent increase in NPM. Furthermore,
the R-Square demonstrates that the Sustainability disclosure index explains 2% of the variation in NPM, whereas the remaining
98% is explained by factors other than the Sustainability disclosure index. The regression result is not well-fitting.

Indicators of Sustainability Reporting and Performance of Non-Financial Companies in Nigeria
IJMRA, Volume 5 Issue 05 May 2022 www.ijmra.in Page 896
Decision
Since the p-value of sustainability disclosure index are greater 5%, the null hypothesis is accepted at 5% level of significance
implying that, Sustainability disclosure has not impacted significantly on net profit margin of companies listed on the Nigeria Stock
Exchange.
The findings of the study can be summarized as:
1) Environmental sustainability disclosures have positive effect on performance of Non-financial firms in Nigeria, but not
statistically significant
2) Social sustainability disclosures have positive on performance of Non-financial firms in Nigeria. but not statistically significant
3) Environmental index of sustainability has positive effect on performance Non-financial of firms in Nigeria. but not statistically
significant
CONCLUSION AND RECOMMENDATIONS
The performance of Nigeria’s non-financial companies is driven by sustainability disclosures. According to the report, the long-
term financial benefits of engaging in sustainability disclosure policies outweigh the costs. Companies that score well on
sustainability indicators are more long-term oriented and hence more appealing to long-term investors and other stakeholders.
The study found that if a company discloses environmental issues, shareholders and other stakeholders place a high value on it.
Increased social sustainability disclosure ensures a rise in the market value of non-financial companies in Nigeria. This is evidenced
by the findings, which show that social sustainability disclosure has a favourable but minor impact on corporate performance.
According to the findings, companies in Nigeria should establish and declare sustainable friendly policies since it demonstrates
their commitment to reaching the aim of sustainable development. In a similar spirit, organizations are encouraged to link their
sustainability disclosure goals with their other performance and shareholder profit maximization goals. Economic, social, and
environmental sustainability should be included in annual reports since it influences how investors evaluate a company's ability
to generate profits in the future. Because a strong sustainability disclosure sets a company apart from its competitors,
organizations should incorporate sustainability indicators into their business model and strategy to create higher sustainability
and long-term value development. Care should be taken with business operations aimed at gaining public respect.
REFERENCES
1) Abubakar, B. A., Garba, T., etal. (2014). Corporate board gender diversity and performance: Evidence from Nigerian stock
exchange. The Economic Journal of Nepal, 34(4), 239-260.
2) Aggarwal, P. (2013). Corporate governance and corporate profitability: Are they related? - A study in Indian context.
International Journal of Scientific and Research Publications, 3(12), 1-8.
3) Albuquerque, R., Durnev, A., & Koskinen, Y. (2013). Corporate Social Responsibility and Firm Risk: Theory and
empirical evidence. Discussion Paper Retrieved January 2, 2022, from https://www.cbs.dk/files/cbs.dk/cepr-dp9533.pdf
4) Aondoakaa, K. (2015). Impact of sustainability reporting on corporate performance of selected quoted companies in
Nigeria. Enugu: Unpublished Ph.D Thesis University of Nigeria, Enugu Campus.
5) Bhatia, A., & Tuli, S. (2014). Sustainable Disclosure Practices: A Study of Sensex Companies in India. Indian Journal of
Corporate Governance, 7(1), 39-55.
6) Campbell, K., & Mínguez-Vera, A. (2008). Gender diversity in the boardroom and firm financial performance. Journal of
business ethics, 83(3), 435-451
7) Ceulemans, K., Molderez, I., & Van Liedekerke, L. (2015). Sustainability reporting in higher education: A comprehensive
review of the recent literature and paths for further research. Journal of Cleaner Production, 106, 127-143.
8) Chen, L., Feldmann, A., Tang, O. (2015). The relationship between disclosures of corporate social performance and
financial performance: Evidences from GRI reports in manufacturing industry. International Journal of Production
Economics, 170, 445–456.
9) Cohen, J. R., Holder-Webb, L. L., Nath, L., & Wood, D. (2012). Corporate reporting of nonfinancial leading indicators of
economic performance and sustainability. Accounting Horizons, 26(1), 65-90.
10) Cortez, M. A., & Cudia, C. P. (2011). Sustainability and firm performance: A case study of Japanes electronics companies.
Ritsumeikan International Affairs, 10, 321-340.
11) Delmas, M., & Blass, V. D. (2010). Measuring corporate environmental performance: the trade-offs of sustainability
ratings. Business Strategy and the Environment, 19(4), 245-260.
12) Eccles, R. G., Ioannou, I., & Sefafeim, G. (2014). The impact of corporate sustainability on organizational processes and
performance. Management Science, 60(11), 2835–2857.

Indicators of Sustainability Reporting and Performance of Non-Financial Companies in Nigeria
IJMRA, Volume 5 Issue 05 May 2022 www.ijmra.in Page 897
13) Eccles, R. G., Ioannou, I., & Sefafeim, G. (2014). The impact of corporate sustainability on organizational processes and
performance. Management Science, 60(11), 2835–2857.
14) Ehsan, S., Nazir, M. S., Nurunnabi, M., Raza Khan, Q., Tahir, S., & Ahmed, I. (2018). A multimethod approach to assess and
measure corporate social responsibility disclosure and practices in a developing economy. Sustainability, 10(8), Article
2955
15) Emeka-Nwokeji, N. A. (2019). Nexus between corporate social responsibility disclosures and market value of listed
nonfinancial firms in Nigeria. International Journal for Innovative Research in Multidisciplinary Field, 5(3), 247-255.
16) Eze, J. C., Nweze, A. U., & Enekwe, C. I. (2016). The effects of environmental accounting on a Finance Research, 4(1), 17-
27.
17) Eze, J. C., Nweze, A. U., & Enekwe, C. I. (2016). The effects of environmental accounting on a Finance Research, 4(1), 17-
27.
18) Feyitimi, O. (2014). The level of financial information disclosure and corporate attributes in developing economy.
European journal of business and management, 6(3), 176-188.
19) Fifka, M. S., & Meyer, J. (2013). Corporate responsibility reporting and its determinants in comparative perspective –a
review of the empirical literature and a meta-analysis. Business Strategy and the Environment, 22, 1-35.
20) Garg, P. (2015). Impact of Sustainability Reporting on Firm Performance of Companies in India. International Journal of
Marketing and Business Communication, 4(3), 38-45.
21) Hussain, N. (2015). Impact of sustainability performance on financial performance: An empirical study of global fortune
(N100) firms. Department of Management, Ca' Foscari University of Venice Working Paper Series n. 1/2015. Retrieved
January 8, 2022, from http://www.ssrn.com/abstract=2616835
22) Khan, M. (2019). Corporate sustainability practices impact on firm financial performance: Evidence from the Banking
Sector of Pakistan. City University Research Journal, 9(2), 427–438.
23) Khlif, H., Guidara, A., & Souissi, M. (2015). Corporate social and environmental disclosure and corporate performance.
Journal of Accounting in Emerging Economies, 5(1): 51- 69.
24) Nnamani, J. N., Onyekwelu, U. L., & Ugwu, O. (2017). Effect of sustainability accounting and reporting on financial
performance of firms in Nigeria brewery sector. European Journal of Business and Innovation Research, 5(1), 1-15.
25) Nnamani, J. N., Onyekwelu, U. L., & Ugwu, O. (2017). Effect of sustainability accounting and reporting on financial
performance of firms in Nigeria brewery sector. European Journal of Business and Innovation Research, 5(1), 1-15.
26) Nwobu, O. (2015). The relationship between corporate sustainability reporting and profitability and shareholders fund
in Nigerian banks. Journal of Accounting and Management, 5(3).
27) Osisioma, B. C. (2013). Good corporate governance: The role of the accountant. Presented at 2013 mandatory continuing
professional development programme/induction of association of national accountants of Nigeria, held at crest hotel,
rayfield, Jos, Plateau state
28) Plumlee, M., Brown, D., Hayes, R. M., & Marshall, R. S. (2015). Voluntary environmental disclosure quality and firm
value: Further evidence. Journal of Accounting and Public Policy, 34(4), 336361.
29) Skouloudis, A., Malesios, C., & Dimitrakopoulos, P. G. (2019). Corporate biodiversity accounting and reporting in
megadiverse countries: An examination of indicators disclosed in sustainability reports. Ecological Indicators, 98, 888–
901.
30) Usman, A. B., & Amran, N. A. (2015). Corporate social responsibility practice and corporate financial performance:
evidence from Nigeria companies. Social Responsibility Journal, 11(4), 749 - 763
31) Uwuigbe, U., Peter, D. S., & Oyeniyi, A. (2014). The effects of corporate governance mechanisms on earnings
management of listed firms in Nigeria. Accounting and Management Information Systems, 13(1), 159-174
32) Vujicic, T. (2015). Corporate social responsibility and stock returns: Examining US stock performance. Retrieved march
16, 2022, from http://ssrn.com/abstract=2595769
33) Xie, H; Bilal, A; Arif, H; Alam, R; Irfan, U; & Farman U. K. (2020). Sustainability Reporting and Firm Performance: The
Demonstration of Pakistani Firms. SAGE Open, 1-17
There is an Open Access article, distributed under the term of the Creative Commons
Attribution – Non Commercial 4.0 International (CC BY-NC 4.0)
(https://creativecommons.org/licenses/by-nc/4.0/), which permits remixing, adapting and
building upon the work for non-commercial use, provided the original work is properly cited.

INTERNATIONAL JOURNAL OF MULTIDISCIPLINARY RESEARCH AND ANALYSIS
ISSN(print): 2643-9840, ISSN(online): 2643-9875
Volume 05 Issue 05 May 2022
DOI: 10.47191/ijmra/v5-i5-02, Impact Factor: 6.261
Page No. 898-906
IJMRA, Volume 5 Issue 05 May 2022 www.ijmra.in Page 898
Governance Structure and Quality of Accounting Reports in Covid
19 Era
Ihenyen, Confidence Joel PhD1, Igo, Oyeintare Kennedy2
1,2Department of Accounting, Niger Delta University, Wilberforce Island, Bayelsa State, Nigeria
ABSTRACT: This article investigated the impact of governance structure on the quality of accounting reports produced by firms
operating in Nigeria during the pandemic. The study was carried out using the ex-post facto research design. The information was
derived from the annual reports and accounts of firms listed on the Nigeria Exchange Group between 2011 and 2020. The
correlation between corporate governance indicators of board structure (size-BRDSZ and independence-BRDID), audit quality
(audit committee size (ADCMZ), the quality of external audit (EADTQ as measured by the presence of an auditor among the big-
4), board experience (i.e. experience-BRDEX), and financial reporting quality is 93.47 percent, according to econometric analysis.
The independent variables can explain 54.29 percent of the variance in the FRQDA. There is general relevance among the metrics
assessing financial reporting quality, such as corporate discretionary accruals (FRQDA). The COVID-19 pandemic has a beneficial
influence on board structure (BRDSZ), board experience (BRDEX), and external audit quality (EADTQ). Furthermore, as a
consequence of the COVID-19 epidemic, independent directors on the board of company (independence-BRDID) and audit quality
(audit committee size (ADCMZ) have a detrimental impact on financial reporting quality as evaluated by the firm's discretionary
accruals (FRQDA). As a result, the research advised that a higher emphasis be placed on corporate governance indicators in order
to achieve global standard financial reporting in the Nigerian growing market for investment opportunities.
KEYWORDS: Corporate, Reporting, Board size and structure, Committee, Companies, Quality, COVID-19.
1.1 INTRODUCTION
There are extraordinary health, economic, and social issues throughout the globe, as the 2019 Covid-19 Pandemic has shown. The
pandemic was very disruptive in terms of mortality toll, several infected patients, and globally severe economic ramifications
included considerable job losses, company bankruptcy, and a global recession of around 3 per cent. (IMF, 2020). While protracted
shutdowns of enterprises' production facilities threaten their viability, the extent of the losses these businesses would suffer due
to the interruption is not yet clear. There is no doubt that many organisations will be referred to as 'patients' in the aftermath of
the catastrophe. It is yet unclear if the relief measures put in place by governments and businesses throughout the globe will be
successful. Scholars will be spurred to action by the enormity of the implications for public health and the economy, as well as the
associated uncertainty. Organisations big and small, for-profit and not-for-profit and governmental, all around the globe will have
financial accounts that show indicators of a downturn. Short sales will significantly impact the net income and book value of the
stock, putting further stress on the company's ability to access short-term financing. Impairment of goodwill, inventories and other
assets, and premeasurement of goods valued at fair value may result in subjective non-cash charges under current accounting
rules, reducing net income and equity even more. Debt-covenant breaches and bankruptcy filings may be triggered if a company's
equity falls below a specific level. It is difficult for investors to predict future cash flows and company values and for auditors to
keep track of the stated amounts in this climate. Economic actors are reacting to the continued uncertainty in a variety of ways.
We believe the following questions are fundamental and pertinent to answer these issues empirically.
The economic and financial impact of the Covid-19 epidemic has already been felt throughout the world (Goodell, 2020). According
to (Arabsalehi and Ziaee, 2010) Corporate Governance Code of Nigeria, 2003) was regarded as a standard in corporate entities.
To eliminate mismanagement, fix any governance shortcomings, avoid power abuse, and adequately manage risks, they assist
firms (Jouini, 2013). If these guidelines are followed, its reputation and shareholders' interests will be protected, so they are crucial
for a sound governance structure. When it comes time for investors to evaluate a company's directors, quality and trustworthy
information (particularly on the activities of the directors) has become a commodity that must be paid for. Corporate governance

Governance Structure and Quality of Accounting Reports in Covid 19 Era
IJMRA, Volume 5 Issue 05 May 2022 www.ijmra.in Page 899
measures (agency costs) are thus supported by both direct and indirect investments from shareholders to raise shareholders' trust
in financial reporting quality. Directors can act opportunistically since shareholders (i.e. the Principal) have little rationality (i.e.
agent). Because shareholders and other external stakeholders evaluate directors' performance via the same financial reports, this
indicates a discrepancy between shareholders' need for information and their degree of trust in the quality financial reports
provided by the company's directors.
For starters, these economic turbulences and diet instability would further impact the trust of companions' financial performance
and thus, cause different financial difficulties for organisations. This is crucial (KPMG, 2020). auditors will be unable to discover
substantial errors if the audit procedure is not consistent (Lenz & Hahn, 2015). Investing in a firm is riskier, and the cost of equity
capital is higher if a company does not assure that its audit procedures are of the highest quality (Gerged et al., 2020). Earnings
fluctuate and decline due to a loss of investor confidence during times of economic uncertainty (Arthur et al., 2015).
Consequently, determining the impact of the Covid-19 eruption on their financial performance is an urgent priority for businesses
in various countries, from rising economies to developing economies, to meet their fiscal year-end data needs for a wide range of
stakeholders (Shahzad et al., 2018). Auditor and corporate organisations confront enormous practical hurdles in many sectors,
and this unique position might lead some companies to either falter or begin manipulating their profits data. Accurate financial
statements may help investors make better decisions about the trustworthiness of financial markets (Gerged et al., 2020; Shahzad
et al., 2018; Tarek et al., 2017).
In a specific notice posted on March 22nd, the Financial Reporting Council (2020) gives auditors guidance on the effects of social
distancing measures on audit quality. When the WHO initially discovered the coronavirus virus in Wuhan, China, it was determined
to be a disease. However, the business determined that its total rate was high. It had expanded to over 190 countries where the
United States had been labelled a pandemic, a steady increase. During this period, the virus outbreak was relocated from China
to Italy, the United States, until April 2020. The alarmingly high prevalence of infection in Europe is a cause for concern (Jackson
et al., 2020; McKibbin & Fernando, 2015).
Consequently, a policy of restriction was implemented to prevent the spread from lowering demand all over the globe. The
auditor's function was diminished, and his or her obligations were undermined and harmed. This epidemic has a vast and severe
influence on the world's second-largest economy, which is anticipated to contribute to one-third of annual global economic
growth. The major European nations are making efforts to combat it. So the coronavirus epidemic in China will disrupt worldwide
demand and supply (Bouey, 2020), as well as Nigeria and Angola's primary African oil exports (Bouey, 2020).
COVID-19, according to the Financial Reporting Council (2020), must be considered by auditors in this period: The auditor's risk
assessment and whether it has to be revised. A new audit technique may emerge, prompting the need for new audit processes,
such as in-group audit engagements, which are a particular focus of an auditor's work. It is required for the audit committee to
determine whether or not an alternate way of travel limitation is possible to disclose or suggest changes in auditors' opinions. The
auditor's appraisal of the present company prospects is complex because of the uncertainty in the global economy and the
auditor's worry about the future of firms.
Covid-19's influence on business and management disclosure adequacy is based on the possibility of how firms affected by it stay
represented, and the high degree of insecurity acknowledged, such that users are directed on the quality of financial reporting.
As a result, auditors need to re-evaluate their audits before the auditor's report is signed because of the fast-changing
environment. It is expected that management would offer different papers and data. Consider marking this as a potential audit
problem and explaining it in the report if the present situation has had a significant influence on the audit is performed. For
example, The Council of Financial Reporting has suggested (2020) that we analyse the effect of COVID-19 on audit quality using a
desk research technique. As a result, our study intends to fill this vacuum in auditing research and enhance the existing body of
prior studies by examining how the COVID-19 outbreaks may affect corporate governance and financial reporting quality in
Nigeria. This pandemic's potential impact on the following five aspects of audit quality is specifically examined: Audit costs, human
resource audits, and this pandemic might all impact the quality of audits. Audit fees, audit staff salaries, and audit procedures are
all included. Thus, our research gives a complete picture of the likely effect of social distance on the quality of financial reporting
for future scholars, investors, and auditors. As a result, the following are the study's goals:
1. To determine the relationship between board size and quality of accounting reports in Covid 19 era in Nigeria?
2. To evaluate the relationship between audit quality and quality of accounting reports in Covid 19 era in Nigeria?

Governance Structure and Quality of Accounting Reports in Covid 19 Era
IJMRA, Volume 5 Issue 05 May 2022 www.ijmra.in Page 900
2.0 LITERATURE REVIEW
2.1 CONCEPTUAL FRAMEWORK
2.2 Corporate Governance: Despite Zain-aldini and Maymand's (2011) thorough definition of corporate governance as an
organisational system for managing the company's operations and producing value for shareholders, there is still much confusion
about corporate governance is. However, the concept of corporate governance that we will use for this research will include a
broader view (i.e., the viewpoint of the shareholders). The term "corporate governance" is used to describe the collection of rules
and regulations that regulate how a company's resources are managed and controlled to safeguard its shareholders' interests. The
way a business is controlled is determined by these structures, conventions, rules, laws, and processes. Keeping these frameworks
in place necessitates expenditures (agency costs) to lead directors away from self-serving and opportunistic behaviour while
simultaneously safeguarding the interests of shareholders (Mehrani and Safarzade, 2011). Investing in the corporate governance
system allows shareholders to ensure that the board reasonably pursues their interests (i.e., maximising profits). The variety of the
board's backgrounds and experience and the high quality of the audits are all evidence of this commitment. Investment in these
areas is expected to help shareholders raise performance and improve the quality of financial reporting, which is a requirement of
regulators (Mehrani and Safarzade, 2011). When financial reports provide high-quality information, investors are more likely to
place their faith in them.
Financial reporting quality will define the amount of shareholder trust in the COVID-19 age, and this study attempts to understand
how the corporate governance structure impacts that level. This research examines the composition of the board (focusing on its
size and independence), the board's flexibility (focusing on the credentials and experience of its directors), and the audit's overall
quality (with emphasis on the presence of an internal audit committee and the use of an external auditor among the big four).
2.3 Quality of Financial Reports: For evaluating the quality of financial reporting, prior research has proposed many ways. The
accrual models, the earnings relevance model and other models used qualitative data (Jouini, 2013). Managers' use of discretionary
accruals to transfer reported revenue across fiscal periods was previously studied as an essential part of financial reporting quality.
Discretionary accruals are calculated by subtracting non-discretionary accruals from total accruals. According to Dechow, Ge, and
Schrand (2010), "Non-discretionary accruals may reveal adjustments that reflect underlying performance, whereas discretionary
accruals capture distortions generated by the application of earnings management or the accounting rules". As a result, we will
utilise the modified Jones model of accrual presented in the study of Dechow and Dichev (2002).
2.4 Quality of Financial Reporting and the Board's Structure
Board structure examines issues such as the number of directors, their independence, and the size of the board. Conflicting evidence
exists on the relationship between the size of the board, level of independence and the level of quality in the financial reporting
provided by public companies.
When a company just has a small number of directors, it is easier for them to coordinate their efforts with management, according
to Jensen (2013) and other pioneering studies. According to Bradbury, Mark, and Tan, a large board might lead to managerial
entrenchment (2006). As coordination and communication problems deepen, directors cannot keep an eye on management.
According to Adams, larger boards have increased profits management while diminishing income transparency (2006). However,
according to Byard, Li, and Weintrop (2006), having a large board size assures the value of financial statements.
Prior studies have shown that independent boards are less likely to engage in profit management (Klein, 2002 and Peasnell et al.,
2000). The quality of information increases as the number of independent directors increases (Vafeas, 2005; Vafeas & Karamanou,
2005 and Bushman, Chen and Engel and Smith (2004 ). According to Dimitropoulos and Asteriou (2010), having an independent
board of directors has increased the profitability of Chinese enterprises. Nesrine and Abdelwahid (2011) concluded that board
independence improves profits quality, but the low number of independent directors and high frequency of CEO duality in Tunisian
firms may make this unfeasible. In contrast, studies conducted by Petra (2007), Bradbury et al. (2006), and Ahmed, Hosain and
Adams (2006), concluded that independent directors do not have the skills necessary to supervise the managers, and their position
on the board does not strive to assure the quality of financial reporting on the company. According to studies by Cornett, McNutt,
and Tehranian, board independence has a negative link with financial reporting quality.
2.4.1 Quality of Financial Reporting and Board Experience
Including the "board flexibility" measure of extra corporate governance is one of the study's distinguishing aspects. There are only
professional and experienced directors on the board for the interest of the shareholders. This study will look at the director's
credentials and expertise concerning the quality of financial reporting as a measure of board adaptability.
2.5 Accounting and Financial Reporting Quality
An influential internal audit committee and an external auditor from one of the Big Four is essential in assessing the quality of
accounting report. It is the audit committee's job to make sure that the reporting process and the financial statements are audited

Governance Structure and Quality of Accounting Reports in Covid 19 Era
IJMRA, Volume 5 Issue 05 May 2022 www.ijmra.in Page 901
to the highest standards. When it comes to practical corporate governance, the role played by the internal audit committee is
pivotal, particularly in ensuring that the accounting process is accurate (Rezaee & Riley, 2010). Prior studies found that audit
committees and the frequency of their meetings helped reduce the incidence of financial reporting difficulties (Erena & Tehulu
2012; Kent & Stewart, 2008 and Farber, 2005). Also, Greco (2012) and Parwit, Smith, and Wood (2009) found that organisations
with vital internal audit quality functions do not support income manipulations, resulting in lower accrual values. Having an external
auditor from the big 4 is a way for the company's owners (shareholders) to ensure that financial statements are presented accurately
and fairly, which boosts their confidence in the financial reports they receive. There is a strong correlation between having an
external auditor in the top four and the quality of the financial disclosures made by directors (Leung, Morris & Gray, 2005).
2.5:1 Audit Fees and COVID-19
For an audit of an organisation's finances, auditors charge a fee (Walid, 2012). Because of this, Chen et al. (2019) postulated that
audit companies and their clients should change the ground in light of economic difficulties brought on by the pandemic since
audit fees would be affected by the firm's risk, liquidity, and efficiency. Specifically, there is a danger that the company may breach
the contract agreement terms, resulting in the bankruptcy of individual businesses. For example, auditors would be compelled to
employ more extensive audit methodologies and spend more time assessing the assumptions of the corporation's continuing
concern due to rising risk levels and creditor difficulties (Noh et al., 2017; Chen et al., 2019).
Auditor working hours will increase as audit litigation rises because of the increased agitation during this outbreak (Karim & Zijl.,
2013; Yuen et al., 2013). Reduced fees and lower incumbency fees at the beginning of future expenses have destroyed the
independence and quality of the auditor, so lowballing is not an option to compromise audit efficiency. Meanwhile, a reasonable
proposal and competitive answer are made to anticipate these technical advantages. However, in most cases, this is likely to be
incorrect. According to Xu et al. (2013), audit fees in Australia rose throughout the financial crisis, studied by the researchers.
According to the authors, consumers' growing concern about corporate risk is to blame for the rise in audit activity. As a result of
the global financial crisis, several earlier research has shown that corporations may negotiate lower audit fees (Alexeyeva &
Svanström 2015; Bozec & Dia 2017, Chenec et al. 2018, Chen et al. 2019, Karim & Zijl, 2013; Krishnan & Zhang 2014; Krishnan et
al. 2015). Home-based work has become the 'new normal,' increasing hours worked and commitment of auditors due to the
COVID19 epidemic. Companies (Clients) are more likely to seek lower audit fee balances due to this trend (Chen et al., 2019).
Because of this external COVID-19 shock, auditors may lower their efforts to ameliorate the loss of commitment; hence, clients
may demand auditors to reduce audit fees during the crisis. Consequently, This pandemic epidemic seems to have had a significant
influence on the competence of auditors.
2:5.2. Audit Procedures
The efficiency of systematic techniques, forming an essential component of the auditing process, is another problem impacting
the current pandemic (Messier et al., 2013). Because audit preparation, information gathering, appraisal, reporting phases, and
analytical techniques are used (Messier et al., 2013; Noh et al., 2017; Trompeter &Wright, 2010). As many businesses will go
bankrupt or fudge their stated profits during the COVID-19 outbreak during this time, analytical techniques must be used more
frequently by auditors since they are the least expensive and easy to measure (Rose et al., 2019). When it comes to costs, analytical
audit techniques are desirable, and they can be applied to direct and equip auditors with delicate bits of submission backing their
findings. Usually, these procedures require a diagnostic method that identifies the origin of account balance fluctuations or the
possibility of serious misrepresentation discovered throughout the audit plan (Rose et al., 2017; Rose et al., 2019). The issue of
fraud is a possible challenge to auditors is associated with producing multiple explanations (Rose et al., 2019). They considered
that many alternative theories' development does not trigger a critical idea and may straighten work in the other direction (Hirt
et al., 2004; Kadous et al., 2006). Meanwhile, auditor engagement should allow a complete awareness of the financial statement,
thus involving several comprehensive checks that are more costly and attract a more extended period to take into consideration
since the majority of communications are by email in this epidemic era of covid-19 (KPMG, 2020). To ensure the auditor's findings
are accurate, the critical issue of an auditor is the signal of accuracy. If the information reported lacks merit or insufficient
consistency, then a higher risk of audit job is observed, forming an incorrect audit opinion (Rose et al., 2017). Therefore, the work-
from-home strategy will affect audit evidence's adequacy and reliability and, consequently, impact audit quality (KPMG, 2020).
2.5.3 Audit Staff Remuneration
A report on audit staff remuneration and covid-19 say that because of many changes in the public accounting business, there is
much uncertainty and more work for auditors, making their pay important (Persellin et al., 2018). Since the start of covid-19, many
new steps have been taken to help staff and businesses in this time. Some businesses have talked about cutting wages or giving
employees unpaid leave (Deloitte, 2020). When it comes to how the audit staff is paid, it is unclear how that relates to how well
the audits are done. The theories of efficiency wages say that higher salaries can help audit workers be more productive by working
harder or attracting better-quality audit workers (Hoopes et al., 2018). As a result, the epidemic could affect the audit staff's

Governance Structure and Quality of Accounting Reports in Covid 19 Era
IJMRA, Volume 5 Issue 05 May 2022 www.ijmra.in Page 902
wages, making them less motivated to do their jobs well and efficiently. So, we think that if the wages of audit staff were to go
down, it could affect the quality of audits.
2.5.4 Governance Structure Variables
2.6 Theoretical Framework
Throughout the ages, theories on corporate governance theory have been tested and refined. Theories such as Stewardship and
stewardship theory are also included in this list of theories: The Agency Theory was chosen to best describe this work for this
investigation.
2.6.1 Agency Theory
This theory is used as a theoretical framework in this study. In the context of an agency relationship, one person, known as the
principle, assigns responsibilities to another, known as the agent. It is possible that the agent may not act in their best interest or
that they will only act partially in their best interest while operating on behalf of their client due to the agency relationship's
inherent opportunism or self-interest.
Concerning corporate control and governance, the board of directors is seen as a crucial monitoring instrument under agency
theory to ensure that any issues arising from the principal-agent relationship are minimised. According to Blair (1996),
management is meant to be the "agent" of a company's "owners," but managers must be overseen, and institutional structures
must provide certain checks and balances to guarantee that they do not abuse their position. Agency is a concept heavily
influenced by the division of ownership in organisations. In the context of corporate governance, this link is sometimes referred
to as an agent-principal relationship.
2.7Empirical Literature
Prior studies into the relationship between governance structure and the quality of financial reporting have produced mixed
results. Abdulkadir and Noor (2013) analyse the connection between audit committees and higher financial reporting quality using
the Dechew and Dichev (2002) model. They found that the audit committee's presence improves the quality of financial reporting.
Also, the study revealed that a committee with a chairman that is independent and has expertise influences the quality of financial
reports positively.
Shehu (2013) also looked at monitoring, and the quality of financial reporting in Nigerian publicly listed manufacturers. Having
independent directors and an audit committee are essential variables in determining the capacity of a corporation to be checked
for them by using a modified Dechow-Dichev (2002) model, which includes 32 firm-years longitudinal data of 160 observations.
According to the research findings, monitoring elements are favourably connected with financial reporting quality. Investors in
Nigerian manufacturing companies should guarantee that the board of directors is structured to ensure that the board can oversee
management's manipulative accounting while putting up financial statements, according to the authors of the study.
Kajola (2008) focuses on four governance measures (the size of the board, composition, the status of the CEO and the audit
committee). Board composition does not seem to have a statistically significant association with Return on Equity or Profit Margin.
As a result, it can be deduced that there is no correlation between the financial success of the tested companies and the presence
of an outside director on the board.
According to Yau and Emmanuel (2013), a sample of 35 publicly traded Nigerian companies' annual reports spanning 1999-2009
provided data on the influence of governance structure on publicly traded firms' voluntary disclosure of information. There were
significant discrepancies in information disclosures in Nigeria before and after the introduction of corporate governance
standards, and Nigeria's publicly listed firms have seen a meaningful increase in the level of voluntary disclosure, they explained.
Nigeria's Consumer Goods Industry was the focus of Garba's (2013) research on the influence governance structure has on
financial reporting quality. In December 2012, a random sample of five publicly listed Nigerian companies was selected and
monitored for five years (i.e. 2008-2012). Correlation and regression were used to analyse data from annual reports and financial
statements. According to the results, financial reporting in Nigeria's consumer products business is improved by the size and
BOARD STRUCTURE
Board size-BRDSZ
Independence-BRDID),
Audit committee size -ADCMZ
AUDIT QUALITY
Quality of external audit Presence (Big4) -EADTQ
Quality of
Financial
Reports
FRQDA-
measured by
Discretionary
accruals

Governance Structure and Quality of Accounting Reports in Covid 19 Era
IJMRA, Volume 5 Issue 05 May 2022 www.ijmra.in Page 903
makeup of the company's board. As a result of this company's size, an audit committee of five to six members is recommended.
Increase the number of non-executive directors to have a more diverse range of perspectives. It would increase the accuracy of
financial reports prepared by the firm.
The financial reporting quality and governance structure of Foods and Beverages company in Nigerian was examined by Dalhatu
(2012). Primary and secondary methods were used to get the data. The Chi-square method of data analysis was used to examine
the results. According to a study, food and Beverage companies' information disclosures may be influenced by a Code of Corporate
Governance. To ensure that investors and other stakeholders are provided with enough information, this research found that
frequent reviews of the Nigerian Stock Exchange's Code of Corporate Governance practice were essential. Considering the effect
of corporate governance on the quality of financial reporting by Nigerian publicly traded manufacturing firms,
Baba (2011) conducted research. More than half of Nigerian manufacturing organisations were represented in this study by the
data acquired from 12 representative sample firms. Multiple regressions were used to analyse the data in this study. The results
demonstrate a strong connection between effective corporate governance and accurate financial reporting in Nigerian publicly
traded industrial companies. It is suggested that the authorities should, among other things, step up their enforcement of the
disclosure and transparency of financial statements for NSE-listed companies.
When examining the effect that governance has on financial reporting quality on a global scale, a study of industrial businesses
listed in Amman Financial Market was conducted by Jamil, Mohamad, Mamdouh, and Hassan (2013). Data were collected from
both primary and secondary sources using a questionnaire sent to all participants in the study. Some of the findings were as
follows: a thorough understanding of corporate governance by designers and consumers of financial statements, together with a
framework for its implementation in assisting Jordanian industrial enterprises listed on the Amman Financial Market. In
community research, it was discovered that the successful adoption of corporate governance principles improves the quality of
financial reporting. In addition, it was discovered that financial statement creators and consumers should be thoroughly
conversant with the corporate governance concept and the underlying principles of its implementation in industrial businesses
listed on the highly regarded Amman Financial Market. According to the research, that is not all, which found that sound corporate
governance principles had a positive impact on financial reporting quality.
Heirany, Sadrabadi, and Mehrjordi (2013) looked at the relationship between a company's operating ratio and the quality of its
accounting income to see how corporate governance systems affect financial reporting quality. Corporate governance methods
like power concentration, institutional shareholder ownership percentages, and board independence have all been considered in
this research. Sixty businesses from the Tehran Stock Exchange were chosen as a representative sample between 2006 and 2010.
The study ideas were put to the test using multiple regressions. According to the study's findings, robust corporate governance
systems are linked to higher reported profitability.
Another study found that corporate governance traits have influenced financial reporting quality in Tehran Stock Exchange (TSE)
listed businesses from 2003 to 2011 (Challaki, Didar, and Riahinezhad 2012). For financial reporting quality assessment purposes,
the study used McNicols (2002) and Collins and Kothari (1989), which included consideration of corporate governance factors.
According to the conclusions of this study, corporate governance characteristics such as board size, independence, the
concentration of ownership, and institutional ownership have little impact on the quality of financial reports. No association seems
to exist between audit size, company size, age and financial reporting quality (such as financial reporting).
However, Gonçalves (2010) investigated the relationship between the composition and aspects of corporate governance and the
financial reporting quality of Portuguese firms. All publicly listed companies in Portugal are included in the study's population.
Over six years, there were 234 observations each year based on evidence from 39 firms and linked to the sample period. The data
from the sample may be analysed using descriptive statistics. According to the research, changing board composition and
independence did not affect the quality of financial reporting in publicly traded Portuguese companies. There was a positive
correlation between board size and the degree of accounting discretion, with a giant board producing better financial reporting.
Also, in 2010, the effect of corporate governance on financial reporting disclosures in Bangladesh corporations was examined by
Hasan, Hossain, and Swieringa (2010). There were 40 people in all, with a sample size of 20, or half of the total. The data was
analysed using Descriptive Statistics. There was a substantial correlation between the degree of financial disclosures made by
companies and the presence of an external auditor, a factor in corporate governance that was examined. The amount of financial
transparency is not significantly influenced by other factors such as board independence, the board size, dominating personality,
institutional ownership, or the general public. As a result, Bangladesh's corporate governance system is not up to snuff.
3.0 RESEARCH METHOD
The descriptive research approach will be employed for this study, spanning ten (10) years between 2011 and 2020. Throughout
the research, all of the companies listed on the Nigerian Stock Exchange comprise the study's population. For this study, a purposive

Governance Structure and Quality of Accounting Reports in Covid 19 Era
IJMRA, Volume 5 Issue 05 May 2022 www.ijmra.in Page 904
selection approach was used to choose a sample of five enterprises from each of the three major economic sectors (manufacturing,
service and banking). Granger causality econometric tests were used to analyse the variables.
3.1 Specification of the model
The Jones Model has been used in a large number of prior researches. Non-discretionary accruals in the event year are often
referred to as the Jones Concept for non-discretionary accruals in the event year by Jones (1991), who developed the model. In
contrast, this research model is based on the following formula:
𝐹𝑅𝑄 = 𝛽0 + 𝛽1𝐵𝑅𝐷𝑆𝑍 + 𝛽2𝐵𝑅𝐷𝐼𝐷 + 𝛽3𝐵𝑅𝐷𝐸𝑋 + 𝛽4𝐴𝐷𝐶𝑀𝑍 + 𝛽5𝐸𝐴𝐷𝑇𝑄 + 𝜇𝑡 ……. (3.1)
Where: FRQ = financial reporting quality as defined by company discretionary accruals
BRDSZ = the number of directors on the firm's board of directors
BRDIDi = is the percentage of independent directors on the firm's board.
ADCMZ = denotes the size of the audit committee in the business.
EADT = the existence of an internal audit committee and the employment of an external auditor among the main four.
BRDEX = the presence of competent and experienced directors on the firm's board of directors.
Previous portions of this research dealt with all of the dependent variables, including the structure of the board (BRDSZ and BRDID),
quality of audit (audit committee size (ADCMZ), and external audit quality (EADTQ as evaluated by the inclusion of an auditor among
the big-4) and board experience (BRDEX). Many researchers have used discretionary accruals as a proxy for "financial reporting
quality".
4.0 RESULTS AND DISCUSSION
The three most critical dependent factors are board structure (BRDSZ and BRDID), audit quality (ADCMZ and BRDID), and board
experience. The model's predictions are heavily influenced by these factors, which have been described in detail in the model's
specification. In this study, many researchers have used "financial reporting quality" as a proxy for discretionary accruals. The model
estimate has a feeling of direction because of the diagnostic tests.
Table 1: Diagnostic Check for Residual
Residuals Test Value P-value Conclusion
Normality JB-test 0.6200 0.7334 Not Normal
Serial LM-test 1.5084 0.3986 Not Serially Correlated
Heteroskedastic ARCH 0.3236 0.5871 Presence of homoskedasticity
Stability Ramsey Ret 8.6587 0.0099 Stable
Source: Authors own Computation using E view 10
Corporate governance model variables are not regularly distributed when tested in a diagnostic test. Homoscedasticity is present
in the series, but there is no link between them. Because the OLS's assumptions are not met, Granger Causality should be used as
the suitable model estimate for this investigation.
According to the findings of Granger causality tests
The R2, t-test, and F-test are significant in the decision-making process about the direction of causation in causality connections. It
has been observed that even when fundamental mistakes are uncorrelated and share common variance, the OLS residuals used in
all diagnostic tests are correlated and heteroscedastic. Table 6.3 shows the results of Granger causality testing.
Table 2: Granger Causality Test Result
Null Hypothesis: Obs F-Statistic Probability
BRDSZ does not Granger Cause FRQDA 8 0.39041 0.70681
FRQDA does not Granger Cause BRDSZ 22.1538 0.01597 BRDID does not Granger Cause FRQDA 8 4.06461 0.13995 FRQDA does not Granger Cause BRDID 13.1674 0.03270 BRDEX does not Granger Cause FRQDA 8 1.35617 0.38059 FRQDA does not Granger Cause BRDEX 1.03383 0.45548
ADCMZ does not Granger Cause FRQDA 8 0.46649 0.66619 FRQDA does not Granger Cause ADCMZ 26.4637 0.01242 EADTQ does not Granger Cause FRQDA 8 0.18718 0.83829 FRQDA does not Granger Cause EADTQ 0.42388 0.68845
Source: Authors own Computation using E view 10

Governance Structure and Quality of Accounting Reports in Covid 19 Era
IJMRA, Volume 5 Issue 05 May 2022 www.ijmra.in Page 905
According to the causality test findings provided in table 2, board structure measurements of board size (BRDSZ) and independence
(BRDID) do not granger cause financial reporting quality as discretionary accruals for COVID-19 era enterprises. Financial reporting
quality (FRQDA) and firm discretionary accruals (FRQDA) are examples of corporate governance metrics. FRQDA has not been
exacerbated in the near term by audit quality (as evaluated by the existence of an auditor among the big-4) or board experience
(i.e. experience-BRDEX). External auditing standards and audit committee size (measured by the presence of an auditor among the
big-4). As far as audit quality and board experience go, FRQDA grange is not to blame for either (the size of the audit committee,
ADCMZ) (i.e. experience-BRDEX). In the short run, financial reporting quality in Nigeria is impacted by corporate governance metrics
and audit quality. – The quality of a financial report will be defined by the level of confidence that shareholders have in the financial
reports. According to Dabor and Adeyemi (2009), this is less probable if people have less faith in corporate governance structures,
norms, and institutions. "Insider trading" may occur due to shareholders who are unsatisfied with the financial report of the
directors and are willing to pay to learn more about their internal operations. If other shareholders are obliged to pay more for the
company's knowledge, which has become a commodity, they may transfer their equity.
5.0 CONCLUSION AND RECOMMENDATIONS
The global financial crisis is a strong indicator that this health crisis will intensify and that the impact of the COVID-19 pandemic
will be the most difficult for auditors and their clusters since many people believe that this epidemic is an issue that affects
companies' money. This paper examines how the COVID-19 outbreak has influenced audit efficiency, providing advice for future
auditors and researchers after this external shock.
According to Abbas (2011), Alzoubi (2012), and Hassan (2013), the corporate governance system of Nigerian firms serves as a
means of encouraging directors to act in the best interests of shareholders by influencing the quality of financial reporting. This
study has thus established empirical links between the corporate governance system and shareholder confidence in financial
reporting quality, which is consistent with these studies. According to this study, the financial reporting of Nigerian companies
may be affected by the level of corporate governance indicators and audit quality. Nigeria's Guarantee Trust Bank Plc's financial
reporting performance (size-BRDSZ) and audit committee size are better than those of the other four companies in the study
(ADCMZ).
The research has harmed an audit report by the epidemic, which has resulted in low-quality financial reporting by companies
throughout the nation.
According to the findings, Nigerian companies should take corporate governance indicators seriously to enhance the quality of
financial reporting under COVID-19. A company's financial reporting quality is directly impacted by the number of members on
the audit committee (ADCMZ) and the number of independent directors (BRDID). Efforts must be made to improve corporate
governance procedures in Nigeria's rapidly expanding market in order for the country to meet international accounting standards.
REFERENCES
1) Abdussalam, D., MAT (2013). Suitable corporate governance mechanism and firms operating and financial performance:
Perspective of Jordanian Industrial Companies. Working Paper, April, 15
2) Alexeyeva, I., & Svanström, T. (2015). The impact of the global financial crisis on audit and non-audit fees: evidence from
Sweden, Managerial Auditing Journal, 30, (4/5), 302-332.
3) Arthur, N., Tang, Q., & Lin, Z. (2015). Corporate accruals quality during the 2008–2010 global financial crisis, Journal of
International Accounting, Auditing and Taxation, 25, 1-15.
4) Bourey, R., (2020). The monitoring function of the board and audit fees: contingent upon ownership concentration,
International Journal of Accounting and Information Management, 25(1), 70-90.
5) Calderon, T.G., & Green, B.P. (1994). Signalling fraud using analytical procedures, Ohio CPA Journal, 53(2), 27-38.
6) Bradbury, M., Mak, Y. Tan, S. (2006), “Board characteristics, audit committee characteristics and abnormal accruals".
Pacific Accounting Review, 18, 47-68
7) Byard, D., Li, Y. Weintrop, J. (2006), “Corporate Governance and the Quality of Financial Analyst’s Information”, Journal of
Accounting and Public Policy, 25, 609-625.
8) Chen, H., Hua, S., Liu, Z., & Zhang, M. (2019). Audit fees, perceived audit risk, and the financial crisis of 2008”, Asian
Review of Accounting, 27(1), 97-111.
9) Dechow, Ge, Schrand (2010), “Understanding earnings quality: A review of the proxies, their determinants and their
consequences", Journal of Accounting and Economics. 50(3).344-401.
10) Dechow, P., R. Sloan, A. Sweeney. (1995), “Detecting earnings management”, The Accounting Review. 70. 193-225.

Governance Structure and Quality of Accounting Reports in Covid 19 Era
IJMRA, Volume 5 Issue 05 May 2022 www.ijmra.in Page 906
11) Dechow, P.M. Dichev, I.D. (2002), “The quality of accruals and earnings: The role of accrual estimation errors", The
Accounting Review. 77. 35-59.
12) Firth, M., Fung, P. Rui, O. (2007), “Ownership, two-tier Board Structure, and the Informativeness of Earnings: Evidence
from China. Journal of Accounting and Public Policy, 26, (4), 463-496
13) Gerged, A.M., Mahamat, B.B., & Elmghaamez, I.K. (2020). Did corporate governance compliance have an impact on
auditor selection and quality? Evidence from FTSE 350”, International Journal of Disclosure and Governance, 17(2/3),
15-60
14) Goodell, W.J. (2020). COVID-19 and finance: agendas for future research, Finance Research Letters, 35(1), 05-12.
15) Jensen, M.C., (2013), “The Modern Industrial Revolution Exit, and the Failure of Internal Control System”, Journal of
Finance.48.831-880
16) Jouini, F., (2013), “Corporate Governance System and Quality of Information: Mediterranean” Journal of Social Sciences,
Vol 4, No. 2, (P) 129-142
17) Karamanou, I. Vafeas, N. (2005), “The Association between Corporate Boards, Audit Committees, and Management
Earnings Forecasts: An Empirical Analysis”, Journal of Accounting Research, 43, (3), 453- 486.
18) Karim, A.K.M.W., & Zijl, T.V. (2013). Efficiency and opportunism in auditor quality choice in emerging audit services
markets: the case of Bangladesh, International Journal of Accounting and Information Management, 21(30), 241-256.
19) KPMG, (2020). COVID-19 Potential impact on financial reporting, available at financial-reporting-resource- centre.html
(accessed April 27th 2020).
20) Mehran, K. & Safarzade. M. (2011). “Explaining the relationship between corporate governance and earnings quality with
a local approach", Accounting Science, Vol. 2 No. 7. Pp 69-98 PMCid:PM C3167199.
21) Messier, W.F., Simon, C.A., & Smith, J.L. (2013). Two decades of behavioural research on analytical procedures: what
have we learned? Auditing Journal of Practice and Theory, 32(1), 139-181
22) Noh, M., Park, H., & Cho, M. (2017). The effect of the dependence on the work of other auditors on an error in analysts'
earnings forecasts, International Journal of Accounting and Information Management, 25(1), 110-136.
23) Peasnell, K., Pope, P. & Young, S. (2000), “Accrual Management to Meet Earnings Targets: UK Evidence Pre- and Post-
Cadbury”. British Accounting Review, 32, 415-445.
24) Rezaee .Z. and Riley .R. (2010), Financial Statement Fraud; Prevention and Detection” Second Edition. John Wiley and Son Inc.
25) Rezaee, Z. (2008), High-Quality Financial Reporting (The Six-Legged Stool). Strategic Finance. PMCid:PMC2390549.
26) Rose, A., Rose, J., Sanderson, K., & Thibodeau, J. (2017). When should audit firms introduce analyses of big data into the
audit process? Journal of Information Systems, 31(3), 81-99.
27) Rose, A.M., Rose, J.M., Suh, I., & Thibodeau, J.C. (2019). Analytical procedures: are more good ideas always better for
audit quality? Behavioral Research in Accounting, 32(1), 37-49.
28) Shahzad, K., Pouw, T., Rubbaniy, G., & El-Temtamy, O. (2018). Audit quality during the global financial crisis: the investors'
perspective, Research in International Business and Finance, 45, 94-105.
29) Tarek, M., Mohamed, E.K., Hussain, M.M., & Basuony, M.A. (2017). The implication of information technology on the
audit profession in developing country: extent of use and perceived importance", International Journal of Accounting and
Information Management, 25(2), 237-255.
30) Trompeter, G., & Wright, A. (2010). The world has changed: have analytical procedure practices? Contemporary
Accounting Research, 27(2), 669-700.
31) VanBeest F., Braam G., Boelens S. (2009), “Quality of Financial Reporting: measuring qualitative characteristics”, Nijmegen
Center for Economics (NiCE) Working Paper 09-108.
32) Walid, EG (2012). Determinants of audit fees: Evidence from Lebanon. International Business Research, 5(11), 136-145.
33) Xu, Y., Carsona, E., Fargherb, N., & Jiang, L. (2013). Responses by Australian auditors to the global financial crisis,
Accounting and Finance, 53(1), 303-338
34) Yuen, D.C.Y., Law, P.K.F., Lu, C., & Guan, J.Q. (2013). Dysfunctional auditing behaviour: Empirical evidence on auditors’
behaviour in Macau, International Journal of Accounting and Information Management, 21(3), 209-226
35) Zain-aldini & Maymand, L. (2011), “The impact of corporate governance on the relationship between capital structure and
firm value". MA Thesis; Yazd Islamic Azad University.
There is an Open Access article, distributed under the term of the Creative Commons Attribution – Non Commercial 4.0 International (CC BY-NC 4.0) (https://creativecommons.org/licenses/by-nc/4.0/), which permits remixing, adapting and building upon the work for non-commercial use, provided the original work is properly cited.

INTERNATIONAL JOURNAL OF MULTIDISCIPLINARY RESEARCH AND ANALYSIS
ISSN(print): 2643-9840, ISSN(online): 2643-9875
Volume 05 Issue 05 May 2022
DOI: 10.47191/ijmra/v5-i5-03, Impact Factor: 6.261
Page No. 907-910
IJMRA, Volume 5 Issue 05 May 2022 www.ijmra.in Page 907
Research on Data Visualization Technology Based on Python
Feng Li1, Lingling Wang2
1,2School of management science and Engineering, Anhui University of Finance and Economics, Bengbu
233000, China
ABSTRACT: This study aims to research on data visualization technology using Python language. Python is an open-source
programming language developed with the community-based model. In this paper, different visual presentation types are
introduced, such as visualization of text data, network visualization, and visualization of spatial information. Additionally,
common data visualization techniques are presented in this paper. Finally, some data visualization tools (Smartbi, D3, Google
Chart API, Processing, and Rapidminer) are described in this paper.
KEYWORDS: Visualization Technology, Python, Data Visualization Tools
I. INTRODUCTION
Python is easy to learn as well because of its simple syntax, which has a powerful interactive network visual information
management library with numerous information visibility optimization libraries. It is an open-source programming language
developed with the community-based model. It’s free to use, and since it’s open-source supports multiple platforms and can be
run on any environment. For example, 2D and 3D information visualization optimization libraries Matplotlib, Seaborn and
Pandas, Folium, Basemap, MapBox, GeoPlotlib, PyechartsMap, etc. Information visualization management library of social
Service Network networkX, Wordcloud, a library for information visibility optimization of dictionaries and cloud images, and
WordCloud from Pyecharts.
The Matplotlib library is Python's third-party data visualization library and the most widely used data visualization drawing
library in Python. It is very convenient to get the general information of the data. The Numpy library is Python's base for data
processing and is the foundation of high-performance scientific computing and data analysis. Because it provides a large number
of mathematical function libraries for data operation, it can be used to store and process large matrices, supporting a large
number of dimensional arrays and matrix operations. Pandas is a well-known data analysis library for Python. It includes a large
number of databases and standard data models and provides the tools needed to efficiently manipulate large data sets. The
main function is to do a lot of data processing but also can draw the efficient completion of the drawing work. The Seaborn
library is a graphical visualization Python package based on Matplotlib that allows to creation of beautiful charts with just a few
lines of code. The advantage is that it provides a highly interactive interface for statistical visualization. It has a high-level
interface that can draw attractive statistical graphics. The visualization results obtained from Seaborn are often faster and more
beautiful. The Bokeh library is an interactive visualization library for modern Web browser rendering capabilities. It is the use of
Python through a simple and fast way to provide high performance of the interaction of large data sets to get multi-functional
visualization. Pyqtgraph is a pure Python graphical GUI library based on PyQt4/PySide and Numpy libraries. It is written entirely
in Python. However, due to the internal use of the NumPy library and GraphicsView framework, it can carry out a large number
of digital processing and rapid display [1].
II. VISUAL PRESENTATION TYPE
At present, there are all kinds of data analysis and visualization applications on the network. These visualization technologies can
be divided into three categories from the technical perspective: text data visualization, network visualization and spatial
information visualization [2].
(1) Visualization of text data
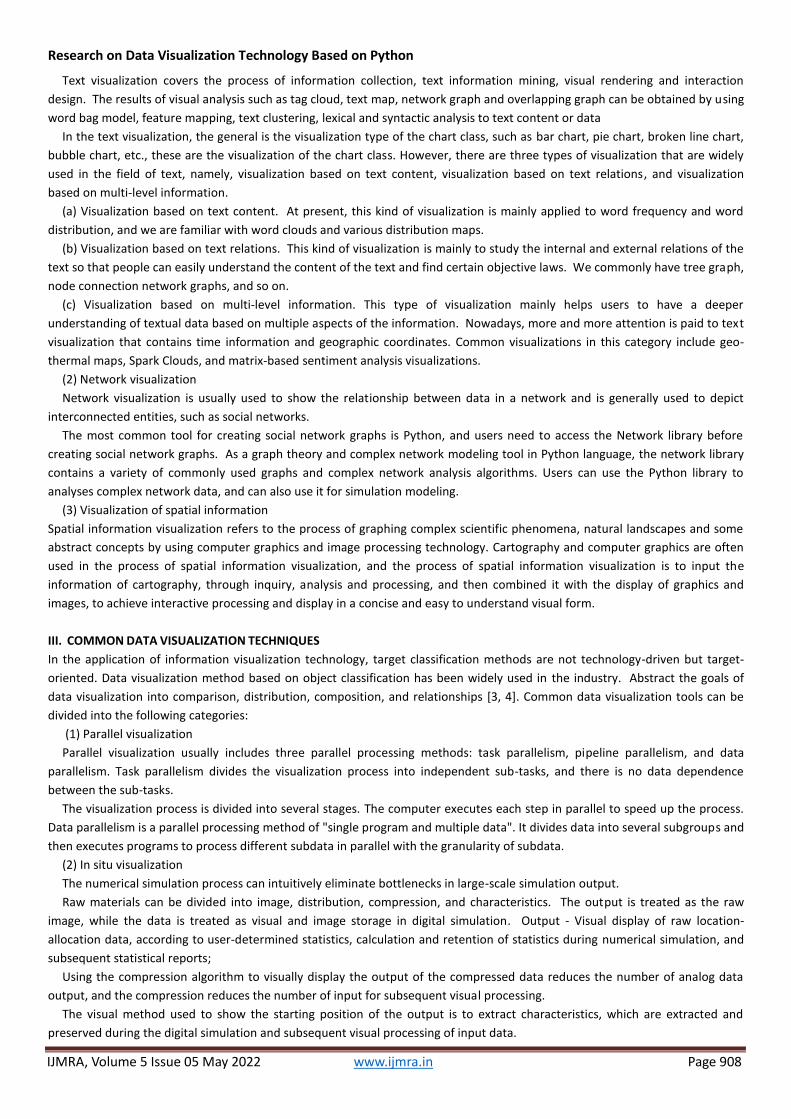
Research on Data Visualization Technology Based on Python
IJMRA, Volume 5 Issue 05 May 2022 www.ijmra.in Page 908
Text visualization covers the process of information collection, text information mining, visual rendering and interaction
design. The results of visual analysis such as tag cloud, text map, network graph and overlapping graph can be obtained by using
word bag model, feature mapping, text clustering, lexical and syntactic analysis to text content or data
In the text visualization, the general is the visualization type of the chart class, such as bar chart, pie chart, broken line chart,
bubble chart, etc., these are the visualization of the chart class. However, there are three types of visualization that are widely
used in the field of text, namely, visualization based on text content, visualization based on text relations, and visualization
based on multi-level information.
(a) Visualization based on text content. At present, this kind of visualization is mainly applied to word frequency and word
distribution, and we are familiar with word clouds and various distribution maps.
(b) Visualization based on text relations. This kind of visualization is mainly to study the internal and external relations of the
text so that people can easily understand the content of the text and find certain objective laws. We commonly have tree graph,
node connection network graphs, and so on.
(c) Visualization based on multi-level information. This type of visualization mainly helps users to have a deeper
understanding of textual data based on multiple aspects of the information. Nowadays, more and more attention is paid to text
visualization that contains time information and geographic coordinates. Common visualizations in this category include geo-
thermal maps, Spark Clouds, and matrix-based sentiment analysis visualizations.
(2) Network visualization
Network visualization is usually used to show the relationship between data in a network and is generally used to depict
interconnected entities, such as social networks.
The most common tool for creating social network graphs is Python, and users need to access the Network library before
creating social network graphs. As a graph theory and complex network modeling tool in Python language, the network library
contains a variety of commonly used graphs and complex network analysis algorithms. Users can use the Python library to
analyses complex network data, and can also use it for simulation modeling.
(3) Visualization of spatial information
Spatial information visualization refers to the process of graphing complex scientific phenomena, natural landscapes and some
abstract concepts by using computer graphics and image processing technology. Cartography and computer graphics are often
used in the process of spatial information visualization, and the process of spatial information visualization is to input the
information of cartography, through inquiry, analysis and processing, and then combined it with the display of graphics and
images, to achieve interactive processing and display in a concise and easy to understand visual form.
III. COMMON DATA VISUALIZATION TECHNIQUES
In the application of information visualization technology, target classification methods are not technology-driven but target-
oriented. Data visualization method based on object classification has been widely used in the industry. Abstract the goals of
data visualization into comparison, distribution, composition, and relationships [3, 4]. Common data visualization tools can be
divided into the following categories:
(1) Parallel visualization
Parallel visualization usually includes three parallel processing methods: task parallelism, pipeline parallelism, and data
parallelism. Task parallelism divides the visualization process into independent sub-tasks, and there is no data dependence
between the sub-tasks.
The visualization process is divided into several stages. The computer executes each step in parallel to speed up the process.
Data parallelism is a parallel processing method of "single program and multiple data". It divides data into several subgroups and
then executes programs to process different subdata in parallel with the granularity of subdata.
(2) In situ visualization
The numerical simulation process can intuitively eliminate bottlenecks in large-scale simulation output.
Raw materials can be divided into image, distribution, compression, and characteristics. The output is treated as the raw
image, while the data is treated as visual and image storage in digital simulation. Output - Visual display of raw location-
allocation data, according to user-determined statistics, calculation and retention of statistics during numerical simulation, and
subsequent statistical reports;
Using the compression algorithm to visually display the output of the compressed data reduces the number of analog data
output, and the compression reduces the number of input for subsequent visual processing.
The visual method used to show the starting position of the output is to extract characteristics, which are extracted and
preserved during the digital simulation and subsequent visual processing of input data.

Research on Data Visualization Technology Based on Python
IJMRA, Volume 5 Issue 05 May 2022 www.ijmra.in Page 909
(3) Time series data visualization
Providing data in chronological order helps people to look at the past from a statistical perspective and predict the future, for
example, to build prediction models and analyze user predictions and behaviors.
The area chart shows the changes and changes in numbers over a period of time, which is the most common trend. In the
bubble chart, you can set a variable in the animation process of an axis as time or change a data variable. Candle patterns are
often used as a tool. Histograms are often used as a project management tool, thermometers show color changes in data, and
histograms are suitable for showing data allocation between sequential intervals or specific time intervals. Use line charts to
show continuous time intervals or the number of time intervals, trends and relationships most often displayed.
IV. DATA VISUALIZATION TOOLS
Data visualization analysis tool, since it is a tool to analyze data, it must have the ability to deal with massive data and graphical
display and interaction. Therefore, it needs to be able to quickly collect, screen, analyses, summarize and show the information
needed by decision-makers, and update it in real-time according to the newly added data [5].
Smartbi
Smartbi supports Excel as a report designer and is perfectly compatible with Excel configuration items. Support Excel all
built-in graphics, background, conditional formatting and other design complex dashboard style. Excel plug-in functions all Excel
graphics such as feature graphics: mini, Pareto, bullet, small and many, etc. Commonly used graphics, such as column chart, pie
chart, line graph, radar chart, etc., and combined with the dynamic data in the data warehouse for data display.
Smartbi supports a complete ECharts graphics library, supporting a variety of graphics, including dozens of dynamic
interaction graphics such as waterfall diagram, relationship diagram, radar diagram, oil volume diagram, thermal map, tree
diagram, etc. Support 3D dynamic graphics effect, such as 3D route chart, 3D scatter chart, 3D column chart for data
visualization display; Support rich Echarts graphics controls such as wheel cast controls, running lights, TAB controls, URL
controls, can be directly using Echarts all options configuration; Integration with other HTML5 graphical controls is also
supported.
D3
D3 is another Java library that supports SVG rendering. However, D3 offers a wide range of complex chart styles beyond
linear and bar charts, such as Voronoi charts, trees, circular clusters, and word clouds. D3.js, which stands for Data-driven
Documents, uses HTMLCSS and SVG to render amazing charts and analysis diagrams. D3's emphasis on web standards is strong
enough to make it possible to use on all major browsers without being tied to other types of architectures, and it can combine
visually appealing components with a data-driven approach.
Processing
Processing is the marquee tool for data visualization. All you need to do is write some simple code and compile it into Java.
There is also a processing.js project that will make it easier for websites to use Processing without Java Applets. Since the port
supports Objective-C, you can also use Processing on iOS. Although Processing is a desktop application, it can run on almost any
platform, and the Processing community has grown over the years to include a large number of instances and code.
Rapidminer
Rapidminer, a handy data visualization tool, another essential tool for data processing, is an open-source data science
platform that works through a visual programming mechanism. Its capabilities include modifying, analyzing, and creating models
and quickly integrating the results into business processes. Rapidminer has received a lot of attention and has become a reliable
tool in the minds of leading data scientists.
Google Chart API
The Google Chart API tool set has removed the static image feature and now only provides the dynamic Chart tool. It works
in all browsers that support SVGCanvas and VML, but one big problem with Google Chart is that: Diagrams are generated on the
client side, which means devices that do not support JavaScript will not be able to use them, nor will they be able to use them
offline or save the results to other formats, as was previously the case with static images. Despite the above issues, it's
undeniable that the Google Chart API is incredibly rich, and if you don't have a particular need for customization or resistance to
Google's visual style, you can start with Google Chart.

Research on Data Visualization Technology Based on Python
IJMRA, Volume 5 Issue 05 May 2022 www.ijmra.in Page 910
V. CONCLUSIONS
This paper first introduces the data visualization that can present the current types. Visualization technology has been widely
used in finance, medical care, geography, e-commerce, and so on, and has played a huge role. Through the visualization
application of knowledge maps, users can understand certain knowledge in the shortest time and obtain accurate information.
The visual display of data represents abstract "data" in a visible form, which helps people understand the data. Data
visualization essentially deals with different data objects compared to traditional data visualization. Data visualization requires
large-scale, multi-type, fast-updating, and efficient data processing, which brings a series of new challenges to the research and
application of data visualization.
ACKNOWLEDGMENT
This work was supported in part by the Natural Science Foundation of the Higher Education Institutions of Anhui Province under
Grant No. KJ2020A0011, Innovation Support Program for Returned Overseas Students in Anhui Province under Grant No.
2021LCX032. the Science Research Project of Anhui University of Finance and Economics under Grant No. ACKYC20085,
Undergraduate teaching quality and teaching reform project of Anhui University of Finance and Economics under Grant No.
acszjyyb2021035.
REFERENCES
1) Enrico G. Caldarola, Antonio M. Rinaldi (2015). Big Data Visualization Tools: A Survey - The New Paradigms,
Methodologies and Tools for Large Data Sets Visualization. Proceedings of 4th International Conference on Data
Management Technologies and Applications, 2015.
2) Satish Premshankar Yadav, Adarsh S.K Singh (2020).Big Data Analytics with Pandas and Scipy Python Tools, International
Research Journal of Engineering and Technology (IRJET), 2020, 1800-1805.
3) Stančin, Igor, and Alan Jović. "An overview and comparison of free Python libraries for data mining and big data
analysis." 2019 42nd International Convention on Information and Communication Technology, Electronics and
Microelectronics (MIPRO). IEEE, 2019.
4) Cielen, D. and Meysman, A., 2016. Introducing data science: big data, machine learning, and more, using Python tools.
Simon and Schuster.
5) Grover, P. and Kar, A.K., 2017. Big data analytics: A review on theoretical contributions and tools used in literature.
Global Journal of Flexible Systems Management, 18(3), pp.203-229.
There is an Open Access article, distributed under the term of the Creative Commons
Attribution – Non Commercial 4.0 International (CC BY-NC 4.0)
(https://creativecommons.org/licenses/by-nc/4.0/), which permits remixing, adapting and
building upon the work for non-commercial use, provided the original work is properly cited.

INTERNATIONAL JOURNAL OF MULTIDISCIPLINARY RESEARCH AND ANALYSIS
ISSN(print): 2643-9840, ISSN(online): 2643-9875
Volume 05 Issue 05 May 2022
DOI: 10.47191/ijmra/v5-i5-04, Impact Factor: 6.261
Page No. 911-915
IJMRA, Volume 5 Issue 05 May 2022 www.ijmra.in Page 911
ABSTRACT: The Four Noble Truths (Pali: cattāri ariyasaccāni), namely: (1) the “Noble Truth of Suffering”, (2) the “Noble Truth of
the Cause of Suffering”, (3) the “Noble Truth of the Ending of Suffering” and (4) the “Noble Truth of the Way to Ending
Suffering” are the fundamental Dharma of Siddhartha Gautama. Mr. Jason Chou was the founder of Taiwan Shinshun
Corporation (TWSS). He experienced to do volunteer works at Sudan Temple and received karmic reward of making profits
extensively. However, a fire devoured the TPU factory of the TWSS Company in 2012. It is the first time he epiphanies the Noble
Truth of Suffering. Mr. Chou sold all the TWSS Company's shares to BASF in 2015, hoping to concentrate on cultivation
compassion, and promoting the Dharma in the future.
KEYWORDS: Siddhartha Gautama, Dukkha, Suffering, Sacca, Entrepreneur, Hsing Yu
I. FOUR NOBLE TRUTHS
Around 2,500 years ago, Siddhartha Gautama attained enlightenment under the Bodhedrum in Buddha-gayā. He presented the
Four Noble Truths of the Dharma for the five sramana: Koṇḍañña, Bhaddiya, Vappa, Mahānāma, and Assaji in Sarnath (Sanskrit:
saraṅga-nāthá). The five sramana disciples understood the Dharma and became ordained as five bhiksu (Pali: bhikkhu). This is
the first turning the Dharma Wheel by Siddhartha Gautama. He said: "Koṇḍañña! Do you know why the way to ending suffering?
Because we desire to be free from suffering. You know it is full of suffering around the world. There are hurricanes, floods, and
earthquakes that have harmed us in the world. There are various intolerable and undesired things in our society that make us
uncomfortable and painful. There are physical and mental attacks from ageing, illness and death. You can see our world is filling
with suffering.
"You should know that all these sufferings are based on “ego”, because sentient beings are attached to “ego”, and following
with greed, hatred, and delusion. This is the cause of suffering. If you want to get rid of these sufferings, you must practice the
way to ending suffering, and you can enter the Nirvana!" These five bhiksu felt that they had never heard it before, when they
heard the Dharma of Siddhartha Gautama. They deeply admire that Siddhartha Gautama is definitely the authority of truths.
Siddhartha Gautama keeps saying: This “suffering”, “the cause of suffering”, “the ending of suffering”, and “the way to ending
suffering” are called the “Four Noble Truths”. No true liberation if you do not understand the Four Noble Truths. Can you
understand my Dharma (Hsing Yun, 2018)?
The Four Noble Truths (Pali: cattāri ariyasaccāni), namely the “Noble Truth of Suffering”, the “Noble Truth of the Cause of
Suffering”, the “Noble Truth of the Ending of Suffering” and “Noble Truth of the Way to Ending Suffering” are the fundamental
Dharma of Siddhartha Gautama (FGS Foundation, 2012).
The “Truth” (Pali: Sacca), is translated as reality in Southern Buddhism, representing the absolute truth, the truth, the rea lity and
unchanging things. It is an important philosophical thought in various religions in India. Buddhism uses “Sacca” (Pali) to
represent truth. The original meanings of “kǔ dì” (Chinese word) are to understand the inner meaning or meaning of things, so it
was used to translate this noun of “Sacca” in ancient China (Fo Guang Shan, 1988). First, the Noble Truth of Suffering: The truth
that makes one realizes that life is suffering. The Truth of Suffering (Sanskrit: Duhkha; pali: Dukkha) clarifies that all sentient
beings are in suffering. However, Dukkha is a combination of the prefix "du" and the noun "kha". "du" means bad, difficult, not
good, uncomfortable. "kha" refers to the meaning of void, space or sky. The combined "Dukkha" means difficulty, discomfort, or
restrained (Buswell and Lopez, 2017).
The word suffering (Pali: Dukkha; Sanskrit: Duhkha), has the meanings of "physical or mental pain that a person is feeling" in
common usage. On the other hand, the word of pleasure (Pali: Sukha; Sanskrit: Sukha) has opposite meanings. When we use the
word of “suffering” to represent the “Dukkha” in English article may lose deeper meaning for Buddha’s Dharma because it
Four Noble Truths and Fo Guang Entrepreneur
Lung-Tan Lu
Department of Management, Fo Guang University, Taiwan

Four Noble Truths and Fo Guang Entrepreneur
IJMRA, Volume 5 Issue 05 May 2022 www.ijmra.in Page 912
contains deeper thoughts, such as "impermanence", "emptiness", and so on. Hence, we should bear in mind, it is impossible to
use “suffering” to represent the whole concept of the “Dukkha” in this article. Our body, and indeed everything, is
impermanence and causes suffering. Suffering and pleasure are happening in our life, but what makes it unbearable is
impermanence. Birth, ageing, sickness, and death are all human beings must go through. From the perspective of Dharma, “ego”
is composed by five aggregates (Sanskrit: Skandhas; Pali: Khandhas), which are only short-lived without permanent existing in
the world.
Siddhartha Gautama divided " the Noble Truth of Suffering " into 11 types of suffering: (1) birth, (2)aging, (3)death, (4)sorrow,
(5)lamentation, (6)suffering, (7)grief, (8)vexation, (9)remorse, (10)separation from love, and (11)inability to seek. The Buddha
finally said that "the Five Aggregates of grasping are suffering”, the Five Skandhas bearing suffering, which means that these
sufferings arise from the Skandhas of form, sensation, perception, volition, and consciousness. All kinds of suffering in life come
from the sentient beings composed of these Five Skandhas.. Siddhartha Gautama said: "bhiksu! If any brahmacarin can not
understand it is enjoyment as enjoying sensual pleasures with objective attitude; it is unsatisfactory as enjoying from sensual
unsatisfactory with objective attitude; In attaining liberation from sensual pleasure, knowing objectively that it is liberation. It is
impossible for them to know precisely and entirely the desire for sensual pleasures. However, bhiksu! Any brahmacarin who can
objectively understand the enjoyment of sensual pleasures is enjoyment; their unpleasantness is unsatisfactory, and liberation
from sensual pleasures is liberation. They may know precisely and entirely the desire for sensual pleasure (Hsing Yun, 2005).
Second, the Truth of the Cause of Suffering (Pali: Samudaya): The truth that enables one to understand the cause of suffering.
Samudaya means accumulation, arising. The Truth of the Cause of Suffering is the analysis of the cause of suffering. Human
suffering mainly comes from greed, hatred, and delusion. The original minds of all human beings are obstructed by ignorance,
driven by ignorance, craving, hatred and other afflictions. Sentient beings accumulate all kinds of bad karma, and these karma
lead to all kinds of suffering. Eventually, a thorough understanding of the cause of suffering, the truth of the cause of suffering,
is the beginning of enlightenment (Rahula, 1959).
Third, The Truth of the ending suffering (Pali: Nirodha): To liberate one from suffering. When we cut off the cause of suffering,
there will be no pain or distress, that is, from the “reincarnation” to liberation, this is the “Truth of the Ending Suffering”, also
known as Nirvana. In order to get rid of suffering, we must eliminate the causes of suffering (suffering) "greed, hatred,
delusion". The Buddha also listed these sufferings, including the six inner senses, the outer six senses, the six senses, the six
touches, the six feelings, the six thoughts, the six loves, the six searches, and the six attachments, and proposed the
corresponding methods. The termination of these sufferings is also called Nirvana, which refers to the state of liberation
attained by practitioners by cultivating "the way to ending suffering" after knowing suffering. "Ending suffering" means
cessation, which is essentially a different name for "Nirvana". Nirvana can be obtained by eliminating all kinds of ignorance, such
as troubles, pains, and obstacles and so on. Taken as a whole, the ending of suffering refers to the eradication of all afflictions
such as greed, hatred, and delusion, and the state of pure and true nature is revealed: Nirvana.
Fourth, the “Truth of the Way to Ending Suffering” (Pali: Magga), it leads to the cessation of suffering and the achievement of
Nirvana. Magga means the way of practice to ending suffering and achieving Nirvana. Its content is the Noble Eightfold Path,
which enables people to get rid of evil and turn to good, and to cultivate right wisdom. If we can practice diligently, when our
afflictions are completely eliminated, we can fully attain Nirvana. The Noble Eightfold Path is: Right View, Right Intention, Right
Speech, Right Action, Right Livelihood, Right Effort, Right Concentration, and Right Mindfulness.
One day, Siddhartha Gautama came to the Jetavana Vihar in Sravasti country to deliver a blessing. At this time, a well-known
arrogant brahmin lived in this country. Not only did his parents belong to brahmin nobles, but all seven generations were
brahmin nobles, and his family background was prominent. He is not only handsome, intelligent and unimpeded, as a brahmin,
but also has extensive knowledge. However, he relied on family background, appearance, intelligence, wealth to be superior to
others, so impertinent to parents, elders and teachers.
He heard that Siddhartha Gautama was blessing near by, and he thought, "I should go to see Siddhartha Gautama, if there is
dharma to present, I can argue with him; if there is nothing to say, I will come back quietly." The arrogant brahmin rode in a
white carriage, followed by a group of young brahmins, with golden handle umbrellas or golden bottles. This group went to the
Jetavana Vihar. The arrogant brahmin got out of the car and walked in as Siddhartha Gautama happened to be preaching to the
public. At this time, the arrogant brahmin thought: "Sramana Gautama didn't notice me at all, let's go home." Siddhartha
Gautama knew the brahmin’s thought, and he said a gatha: "arrogant is here, badness will grow more arrogant; always been for
dharma; increasing for dharma”. As the brahmin hearing what Siddhartha Gautama said, he thought, "Sramana Gautama already
knows my purpose." He wanted to bow down to Siddhartha Gautama. Siddhartha Gautama said to the arrogant brahmin, "Stop!
There is no need to bow, as long as your mind is pure enough."

Four Noble Truths and Fo Guang Entrepreneur
IJMRA, Volume 5 Issue 05 May 2022 www.ijmra.in Page 913
In Jetavana Vihar, all the people present praised in unison: "It's amazing, Buddha! You are indeed of great wisdom. This brahmin
is usually arrogant, relying on his family background, appearance, intelligence, wealth is higher than others, and he disrespects
his parents, elders, and teachers. However, he is humbled by the Buddha and wants to pay homage to the Buddha.” The
arrogant brahmin respectfully asked Siddhartha Gautama: "What is humbleness? What is admiration? What is good
consolation? What is good offering?" Siddhartha Gautama replied with gatha: "Parents and elder, monks and teachers, and
those who respect, should not be humbled. They should be respectful, humble and inquiries, serve enthusiastically, and make
offerings. Free from greed and exhausted arahant. Righteous wisdom and good liberation can reduce arrogance. Wise people
will be hands-together Ceremony.
Siddhartha Gautama taught the arrogant Brahmins all kinds of wonderful dharma afterwards, and consecutively explained the
various ways of kindness, keeping the precepts, generating virtues, cravings, and avoiding afflictions, so as to purify your mind.
The arrogant brahmin realizes the Four Noble Truths - “suffering”, “the cause of suffering”, “the ending of suffering”, and “the
way to ending suffering” and realizes the state of full attainment of arhatship (Pali: Arahant). The arrogant brahmin stood up
and bowed to Siddhartha Gautama. He asked, "Siddhartha Gautama, can I become a Sramana and receive full ordination?"
Siddhartha Gautama then genially agreed. After being a sramana, the brahmin thought: "A good man (Pali: kula-putta) shaves
his hair and wears a cassock. He should become a sramana with virtuous faith and learn the right path..." Since this thought has
been liberated from the repression of arrogant, he attains the state of full attainment of arhatship (Pali: Arahant) (FGS
Foundation, 2012).
II. FO GUANG ENTREPRENEUR
Venerable Master Hsing Yun said that a person who wants to have a career will have the opportunity to start a business as long
as he understands the needs of the public with his heart. Staring up a business must also get together four basic conditions: (1)
utilizing capital, (2) connecting with people, (3) creating opportunities, and (4) having adequate conditions. Jason Chou
expressed his view in a lecture of Entrepreneurship (Hsu, and Chiu, 2018). Mr. Luohan Chou, was the founder of the Kangshan
branch of the Buddha's Light International Association (BLIA), and is also a Lay Dharma Lecturer of the BLIA. Mr. Luohan Chou
had been relying on self-learning method during early years although only graduated from elementary school. He has been a
lifelong supporter of BLIA and is the best role model for Jason Chou, the founder of Taiwan Sheen Soon Co. Ltd. (TWSS) (Man
Mu, 2017).
Jason Chou studied MSc in chemical engineering at the University of Utah in the United Stated after BA graduation in Taiwan. He
had been reading Buddhism books written by Master Hsing Yun before going to the United States in 1988. It had been a voice in
his heart: "I am a Buddhist!” when someone invited him to church. After Jason obtained the master degree from the University
of Utah, he went back to Taiwan and worked for a company for seven years. A friend invited him to establish a Thermoplastic
Polyurethane (TPU) factory, Taiwan Shinshun Corporation (TWSS) and he became an entrepreneur. TWSS was established in July
1997 and officially produced in mid-1998. Thermoplastic Polyurethane (TPU) is an environmentally friendly material for polymer
elastomers. TPU does not enclose plasticizers and can be used in a large range of applications, such as PU pneumatic tube,
mechanical transmission belt and so on. However, the road to operate a company was bumpy, and the TWSS suffered serious
losses for three following years.
His father, Luohan Chou, and mother accompanied him to Fushan Temple in Changhua County. His mother said to him, "The
only thing you lack is karmic reward, and you have to go to the temple to cultivate karmic reward as soon as possible." His
mother asked the Most Venerable of Fushan Temple to give Jason a chance to do volunteer works. Surprisingly, the company
began to make a profit as Jason became a volunteer at Fushan Temple in the very first month. It was the first time that the
company had profits although it was a small fortune. Jason’s mother asked him to donate the whole profits to Fushan Temple in
order to repay Buddha's grace. The TWSS Company has been making profits since the donation, and it's making more and more
money. Jason is a scientist, and he could not figure it out from an experimental point of view. But it was a success after all, and
Jason worked harder to be Buddhist volunteer (Pan, 2018).
Later, Jason supported a new building of Fushan Temple and cultivated karmic reward. In the ten years after year 2002, the
revenues of the TWSS Company grew more than 20 times. In 2009, the TWSS Company won the Little Giant Award from the
Ministry of Economic Affairs in Taiwan. In 2011, the TWSS Company won the honor of the Golden Merchant Award (Excellent
Merchant Award) also from the Ministry of Economic Affairs in Taiwan (Chen, 2015). The TWSS Company had been growing 10
times in the following decade. Jason thanked his parents for cultivating merit and wisdom simultaneously to achieving a
successful life. When encountering tricky customers, Jason would take the initiative to write disaster relief tablets for them, and
chanted sutras in the morning and evening. Jason freely subscripted The Merit Times, a Buddhism newspaper, to all employees,
in order to accomplish Three Acts of Goodness Campaign and share Dharma to encourage employees.

Four Noble Truths and Fo Guang Entrepreneur
IJMRA, Volume 5 Issue 05 May 2022 www.ijmra.in Page 914
In 2005, The TWSS Company expanded its factory with an area of 24,000 square meters and an annual production capacity of
8,000 metric tons in Taiwan. In 2009, the TWSS Company invested in Zhongshan Baoxuan Technology, a subsidiary of Pou Chen
Group in China, and expanded its annual production capacity to 5,000 tons in China. Pou Chen Group is one of the largest shoe
manufacturers in the world. It produced branded athletic and casual footwear and claims to be an OEM for major sports brands
such as Nike, Adidas, New Balance, Puma, and so on. In 2011, the annual production capacity of the Taiwan factory was
expanded to 20,000 tons as launching the film-blown TPU. In 2014, the TWSS Company was the largest TPU hot melt adhesive
manufacturer in the Asia-Pacific region and top three independent TPU material suppliers in Asia.
However, a fire devoured the TPU factory of the TWSS Company in 2012. Many Foguang members of (BLIA) in Changhua County
rushed to the scene to care as they saw the TV news. The 4,000-square-meter factory burned down for a whole day and night,
and only the pillars at the entrance of the TWSS Company's fence were pasted with the Spring Festival couplets "Heavenly
Blessings & Protection" written by Venerable Master Hsing Yun. A neighbor said "Did Heavenly Blessings & Protection work? The
factory was burnt down." as he saw the Spring Festival couplets. Jason’s wife replied, "Fortunately, there was Heavenly Blessings
& Protection to protect the neighbors, so no one was injured.” Jason and his wife were so calm, so others were surprised to see
them accepting this disaster calmly. Jason cleaned up the mess among the rubble, and comforting the sympathetic masters and
members of BLIA. It is the first time he epiphanies the Noble Truth of Suffering.
What Jason prayed sincerely at the fire scene was: don't let the neighbors suffer. He only thought about how to solve the
problem under the devastating high temperature. At his hart, It was Venerable Master Hsing Yun's teaching: "If there is Dharma,
there is a solution!" . Jason and his wife have been implemented the Dharma in their daily life, and our words and deeds are in
line with the Noble Eightfold Path. We firmly believe that the whole family will never go hungry after the fire. Mr. Hong
Wenzheng, a supervisor of BILA, helped the steel structure manufacturer to build the new factory as quickly as possible
regardless of the cost. Moreover, Jason usually treat people with integrity, so the bank was not in a hurry to ask him to repay the
loan. On the other hand, the machine manufacturer urgently changed the machines ordered to install new machines for the
TWSS Company regardless of payment issue. Not only all upstream suppliers continued to supply raw materials, but also none of
their customers stopped placing orders. All of the above, as long as any party does not support the TWSS Company, it will go
bankrupt soon. I am really grateful for these many good causes and good fates! Fortunately, all the machines and purchase
documents were fine. In addition, Jason has been developed broad and good affinity with others, and the fire insurance claims
were settled quickly. The TWSS Company was able to restore the production line within six months. The fire did not knock Jason
down, but let him made some fortunes. Finally, the employees understand the truth of "The family that accumulates goodness is
sure to have superabundant happiness" (Chou, 2016).
III. CONCLUSIONS
Jason took the oath in front of the Buddha to be the chairman of the North Branch of BILA in Changhua County just few months
after the fire. People were wondering why he took the chair. Jason expressed the main reason was "impermanence", and
everything "there is a solution to the Buddha dharma". Surprisingly, profits of the TWSS Company were the best in 16 years after
he taking over as chairman. The company continued to operate smoothly and the two years of 2013 and 2014 as the chairman
of the North Branch of BILA in Changhua County were the best two years of profit in the TWSS Company's 17-year history.
BASF, a leading Chemical Company worldwide, acquired the TWSS Company for its operations and assets both in Taiwan and
China in 2015. This acquisition of the TWSS Company will further strength dominant position of BASF in the field of TPU
extrusion and injection molding, which are widely applied in the shoe industry. Mr Jason Chou, Chairman and General Manager
of the TWSS Comapny will continue to manage its business as a BASF consultant to oversee the related business after the
acquisition. BASF will do its best to ensure a smooth transition and unaffected customer supply after the TWSS Company's
related assets, customers and employees will be incorporated into BASF's business.
A fire caused Jason and his wife to epiphany the “impermanence” in life. Jason Chou sold all the TWSS Company's shares to
BASF, hoping to concentrate on cultivation compassion, and promoting the Dharma in the future.
REFERENCES
1) Buswell, R. E. and Lopez, D. S. (2017) four noble truths (S.catvāry āryasatyāni; P.cattāri ariyasaccāni; C.si shengdi), The
Princeton Dictionary of Buddhism, NJ: Princeton University Press, Online version, Retrieved from:
https://www.oxfordreference.com/view/10.1093/acref/9780190681159.001.0001/acref-9780190681159-e-1528
2) Chen, S.Y. (2015) Jason Chou and Shumei Chang: Widely cultivate the cause of benefiting all sentient beings, Life News
Agency, retrieved from:

Four Noble Truths and Fo Guang Entrepreneur
IJMRA, Volume 5 Issue 05 May 2022 www.ijmra.in Page 915
http://www.lnanews.com/news/4/%E5%91%A8%E5%AD%B8%E6%96%87%E3%80%81%E5%BC%B5%E6%B7%91%E7%BE%
8E%E4%BC%89%E5%84%B7%20%E5%BB%A3%E4%BF%AE%E5%88%A9%E7%9B%8A%E7%9C%BE%E7%94%9F%E4%BA%8B
%E6%A5%AD.html
3) Chou, J. (2016) The Influence of Humanistic Buddhism on Me: Jason Chou Has the Courage to Undertake as Fire Showing
Impermanence, The Merit Times, retrieved from: https://www.merit-times.com/NewsPage.aspx?unid=428486
4) FGS Foundation (2012) Miscellaneous Arkansas (Chapter4, Article 92), Fo Guang Shan Buddhist Electronic Texts, Retrieved
from: http://etext.fgs.org.tw/flipbooks/fgs01/04/index.html
5) Fo Guang Shan (1988) Fo Guang Buddhist Dictionary, Retrieved from: https://www.fgs.org.tw/fgs_book/fgs_drser.aspx.
6) Hsing Yun (2005) Complete Works of Venerable Master Hsing Yun (Article 9886), Retrieved from:
http://books.masterhsingyun.org/ArticleDetail/artcle9886
7) Hsing Yun (2018) The Biography of Shakyamuni Buddha, the First Turning Dharma and Establishing Religion Group, The
Merit Times, retrieved from: https://www.merit-times.com/NewsPage.aspx?unid=499565
8) Hsu, Z. H. and Chiu, Y. F. (2018) Sabah Lecture by Jason Chou: Share the way to change your mind, Life News Agency,
retrieved from:
9) https://www.merit-times.com/NewsPage.aspx?unid=520134
10) Man Mu (2017) Where There Is Dharma, There Is a Way I, Humanistic Buddhism: A Story of Life Transformation, New
Taipei: Gandhabooks.
11) Pan, Y. Z. (2018) Sabah Lecture by Jason Chou: Share the way to change your mind, Life News Agency, retrieved from:
http://www.lnanews.com/news/%E5%91%A8%E5%AD%B8%E6%96%87%E6%B2%99%E5%B7%B4%E8%AC%9B%E5%BA%A
7%E3%80%80%E5%88%86%E4%BA%AB%E8%BD%89%E5%BF%B5%E4%B9%8B%E9%81%93.html
12) Rahula, W. (1959) What the Buddha Taught, Taipei: Towisdom Publishing.
There is an Open Access article, distributed under the term of the Creative Commons
Attribution – Non Commercial 4.0 International (CC BY-NC 4.0)
(https://creativecommons.org/licenses/by-nc/4.0/), which permits remixing, adapting and
building upon the work for non-commercial use, provided the original work is properly cited.

INTERNATIONAL JOURNAL OF MULTIDISCIPLINARY RESEARCH AND ANALYSIS
ISSN(print): 2643-9840, ISSN(online): 2643-9875
Volume 05 Issue 05 May 2022
DOI: 10.47191/ijmra/v5-i5-05, Impact Factor: 6.261
Page No. 916-920
IJMRA, Volume 5 Issue 05 May 2022 www.ijmra.in Page 916
ICT-Based Needs Assessment Analysis in Partner Community
Sharra Mae B. Fernandez1, Sheila Mae S. Pagayonan2
1,2Northern Iloilo Polytechnic State College, Estancia Iloilo
ABSTRACT: Determining the needs of the participants in a community extension program prioritizes the topics that they will be
interested to attend. It is critical to identify interconnected needs and their underlying causes in order to design empowering and
long-term programs and projects to assist people in improving their quality of life. Thus, using consultative meetings and focus
group discussions, this qualitative study determined the community problems of Barangay Tanza, Estancia, Iloilo, on the ICT
related program. Participants included 50 residents from the sectors of fisherfolks, farmers, women, youth, barangay officials, and
4Ps beneficiaries. This ensures that participants are interested in various topics presented in the program. The findings of the
study were the basis for a proposed annual extension program plan for June 2021to October 2025.
I. INTRODUCTION
The academe is one of the most important actors in society, with the ability to affect change by empowering members of the
community. Community extension services address not only the needs of the community, but also the University's Vision and
Mission. Community development is the process of assisting a community in strengthening and developing to its full potential
(Adedokon, Adeyemo & Olorunsola, 2010). One of the most difficult challenges faced by members of the community, as well as
many others, is a sense of isolation, and ICTs can provide access to knowledge in ways that were unimaginable not long ago.
ICTs force that has changed many aspects of the way we live. If one was to compare such fields as medicine, tourism, travel
business, business, law, banking, engineering and architecture, the impact of ICT across the past two or three decades has been
enormous. The way these fields operate today is vastly different from the ways they operated in the past.
In addition to curiosity, a person will recognize that it will not be easy to get through the rest of life without knowing about
computers. As one studies about computers, the person becomes aware of the importance, versatility and its pervasiveness in the
society. The person will also learn what computers are and how they work. This requires learning some technical jargon. And there
is no better way to understand computers than through interacting with one. So being computer literate also means being able
to use a computer for some simple applications (Capron & Johnson, 2004).
E-learning is another term for learning through new ICTs. Information and communication technology (ICT) is an essential
component of today's world. It is a force that influences many aspects of our lives, as well as an electronic means of capturing,
processing, storing, and communicating information.
According to UNESCO: ICT is a scientific technological and engineering discipline and management technique used in handling
information in application and association with social, economic and cultural aspects. Appropriate use of ICT can transform the
whole teaching-learning processes leading to paradigm shift in both content and teaching methodology (Anu Sharma et al., 2011).
Through its adopt-a-barangay program, the Northern Iloilo Polytechnic State College (NIPSC), has been charged with
performing extension functions. In accordance with its mission and vision, the college generates data to support and sustain critical
decisions, implements corresponding mechanisms, and transfers results in the design of relevant community extension services.
As a result, this study was conducted to assess the needs of Barangay Tanza, Estancia, Iloilo in order to develop an extension
program that will provide opportunities to its residents while also empowering the community.

ICT-Based Needs Assessment Analysis in Partner Community
IJMRA, Volume 5 Issue 05 May 2022 www.ijmra.in Page 917
II. METHODOLOGY
A. Study Area
Tanza is located in the municipality of Estancia, province of Iloilo (11° 25' 44" N, 123° 8' 18" E). It is situated at approximately
11.4375, 123.1363, in the island of Panay. The elevation is estimated to be 24.5 meters or 59.4 feet above mean sea level.
According to the 2020 Census, its population was 1,413. This represented 2.66% of the total population of Estancia.
Figure 1. Map of Tanza, Carles, Iloilo
B. Participants
The participants in this study were 50 randomly selected residents of Barangay Tanzai, Estancia, Iloilo. They represented a variety
of sectors, including fisherfolks, farmers, women, youth, barangay officials, and 4Ps beneficiaries. Prior to the start of the process,
they were oriented and informed of the objectives of the program.
C. Procedure
Consultative meetings and focus group discussions were used in this qualitative study to identify gaps, map out issues, and
determine key training priorities in order to design a sustainable extension program.
Participants were asked to write down the needs of their respective sectors intended for computer skills, as well as the
contributing factors and potential solutions. Each group presented its findings, and then there was deliberation.
Figure 2. shows the active participation of various stakeholders in the needs assessment activity.

ICT-Based Needs Assessment Analysis in Partner Community
IJMRA, Volume 5 Issue 05 May 2022 www.ijmra.in Page 918
III. RESULTS AND DISCUSSION
Needs of the Partner Community
During the consultative meeting and focus group discussion, a number of issues and needs arose. The interconnectedness of all
issues from different sectors was observed during the presentation of participants' output.
The needs of the participants for the ICT program reveals that the top ninenecessities were: Computer Literacy Program,
Barangay Information System, SK Information System, Vaccination System, computer assembly, computer troubleshooting,
Photoshop, Awareness on Social Media, and Netiquette.
a. Computer literacy, also known as digital literacy, involves having a current knowledge and understanding of computers and
their uses. Because the requirements that determine computer literacy changes as technology changes, you must keep up
with these changes to remain computer literate (Shelly & Vermaat, 2011).
Thus, the training program under the computer literacy will be the Training on Microsoft Word and Microsoft Powerpoint. Trainees
who successfully complete the Microsoft Word training course will be able to learn the latest features of Word, create, edit, and
save documents, format text and paragraphs, work with tables, columns, and other formatting features, and work with graphics,
WordArt, charts, and text flow.
Microsoft PowerPoint, on the other hand, will teach participants how to create presentations with PowerPoint, format and
organize PowerPoint slides, work with graphics, tables, and charts, add multimedia and SmartArt presentations, and integrate
Microsoft office files.
b. Barangay Information System
Technology had proven its capacity on how a business, organization and government keep the productivity and to be competitive.
In giving quality service for its people to satisfy their needs.
Keeping Barangay records is a one way to easily track resident’s information. BIS is capable in recording this bulk information and
can be stored in a long period of time. This system can meet strategic objectives for reducing paper consumption and reducing
time consuming file retrieval from bulky documents. BIS can track residents record such as personal to family information,
complaints to amicable settlement information and can create daily reports for the Barangay.
c. SK Information System
SK Information System is designed to manage all the records of SK officials and it is an information system intended to the
youth of Brgy. Tanza. SKIS is capable of recording large amounts of data and storing it for an extended period of time. It creates
monthly reports and send notification for all the registered kabataan members. d. Vaccination System
This system is capable of storing and retrieving information of individuals inoculated with COVID -19. A tool to display information
and generate reports of the individual and its vaccination details Also, for reliable and rapid data collection.
e. Computer Assembly is a training course that teaches participants how to disassemble a computer system, identify computer
components and accessories, assemble and test the computer system.
f. Computer Troubleshooting will teach trainees how to identify common computer system problems, identify basic
troubleshooting procedures and tools, describe safety hazards associated with working with electronic equipment, and
demonstrate the ability to install and effectively use command-line functions and utilities to manage the operating system.
g. Graphics Design is a training course that will teach basic graphics to the trainees to understand and work with layers; enhance
images with paint and filters; perform color adjustments; work with vector paths; and automate task. Adobe Photoshop is
the software program used in the training.

ICT-Based Needs Assessment Analysis in Partner Community
IJMRA, Volume 5 Issue 05 May 2022 www.ijmra.in Page 919
Figure 3. Presentation of Output
Figure 4. Presentation of Output
Figure 5. Presentation of Output
IV. CONCLUSIONS
It is concluded that, under certain conditions, information and communication technologies (ICTs) can significantly improve poor
people's human and social capabilities and have a positive impact on their well-being. ICTs have the potential to increase the
individual and collective agency of poor people, as well as to strengthen their existing individual or community assets and
informational capabilities. ICTs gain meaning only when people use and enact ICTs for specific purposes. The most immediate and
direct impact of ICT programs on people's well-being, according to the study, is personal empowerment of the most marginalized
groups, where newly acquired ICT capabilities provide a sense of accomplishment significantly strengthening their self-esteem. As
a result, anICT program is deemed essential. Eventually, the use of ICT will improve people's learning experiences in the
community. It also aids in the development of a successful career in a technologically advanced world.
V. RECOMMENDATIONS
Training programs and activities should be carefully planned to meet the needs of the community, and a long-term extension
program should be established. Continuous monitoring and evaluation should be carried out to assess the program's impact on
the community. More extension programs should be offered in order to further empower the partner communities.

ICT-Based Needs Assessment Analysis in Partner Community
IJMRA, Volume 5 Issue 05 May 2022 www.ijmra.in Page 920
REFERENCES
1) Adedokun, M., Adeyemo, C., & Olorunsola, E. (2019). The Impact of Communication on Community Development. J
Communication, 1(2): 101-105 (2010)
2) Das, K. (2019). The Role and Impact of ICT in Improving the Quality of Education: An Overview. Volume 4, Issue 6, ISSN
2456-4931. Retrieved from: https://ijissh.org/storage/Volume4/Issue6/IJISSH-040611.pdf
3) Capron, H. L. & Johnson, J. A. (2004). Computers: Electronic Tools for an Information Age. 8th edition. Singapore: Pearson
Education South Asia Pte Ltd.
4) Anu Sharma, Kapil Gandhar and Seema, (2011). Role of ICT in the Process of Teaching and Learning. Journal of Education
and Practice, Vol.,2, No 5, pp.16.
5) Shelly, G. B. & Vermaat, M. E. (2011). Discovering Computers Fundamentals. Philippine edition. Singapore: Cengage
Learning
There is an Open Access article, distributed under the term of the Creative Commons
Attribution – Non Commercial 4.0 International (CC BY-NC 4.0)
(https://creativecommons.org/licenses/by-nc/4.0/), which permits remixing, adapting and
building upon the work for non-commercial use, provided the original work is properly cited.

INTERNATIONAL JOURNAL OF MULTIDISCIPLINARY RESEARCH AND ANALYSIS
ISSN(print): 2643-9840, ISSN(online): 2643-9875
Volume 05 Issue 05 May 2022
DOI: 10.47191/ijmra/v5-i5-06, Impact Factor: 6.261
Page No. 921-928
IJMRA, Volume 5 Issue 05 May 2022 www.ijmra.in Page 921
Smart Irrigation for Crop Management Using IoT
Mohamed Fazil1, Rohan S2, Ashritha C3, Nagesh Shetty4, Ramalingam H M5
Department of Electronics and Communication Engineering, Mangalore Institute of Technology &
Engineering Mangalore, Karnataka, India
ABSTRACT: Agricultural production involves cultivating plants and raising domesticated animals to produce food and feed for
humans and other animals. Agriculture or farming as it is also called is a complex activity, and each aspect of it impacts the overall
crop production. Farmers need to manage all segments of crop production to achieve success. Farmers make strenuous efforts to
produce good quality crops but they face challenging issues of monitoring and maintaining it around the clock. The problems in
the agriculture domain largely affect the food production and supply chain. This project includes the proposal of an integrated
crop management system to maintain the health of crops by supplying the required amount of water and nutrients to them. One
aim is to reduce the amount of water lost to unnecessary evaporation, a concern in the 21st century. As a result, other factors,
such as cost, time, and effective care are also benefited. This is why, after the soil preparation and planting are completed, the
growth phase of the plant also requires special attention. The paper discusses a process for detecting and solving plant health
issues using an intelligent automated system.
KEYWORDS: Plant Disease detection; Machine learning; Automated Irrigation; Raspberry Pi.
1. INTRODUCTION
Agriculture is the main source of income in India. Initially, farming needs human interaction. The yield depends upon the way a
farmer takes care of his field. But if the land is far from his residence, it is difficult to monitor. While in case the crops turn out to
be diseased farmers to spend more time and money on curing them [1]. For salt-affected soils and saline water to be safely utilized,
primarily salt-tolerant crops have to be grown, seedbeds have to be managed, and fields have to be graded.
It is necessary to minimize local concentrations of salt, improve irrigation efficiency, and monitor soil, water, and salinity to gauge
drainage and leaching requirements. This has led to the development of autonomous, robotic vehicles, such as those used in
mechanical weeding. It is now possible to calculate biomass development and fertilization by using aircraft equipped with a
hyperspectral snapshot camera that uses lightweight powerful and autonomous flight control systems. These cameras are being
developed to aid in unmanned aerial vehicles’ application of fertilizer and harvesting of fruits. A decision-tree model based on
optical information allows discerning between plant diseases based on crop status. In addition, today’s technology farms reed
crop histories to provide sophisticated farm management advice [2]. In addition, decision tree models are now available, allowing
farmers to differentiate between crop diseases using visual information. Taken together, these technical improvements represent
a technical revolution that will lead to disruptive changes in agricultural practice. This trend has for agriculture not only in
developed countries but also in developing countries. At the same time, the demand for food is growing and the supply side faces
constraints in terms of land and agricultural inputs [2]. The worworldpulation is on track to reach 9.7 billion by 2050, requiring a
corresponding 70% increasing calories available for consumption even as the cost of inputs required to produce those calories
increases. By 2030, water supply will be 40% below global water needs,d raising energy, labor, and nutrient cost are already
putting pressure on profit margins. About a quarter of farmland is degraded and requires extensive restoration before it is once
again suitable for large-scale cultivation. Climate change is irreversible, and agriculture is a highly affected industry. Unexpected
weather and sometimes bad weather is a serious problems to be solved [3]. Proper timing of fertilizer application increases yields,
reduces nutrient losses, and prevents environmental damage. Bad weather and unpredictable weather can cause fertilizer damage
and damage the crop. Information is needed on how to apply fertilizer [4]. Weather forecasts can help farmers determine when
and where to use them. Both resources and money can be wasted if fertilizer application is done incorrectly so proper information
and forecasting are required. The land is an important resource for agriculture. Soil and chemical conditions play a major role in

Smart Irrigation for Crop Management Using IoT
IJMRA, Volume 5 Issue 05 May 2022 www.ijmra.in Page 922
the production cycle. One of the most important tools for farmers to improve their crop production is soil analysis. In this regard,
soil testing plays an important role in plant growth. Farmers can add organic or non-living nutrients to the soil in appropriate
amounts. Yield growth depends largely on the nutrients in the soil: nitrogen (N), phosphorous (P), and potassium (K). Excessive
distribution of fertilizer can significantly reduce production and quality 1.
2. LITERATURE SURVEY
Paper [1] recommends drip irrigation performance when water is supplied to plants where the required weather forecasting and
crop diagnostics are performed with ugh MCP 3008. This paper proposes a cheap and efficient and effective irrigation system.
CNN is responsible for the separation and accuracy of the high voting number and the state of full connection. This paper [1]
proposes drip irrigation efficiency when water is supplied to plants were necessary to predict the weather and crop diagnostics
are performed with MCP 3008. The degree of yellowing of leaves in plant cracks and on earth is determined by CNN calculations.
And based on the data of the clouds using raspberry pi will determine whether to spray water and its value.
Paper [2] provides an advance in the field of in-depth research technology in the field of leaf spot disease in recent years. In this
paper, the diagnosis of plant leaf disease is based on an in-depth study, and as long as sufficient information is available for
training, in-depth study methods can detect plant leaf disease with high accuracy and advanced photography techniques learned.
The comparative study in [3] was conducted, focusing on developing and comparing several Machine Learning (ML) models,
assessing the various conditions and horizons of time, and predicting rain using two types of methods. The forecast model uses
four different ML algorithms, namely Bayesian Linear Regression (BLR), Boosted Decision Tree Regression (BDTR), Decision Forest
Regression (DFR), and Neural Network Regression (NNR). Rainfall was predicted at different times using different ML algorithm
that methods used to predict rain using Autocorrelation Function (ACF) based on rain history data and Rainfall Forecasting Using
Predicted Error based on historical and predictable rainfall data. This paper concludes with the use of two different methods with
different conditions and different horizons of time, and ACF shows higher accuracy than predicting Rainfall Using Forecast Error
using BDTR modeling. Paper [4] focuses on various agricultural and crop diseases. The paper has reviewed the Inception-ResNet-
v2 model developed using in-depth learning theory and neural network technology. Tests show that the model can successfully
diagnose a set of data and the accuracy of overall recognition which is why it can be used effectively in diagnosing and diagnosing
plant and insect diseases. Paper [5] proposes an effective way to systematically classify the symptoms of plant diseases using
neural convolution networks. This program is trained and tested on two plant disease databases namely plant data and pepper
data sets. Learning the slow transmission helped to reduce CNNS meeting time. The accuracy of training and validation is measured
in three tests with MonileNet_V3_Large for transfer learning with and without the Plant district data set compared to VGG-16 and
transfer learning. Paper [6] suggests how to diagnose cardamom plant disease using the effective NETV2 model. A complete set
of tests was performed to determine the effectiveness of the method and to compare it with other models such as NET which
works well with Convolutional Neural networks. Paper [7] operates and compares Markov's predicted modern performance with
rain forecast and other six alumni learning algorithms, namely: Gene Programming, Support Vector Regression, Radial Basis Neural
Networks, Rules for M5, MS. Model Trees, and k-Close Neighbors. This paper also focuses on finding the correlation between
different weather conditions and the accuracy of forecasts. paper [8] provides research on artificial neural network (ANN) that
contains multiple layers and back-propagation to enable computer literacy in determining the indirect combination. A
convolutional neural network (CNN) is generally regarded as an improved version of ANN called a deep learning neural network.
This method uses a multilayer perceptron system designed for reduced processing needs. CNN contains the output layer, the
hidden layer, the most flexible layers, the integration layers, the fully connected layers, and the default layers to automatically
extract the shallow and deep input features. 2D-CNN and 3D-CNN have been used to output spatial-spectral presentations of
hyperspectral images. Based on this paper [9] the basis of a network-based disease module, a recurring clustering algorithm was
adopted to classify 299 diseases into different categories. The optical clustering scheme is based on the networks and functions
of disease-related genes, which can provide functional phases for each disease as well, with more goals or KEGG methods
identified and validated. This paper proposes several computational methods to reveal functional differences between different
diseases such as group disease identification and classification, the functional relationship between diseases shared by the same
group, and the important function associated with the classification of diseases. This paper [10] proposes a diagnostic method for
the diagnosis of asymptotic non-local means (ANLM) image algorithm and integration of parallel convolution neural network
(PCNN) and advanced reading machine (ELM) with improved linear particle swarm optimization ( IPSO). PCNN-IPELM-based peach
image detection i.e. neural network parallel convolution, IPSO-based high-resolution machine learning, and precision particle
efficiency The paper propose an NLM-based audio output algorithm for peach images. The Parallel convolution neural network
model is used to process data after audio output. This paper [11] suggests early diagnosis and complementary measures can be
taken at the onset of plant disease. They are trained in specific types such as AlexNet DenseNet-121, ResNet-50, VGG-16, and X-

Smart Irrigation for Crop Management Using IoT
IJMRA, Volume 5 Issue 05 May 2022 www.ijmra.in Page 923
ception and it is shown that almost all of the above types cannot provide satisfactory results. X-reception can achieve only 80%.
The proposed approach focuses on leaf dot features, which include an advanced R-CNN object acquisition algorithm and a
background production platform, two Db and Daux stereotypes are presented to judge the generated or non-realistic image and
to determine whether the generated image contains space.This paper [12] proposes an in-depth study approach based on the
development of convolution of neural networks (CNNs) for the real-time diagnosis of apple leaf disease. Introducing a new apple
leaf diagnostic model using the original GoogLeNet structure and Rainbow Concatenation. This paper proposed a new model of
deep neural convolution network, i.e., INAR-SSD was designed by introducing the GoogLeNet launch module and integrating
Rainbow integration to improve diagnostic and diagnostic function. This paper [13] suggests nutritional recommendations using
an advanced genetic algorithm (IGA) that uses time-series sensor data and recommends various plant settings. Through the
proposed model, crop production increased and enabled the determination of the right combination of different types of
resources available. N-P-K automation helps to avoid manual manipulation. The method is also improved if a large amount of data
for a variety of crops can be achieved and the target will be to produce values that are correctly calculated by soil type and location.
This study [14] provides a comparative analysis using simulated rainfall models based on conventional machine learning algorithms
and in-depth study structures that work well in sub-river operating systems. This study aims to compare the performance of rain
forecast models based on the LSTM-Networks architecture and modern Mechanical Learning algorithms. Weather data from 2000
to 2020 was used in five major cities in the United Kingdom. This paper suggests that LSTM-Networks-based models with a few
hidden layers work better in this approach, demonstrating its potential for use as a smart rain forecast forecasting app. This paper
concludes that it is appropriate to consider the analysis of the significance of the features and the inclusion of other climatic factors
to achieve better performance of rain forecast models. This paper [15] introduces a fast-paced FCM-KM and Faster R-CNN fusion
detection system to address a wide range of problems with rice disease photography, such as noise, blurred vision, severe
background disturbances, and low detection accuracy. . The Faster 2DOtsu algorithm mentioned in this paper has achieved
excellent results in the use of image classification of rice. This paper suggests that this method is more effective in detecting rice
diseases and improves the diagnostic accuracy of the Faster R-CNN algorithm while reducing the required diagnostic time. The
paper concludes that there is a need to integrate smart internet resources such as the Internet of Things agricultural and terminal
processor processors to real-time monitoring and pest identification in grain storage facilities, ready to promote modernization
and agricultural industry ingenuity. This paper [16] focuses on promoting effective humidity control based on the Modern
Irrigation System (MIS) using the Arduino Nano with various modifications in the planting area. The main objective of this project
is to reduce excess water consumption, thereby saving crops from damage. The proposed system can be applied to a variety of
plants, as those plants have different humidity conditions for their growth. This article [17] introduces various recent strategies
related to intelligent irrigation systems in agriculture using the IoT and intelligence surveillance systems. In this introductory
article, various components of smart irrigation, the functions of each layer in smart irrigation, and modern irrigation systems are
introduced. System [18] is a sensor that measures soil moisture and adjusts the relay that controls the solenoid valve according to
the requirement. The model shown provided the expected results at different humidity levels. The system can be enabled with
the help of a solar panel; a solar controller can be used that controls the power of the system. This paper [19] introduces an image
classification algorithm used for the automatic detection and classification of plant leaf diseases. It also compiles a study on a
variety of disease-specific methods that can be used to diagnose plant leaf diseases. Image classification, which is an important
factor in the diagnosis of plant leaf disease, is performed using a genetic algorithm. This paper demonstrates the effectiveness of
the proposed algorithm in detecting and classifying leaf diseases. Another advantage of using this method is that plant diseases
may appear early or in the early stages. In this paper [20] they developed a self-defense measure based on ground moisture and
salt sensitivity, an electrophoretic sensor for measuring ions/nutrients in the soil, a nano-patterned plasmonic-resonance, and
light-based sensors based on resonance-based optical mode. in the plant, flexible organic compounds are extracted. In this, they
used the input impedance of the metamaterial-inspired pool embedded in the soil sample as a measurable area, known to be
directly related to the permit, and proposed a method of determining ion-ion saturation mixture using Impendence spectroscopy.
Using a multi-frequency impudence measurement method, a method of measuring the concentration of in-suit nitrate in the soil
by analyzing dielectric mixture models over a mixture of Debye-type elements is developed. In this paper [21] the trapezoid
method is widely used in SM recognition based on pixel distribution within the thermal remote vision and optical sensing. The SM
recovery algorithm that combines a common method with learning methods that integrate with packaging technology is proposed.
The accuracy of the predictions tested against the in situ, RMSE, MAE, and group return correlations was performed. This paper a
potential application for remote sensing data measuring SM in TP using integrated learning methods. The SM retrieval algorithm
that combines a common method (trapezoid method) with integrated learning methods with packaging technology is suggested.
In this paper [22] SMMI (soil moisture monitoring index), MSMMI (soil moisture monitoring index), PDI (perpendicular drought
index indicator), and MPDI (modified perpendicular drought index) for moisture measurement of land (SM) on farms. Here

Smart Irrigation for Crop Management Using IoT
IJMRA, Volume 5 Issue 05 May 2022 www.ijmra.in Page 924
Spectral indicators and plants that are important in distinguishing the earth cover species mainly include Sentinel-2 bands of
SWIR1, SWIR2, Red, Green, Red edge1, blue, and plant extracts such as MNDWI, NDMI, TCARI, I S2REP (Sentinel-2 REPI), REPI,
MRENDVI, red-edge vegetation index32, and MRESR. MSMMI is not dependent on the soil line and can more accurately establish
a standard SM regional testing model for farms. Sentinel-2 satellites with red belts and SWIR can create an SM map of 0–5 cm
depth of 10–20 m of landscaping and provide a solid foundation for agricultural waste management. Repeating farmers' financial
profits until 2022-23 from the 2016-16 primary year requires an annual improvement of 10.42 percent on the farmer's income. In
this paper [23], they evaluated each function separately based on the performance of a built-in robot. the grid structure is used
for pomegranate plants. 5 pairs of transmitters and receivers are used to locate the white line in a dark area with the help of an
IR-based line. The visual sensor is made by connecting the light transmission setting with the right-angle detection setting. The
distance between the LED and the photodiode varies using the test and error method to obtain maximum transducer sensitivity.
Plant growth depends on several factors such as NPK, soil characteristics, soil pH, soil moisture, temperature, climate, and light.
To manage all the necessary information and complexity of crop growth system, based on IoT technology, can measure, analyze,
and take action. It is an accurate agricultural context. acts as a key parameter sensor. The paper introduces an IoT-based system
and innovative strategies that improve soil yield through which it is a new way to feed this population growth. this paper proposes
[24] a solution that integrates IoT to monitor agriculture more accurately. This paper is primarily aimed at improving the visual
system [25] of nitrogen, phosphorus, and potassium-containing the optic nerve. It uses a transfer system and a recovery system.
This paper shows the built-in NPK optical sensor for ground detection, which includes light transmission and detection system. An
integrated optical sensor war can detect the NPK element on the ground. the clear container is high, about 80%. Based on the test
results, there was a significant interaction between the light samples and the NPK samples taken at different locations which
caused the light intensity to decrease as the voltage was reduced. Output responses to high NPK were obtained from 32.0 volts
of Nitrogen, 4.6 V of Phosphorus, and 19.8 V of Potassium. This paper [26] introduces an agricultural precision recognition system
using Wireless Sensor Networks, which enables remote monitoring of soil fertility and other parameters namely soil moisture, pH,
and temperature. The proposed Internet of Things (IoT) software system is smart enough to recommend water and fertilizer
improvements that improve soil quality and ensure good crop growth. This program helps to reduce the use of excess fertilizer
thus increasing the yield. To estimate the amount of nitrogen, phosphorus, and potassium present in the soil, soil fertility tests
are used. Data from the sensor is sent to the AWS cloud, and a mobile app is developed that provides information about various
soil features by using this information, the farmer will make the right decision on growing the right crop. For the plant to grow
continuously above macronutrients (such as N, P, and K), trace elements such as copper, iron, manganese, molybdenum, and zinc
are also required to affect yields. The system can be expanded to measure these features with appropriate integration of
additional components and precision specifications. The main purpose of this paper [27] is to
incorporate an integrated irrigation network and to measure the amount of three major macronutrients, nitrogen (N), phosphorus
(P), and potassium (K), in the soil, respectively. Saving farmers time, money, and energy. Comparing the solution in the color
scheme determines the value of N, P, and K in the soil sample. It will define the upper, middle, and lower levels of N, P, and K. This
paper introduces an intelligent system that will detect and analyze the NPK level of the soil and will determine the moisture
content of the soil, and then based on these values, automatically. watering will take place. Like the tiny Microcontroller system
used here to make the device less expensive and instead of the pH meter here it used the TCS230 color sensor to determine the
pH level of the soil or NPK, this sensor detects the color of the soil sample solution. A tiny Microcontroller performs sensory
measurements about NPK objects.
3. PROPOSED SYSTEM
The proposed solution ensures monitoring the health of a plant during its entire lifecycle by using various sensors and taking
required actions based on data collected. RaspberryPi is the controller of the setup. We also develop an AI model to take necessary
decisions depending on the condition of the plants and the weather. It collects data from sensors and, cameras, and based on the
suggestion of AI models it controls the irrigation network [1]. The sensors used are soil NPK and moisture. The water tank consists
of a water level sensor to monitor the water level. The main water tank is connected to four containers consistent with nutrients
and medicines concerning the plants. The camera and sensors constantly check the plants, once it detects any disease or
malnutrition. Then the AI model suggests the required nutrition or fertilizers be supplied to the plants [2]. This enforces the
RaspberryPi to open the valve of that container containing the nutrient. The nutrient gets mixed up with the water coming from
the tank [13] and is made to flow to the plants. Once the required water is supplied, the valves get closed. The amount of water
and nutrients left is noted and if it is very minimal, then an alert message will be sent to the user to refill the container and tan

Smart Irrigation for Crop Management Using IoT
IJMRA, Volume 5 Issue 05 May 2022 www.ijmra.in Page 925
.
Fig.1 Work Flow
The solution also aims at applying real-time data on weather conditions relevant to the current location and season to take care
of soil and crops and manage all weather-related risks. It gets data such as rainfall [14], temperature, humidity, and wind from
reliable sources and takes appropriate measures to conserve water, plan smart irrigation, and predict crop yields. If the rainfall is
very less in that particular season [3], then the amount of water used is regulated, and plans to wisely use it. This combined
solution promises to improvise crop maintenance and yields good quality crops.
4. RESULTS AND DISCUSSION
The ML model is tested and verified for different crop diseases and the results obtained are highly satisfactory. The success rate
of the Convolution Neural Network model for all the diseases is almost similar. To optimize the results of detection and prediction,
the number of epochs can be increased. The data collected from these devices is sent to the project’s AIR app and analyzed. The
pipeline created in the AIR app receives the data and filters the required parameter (Image and Integer from camera and NPK
sensor respectively will be collected). Once filtered, the rules section will monitor the NPK values and, depending on that, it sends
notifications and commands to the valves to turn-On/Off.
Fig.2 Prototype Setup
Fig.3 Water outlet to plants

Smart Irrigation for Crop Management Using IoT
IJMRA, Volume 5 Issue 05 May 2022 www.ijmra.in Page 926
Fig.4 Plant disease detection Fig.5 Analysis of NPK data
Fig. 6 Analysis of image data
Fig.7 Decision pipeline
The ML model is tested and verified for different crop diseases and the results obtained are highly satisfactory. The success rate
of the Convolution Neural Network model for all the diseases is almost similar. To optimize the results of detection and prediction,
the number of epochs can be increased.
5. CONCLUSION
Smart farming using IoT is a significant answer for different health-related issues of plants. With the traditional methods, it is
difficult to assess plant diseases and suggest remedies for them. The proposed system enhances the irrigation system using new-
age technologies like AI, ML, and edge computing. The system keeps track of plant health status and automates the process of
supplying fertilizers. This path-breaking solution promises to handle these issues more systematically with minimal effort. This
takes into consideration versatile and prominent answers for a significant issue influencing many million individuals across the
globe.

Smart Irrigation for Crop Management Using IoT
IJMRA, Volume 5 Issue 05 May 2022 www.ijmra.in Page 927
REFERENCES
1) R. Kanmani, S. Muthulakshmi, K. S. Subitcha, M. Sriranjani, R. Radhapoorani, and N. Suagnya, “Modern Irrigation System
using Convolutional Neural Network,” 2021 7th Int. Conf. Adv. Comput. Commun. Syst. ICACCS 2021, pp. 592–597, 2021,
DOI: 10.1109/ICACCS51430.2021.9441917.
2) L. Li, S. Zhang, and B. Wang, “Plant Disease Detection and Classification by Deep Learning - A Review,” IEEE Access, vol. 9,
no. CCV, pp. 56683–56698, 2021, DOI: 10.1109/ACCESS.2021.3069646.
3) W. M. Ridwan, M. Sapitang, A. Aziz, K. F. Kushiar, A. N. Ahmed, and A. El-Shafie, “Rainfall forecasting model using machine
learning methods: Case study Terengganu, Malaysia,” Ain Shams Eng. J., vol. 12, no. 2, pp. 1651–1663, 2021, DOI:
10.1016/j.asej.2020.09.011.
4) Y. Ai, C. Sun, J. Tie, and X. Cai, “Research on recognition model of crop diseases and insect pests based on deep learning
in harsh environments,” IEEE Access, vol. 8, pp. 171686–171693, 2020, DOI: 10.1109/ACCESS.2020.3025325.
5) Ahmad, Mobeen, Muhammad Abdullah, Hyeonjoon Moon, and Dongil Han. "Plant disease detection in imbalanced
datasets using efficient convolutional neural networks with stepwise transfer learning." IEEE Access 9 (2021): 140565-
140580.
6) “Sunil, C. K., C. D. Jaidhar, and Nagamma Patil. "Cardamom Plant Disease Detection Approach Using EfficientNetV2." IEEE
Access 10 (2021): 789-804.”.
7) S. Cramer, M. Kampouridis, A. A. Freitas, and A. K. Alexandridis, “An extensive evaluation of seven machine learning
methods for rainfall prediction in weather derivatives,” Expert Syst. Appl., vol. 85, pp. 169–181, 2017,
DOI: 10.1016/j.eswa.2017.05.029.
8) C. A. T. Tee, Y. X. Teoh, P. L. Yee, B. C. Tan, and K. W. Lai, “Discovering the Ganoderma Boninense Detection Methods
Using Machine Learning: A Review of Manual, Laboratory, and Remote Approaches,” IEEE Access, vol. 9, pp. 105776–
105787, 2021, DOI: 10.1109/ACCESS.2021.3098307.
9) Guo, Wei, Tao Zeng, Tao Huang, and Yu-Dong Cai. "Disease cluster detection and functional characterization." IEEE Access
8 (2020): 141958-141966.
10) Huang, Shuangjie, Guoxiong Zhou, Mingfang He, Aibin Chen, Wenzhuo Zhang, and Yahui Hu. "Detection of peach disease
image based on asymptotic non-local means and PCNNIPELM." IEEE Access 8 (2020): 136421-136433.
11) Zhou, C., Zhang, Z., Zhou, S., Xing, J., Wu, Q., & Song, J. (2021). Grape Leaf Spot Identification Under Limited Samples by
Fine Grained-GAN. IEEE Access, 9, 100480100489.
12) Jiang, Peng, Yuehan Chen, Bin Liu, Dongjian He, and Chunquan Liang. "Real-time detection of apple leaf diseases using
deep learning approach based on improved convolutional neural networks." IEEE Access 7 (2019): 59069-59080.
13) U. Ahmed, J. C. W. Lin, G. Srivastava, and Y. Djenouri, “A nutrient recommendation system for soil fertilization based on
evolutionary computation,” Comput. Electron. Agric., vol. 189, no. February, p. 106407, 2021, DOI:
10.1016/j.compag.2021.106407.
14) A. Y. Barrera-Animas, L. O. Oyedele, M. Bilal, T. D. Akinosho, J. M. D. Delgado, and L. Akanbi, “Rainfall prediction: A
comparative analysis of modern machine learning algorithms for time-series forecasting,” Mach. Learn. with Appl., vol.
7, p. 100204, Mar. 2022, doi: 10.1016/j.mlwa.2021.100204.
15) Zhou, Guoxiong, Wenzhuo Zhang, Aibin Chen, Mingfang He, and Xueshuo Ma. "Rapid detection of rice disease based on
FCM-KM and faster R-CNN fusion." IEEE Access 7 (2019): 143190-143206.
16) N. Komal Kumar, D. Vigneswari, and C. Roth, “An Effective Moisture Control based Modern Irrigation System (MIS) with
Arduino Nano,” 2019 5th Int. Conf. Adv. Comput. Commun. Syst. ICACCS 2019, pp. 70–72, 2019, DOI:
10.1109/ICACCS.2019.8728446.
17) J. Angelin Blessy and A. Kumar, “Smart irrigation system techniques using artificial intelligence and IoT,” Proc. 3rd Int.
Conf. Intell. Commun. Technol. Virtual Mob. Networks, ICICV 2021, no. Icicv, pp. 1355–1359, 2021, doi:
10.1109/ICICV50876.2021.9388444.
18) K. K. Namala, A. V. Krishna Kanth Prabhu, A. Math, A. Kumari, and S. Kulkarni, “Smart irrigation with embedded system,”
IEEE Bombay Sect. Symp. 2016 Front. Technol. Fuelling Prosper. Planet People, IBSS 2016, 2016, DOI:
10.1109/IBSS.2016.7940199.
19) V. Singh and A. K. Misra, “Detection of plant leaf diseases using image segmentation and soft computing techniques,” Inf.
Process. Agric., vol. 4, no. 1, pp. 41–49, 2017, DOI: 10.1016/j.inpa.2016.10.005.
20) G. Pandey, R. J. Weber, and R. Kumar, “Agricultural cyber-physical system: In-situ soil moisture and salinity estimation by
dielectric mixing,” IEEE Access, vol. 6, pp. 43179– 43191, 2018, DOI: 10.1109/ACCESS.2018.2862634.
21) L. He, Y. Cheng, Y. Li, F. Li, K. Fan, and Y. Li, “An Improved Method for Soil Moisture

Smart Irrigation for Crop Management Using IoT
IJMRA, Volume 5 Issue 05 May 2022 www.ijmra.in Page 928
22) Monitoring with Ensemble Learning Methods over the Tibetan Plateau,” IEEE J. Sel. Top. Appl. Earth Obs. Remote Sens.,
vol. 14, pp. 2833–2844, 2021, DOI: 10.1109/JSTARS.2021.3058325.
23) Y. Liu, J. Qian, and H. Yue, “Comprehensive Evaluation of Sentinel-2 Red Edge and Shortwave-Infrared Bands to Estimate
Soil Moisture,” IEEE J. Sel. Top. Appl. Earth Obs. Remote Sens., vol. 14, pp. 7448–7465, 2021, DOI:
10.1109/JSTARS.2021.3098513.
24) A. Y. Kachori and K. Ghodinde, “Design of microcontroller based agribot for fertigation and plantation,” 2019 Int. Conf.
Intell. Comput. Control Syst. ICCS 2019, no. Iciccs, pp. 1215–1219, 2019, doi: 10.1109/ICCS45141.2019.9065768.
25) V. Grimblatt, G. Ferré, F. Rivet, C. Jego, and N. Vergara, “Precision agriculture for small to medium size farmers - An IoT
approach,” Proc. - IEEE Int. Symp. Circuits Syst., vol. 2019-May, 2019, DOI: 10.1109/ISCAS.2019.8702563.
26) M. Marie, A. Z. M. Rosli, R. Sam, Z. Janin, and M. K. Nordin, “Integrated optical sensor for NPK Nutrient of Soil detection,”
2018 IEEE 5th Int. Conf. Smart Instrumentation, Meas. Appl. ICSIMA 2018, no. November, pp. 1–4, 2019,
DOI: 10.1109/ICSIMA.2018.8688794.
27) R. Madhumathi, T. Arumuganathan, and R. Shruthi, “Soil NPK and Moisture analysis using Wireless Sensor Networks,”
2020 11th Int. Conf. Comput. Commun. Netw. Technol. ICCCNT 2020, 2020, doi: 10.1109/ICCCNT49239.2020.9225547.
28) I. Mahmud and N. A. Nafi, “An approach of cost-effective automatic irrigation and soil testing system,” ETCCE 2020 - Int.
Conf. Emerg. Technol. Comput. Commun. Electron., 2020, DOI: 10.1109/ETCCE51779.2020.9350896.
There is an Open Access article, distributed under the term of the Creative Commons
Attribution – Non Commercial 4.0 International (CC BY-NC 4.0)
(https://creativecommons.org/licenses/by-nc/4.0/), which permits remixing, adapting and
building upon the work for non-commercial use, provided the original work is properly cited.

INTERNATIONAL JOURNAL OF MULTIDISCIPLINARY RESEARCH AND ANALYSIS
ISSN(print): 2643-9840, ISSN(online): 2643-9875
Volume 05 Issue 05 May 2022
DOI: 10.47191/ijmra/v5-i5-07, Impact Factor: 6.261
Page No. 929-934
IJMRA, Volume 5 Issue 05 May 2022 www.ijmra.in Page 929
Rationing of Tire Mileage in the Operating Conditions of the
Kalmakyr Quarry
Umidbek Yusupov1, Akmal Muxitdinov2, Feruz Otamuradov3
1PhD, docent, Tashkent State Transport University 2Doctor of Technical Sciences, Professor, Tashkent State Transport University 3Master Student, Tashkent State Transport University
ABSTRACT: The article presents the results of the road studies of the wear resistance of the tire size 33.00.51 in the Kalmakyr
quarry. It is established that the predicted norm of the operational mileage of the tire was 30500 km (Belshina). On Kalmakyr,
BelAZ-75131 dump trucks deliver cargo at the Overburden Quarry and the Central One, carrying out lifting, which averages about
60% of the length of the entire route. Based on the analysis of the characteristic causes of premature decommissioning of 23% of
controlled oversized tires (ОT), it is shown that all of them failed due to cuts and punctures of the tread or side walls. It was
revealed that radial tires 33.00R51 VRLS, "BRIDGESTONE" are much more resistant to cuts: on average, their cuts occur after a run
of 40000km.
KEYWORDS: tread wear, dump truck, rationing, correction factors, oversized tires.
1. INTRODUCTION
Operating costs for tires represent 25-30% of the cost of transporting rock mass by dump trucks, so increasing tire mileage is
essential to reduce costs. The decisive factor determining the efficiency of using tires is the performance of tires, performance,
technical level of their operation. The performance and durability of tires are affected by the average density and strength of the
transported rocks, the correct loading of the dump truck and the uniformity of the location of the rock mass, the road profile, the
condition and type of road surface. In this regard, in order to obtain the maximum efficiency of tires, it is necessary to properly
operate and maintain them [1].
Tire wear is generally affected by about 30 different factors, which can be grouped into the following four groups: tire
quality; technical condition of the motor vehicle; violation of the conditions and modes of operation of the vehicle; road and
climatic conditions [2, 9].
In the course of the study of the state of roads of the Kalmakyr Mine Administration, all routes of technological and
auxiliary transport at the Kalmakyr and Sary-Cheku quarries were analyzed in detail. Quarry Kalmakyr deep type. The roads in the
quarry naturally crumble or build on the rocks that lie there. The Kalmakyr ore field is composed mainly of intrusive and volcanic
rocks. In the north of the quarry, ionite-diorite porphyries occur, on the left side - quartz porphyries, on the right side of the
observation deck - diorites with chlorides, related to soft rocks. At the bottom of the quarry, there are granodiartine porphyries
and basalts, a very hard rock; in the southeast of the quarry, there are sheet-like quartz porphyries [3, 4].
The rock in the Kalmakyr quarry is not homogeneous. Formed with stacked and discontinuous disturbances. Therefore, on
different horizons, one can find various rocks, up to soft ones, based on sandstone and limestone [5].
2. METHOD OF CALCULATION
According to the methodology “Individual norms for the operating mileage of automobile large tires”, developed at the Scientific
Research Institute of Large Tires (SRILT), taking into account the listed factors, careers are divided into three categories according
to the severity of tire operating conditions [6]:
I-category (L) - careers with light operating conditions;
II-category (C) – quarries with medium-heavy operating conditions;
III-category (T) - careers with difficult operating conditions.

Rationing of Tire Mileage in the Operating Conditions of the Kalmakyr Quarry
IJMRA, Volume 5 Issue 05 May 2022 www.ijmra.in Page 930
The quarry category is determined by three generalized parameters - X1, X2, X3, which characterize the operating
conditions of tires in this particular quarry. The X1 parameter, which takes into account the influence of the type of road surface
and its share in the transportation shoulder on tire mileage, is determined by the expression
Х1 = ∑ Ki3𝑖=1 ∙ Ni, (1)
where Ni is the share of the i-th coating (asphalt, crushed stone, soil on a rocky base) in the transportation leg; Ki is a coefficient
that takes into account the influence of the i-th coating on the tire mileage. The values of the coefficient K are given in table.1.
Таble 1. Coefficient values К
Type of road surface i K
Advanced asphalt pavement and soft ground 1 1
Crushed stone and gravel 2 0,8
Natural covering on a rocky base (rocky soil) 3 0,7
The parameter X2 takes into account the influence of the magnitude of the longitudinal slope and its share in the shoulder
of transportation on the mileage of tires and is determined by the formula
Х2 = Ny ∙ θ, (2)
where Ny is the share (percent) of slopes in the shoulder of transportation; θ is the average value of slopes, %.
The parameter X3 takes into account the hardness of the transported rocks and is determined by the formula
Х3 = ∑ Mj ∙n𝑗=1 fj, (3)
where Mj is the share of the j–th rock in the total volume of rock mass transportation; fj is the hardness coefficient of the j-th rock
on the Protodyakonov M.M. scale; n is the number of types of transported rocks with different hardness.
Each category of quarries is characterized by the average values of generalized parameters Х̅1к, Х̅2к, Х̅3к.
To determine the category of operating conditions of a particular quarry, it is necessary to calculate the Dk parameter,
which characterizes the measure of "proximity", "approximation" of the generalized parameters of this enterprise Х1, Х2, Х3 to the
average values of the generalized parameters Х̅1к,Х̅2к,Х̅3к characterizing each category. The maximum value of the parameters
D1, D2, D3 determines whether the quarry belongs to the corresponding category.
The Dk parameter is determined by the formula
𝐷𝑘 = {1 + 0,01 [1,33(X1−Х̅1к)2
σ12 +
0,67(X2−Х̅2к)2
σ22 +
1,33(X3−Х̅3к)2
σ32 ]}
−1
, (4)
where X1, X2, X3 are generalized parameters characterizing the operating conditions of this quarry; Х̅1к , Х̅2к, Х̅3к are the average
values of parameters characterizing the severity categories of operating conditions (Table.2); σ1, σ2, σ3 are the standard deviations
of the parameters X1, X2, X3 obtained as a result of statistical data processing.
The tire mileage rate for a particular quarry is determined by the formula
𝑆 = Sk̅̅̅ ∙ C1k ∙ C2k ∙ C3k, (5)
where Sk̅̅̅ is the basic tire mileage rate for each category of operating conditions; С1к, С2к, С3к are correction coefficients that take
into account the change in the basic tire mileage rate for each category depending on the values of the parameters X1, X2, X3 of a
particular quarry; K= 1, 2, 3 is the index of the category of operating conditions.
The basic rate of tire mileage for each category of operating conditions is set by the manufacturer. For the 27.00-49 and
33.00-51 FT-116 AM2 models, the basic mileage standards are presented in table 2.
Table 2. Basic standards of tire mileage
Category of operating
conditions
Basic tire mileage rate Sk̅̅̅, thousand km
model (tire brand)
27.00-49(Bel) 33.00-51(Bel) 33.00R51 (Bridg)
I (easy) 40 40 90
II (average) 34 35 75
III (heavy) 25 30 60
Correction coefficients that take into account the change in the basic mileage rate of tires for each category are given in
table 3.

Rationing of Tire Mileage in the Operating Conditions of the Kalmakyr Quarry
IJMRA, Volume 5 Issue 05 May 2022 www.ijmra.in Page 931
Table 3. Correction factors that take into account the change in the base rate of tire mileage
Х11 С11 Х21 С21 Х31 С31
0,85
0,85 - 0,90
0,90 - 0,93
0,93 - 0,95
0,95 - 0,97
0,97 - 1,00
0,93
0,95
0,98
1,00
1,10
1,20
0,5
0,5 - 1,0
1,0 - 1,5
1,5 – 2,5
2,5
1,25
1,10
1,00
0,97
0,95
1
1 – 2
2 – 3
3 – 4
4
1,10
1,05
1,00
0,97
0,95
Х12 С12 Х22 С22 Х32 С2
0,75
0,75 – 0,80
0,80 – 0,85
0,95 – 0,90
0,90 – 0,95
0,95 – 1,00
0,95
1,00
1,03
1,05
1,07
1,10
2,0
2,0 – 2,5
2,5 – 3,0
3,0 – 4,0
4,0
1,10
1,05
1,00
0,98
0,95
3
3 – 4
4 – 5
5 – 6
6 – 7
7
1,10
1,08
1,04
1,02
1,00
0,95
Х13 С13 Х23 С23 Х33 С33
0,70
0,70 – 0,75
0,75 – 0,80
0,80 – 0,90
0,90 – 1,00
0,85
0,95
1,00
1,05
1,10
2
2 – 3
3 – 4
4 – 5
5 – 6
6
1,10
1,05
1,00
0,95
0,90
0,85
12,0
12,0 – 13,0
13,0 – 14,0
14,0 – 14,5
14,5 – 15,0
15,0
1,10
1,08
1,05
1,00
0,90
0,80
3. EXPERIMENTAL RESEARCH
According to the standards of Building codes and regulations 2.05.07–91 "Industrial transport", the quarry roads of the Kalmakyr
facility belong to the III category of mountain roads. 90% of technological roads are temporary with a service life of up to one year.
Considering that the rock contains a lot of quartzite of the Kalmakyr quarry up to 67%, which is considered the hardest rock, it
is natural that all wheeled vehicles operating there will experience intense tire wear. Even bulldozers that perform a huge amount of
work in the quarries of the Almalyk Mining and Metallurgical Combine (AМMС), the tracks wear out before the planned service life in
hours. Judging by the location of various rocks in layers of a certain height, the road from the descent to the bottom of the quarry is
heterogeneous in the hardness of its base.
According to the classification of rocks, their strength and hardness are evaluated on the scale of M.M.Protodyakonov. The
strength of the rocks on which the road in the Kalmakyr quarry is based is estimated on average at 15 units out of 20 on the scale. Data on
the strength of rocks were obtained from geologists of specific quarries and refined in the department of the Chief Geologist of the AМMC
[7, 10, 11] (table 4).
Table 4. Characteristics of the magnitude of slopes and their length on the main routes of transportation of rock mass in the
Central and Overburden quarries of Kalmakyr
Slope,
%
Length of horizontal sections, km The length of the ascent, km Length of descent, km Total,
km
№ transportation route № transportation route № transportation route
1 2 3 4 5 1 2 3 4 5 1 2 3 4 5
0 0,7 0,13 0,05 0,56 1,32 2,76
0-1 0,24 0,15 0,39
1-2 0,1 0,09 0,19
2-3 0,16 0,1 0,26

Rationing of Tire Mileage in the Operating Conditions of the Kalmakyr Quarry
IJMRA, Volume 5 Issue 05 May 2022 www.ijmra.in Page 932
3-4 0,31 0,31 0,31 0,96 0,05 0,28 2,22
4-5 0,23 1,22 1,45
5-6 0,29 0,09 0,26 0,64
6-7 0,36 0,31 0,31 0,98
7-8 0,72 0,22 0,09 1,03
8-9 0,24 0,24
9-10 0,18 0,04 0,04 0,26
Total 10,42
The mileage of the diagonal 33.00-51 FT-116AM2 model of the BelAZ-75131 dump truck at the Kalmakyr quarry in the
winter season of 2019 in November – April was 32624 km, and in the summer-autumn 27821 km, in 2020 respectively –32733 km
and 29995 km [8] (table 5).
Table 5. Initial data on the routes of transportation of rock mass by cars BelAZ-75131. Name of the quarry: Kalmakyr (Central +
Overburden)
№ Name of indicator Designatio
n
Unit of
measure-
ment.
Value
1 2 3 4 5
1. Route length L km 10,42
2.
Type of coverage and its length on the leg of transportation:
-asphalt - concrete, soft ground;
lа
km
-
-crushed stone and gravel; lщ
km 1,88
-natural coating on a rocky base, rocky soil
lск
km
8,54
3.
For each coating in the general shoulder of transportation:
-asphalt concrete, soft ground;
N1
%
-
-crushed stone and gravel; N2 % 18
-natural coating on a rocky base, rocky soil N3 % 82
4.
The number of slopes and their length on the shoulder of transportation:
1st – slope
l1
km
0,39
2nd – slope l2 km 0,19
3rd – slope l3 km 0,26
4th – slope l4 km 2,22
5th – slope l5 km 1,45
6th – slope l6 km 0,64
7th – slope l7 km 0,98
8th – slope l8 km 1,03
9th – slope l9 km 0,24
10th – slope l10 km 0,26
5. The total length of slopes in the shoulder of transportation lу km 7,66
6. The share of slopes in the shoulder of transportation Nу % 74

Rationing of Tire Mileage in the Operating Conditions of the Kalmakyr Quarry
IJMRA, Volume 5 Issue 05 May 2022 www.ijmra.in Page 933
7.
The magnitude of each slope on the shoulder of transportation:
1st – slope
Θ1
%
1
2nd – slope Θ2 % 2
3rd – slope Θ3 % 3
4th – slope Θ4 % 4
5th – slope Θ5 % 5
6th – slope Θ6 % 6
7th – slope Θ7 % 7
8th – slope Θ8 % 8
9th – slope Θ9 % 9
10th – slope Θ10 % 10
8. The average value of the values of all slopes on the shoulder of
transportation Θ % 5,5
9. For each rock in the total volume of rock mass transportation:
1st (breed)
M1
%
100
10. The coefficient of rock strength on the Protodyakonov scale:
1st (breed)
f1
-
14
4. CALCULATION
The following generalized parameters characterizing the operating conditions of tires in the Kalmakyr quarry are calculated: a
parameter that takes into account the influence of the type of pavement and its share in the transportation arm on the tire
resource:
Х1 = ∑ Ki3𝑖=1 ∙ Ni = 0,8 ∙ 0,18 + 0,7 ∙ 0,82 = 0,718.
a parameter that takes into account the effect of the magnitude of the longitudinal slope and its share in the shoulder of
transportation on the mileage of tires:
Х2 = Ny ∙ θ = 0,74 ∙ 5,5 = 4,07.
a parameter that takes into account the influence of rock strength on tire mileage:
Х3 = ∑ Mjn𝑗=1 ∙ fj = 1 ∙ 14 = 14.
According to the calculations of the measure of proximity Dk of the generalized parameters Х1, Х2, Х3 of the operating
conditions of the Kalmakyr quarry to the average values of the typical parameters characterizing the category of severity of the
operating conditions, it was found that:
𝐷1 = {1 + 0,01 [1,33(0,718 − 0,95)2
0,092+
0,67(4,07 − 1,43)2
2,432+
1,33(14 − 2,04)2
4,52]}
−1
= 0,84,
𝐷2 = {1 + 0,01 [1,33(0,78 − 0,78)2
0,092+
0,67(4,07 − 3,03)2
2,432+
1,33(14 − 6,89)2
4,52]}
−1
= 0,96,
𝐷3 = {1 + 0,01 [1,33(0,718 − 0,79)2
0,092+
0,67(4,07 − 3,89)2
2,432+
1,33(14 − 14,41)2
4,52]}
−1
= 0,991.
A comparison of the calculated values of the parameters D1, D2, D3 indicates that the largest value is D3=0,991, therefore,
the Kalmakyr quarry belongs to the III category with severe tire operating conditions. According to TURB 700016217.126-2001,
for the III category of operating conditions, the base mileage rate of tires 33.00-51 of the FT-116AM2 model is Sk̅̅̅ =30000km [8,
10, 11].
The values of the correction coefficients С13, С23, С33 for a quarry with severe operating conditions are from table.3
according to the values of the generalized parameters Х1, Х2, Х3. The adjusted rate of tire service life for specific operating
conditions of the Kalmakyr quarry is determined by the formula
𝑆 = 𝑆𝑘̅̅ ̅ ∙ C1k ∙ C2k ∙ C3k = 30000 ∙ 0,95 ∙ 0,95 ∙ 1,05 = 28428км.
According to the Operating Manual of the oversized tires company "BRIDGESTONE" for 2018, for the III – category of
operating conditions, the basic warranty rate of radial tires 33.00R51 is Sk̅̅̅ = 60000km.
The adjusted norm of the operational mileage of tires for specific operating conditions of the Kalmakyr quarry is
determined by the following formula, making up 33.00R51 "BRIDGESTONE" for tires:

Rationing of Tire Mileage in the Operating Conditions of the Kalmakyr Quarry
IJMRA, Volume 5 Issue 05 May 2022 www.ijmra.in Page 934
Sk= Sk̅̅̅ ∙ C1k ∙ C2k ∙ C3k= 60000 ∙ 0,95 ∙ 0,95 ∙ 1,05=56875км.
5. CONCLUSIONS
1. After carrying out activities in the quarry under study to improve the quality of quarry roads and bring them into compliance
with at least the minimum requirements of the interstate Building codes and regulations 2.05.07-91 "Building codes and
regulations. Industrial transport" the mileage of these radial tires should increase by at least 15-20%.
2. Radial tires 33.00R51 VRLS, "BRIDGESTONE" are much more resistant to cuts: on average, cuts occur after a run of 40000km.
The cost of these tires is more than diagonal tires of the same size produced by JSC "Belshina", and the walking capacity is 2 times
higher. Calculations show that in the case of switching to the purchase of radial tires 33.00R51 VRLS "BRIDGESTONE" instead of
diagonal tires 33.00-51 "Belshina" for 34 BelAZ-75131 dump trucks operating today, the annual economic effect on truck depots
No. 1 and No. 4 will amount to more than 3 million US dollars.
REFERENCES
1) Reference book of operational characteristics of BELAZ. Minsk, 2014.
2) Knoroz V.I. The work of a car tire. – M.: Transport, 1976.–238 p.
3) Topalidi V.A., Yusupov U.B. Rationing of the resource of truck tires in quarry conditions // Automotive industry. – 2019.
–No. 11. – p. 27-29.
4) Topalidi V.A., Yusupov U.B. Wear resistance of specialized vehicle tires depending on the category of strength of quarry
roads // Automotive industry. – 2020. – No. 12. – pp. 20-22.
5) Report on contract No. 04-10/19. Research and Development "Installation of mileage standards for oversized tires of
off-road dump trucks BelAZ-75131 and BelAZ-7514". 2019
6) Topalidi V.A., Yusupov U.B. Universal methodology for rationing the mileage of automobile tires // Bulletin of TARI. –
2019. – No.3 – p.18-24.
7) Yusupov U.B. Development of a methodology for rationing the mileage of tires of specialized vehicles, taking into
account work in career conditions: Dis.... doct. philos. (PhD) in technical sciences. 05.08.06. –Tashkent, 2020. – 122 p.
8) Report of the UNC "BILIMINTERTRANS" under the contract 06-63 with JSC "AMMC" "Research and installation of tire
mileage standards for three types of vehicles and road construction machines in the quarries of JSC "Almalyk MMC".
2020.
9) Topalidi Valeriy, Yusupov Umidbek, Babayev Alijon. Wear resistance of specialized vehicles tires on quarry roads //
IJMPERD. ISSN (P): 2249-6890; ISSN (E): 2249-8001. Vol.10. Issue 5. Oct 2020. –р. 643–658.
10) Yusupov U.B., Anvarjonov A.A. Rating of the operational massage of the tires of large-loaded mining dump trucks
operating at the objects of the Almalyk mining and metallurgical combine// GALAXY INTERNATIONAL
INTERDISCIPLINARY RESEARCH JOURNAL (GIIRJ). ISSN (E): 2347-6915. Vol. 10, Issue 1, Jan. (2022). р. 36 – 40.
11) Yusupov U.B. Rationing of tire resource in career conditions // Railway transport: Topical issues and innovations. Tashkent, 2021. - No. 3. p. 35 – 42.
There is an Open Access article, distributed under the term of the Creative Commons
Attribution – Non Commercial 4.0 International (CC BY-NC 4.0)
(https://creativecommons.org/licenses/by-nc/4.0/), which permits remixing, adapting and
building upon the work for non-commercial use, provided the original work is properly cited.

INTERNATIONAL JOURNAL OF MULTIDISCIPLINARY RESEARCH AND ANALYSIS
ISSN(print): 2643-9840, ISSN(online): 2643-9875
Volume 05 Issue 05 May 2022
DOI: 10.47191/ijmra/v5-i5-08, Impact Factor: 6.261
Page No. 935-939
IJMRA, Volume 5 Issue 05 May 2022 www.ijmra.in Page 935
Archaeological Research is an Important Source in the Study of
Traditional Economic Activities of the Uzbek People (On the
Example of SomeResearchers of the Twentieth Century)
Bobir Odilov1, Nodir Karimov2
1Assistant professor, Tashkent State University of Oriental Studies Uzbekistan 2Lecturer, Tashkent State University of Oriental Studies, Uzbekistan
ABSTRACT: This article discusses archeological research as an important source (on the example of some researchers of the
twentieth century) in the study of traditional economic activities of the Uzbek people. Historical analysis has shown that some of
the scientific works of that period were dominated by the research of historical archeology of the former Soviet period and the
influence of history on the idea that the economy of the ancient peoples of Central Asia, especially the Uzbeks, was formed
mainly nomadic. This is because the diversity of views and sometimes unscientific notions on the way of life of the peoples of
Central Asia, which still persist in science, are sometimes linked to the fact that the economy of the Uzbek people has long been
associated with the territories inhabited and now occupied by oases and valleys.
KEYWORDS: archeological research, source, economic activities, Uzbek people, historical analysis, scientific works, historical
archeology, Soviet period, influence of history, ancient peoples, unscientific notions, Uzbek people, territories, oases, valleys.
INTRODUCTION
It is known that from ancient times the specific natural and geographical features and climatic conditions of Uzbekistan have
affected the economic life of the people. From ancient times in he territories of the republic, especially in the oases, steppes and
valleys of irrigated agriculture, three main types of economy have been formed: animal husbandry, semi-subsistence farming,
and irrigated subsistence farming.
To date, significant work has been done to study the lifestyle and economic activities of the ancient population of
Uzbekistan from an archeological point of view, and great achievements have been made. In this regard, significant research has
been conducted in the XX century in the field of history, especially in the field of archeology, which is its component area. In
particular, on the issues of lifestyle and economy of the Uzbek people, leading historians S.P. Tolstov, V.M. Masson, A. V.
Vinogradov, Yu.A Zadneprovskiy, V.I Sprishevskiy, Ya.Gulomov, E. Kuzmina, N, N.A Avanesova, A. Askarov, Yu.F. Buryakov, A.
Sagdullaev’s scientific researches are noteworthy. Although the traditional economy of ethnic communities and peoples living in
the territory of modern Uzbekistan in the XIX-XXI centuries is almost similar, it is clear that they differ in some local and ethnic
aspects.
THE MAIN FINDINGS AND RESULTS
Scientific research based on archeological research conducted in the country after the second half of the XX century was
radically different from the work of previous periods in terms of its weight, scope, essence and methodology. In particular, in
order to study the economic life of our ancient ancestors, scientists have found many archeological monuments of the Neolithic
period in the territory of our country, in particular, the settlements inhabited by individuals in a compact place.
If we approach the issue from a periodic point of view, in the 40s and 50s of the XX century only the lower basins of the
Amudarya, especially near the Kaltaminor canal near the ancient Akchadarya delta, were inhabited by separate Neolithic
settlements. The research of one of the leading scholars of the region S.P. Tolstov [1] reflected the fact that many communities
were found and studied in the Upper Uzbay tributary of the Amudarya and the north-eastern shores of the Aral Sea.
In 1949-1953, under the leadership of academician S.P. Tolstov, a special “Archaeological and ethnographic expedition”
to the Khorezm oasis was organized. As a result of excavations in the lower basins of the Amudarya, the ancient Aral Sea region

Archaeological Research is an Important Source in the Study of Traditional Economic Activities of the Uzbek
People (On the Example of Some Researchers of the Twentieth Century)
IJMRA, Volume 5 Issue 05 May 2022 www.ijmra.in Page 936
of the Khorezm oasis, the ancient agricultural culture “formed much earlier in the northwestern regions of Uzbekistan due to the
natural climate and geographical features of the region” [1]. According to S.P. Tolstov, “In the above-mentioned regions, hunting
and fishing have not yet given way to a new economy - animal husbandry. It was at this time that the economic life of primitive
communities in the central regions of Central Asia began to change radically [2,123-187]”.
Another important contribution of S.P. Tolstov was that under his leadership, bibliographic indexes of scientific
literature in the field of archeology in Uzbekistan from 1948 to 1954 were compiled, and a number of scientific articles were
regularly published in the journal “Soviet Archeology”. In these articles you can find a number of articles devoted to the ancient
period of the cultural economy of the Uzbek people, which we have analyzed.
Well-known archaeologist V.M. Masson’s study of the Anov-Namazgoh economic culture of the Eneolithic and Bronze
Ages, based on the cultural and economic traditions of the Joytun culture, made it possible to compare the economic life of the
peoples of Central Asia with other regions of the ancient East. According to him, the traces of sedentary farming in the central
regions of Central Asia, especially in the lower basins of Zarafshan, are widespread from the south to the north-eastern regions
of the region, especially along the northern Kopetdag [3].
Although the works of the scientist have a general, descriptive character, his work “Central Asia and the Ancient East”
provided an opportunity to study the economic life of the Uzbek people and enrich its dynamics. According to the concept of
V.M. Masson, in the south-western regions of Central Asia, under the influence of the ancient Eastern civilization, a way of life
based on a sedentary farming culture began to take shape from the Neolithic period (Joytun culture) [4].
Among the researches on archeology and economic life after the 50s of the XX century, the directions of economic life
of the Uzbek people were studied by academician Ya. Gulyamov was able to show clearly. The involvement of the vast factual
source and statistical material inherent in the scientist’s research made it possible to draw a number of important theoretical
conclusions. This is confirmed by the monument of Zamonbobo culture of the first stage of primitive farming, which was
discovered by a scientist in the 50s of the XX century [5].
One of the great achievements of the academician in the field of archeology was that he first provided valuable
information in his fundamental work “History of Irrigation in Khorezm” [6,57-67] about the ancient irrigation systems of the
Khorezm oasis, the existing irrigation systems and the first views of the main canals. According to Ya. Gulyamov, “the first
irrigated agriculture in the oasis began to take place not only in the lower reaches of the Amudarya, but also in the steppe, hilly
areas and dry oases” [6].
A.V. Vinogradov’s research confirms that primitive communities on the northern borders of Khorezm in the Mesolithic
period still lived by hunting (Kaltaminor culture)1. While studying the ancient economic life of the people of the region on the
basis of available archeological materials, scientists pay attention not only to agriculture, hunting, fishing, but also to the
settlements of ancient herdsmen and artisans. According to the author’s analysis, the images of Zarautsoy rock in Surkhandarya
region belong to the Mesolithic period, and in the Neolithic period the migration of hunter-gatherer families to the settlements
between the Amudarya and Syrdarya rivers is observed [7]. According to the author’s concept, such farms are known to science
as “hunting and fishing grounds of the ancient rivers of Central Asia” [8]. This thesis was further developed and enriched by local
archaeologists such as Ya. Gulomov, A. Askarov, O., Islamov, who studied the economic activity of the ancient ancestors of the
Uzbek people.
Historical analysis has shown that some of the scientific works of that period were dominated by the research of
historical archeology of the former Soviet period and the influence of history on the idea that the economy of the ancient
peoples of Central Asia, especially the Uzbeks, was formed mainly nomadic. This is because the diversity of views and sometimes
unscientific notions on the way of life of the peoples of Central Asia, which still persist in science, are sometimes linked to the
fact that the economy of the Uzbek people has long been associated with the territories inhabited and now occupied by oases
and valleys.
At a time when the science of history could not deviate from the ideological stereotypes of its time, academician A.
Askarov’s research is characterized by the fact that archeological research is carried out at the required level and is rich in
scientific analysis. In “Sapallitepa” and “Ancient agricultural culture of the Bronze Age of the south of Uzbekistan” the author
rightly noted that in the economic life of the southern population a sedentary lifestyle prevailed and agriculture was of great
importance, “they were the oldest farmers in southern Uzbekistan” [9]. The fact that the people of the South have established
economic relations with such regions as the ancient Zarafshan oasis, the Fergana Valley is also noted in the works of such
authors as Ya.G. Gulomov, O. Islamov Yu.A. Zadneprovsky [10].
1 Виноградов А. В. Древние охотники и рыболовы среднеазиатского междуречья. Москва-1981.

Archaeological Research is an Important Source in the Study of Traditional Economic Activities of the Uzbek
People (On the Example of Some Researchers of the Twentieth Century)
IJMRA, Volume 5 Issue 05 May 2022 www.ijmra.in Page 937
Historical analysis of the available sources has shown that as a result of such economic and cultural changes, the
boundaries of the regions of ancient agricultural culture began to expand towards the northeastern regions of Central Asia,
shows the beginning of the formation of the Bronze Age Sopolli culture of irrigated agriculture and highly developed handicrafts
in southern Uzbekistan [9].
Based on the analysis of the works of the above-mentioned authors, it can be concluded that if scientists focused more
on the study of agriculture and animal husbandry, an important sector of the economy, Archaeological finds from southern
Uzbekistan confirm the development of handicrafts in the region.
V.I. Sprishevsky, E. E. Kuzmina’s researches studied the culture of Zoroastrian and cattle-breeding tribes living in the
lower reaches of the Amudarya in the middle of the 2nd millennium BC. The authors have made a significant contribution to the
development of archeological research in the region. In particular, the monument to Amirabad in the early 1st millennium BC,
the location of the ancient cultivating families of the Chust culture in the late Bronze Age (late 2nd millennium BC - early 1st
millennium BC) will be studied [11].
Yu. A. Zadneprovsky, N.A. Avanesova, based on their research, conclude that as the migration of livestock communities
from north to south begins in the oases inhabited by settled peasant communities, ethnic processes expand and the first
consolidation of northern and southern populations occurs. Such rapid changes are reflected in the authors’ scientific research
on the ancient Bronze and Iron Ages [12,20-21].
Rapid economic relations As noted by scholars, by the time of the Bronze Age (end of the second millennium BC -
beginning of the first millennium BC) radical socio-economic and cultural changes took place in the economic life of our primitive
ancestors. It is noted that the root of these changes took place simultaneously in the last quarter of the 3 millennium BC in both
worlds, i.e. in the communities of ancient farming and hunting-fishing tribes.
According to extensive archeological research, the discovery of private property buds farming and animal husbandry
was the economic basis of society, associated with the transition from a subsistence farm to a productive farm. In the south-
western regions of Central Asia, primitive farming and animal husbandry began in the Neolithic period. In the central and north-
western regions of the region during the Neolithic period, still subsistence farming was still going on [12].
It is known from historical research that the authors note that mil. av. In the early millennia, our ancestors mastered
the manufacture of iron tools, weapons, ornaments, and the use of iron in agriculture became widespread. The Iron Age begins
in people's lives. Iron plows, hoes, shovels, and other tools made farm work easier, with the possibility of plowing much larger
areas, building dams, and digging canals and ditches. This helped to increase the generality of farm labor.
But a number of authors, particularly Yu.A. Zadneprovsky in his book “Ancient agricultural culture of Ferghana” notes
that not only in ancient times, but also in the Middle Ages, the preservation of past forms of land tenure has led to low labor
productivity in agriculture, existing primitive agro-technical traditions, which prevent workers from growing at the required
level. It was one of the factors that negatively affected the uneven development of the national economy and the development
of social life [13].
One of the other historical-cultural and historical-ethnographic regions of Uzbekistan is undoubtedly the Fergana
Valley. In addition to Yu.A. Zadneprovsky and O. Islamov, the economic activity of the population of the valley during the first
Iron Age was studied by B.E. Hamburg, N.G. Gorbunova [14], Shurabashat culture associated with farming tribes dating back to
the post-Eilaton period [15] and similar studies are of great importance in the study of the ancient economic life of the
inhabitants of the Fergana Valley. The scientific conclusion that the culture of ancient Fergana was in the direction of agriculture
and animal husbandry was also noted by A.N. Bernstam in his time [16, 186-190].
In one of his works on irrigation and irrigated agriculture in ancient Fergana, the researcher B. Latin focuses on the
characteristics of the valley, ancient agricultural traditions and systems, stages of development, and shows the characteristics of
each stage. He noted that at the end of the second millennium BC and the first half of the first millennium BC, small oases for
the first time appeared, which were irrigated and cultivated by the simplest method (port).
As a result of the development of agriculture and animal husbandry in the country, patriarchal families with high male
rights emerged. Family life of the Uzbek people and patriarchal family economic relations of ancient and medieval L.F.
Monogarova, reflected in the scientific work of N.G. Borozna, was the head of a male family in such a patriarchal family, where
he lived with his wives, children and grandchildren, as well as other relatives. Such originality contributed to the organization of
family life, in particular, the rapid development of economic life [17]. Such an attitude as M. Kosven points out, the peasant and
pastoral communities of the time were dominated by the rules of military democracy [18,7], It is a sign that a child born in every
family has been brought up in the spirit of loyalty to the family, clan and tribal traditions from an early age. Ethnographer N.A.

Archaeological Research is an Important Source in the Study of Traditional Economic Activities of the Uzbek
People (On the Example of Some Researchers of the Twentieth Century)
IJMRA, Volume 5 Issue 05 May 2022 www.ijmra.in Page 938
Kondaurov describes the patriarchal collective farm as not only a combination of several large and small family farms, but also a
slightly larger social association with certain economic and territorial units [19,147].
It should be noted that it is not difficult to see from the analysis of research that the social sciences, especially history,
served the interests of the communist ideology and Marxist-Leninist ideas of the time. In particular, in post-Soviet
historiography, the first urban culture in Central Asia was brought by the Iranian Achaemenids and the Greeks led by Alexander.
The indigenous inhabitants of this land, the Saks, lived on pastures and were engaged in nomadic pastoralism.
However, archeological research since the 1970s has proved that such unscientific views are unfounded on the example
of the above-mentioned monuments of ancient agricultural culture [20, 194]. As a result of the growth and change of production
relations in the process of historical development, small farms, small artisanal farms have led to a crisis.
It is worth noting that the important traces of the ancient economic life of the peoples of Central Asia, including the
Uzbek people, are reflected in the work of a number of researchers on the example of the historical and cultural regions of
Ancient Sogdiana and Bactria. Among them, the scientific research of local scientists is also significant, Yu.A. Buryakov, A.
Sagdullaev, N. A Avanesovas began to come up with their own concepts and theories, in contrast to the principles and
methodology of post-Soviet historiography [21].
In other words, during the Late Bronze and Early Iron Ages, another cultural and economic center, the Sogdiana region,
was formed, traces of its ethnic strata engaged in ancient farming, on the example of the lower strata of the Koktepa, Afrosiyob,
Khojabostan, Kazimontepa monuments of the Zarafshan valley by Sagdullaev [22], information about the shield tombs of Kalkan
ota, Uzunqir, Daratepa, Sangirtepa and other monuments in the Kashkadarya oasis can be found in the works of a number of
other authors [23].
Yu. F. Buryakov notes that information about another region of Chach, which was formed as a result of regional
development in Central Asia in the early antiquity, dates back to the 2nd half of the I millennium BC. The author argues that the
urbanization process in the country is based on the burglary culture of the local settlers, the ancient inhabitants of Chach, who
first began to engage in ancient agriculture, and its historical roots gradually began to settle under the influence of agricultural
cultures of the southern regions of Central Asia. The first monuments of this period were Qanqatepa in Akkurgan district of
Tashkent oasis, Qovunchitepa in Yangiyul, Shoshtepa (Chochtepa) in the Greater Tashkent region and others, signs of ancient
urban culture began to appear in these places in the III-II centuries BC [24,108110].
CONCLUSION
Based on the study of the reflection of the economic life of the Uzbek people in archeological research and sources, the
following conclusions can be drawn:
First of all, the scope of archeological research of the economic life of the Uzbek people is quite significant in terms of
its content, which has served and continues to serve as a scientific basis for the science of historiography of its time and today;
Second, although the archeological study of the ancient way of life of Central Asia, including the Uzbek people, provided
some opportunities for further scientific research, their analysis suggests that research in this area did not fully reflect all aspects
of economic life of peoples.
Thirdly, from ancient times to the formation of the first land tenure relations, it is easy to see that the radical socio-
economic changes in the economic development of the Uzbek people were reflected in archeological materials, in a sense under
the influence of the former regime’s communist ideology and Marxist-Leninist ideas.
REFERENCES
1) Tolstov S.P. Works of the Khorezmian archaeological and ethnographic expedition in 1949-1953, “THAEE”, Volume II
Moscow: 1948.
2) Tolstov S.P. In the footsteps of the ancient Khorezmian civilization. Moscow: 1948.
3) Masson V.M. Central Asia and the Ancient East. Moscow:, 1964; P. 123-187.
4) Masson V.M. Jaitun settlement (The problem of the formation of a producing economy). Leningrad: 1971.
5) Gulyamov Ya.G. Archaeological work to the west of the Bukhara oasis. Proceedings of the Institute of History and
Archeology of the Academy of Sciences of the Uzbek SSR, vol. VIII. T., 1956. Gulyamov YG, Askarov A, Islomov U.
Primitive culture in the lower reaches of the Zerafshan. Тashkent: 1966.
6) Gulyamov Ya. History of irrigation in Khorezm. Тashkent: 1959. P.57-67.
7) Vinogradov A. V. Ancient hunters and fishermen of the Central Asian interfluve. Moscow: -1981.

Archaeological Research is an Important Source in the Study of Traditional Economic Activities of the Uzbek
People (On the Example of Some Researchers of the Twentieth Century)
IJMRA, Volume 5 Issue 05 May 2022 www.ijmra.in Page 939
8) Vinogradov A.V. Ancient hunters and fishermen of the Central Asian interfluve. M., 1981. Gulyamov Ya.G.
Archaeological work to the west of the Bukhara oasis. Tr. Institute of History and Archaeology. An Uzbek SSR, Issue VIII.
T. 1956. The history of the irrigation of Khorezm from ancient times to the present day. Tashkent 1957. Gulyamov YG,
Askarov A, Islomov U. Primitive culture in the lower reaches of the Zerafshan. Tashkent: 1966.
9) Askarov A. Sapallitepa. Publishing House “Science”, Tashkent: 1973, Askarov A. Ancient agricultural culture of the
Bronze Age in the south of Uzbekistan. Publishing House “Science”.1977.
10) Gulyamov YG, Askarov A, Islomov U. Primitive culture in the lower reaches of the Zerafshan. T. 1966. Zadneprovsky
Yu.A. Ancient agricultural culture of Ferghana. Moscow Leningrad, 1962. MIA № 118. Chust culture of Ferghana and
monuments of the Early Iron Age of Central Asia. Abstract of the thesis. doc. Diss. Moscow, 1978.
11) Sprishevsky V.I. Chust site of the Bronze Age in Uzbekistan SE No. III. Moscow 1954. Kuzmina E.E. On the question of the
formation of the culture of northern Bactria (“Bactrian mirage” and archaeological reality) VDI №1 1972., Askarov A.
Ancient agricultural culture of the Bronze Age. Tab. XXI, fig.-1-15. His: Early Gorsky culture of the Bronze Age in the
south of Central Asia. Samarkand 1993.
12) Zadneprovsky Yu.A. Ancient agricultural culture of Ferghana. Moscow, Leningrad, 1962. MIA № 118. His own. doc. Diss.
Moscow, 1978., Avanesova N.A. New materials of the Bronze Age of the Zerafshan Valley. “Archaeological research in
Uzbekistan - 2001”. P. 20-21.
13) Zadneprovsky Yu.A. Ancient agricultural culture of Ferghana. Moscow Leningrad, 1962. MIA №. 118. Chust culture of
Ferghana and monuments of the Early Iron Age of Central Asia. Abstract of the thesis. doc. Diss. Moscow, 1978.
14) Hamburg B.E., Gorbunova N.G. Aktam burial ground KSIIMK. Issue 69. 1957., Gorbunova N.G. Culture of Ferghana in the
Early Iron Age / ASGE, issue 5. 1963. Ўsha muallif: ASEG Sufan burial ground. Issue. 11 1969. Kungai burial ground //
ASGE. Issue. 3. 1961.
15) Gorbunova N.G. Shurabashat ceramics in Eastern Fergana // ASGE. issue 18. 1977.
16) Bernshtam A.N. Historical and archaeological essays on the central Tien Shan and Pamir-Alai // MIA №. 26. Moscow:
1952. P. 186-190
17) Monogarova L.F. Family and family life // Ethnographic essays on the Uzbek rural population. – Moscow:, 1969; Borozna
N.G. On the question of the form of the family among semi-nomadic Uzbeks (based on the materials of the Uzbek
durmens) // Family and family rituals among the peoples of Central Asia and Kazakhstan. Мoscow:1987;
18) Kosven M.O. Family community and patronymic. – Moscow: Science,1963. – P. 7.
19) Kondaurov N.A. Patriarchal home community and communal houses among the Yaghnobis. - Moscow-Lelilgrad,1940. –
P. 147.
20) Askarov A. History of the origin of the Uzbek people. Тashkent, 2015. P. 194.
21) Buryakov Yu. Cultural and economic processes. Tashkent:, 1974. A. Sagdullaev, Monuments of the material culture of
the southern Sogd of the Early Iron Age (Some results of research in 1976-1986). That author. Settled areas of the south
of Central Asia in the Early Iron Age (the genesis of culture and socio-economic dynamics). Atoref. Dr. Diss. Moscow
1989. Avanesova N.A. New materials of the Bronze Age of the Zerafshan Valley. “Archaeological research in Uzbekistan
-2001”.
22) Sagdullaev A., Monuments of the material culture of the southern Sogd of the Early Iron Age (Some results of research
in 1976-1986). That author. Settled areas of the south of Central Asia in the Early Iron Age (the genesis of culture and
socio-economic dynamics). Atoref. Dr. Diss. Moscow:
23) Litvinskiy B.A. “Saki beyond Soghd” // Trudq AN Tadj SSR .T., 120. Stalinobod. 1960., Khojaev A. The past of our people
in ancient sources., Tashkent: 2001.
24) Buryakov Yu.F. Genesis and stages of development of the urban culture of the Tashkent oasis. Tashkent-1982. P. 108-
110.
There is an Open Access article, distributed under the term of the Creative Commons
Attribution – Non Commercial 4.0 International (CC BY-NC 4.0)
(https://creativecommons.org/licenses/by-nc/4.0/), which permits remixing, adapting and
building upon the work for non-commercial use, provided the original work is properly cited.

INTERNATIONAL JOURNAL OF MULTIDISCIPLINARY RESEARCH AND ANALYSIS
ISSN(print): 2643-9840, ISSN(online): 2643-9875
Volume 05 Issue 05 May 2022
DOI: 10.47191/ijmra/v5-i5-09, Impact Factor: 6.261
Page No. 940-948
IJMRA, Volume 5 Issue 05 May 2022 www.ijmra.in Page 940
Best Practices in Implementing Modular Distance Learning to
Indigenous People (IP) Students in Olongapo City
Merlyn M. Seridon
Kalalake National High School, Schools Division Office of Olongapo City, Zambales, Philippines
ABSTRACT: This study explored the best practices employed by the teacher-respondents’ strategies in implementing Modular
Distance Learning to IP students amidst COVID-19 pandemic. It was conducted among Junior High School Teacher of Olongapo
City that has Indigenous People (IP) students, Department of Education, Division of Olongapo during the first quarter of the
school year of 2021-2022. The study utilized a descriptive quantitative research design, survey questionnaire as research
instrument, and descriptive and inferential statistics for analysis of data. The researcher concluded that the teacher-respondent
are female in their adulthood stage with a teaching position of Teacher I and the highest educational attainment of having units
in master’s degree. The teacher-respondents always employed best practices in implementing modular distance learning to IP
students in terms of assessment and instructional delivery, they often employed best practices in terms of module development
and distribution and retrieval of modules. There was a significant difference in the best practices employed in terms of module
development in implementing module distance learning to IP students when respondents grouped according to age and higher
education attainment; in terms of distribution and retrieval and assessment when grouped according to age, teaching position
and highest educational attainment; there was a significant difference in the best practices employed in terms of instructional
delivery when grouped according to teaching position.
KEYWORDS: Alternative Delivery Mode, Assessment, Indigenous People Students, Instructional Delivery, Modular Distance
Learning, Module Development
INTRODUCTION
The COVID-19 pandemic is a huge challenge to education systems (Daniel, 2020 & Tria, 2020). According to Chin (2020), in order
to maintain the education of millions of Filipino students, the government implemented a distance learning approach. Distance
learning, also known as correspondence education or home study, is a form of education where there is little or no face-to-face
interaction between students and their instructors. Another challenge to carefully reconsider education with special
consideration on the distinctly disadvantaged Indigenous People (IP) learners. Finding ways on how education can be delivered
to the vulnerable group of IP learners amid the COVID-19 crisis is important so that appropriate learning delivery modes can be
carefully contextualized from any learning continuity plan. For young indigenous learners, many of whom live in remote areas
with no or limited internet access, online education is nearly impossible. Many students especially the poor and those living in
the far-flung areas for lack of gadget and equipment for on-line classes and also internet connectivity problem. However, the
Covid-19 pandemic really forces educational institutions to look into different modes of delivery of lesson and learning media.
The modular mode also provided many challenges ranging from lack of transportation to difficulty in crossing from one town to
the others because of security and health protocols implemented by different local government units. The possibility of local
transmission is very real when teachers from the lowland communities will come up the mountains to teach the IP students
(Bayod, 2020). This study was done to determine the best practices employed by teachers can also be a reference for other
teachers and a basis for further school program and activities in implementing Modular Distance Learning to IP students.
Best Practices in Implementing Modular Distance Learning to Indigenous People (Ip) Students in Olongapo City
The study determined the best practices employed in implementing modular distance learning to Indigenous People
(IP) students by Junior High School Teachers of Olongapo City, Department of Education, Division of Olongapo City during the
first quarter of the school year of 2021-2022.

Best Practices in Implementing Modular Distance Learning to Indigenous People (IP) Students in Olongapo City
IJMRA, Volume 5 Issue 05 May 2022 www.ijmra.in Page 941
MATERIALS AND METHODOLOGY
The research study utilized a descriptive research design. According to McCombes (2019), descriptive research is an appropriate
choice when the research aim is to identify characteristics, frequencies, trends, and categories. Moreover, the research study
employed a quantitative research method. Quantitative research is defined as the process of collecting and analyzing numerical
data. It can be used to find patterns and averages, make predictions, test causal relationships, and generalize results to wider
populations. It is widely used in the natural and social sciences (Bhandari, 2020).
The respondents of the survey were two hundred forty (240) teachers of the selected public secondary schools in the
Schools Division of Olongapo City. The respondents were chosen using total population sampling technique. There are only four
(4) public secondary schools located in the Schools Division of Olongapo City that has IP students, namely: Iram High School,
New Cabalan National High School, Old Cabalan Integrated School and Olongapo City National High School.
A survey questionnaire was used to gather all the necessary data regarding the best practices employed by the teacher-
respondents’ strategies in implementing Modular Distance Learning to IP students amidst COVID-19 pandemic. The contents of
the survey checklist were based on the study of De Villa and Manalo (2020), Secondary Teachers' Preparation, Challenges, and
Coping Mechanism in the Pre -Implementation of Distance Learning in the New Normal and Abante, Cruz, Guevarra, Lanada,
Macale, and Myron (2021), A Comparative Analysis on the Challenges of Online Learning Modality and Modular Learning
Modality: A Basis for Training Program.
The survey questionnaire has two (2) parts. First part of the survey checklist focused on the profile of the teacher –
respondents which include the age, sex, academic position, and highest educational attainment. The second part determined
the best practices employed by junior high school teachers in the implementation of modular distance learning to Indigenous
People (IP) students in terms of Module Development, Distribution and Retrieval of Modules, Instructional Delivery, Assessment.
This part had a total of 28 items. The teachers answered from the scale ranging from 4 (Always), 3 (Often), 2 (Sometimes) and 1
(Never).
To test for the reliability and validity of the instrument, the questions were pilot tested to 25 teachers among the Junior
High School teacher in the Municipality of Subic, Schools Division of Zambales, who were not respondents of the study. After the
data had been consolidated, it was subjected to Cronbach’s analysis by a Statistician and the questions were found acceptable.
The researcher asked for permission from the Schools Division Superintendent, Division of Olongapo City for the
distribution of questionnaires to the respective public secondary schools. After securing the endorsement, the researcher
properly coordinated to the respective school heads or principals for the administration of the questionnaire through google
forms and printed questionnaire. The participants were informed of the objectives of the study so that clarity of information and
correctness of answers were attained. The researcher ensured full compliance with the highest standards of research and ethical
considerations throughout the conduct of the study. The demographic profile of the respondents was analyzed using descriptive
statistics. The best practices in the implementation of the Modular Distance Learning to IP Students were determined using
Likert Scale.
The significant difference on the best practices in the implementation of the Modular Distance Learning when
respondents are grouped according to profile variables was computed using Analysis of Variance (ANOVA). All the data obtained
in the instrument were tallied, tabulated, analyzed and interpreted accordingly.
RESULTS AND DISCUSSION
The computed mean age of the respondents was 34.57 years’ old which clearly signifies that the typical respondent is in
adulthood. The highest frequency of respondents belongs to age group 31-40 years old, with one hundred twelve (112)
responses or 46.67%. In terms of sex, majority of the teacher- respondents were females with one hundred eighty-three (183)
or 76.25%, while there are only fifty-seven (57) or 23.75% who are male teacher-respondents. The highest frequency of
respondents was in the Teacher I position, with one hundred seven (107) responses or 44.58%. Majority of the respondents
earned units in Master’s Degree with one hundred forty-four (144) responses or 60%. This result suggests that the teachers of
the present study are pursuing continuous professional development through engagement in advanced education.
1. Best Practices Employed by the Respondents in Implementing Modular Distance Learning to IP Students
1.1 Module Development
In terms of the best practices employed in module development in implementing modular distance learning to IP
students, it can be noted on Table 1 that the teacher-respondents “Often” employed “2. Procurement of learning resources for
module development”, as manifested in the highest weighted mean of 3.15. Furthermore, the teacher-respondents
“Sometimes” practiced the “4. Conduct action research for effectivity of developed modules”, with the lowest weighted mean of
2.10.

Best Practices in Implementing Modular Distance Learning to Indigenous People (IP) Students in Olongapo City
IJMRA, Volume 5 Issue 05 May 2022 www.ijmra.in Page 942
The computed overall weighted mean on the responses was 2.74 with qualitative interpretation of “Often”. To address
the challenges encountered by teachers on the lack of laptops, the Department of Education (DepEd) already asked the House of
Representatives during the 2022 Budget Deliberation for a P37 billion fund to provide public school teachers with the laptops
needed to support remote teaching during the pandemic, including the development of modules (Magsambol, 2021).
Table 1. Best Practices Employed in Module Development in Implementing Modular Distance Learning to IP Students
1.2 Distribution and Retrieval of Modules
Table 2. Best Practices Employed in Distribution and Retrieval of Modules in Implementing Modular Distance Learning to IP
Students
Distribution and Retrieval of Modules Weighted
Mean
Qualitative
Rating
Rank
1. All subjects have available printed modules for all the
IP learners.
3.35 Always 2
2. Building partnerships with LGU or Barangay officials
for the distribution and retrieval of modules.
2.80 Often 3
3. The flowchart of procedures is devised in the dialect
of the IP learners and parents.
2.23 Sometimes 6
4. Police Officers are being tapped for the strict
implementation of health protocols.
2.51 Often 4
5. Retrieved modules and answer sheets are properly
disinfected.
2.29 Sometimes 5
6. Masks and alcohols are readily available for parents,
guardians of students during distribution of modules.
3.73 Always 1
7. Modules are delivered to the houses of the IP
learners directly.
2.19 Sometimes 7
Overall Weighted Mean 2.73 Often
In terms of the best practices employed in the distribution and retrieval of modules in implementing modular distance
learning to IP students, it can be noted on Table 2 that the teacher-respondents “Always” practiced the statements “6. Masks
and alcohols are readily available for parents, guardians of students during distribution of modules”, with the highest weighted
mean of 3.73, and the respondents “Sometimes” practiced the statement “7. Modules are delivered to the houses of the IP
learners directly”, with the lowest weighted mean of 2.19.
Module Development Weighted
Mean
Qualitative
Rating
Rank
1. Attending trainings or webinars for module
development.
2.98 Often 4
2. Procurement of learning resources for module
development.
3.15 Often 1
3. Collaboration with other teachers for techniques in
module development.
3.05 Often 3
4. Conduct action research for effectivity of developed
modules.
2.10 Sometimes 7
5. Maximization of the availability of laptops and
computers in the school.
2.68 Often 5
6. Development of modules using the dialects of the IP
learners.
2.11 Sometimes 6
7. Quality assurance of developed modules is being
conducted by supervisors and other experts.
3.14 Often 2
Overall Weighted Mean 2.74 Often

Best Practices in Implementing Modular Distance Learning to Indigenous People (IP) Students in Olongapo City
IJMRA, Volume 5 Issue 05 May 2022 www.ijmra.in Page 943
The computed overall weighted mean on the responses was 2.73 with qualitative interpretation of “Often”. It was
found out that the teachers employed their best practices to counteract the challenges in Modular Distance Learning in terms of
the distribution and retrieval of modules. The schools have allotted funds for the procurement of COVID-related supplies that
are readily available during distribution of modules. Teachers made sure that all the IP learners are provided with printed SLMs.
According to Adriano (2020), various schools gear up for distance learning under the new normal, some motorcycle
riders have signified their intent to distribute learner’s modules for free. In a memorandum of agreement (MOA) signed
between the Department of Education Laoag City and the Motorcycle Philippines Federation 128 Inc., the Project Volunteer
Riders Organized for Optable Module (VROOM) Delivery was launched as both parties agreed that the modules developed by
teachers will be distributed for free by the riders to the village halls of Laoag and other municipalities. The village officials will
then give out the modules to the learner’s home. The learners will bring the modules to the barangay halls which will be carried
back by the riders to schools. The distribution and retrieval of learning modules will be made weekly.
1.3 Instructional Delivery
Table 3. Best Practices Employed in Instructional Delivery in Implementing Modular Distance Learning to IP Students
In terms of the best practices employed in instructional delivery in implementing modular distance learning to IP
students, it can be noted on Table 3 that the teacher-respondents “Always” employed the statement “2. A Weekly Home
Learning Plan is given to every learner”, with the highest weighted mean of 3.63. Additionally, the respondents “Often”
employed the statement “7. When explaining lessons to students, the dialect of the IPs is being used”, with the lowest weighted
mean of 2.67.
The computed overall weighted mean on the responses was 3.33 with qualitative interpretation of “Always”. It was
found out that the teachers employed their best practices to counteract the challenges in Modular Distance Learning in terms of
instructional delivery. The teachers make sure that students are well-informed of the competencies they need to learn and the
activities they need to answer through the provision of the Weekly Home Learning Plan. Monitoring of the students are also
being practiced and home visitations are being conducted by the teachers.
DepEd-CO features Lutucan integrated National High School on a Press Release titled “Deped Teaches Inetrates
Technical Assistance in Improving Delivery of Basic Education Services. In one of the sessions, OIC-Director Cawilan underscored
one of the best practices of Lutucan Integrated National High School (LINHS) in Sariaya, Quezon Province on managing learning
resources in time of the pandemic. In the Schools Division of Naga City, the best practices of teachers must include: (1) conduct
of house-to- house visitation for those learners with low performance; (2) parents and teachers must have collaborative efforts
in the implementation of Weekly Home Learning Plan in keeping track the student`s everyday activities; and (3) teachers must
give intervention strategies based on the Individual Monitoring Learning Plan which monitors the learner`s progress.
Instructional Delivery Weighted
Mean
Qualitative
Rating
Rank
1. Establish good and regular communication with
students.
3.36 Always 5
2. A Weekly Home Learning Plan is given to every
learner.
3.63 Always 1
3. Home visitations are being conducted to assist the
IP learners.
3.04 Often 6
4. Students’ progress is being monitored regularly per
subject area.
3.60 Always 2
5. Enrichment activities and other references are
given to learners to improve mastery of lessons.
3.48 Always 4
6. Proper guidance from parents, continuous
communication between the parents and teachers
3.53 Always 3
7. When explaining lessons to students, the dialect of
the IPs is being used.
2.67 Often 7
Overall Weighted Mean 3.33 Always

Best Practices in Implementing Modular Distance Learning to Indigenous People (IP) Students in Olongapo City
IJMRA, Volume 5 Issue 05 May 2022 www.ijmra.in Page 944
1.4 Assessment
Table 4. Best Practices Employed in Assessment in Implementing Modular Distance Learning to IP Students
Assessment Weighted
Mean
Qualitative
Rating
Rank
1. Summative tests are given in printed form. 3.83 Always 1
2. Results of summative tests are given to students
for feedbacks.
3.53 Always 4
3. Summative tests are given every week and are
aligned to the content standards of the MELCs.
3.38 Always 5.5
4. Rubrics are given in every performance task and
are explained to students.
3.63 Always 2
5. Parents and students are being informed of the
assessment process.
3.60 Always 3
6. LAC sessions are being conducted to improve test
construction skills of teachers.
3.38 Always 5.5
7. Focused Group Discussions are being conducted
for effective assessments of IP learners.
3.37 Always 7
Overall Weighted Mean 3.53 Always
In terms of the best practices employed in assessment in implementing modular distance learning to IP students, it can
be noted on Table 4 that the teacher-respondents “Always” practiced the statement “1. Summative tests are given in printed
form”, with the highest weighted mean of 3.83 and “7. Focused Group Discussions are being conducted for effective
assessments of IP learners”, with the lowest weighted mean of 3.37.
The computed overall weighted mean on the responses was 3.53 with qualitative interpretation of “Always”. It was
found out that the teachers employed their best practices to counteract the challenges in Modular Distance Learning in terms of
assessing the students’ learning. This is being done through the construction of summative tests that are suited to assess each
weeks’ learning of the students.
In the study conducted by Galang, Conde & Sudarsana (2021), it was identified that teachers assess the students by
utilizing modules and other activities as alternatives of face-to-face instruction and assessment, using rubrics and providing
feedbacks, utilizing online platforms, and involving parents.
1.5 Summary
Table 5. Summary on the Best Practices Employed by the Respondents in Implementing Modular Distance Learning to IP
Students
Best Practices Employed in the
Implementation of MDL
Overall Weighted
Mean
Qualitative Rating Rank
Module Development 2.74 Often 3
Distribution and Retrieval of Modules 2.73 Often 4
Instructional Delivery 3.33 Always 2
Assessment 3.53 Always 1
Grand Mean 3.08 Often
Table 5 shows the summary on the best practices employed by the teacher-respondents in implementing modular
distance learning to IP students. It can be noted that the teacher-respondents “Always” employed best practices in
“Assessment”, with the highest overall weighted mean of 3.53, followed by “Instructional Delivery”, with an overall weighted
mean of 3.33. Additionally, the teacher-respondents “Often” employed best practices in “Module Development”, with an overall
weighted mean of 2.74, and “Distribution and Retrieval of Modules”, with the lowest computed overall weighted mean of 2.73.
The computed grand mean of responses was 3.08, with a qualitative interpretation of “Often”. The results manifested
that the teachers employed their best practices to counteract the challenges in Modular Distance Learning to IP students.

Best Practices in Implementing Modular Distance Learning to Indigenous People (IP) Students in Olongapo City
IJMRA, Volume 5 Issue 05 May 2022 www.ijmra.in Page 945
2. Analysis of Variance on the Difference in the Best Practices Employed by the Respondents in Implementing Modular
Distance Learning to IP Students when Respondents are Grouped According to the Demographic Profile Variables
2.1 Module Development
Table 6. Difference in the Best Practices Employed in Module Development in Implementing Modular Distance Learning
to IP Students when Respondents are Grouped According to the Demographic Profile Variables
Table 6 shows the Analysis of Variance to test the difference in the best practices employed in module development in
implementing modular distance learning to IP Students when respondents are grouped according to demographic profile
variables of age, sex, teaching position and highest educational attainment respectively.
The computed P-values for sex (0.937) and teaching position (0.560) were greater (>) than 0.05 Alpha Level of
Significance, hence the Null Hypothesis is accepted. Therefore, there is no significant difference on the best practices employed
in module development in implementing modular distance learning to IP Students when respondents are grouped according to
sex and teaching position. On the other hand, the P-values for age (0.017) and highest educational attainment (0.000) were
lower than (<) 0.05 Alpha Level of Significance, therefore the Null Hypothesis is rejected and that there is a significant difference
when respondents are grouped according to age, and highest educational attainment.
The result implies that the best practices employed in module development by the teacher-respondents diverges in
terms of the age and highest educational attainment of the respondents. Furthermore, there is no statistically detected
difference in the best practices employed by the male and female respondents and their teaching positions.
According to the study of Chan, Marasigan &Santander (2021), quality assured modules and stronger financial support
would aid better modular remote teaching delivery in modular distance learning during the COVID-19 pandemic. Thus, the
improvement of quality-controlled modules and worksheets was recommended.
2.2 Distribution and Retrieval of Modules
Table 7 shows the Analysis of Variance to test the difference in the best practices employed in the distribution and
retrieval of modules in implementing modular distance learning to IP Students when respondents are grouped according to
demographic profile variables of age, sex, teaching position and highest educational attainment respectively.
The computed P-value for sex (0.499) was greater (>) than 0.05 Alpha Level of Significance, hence the Null Hypothesis is
accepted. Therefore, there is no significant difference on the best practices employed in distribution and retrieval of modules in
implementing modular distance learning to IP Students when respondents are grouped according to sex. On the other hand, the
P-values of age (0.000), teaching position (0.000) and highest educational attainment (0.000) were lower than (<) 0.05 Alpha
Level of Significance, therefore the Null Hypothesis is rejected and that there is a significant difference when respondents are
grouped according to age, teaching position, and highest educational attainment.
The result signifies that the best practices employed in the distribution and retrieval of modules by the teacher-
respondents varies in terms of the age, teaching positions, and highest educational attainment of the respondents.
Furthermore, there is no statistically detected difference in the best practices employed by the male and female respondents.
Profile
Variables Source of Variation
Sum of
Squares df
Mean
Square F Sig. Interpretation
Between Groups 5.186 4 1.296 3.088 0.017 Ho is rejected
Age Within Groups 98.658 235 0.42 Significant
Total 103.843 239
Between Groups 0.003 1 0.003 0.006 0.937 Do not reject Ho
Sex Within Groups 103.840 238 0.436 Not Significant
Total 103.843 239
Teaching Between Groups 0.9 3 0.3 0.688 0.560 Do not reject Ho
Position Within Groups 102.943 236 0.436 Not Significant
Total 103.843 239
Highest
Educational Between Groups 42.272 3 14.091 54.009 0.000 Ho is rejected
Attainment Within Groups 61.571 236 0.261 Significant
Total 103.843 239

Best Practices in Implementing Modular Distance Learning to Indigenous People (IP) Students in Olongapo City
IJMRA, Volume 5 Issue 05 May 2022 www.ijmra.in Page 946
To ensure the safety of both teachers and students in the distribution and retrieval of modules, the Department of
Education (DepEd) said its regional offices (ROs) and school division offices (SDOs), schools should conduct of disinfection of
learning materials prior packaging and distribution and forge stronger partnerships with barangay councils that will help in
facilitating the distribution and retrieval of modules to their respective barangays (Malipot, 2020).
Table 7. Difference in the Best Practices Employed in Distribution and Retrieval of Modules in Implementing Modular Distance
Learning to IP Students when Respondents are Grouped According to the Demographic Profile Variables
Profile
Variables
Source of
Variation
Sum of
Squares df
Mean
Square F Sig. Interpretation
Between Groups 18.961 4 4.74 27.234 0.000 Ho is rejected
Age Within Groups 40.904 235 0.174 Significant
Total 59.865 239
Between Groups 0.115 1 0.115 0.459 0.499 Do not reject Ho
Sex Within Groups 59.75 238 0.251 Not Significant
Total 59.865 239
Teaching Between Groups 19.819 3 6.606 38.931 0.000 Ho is rejected
Position Within Groups 40.046 236 0.17 Significant
Total 59.865 239
Highest
Educational Between Groups 17.492 3 5.831 32.475 0.000 Ho is rejected
Attainment Within Groups 42.373 236 0.18 Significant
Total 59.865 239
2.3 Instructional Delivery
Table 8 shows the Analysis of Variance to test the difference in the best practices employed in instructional delivery in
implementing modular distance learning to IP Students when respondents are grouped according to demographic profile
variables of age, sex, teaching position and highest educational attainment respectively.
The computed P-values for age (0.087), sex (0.871) and highest educational attainment (0.229) were greater (>) than
0.05 Alpha Level of Significance, hence the Null Hypothes is accepted. Therefore, there is no significant difference on the best
practices employed in in instructional delivery in implementing modular distance learning to IP Students when respondents are
grouped according to age, teaching position and highest educational attainment. On the other hand, the P-value for teaching
position (0.000) was lower than (<) 0.05 Alpha Level of Significance, therefore the Null Hypothesis is rejected and that there is a
significant difference when respondents are grouped according to sex.
Table 8. Difference in the Best Practices Employed in Instructional Delivery in Implementing Modular Distance Learning to IP
Students when Respondents are Grouped According to the Demographic Profile Variables
Profile Variables Source of Variation Sum of
Squares df
Mean
Square F Sig. Interpretation
Between Groups 1.818 4 0.455 2.056 0.087 Do not reject Ho
Age Within Groups 51.952 235 0.221 Not Significant
Total 53.770 239
Between Groups 0.006 1 0.006 0.026 0.871 Do not reject Ho
Sex Within Groups 53.764 238 0.226 Not Significant
Total 53.770 239
Teaching Between Groups 15.762 3 5.254 32.623 0.000 Ho is rejected
Position Within Groups 38.008 236 0.161 Significant
Total 53.770 239
Highest Educational Between Groups 0.973 3 0.324 1.449 0.229 Do not reject Ho
Attainment Within Groups 52.797 236 0.224 Not Significant
Total 53.77 239

Best Practices in Implementing Modular Distance Learning to Indigenous People (IP) Students in Olongapo City
IJMRA, Volume 5 Issue 05 May 2022 www.ijmra.in Page 947
The result implies that the best practices employed in the instructional delivery of the teacher-respondents differs in
terms of teaching positions only. Furthermore, there is no statistically detected difference in the best practices employed by the
male and female respondents and their age, as well as their highest educational attainment.
Parents use the learning guide and supervise their child’s interaction with the materials and communication with the
teacher can be done. For the other students they accomplish the module activities and connect with the teacher for feedback
through text, messenger, or any form of communication (Codamon, 2020).
2.4 Assessment
Table 9. Difference in the Best Practices Employed in Assessment in Implementing Modular Distance Learning to IP Students
when Respondents are Grouped According to the Demographic Profile Variables
Profile
Variables Source of Variation
Sum of
Squares df
Mean
Square F Sig. Interpretation
Between Groups 5.484 4 1.371 11.911 0.000 Ho is rejected
Age Within Groups 27.049 235 0.115 Significant
Total 32.533 239
Between Groups 0.027 1 0.027 0.197 0.658 Do not reject Ho
Sex Within Groups 32.506 238 0.137 Not Significant
Total 32.533 239
Teaching Between Groups 6.773 3 2.258 20.685 0.000 Ho is rejected
Position Within Groups 25.76 236 0.109 Significant
Total 32.533 239
Highest
Educational Between Groups 7.711 3 2.57 24.438 0.000 Ho is rejected
Attainment Within Groups 24.822 236 0.105 Significant
Total 32.533 239
Table 9 shows the Analysis of Variance to test the difference in the best practices employed in assessment in
implementing modular distance learning to IP Students when respondents are grouped according to demographic profile
variables of age, sex, teaching position and highest educational attainment respectively.
The computed P-value for sex (0.658) was greater (>) than 0.05 Alpha Level of Significance, hence the Null Hypothesis is
accepted. Therefore, there is no significant difference on the best practices employed in assessment in implementing modular
distance learning to IP Students when respondents are grouped according to sex. On the other hand, the P-values for age
(0.000), teaching position (0.000) and highest educational attainment (0.000) were lower than (<) 0.05 Alpha Level of
Significance, therefore the Null Hypothesis is rejected and that there is a significant difference when respondents are grouped
according to age, teaching position, and highest educational attainment.
The result indicates that the best practices employed in the assessment by the teacher-respondents varies in terms of
all the profile variables of the respondents. Their practices differ in terms of their age, sex, teaching positions and highest
educational attainment.
The Department of Education emphasized that assessment should be holistic and authentic in capturing the attainment
of the most essential learning competencies and is integral for understanding student learning and development. Assessment
and grading should have a positive impact on learning (Montemayor, 2020).
V. CONCLUSIONS
Based on the results of the study, the researcher concluded that the majority of the teacher-respondent are female in their
adulthood stage with a teaching position of Teacher I and the highest educational attainment of having units in master’s degree.
The teacher-respondents always employed best practices in implementing modular distance learning to Indigenous People (IP)
students in terms of assessment. There was significant difference in the best practices employed in terms of module
development in implementing module distance learning to IP students when respondents grouped according to age and higher
education attainment. There was significant difference in the best practices employed in terms of distribution and retrieval and
assessment when grouped according to age, teaching position and highest educational attainment; in terms of the instructional

Best Practices in Implementing Modular Distance Learning to Indigenous People (IP) Students in Olongapo City
IJMRA, Volume 5 Issue 05 May 2022 www.ijmra.in Page 948
delivery when grouped according to teaching position. Teachers should sustain best practices on the implementation of modular
distance learning to IP Learners and conduct benchmarking to further improve other practices.
REFERENCES
1) Abante, A. etc. (2021). A Comparative Analysis on the Challenges of Online Learning Modality and Modular Learning
Modality: A Basis for Training Program. International Journal of Multidisciplinary Research and Analysis. Retrieved from
https://ijmra.in/v4i4/Doc/17.pdf
2) Adriano, L (2020). Riders volunteer to distribute modules for learners. Retrieved from
https://www.pna.gov.ph/articles/1112611
3) Bayod, R. (2020). Fears and hopes of indigenous students in Southern Mindanao during the Covid-19 Pandemic.
Retrieved from https://www.researchgate.net/publication/343858274_Fears_and_Hopes_of_Indigenous_Students
4) Bhandari, P. (2020). An introduction to quantitative research. Retrieved from
https://www.scribbr.com/methodology/quantitative-research
5) Chan, J., Marasiga, A. and Santander, N. (2021), Multigrade teachers’ experiences and learning assessments on modular
remote teaching during the COVID-19 pandemic. Retrieved from https://www.researchgate.net/profile/Joefrey-
Chan/publication/350848604_Multigrade_teachers'_experiences_and_learning_assessments_on_modular_remote_te
aching_during_the_COVID-19_pandemic/links/6077a602881fa114b402b47c/Multigrade-teachers-experiences-and-
learning-assessments-on-modular-remote-teaching-during-the-COVID-19-pandemic.pdf
6) Codamon, D. (2020). Understanding the Distance Learning Delivery modalities. Retrieved from
https://pia.gov.ph/news/articles/1049277
7) Daniel, S. (2020). Education and the COVID-19 pandemic. Prospects (2020). Retrieved from
https://doi.org/10.1007/s11125-020-09464-3
8) Department of Education (2020). DepEd Teaches integrates technical assistance in improving delivery of basic
education services. Retrieved from https://www.deped.gov.ph/2020/12/23/deped-teaches-integrates-technical-
assistance-in-improving-delivery-of-basic-education-services/
9) De Villa, J., Manalo, F., Secondary Teachers’ Preparation, Challenges, and Coping Mechanism in the Pre –
Implementation of Distance Learning in the New Normal, IOER International Multidisciplinary Research Journal, VOL. 2,
NO. 3 pp.144 – 154
10) Galang, A., Conde, R. and Sudarsana, K. (2021). MGA Kwento NG Guro At Kwentong Mag-Aaral: Student Assessment
Processes, Challenges And Solutions In The New Normal Setup Leading To Quality Assurance Inputs. Retrieved from
http://www.ejournal.ihdn.ac.id/index.php/JPM/article/view/2351
11) Magsambol, B (2021). DepEd needs P33 billion to provide laptops for all teachers. Retrieved from
https://www.rappler.com/nation/deped-needs-billions-provide-teachers-laptops
12) McCombes, S. (2020). Descriptive Research Design, Definition, Methods and Examples. Retrieved from
https://www.scribbr.com/methodology/descriptive-research/
13) Malipot, M. (2020). Teachers’ participation in module-writing for blended learning ‘crucial’ – DepEd. Retrieved from
https://mb.com.ph/2020/07/11/teachers-participation-in-module-writing-for-blended-learning-crucial-deped/
14) Montemayor, T. (2020). DepEd releases assessment, grading guidelines. Retrieved from
https://www.pna.gov.ph/articles/1117471
There is an Open Access article, distributed under the term of the Creative Commons
Attribution – Non Commercial 4.0 International (CC BY-NC 4.0)
(https://creativecommons.org/licenses/by-nc/4.0/), which permits remixing, adapting and
building upon the work for non-commercial use, provided the original work is properly cited.

INTERNATIONAL JOURNAL OF MULTIDISCIPLINARY RESEARCH AND ANALYSIS
ISSN(print): 2643-9840, ISSN(online): 2643-9875
Volume 05 Issue 05 May 2022
DOI: 10.47191/ijmra/v5-i5-10, Impact Factor: 6.261
Page No. 949-955
IJMRA, Volume 5 Issue 05 May 2022 www.ijmra.in Page 949
Validation of modified Children’s Health Survey for Asthma (CHSA)
Questionnaire for the Sri Lankan setting
Samarasinghe AIP1, Arnold SM 2, Fonseka Pushpa3
1,2 Ministry of Health, Sri Lanka
3Sri Jayawardena University, Sri Lanka
ABSTRACT: Asthma is one of the most common chronic diseases in the childhood in developing and developed countries. Health
related quality of life has become essential part of health outcome measurement in chronic disorders. The present study was
conducted to assess the validity and reliability of western developed scale for use in Sri Lankan children and their care givers. This
study was a hospital based cross sectional study for validation of the western developed CHSA questionnaire. Study population
was 100 children who was diagnosed as having asthma. Factor analysis of the data in the present study identified seven relevant
factors. Two separate factors each were extracted for physical health (child) domain and emotional health (family) domain. Two
separate factors each were extracted for physical health (child) domain and emotional health (family) domain. Cronbach alpha of
above 0.7 for all domains indicate the internal consistency of the measure.
It was found that CHSA is a valid and reliable measure to assess the impact of the disease among children with Asthma and their
care givers.
KEYWORDS: Childhood asthma, CHSA, Factor analysis
1. INTRODUCTION
Abramson and Abramson1 stated that when a researcher considers the use of a study instrument that others have developed and
validated, they should satisfy its validity in the present study population. If the researcher is certain that the study populations
and circumstances are so similar, then the previous validation would be sufficient. When a questionnaire has to be translated from
one language to another and understood by a specific population it is essential to check the validity.
The best and most obvious way of assessing the validity is comparing the findings with a gold standard or a criterion that is known
or believed to be close to the truth.1 The CHSA is an instrument which is used to assess the quality of life of asthma patients and
their parents/ caregivers. Quality of life assessment is essentially a subjective measure and there is no gold standard to compare
with.2 Therefore, criterion validity which is thought to be the best cannot be proven for this measure. In the absence of a standard
method, triangulation is the commonly used method to appraise validity in research tools. It is an approach where the evidence
is sought by using different methods.1,3
2. METHODS
Assessment of judgmental validity
Judgmental validity is mainly based on judgement alone and it assesses whether the conceptual definition of the variable has been
measured by the operational definition. It includes face validity, content validity and consensual validity. This was done by a panel
of experts in the field of paediatrics, psychology, sociology and community medicine. This panel included senior registrars in
paediatrics (n=2), psychologists (n=2) attached to the Psychiatry Unit of the National Hospital of Sri Lanka (NHSL), a sociologist
(n=1) of the University of Colombo, a Community Physician attached to the National Institute of Health Sciences, Kalutara (n=1)
and the Principal Investigator (PI).
Selection of the study instrument
After a thorough literature search by the Principal Investigator (PI), the following questionnaires were identified for the
assessment of impact of asthma among children and their families.

Validation of modified Children’s Health Survey for Asthma (CHSA) Questionnaire for the Sri Lankan setting
IJMRA, Volume 5 Issue 05 May 2022 www.ijmra.in Page 950
1. Children’s Health Survey for Asthma (CHSA) Questionnaire4
2. Paediatric asthma quality of life questionnaire5
3. Questionnaire to measure perceived symptoms and disability in asthma6
4. A Life Activities questionnaire for childhood asthma
5. Paediatric Asthma Quality of life Questionnaire
The content of each item of the questionnaires were looked for its relevance and acceptability in terms of local cultural context in
which it was to be used, by a panel of experts. They also critically reviewed each question in the questionnaires for
comprehensiveness of the questions and appropriateness of the measures. Among the above questionnaires the Children’s Health
Survey for Asthma questionnaire was selected by the panel because it assesses the health related quality of life in both the children
and their family among 5-11 years children.
CHSA questionnaire
The CHSA is a disease specific, interviewer-administered questionnaire designed for the parents or the caregivers of the children.
This instrument had been developed by the American Academy of Paediatrics in 1992. To develop the clinical aspect of the CHSA,
a group of experts including pediatricians and specialists in asthma, allergy, immunology and pulmonology provided inputs.
Contributions from the parents of asthma patients were also included. Its original is in English.
The questionnaire was pre-tested with the parents of asthmatic children for readability, comprehension and recall. This
instrument includes assessment of five domains of child and family, namely; physical health (child), emotional health (child),
activity (child), emotional health (family) and activity (family). The questionnaire has 48 items.
Table 1: Domains and the items in CHSA
Category Domain Item
Child Physical health 15 items
Activity 5 items
Emotional health 5 items
Family Activity 6 items
Emotional health 17 items
In addition, it includes questions on health care utilization, asthma triggers and family demographics. Each item has a 5-point
Likert type scale with a higher score indicating better of more positive outcome. This measure had undergone a series of
psychometric tests for validation in a variety of settings in the United States (4). Validity of the CHSA has not been done in Sri
Lanka.
After selecting of the CHSA, few changes were made. These changes included changing of the wordings of the few items. e.g.
participating in the gymnastic classes was changed to participating in the physical training sessions at school.
Translation of the CHSA questionnaire to Sinhala language
Translating an instrument that was developed in one language with a particular cultural background to another language with a
different cultural background will pose some difficulties. The CHSA which was used as the instrument for the present study was
initially developed in the western world. Therefore, it needs to be translated into Sinhale language. Hereafter, the original English
questionnaire and the translated Sinhalese questionnaire will be referred to as E-CHSA and S-CHSA respectively. The following
validity problems were considered during the translation and adaptation of the questionnaire into Sinhala.7,8,9
1. Content equivalence: The contents of the instrument (items of the questionnaire) describe a phenomenon relevant to both
cultures. The items of the E-CHSA which measures the health related quality of life and developed in the western world should be
culturally relevant to Sri Lanka.
2. Semantic Equivalence: It concerns with the retaining of the meaning of each item. The words used in the original and the
translated versions should have the same meaning.
3. Technical equivalence: Similar effects to be achieved by the measuring technique in both cultures. It is mainly referred to both
the technical features of the languages and their relationships in a socio cultural context. Sometimes, cultural and geographical
differences are likely to lead to important differences between both cultures. e.g. In E-CHSA social plans and sports
4. Criterion equivalence: It measures whether the responses to similar items relate to the same normative concept in the two
cultures.

Validation of modified Children’s Health Survey for Asthma (CHSA) Questionnaire for the Sri Lankan setting
IJMRA, Volume 5 Issue 05 May 2022 www.ijmra.in Page 951
5. Conceptual Equivalence: It means that responses to an interview or question should relate to theoretical construct within that
culture. Therefore, it needs to obtain an identical meaning of concepts which may have different cultural understandings. Most
authors had emphasized the need of achieving the conceptual equivalence between measures, that is, comparability not only in
what is said through translation procedures but in what is understood by the respondent. This can be achieved by careful attention
to the cultural values and norms of relevant societies.
Participants for translation: When translating an instrument into another language, the translator should have a good technical
knowledge of both the source and the target languages and full emotional understanding of the source and target languages. In
addition, he should be deeply involved in the culture where the questionnaire is going to be applied to know about the cultural
problems related to the concepts and terms used in the questionnaire (e.g. to avoid the use of stigmatizing concepts) and to have
intergraded knowledge of the area and domains explored in the questionnaire.7
By considering all the above facts, it was decided to translate this questionnaire into Sinhala by a group of persons who were
fluent in both English and Sinhala languages. In addition, some questions included in the E-CHSA questionnaire that were related
to clinical aspect. Hence, it was decided to take persons with a medical background for this task in this study. This group consisted
of a Medical officer, Out Patient Department (OPD) of Lady Ridgeway Hospital (LRH) for Children, a Medical Officer, Central Chest
Clinic at Colombo and the PI. During the process of translation semantic, technical, criterion and conceptual equivalences were
established. Developing consensus among the panel members during translation helped to modify and eliminate ambiguous items.
After establishing the semantic, technical, criterion and conceptual equivalences between the E-CHSA and S-CHSA, the
questionnaire was pre-tested. This was done for both clarity and acceptance among twenty mothers who came for treatment
from the OPD, and Asthma Emergency Treatment Unit at LRH. The translated and pre-tested instrument was then used for the
validation study.
Assessment of construct validity
The assessment of construct validity of a questionnaire is essential in a psychometric measure. Construct validity is defined as the
extent to which an instrument measure a theoretical construct.
Construct validity of the questionnaire was appraised using two methods.
1. Confirmatory factor analysis
2. Assessing the discrimination between groups
Confirmatory factor analysis
This is a technique of psychometric validation that examines the correlation between variables in a large set of data to see if a
small number of variables or factors can explain the variation in the original set of variables. For this study, factor analysis was
performed to identify independent dimensions of impact of asthma on the child and the family and to identify homogenous items
suitable for measuring each dimension. If CHSA is a valid measure, the dimensions (physical health, social health and day-to-day
activities of the child and the social health and day-to-day activities of the mother or the caregiver) within it should emerge from
a factor analysis of the data of the population that is being validated for. Items relating to a particular dimension should be grouped
together within a single factor.10 The method used to perform the factor analysis was the principal component analysis. The
appropriateness of the factor analysis was assessed by using test of Kaiser-Meyer-Olkin measure of sampling adequacy and
Bartlett’s test of sphericity. The selection of the appropriate factors was based on the variance explained by each factor, the eigen
value for each factor and examination of the scree plot. The methods used to extract factors include principal component analysis
with varimax rotation using Kaiser normalization. For a rotated factor to be interpretable, each factor should have two or more
loadings above 0.3 and each item should have at least one factor loading above 0.3. 3,11,12
The discrimination between groups
The results of the validation study confirm the hypothesis concerning the expected distribution of the impact within the group
(mild, moderate, and severe cases of asthma) that was examined by the measure being validated (1,10). It was hypothesized that
mean scale scores for all five domains should be highest for the mild and lowest for the severe. The categorization of children into
mild, moderate and severe was based on the classification given by the authors. Symptom activities were classified as number of
days the child experienced wheezing or tightness of the chest in the last two weeks. It was defined as follows: mild = 0-2 days,
moderate = 3-10 days, severe = 11 or more days.4
Assessment of reliability – internal consistency
The reliability of an instrument is a major criterion for assessing its scientific acceptability. In a composite scale, reliability can be
measured by appraising the internal consistency. It assesses the degree with which an instrument measures the attributes it is
supposed to measure. This is measured by the extent to which items within the domain correlate with each other.

Validation of modified Children’s Health Survey for Asthma (CHSA) Questionnaire for the Sri Lankan setting
IJMRA, Volume 5 Issue 05 May 2022 www.ijmra.in Page 952
Therefore, the domains which assess the physical health, social health and activities of the child and the physical health and
activities of the family should be internally consistent if the responses to items that contribute to the same domain correlate well
with each other (1,10).Internal consistency was assessed using Crohnbach’s alpha for each scale overall, item total correlation and
alpha if an item was deleted for individual scale items.
Crohnbach’s Alpha
The calculation of Crohnbach’s alpha is based on the number of items and the average inter-item correlation i.e. more
homogenous the domain, the higher the internal consistency. A high correlation between different items in a domain will indicate
that they are measuring the same thing and there is less chance for random error.A low correlation indicates that there is lot of
error and items are not measuring the same items. For scales which are used as research tools, alpha may be less than in the
clinical situations. Alpha values of 0.7 to 0.8 are regarded as satisfactory. 12,13
Item total correlation
It gives the relationship between the responses on individual questions and the overall total score on the questionnaire. A reliable
question should have a positive relationship with the overall total, ideally being above 0.3. An item displaying weak or a negative
relationship to the total indicates that item may be poor in reliability and thus affect the findings of the whole scale. The effect of
the individual item on overall reliability of the questionnaire can be assessed by the relationship between the corrected total
correlation and the alpha if item is deleted.12
Validation study
S-CHSA validation was done at the Asthma Emergency Unit at OPD/ LRH, in a follow up clinic at LRH, and all the medical wards at
LRH. The study subjects were identified according to the place of residence. Those who resided in areas other than the CMC area
were selected. Selecting the study subjects from above places ensured coverage of a broad spectrum of clinical presentations of
childhood asthma and different social groups they come from.
The subjects for this study were the children aged 5-11 years diagnosed by a paediatrician as having asthma or wheezing. The
respondents were the mothers or the principal caregivers of the above children.
Exclusion Criteria were;
1. The children with other diseases in addition to asthma
2. The children who come to the Emergency Treatment Unit for asthma at OPD/ LRH without a diagnosis of asthma or wheezing
by a paediatrician
There are no power tables available to assess the sample size calculation. Sample size calculation for the factor analysis is
controversial. Some consider that a minimum of 2:1 participants to a variable will give stable reliability and validity estimates while
others argue that a minimum sample size of 100 subjects is sufficient.11 The S-CHSA in the present study has 48 items. If 1:2 ratio
is considered, the sample size for 48 items is 96. Considering all above factors, it was decided to take 100 subjects for the present
study.
A consecutive sample of children aged 5-11 years with asthma or wheezing who came for treatment from Emergency Treatment
Unit of Asthma, at LRH, asthma follow up clinics of the LRH or admitted to wards at LRH were selected until the sample size was
achieved.
Data collection instrument was the modified and validated S-CHSA. Respondents were the mothers or the caregivers of the
selected children diagnosed as having asthma or wheezing. The principal investigator (PI) administered the questionnaires to the
respondents.
3. RESULTS
Confirmatory Factor Analysis
Anti-image correlation matrices shows that sampling adequacy for all 48 items were well above the accepted level of 0.5. The
Kaiser-Meyer-Olkin measure of sampling adequacy (KMO) is 0.649. For a satisfactory factor analysis, the KMO value should be
greater than 0.5.
The Bartlett’s test of sphericity is significant at 0.000. If the p value is less than 0.05, it indicates that there is sufficient power to
continue with the factor analysis. Therefore, the above criteria confirmed the factorability of data12. After the principal component
analysis, 12 factors met the eigen value greater than one criterion.

Validation of modified Children’s Health Survey for Asthma (CHSA) Questionnaire for the Sri Lankan setting
IJMRA, Volume 5 Issue 05 May 2022 www.ijmra.in Page 953
Scree plot revealed that scree test breaks at 4 and 7 factors. Four and seven factors were rotated using varimax rotation with
Kaiser Normalization and seven factor was the most interpretable. The eigen values among these factors were ranging from 9.87
to 1.96.
Discrimination between groups
The discrimination between groups were tested among all five domains of the CHSA with low, moderate and high sub groups of
asthma children in the study. The different studies had used different criteria to categorize the severity of the asthma symptoms.
The authors of the original study had used the number of days child experienced wheezing or tightness in the chest as to create
the symptom activity variable. The categories of symptom activity were defined as Low=0-2 days, Moderate= 3-10days and the
High=11 days or more.
Similar classification was adapted for the present study. CHSA scale scores were assembled using likert method for summed ratings
and the raw scores were linearly transformed into 0-100 scale. Higher scores indicate more positive outcome or better health.
The mean scores of the physical health (child), emotional health (child) and Activity (Child) domains among the subgroups were
tested for significance by using the Analysis of variance (ANOVA) and it was significant at p=0.001 level.
The mean scores of the emotional health (Family) and Activity (Family) domains among the subgroups were tested for significance
by using the Analysis of variance (ANOVA) and it was significant at p=0.001 level.
Cronbach’s Alpha
Each domain has a Cronbach’s Alpha ranging from 0.76 to 0.84.
Table 2 : Cronbach’s Alpha for each domain of S-CHSA
Domains Physical
Health (child)
emotional
health(child),
Activity
(child
Emotional
Health
(Family)
Activity
(Family)
Cronbach’s
Alpha
0.76 0.77 0.84 0.83 0.75
Total Item Correlation
A reliable question should have a positive relationship with the overall total correlation of above.3. All the items of the
questionnaire were meet this criteria.
4. DISCUSSION
The criteria used for recruitment of asthma children into the validation study was purely based on clinical diagnosis, were adequate
for the purpose of carrying out this study. The majority of the children recruited were categorized as mild to moderate asthma
(94%), is a reflection of the role of severity of disease as the determinant for seeking health care. Because of the early relief of the
often-distressing symptoms of asthma more mild& moderate types are likely to come before they get severe attacks. This
discrepancy may however, be unlikely to affect the validity of the results.
Health related quality of life has become essential part of health outcome measurement in chronic disorders. In addition to the
sequalae of chronic disease itself on the child, it has some impact on the family as well. Therefore, goal of prevention and
treatment of chronic illness in children is to diminish the impact of the illness and prevent dysfunction.
To asses the impact of the disease several questionnaires are available in the literature. They are the Pediatric Asthma
quality of life Questionnaire and Pediatric Asthma Care Givers Quality of life Questionnaire5, Questionnaire to measure perceived
symptoms and disability in asthma6 Children’s Health of Survey for Asthma (CHSA)Questionnaire4 etc. After appraising the
judgmental validity by the six experts, the CHSA was selected as the study instrument for the present study. Once a study
instrument is used in different setting, other than where it was developed, the researcher if using this instrument should be
satisfied of its validity in the selected setting1. Therefore, the present study was conducted to assess the validity and reliability of
western developed scale for use in Sri Lankan children and their care givers. When in a situation where there are no standard
validation methods available, the use of several methods, however imperfect each may be, provides the most accurate assessment
of the instrument properties. This method is known as Triangulation3.For the present study above method of Triangulation was
used to validate the questionnaire.

Validation of modified Children’s Health Survey for Asthma (CHSA) Questionnaire for the Sri Lankan setting
IJMRA, Volume 5 Issue 05 May 2022 www.ijmra.in Page 954
When validating a questionnaire first criterion which was looked for was the judgmental validity and it assesses that
the survey instrument makes sense and reflects appropriately the domains under investigation. This was assessed by a panel of
experts and it was found to be satisfactory.
This questionnaire is based on multidimensional conceptualization of health. The statistical approach of factor
analysis was adopted to test whether the original conceptualized domains fitted into the data, which were collected during
present study.
The precise correspondence between the factors and the domains are rare in factor analysis14. Factor analysis of the
data in the present study identified seven relevant factors. Two separate factors each were extracted for physical health (child)
domain and emotional health (family) domain. . Factor analysis of the data in the present study identified seven relevant factors.
Two separate factors each were extracted for physical health (child) domain and emotional health (family) domain. Similar findings
were seen in other studies. WHO study group15 reported that the factor analysis among the WHO quality of life questionnaire
confirmed the comparative fit of a four domain model and six domain model of assessment of quality of life. Wijeyasinghe et al 16
in their study found though the original version of the questionnaire had eleven domains they had only seven domains extracted.
In the original study the mean scale scores for children whose recent symptom activity was rated as
low were consistently better and significantly higher (for all but the activity (child) domain) than for those designated as moderate
to high4. But the present study showed significantly higher scores for the low symptom activity than the moderate and high
symptom activity for all domains.
Internal consistency reliability for CHSA-S were above 0.7 for all domains. The high degree of internal
consistency confirmed its reliability. This is compatible with the original validation study of the questionnaire4.
CONCLUSION
The translated Sinhalese version of the western developed questionnaire is a reliable instrument for measuring the impact of
Childhood Asthma in children and the family.
REFERENCE
1) Abramson JH, Abramson ZH. Survey Methods in Community Medicine, Edinburgh: Churchill Livingstone, 1999: 185-91
2) Arunkumar G, Wyllie E, Kotagal P, Ong HT, Gilliam F. Parent‐and patient‐validated content for pediatric epilepsy quality‐
of‐life assessment. Epilepsia. 2000 Nov;41(11):1474-84.
3) Etter JF, Perneger TV. Validating a satisfaction questionnaire using multiple approaches: a case study. Social science &
medicine. 1997 Sep 1;45(6):879-85.
4) Asmussen L, Olson LM, Grant EN, Fagan J, Weiss KB. Reliability and validity of the Children's Health Survey for Asthma.
Pediatrics. 1999 Dec 1;104(6):e71-.
5) Reichenberg K, Broberg AG. Quality of life in childhood asthma: use of the Paediatric Asthma Quality of Life Questionnaire
in a Swedish sample of children 7 to 9 years old. Acta paediatrica. 2000 Aug;89(8):989-95.
6) Usherwood TP, Scrimgeour A, Barber JH. Questionnaire to measure perceived symptoms and disability in asthma.
Archives of Disease in Childhood. 1990 Jul 1;65(7):779-81.
7) Knudsen HC, Vázquez-Barquero JL, Welcher B, Gaite L, Becker T, Chisholm D, Ruggeri M, Schene AH, Thornicroft G.
Translation and cross-cultural adaptation of outcome measurements for schizophrenia: EPSILON Study 2. The British
Journal of Psychiatry. 2000 Jul;177(S39):s8-14.
8) Sumathipala A, De Silva N, Siribaddana SH, Abeysingha MR, Fernando DJ. Cross-cultural adaptation and preliminary
validation of a zygosity determination questionnaire for twins in Sri Lanka. Twin Research and Human Genetics. 2000
Aug;3(4):205-12.
9) Sumathipala A, Murray J. New approach to translating instruments for cross‐cultural research: a combined qualitative
and quantitative approach for translation and consensus generation. International journal of methods in Psychiatric
Research. 2000 Jun;9(2):87-95.
10) McDowell I. Measuring health: a guide to rating scales and questionnaires. Oxford University Press, USA; 1996.
11) Tabachnick BG, Fidell LS. Principal components and factor analysis. Using multivariate statistics. 2001;4(1):582-633.
12) Perry Hinton D, Hinton PR, McMurray I, Brownlow C. SPSS explained. Routledge; 2004.
13) Bland JM, Altman DG. Statistics notes: Cronbach's alpha. Bmj. 1997 Feb 22;314(7080):572.
14) Garratt AM, Ruta DA, Abdalla MI, Buckingham JK, Russell IT. The SF36 health survey questionnaire: an outcome measure
suitable for routine use within the NHS?. British Medical Journal. 1993 May 29;306(6890):1440-4.

Validation of modified Children’s Health Survey for Asthma (CHSA) Questionnaire for the Sri Lankan setting
IJMRA, Volume 5 Issue 05 May 2022 www.ijmra.in Page 955
15) World Health Organization, World Health Organization. Quality of Life Assessment (WHOQOL): Development and general
psychometric properties. Soc Sci Med. 1998 Jun;46(12):1569-85.
16) Wijesinghe PR, Seneviratne RD, Jayakody RL. Development and validation of a scale to measure the perceived access to
medical care. Journal of the College of Community Physicians of Sri Lanka. 2005 Dec 29;10(1).
There is an Open Access article, distributed under the term of the Creative Commons
Attribution – Non Commercial 4.0 International (CC BY-NC 4.0)
(https://creativecommons.org/licenses/by-nc/4.0/), which permits remixing, adapting and
building upon the work for non-commercial use, provided the original work is properly cited.

INTERNATIONAL JOURNAL OF MULTIDISCIPLINARY RESEARCH AND ANALYSIS
ISSN(print): 2643-9840, ISSN(online): 2643-9875
Volume 05 Issue 05 May 2022
DOI: 10.47191/ijmra/v5-i5-11, Impact Factor: 6.261
Page No. 956-964
IJMRA, Volume 5 Issue 05 May 2022 www.ijmra.in Page 956
A Study of Donation-Based Crowd Funding Platforms
Dr. Amol Mane
Head, Department of Business Administration and International Business
MAEER’s MIT Arts, Commerce and Science College, Alandi, Pune
ABSTRACT: Persuasion is the process of communication in which a person wants to create an influence to induce certain behaviour
sends a persuasive message to the other individual with the aim of generating an impact on the recipient's attitude. The power of
decision making, however, is at the disposal of the recipient. Various technologies are used by the donation based crowd funding
platforms to persuade the website visitors to make donations for certain causes.
The main objective of the study was to focus on the specific factors that are used by the donation based crowd funding platforms
to persuade the prospective donors to make donations to specific campaigns. Exploration methods were used to obtain the
necessary data through online questionnaires. The questionnaire mainly included close ended questions where most of the
questions were designed for the people who have donated using crowd funding platforms to react on a Likert scale of 5 (Strongly
Agree to Strongly Disagree). Total sample size was 230. Simple Random Sampling method was used to collect the data. The
researcher has explained a model where building a new concept in the set of factors that are specifically applicable for the donors
who contribute for donation based crowd funding campaigns. The model shows that using technology in persuasion and having a
higher social networking presence can affect the donation intention of the website visitors to a considerable extent. The model
also shows that various privacy issues, trust and overall website quality also have a major impact on the donation intention of the
donors. In the end, the study also shows that the donation intention of the donors is highly positively correlated with the donation
behaviour.
KEYWORDS: crowd funding, crowd funding platforms, website quality, donation intention, Persuasion Technologies, donation
behaviour, donation behaviour.
INTRODUCTION
One may define persuasion as the process of communication in which a person wants to create an influence to induce certain
behaviour sends a persuasive message to the other individual with the aim of generating an impact on the recipient's attitude.
The power of decision making, however, is at the disposal of the recipient1. The overall value of the persuasive messages is
distinguished by the media channel and the content of the message that is used to deliver these messages. Several technologies
including the internet, cell phones and other online platforms provide ample opportunities for a persuasive interaction between
the donors and the fundraisers. Persuasive technology can be used to communicate with single individuals as well as groups of
individuals.2 There has been a very limited amount of research that has been conducted on the use of persuasive techniques used
by donation based crowdfunding platforms which are used to persuade the donors to donate to specific causes and finally check
out, almost like a regular online purchase.
Therefore, it can be said that the entire set of ICT enabled tools that are designed to interact with the purpose of changing or
shaping a particular person's attitude or behaviour is persuasive technology. Persuasive technology involves bringing about a valid
interaction between humans and computers and studies how people are persuaded when they interact with different kinds of
technologies.
Various technologies are used by the donation based crowdfunding platforms to persuade the website visitors to make
donations for certain causes. The following is a list of some of the persuasive strategies that are used:1
• Reduction: by simplifying the complex activities and making it easier to donate, donation based crowdfunding platforms
use a strategy of reduction. For example, instead of going through the entire lengthy process, they can facilitate the donor
to donate for a particular cause with a few clicks of the mouse. For this purpose, crowdfunding platforms often offer the

A Study of Donation-Based Crowd Funding Platforms
IJMRA, Volume 5 Issue 05 May 2022 www.ijmra.in Page 957
visitors who visit for the first time to save their card information or remember that choice/ mode of payment which
speeds up the process and also persuade the prospective donors to donate quickly. This strategy is especially useful in
the case of people who get overwhelmed with a feeling of sympathy and make impulsive donations.
• Tunnelling: tunnelling is a process by which websites offer free trials. However, this method is not applicable to the
donation based crowdfunding platforms. The strategies used by websites that provide certain types of services such as
antiviruses, spyware protection and special-purpose websites that provide specific information to certain prospective
donors.
• Tailoring: based on the browsing history, potential interests, usage context and other factors that may be borrowed from
the process of profiling of the donors, donation based crowdfunding platforms tailor out specific information and
persuade the prospective donors to make donations for specific causes.
• Personalisation: in this strategy, based on the donors’ previous history, the websites offer specific content and
recommendations to the donors so that they can make decisions to donate quickly.
• Self-monitoring: it allows the customers to keep a track of their own status and performance as far as their donation
ability is concerned. This strategy enables the donors to check the actual impact of the donations that they have made
and create a feeling of pride and warmth. This can create a sense of pride as donors always want to know how they have
affected the wellbeing of specific people who needed help. Faster checkouts and reports that contain detailed
information regarding the status of the beneficiaries, progress of the overall campaign are emailed to the donors on a
timely basis. These factors can play an important role in persuading donors to donate more towards the same campaign
or other campaigns that are promoted on the same donation based crowd funding platform.
• Pop-ups: this technology is relatively old. Whenever a particular person logs in to a specific social networking platform
or website, or simply opens a webpage, a pop-up advertisement is displayed which contains pictures of the individuals/
beneficiaries that are illustrated in a way to create sympathy and persuade the donors to make donations by clicking on
links. These pop-ups are extremely effective and contain punch lines such as “Help a farmer’s 3-year-old daughter to
battle blood cancer”. These messages are accompanied with images of the actual bedridden patient along with the
photographs of the parents, who pose helplessness through their natural expressions. This is one way of creating
sympathy, and persuading the donors to click to know more. Once the donors click the link on the pop-up, they directly
land up on the payment page, where donation amounts are pre-written (Usually beginning with 1000-1500 INR).
However, the person who makes the donation can change the amount to the minimum acceptable limit that is set by the
platform (usually in the range of 300-500 INR).
• Offering the option to withdraw the donation: In certain cases, (Ketto.org) the crowdfunding platforms allow the users
to claim the amount that they have contributed in case if they ever face situations in life where they need to raise funds
for themselves. This means that if the donor who had previously donated to the campaign faces a situation in life, where
he is not left with any option but to raise funds using donation based crowdfunding, Ketto.org allows the person to use
the amount that he had donated over the years, for various causes.
There are several other factors such as “thank you letters”, reminders, testimonials given by beneficiaries that add to the
overall persuasion strategy and can have a deep impact on the donation intention and the donating behaviour of the individuals
who visit the websites that are maintained by donation based crowdfunding platforms. According to Oinas-Kukkonen and
Harjumaa (2009) other factors include trustworthiness, suggestion and third-party endorsements etc. that contribute to the
overall persuasiveness of the website. According to the authors, websites often offer up-to-date information and statements from
certain famous personalities or people who have a certain level of authority that increase the trustworthiness of a particular
donation based crowdfunding campaign. When a particular website has a very sympathetic feel and look and the design reflects
the context of the website, it certainly ends in persuading the person to make contributions.1
In the context of electronic commerce, the current paper focuses mainly on the design of the websites that are maintained
by donation based crowdfunding platforms. It also discusses several strategies that are used by such platforms in order to shape
the attitude or behaviour of the donors. Due to the advent of Internet technology and availability of higher broadband speeds,
such websites are becoming increasingly functionally persuasive and are implementing dynamic persuasion techniques to increase
their site visits and contributions to the various campaigns that are listed on the platform. These technologies are used by donation
based crowdfunding platforms to enhance the overall system credibility and facilitate the process of donating online by motivating
the donors to adopt certain systems. For example, a list of top contributors is displayed on the website. Such things can motivate
specific individuals to donate more and be at the top of the list, possibly by generating a sense of pride or some kind of satisfaction.

A Study of Donation-Based Crowd Funding Platforms
IJMRA, Volume 5 Issue 05 May 2022 www.ijmra.in Page 958
At times, when a particular person clicks a post on the social networking website, but decides to not donate at that moment, a
few days later the same campaign is deliberately displayed with the help of tools like Google ads etc. and hammered on the
prospective donors. Hammering can happen with the help of mobile phone short text messages, emails and at times and
sometimes even through personalized phone calls. This is done with the intention of perusading the prospective donors to donate
to specific campaigns that were explored by the prospective donor. Thus, it can be said that various techniques and methods are
employed by donation based crowdfunding platforms in order to raise funds using persuasive techniques. The next section of the
paper deals with the review of literature that is relevant to the current study.
REVIEW OF LITERATURE
Captology is the study of computers as devices that promote persuasive technologies. In the year 1996, Dr. B.J. Fogg, who is the
director of the Stanford University Persuasive Technology Lab, derived the term in 1996 from an acronym. According to him, the
full form of CAPT is “Computers As Persuasive Technologies (CAPT).” 3
Captology involves the research, design and analysis of various computing products that are interactive in nature. Various
devices such as mobile phones, websites, wireless technologies, computers, mobile applications, video games et cetera can be
used for the purpose of persuading the people to buy certain products and services. Therefore, it can be said that the technology
has the potential of creating an influence on its own right. The concept of Captology (persuasive technology) has been around for
more than 2 decades. However, there is very limited research on Captology and its impact on the donation intention and donating
behaviour of people who surf the Internet to make donations to specific campaigns. Each crowdfunding campaign requires a
different way of persuasion. For example, if a particular person wants to raise funds for the purpose of taking care of stray animals,
the persuasion technique used by the crowdfunding platform will be completely different as compared to a campaign directed
towards raising funds for a patient with terminal illness requiring a transplant. Persuasion is extremely relevant for the design of
interactive electronic communications. Nonlinear messages make it difficult to orient and direct the reader with traditional graphic
strategies conceived for linear message sequencing.
Internet site’s visitors can choose their own paths, browsing the key content, and may be diverted by links to other sites
on the Web. Persuasive communications strategies can persuade the website visitors to follow understandable reading pathways,
and to generate the most expected reactions by using a combination of different kinds of tools, techniques and devices. Thinking
of persuasion in this way, the smallest graphic images can also amount to persuasion. For example, the prospective donors can be
directed to click the “Donate Now” or “Save his Life now!” button that is highlighted by using attention grabbing animations and
colours (McCoy, 2000)4.
Persuasive technologies work without using quotes and deception and make an attempt to change shape an individual’s
attitude and behaviour concerning an object, issue or action (Fogg, 2003)3. The literature that is available on the current study
provides various guidelines for evaluating the performance of various aspects of systems that are implemented by the websites
that are maintained by donation based crowdfunding platforms in order to persuade people to make donations for certain
charitable causes. Kaptein and Duplinsky (2009)5 have studied the use of persuasive technology in e-commerce. However, they
have overemphasized on the aspect of the changing behaviour of individuals using specific messages. The study that is done by
Felfernig and Burke(2008) explores the various factors that contribute to the success of ecommerce websites. However, there are
virtually no studies that have considered the persuasive techniques employed by crowdfunding websites. This demands a study
that would help in gaining a deeper understanding about the persuasive aspects of the design of the websites that are maintained
by donation based crowdfunding platforms. Several researchers have used the persuasive system design (PSD) model (Oinas-
Kukkonen & Harijumaa, 2009) as a theoretical foundation. However, none of the researchers seem to have used the various factors
that have been mentioned by the technology acceptance model.
Online donations have become increasingly popular, owing to the pandemic situation that the planet is currently going
through. Therefore, the proficiency in design and functionalities of a particular website play a considerable role in providing a
competitive advantage to the fundraising platforms. Websites are often the first point of contact and generally it is considered
that the first impression is the last impression. Therefore, it is necessary for a particular website to be good enough to present a
favourable image of the entire organisation and attract more prospective donors. The website must have the ability of converting
people who are surfing the Internet to potential shoppers. There are several features which are purses of extensively applied in
designing e-commerce websites that result in improving the quality and help companies to deploy their marketing strategies more
effectively. Such features also contribute to the credibility of the website (Fogg et al., 2003, Kaptein and Duplinsky, 2009). Again,
a donation based platform gains valuable information of the donors. In certain cases, the donors may even be required to enter
their pan number and other sensitive data. This data can leak or be sold by the platform for money. Therefore, privacy is one of
the major issues that can affect the donation behaviour and the donation intention of the prospective donors.

A Study of Donation-Based Crowd Funding Platforms
IJMRA, Volume 5 Issue 05 May 2022 www.ijmra.in Page 959
Winn and Beck (2002)6 performed a study as to how the different visual elements operate in persuading prospective
donors. However, the study was performed in 2002 and technologies have changed since then and websites have become more
interactive due to the availability of higher internet speeds and faster computing devices. Instead of pop-ups with images, websites
can use popups with videos and other forms of interactive media that is programmed using flash animations.
Overall, the literature available suggests that there is very less work done on the impact of persuasive technology on the
donation intention and donating behaviour of individuals who contribute to charitable causes through donation based online
crowdfunding platforms. The current study focusses on donations probes into the various persuasive technologies and strategies
that have a certain amount of impact on the donating behaviour and donating intention of the visitors of the websites that are
maintained by donation based crowdfunding platforms.
OBJECTIVES OF THE STUDY
1. To identify various factors that are used to persuade the website visitors of donation based crowdfunding platforms to
increase the chances of success of donation-based crowdfunding campaigns.
2. To measure the influence of the key factors that are used to persuade the potential donors of donation based
crowdfunding platforms.
Hypothesis:
H1: The website quality (WQ) is significantly positively correlated with trustworthiness (T) of a donation based crowdfunding
platform.
H2: Privacy (PRI) is significantly correlated with donation intention (DI).
H3: There is a significant positive correlation between Persuasion Technologies (PT) and the donation intention (DI).
H4: The social networking presence (SNP) of the website is positively correlated with the donation intention (DI).
H5: Trust (T) and Privacy (PRI) are significantly positively correlated with the donation behaviour.
H6: Donation intention (DI) and donation behaviour (DB) are positively correlated.
RESEARCH METHODOLOGY
The main objective of the study was to focus on the specific factors that are used by the donation based crowdfunding platforms
to persuade the prospective donors to make donations to specific campaigns. The objective of the study is to create a model that
would explain the level of influence of each of the persuasion strategies on the donation intention of the website visitors.
Exploration methods were used to obtain the necessary data through online questionnaires. The questionnaire mainly included
close ended questions where most of the questions were designed for the people who have donated using crowdfunding platforms
to react on a Likert scale of 5 (Strongly Agree to Strongly Disagree). The questionnaire was circulated among the respondents using
social media platforms like WhatsApp and Facebook. The exact number of donors of the Internet is finite but unknown. The survey
was conducted on 252 respondents. However, some of the respondents had given polarised Reponses and not seem to have
seriously participated in the research. 22 such irrelevant questionnaires were cancelled and finally, 230 responses were considered
for the purpose of the study. For the purpose of dimensional reduction an exploratory factor analysis was conducted.
ANALYSIS OF DATA
Profile of the Respondents:
Age * Gender Crosstabulation
Gender Total
Male Female
Age 18-30
31-40
Count
% within Gender
Count
% within Gender
30 48 78
26.3% 41.4% 33.9%
44 40 84
38.6% 34.5% 36.5%

A Study of Donation-Based Crowd Funding Platforms
IJMRA, Volume 5 Issue 05 May 2022 www.ijmra.in Page 960
41-50
Count
% within Gender
23 20 43
20.2% 17.2% 18.7%
51-60
Above Years 60
Total
Count
% within Gender
Count
% within Gender
Count
% within Gender
14 7 21
12.3% 6.0% 9.1%
3 1 4
2.6% 0.9% 1.7%
114 116 230
100.0% 100.0% 100.0%
The table shows that maximum number of respondents (36.5%) were from the age group of 31 to 40 years followed by 33.9% of
the respondents belonging to the age group of 18 to 30 years. Overall, 116 respondents were female whereas 114 the respondents
were male. A very few number of respondents belonged to the age group of 51 years and above. This suggests that making online
donations through crowd funding platforms is not that popular among the people who are having ages 51 years and above.
Education
Frequency Percent Valid Percent Cumulative Percent
Masters and above
Graduate
Valid 10+2 and below
Diploma/ Other
Total
120 52.2 52.2 52.2
94.8
97.4
100.0
98 42.6 42.6
6 2.6 2.6
6 2.6 2.6
230 100.0 100.0
The above table shows that 94.8% of the respondents were graduates. Only 2.6% of the respondents were having an education of
10+2 and below.
Most preferred donation based platform:
Frequency Percent Valid Percent Cumulative Percent
Impact guru 35 15.2 15.2 15.2
Milaap 84 36.5 36.5 51.7
Valid Ketto 91 39.6 39.6 91.3
Others 20 8.7 8.7 100.0
Total 230 100.0 100.0
Milaap and Ketto seem to be more popular as compared to Impact Guru and other platforms for the purpose of making charitable
contributions. 36.5% of the respondents stated that the Milaap is the most preferred platform whereas 39.6% of the respondents
stated that Ketto is the most preferred platform as far as their activity of making online donations is concerned.

A Study of Donation-Based Crowd Funding Platforms
IJMRA, Volume 5 Issue 05 May 2022 www.ijmra.in Page 961
Internet Usage proficiency (Self Evaluation of the respondents)
Frequency Percent Valid Percent Cumulative Percent
Newbies
Beginner
Basic Valid
10 4.3 4.3 4.3
36 15.7 15.7 20.0
46 20.0 20.0 40.0
Intermediate 65 28.3 28.3 68.3
Expert 73 31.7 31.7 100.0
Total 230 100.0 100.0
For the purpose of the study, internet proficiency refers to the level of expertise that prospective donors have regarding
the various issues that are related to the general use of the internet, for browsing, making online payments and using social media
platforms. Experienced users can make donations easily as they may know the different issues that can arise during the process.
Only 4.3% of the respondents were newbies and 15.7% of the respondents were beginners. However, 20% of the respondents
expressed that they had basic knowledge of online shopping, 28.3% of the respondents expressed that they had intermediate
proficiency and 31.7% of the respondents stated that they are experts as far as using the internet is concerned.
For the purpose of checking the internal consistency among the variables, the Cronbach’s Alpha Value was calculated,
and for all factors that have been considered in the model, the Value was above 0.7.
For the purpose of testing the hypothesis, correlation analysis was used and the results were as follows.
Correlations
WEB
SITE
QUA
LITY
SOCIAL
NETWOR
KING
PRESENCE
PRIVACY TECHNO
LOGY IN
PURSUAS
ION
TRUST DONAT
ION
INTENT
ION
DONATI
ON
BEHAVI
OUR
WEBSITE
QUALITY
Correlation 1 .242** .286** .418** .248* .245** .465**
*
Sig. .000 .000 .000 .000 .000 .000
N 231 231 231 231 231 231 231
SOCIAL
NETWORKING
PRESENCE
Correlation .242** 1 .403** .402** .443*
*
.454** .547**
Sig. .000 .000 .000 .000 .000 .000
N 231 231 231 231 231 231 231
PRIVACY Correlation .286** .403** 1 .476** .329*
*
.483** .619**
Sig. .000 .000 .000 .000 .000 .000
N 231 231 231 231 231 231 231
TECHNOLOGY IN
PURSUASION
Correlation .418** .402** .476** 1 .349*
*
.505** .773 **
Sig. .000 .000 .000 .000 .000 .000
N 231 231 231 231 231 231 231

A Study of Donation-Based Crowd Funding Platforms
IJMRA, Volume 5 Issue 05 May 2022 www.ijmra.in Page 962
TRUST Correlation .248** .443** .329** .349** 1 .364** .472**
Sig. .000 .000 .000 .000 .000 .000
N 231 231 231 231 231 231 231
DONATION
INTENTION
Correlation .245** .454** .483** .505** .364*
*
1 .610**
Sig. .000 .000 .000 .000 .000 .000
N 231 231 231 231 231 231 231
DONATION
BEHAVIOUR
Correlation .465** .547** .619** .773** .472*
*
.610** 1
Sig. .000 .000 .000 .000 .000 .000
N 231 231 231 231 231 231 231
**. Correlation is significant at the 0.01 level (2-tailed).
From the above table it can be seen that:
1. The website quality (WQ) is significantly positively correlated with trustworthiness (T) of a crowdfunding platform’s
website.
2. Privacy (PRI) is significantly positively correlated with donation intention (DI).
3. There is a significant positive correlation between Persuasion Technologies (PT) and the donation intention (DI).
4. The social networking presence (SNP) of the users is positively correlated with the donation intention (DI).
5. Trust (T) and Privacy (PRI) are significantly positively correlated with the donation behaviour.
6. Donation intention (DI) and donation behaviour(DB) are positively correlated.
THE MODEL:
The model can be represented as follows:
CONCLUSION
The researcher has explained a model where building a new concept in the set of factors that are specifically applicable for the
donors who contribute for donation based crowdfunding campaigns. Therefore, the study attempts to make contributions to the
scientific work that is not done on the subject matter. The study shows that there are several factors that affect the donation
intention which are related to the various forces of strategies that are used by donation based crowdfunding platforms to persuade

A Study of Donation-Based Crowd Funding Platforms
IJMRA, Volume 5 Issue 05 May 2022 www.ijmra.in Page 963
the visitors to donate. The model shows that using technology in persuasion and having a higher social networking presence can
affect the donation intention of the website visitors to a considerable extent. The model also shows that various privacy issues,
trust and overall website quality also have a major impact on the donation intention of the donors. In the end, the study also
shows that the donation intention of the donors is highly positively correlated with the donation behaviour.
REFERENCES
1) Oinas-Kukkonen, H., & Harjumaa, M. (2009). Persuasive systems design: Key issues, process model, and system features.
Communications of the Association for Information Systems, 24(1), 28.
2) Chaffee, S. H., & Metzger, M. J. (2001). The end of mass communication?. Mass communication & society, 4(4), 365-379.
3) Fogg, B. J. (1998, April). Captology: the study of computers as persuasive technologies. In CHI 98 Conference Summary
on Human Factors in Computing Systems (p. 385).
4) McCoy, K. (2000). Information and Persuasion: Rivals or Partners?. Design Issues, 16(3), 80-83.
5) Kaptein, M., & Duplinsky, S. (2009). Combining Multiple Influence Strategies to Increase Consumer Compliance.
6) Winn, W., & Beck, K. (2002). The persuasive power of design elements on an e-commerce web site. Technical
communication, 49(1), 17-35.
7) Alwafi, F., Magnadi, R.H. (2016). Pengaruh persepsi keamanan, kemudahan, bertransaksi, kepercayaan terhadap dan
pengalaman berbelanja terhadap minat beli secara online pada situs jual beli tokopedia.com. Diponegoro Journal of
Management, 5(2), 1-15.
8) Aribowo, D., & Nugroho, M. (2013). Pengaruh trust dan perceiced of risk terhdap niat untuk bertransaksi menggunakan
e-commerce. Jurnal Nominal, 2(1), 11-35.
9) Çelik, H. (2011). Influence of social norms, perceived playfulness and online shopping anxiety on customers’ adoption of
online retail shopping: An empirical study in the Turkish context. International Journal of Retail & Distribution
Management, 39(6), 390-413.
10) Lung, H.C., Chuan L.J., & Hsu, C.L. (2013). The effects of blogger recommendations on customers’ online shopping
intentions. Emerald Insight, 23(1), 69-88.
11) Davis, F. (1989). Perceived usefulness, perceived ease of use, and user acceptance of information technology. MIS
Quarterly, 13(3), 319-39.
12) Delafrooz, N., Paim, L.H., & Khatibi, A. (2011). Understanding consumer’s internet donation intention in Malaysia. African
Journal of Business Management, 5(3), 2837-2846.
13) El-Gohary, H. (2010). E-Marketing - A literature Review from a Small Businesses perspective. International Journal of
Business and Social Science, 1(1), 216.
14) Ferdinand, A. (2014). Metode Penelitian Manajemen. Semarang: Badan Penerbit Universitas Diponegoro.
15) Ha, S., & Stoel, L. (2009). Consumer e-shopping acceptance: Antecedents in a technology acceptance model. Journal of
Business Research, 565-571.
16) Hair, J.R., Joseph, F.B., William, C., Babin, B.J., Anderson, R.E. (2010). Multivariate Data Analysis, Seventh Edition. New
Jersey: Pearson Prentice Hall.
17) Hong, I., & Cho, H. (2011). The impact of consumer trust on attitudinal loyalty and donation intentions in B2C e-
marketplaces: Intermediary trust vs. fundraisers trust. International Journal of Information Management, 469-479.
18) Hsu, M.H., Chuang, L.W., & Hsu, C.S. (2014). Understanding online shopping intention: the roles of four types of trust and
their antecedents. Internet Research, 24(3), 332-352.
19) Indarsin, T., & Ali, H. (2017). Attitude toward Using m-Commerce: The Analysis of Perceived Usefulness Perceived Ease
of Use, and Perceived Trust: Case Study in Ikens Wholesale Trade, Jakarta - Indonesia. Saudi Journal of Business and
Management Studies, 2(11), 995-1007. Jakarta: Erlangga.
20) Julianti, S. (2017). Mastering Packaging for E-commerce. Jakarta: Gramedia Pustaka Utama.
21) Kim, D.J., Ferrin, D.L., & Rao, H.R. (2009). Trust-based consumer decision-making model in electronic commerce: the role
of trust, perceived risk, and their antecedents. Decision Support Systems, 44(2), 544-564.
22) Kotler, P., Keller, K.L., & Amstrong, G. (2012). Marketing Management Edition 14.
23) Kwek, C., Tan, H., & Lau, T. (2010). Investigating the Shopping Orientations on Online Donation intention in the e-
Commerce Environment: A Malaysian Study. Journal of Internet Banking and Commerce, 15(2), 1-22.
24) Lee, H. (2016). Examining neighborhood influences on leisure-time walking in older Korean adults using an extended
Theory of Planned Behavior. Landscape and Urban Planning, 148, 51-60. New Jersey: Pearson Education Limited.

A Study of Donation-Based Crowd Funding Platforms
IJMRA, Volume 5 Issue 05 May 2022 www.ijmra.in Page 964
25) Palvia, P. (2009). The role of trust in e-commerce relational exchange: A unified model. Information & Management, 213-
220.
26) Pavlou, P. A. (2003). Consumer Acceptance of Electronic Commerce: Integrating Trust and Risk with the Technology
Acceptance Model. International Journal of Electronic Commerce, 7(3), 101134.
27) Pavlou, P., & Fygenson, M. (2006). Understanding and predicting electronic commerce adoption: an extension of the
theory of planned behavior. MIS Quarterly, 30(1), 115-143.
28) Schiffman, L., Kanuk, L., Wisenblit, J. (2010). Consumer behavior. 10th edition. New Jersey: Pearson Prentice Hall.
There is an Open Access article, distributed under the term of the Creative Commons
Attribution – Non Commercial 4.0 International (CC BY-NC 4.0)
(https://creativecommons.org/licenses/by-nc/4.0/), which permits remixing, adapting and
building upon the work for non-commercial use, provided the original work is properly cited.

INTERNATIONAL JOURNAL OF MULTIDISCIPLINARY RESEARCH AND ANALYSIS
ISSN(print): 2643-9840, ISSN(online): 2643-9875
Volume 05 Issue 05 May 2022
DOI: 10.47191/ijmra/v5-i5-12, Impact Factor: 6.261
Page No. 965-970
IJMRA, Volume 5 Issue 05 May 2022 www.ijmra.in Page 965
A Study of Speech Recognition with Deep Learning
Feng Li1, Yiyang Wei2
1,2School of management science and Engineering, Anhui University of Finance and Economics, Bengbu
233030, China
ABSTRACT: The development of deep learning and the continuous progress of artificial intelligence have contributed to the rapid
development of speech recognition. Among them, the end-to-end structure is the more important part of the whole speech
recognition. This paper introduces two end-to-end speech recognition methods, the attention model and the CTC loss function,
describes the practical application of deep learning in speech recognition and suggests improvements to the two models. Finally,
the practical usefulness of speech recognition is demonstrated by analyzing the application of trigger word detection and
sentiment analysis in artificial intelligence in teaching and learning.
KEYWORDS: Speech Recognition; Deep learning; CTC Loss Function; Sentiment Analysis.
I. INTRODUCTION
Speech recognition is a technology that uses machines to recognize and understand speech signals and convert them into
corresponding text and commands [1]. In simple terms, speech recognition can find the corresponding text when given a sound
segment. The two most important parts of speech recognition are acoustic feature extraction and acoustic model building. One
of the most used acoustic features is the Mel Frequency Cepstrum Coefficient (MFCC) [2]. For acoustic model building, the
Gaussian Mixture Model (GMM) [3] in the traditional GMM-HMM [4] acoustic model ignores temporal information and does not
make sufficient use of before and after information, which has certain limitations. The rise of deep learning, on the other hand,
provides a new approach to acoustic modeling. Deep convolutional neural networks can improve the connectivity between
frames, i.e. the closeness of the before and after information, and can achieve an improved level of speech recognition in the
process of speech recognition. However, the emergence of accurate speech recognition was marked by the development of the
sequence-to-sequence model [5]. Microphones work by measuring small changes in air pressure [6], and we can now hear people
speaking because our ears detect small changes in air pressure generated by speakers or headphones. Speech recognition
algorithms, which use a segment of an audio graph (an image of air pressure against time) as input, are then fed with the
corresponding text. Even the physiological structures in the human ear are able to measure the intensity of different frequencies,
rather than processing the original sound waves in their raw form [7]. So a common pre-processing step for sound frequency
data is to generate a spectrogram from the sound frequency fragments, inside this graph the horizontal coordinates are time
and the vertical coordinates are frequency, with different shades of color indicating energy levels. The spectrogram indicates
how much volume is present at different times and at different frequencies.
Speech recognition systems were constructed based on phonemes (the basic units of sound) [8], where researchers divided
language into basic sound units, and linguists believed that representing audio in terms of phonemes was the best way to
recognize speech. Later, scholars proposed end-to-end structures, which could solve the situation of sequence misalignment
during speech recognition [9]. Moreover, there is no need to use phonemes to represent sounds. However, the implementation
presupposes that a larger dataset is required. An academic dataset for speech recognition may b 300 hours long, and in the
academic community, an audio dataset of 3000 hours would be considered a reasonable size. This paper presents two types of
end-to-end speech recognition based on attention models and CTC loss functions respectively. Of these, the CTC loss function is
the main core algorithm for the end-to-end architecture [10].
II. PREVIOUS STUDIES
(1) Speech recognition based on attention models
Attentional modeling is a technique for extracting effective features from a sequence of features in a real sequence-to-sequence
model. When people observe a scene, they pay different attention to different locations, people, and things within that scene.

A Study of Speech Recognition with Deep Learning
IJMRA, Volume 5 Issue 05 May 2022 www.ijmra.in Page 966
Derived from this phenomenon, attention models calculate a series of attention weights [11]. In speech recognition, a soft
attention model is generally used, i.e. the attention weights are calculated for all encoder output data. A speech recognition
based on the attention model is shown in the Figure 1.
Figure 1 Diagram of speech recognition based on the attention model
The model consists of an encoder, a decoder, and an attention layer. The encoder is represented using a bidirectional RNN, while
the decoder is composed using a unidirectional RNN [12]. First, the input data is fed through the bidirectional RNN model, which
a⃗ <t> denotes the time step t in the forward propagation of the activation, and a⃗⃖<t′> denotes the time step t in the backward
propagation of the activation.a<t′> Connecting these two activation units, their representation of the feature vector at time step
t
a<t′> = (a⃗ <t′>, a⃗⃖<t′>)
The input to a unidirectional RNN depends on the attention layer. The attention layer has an attention sub-network, which
contains only one implicit layer and can be e<t,t′> denoted by the sub-network as shown in the following figure.
Figure 2 Attentional sub-network
where the first input s<t−1> is the previous step in the neural network decoded at the previous moment anda<t′> is the other
input. In simple terms, the amount of attention needed for the input depends mainly on the activation from the previous state.
By training this small neural network and back-propagating the algorithm to find the corresponding function utilizing gradient
descent.
Then, all moments thee<t,t′> are exponentially normalized. The normalized value is the attention weight [13], which can be
interpreted as the attention of the output to the input. For example, when the decoder outputs a character, it should pay
attention to how much attention is paid to thet′ input character is how much. This is shown below.
𝑎<𝑡,𝑡′> =exp (𝑒<𝑡,𝑡′>)
∑ exp (𝑒<𝑡,𝑡′>)𝑁𝑡′=1
Finally, the features are weighted and summed over all moments to obtain the output corresponding to the position of the
output sequence under the attention model o.
𝑜<𝑡> = ∑𝑎<𝑡,𝑡′>
𝑡′
𝑎<𝑡′>

A Study of Speech Recognition with Deep Learning
IJMRA, Volume 5 Issue 05 May 2022 www.ijmra.in Page 967
(2) Speech recognition based on CTC loss function
In the horizontal coordinates, the audio is input at various times and the text is output by the attention model, which is a good
approach, but the algorithm is prone to run at a quadratic cost. A better alternative approach to speech recognition is to use the
CTC loss function, which stands for Conjointist Temporal Classification [14]. The principle is described in the figure.
Figure 3 Diagram of speech recognition based on CTC loss function
If there is an audio clip "The handsome boy", a simple one-way RNN is used here, but in practice, this is usually a bi-directional
LSTM or bi-directional GRU, usually a deeper model. The important thing to note here is that the times here are large and that
in speech recognition the input times usually greatly exceed the output times. For example, if you have 5 seconds of video with
features at 50Hz, i.e. 50 samples of data per second, then 5 seconds of audio will be 250 input characters.
50Hz ∗ 5s = 250
The basic principle of the CTC loss function is to collapse repetitive characters that are not split by whitespace, for example, an
RNN produces an output sequence "bbbbbbb ____ooo_y", which is the correct output for "boy", using underscores to represent
a special whitespace character for clarity. a character many times, giving a sequence of 1000 outputs. So by inserting a bunch of
whitespace characters, you can still end up with a shorter string of text, so the paragraph above actually has 16 characters, and
if somehow it can use the output value of these 1000 Y's to represent a string of these 16 characters.
Both attention-based models and CTC models are viable solutions for speech recognition. Today, building speech recognition
systems still require significant effort and data sets.
III. APPLICATION AREAS
(1) Trigger word detection in AI
There is a very important branch in the field of artificial intelligence, natural language processing, which simply means enabling
machines to understand human language and communicate with humans. Natural language processing covers machine
translation, intelligent retrieval, and more. With the increasing maturity of deep learning, it simplifies the models in natural
language processing but improves performance, trigger word detection being an example. As voice recognition is used in more
and more smart devices, people can use their voice to command the devices they own, which is known as activating this detection
[15].
Examples of activated word detection include Amazon Echo using "Alexa" to wake up, Baidu DuerOS using "Hello Xiaodu", Apple
Siri using "Hey Siri" and Google Home using "ok Google". "For example, when a user says "Hello Xiaodu, what time is it? Baidu
DuerOS will wake up with "Xiaodu Hello" and answer the corresponding voice question. So, if you can create an activation
vocabulary detection system, then it is possible that you can activate your computer to make it do what you want. Activated
vocabulary detection is still being adapted, so there is not a single universally default optimal algorithm, so it is described below
using RNN. The principle of activated vocabulary detection is shown in the diagram.
Figure 4 Schematic diagram of trigger word detection

A Study of Speech Recognition with Deep Learning
IJMRA, Volume 5 Issue 05 May 2022 www.ijmra.in Page 968
Taking "Hey Siri" as an example, when "Siri" is heard, the previous target tag in the training set can be set to 0, and the next
target tag after it is detected can be set to 1. And so on, when the trigger word is responded to, the next subsequent target tag
is set to 1, and the previous target tags are all 0. However, this RNN-based trigger word detection is flawed and can lead to an
unbalanced training set with far more zeros than ones.
In terms of improvement, there are two methods. The first method is to set multiple subsequent target tags to 1 relative to a
single target tag after a trigger word has been detected. The other method is to set the target tag value to 1 for a certain period
after detection. The improvement allows for a balanced ratio of 0s to 1s.
3.2 Affective analysis in teaching
The task of sentiment analysis is to analyze a piece of text and tell people whether someone likes what they are discussing or
not. It is the most important component of natural language processing and is used in many applications. There is this sentiment
analysis problem. Input a piece of text and the output can be the sentiment that you want to predict. Examples are the emotions
such as happiness, sadness, anger, boredom, and fear that students produce in the classroom. Sentiment analysis can use a piece
of text to predict whether the students' feelings towards the teacher in class are positive or negative, and then the teacher and
school can see if the teacher is having problems or whether the students' attitudes towards the teacher have changed for the
better or worse over time. One of the challenges with sentiment analysis is the lack of a particularly large labeled training set in
[16], but with the use of word embeddings, it is possible to build a good sentiment analyzer relying on a moderately sized labeled
training set in [17]. For sentiment analysis tasks, it is common that the training set may have between 10,000 and 100,000 words
of data. Sometimes it is even less than 10,000 words, and word embeddings can help to understand what happens when the
training set is small.
(1) Word embedding method
Suppose you have a sentiment analysis model like this. You can take a sentence like "The teacher is excellent" and look up these
words in your dictionary. This is shown in the diagram.
Figure 5 Schematic diagram of word embedded sentiment analysis
This sentence has a total of four terms. First, we get "The {0, 8, 9, 2, 8}", which is the product of the one-hot vector and the
embedding matrix E. It can continue to learn into larger text vectors. It can continue to learn from a larger vector of text. This
vector is then used to extract the embedding vector for the word "the"e_8928. The same operation is then performed for the
remaining three words. Finally, the classifier is constructed using the averaging method, averaged over them, and then
transferred to the softmax classifier, which outputs the predictions [18].
Although the averaging method gives a better prediction, what it does is average the meanings of all the words in the example.
One of the problems with this algorithm is that it ignores the order of the words, particularly, in the case of the following
comment, "Completely lacking in good teaching methods, good passion, and good attitude", although this is a negative comment.
However, it has multiple occurrences of "good", so if you use the average algorithm output, this ignores the order in which the
words are arranged and simply averages all the words. If there are many positive representations in the feature vector. The
classifier may simply assume that this is a good rating, which in turn affects the analysis of sentiment, however in reality it is a
very negative review.

A Study of Speech Recognition with Deep Learning
IJMRA, Volume 5 Issue 05 May 2022 www.ijmra.in Page 969
(2) Deep learning approach
There is more sophisticated model which not only sums all word embeddings but also performs sentiment analysis using an RNN.
the previous steps are similar, find the one-hot vector for each word in the comment, then multiply the word embedding matrix
E. You can then use the resulting embedding vectors of multiple words as input to the RNN, and finally predict the outcome
through a many-to-one RNN model. This is shown in Figure 6.
Figure 6 Schematic diagram of deep learning-based sentiment analysis
Like word embedding, the one-hot vector for each word is found and, as usual, multiplied with the word embedding matrix E.
Multiple words embedding vectors can then be obtained. These word embedding vectors are used as input to the RNN, which
finally computes the predicted sentiment results in the final step. With an algorithm like this, the order of the words can be
considered to get better results and to realize that this comment is negative [19]. But the nature of the algorithm differs from
the previous algorithm in that it recognizes "not good" as a negative comment. The previous algorithm just added everything
into a larger word vector and did not realize that the meaning of "not good" was different from where "good" was used.
A larger dataset could be used to train the word embedding vector and better results obtained. This can even be generalized to
words that do not appear in the training set. For example, enter the following text "Completely absent of good teaching methods",
even though "absent" is not in your label training set, if it is in the billion-word or 100-billion-word database of the training word
embedding vector of billions or hundreds of billions of words, you may be able to get the correct result, or even better generalize
to words that are present in the training set of the training word embedding vector, but not necessarily in the label training set.
This label training set may have been prepared by the researchers specifically for the sentiment analysis problem.
IV. CONCLUSIONS
This paper focuses on the principles of the attention model and the CTC loss function on the one hand, and the application of
RNNs in speech recognition on the other. The end-to-end model based on the attention model does not require a priori alignment
information, nor does it require independence tests between phoneme sequences, nor does it require artificial methods such as
pronunciation dictionaries, and can be effectively combined with neural networks to achieve speech recognition. CNN,
Transducer, and other models for improvement and optimization. On the other hand, two applications of speech recognition
under deep learning are introduced. Trigger word detection and sentiment analysis, as promising fields, have been developed
for a long time.
ACKNOWLEDGMENT
This work was supported in part by the Natural Science Foundation of the Higher Education Institutions of Anhui Province under
Grant No. KJ2020A0011, Innovation Support Program for Returned Overseas Students in Anhui Province under Grant No.
2021LCX032, Undergraduate teaching quality and teaching reform project of Anhui University of Finance and Economics under
Grant No. acszjyyb2021035, Undergraduate Research and Innovation Fund project of Anhui University of Finance and Economics
under Grant No. XSKY22154.
REFERENCES
1) P. Wang, "Research and Design of Smart Home Speech Recognition System Based on Deep Learning," 2020 International
Conference on Computer Vision, Image and Deep Learning (CVIDL), 2020, pp. 218-221.
2) A. Winursito, R. Hidayat and A. Bejo, "Improvement of MFCC feature extraction accuracy using PCA in Indonesian speech
recognition," 2018 International Conference on Information and Communications Technology (ICOIACT), 2018, pp. 379-
383.

A Study of Speech Recognition with Deep Learning
IJMRA, Volume 5 Issue 05 May 2022 www.ijmra.in Page 970
3) T. R. Kumar, S. Padmapriya, V. T. Bai, P. M. Beulah Devamalar and G. R. Suresh, "Conversion of non-audible murmur to
normal speech through Wi-Fi transceiver for speech recognition based on GMM model," 2015 2nd International
Conference on Electronics and Communication Systems (ICECS), 2015, pp. 802-808.
4) J. Rahman Saurav, S. Amin, S. Kibria and M. Shahidur Rahman, "Bangla Speech Recognition for Voice Search," 2018
International Conference on Bangla Speech and Language Processing (ICBSLP), 2018, pp. 1-4.
5) M. Mimura, S. Ueno, H. Inaguma, S. Sakai and T. Kawahara, "Leveraging Sequence-to-Sequence Speech Synthesis for
Enhancing Acoustic-to-Word Speech Recognition," 2018 IEEE Spoken Language Technology Workshop (SLT), 2018, pp.
477-484.
6) F. Mitsugi, S. Kusumegi, T. Kawasaki, T. Nakamiya and Y. Sonoda, "Detection of Pressure Waves Emitted From Plasma
Jets With Fibered Optical Wave Microphone in Gas and Liquid Phases," in IEEE Transactions on Plasma Science, vol. 44,
no. 12, pp. 3077-3082, Dec. 2016.
7) Liu Chien Chih and Chiang Che Ming, "The effect of environment of different noise frequencies on human physiological
responses," 2011 International Conference on Multimedia Technology, 2011, pp. 1808-1811.
8) N. Uma Maheswari, A. P. Kabilan and R. Venkatesh, "Speaker independent speech recognition system based on phoneme
identification," 2008 International Conference on Computing, Communication and Networking, 2008, pp. 1-6.
9) C. Fan, J. Yi, J. Tao, Z. Tian, B. Liu and Z. Wen, "Gated Recurrent Fusion With Joint Training Framework for Robust End-to-
End Speech Recognition," in IEEE/ACM Transactions on Audio, Speech, and Language Processing, vol. 29, pp. 198-209,
2021.
10) J. Sun, G. Zhou, H. Yang and M. Wang, "End-to-end Tibetan Ando dialect speech recognition based on hybrid
CTC/attention architecture," 2019 Asia-Pacific Signal and Information Processing Association Annual Summit and
Conference (APSIPA ASC), 2019, pp. 628-632.
11) J. -n. Chen, S. Gao, H. -z. Sun, X. -h. Liu, Z. -n. Wang and Y. Zheng, "An End-to-end Speech Recognition Algorithm based
on Attention Mechanism," 2020 39th Chinese Control Conference (CCC), 2020, pp. 2935-2940.
12) H. Zhang, "An Exploration of Recurrent Units for Automatic Speech Recognition with RNN based Acoustic Model," 2019
2nd International Conference on Information Systems and Computer Aided Education (ICISCAE), 2019, pp. 563-566.
13) C. Shan, J. Zhang, Y. Wang and L. Xie, "Attention-Based End-to-End Speech Recognition on Voice Search," 2018 IEEE
International Conference on Acoustics, Speech and Signal Processing (ICASSP), 2018, pp. 4764-4768.
14) J. Cui et al., "Improving Attention-Based End-to-End ASR Systems with Sequence-Based Loss Functions," 2018 IEEE
Spoken Language Technology Workshop (SLT), 2018, pp. 353-360.
15) S. Sigtia, J. Bridle, H. Richards, P. Clark, E. Marchi and V. Garg, "Progressive Voice Trigger Detection: Accuracy vs Latency,"
ICASSP 2021 - 2021 IEEE International Conference on Acoustics, Speech and Signal Processing (ICASSP), 2021, pp. 6843-
6847.
16) H. Shim, D. Lowet, S. Luca and B. Vanrumste, "LETS: A Label-Efficient Training Scheme for Aspect-Based Sentiment
Analysis by Using a Pre-Trained Language Model," in IEEE Access, vol. 9, pp. 115563-115578, 2021.
17) M. Aliramezani, E. Doostmohammadi, M. H. Bokaei and H. Sameti, "Persian Sentiment Analysis Without Training Data
Using Cross-Lingual Word Embeddings," 2020 10th International Symposium on Telecommunications (IST), 2020, pp. 78-
82.
18) R. MohammadiBaghmolaei and A. Ahmadi, "Word Embedding for Emotional Analysis: An Overview," 2020 28th Iranian
Conference on Electrical Engineering (ICEE), 2020, pp. 1-5.
19) D. Goularas and S. Kamis, "Evaluation of Deep Learning Techniques in Sentiment Analysis from Twitter Data," 2019
International Conference on Deep Learning and Machine Learning in Emerging Applications (Deep-ML), 2019, pp. 12-17.
There is an Open Access article, distributed under the term of the Creative Commons
Attribution – Non Commercial 4.0 International (CC BY-NC 4.0)
(https://creativecommons.org/licenses/by-nc/4.0/), which permits remixing, adapting and
building upon the work for non-commercial use, provided the original work is properly
cited.

INTERNATIONAL JOURNAL OF MULTIDISCIPLINARY RESEARCH AND ANALYSIS
ISSN(print): 2643-9840, ISSN(online): 2643-9875
Volume 05 Issue 05 May 2022
DOI: 10.47191/ijmra/v5-i5-13, Impact Factor: 6.261
Page No. 971-974
IJMRA, Volume 5 Issue 05 May 2022 www.ijmra.in Page 971
Relationships Between the Achieved Target Levels of LDL
Cholesterol and the State of Various Types of LV EF in Patients with
Coronary Artery Disease and Type 2 Diabetes.
Mukharram A.Musaeva1, Dinara A.Parpibaeva2, Muborak S.Salaeva3, Nargiza D.Salimova4
1Assistant of the simulation training department of the Tashkent Medical Academy, Tashkent, Uzbekistan 2Doctor of Medical Sciences, Associate Professor, Head of the Department of Simulation training, Tashkent Medical Academy,
Tashkent, Uzbekistan 3Candidate of medical sciences, Associate Professor of the Department of Simulation training, Tashkent Medical Academy,
Tashkent, Uzbekistan 4Candidate of medical sciences, Associate Professor of the Department of Simulation training, Tashkent Medical Academy,
Tashkent, Uzbekistan
ANNOTATION: Today, diabetes mellitus is one of the most powerful risk factors for the development of cardiovascular diseases
and its complications. [1] In 50% of patients with type 1 diabetes and in 80% of people with type 2 diabetes, early disability and
premature death are recorded due to cardiovascular complications. People with diabetes are often at risk for strokes, heart
attacks, and high blood pressure. In this regard, the main strategy for the treatment of patients with diabetes is to prevent the
development of cardiovascular complications, which includes strict control of glycemia, blood pressure, as well as antiplatelet and
lipid-lowering therapy.
Despite the fact that strict glycemic control alone does not reduce the risk of myocardial infarction and mortality from it, most
epidemiological and pathophysiological studies indicate a worse prognosis and a higher incidence of cardiovascular complications
in chronic hyperglycemia. The use of a fixed combination of sitagliptin / metformin is one of the preferred options in the treatment
of type 2 diabetes in patients with a high risk of cardiovascular disease due to the presence of type 4 dipeptidyl peptidase inhibitors
of cardio protective effects. In this paper, changes in the lipid spectrum in patients with ischemic heart disease and type 2 diabetes
mellitus with varying degrees of cardiac output are related to the number of years the patient has had diabetes mellitus, sitagliptin
/ metformin and statin drugs changes depending on the dose are highlighted.
KEYWORDS: dipeptidyl peptidase-4 inhibitors, metformin, type 2 diabetes mellitus, heart failure, average ejection fraction,
preserved ejection fraction, lipid spectrum, statin.
INTRODUCTION
Type 2 diabetes mellitus (DM2) is a chronic progressive disease. Half of the patients with DM 2 already had complications, including
those from the cardiovascular system, by the time the disease manifested. Ccardiovascular diseases are 2–5 times more common
in people with diabetes than in people without this pathology [1,4]. By the age of 50, almost 50% of diabetic patients have at least
one of them unstable angina, myocardial infarction, life-threatening cardiac arrhythmias, and chronic heart failure rapidly
develops.[2] At the same time, there is a high risk of developing conditions such as coronary heart disease (CHD), myocardial
infarction (MI), arterial hypertension (AH), and acute cerebrovascular accident (ACVA). Thus, 69% of patients with diabetes have
dyslipidemia, 80% have hypertension, 50–75% have diastolic dysfunction, 12–22% have chronic heart failure (CHF).[1] Mortality
from MI among patients with DM is 1.5–2 times higher than among people who do not suffer from this disease, both in the acute
stage of MI and during long-term follow-up [2]. In this regard, the main strategy for the treatment of patients with diabetes is to
prevent the development of cardiovascular complications, which includes strict control of glycemia, blood pressure, as well as
antiplatelet and lipid-lowering therapy. The development of vascular complications of type 2 diabetes mellitus is associated with
chronic hyperglycemia, so the goal of treating the disease is to compensate for carbohydrate metabolism disorders as fully as

Relationships Between the Achieved Target Levels of LDL Cholesterol and the State of Various Types of LV EF in
Patients with Coronary Artery Disease and Type 2 Diabetes.
IJMRA, Volume 5 Issue 05 May 2022 www.ijmra.in Page 972
possible. The lack of an ideal drug for the treatment of patients with type 2 diabetes, which would not only be able to provide
high-quality and permanent control of glycemia without weight gain, the risk of hypoglycemia, and a negative effect on the heart,
kidneys and liver, but also preserve the secretory function of β-cells, forced scientists to continue the search for new opportunities
to influence the cause of the onset and progression of type 2 diabetes.
The attention of the entire diabetic community is drawn to the cardiovascular safety of hypoglycemic drugs. The combination of
metformin + DPP-4 inhibitor is associated with a significantly lower risk of adverse cardiovascular events and all-cause mortality.[3]
Numerous randomized clinical trials involving sitagliptin / metformin have a strong evidence base that allows you to
comprehensively evaluate the hypoglycemic and non-glycemic effects, as well as the safety of use, especially in the group of
patients with heart failure-mean ejection fraction. Anti-atherosclerotic properties of DPP-4 inhibitors may be associated with anti-
inflammatory activity, improvement of endothelial function, and effects on lipid metabolism. In particular, while taking DPP-4
inhibitors in patients with type 2 diabetes, there was a decrease in the concentration of markers of systemic sluggish inflammation
(low grade inflammation), including C-reactive protein, interleukins 1β, 6 and 18, tumor necrosis factor α, secretory phospholipase
A2, macrophage activation marker sCD163.[1,5]
MATERIAL AND RESEARCH METHODS
A total of 60 patients with coronary artery disease and 2 patients with concomitant diabetes aged 30 to 70 years were examined.
Patients of the main group (n-50) were divided into 2 groups depending on the ejection fraction (EF).
The first group - with an average ejection fraction (HF aEF -40-49%) - n-17.
The second group - with preserved ejection fraction (HFpEF ≥50%) n- 33.
Work with each patient included: questioning (complaints, anamnesis), physical examination (measurement of height and body
weight of the patient with calculation of BMI, as well as examination of the cardiovascular, respiratory, digestive, urinary and
endocrine systems). Paraclinical examination included: general analysis of blood and urine, biochemical blood analysis, ECG,
echocardiographic examination of the heart, HMECG, daily monitoring of blood pressure, questionnaires using the Moirsky-Green
questionnaires to assess adherence.
RESEARCH RESULTS
In the whole sample, the mean experience of DM-2 did not differ between the groups and amounted to 10.05±0.59 and 9.5±0.81
years; according to the number of patients who underwent AMI 7 and 5 (χ2=0.18); PCI 7 and 7 (χ2=0); the mean age of patients
was 59.3±1.4 and 62.4±2.3 years (P=0.5) in the groups with HF aEF and HF pEF, respectively.
To correct the lipid spectrum, patients were prescribed fixed doses (10-20 mg/day) of rosuvastatin from the moment of admission
(many patients were already taking a statin). Statin therapy was prescribed for the entire observation period with compliance
control.
Monitoring of the patients' condition (clinical and instrumental data, indicators of lipid and carbohydrate metabolism) was carried
out at admission and after 1 year of follow-up.
Analysis of the studied indicators depending on the achievement of target levels of LDL cholesterol showed the following. The
number of patients who reached the target level of LDL-C was higher in the HFaEF group and amounted to (n-9; 53%) versus (n-
12; 36%) in the HFpEF group. Although some patients were already initially at the achieved target level, and continued to take
statins at the same dose.
According to the analysis of lipid spectrum indicators (Table 3.3.1), in patients with HFaEF, the average values of TC were: in the
initial state 129±12.17 mg/dL; after a year of observation 110.5±9.92 mg/dl (in relation to the initial state t= 1.177; P=0.09); and
in the comparison group with HFpEF: at the beginning of the observation 193.75±9.38 mg/dl; after a year of observation
144.83±1.42 mg/dl (in relation to the initial state t= 5.150; P=0.01). That is, the severity of the decrease in the level of total
cholesterol was determined by the level of cholesterol at the beginning of the observation. And the difference in reduction was
18.5±3.69 mg/dL (HFaEF) VS 48.91±7.96 mg/dL (t=-3.46589900; P=0.04).
Comparing the parameters of LDL cholesterol in the analyzed subgroups, we see the following features. In the group of patients
with HFmean LDL EF decreased from 54±11.04 mg/dl to 39.75±7.52 mg/dl (t= -1.066; P=0.5) (t= -2.820; P=0 .04), in the HF HF
group from 82.75±15.10 mg/dl (t= -1.183; P=0.5) to 64.16±4.28 mg/dl (t= -1.183; P= 0.5). Despite a significant difference in the
level of reduction between groups (t=2.820; P<0.05). Although this difference was not significant in terms of Δ reduction in LDL-C
and amounted to 18.58±10.81 in the group with HF and 14.25±5.02 mg/dL (t=-0.363; P>0, 5).
A similar situation is repeated with the content of triglycerides. Initially, the initial levels of triglycerides differed in subgroups and
in the group with HFpEF was significantly higher than in the group with HFaEFF was 220.83±4.89 mg/dl versus 167.33±19.44 mg/dl

Relationships Between the Achieved Target Levels of LDL Cholesterol and the State of Various Types of LV EF in
Patients with Coronary Artery Disease and Type 2 Diabetes.
IJMRA, Volume 5 Issue 05 May 2022 www.ijmra.in Page 973
(t=-2.667; P=0.04). A distinctive feature is the degree of severity of the level of TG.Аналогичная ситуация повторяется и с
содержанием триглицеридов. A distinctive feature is the degree of severity of the level of TG. In the group of patients with the
target level of LDL-C with HF pEF, the decrease in TG was pronounced and amounted to 202.66±0.61 mg/dL (t= - 3.679; P<0.05),
compared with the decrease in TG in the subgroup with HFaEF 164.55±18.93 mg/dL (t=-0.102; P=0.5). But according to the degree
of decrease in the difference in ΔTG in the group with HF aEF, there was no decrease in TG 2.77±11.42 mg/dL (t=-2.667; P=0.04),
in comparison with the group of HF pEF 18.16±5, 51 mg/dL (t=-1.213; P=0.4). Perhaps the results obtained can be explained by a
decrease in the level of PPG in this subgroup (HF pEF), because they are interconnected.
The eGFR indices in the subgroups did not change for the worse, and were before and after treatment in the HF aEF and HF pEF
groups, respectively: 66.9±8.32 vs 61.8±5.72 and 69±8.57 vs 74±2 .04.
Biochemical parameters depending on the achievement of target levels of LDL-C (70 mg/dl) in patients with coronary artery
disease with DM 2 with HF aEF and HF pEF before and after treatment (M±m).
*P<0.05; ** P<0.01, *** P<0.001 between baseline and stage of therapy in the analyzed groups.
CONCLUSION
The increase in blood sugar and lipid index was an interrelated process, and in both groups a positive change in lipid profile was
noted as a result of the pleiotropic effect of the drug metformin. In the 1st group 9 (52.9%) and in the 2nd group 12 (36%) patients
reached the target level for CHLDLP. CHVLDP and TG in the HF pEF group decreased significantly after treatment compared with
the HF aEF group. Blood sugar levels also dropped significantly. Changes in the parameters of the lipid spectrum in patients with
HF pEF do not depend on the state of carbohydrate metabolism compensation. While in the group of patients with HF aEF content
is 1.3 times lower, especially at the final stage (t=3.061; P=0.003), the CHLDLP in the outcome is 1.6 and after treatment is 2.1
times lower in terms of compared with the group of heart failure with pEF, especially in decompensated patients with the same
doses of statins and sitagliptin / metformin.
The combination of sitagliptin/metformin in the regimen of hypoglycemic therapy in patients with type 2 diabetes is well tolerated
by patients and did not cause hypoglycemia.
REFERENCES
1) Diabetes mellitus and cardiovascular diseases // Edited by Ametov A.S., Kurochkin I.O.
2) Ametov A.S., Pakus E.N. Efficacy and safety of the combination of metformin and sitagliptin in the treatment of patients
with type 2 diabetes mellitus with obesity // Diabetes Mellitus 2010. No. 3. C. 62–65.
СН ср ФВ (n-9) СН с ФВ (n-12)
Indicators До лечения После лечения До лечения После лечения
Total cholesterol, mg/dl 141,7±18,7 116±9,58## 193±9,38 144±1,42**
CHLDP, mg/dl 68,4±17,4 43,5±7,64## 82,7±15,1 64,1±4,28
CHHDL,mg/dl 32±2,81 37±3,31 31,9±3,67 35,6±1,02
CHVLDP, mg/dl 32,8±3,54 32±3,75### 77,5±1,02 63±0,61**
TG, mg / dL 167±19,4 164±18,9# 220±4,89 202±0,61**
GFR,ml/min/1.73m ² 66,9±8,32 61,8±5,72 69±8,57 74±2,04
PCI, (number) 7 7 0(χ2)
PICS, (number) 7 5 0,18(χ2)
DM (years) 10,5±0,59 9,5±0,81
Дозы С/М, мг 61,1/705,5±
7,34/82,6
61,1/705,5±
7,34/82,6
62,5/850±
10,2/30,61
54,1/850±
10,2/30,61
Doses S/M, mg 18,8±2 19,4±0,55 19,7±4,26 17,9±2,04
Fasting blood glucose, mmol/l 8,6±0,42 7,57±0,42* 11,1±0,75 9±0,97
Postprandial blood glucose,
mmol/l
13,6±1,26 10,3±0,52 14,8±2,24 11,6±1,95*
HbA1,% 7,64±0,59 7,28±0,22## 9,8±0,64 8,35±0,31*

Relationships Between the Achieved Target Levels of LDL Cholesterol and the State of Various Types of LV EF in
Patients with Coronary Artery Disease and Type 2 Diabetes.
IJMRA, Volume 5 Issue 05 May 2022 www.ijmra.in Page 974
3) Algorithms of specialized medical care for patients with diabetes mellitus / Edited by I.I. Dedova, M.V. Shestakova, A.Yu.
Mayorova. – 9th edition (updated). – M.; 2019. P. 214. DOI: 10.14341/DM221S1
4) Rustamova M.T., Salaeva M.S., Salimova N.D., Nurmatov D.Kh. Influence of risk factors for the development of renal
dysfunction in patients with stable angina on the background of type II diabetes mellitus // Bulletin of the Association of
Physicians of Uzbekistan, Tashkent. 2020. S. 16-19
5) Kubota A, Maeda H, Kanamori A, Matoba K, Jin Y, Minagawa F, et al. Pleiotropic effects of sitagliptin in the treatment of
type 2 diabetes mellitus patients. J Clin Med Res 2012; 4:309-13.
6) Sesti G, Avogaro A, Belcastro S, Bonora BM, Croci M, Daniele G, et al. . Ten years of experience with DPP-4 inhibitors for
the treatment of type 2 diabetes mellitus. Acta Diabetol. (2019) 56:605–17. 10.1007/s00592-018-1271-3
7) Gallwitz B. Novel therapeutic approaches in diabetes. Endocr Dev. (2016) 31:43–56. 10.1159/000439372
8) Deacon CF, Holst JJ. Dipeptidyl peptidase-4 inhibitors for the treatment of type 2 diabetes: comparison, efficacy and safety.
Expert Opin Pharmacother. (2013) 14:2047–58. 10.1517/14656566.2013.824966
9) Gerich JE. Contributions of insulin-resistance and insulin-secretory defects to the pathogenesis of type 2 diabetes mellitus.
Mayo Clinic Proc. (2003) 78:447–56. 10.4065/78.4.447
10) Creutzfeldt W. The incretin concept today. Diabetology. (1979) 16:75–85. 10.1007/BF01225454
11) Nauck MA, Meier JJ. Incretin hormones: their role in health and disease. Diabetes Obes Metab. (2018) 20(Suppl 1):5–21.
10.1111/dom.13129
12) Sesti G, Avogaro A, Belcastro S, Bonora BM, Croci M, Daniele G, et al. . Ten years of experience with DPP-4 inhibitors for
the treatment of type 2 diabetes mellitus. Acta Diabetol. (2019) 56:605–17. 10.1007/s00592-018-1271-3
There is an Open Access article, distributed under the term of the Creative Commons
Attribution – Non Commercial 4.0 International (CC BY-NC 4.0)
(https://creativecommons.org/licenses/by-nc/4.0/), which permits remixing, adapting and
building upon the work for non-commercial use, provided the original work is properly
cited.

INTERNATIONAL JOURNAL OF MULTIDISCIPLINARY RESEARCH AND ANALYSIS
ISSN(print): 2643-9840, ISSN(online): 2643-9875
Volume 05 Issue 05 May 2022
DOI: 10.47191/ijmra/v5-i5-14, Impact Factor: 6.261
Page No. 975-982
IJMRA, Volume 5 Issue 05 May 2022 www.ijmra.in Page 975
The Network EPES8–2
Abdumannon Kodirjonovich Jumakulov
Lecturer, Kokand branch of Tashkent state technical university ABSTRACT: The article presents the EPES8–2 network with two round functions using the same algorithm for encryption and
decryption.
KEYWORDS: Feystel network, Lai-Massey scheme, encryption, decryption, round keys, round functions.
INTRODUCTION
Currently, block encryption algorithms based on the Feystel network are widely used. Block encryption algorithms based on the
Feystel network include encryption algorithms such as DES, GOST 28147-89, as well as block encryption algorithms such as CAST-
256, DFC, E2, LOKI97, which participated in the competition announced by NIST. The advantage of this network is that a single
algorithm is used for encryption and decryption, only the encryption round keys are used in reverse order for decryption.
Encryption and decryption processes of the Feistel network can be expressed by the following formulas:
niKRFLR
RL
iiii
ii...1,
),( 11
1
(1) 1...,
),(1
1ni
KLFRL
LR
iiii
ii
(2)
The PES [7] block encryption algorithm was developed in 1990 and is based on the Lai-Massey scheme. In 1991, the
authors modified this block encryption algorithm and named it IDEA [8]. In these block encryption algorithms, round keys
1216 are multiplied by the module on the part blocks, 162 added by the module, and in MA transformation, 1216
modular multiplication, 162 module addition operations are used, i.e. not used operations such as shift, substitution with S-box,
etc. However, a single algorithm is used in encryption and decryption, as well as encryption round keys are used in reverse order
in decryption, just like the Feistel network. The IDEA NXT block encryption algorithm is based on the extended Lai-Massey
scheme developed by P. Junod, S. Vaudenay. Later, the IDEA NXT algorithm came to be known as FOX [9]. Using the structure of
the PES block encryption algorithm, networks with round function PES4–2, PES8–4, PES32–16 and PES2m–m were created [1-6].
In this article based on the structure encryption algorithm PES the EPES8–2 (extended PES) network was developed,
which consists of eight subblocks and two round functions.
NETWORK STRUCTURE
In the proposed EPES8-2 network, the operations (mul), (add) ва (xor) can be used as operations z0, z1, z2, z3. Here –
multiplication of 32 (16, 8) bit blocks by module 1232 ( 1216 , 128 ), – addition of 32 (16, 8) bit blocks by module 322 (
162 ,82 ) and – addition of 32 (16, 8) bit blocks by XOR. It is possible to create block encryption algorithms with a block length
of 256 bits when the length of the subblocks of the network is 32 bits, 128 bits with a block length of 16 bits, and 64 bits with a
block length of 8 bits. The network encryption formula (3) and the functional scheme are shown in Figure 1.

The Network EPES8–2
IJMRA, Volume 5 Issue 05 May 2022 www.ijmra.in Page 976
0
5)1(102
5
1
7
10
4)1(102
4
1
6
0
7)1(103
7
1
5
10
6)1(103
6
1
4
0
1)1(100
1
1
3
10
)1(100
0
1
2
0
3)1(101
3
1
1
10
2)1(101
2
1
0
))((
))((
))((
))((
))((
))((
))((
))((
iiii
iiiii
iiii
iiiii
iiii
iiiii
iiii
iiiii
TKzXX
TTKzXX
TKzXX
TTKzXX
TKzXX
TTKzXX
TKzXX
TTKzXX
, ni ...1
))((
))((
))((
))((
))((
))((
))((
))((
7103
77
1
6103
66
1
5102
55
1
4102
44
1
3101
33
1
2101
22
1
1100
11
1
100
00
1
nnn
nnn
nnn
nnn
nnn
nnn
nnn
nnn
KzXX
KzXX
KzXX
KzXX
KzXX
KzXX
KzXX
KzXX
, in the output transformation
(3)
where 10 , ii TT round functions are described in the following formulas:
))),()(())()((( 8)1(106)1(103
6
14)1(102
4
12)1(101
2
1)1(100
0
10
0
iiiiiiiiii KKzXKzXKzXKzXFT ,
))),()(())()((( 9)1(107)1(103
7
15)1(102
5
13)1(101
3
11)1(100
1
11
1
iiiiiiiiii KKzXKzXKzXKzXFT
In the network EPES8–2 the length of round keys )1(10 iK , 1)1(10 iK ,…, 7)1(10 iK , 1...1 ni , the input and output
bits of round functions 0F , 1F is equal (16, 8) bits. The length of round keys 8)1(10 iK , 9)1(10 iK , ni ...1 optional to 32
(16, 8) bits.

The Network EPES8–2
IJMRA, Volume 5 Issue 05 May 2022 www.ijmra.in Page 977
Figure 1. The scheme of EPES8–2 network
In W transformation in each round the subblocks 0
1iX and 2
1iX , 1
1iX and 3
1iX , 4
1iX and 6
1iX , 5
1iX and 7
1iX will
replaced between themselves. Based on the replacement of subblocks, each variants of networks EPES8–2 can be build. The
networks represented in fig.1 accept as first variants,
–only subblocks 0
1iX ва 2
1iX , 4
1iX ва 6
1iX , ni ...1 replaced, as second variant
–subblocks not replaced, as third variant,
– only subblocks 1
1iX ва 3
1iX , 5
1iX ва 7
1iX , ni ...1 replaced, as fourth variant can be accepted as a network.

The Network EPES8–2
IJMRA, Volume 5 Issue 05 May 2022 www.ijmra.in Page 978
Figure 2. The scheme of second variant EPES8–2 network

The Network EPES8–2
IJMRA, Volume 5 Issue 05 May 2022 www.ijmra.in Page 979
Figure 3. The scheme of third variant EPES8–2 network

The Network EPES8–2
IJMRA, Volume 5 Issue 05 May 2022 www.ijmra.in Page 980
Figure 4. The scheme of fourth variant EPES8–2 network
KEYS GENERATION
n n rounded EPES8–2 network, in each round applied 10 round keys and in the output transformation applied 8 round keys,
i.e. the total number of round keys is 810 n . In encryption, the basis of key K generating encryption round keys c
iK .
Decryption round keys d
iK are created based on encryption round keys c
iK . In encryption process in Figure 1 and formula (3),
uses an encryption round key c
iK instead of iK and decryption process uses a decryption round key
d
iK , i.e. a single
algorithm is used for encryption and decryption, only the order of the round keys. The n-round EPES8–2 network in all variants
The first, second and n-round decryption round keys are associated to the encryption round keys as follows:

The Network EPES8–2
IJMRA, Volume 5 Issue 05 May 2022 www.ijmra.in Page 981
....1),,,)(,)(
,)(,)(,)(,)(,)(,)((
),,,,,,,,,(
9)(108)(107)1(106)1(10
5)1(104)1(103)1(102)1(101)1(10)1(10
9)1(108)1(107)1(106)1(105)1(104)1(103)1(102)1(101)1(10)1(10
33
221100
niKKKK
KKKKKK
KKKKKKKKKK
c
in
c
in
zc
in
zc
in
zc
in
zc
in
zc
in
zc
in
zc
in
zc
in
d
i
d
i
d
i
d
i
d
i
d
i
d
i
d
i
d
i
d
i
(4)
If z0, z1, z2, z3 applied as operations, then 1 KK , operations are applied, then KK and are applied, then
KK , here 1K – multiplication inversion K by modulo 1232 ( 1216 , 128 ), – K - additive inversion K by modulo
322 (162 ,
82 ). For 32 bit numbers )12mod(1 321 KK , 16 bit numbers )12mod(1 161 KK , 8 bit numbers
)12mod(1 81 KK and K K =0, 0KK .
The decryption round keys of the output transformation are associated with encryption round keys as follows:
).)(,)(,)(,)(,)(
,)(,)(,)((),,,,,,,(
33221
100
76543
21071061051041031021011010
zczczczczc
zczczcd
n
d
n
d
n
d
n
d
n
d
n
d
n
d
n
KKKKK
KKKKKKKKKKK (5)
RESULTS
In article on the basis of the encryption algorithm PES developed EPES8–2 network. In developed network as round function can
choose any transformation, including one-way functions. Because when decryption no need to calculate inverse round
functions. The advantage of the developed networks is that the encryption and decryption using the same algorithm. It gives
comfort for creating hardware and software-hardware tools.
In addition, as the round function using the round function of the existing encryption algorithms for example, encryption
algorithms based on Feistel networks, you can develop these algorithms on the basis of the above networks.
REFERENCES:
1) Aripov M.M., Tuychiev G.N. PES8–4 network consisting of four rounds of functions // Proceedings of the International
Scientific Conference "Actual Problems of Applied Mathematics and Information Technology - Al-Khwarizmi 2012",
collection № II. - Tashkent. 2012, 16–19 p.
2) Tuychiev G.N. PES4–2 network consisting of two rounds of functions // Journal of Informatics and Energy Problems
journal of Uzbekistan, –Tashkent, 2013. №5–6, 107–111 p. (05.00.00, №5).
3) Tuychiev G.N. About PES4–1, RFWKPES4–2, PES4–1 networks created on the basis of PES4–2 network // Informatics
and Energy Problems jounal of Uzbekistan. – Tashkent, 2015. №1–2, 100–105 p. (05.00.00, №5).
4) Tuychiev G.N. About RFWKPES8–4, RFWKPES8–2, RFWKPES8–1 networks created on the basis of PES8–4 network //
Collection of reports of the international conference “Actual problems of applied mathematics and information
technologies – Al-Khwarizmi 2014”, collection № 2, –Samarkand. 2014, 32–36 p.
5) Tuychiev G.N. About RFWKPES32–16, RFWKPES32–8, RFWKPES32–4, RFWKPES32–2 and RFWKPES32–1 networks
created on the basis of PES32–16 network // “Information security in the field of communication and information.
Problems and ways to solve them”, Republican seminar collection of reports and abstracts. – Tashkent, 2014.
6) Tuychiev G.N. On the PES2m–m network consisting of m round functions and its modification // Security of
Information. –Kyiv, 2015. Volume 21. No. 1. 52–63 p.
7) Lai X., Massey J.L. A proposal for a new block encryption standard. Advances in Cryptology - Proc. Eurocrypt’90, LNCS
473, Springer – Verlag, 1991, 389–404 p.
8) Lai X., Massey J.L. On the design and security of block cipher. ETH series in information processing, v.1, Konstanz:
Hartung–Gorre Verlag, 1992.
9) Junod, P., Vaudenay, S.. FOX: a new family of block ciphers. In 11th Selected Areas in Cryptography (SAC) Workshop,
LNCS 3357, pages 114–129. Springer–Verlag.
10) Akbarov D.E., Umarov Sh.A. Working out the new algorithm enciphered the data with a symmetric key. //Siberian
Federal University. Engineering & Technologies. 2016, 9(2), 214-224 p, DOI: 10.17516/1999-494x-2016-9-2-214-224.
11) Akbarov D., Umarov Sh. Mathematical characteristics of application of mathematical characteristics of logical
operations and table substitution in cryptographic transformations. //Scientific-technical journal: 2021, V.4, №2 pp 6-
14.

The Network EPES8–2
IJMRA, Volume 5 Issue 05 May 2022 www.ijmra.in Page 982
12) Abdurakhmonova, M. M., ugli Mirzayev, M. A., Karimov, U. U., & Karimova, G. Y. (2021). Information Culture And
Ethical Education In The Globalization Century. The American Journal of Social Science and Education Innovations, 3(03),
384-388.
13) Akbarov D. E. Umarov Sh. A.(2020). Applying Logical Operations and table replacements in modeling basic
transformations of Symmetric block encryption algorithms //International Journal of Mechanical and Production
Engineering Research and Development. – Т. 10. – №. 3. – С. 15041-15046.
There is an Open Access article, distributed under the term of the Creative Commons
Attribution – Non Commercial 4.0 International (CC BY-NC 4.0)
(https://creativecommons.org/licenses/by-nc/4.0/), which permits remixing, adapting and
building upon the work for non-commercial use, provided the original work is properly cited.

INTERNATIONAL JOURNAL OF MULTIDISCIPLINARY RESEARCH AND ANALYSIS
ISSN(print): 2643-9840, ISSN(online): 2643-9875
Volume 05 Issue 05 May 2022
DOI: 10.47191/ijmra/v5-i5-15, Impact Factor: 6.261
Page No. 983-993
IJMRA, Volume 5 Issue 05 May 2022 www.ijmra.in Page 983
ICT Skills, E-Supervision Scheme of School Heads, And Teacher
Development in Distance Learning Among Selected Private Schools in
Cainta
Ruel G. Gerona1, Susana C. Bautista2
1Wesleyan Academy, PHILIPPINES 2University of Perpetual Help System Laguna, PHILIPPINES
ABSTRACT: The study aimed at examining the interplay the relationship among the ICT skills, e-supervision scheme of school heads,
and teacher development in distance learning which longed to be a valuable undertaking in the time of pandemic where alternative
delivery mode of education is implemented; skills of school heads in Information and Communication Technology (ICT) have been challenged
and brought impact to their administrative and academic role. Descriptive-correlational design was employed. The study revealed that school
heads had very high ICT skills level in terms of utilization and competence, had very high e-supervision scheme level in terms of video
conferencing, instant messaging, and office suite, and very high level of teacher development in distance learning. Correlation
indicated that the higher the ICT skills level of school heads’ in terms of competence and utilization, the better is their e-supervision
scheme and teacher development in distance learning. In essence, these findings demonstrate importance to maintain the high-level
ICT skills, e-supervision scheme of school heads, and teacher development in distance learning, Similarly, data served as basis for a
training program to make the school heads’ skills level higher on the indicators that ranked last.
KEYWORDS: ICT Skills, E-supervision, Teacher Development, Distance Learning, Descriptive-correlational study, Philippines.
INTRODUCTION
UNICEF 2019 Annual Report: Information and Communication Technology Division stated that over the past two decades, the advent
of digital information and communication technologies (ICTs) has expanded and spread rapidly [1]. Notably, the integration of ICT into
education has become a process whose implications go far beyond the technological tools nurturing the educational environment [2].
Specifically, ICT integration in basic education classrooms in the Philippines has been progressively embraced and has brought impacts
on the technical core, administrative tasks, and innovative processes in schools. Without a doubt, ICT has become essential in teaching
and learning in classrooms, in educational management, and in improving the functional effectiveness of school systems [3]. The
application of ICT in school administration is indeed a necessity and worthwhile venture especially in this era of globalization.
From the above-mentioned premises, it depicts that ICT skills are an indispensable skill of a school head to facilitate an e-
supervision scheme in the implementation of curriculum during distance learning. ICT offers unprecedented opportunities to the
education systems with its capacity to integrate, enhance and interact with each other over a wide geographic distance in a meaningful
way to achieve the learning objectives [4]. The studies made by Eremie and Agi [5], and Ibrahim, Adu-Gyamfi, and Kasim [6] identified
the ICT skills needed by principals and application tools relevant to school administration which enhance efficient management of
educational resources and gives direct effect on improving the effectiveness of administrative functions of an institution. Hence,
leading through this uncertain time requires leadership that is flexible and can adapt to changing circumstances [7]. The transformation
of the practice of supervision in schools should be implemented so as to produce a positive impact on teachers [8]. Meanwhile, in the
study of Lapid [9], and Iroegbu and Eyo [10] explained the objective of supervision in an online environment which serves as a
mechanism to evaluate and validate teachers’ performance towards the achievement of school goals, aims and objectives. However,
the principals experienced several obstacles in conducting online-based academic supervision due to the absence of standard

ICT Skills, E-Supervision Scheme of School Heads, And Teacher Development in Distance Learning Among Selected Private Schools in Cainta
IJMRA, Volume 5 Issue 05 May 2022 www.ijmra.in Page 984
applications provided by the government to facilitate the process of supervision [11]. Also, the extent of their application is very slow
as school administrators are incompetent in handling ICT facilities for the effective administration of schools [12]. Further, the COVID-
19 pandemic brought about an alternative delivery mode of education utilizing ICT, challenging school heads to a greater extent for
their administrative and supervisory role.
Teacher development on the other hand creates readiness and effective delivery of distance learning. Wilichowski and Cobo
explained the importance of developing teachers’ pedagogical skills which is needed to critically assess and decide when and how to
incorporate digital tools, and realistically define their impact to support or enhance learning [13]. Teachers need specific professional
development opportunities in order to increase their ability to use ICT for formative learning assessments, individualized instruction,
accessing online resources, and fostering student interaction and collaboration [14]. Remarkably, in the study of Kim and Lee [15],
they explained that principals can have more impact on teacher development by formally arranging opportunities and resources for
teachers’ collaborative learning. Principals need to devise professional improvement programs to help teachers implement digital
teaching practices [16]. It is therefore recommended to provide more training in the context of technology during distance education
[17]. Consequently, in the study of Gustafson & Haque [18] stated that professional development could actually be easier in a virtual
school however professional development on best practices in online teaching was actually very limited. Thus, the British Council [19]
found out that teacher educators and teachers feel they need more training and support in how to teach online. This study aimed to
determine the level and relationship of the ICT skill, e-supervision scheme of school heads, and teacher development in distance
learning. The findings of the study may serve as guide in the enhancement of school heads’ ICT skills, online supervision, and
implementation of teacher development in distance learning.
METHODS
The study used descriptive-correlational research design since it determined the level of ICT skills, level of the e-supervision scheme
of school heads, and level of teacher development in distance learning among selected private schools in Cainta of Academic Year
2021-2022. Likewise, it determined the relationship that exist among variables and their correlations. Data used in the investigation
came from 174 teachers of five private schools in Cainta of Academic Year 2021-2022. Out of 174 teachers, Raosoft Calculator was
used arriving at 120 sample respondents who were given research instruments through Google Form. All the respondents were able
to accomplish and return the completed survey questionnaire, representing 100 percent retrieval rate.
The researcher used a survey questionnaire with three parts. Part 1 dealt with the level of ICT skill of the school head. Part 2 pertained
to the level of the e-supervision scheme of the school head. Part 3 covered the level of teacher development in distance learning. All
parts of the questionnaire were measured using the four-point Likert Type Scale: Strongly Agree (3.25-4.00), Agree (2.50-3.24),
Disagree (1.75-2.49), Strongly Disagree (1.00-1.74). Notably, the researcher personally wrote a letter to the Schools Division
Superintendent for her approval to conduct the study. Afterwards, the researcher sought permission to the school heads among
selected private schools in Cainta for the distribution of research instrument through Google Form. After gaining permission, link to
the survey questionnaire were distributed to respondents through their respective school head. To make sure that data gathered were
precisely treated; weighted mean was used to describe the school heads’ ICT skills in terms of competence and utilization, e-
supervision scheme of school heads in terms of instant messaging, office suite and videoconferencing, and teacher development in
distance learning. Pearson r Moment Correlation Coefficient was utilized to determine the significant relationship between the school
heads’ ICT skills and e-supervision scheme, ICT skills of school heads and teacher development, and e-supervision scheme of school
heads and teacher development.
RESULTS AND DISCUSSION
Discussion of the ICT skills, e-supervision scheme of school heads, and teacher development in distance learning is presented in the
succeeding tables and textual presentation.
It is depicted in Table 1 that school heads got a very high overall weighted mean of 3.46 as the respondents strongly agreed with the
indicators of their ICT skills in terms of competence. It implies that they are competent in providing an ICT driven educational
environment and learning communities. This finding is aligned with the statement of Leong, Chua, & Sathiamoorthy [20] that principals
stay abreast of emerging trends regarding effective use of technology; model and promote effective communication and collaboration
among school communities using ICT; and encourage evaluation of new technologies potential to improve student learning. It depicts

ICT Skills, E-Supervision Scheme of School Heads, And Teacher Development in Distance Learning Among Selected Private Schools in Cainta
IJMRA, Volume 5 Issue 05 May 2022 www.ijmra.in Page 985
that school heads competence as postulated by Griffin, McGraw, & Care (cited in Al-Khateeb) [21] involves (digital) skills which exceed
searching for information online, and includes more demanding services and advanced expertise such as problem-solving, sharing,
and collaborating with peers. However, it debunks Abraham et.al [22] observation that the principal's knowledge of ICT is basic with
the goal that systems can be set up to make organizational procedures progressively effective, including the work of faculty to oversee
and direct the ICT foundation.
Table 1. ICT Skills Level of School Heads in Terms of Competence
Indicators Weighted
Mean
Categorical
Response
Verbal
Interpretation
1. demonstrates the use of technological
tools, online applications, or software 3.54 Strongly Agree Very High
2. solves technological issues
encountered by teachers 3.37 Strongly Agree Very High
3. implements technology-infused
organizational procedures 3.48 Strongly Agree Very High
4. evaluates teacher competence in an
online platform 3.47 Strongly Agree Very High
5. provides technology learner-centered
environment to meet the diverse need
of learners
3.51 Strongly Agree Very High
6. facilitates learning sessions to
update teachers’ digital skills 3.39 Strongly Agree Very High
Overall Weighted Mean 3.46 Very High
From the data shown in Table 2, school heads got a very high overall weighted mean of 3.70 as the respondents strongly agreed with
the indicators of their ICT skills in terms of utilization. This suggests that they utilize information and communication technologies in
their administrative and supervisory functions. Likewise, it confirms that principals utilize information technology to acquire
information to analyze existing situations, identify problems in school, facilitate communication between and among stakeholders,
evaluate the desirability and feasibility of policy options, and access online schools’ historical records to evaluate current performance
[23]. It also conforms with the study of Abraham et.al [22] that principals had high proficiency in the usage of the following ICT
materials; internet for accessing the information on the computer, email to communicate with colleagues, family, and friends,
computer for performing assignments, computer for keeping records/data, computer for making a presentation, computer for
teaching, browse on the internet using different websites, projector for doing presentations, Microsoft word, excel, and PowerPoint
for document preparation. Moreover, the data supports the study of Barrido and Abadiano [24] that academic heads have very high
utilization of ICT application tools because as academic heads, they encouraged the use of PowerPoint during instruction, applied
PowerPoint presentation in giving instruction, and in the conduct of in-house training, applied ICT applications to prepare the school,
teacher and staff meetings, announcements and reports, and being an academic head they have the basic skills of using ICT in school
daily administrative and management job.
Table 2. ICT Skills Level of School Heads in Terms Utilization
Indicators Weighted
Mean Categorical Response
Verbal
Interpretation
1. communicates or sends feedback
through several online
communication tools such as e-mail,
messenger, etc.
3.67 Strongly Agree Very High
2. disseminates information through 3.72 Strongly Agree Very High

ICT Skills, E-Supervision Scheme of School Heads, And Teacher Development in Distance Learning Among Selected Private Schools in Cainta
IJMRA, Volume 5 Issue 05 May 2022 www.ijmra.in Page 986
several online communication tools
such as e-mail, messenger, Viber, etc.
3. collaborates to create academic plans
using office suite or productivity
applications like online spreadsheets,
Google Docs, Slides, etc.
3.66 Strongly Agree Very High
4. conducts meetings, orientations, and
workshops via an online platform
like Zoom, Google Meet, etc. with
the use of advanced features of the
communication tools used to enhance
the presentation
3.74 Strongly Agree Very High
5. supervises teaching-learning
processes via online platforms such
as Zoom, Google Meet, etc.
3.67 Strongly Agree Very High
6. shares documents and/or teaching
materials using cloud-based storage
solutions like Google Drive
3.68 Strongly Agree Very High
7. uses cloud-based storage solutions
like Google Drive in collecting
academic reports and learning
materials i.e. class records, learners’
profiles, learning plans, learning
videos, etc.
3.74 Strongly Agree Very High
Overall Weighted Mean 3.70 Very High
Table 3. Summary Table of School Heads’ ICT Skills
Indicators Weighted
Mean
Categorical Response Verbal Interpretation
1. Competence 3.46 Strongly Agree Very High
2. Utilization 3.70 Strongly Agree Very High
Overall Weighted Mean 3.58 Very High
The composite table presented in Table 3 reflects that the school heads have a very high level of ICT skills (mean = 3.58). It implies
that school heads are abreast in the use of different ICT tools and applications. The finding is in conformity with Hernandez [2]
statement that the integration of ICT into education has become a process whose implications go far beyond the technological tools
nurturing the educational environment. It strengthened the idea postulated by Tyagi et. al [25] that technical competence mainly
encompasses handling hardware and software, and application competence include the capability to handle and make use of ICT for
specific purposes, personal and professional applications. The finding is also related to the study of Barrido & Abadiano [26] which
stated that academic heads have very high utilization of ICT application tools during instruction, in giving instruction, and in the conduct
of in-house training, applied ICT applications to prepare the school, teacher and staff meetings, announcements and reports.
Table 4. School Heads’ E-Supervision Scheme
Indicators Weighted
Mean
Categorical
Response
Verbal
Interpretation
Instant Messaging
1. lesson plan review 3.30 Strongly Agree Very High

ICT Skills, E-Supervision Scheme of School Heads, And Teacher Development in Distance Learning Among Selected Private Schools in Cainta
IJMRA, Volume 5 Issue 05 May 2022 www.ijmra.in Page 987
2. assessment of online instructional
materials 3.46 Strongly Agree Very High
3. virtual classroom observation and
monitoring 3.54 Strongly Agree Very High
4. monitoring of learners’ needs,
progress, and achievements 3.53 Strongly Agree Very High
5. feedbacking, coaching, and/or
mentoring 3.42 Strongly Agree Very High
Average 3.44 Very High
Office Suite
1. lesson plan review 3.34 Strongly Agree Very High
2. assessment of online instructional
materials 3.48 Strongly Agree Very High
3. virtual classroom observation and
monitoring 3.50 Strongly Agree Very High
4. monitoring of learners’ needs,
progress, and achievements 3.45 Strongly Agree Very High
5. feedbacking, coaching, and/or
mentoring 3.38 Strongly Agree Very High
Average 3.43 Very High
Video Conferencing
1. lesson plan review 3.38 Strongly Agree Very High
2. assessment of online instructional
materials 3.47 Strongly Agree Very High
3. virtual classroom observation and
monitoring 3.58 Strongly Agree Very High
4. monitoring of learners’ needs,
progress, and achievements 3.53 Strongly Agree Very High
5. feedbacking, coaching, and/or
mentoring 3.51 Strongly Agree Very High
Average 3.50 Very High
Overall Weighted Mean 3.46 Very High
It can be gleaned from table 4 that school heads got a very high overall weighted mean of 3.46 as the respondents strongly agreed
with the indicators of the school heads e-supervision scheme. Specifically, it showed that the respondents strongly agreed that the
school heads have e-supervision scheme in terms of instant messaging (mean = 3.44), office suite (mean = 3.43), and video
conferencing (mean = 3.50). This means that school heads are capable of using different electronic modes of supervision for curriculum
implementation. Specifically, this study agrees with Cha, Kim, Park, Yi, & Lee [27] findings that instant messaging is primarily used for
relationship maintenance purposes, such as planning, coordinating, sharing, discussing, and reflecting on everyday activities. Also, it
coincides with the suggestion of Mutter & Marescaux (as cited in Byrnes, Kiely, Dunne, McDermott, Coffey) [28] that video
conferencing technology may be applied to a range of academic activities, including teaching sessions, large group webinars,
examinations, research meetings, and academic conferences. They noted that supervisors would engage in conversations with the
teachers in the videos, not just disseminate information. By engaging in instructional supervision conversations through the video
channel, the teachers felt like they were not just being told information but having authentic conversations [29].

ICT Skills, E-Supervision Scheme of School Heads, And Teacher Development in Distance Learning Among Selected Private Schools in Cainta
IJMRA, Volume 5 Issue 05 May 2022 www.ijmra.in Page 988
Table 5. Teachers’ Development in Distance Learning
Indicators Weighted
Mean
Categorical
Response
Verbal
Interpretation
1. teacher development is a
school-based activity conducted by
the school head or a resource speaker
3.52
Strongly Agree
Very High
2. teacher development are sourced
from webinars 3.48
Strongly Agree Very High
3. teacher development topics are
directed by the school head 3.43
Strongly Agree Very High
4. teacher development provided to
improve teachers’ technology
teaching practices
3.55
Strongly Agree
Very High
5. teacher development given is on
pedagogical approaches for distance
learning
3.55
Strongly Agree
Very High
6. teacher development prepared are for
designing learning activities for
online instruction
3.58
Strongly Agree
Very High
7. teacher development provided focus
on creating distance learning materials 3.56
Strongly Agree Very High
8. teacher development given is for
effective learning assessment
during distance learning
3.55
Strongly Agree
Very High
9. workshops are conducted in an online
platform like Google Meet during
teacher development
3.42
Strongly Agree
Very High
10. teacher development is done
through video conferencing 3.51
Strongly Agree Very High
Overall Weighted Mean 3.51 Very High
It is depicted in Table 5 that the implementation of teachers’ development in distance learning got a very high overall weighted mean
of 3.51 as the respondents strongly agreed with the indicators. The finding further illustrates that professional development to develop
teachers’ necessary skills in carrying out their role are implemented during distance learning. The findings of the study are much
related to Sadler et. al [30] observation from their facilitated teacher professional development project in the midst of the COVID-19
pandemic with the aim of collaboratively designing instructional activities to teach about COVID-19 using videoconferencing
technologies worked well. The ability to form smaller design teams and flow between full group sessions and small group workspaces
seemed to facilitate productivity. All of the teachers made substantive contributions to the development of novel curriculum materials.
Many researches, like those of Hamzah, Nasir, & Wahab [16] reveal that in a time of distance learning due to pandemics principals
need to devise professional improvement programs to help teachers implement digital teaching practices. Thus, the highest means of
professional development is institution professional development, i.e. webinars and online workshops [31].
Table 6. Relationship Between the School Heads’ ICT Skills and E-Supervision Scheme
Variables
ICT Skills
Competence Utilization
Instant Messaging
r=.698 (high correlation)
Instant Messaging
r=.724 (high correlation)

ICT Skills, E-Supervision Scheme of School Heads, And Teacher Development in Distance Learning Among Selected Private Schools in Cainta
IJMRA, Volume 5 Issue 05 May 2022 www.ijmra.in Page 989
E-supervision Scheme
p=.000
Decision: Null hypothesis rejected
Interpretation: Significant
p=.000
Decision: Null hypothesis rejected
Interpretation: Significant
Office Suite
r=.657 (high correlation)
p=.000
Decision: Null hypothesis rejected
Interpretation: Significant
Office Suite
r=.733 (high correlation)
p=.000
Decision: Null hypothesis rejected
Interpretation: Significant
Videoconferencing
r=.711 (high correlation)
p=.000
Decision: Null hypothesis rejected
Interpretation: Significant
Videoconferencing
r=.721 (high correlation)
p=.000
Decision: Null hypothesis rejected
Interpretation: Significant
Significant @ .01
As observed from the data in table 6, a high correlation was found between school heads’ ICT skills and e-supervision scheme,
specifically between competence and instant messaging (r=.698), office suite (r=.657) and videoconferencing (r=.711) and between
utilization and instant messaging (r=.724), office suite (r=.733) and videoconferencing (r=.721). It is worth noting that all p-values of
.000 were lower than the test of significance at .01 which revealed that there is significant relationship existed. The result showed that
the higher are the ICT skills level of the school heads in terms of their competence and utilization, the better is their e-supervision
scheme along with instant messaging, office suite and videoconferencing. This relationship can be explained with the premise that
the ICT knowledge acquired by the school head actuate effective application of ICT on the supervisory function in curriculum
implementation through the different technological platforms. This finding solidifies the idea revealed by Uğur & Koç [32] that
principals, as instructional leaders, who do not understand how to use technology cannot properly evaluate the use of it by teachers
for instruction and students for achievement. The ICT skills needed by principals include among others: knowledge of operating ICT
devices, good knowledge of using ICT devices in teaching, ability to use ICT devices to store and retrieve information. They also posited
that ICT skills enhance efficient management of educational resources through enhancing proper keeping of records, effective
communication, and proper accountability of educational resources among others [5]. However, it contradicts the observation of
Abraham et.al [22] that the principal's knowledge of ICT is basic with the goal that systems can be set up to make organizational
procedures progressively effective, including the work of faculty to oversee and direct the ICT foundation.
Table 7. Relationship Between the School Heads’ ICT Skills and Teacher Development
Significant @ .01
As disclosed in table 7, a high correlation was found between the school heads’ ICT skills and teacher development specifically between
competence and teacher development (r=.724) and utilization and teacher development (r=.699). Both the p-values of .000 were
lower than the test of significance at .01, leading to the rejection of the null hypothesis. This showed that the higher are the ICT skills
Variables
Statistical
Treatment
(Pearson r)
p-value Decision Interpretation
Competence and
Teacher Development
.724
(high
correlation)
.000 Null hypothesis
rejected Significant
Utilization and Teacher
Development
.699
(high
correlation)
.000 Null hypothesis
rejected Significant

ICT Skills, E-Supervision Scheme of School Heads, And Teacher Development in Distance Learning Among Selected Private Schools in Cainta
IJMRA, Volume 5 Issue 05 May 2022 www.ijmra.in Page 990
level of the school heads in terms of their competence and utilization, the better is the teacher development in distance learning. This
relationship can be explained by the modality used in delivery of teachers training in distance learning. It connotes that school heads
being abreast to different communication technologies positively ramifies the professional learning of teachers. As elucidated by N.,
Dzakpasu, and Amenyedze [33] that in this era of information, principals must incorporate ICT into their day-by-day practice and give
steady and positive leadership to technology use in the instructing learning process. School leaders should ensure that processes are
in place during professional development opportunities to support the diverse learning styles of teachers. By providing a variety of
learning options, districts can guarantee their teachers will have support and access to training, ownership of their learning, and the
ability to assess their technical skill levels [34]. Along this line, school heads ought to motivate a mutual vision for far-reaching
reconciliation of technology and cultivate a domain and culture helpful for the acknowledgment of that vision. Principals ought to
depict an enthusiastic responsibility for giving proper ICT proficient staff improvement for individual staff members [35]. Hence,
Cadiente, Acob, & Bagon [39] concurred in their study that literacy skills of school principals as a contributory factor may lead to
effective instruction and facilitate managerial functions in the school setting.
Contrary to the finding, it opposes the study of Apsorn, Sisan, & Tungkunanan [36] telling that even though school directors may be
effective and fine examples of how to plan and implement ICT for use by teachers and supporting staff, they are not necessarily experts
in using ICT, but need to give school teachers and staff knowledge and opportunities and establish a culture of ICT in order to shape
learning communities.
Table 8. Relationship Between the School Heads’ E-Supervision Scheme and Teacher Development
Variables
Statistical
Treatment
(Pearson r)
p-value Decision Interpretation
Instant Messaging and
Teacher Development
.741
(high
correlation)
.000 Null hypothesis
rejected Significant
Office Suite and
Teacher Development
.708
(high
correlation)
.000 Null hypothesis
rejected Significant
Videoconferencing and
Teacher Development
.794
(high
correlation)
.000 Null hypothesis
rejected Significant
Significant @ .01
Table 8 unveils a significant relationship between the respondents’ e-supervision scheme and teacher development, specifically
between instant messaging and teacher development (r=.741), office suite and teacher development (r=.708) and videoconferencing
and teacher development (r=.794), as evidenced by their obtained probability values of .000 which were lower than the test of
significance at .01. This showed that the better is the school heads’ e-supervision scheme in terms of instant messaging, office suite
and videoconferencing, the better is their teacher development. This relationship can be explained by the process of drawing
authentic information through an e-supervision scheme to determine the overall need of teachers in curriculum implementation that
might be included in the teacher development program. Kim & Lee [15] revealed that principals can have more impact on teacher
development by formally arranging opportunities and resources for teachers’ collaborative learning. Mentoring, peer observation,
and coaching activities are regarded as effective forms of professional development in that they rely on interactions and co-
development of expertise between teachers and focus on teachers’ individual needs to improve instructional practices. This finding
supported by what was stressed by Abdullaha, Sulongb, & Rahimc [37] that a high percentage of teacher trainees felt that using the
Google Classroom application was a good and effective e-supervision system that supported traditional supervision methods. Also, as
what Van Boxtel [38] had noted, a video-based remote supervision method in strategic implementation of an asynchronous video-
based remote supervision model is feasible and equally effective or preferred over traditional face-to-face observations by teacher
candidates and cooperating teachers for self-reflection, professional growth, and convenience.

ICT Skills, E-Supervision Scheme of School Heads, And Teacher Development in Distance Learning Among Selected Private Schools in Cainta
IJMRA, Volume 5 Issue 05 May 2022 www.ijmra.in Page 991
CONCLUSION AND RECOMMENDATION
The school heads are confident to claim that they manifest a very high level of ICT skills in terms of competence and utilization for it
makes them abreast with the use of instant messaging, office suite, and video conferencing for e-supervision scheme. Meanwhile,
teachers among selected private schools in Cainta had a very high level of teacher development in distance learning. Hence, it can be
viewed that the higher the ICT skills level of school heads the better is their e-supervision scheme and teacher development in distance
learning. The investigation, however, has some limitations particularly on the sample size which was used in the study since it was
only limited to the teachers among 5 selected private schools in Cainta during Academic Year 2021-2022. To have a better
generalization of the study, it is recommended to future researchers to conduct similar study considering a larger number of
respondents including school heads. Training program implementation is highly recommended to make the school heads’ skills level
higher on the indicators that ranked last.
REFERENCES
1) UNICEF (2019). 2019 Annual Report: Information and Communication Technology Division.
https://www.unicef.org/media/91061/file/ICTD-2019-HQAR.pdf
2) Hernandez, R.M.. (2017). Impact of ICT on Education: Challenges and Perspectives. Propósitos y Representaciones, 5(1), 325-
347. doi: http://dx.doi.org/10.20511/pyr2017. V5n1.149
3) Buenviaje J. T. (2019). Basic Education ICT for Governance, Finance, and School Improvement. In D. Ocampo & K. Lucasan
(Eds.), Key Issues in Governance, Finance, School Improvement, and ICT in Basic Education (pp. 16-23). Quezon City: UP Center
for Integrative and Development Studies. https://www.researchgate.net/ publication
/333309653_Key_Issues_in_Governance_Finance_School_Improvement_and_ICT_in_Basic_Education
4) Ugwu N. P. and Nnaekwe K. (2019). THE CONCEPT AND APPLICATION OF ICT TO TEACHING/LEARNING PROCESS. International
Research Journal of Mathematics, Engineering and IT, 6(2). https://www.researchgate .net/publication
/332843634_THE_CONCEPT_AND_APPLICATION_OF_ICT_TO_TEACHINGLEARNING_PROCESS
5) Eremie I., & Agi U. K. (2020). Information and Communication Technology (ICT) Skills and Efficient Management of Educational
Resources in Secondary Public Schools. Journal of the International Society for Teacher Education, 24 (1), 36-47.
https://web.b.ebscohost.com/abstract?direct=true&profile
6) Ibrahim A., Adu-Gyamfi M., & Kassim B. A. (2018). Factors Affecting the Adoption of ICT by Administrators in the University
for Development Studies Tamale: Empirical Evidence from the UTAUT Model. International Journal of Sustainability
Management and Information Technologies, 4(1), 1-9. doi: 10.11648/j.ijsmit.20180401.11
7) Australian Institute for Teaching and School Leadership (2021). The role of school leadership in challenging times.
https://www.aitsl.edu.au/research/ spotlight/the-role-of-school-leadership-in-challenging-times.
8) Makin M., Abdullah Z., & Shafee S. (2018). The art of supervision: Role of supervisory skills in developing teacher capacity.
Malaysian Online Journal of Educational Management, 6 (4), 37-55. DOI:10.22452/mojem.vol6no4.3
9) [Lapid J. R. (2021). Instructional Supervision Under the New Normal in Education: Tenets of Job-embedded Learning. DepEd
Bataan.com Publications.
http://www.depedbataan.com/resources/4/instructional_supervision_under_the_new_normal_in_education-
_tenets_of_job-embedded_learning.pdf
10) Iroegbu E. E. & Eyo E. E. (2018). Teacher’s Participation in Quality Assurance in Private and Public Secondary Schools in Uyo
Local Education Committee, Akwa Ibom State, Nigeria: Administrators’ Perspective. International Journal of Managerial
Studies and Research, 6(2), 1-9. https://www.arcjournals.org/pdfs/ijmsr/v6-i2/1.pdf
11) [11] Fendi H. et.al (2021). Online-Based Academic Supervision during the Covid-19 Pandemic. Journal of Physics: Conference
Series. doi:10.1088/1742-6596/1779/1/012027
12) [12] Atunde M., Abdulraheem J., Tijani A., Ayoku O., and Adeseko S. (2020). Information and Communication Technology
(ICT) and Administrative Performance of Principals’: A Survey of Public Secondary Schools in Ilorin Metropolis, Nigeria. Texila
International Journal ofAcademic research. DOI: 10.21522/TIJAR.2014.07.01

ICT Skills, E-Supervision Scheme of School Heads, And Teacher Development in Distance Learning Among Selected Private Schools in Cainta
IJMRA, Volume 5 Issue 05 May 2022 www.ijmra.in Page 992
13) Wilichowski T. & Cobo B. (2020). From coping to improving and accelerating: Supporting teachers in the pandemic and
beyond. https://blogs.worldbank.org/education/coping--improving- and-accelerating supporting-teachers-pandemic-and-
beyond
14) Learning Portal (2021, July 13). Information and communication technology (ICT) in education.
https://learningportal.iiep.unesco.org/en/issue-briefs/improve-learning/information-and-communication-technology-ict-in-
education
15) Kim T. & Lee Y. (2020). Principal instructional leadership for teacher participation in professional development: evidence from
Japan, Singapore, and South Korea. Asia Pacific Education Review, 21, 261-278. https://doi.org/10.1007/s12564-019-09616-
x
16) Hamzah N. H., Nasir M. K., & Wahab J. A. (2021). The Effects of Principals' Digital Leadership on Teachers' Digital Teaching
during the COVID-19 Pandemic in Malaysia. Journal of Education and e-Learning Research, 8(2), 216-221.
DOI:10.20448/journal.509.2021.82.216.221
17) Kilic M. E. (2021). What are the Expectations of Primary School Teachers from Instructional Leaders during the Distance
Education Period?. Athens Journal of Education, 8, 1-17. https://doi.org/10.30958/aje.X-Y-Z
18) Gustafson & Haque (2020). Uncovering the Challenges and Leadership Practices of Virtual School Principals. Online Journal of
Distance Learning Administration, XXIII(4).https://www.westga.edu/~distance/ojdla/winter234/ Gustafson_haque234.html
19) [British Council (2020). A Survey of teacher and teacher educator needs during theCOVID-19 pandemic.
https://www.teachingenglish.org.uk /sites/teacheng/files/covid19-teacher-teacher-educator-survey.pdf
20) Leong M. W., Chua Y. P. & Sathiamoorthy K. (2017). Relationship between principal technology leadership practices and
teacher ICT competency. Malaysian Online Journal of Educational Management, 4(3), 13-36.
http://mojem.um.edu.my/index.php/MOJEM/article/view/6062
21) Al Khateeb A. M. (2017). Measuring Digital Competence and ICT Literacy: An Exploratory Study of In-Service English
Language Teachers in the Context of Saudi Arabia. International Education Studies, 10 (12), 38-51.
doi:10.5539/ies.v10n12p38
22) Abraham L. N., Dzakpasu P. E., and Amenyedzi K. D. (2019). “Principals' ICT Proficiency Level and Tutors’ Willingness to Adopt
Modern Technological Devices in Teaching in the Volta and Greater Accra Regions, Ghana.” American Journal of Information
Systems, 7 (1), 1-6. doi: 10.12691/ajis-7-1-1.
23) Gulpan J. O. & Baja R. M. (2020). Technological Leadership of 21st Century Principals of Private Secondary Schools.
International Journal of Advanced Research and Publications, 4 (4), 66-69. Retrieved from http://www.ijarp.org/published-
research-papers/apr2020/Technological-Leadership-Of-21st-Century-Principals-Of-Private-Secondary-Schools.pdf
24) Barrido B. D. & Abadiano M. N. (2018). Leadership Style in the Utilization and Effectiveness of ICT Application Tools by
Educational Management. International Journal of Management and Commerce Innovations, 5 (2), 1290-
1321. https://www.academia.edu/38458701/Leadership_Style_in_the_Utilization_5523_pdf?bulkDownload=thisPaper-
topRelated-sameAuthor-citingThis-citedByThis-secondOrderCitation&from=cover_page
25) Tyagi R., Vishwakarma S., Alexandrovich Z.S., Mohammmed S. (2020) ICT Skills for Sustainable Development Goal 4. In: Leal
Filho W., Azul A.M., Brandli L., Özuyar P.G., Wall T. (eds) Quality Education. Encyclopedia of the UN Sustainable Development
Goals. Springer, Cham. https://doi.org/10.1007/978-3-319-95870-5_39
26) Cha Y., Kim J., Park S., Yi M. Y., & Lee U. (2018). Complex and Ambiguous: Understanding Sticker Misinterpretations in Instant
Messaging. In Proceedings of the ACM on Human-Computer Interaction, 2 (30), 1-22. ACM, New York, NY.
https://doi.org/10.1145/ 3274299
27) Byrnes K.G., Kiely P.A., Dunn C.P., McDermott K.W., Coffey J.C. (2021). Communication, collaboration and contagion:
“Virtualisation” of anatomy during COVID-19. Clin Anat., 34, 82– 89. https://doi.org/10.1002/ca.23649
28) Brock J. D., Beach D. M., Musselwhite M., & Holder I. (2021). Instructional supervision and the COVID-19 pandemic:
Perspectives from principals. Journal of Educational Research and Practice, 11, 168–180.
https://doi.org/10.5590/JERAP.2021.11.1.12
29) [Sadler, T.D., Friedrichsen, P., Zangori, L. & Ke, L. (2020). Technology-Supported Professional Development for Collaborative
Design of COVID-19 Instructional Materials. Journal of Technology and Teacher Education, 28(2), 171-177. Waynesville, NC
USA: Society for Information Technology & Teacher Education. https://www.learntechlib.orgprimary/p/216087/.

ICT Skills, E-Supervision Scheme of School Heads, And Teacher Development in Distance Learning Among Selected Private Schools in Cainta
IJMRA, Volume 5 Issue 05 May 2022 www.ijmra.in Page 993
30) Rahayu N. & Suprina R. (2021). EFL teacher professional development in the pandemic era of COVID-19. In K. A. Putra & N.
A. Drajati (Eds), Post Pandemic L2 Pedagogy (pp). London: Taylor Francis Group. DOI 10.1201/9781003199267-7
31) Uğur, N.G. & Koç., T. (2019). Leading and Teaching with Technology: School Principals’ Perspective. International Journal of
Educational Leadership and Management, 7(1), 42-71. DOI: 10.17583/ijelm.2018.3758
32) N.A., Dzakpasu P., and Amenyedzi K. (2019). Principals' ICT Proficiency Level and Tutors’ Willingness to Adopt Modern
Technological Devices in Teaching in the Volta and to Greater Accra Regions, Ghana. American Journal of Information Systems,
7 (1). doi: 10.12691/ajis-7-1-1
33) Belastock E. (2020). How to Improve Teacher Training for More Successful Remote Learning.
https://edtechmagazine.com/k12/article/2020/08/how-improve-teacher-training-more-successful-remote-learning
34) Njathi, S. N., Ngaruiya, B., & Maithya, P. (2018). Principal’s Computer Application Skills as a Determinant of Computer Use in
Administration of Public Secondary Schools in Kiambu County, Kenya. Journal of Education and Practice, 2(1), 26-41.
http://irlibrary.mmarau.ac.ke:8080/xmlui/bitstream/handle/123456789/7717/241-1169-1-
PB.pdf?sequence=1&isAllowed=y
35) Cadiente , A. M., Acob, J. R., & Bagon, A. E. (2020). Assessment on the information communication technology literacy among
education managers as an expression of caring education . Basic and Applied Nursing Research Journal, 1(2), 36-45.
https://doi.org/10.11594/banrj.01.02.03
36) Apsorn, A., Sisan, B., & Tungkunanan, P. (2019). Information and Communication Technology Leadership of School
Administrators in Thailand. International Journal of Instruction, 12(2), 639-650. https://doi.org/10.29333/iji.2019.12240a
37) Abdullaha M. H., Sulongb M. A., & Rahimc M. A. (2020). Development and Validation of the Music Education Teaching Practice
E-Supervision System Using the Google Classroom Application. International Journal of Innovation, Creativity and Change,
11(10),102-116. https://www.researchgate.net/profile/Mohd-Abdullah-14/publication/340264563
38) Van Boxtel J.M. (2017). Seeing Is Believing: Innovating the Clinical Practice Experience for Education Specialist Teacher
Candidates With Video-Based Remote Supervision. Rural Special Education Quarterly, 36(4),180-190.
doi:10.1177/8756870517737313
There is an Open Access article, distributed under the term of the Creative Commons
Attribution – Non Commercial 4.0 International (CC BY-NC 4.0)
(https://creativecommons.org/licenses/by-nc/4.0/), which permits remixing, adapting and
building upon the work for non-commercial use, provided the original work is properly cited.

INTERNATIONAL JOURNAL OF MULTIDISCIPLINARY RESEARCH AND ANALYSIS
ISSN(print): 2643-9840, ISSN(online): 2643-9875
Volume 05 Issue 05 May 2022
DOI: 10.47191/ijmra/v5-i5-16, Impact Factor: 6.261
Page No. 994-1002
IJMRA, Volume 5 Issue 05 May 2022 www.ijmra.in Page 994
Working Capital Strategy on Profitability before and During the
Covid-19 Pandemic in the Indonesia Stock Exchange
Ervita Safitri1 , Dhea Seftiani2, Abdul Basyith3 1,2,3 Faculty of Economics and Business, University of Muhammadiyah Palembang
ABSTRACT: The purpose of this study was to determine the effect of working capital strategy on profitability before and during
the Covid-19 pandemic on the Indonesia Stock Exchange. The population used in this study is the restaurant, hotel & tourism sub-
sector companies; pharmaceutical sub-sector; as well as the telecommunications sub-sector listed on the Indonesia Stock
Exchange which was conducted in the 2nd quarter of 2018 to the 3rd quarter of 2021 (14 periods). With a total sample of 22
companies. The sampling technique was carried out using purposive sampling method. This study uses secondary data in the form
of financial statements obtained from the official website of the Indonesia Stock Exchangewww.idx.co.id.
The data analysis technique in this study used multiple linear regression analysis with dummy variables. By calculating descriptive
statistics, multiple linear regression test, multicollinearity test, autocorrelation test, heteroscedasticity test, model fit test,
regression coefficient test, and different test. The results showed that CCC, WCIA, WCFA, and Dummy together had a significant
effect on ROA. CCC has no and no significant effect on ROA, WCIA and WCFA partially have a significant effect on ROA, Dummy
has a negative and significant effect on ROA. And WCIA has a parallel different influence on ROA before and during the Covid-19
pandemic, WCFA has an intersecting different influence on ROA before and during the Covid-19 pandemic.
1. INTRODUCTION
At the end of 2019, the world was shocked by the emergence of new and infectious and dangerous diseases. This disease is called
CoronavirusDisease of 2019 or known asCovid-19. Covid-19 was first discovered at the end of 2019, precisely in Wuhan City, Hubei
Province, China. On March 2, 2020, Joko Widodo as President of Indonesia stated that Indonesia had been exposed to the corona
virus, this was stated by the presence of two Indonesian citizens who were positively infected with the Covid-19 virus.(Ihsanuddin,
2020). Haryadi as General Chair of the Indonesian Hotel and Restaurant Association (PHRI) assessed that working capital incentives
can provide resilience for the business world directly in tackling the impact of the Covid-19 pandemic due to the implementation
of community activity restrictions (PPKM) which has made the tourism industry deserted(Santoso, 2021).
In contrast to the restaurant, hotel and tourism industries. The pharmaceutical industry and the telecommunications industry can
survive the Covid-19 pandemic. (Gayetri, Dijaya, Atmojo, & Sari, 2020)stated PT. Kalbe Farma Tbk. which is one of the companies
in the pharmaceutical industry that has had a positive impact due to the Covid-19 pandemic because it saw an increase in sales
where in the first quarter of 2020 it got sales of 5,796 billion or an increase of 8.0% compared to the first quarter of 2019.
The telecommunications industry has also become one of the industries that was able to survive the Covid-19 pandemic. Director
and Chief Financial Officer of PT. Tower Bersama Infrastructure Tbk. (TBIG), Helmy Yusman Santoso said "the telecommunications
industry has the potential to grow rapidly, because the number of smartphone users in 2021 will increase rapidly, of course it will
also increase internet users. This is because 80% of the 160 million internet access in Indonesia comes from
smartphones.”(Hastuti, 2021).
From the information above, it can be seen that various industries such as the restaurant, hotel & tourism industry;
pharmaceutical industry; as well as the telecommunication industry feeling the impact of the Covid-19 pandemic, both from
companies that experienced a decline as well as those that experienced an increase in revenue. One that affects income is the
size of the working capital used by the company. The company's working capital is divided into two types, namely gross working
capital and net working capital. Gross working capital is all the components in current assets, while net working capital is the
component of current assets minus current liabilities or short-term debt.(Cashmere, 2016).Working capital management can be
carried out with two approaches, namely an aggressive working capital approach and a conservative working capital
approach.(Basyith, Djazuli, & Fitriya, 2021)To see the working capital strategy used by a company, the working capital investment

Working Capital Strategy on Profitability before and During the Covid-19 Pandemic in the Indonesia Stock Exchange
IJMRA, Volume 5 Issue 05 May 2022 www.ijmra.in Page 995
approach (WCIA) and the working capital financing approach (WCFA) ratio can be used. The WCIA ratio is used to measure the
level of conservativeness/aggressiveness of the investment approach in current assets. while the WCFA ratio is used to measure
the level of conservativeness/aggressiveness of the financing approach in short-term liabilities.
Based on the description of the background, the formulation of the problem in this study is how does the working capital strategy
affect profitability before and during the covid-19 pandemic on the Indonesia Stock Exchange?
Profitability Ratio
Profitability ratio is the ratio used to assess the company's ability to seek profit (Cashmere, 2016). The types of profitability ratios
that can be used are:
1. Profit margin (profit margin on sales)
Profit margin or profit margin on sales is a ratio used to measure the company's ability to earn a profit on the company's sales.
There are two formulas to find the profit margin, namely for the gross profit margin and for the net profit margin.
a. Gross profit margin
Gross profit margin is a ratio that indicates the company's ability to generate gross profit from its sales. The formula
used to calculate the gross profit margin is:
b. Net profit margin
Net profit margin is a ratio that indicates the company's ability to generate net profit from its sales. The formula used
to calculate the net profit margin is:
2. Return on investment (ROI)
Return on investment (ROI) is a ratio that shows the results of the total assets used in the company. Return on investment is
also known as return on total assets (ROA) which is used to measure the effectiveness of the company's overall operations.
The formula used to measure return on investment is:
3. Return on equity (ROE)
Return on equity (ROE) or profitability of own capital is a ratio used to measure net profit after tax with own capital. The
formula used to measure return on equity is:
4. Earnings per share (Earnings per share/EPS)
Earnings per share or the so-called book ratio is a ratio used to measure the success of management in achieving profits for
shareholders. The formula used to measure earnings per share of common stock is:
In this study, the indicator used is return on assets (ROA) because it measures the extent to which the company's ability to
achieve profits.
Working capital
According to (Cashmere, 2018) Working capital is defined as the capital used to finance the daily operations of the company,
especially those with a short period of time. In other words, working capital is an investment invested in current assets or short-
term assets such as cash, banks, securities, receivables, inventory, and other current assets. Every company needs working capital.
To calculate the company's working capital requirements, the cash conversion cycle (CCC) concept can be used. (Anwar, 2019)
CCC or cash turnover cycle is a cycle that occurs from the start of the company issuing cash (cash) until the company gets cash
back. The formula for calculating the cash conversion cycle is used the following formula:
1. Average age of inventory (AAI) is the average age of the company's inventory in a period.

Working Capital Strategy on Profitability before and During the Covid-19 Pandemic in the Indonesia Stock Exchange
IJMRA, Volume 5 Issue 05 May 2022 www.ijmra.in Page 996
2. Average collection period (ACP) is the average length of time the company collects collectible receivables.
3. Average payment period (APP) is the average length of time a company pays its debts to suppliers.
According to(Brigham & Houston, 2019)the formula used to calculate the average payment period is:
Working Capital Strategy
According to (Anwar, 2019) The strategy to fulfill working capital needs can be divided into two, namely:
1. Aggressive funding strategy
Aggressive funding strategy is a strategy to fulfill working capital with long-term funding sources used to meet permanent
working capital needs and short-term financing sources used to meet seasonal working capital.
2. Conservative funding strategy
A conservative funding strategy is a strategy to fulfill working capital by using long-term financing sources to meet all the
company's working capital needs.
(Basyith, Djazuli, & Fitriya, 2021) To see the working capital strategy used by a company, the working capital investment approach
(WCIA) and the working capital financing approach (WCFA) ratio can be used.
If the WCIA ratio is less than 0.5, the company tends to have an aggressive working capital investment strategy and vice versa, if
the WCIA ratio is more than 0.5, the company tends to use a conservative working capital investment strategy.
If the WCFA ratio is less than 0.5 then the company tends to have an aggressive working capital financing strategy and vice versa,
if the WCFA ratio is more than 0.5 then the company tends to use an aggressive working capital financing strategy.
2. METHODOLOGY
The type of research used in this research is associative research, uses secondary data, which is a source of research data obtained
by researchers indirectly through intermediary media, namely from the official website of PT. Bursa Efek Indonesia through
www.idx.co.id, in this study is the data for the period 2018-2021.
The population in this study were all companies in the restaurant, hotel & tourism sub-sector; pharmaceutical sub-sector; and the
telecommunications sub-sector listed on the Indonesia Stock Exchange in 2018-2021. The sample used is as many as 22 companies
with a sampling technique carried out using the purposive sampling method.
The data analysis used in this research is quantitative analysis. The analytical technique used in this research is multiple linear
regression analysis with dummy variables and different tests are carried out to see the effect before and during the Covid-19
pandemic.
3. RESULTS AND DISCUSSION
Descriptive Statistics Test
1. Restaurant, Hotel & Tourism Sub-Sector
Table 1. Descriptive Statistics of Restaurant, Hotel & Tourism Sub-Sector
Descriptive Statistics
N Minimum Maximum mean Std. Deviation
ROA 140 -.1221 1.1103 -.006728 .0389388
CCC 140 -13521.6611 18927.4184 776.247546 3364.9455674
WCIA 140 .0159 2.7970 .255769 .2432783

Working Capital Strategy on Profitability before and During the Covid-19 Pandemic in the Indonesia Stock Exchange
IJMRA, Volume 5 Issue 05 May 2022 www.ijmra.in Page 997
WCFA 140 .1044 7.9603 .978481 1.3067394
Valid N (listwise) 140
Source: Diolah Penulis, 2022
Table 1 explains that the average ROA value is -0.006728 or -0.67% with the minimum ROA value being -0.1221 or 12% and the
maximum ROA value being 0.1103 or 11%. This indicates that the spread of ROA is more skewed to the left.
The average value of the cash conversion cycle (CCC) is 776.25 or 776 days. This means that the turnover of assets from cash to
cash back is 776 days or more than 25 months. The minimum value of CCC is -13521.66 or -13522 days and the maximum value of
CCC is 18927 days.
The average value of working capital investment approach (WCIA) is 0.255769, this indicates that companies use an aggressive
working capital investment approach more than using a conservative working capital investment approach. The minimum value
of WCIA is 0.0159 or 1.59% and the maximum value of WCIA is 2.7970 or 279.7% or the ratio of the value of current assets to total
current is 279.7%.
The average value of the working capital financial approach (WCFA) is 0.978481 or 97.8%, the value of current liabilities is 97.8
times higher than long-term debt. This shows that companies use an aggressive working capital financing approach more than
using a conservative working capital financing approach. The minimum WCFA value is 0.1044 or 10.44% with the maximum WCFA
value is 7.9603 or 796.03%. This means that the value of current debt is 796.03 greater than long-term debt.
2. Pharmaceutical Sub-Sector
Table 2. Pharmaceutical Sub-Sector Descriptive Statistics
Descriptive Statistics
N Minimum Maximum mean Std. Deviation
ROA 112 .0009 1.0000 .082251 .1296223
CCC 112 45.8243 1559.5406 334.183310 258.5532775
WCIA 112 .3469 .8468 .619590 .1283881
WCFA 112 .2455 29.0903 4.216014 4.2093530
Valid N (listwise) 112
Source: Diolah Penulis, 2022
Table 2 explains that the average ROA value is 0.082251 or 8.2% with the minimum ROA value being 0.0009 or 0.09% and the
maximum ROA value being 1.0000 or 100%.
The average value of the cash conversion cycle (CCC) is 334.18 or 334 days. This means that the turnover of assets from cash to
cash back is 334 days or more than 9 months. The minimum CCC value is 45.8243 or 46 days and the maximum CCC value is
1559.5406 or 1560 days.
The average value of working capital investment approach (WCIA) is 0.619590, this indicates that companies use a conservative
working capital investment approach rather than using an aggressive working capital investment approach. The minimum value
of WCIA is 0.3469 or 34.69% and the maximum value of WCIA is 0.8468 or 84.68% or the ratio of the value of current assets to
total current is 84.68%.
The average working capital financial approach (WCFA) is 4.216014 or 421.6%, current liabilities are 421.6 times higher than long-
term debt. This shows that companies use an aggressive working capital financing approach more than using a conservative
working capital financing approach. The minimum WCFA value is 0.2455 or 24.55% with the maximum WCFA value is 29.0903 or
2909.03%. This means that the value of current debt is 2909.03 greater than long-term debt.
3. Telecommunication Sub Sector
Table 3. Telecommunication Sub Sector Descriptive Statistics
Descriptive Statistics
N Minimum Maximum mean Std. Deviation
ROA 56 -.1409 .1308 .010528 .0574237
CCC 56 -529.1014 6.7691 -138.579931 123.8062232
WCIA 56 .0423 1.3343 .141937 .0657805
WCFA 56 .4561 1.6555 .867417 .2730384
Valid N (listwise) 56
Source: Diolah Penulis, 2022

Working Capital Strategy on Profitability before and During the Covid-19 Pandemic in the Indonesia Stock Exchange
IJMRA, Volume 5 Issue 05 May 2022 www.ijmra.in Page 998
Table 3 explains that the average ROA value is 0.010528 or 1% with the minimum ROA value being -0.1409 or -14.09% and the
maximum ROA value being 0.1308 or 13.08%.
The average value of the cash conversion cycle (CCC) is -138.579931 or -139 days, this indicates that the age of debt in the
telecommunications sub-sector is greater than the age of the receivables. The minimum CCC value is -529.1014 or -529 days and
the maximum CCC value is 6.77 or 7 days.
The average value of working capital investment approach (WCIA) is 0.141937, this indicates that companies use an aggressive
working capital investment approach more than using a conservative working capital investment approach. The minimum value
of WCIA is 0.423 or 42.3% and the maximum value of WCIA is 0.2589 or 25.89% or the ratio of the value of current assets to total
current is 25.89%.
The average value of working capital financial approach (WCFA) is 0.867417 or 86.74%, the value of current liabilities is 86.74
times higher than long-term debt. The minimum WCFA value is 0.4561 or 45.61% with the maximum WCFA value is 1.6555 or
1655.5%. This means that the value of current debt is 1655.5 greater than long-term debt.
Normality test
The normality test was conducted to test whether the regression model of the dependent variable and the independent variable
had a normal distribution or not. Based on the results of the normality test on each variable used by removing the extreme data
contained in each variable, it can be said that the data is normally distributed and is suitable for use in research because it meets
the assumption of normality.
Regression analysis
Table 4. Multiple Linear Regression Test Results with Dummy Variables
Coefficientsa
Model
Unstandardized
Coefficients
Standardized
Coefficients
T Significance B Std. Error Beta
1 (Constant) -.034 .007 -4.748 .000
CCC 7.072E-6 .000 .025 .416 .678
WCIA .116 .013 .517 8,566 .000
WCFA .030 .007 .189 4.106 .000
DUMMY -.017 .005 -.164 -3,595 .000
a. Dependent Variable: ROA
Source: Diolah Penulis, 2022
From table 4 above, the results of multiple linear regression with variables of working capital requirements (CCC), working capital
investment strategy (WCIA), working capital financing strategy (WCFA), dummy (D) on profitability (ROA) are shown. The
regression equation can be written as follows:
ROA = -0.034 + 7.072CCC + 0.116 WCIA +0.030WCFA – 0.017D
D = 0, Before the Covid-19 Pandemic
D = 1, During the Covid-19 Pandemic
The regression equation at D = 0, before the Covid-19 pandemic is as follows:
ROA = -0.034 + 7.072 CCC + 0.116 WCIA + 0.030 WCFA – 0.017(0)
ROA = -0.034 + 7.072 CCC + 0.116 WCIA + 0.030 WCFA
The regression equation at D = 1, during the Covid-19 pandemic is as follows:
ROA = -0.034 + 7.072 CCC + 0.116 WCIA + 0.030 WCFA – 0.017(1)
ROA = -0.034 + 7.072 CCC + 0.116 WCIA + 0.030 WCFA – 0.017
ROA = -0.051 + 7.072 CCC + 0.116 WCIA + 0.030 WCFA
Based on the calculation of the regression equation above, the constant value is -0.033, meaning that if CCC, WCIA, WCFA, D are
equal to 0, then the ROA is -0.034. The calculation result of the coefficient of working capital requirement (CCC) is 7.072, indicating
that working capital requirement (CCC) has a positive effect on profitability (ROA). This means that if the CCC increases by 1%, the
profitability (ROA) will increase by 7.072. The calculation result of the working capital investment strategy (WCIA) coefficient value
is 0.116. shows the working capital investment strategy (WCIA) has a positive effect on profitability (ROA). This means that if the
WCIA increases by 1%, the profitability (ROA) will increase by 0.116.

Working Capital Strategy on Profitability before and During the Covid-19 Pandemic in the Indonesia Stock Exchange
IJMRA, Volume 5 Issue 05 May 2022 www.ijmra.in Page 999
The calculation result of the coefficient of working capital financing strategy (WCFA) is 0.030, indicating that the working capital
financing strategy (WCFA) has a positive effect on profitability (ROA). This means that if WCFA increases by 1%, the profitability
(ROA) will increase by 0.030.
The result of the calculation of the value of the dummy coefficient (D) is -0.017. From the results of the regression equation on
the value of the dummy coefficient, it can be interpreted that there is a difference between before and during the Covid-19
pandemic. Because before the pandemic it was marked with the number 0 and during the pandemic it was marked with the
number 1, it can be concluded that the negative sign on the dummy regression coefficient is that the Covid-19 pandemic has a
negative effect on ROA. This means that if before the Covid-19 pandemic the ROA value was equal to 0, then during the Covid-19
pandemic the ROA value decreased by 0.017.
Classic assumption test
Based on the results of the classical assumption test that has been carried out, it can be concluded that the data does not contain
multicollinearity, autocorrelation, and does not occur heteroscedasticity.
Hypothesis testing
a. Model Fit
Table 5. Model Fit Test Results
ANOVAa
Model Sum of Squares df Mean Square F Significance
1 Regression .301 4 .075 45,292 .000b
Residual .504 303 .002
Total .806 307
a. Dependent Variable: ROA
b. Predictors: (constant) DUMMY, CCC, WCFA, WCIA...
Source: Diolah Penulis, 2022
Based on table 5 shows that the significant value of Fcount 45.292 > Ftable 2.4014 and sig. alpha 0.000 < sig. 0.05, then H0 is rejected
and Ha is accepted, which means that all independent variables CCC, WCIA, WCFA, and DUMMY have an influence on the
dependent variable ROA.
b. Regression Coefficient Test
Table 6. Regression Coefficient Test Results
Coefficientsa
Model
Unstandardized
Coefficients
Standardized
Coefficients
T Significance B Std. Error Beta
1 (Constant) -.034 .007 -4.748 .000
CCC 7.072E-6 .000 .025 .416 .678
WCIA .116 .013 .517 8,566 .000
WCFA .030 .007 .189 4.106 .000
DUMMY -.017 .005 -.164 -3,595 .000
a. Dependent Variable: ROA
Source: Diolah Penulis, 2022
Determine ttable with 95% confidence level and error rate (α) 5% = 0.05 and df 303. So the value of ttable = 1.9678
Based on table 6 for CCC of 0.416 < 1.9678, with a significant level of 0.678 > 0.05 (not significant), then Ha cannot be rejected and
H0 is accepted, meaning that there is no effect and no significant CCC on ROA before and during the Covid-19 pandemic. 19 on the
Indonesia Stock Exchange.
The value for WCIA is 8.566 > 1.9678, with a significant level of 0.000 < 0.05 (significant), then H0 is rejected and Ha is accepted,
meaning that there is a significant effect of WCIA on ROA before and during the Covid-19 pandemic on the Indonesia Stock
Exchange.

Working Capital Strategy on Profitability before and During the Covid-19 Pandemic in the Indonesia Stock Exchange
IJMRA, Volume 5 Issue 05 May 2022 www.ijmra.in Page 1000
The value for WCFA is 4.106 > 1.9678, with a significant level of 0.000 < 0.05 (significant), then H0 is rejected and Ha is accepted,
meaning that there is a significant effect of WCFA on ROA before and during the Covid-19 pandemic on the Indonesia Stock
Exchange.
The value for DUMMY is (negative) 3.595 > 1.9678, with a significant level of 0.000 < 0.05 (significant), then H0 is rejected and Ha
is accepted, meaning that before the Covid-19 pandemic and during the Covid-19 pandemic had a significant effect on profitability
( ROA).
Different Test
1. WCIA Difference Test with ROA
Table 7. WCIA Regression Equation
Model Source Sum of
Square df
Mean
Square F Sig
1 Regression
Residual
.252
.553
1
306
.252
.002
139,549 .000
2 Regression
Residual
.273
.532
2
305
.137
.002
78.332 .000
3 Regression
Residual
.278
.527
3
304
.093
.002
53,511 .000
Source: Diolah Penulis, 2022
a. Coincidence Test for WCIA Line
Based on table 7, the coincidence test can be carried out as follows:
Fcount 6.5 > Ftable 2.6343 then H0 is rejected and Ha is accepted, which means that the two WCIA lines are not coincidental,
meaning that they are not in the same line, then proceed with the Parallel test.
b. Parallel Test for WCIA Line
Based on table 7, parallel tests can be carried out as follows:
Fcount 2.5 < Ftable 2.6443, then H0 cannot be rejected and Ha is accepted, which means the two WCIA lines are parallel. This
means that the WCIA line to ROA both before and during the Covid-19 pandemic is parallel.

Working Capital Strategy on Profitability before and During the Covid-19 Pandemic in the Indonesia Stock Exchange
IJMRA, Volume 5 Issue 05 May 2022 www.ijmra.in Page 1001
2. WCFA Difference Test with ROA
Table 8. WCFA regresi regression equation
Model Source Sum of
Square df
Mean
Square F Sig
1 Regression
Residual
.044
.762
1
306
.044
.002
17.639 .000
2 Regression
Residual
.075
.731
2
305
.037
.002
15,655 .000
3 Regression
Residual
.113
.693
3
304
.038
.002
16.518 .000
Source: Diolah Penulis, 2022
a. Coincidence Test for WCFA Line
Based on table 8, the coincidence test can be carried out as follows:
F (0.05) V1 = 3 and V2 = 304
Fcount 17.25 > Ftable 2.6343, then H0 is rejected and Ha is accepted, which means that the two WCFA lines are not a
coincidence.
b. Parallel Test for WCFA Line
Based on table 8, parallel tests can be carried out as follows:
Fcount 19 > Ftable 2.6343, then H0 is rejected and Ha is accepted, which means the two WCFA lines are not parallel.
c. Equal Intercepts Test for WCFA Lines
Based on table 8, the equal intercepts test can be carried out as follows:
Fcount 10.5 > Ftable 2.4014, then H0 is rejected and Ha is accepted, which means that the two WCFA lines do not have the
same intercepts or have intersecting lines. That is, the WCFA line to ROA both before and during the Covid-19 pandemic
is intersecting.
4. CONCLUSION
Based on the results of research and discussion, the following conclusions can be drawn:
1. Cash conversion cycle, working capital investment strategy, working capital financing strategy simultaneously affect return
on assets before and during the Covid-19 pandemic on the Indonesia Stock Exchange.

Working Capital Strategy on Profitability before and During the Covid-19 Pandemic in the Indonesia Stock Exchange
IJMRA, Volume 5 Issue 05 May 2022 www.ijmra.in Page 1002
2. Cash conversion cycle partially has no effect and is not significant on return on assets before and during the Covid-19
pandemic. Working capital investment strategies and working capital financing strategies partially have a significant effect
on return on assets before and during the Covid-19 pandemic. The dummy for "0" before and "1" during the Covid-19
pandemic partially had a significant effect on return on assets.
3. Working capital investment strategies have different effects in parallel or parallel to return on assets before and during the
Covid-19 pandemic. Working capital financing strategies have different intersecting or intersecting effects on return on
assets before and during the Covid-19 pandemic.
5. SUGGESTION
Based on the results of research that has been done, the suggestions that can be given by the author are as follows:
1. It is advisable for further researchers to add variables and use populations and samples with a wider scope with the aim of
obtaining better results from this research and increasing knowledge.
2. Extend the research period to maximize results at the end of the study.
REFERENCES
1) Anwar, M. (2019). Fundamentals of Corporate Financial Management. Jakarta: Kencana.
2) Basyith, A., Djazuli, A., & Fitriya, F. (2021). Strategy & Working Capital Management on Profitability of Companies Listed
on the Indonesia Stock Exchange. Depok: PT. RajaGrafindo Persada.
3) Brigham, E. F., & Houston, J. F. (2019). Fundamentals of Financial Management Edition 14-Buku 2. Jakarta: Salemba
Empat.
4) Gayetri, A., Dijaya, D., Atmojo, M. D., & Sari, P. (2020). Analysis of the Effect of the Covid-19 Pandemic on Cash Flow of
Pharmaceutical Industry Companies (Case Study of PT. Kalbe Farma Tbk.). Journal of Competitive Business Covid-19
Edition, 1(1), 53-62.
5) Hastuti, R. K. (2021, September 23). Retrieved November 02, 2021, from CNBC Indonesia:
https://www.cnbcindonesia.com/market/20210923175550-17-278725/potensi-besar-bisnis-menara-di-tengah-
digitalisasi-pandemi/amp#aoh=16358633244863&referrer=
https%3A%2F%2Fwww.google.com&_tf=From%20%251%24s
6) Horne, J. C. (2009). Fundamentals of Financial Management. United Kingdom: Prentice Hall.
7) Ihsanuddin. (2020, March 032). Complete Facts of the First Case of the Corona Virus in Indonesia. Retrieved October 26,
2021, from Kompas: https://amp.kompas.com/nasional/read/2020/03/03/06314981/facts-complete-case-pertama-
virus-corona-di-indonesia
8) cashmere. (2016). Financial Statement Analysis. Jakarta: PT. RajaGrafindo Persada.
9) cashmere. (2018). Introduction to Financial Management. Jakarta: Kencana Prenadamedia Group.
10) Santoso, Y. I. (2021, July 27). Retrieved October2 26, 2021, from Kontan: https://amp.kontan.co.id/news/insentif-
modal-kerja-sector-pariwisata-transportasi-akan-terurun-di-semester-ii-2021
There is an Open Access article, distributed under the term of the Creative Commons
Attribution – Non Commercial 4.0 International (CC BY-NC 4.0)
(https://creativecommons.org/licenses/by-nc/4.0/), which permits remixing, adapting and
building upon the work for non-commercial use, provided the original work is properly cited.

INTERNATIONAL JOURNAL OF MULTIDISCIPLINARY RESEARCH AND ANALYSIS
ISSN(print): 2643-9840, ISSN(online): 2643-9875
Volume 05 Issue 05 May 2022
DOI: 10.47191/ijmra/v5-i5-17, Impact Factor: 6.261
Page No. 1003-1008
IJMRA, Volume 5 Issue 05 May 2022 www.ijmra.in Page 1003
Influence of COVID-19 on Student’s Classroom Learning and
Their Academic Performance
Dr. Ms. Shabnam S. Mahat1, Dr. S. B. Sawant2, Ms.Ummemisbah M. Bhisti3
1Assistant Professor Bharati Vidyapeeth (Deemed to be University), Pune. 2Professor, Bharati Vidyapeeth (Deemed to be University), Pune.
3Student, D. K. T. E Icchalkaranji
ABSTRACT: Right from 2019 to the present (2021), the whole word is suffering from pandemic situation due to COVID-19, thus
India has enforced lockdowns from 24th of March 2020 to stop faster spreading of the disease. The COVID-19 has resulted in
schools shut all across the world. Globally, more than 1 billion children are out of the classroom. Physical distancing of atleast 1
meter between individuals is needed for security measures, thus Indian government had implemented many schools and colleges
to quarantine peoples separately from their family. As a result, education system has changed from class room learning to virtual
learning, whereby teaching is undertaken remotely with the help of digital platforms on mobile phone. But pervious literatures
shows that excess use of mobile phone is affecting on students academic performance and it may lower academic performance
of students as well. In this study researcher analyze the impact of Covid-19 on education and also check whether virtual learning
is better than class room learning.
KEYWORDS: Covid-19, Pandemic, virtual learning, ICT.
LITERATURE REVIEW
Before Covid-19 pandemic, all parents has anxiety about the use of mobile phone and social media, because excess use of mobile
phone is affecting on students academic attendance and it may lower academic performance of their children. Amali Ismaila,
Onche. O, Bello Muhinat and Hassan, Ibrahim (2012), hypothesize that the use of mobile phones is unfair during lectures. But
during pandemic situation, most of the parents brought new mobile phones for their children’s to attend online lectures. As we
know that, at one side student listen lecture on mobile phone and on other side they play game on same device. “How students
concentrate on lectures?” that is the question. This indicates that mobile phones have become negative influence on academic
performance.
ICT reduces the teaching time and it makes teaching and learning process more productive [7].
Effective ICT teaching methods increase the student engagement in the class. It will improve the class climate and student
concentration in the subject teaches by teachers [4]. But if you use ICT for online lectures, it affects students’ commitment to their
academic work.
CORONA VIRUS (COVID-19) STATISTICS IN INDIA
Currently the whole word is suffering from pandemic situation due to COVID-19 which is transmitted from animals to people and
peoples to people. In December 2019, it is originated from seafood market of Wuhan city in China. COVID-19 is part of corona
viruses family and it can lead a lung infection which causes acute respiratory syndrome, pneumonia , some time multi-organ failure
and even death in the cases having pre-existing disease like blood sugar, blood presser etc. .
On 30th January 2020, first five case of Covid-19 were found in India then after on 2nd feb 2020 again newly one case was
found, day by day the rate of cases had been increased and till 23rd of March 2020 there were 434 case, thus India has enforced
lockdowns from 24th of March 2020 to stop faster spreading of the disease. Indian government enforced to close down schools
and colleges, stop public events and gathering, closing borders of country, states and districts.
Until then, the World Health Organization (WHO) has encouraged to take basic precautionary measures to stop Covid-19 infection
through TV channels and media. Indian government encouraged to the peoples to washing hands regularly, encouraged them to
covering the mouth and nose with mask and enforced to avoiding contact with infected people. Instead of that India reported 2nd

Influence of COVID-19 on Student’s Classroom Learning and Their Academic Performance
IJMRA, Volume 5 Issue 05 May 2022 www.ijmra.in Page 1004
highest cases of COVID-19 throughout the world. On 31st Oct 2020, the United States has the 1st highest, India has 2nd highest and
Brazil has 3rd highest number of COVID-19 cases and deaths of any country worldwide [2].
Statistics of cases is as below:
2020 Year Confirmed cases Deaths
31st Jan 5 0
29th Feb 7 0
30th Mar 1251 32
31st Apr 33050 1074
31st May 182147 5164
30th Jun 566840 16893
31st July 1638870 35747
31st Aug 3621245 64469
30th Sep 6225763 97497
31st Oct 8137119 121641
Source: [3] https://covid19.who.int/region/searo/country/in
COVID- 19 negatively affecting human health as well as their attitude towards survivals. Aside from that, this pandemic has also
negatively effecting education industries such as the physical contact lecture, annual sports, cultural activities etc. WHO
recommends carrying out early detection program and testing to find out infected persons, and then trace the people who are in
contact with covid-19 patient and quarantine them for atleast 14 days. Physical distancing of atleast 1 meter between individuals
is needed for security measures, thus Indian government had implemented many schools and colleges to quarantine peoples
separately from their family.
III. RATIONALE
This investigation aims to check impact of Covid-19 on education in Maharashtra state. Although based on geographically and
numerically wide sample, the findings of such an investigation may be useful in highlighting an importance and drawback of virtual
learning due to Covid-19 pandemic situation in Maharashtra.
IV. OBJECTIVE
1. To analyze the impact of Covid-19 on education.
2. To determine how virtual learning control students’ academic performance.
V. HYPOTHESIS
H0: There is no significance relationship between student’s classroom learning and their academic performance.
VI. ANALYSIS
The present study is mainly based on primary data which has been collected from 205 students score sheets. Data has been
collected through field visit, which is classified and presented in tables. Analysis is done by using Wilcoxon Signed Ranks Test under
following conditions.
Data type is discrete.
Pre and Post data has been studied.

Influence of COVID-19 on Student’s Classroom Learning and Their Academic Performance
IJMRA, Volume 5 Issue 05 May 2022 www.ijmra.in Page 1005
Table 1. 10th standard student’s test scoring during pandemic situation (online learning) and test scoring
after pandemic situation( classroom learning).
A= Score out of 20 during pandemic situation.
B= Score out of 20 after pandemic situation.
Student ID A
(online learning)
B
(classroom
learning).
1 16 18
2 13 19
3 16 17
4 14 17
5 14 14
6 5 14
7 13 13
8 9 12
9 14 15
10 13 13
11 14 17
12 10 13
13 11 11
14 14 16
15 7 13
16 12 13
17 12 15
18 14 17
19 8 11
20 11 14
21 10 11
22 15 17
23 6 11
24 16 17
25 15 15
26 12 13
27 12 16
28 12 14
29 12 12
30 12 13
31 11 12
32 10 14
33 16 17
34 12 13
35 10 13
36 11 12
37 12 12
38 10 11
39 11 13
40 11 12
41 12 15
42 5 10
Student ID A
(online
learning)
B
(classroom
learning).
104 11 13
105 12 15
106 8 10
107 12 13
108 10 10
109 12 13
110 13 15
111 11 13
112 12 12
113 12 14
114 11 11
115 6 9
116 12 13
117 13 15
118 13 14
119 11 14
120 12 12
121 13 15
122 10 12
123 10 12
124 10 10
125 12 13
126 8 12
127 11 12
128 11 11
129 11 12
130 11 11
131 13 14
132 11 13
133 12 17
134 11 13
135 12 15
136 6 11
137 12 14
138 13 16
139 13 15
140 11 14
141 13 15
142 13 15
143 10 12
144 11 13
145 10 10

Influence of COVID-19 on Student’s Classroom Learning and Their Academic Performance
IJMRA, Volume 5 Issue 05 May 2022 www.ijmra.in Page 1006
43 13 14
44 13 13
45 13 14
46 11 13
47 13 13
48 12 15
49 11 11
50 10 11
51 11 15
52 12 12
53 7 14
54 12 12
55 10 16
56 12 12
57 10 12
58 12 12
59 13 14
60 14 14
61 10 11
62 12 12
63 13 14
64 10 10
65 9 13
66 12 12
67 12 12
68 11 12
69 12 13
70 11 11
71 14 17
72 9 11
73 12 13
74 12 13
75 10 11
76 10 11
77 11 15
78 14 16
79 13 14
80 13 19
81 12 12
82 16 18
83 12 15
84 10 16
85 11 11
86 11 11
87 12 12
88 5 9
89 13 16
90 13 13
91 13 16
92 11 11
146 13 15
147 8 11
148 12 13
149 10 13
150 12 12
151 11 11
152 10 14
153 11 11
154 12 12
155 11 11
156 11 12
157 12 13
158 11 13
159 5 10
160 13 15
161 13 15
162 13 14
163 10 10
164 13 13
165 13 13
166 10 13
167 11 14
168 11 14
169 13 17
170 8 12
171 12 15
172 10 10
173 12 12
174 5 5
175 13 13
176 13 13
177 13 13
178 10 17
179 13 15
180 12 17
181 10 18
182 10 17
183 10 15
184 13 18
185 7 10
186 12 12
187 10 10
188 11 12
189 13 11
190 11 10
191 12 12
192 11 12
193 12 13
194 6 15
195 12 12

Influence of COVID-19 on Student’s Classroom Learning and Their Academic Performance
IJMRA, Volume 5 Issue 05 May 2022 www.ijmra.in Page 1007
93 13 15
94 12 12
95 11 12
96 10 12
97 11 12
98 12 15
99 7 11
100 12 14
101 10 13
102 12 13
103 11 13
196 13 16
197 13 15
198 11 12
199 13 13
200 13 13
201 10 10
202 11 11
203 10 10
204 13 13
205 8 15
Table 2. Wilcoxon Signed Ranks Test Statistics (Hypothesis)
N Mean Rank Sum of Ranks
During pandemic-
After pandemic
Negative Ranks 2(a) 44.50 89.00
Positive Ranks 144(b) 73.90 10642.00
Ties 59(c)
Total 205
a During pandemic < After pandemic b During pandemic < After pandemic
c During pandemic = After pandemic
Result
During pandemic - After pandemic
Z -11.669
Asymp. Sig. (2-tailed) .000
Sources : Compiled by researcher
Table 2 shows the Wilcoxon Signed Ranks Test Statistics, Z = -11.669, and p = 0.000; ie, a very small probability of this result
occurring by chance, under the null hypothesis of no difference. The null hypothesis is rejected, since p < 0.05 (in fact p = 0.000),
reject the null hypothesis and accept the alternate hypothesis that is, there is significance relationship between student’s
classroom learning and their academic performance. Researcher can conclude that, class room learning is more effective than
online learning.
VII. CONCLUDING REMARKS
This study demonstrates some interesting findings related to the consequences of virtual-learning process and it shows, there is
significance relationship between student’s classroom learning and their academic performance. Researcher can conclude that,
class room learning is more effective than online learning. On the bases of score of the students where mean of marks during
pandemic (virtual learning) Am= 11.263 which is less than mean of marks score after pandemic (Class room learning) Bm= 15.160.
Because of Covid-19 we enforce the students towards online learning but Covid-19 influences student’s classroom learning and
their academic performance.
Through an interview technique, researcher found some parents view, and 82% parents agreed that, students
concentration can increase in classroom learning. Covid-19pandemic had changed the way of learning which results for lower
academic performance of students. Though virtual learning given flexibility and comfort of learning it also distract the student
from the academic curriculum. India is suffering from this virus and students are suffering from this virtual learning which may
causes lack in health as well as skillful learning. The above analysis shows the effect of studies done by the students online as well
as offline. So we can say that offline learning has an edge over online learning. Although we don’t have any other alternative way

Influence of COVID-19 on Student’s Classroom Learning and Their Academic Performance
IJMRA, Volume 5 Issue 05 May 2022 www.ijmra.in Page 1008
of learning but still we need to look how we can make use of our old learning method so that academic progress of students along
with their skill with not disturb.
REFERENCES
1) https://www.statista.com/statistics/1110522/india-number-of-coronavirus-cases-by-age-group/
2) https://www.statista.com/statistics/1110522/india-number-of-coronavirus-cases-by-age-group/
3) https://www.statista.com/statistics/1043366/novel-coronavirus-2019ncov-cases-worldwide-by-country/
4) https://covid19.who.int/region/searo/country/in
5) Mahat S, “Effects of the ICT on students recalling power along with attitude towards ICT in education during Per, Post
and Continuation test”, 2014: Pp.29-39
6) Yalcinalp, Ph.D. (2005) “A Study of Students' Self-Efficacy, Performance and Attitudes towards Computers and Internet
in a Computer Literacy Course at freshman”
7) Zoltan, E. & Chaphanis, A. (1982). What do Professional persons think about computers? Behavior & Information
Technology, 1, 55-68
8) Shabnam and Nalavade, “STUDY OF EFFECT OF ICT ON INSTITUTE MANAGEMENT AND ON SOCIAL ASPECT”, 2012: Pp.285-
288.
There is an Open Access article, distributed under the term of the Creative Commons
Attribution – Non Commercial 4.0 International (CC BY-NC 4.0)
(https://creativecommons.org/licenses/by-nc/4.0/), which permits remixing, adapting and
building upon the work for non-commercial use, provided the original work is properly cited.

INTERNATIONAL JOURNAL OF MULTIDISCIPLINARY RESEARCH AND ANALYSIS
ISSN(print): 2643-9840, ISSN(online): 2643-9875
Volume 05 Issue 05 May 2022
DOI: 10.47191/ijmra/v5-i5-18, Impact Factor: 6.261
Page No. 1009-1016
IJMRA, Volume 5 Issue 05 May 2022 www.ijmra.in Page 1009
Prison Administration in context with Prisoner’s rights in India
Dr. Shikha Mishra1 , Dr. Uday Veer Singh2
1LL.M., NET, Ph.D. Assistant Professor, Law, IFTM University, Moradabad 2LL.M. NET JRF Ph.D Assistant Professor, Law, IFTM University, Moradabad
ABSTRACT: Prisons are those dark wells, which are kept separate from the society. Suffering and torture of prisoners are remained
in existence from the ancient time. Numerous agonies are faced by prisoners' in name of punishment during their detention as
maltreatment, third degree torture, overcrowding or congestion, sanitation etc. The stories of prisons don’t come out of their
walls generally. Administering of the prison must be in accordance with the law so that the prisoners can live behind walls of
prisons with human dignity. Administration of prison and prison rights jurisprudence is linked to each other. The prisoners’ rights
jurisprudence is evolved and developed because of inhuman attitude with prisoners in jails and growth of human right
jurisprudence. Different human rights of the detained persons are protected and enforced through various laws at different times.
However, even after the enactment of plethora of legislations not only the instances of violations are still continue but also many
sufferings remain untold. The area of human rights is a dynamic in itself, it has been changed with the growth of civilizations. This
paper deals with administration of prisons, types of prisons, officers of prisons and their duties. The paper examines the duties of
jail officials. The paper has come to an end with the help of doctrinal method of research.
KEYWORDS: Prison Administration, Prison, officers of prisons and their duties, human rights.
INTRODUCTION
Human rights jurisprudence advocates that no crime should be punished in a cruel, degrading or in an inhuman manner.1 On the
contrary, it can be held that any punishment that amounts to cruel, degrading or inhuman should be treated as an offence by
itself.2 The protection to rights of prisoners is a recognized issue throughout the world but the scope of rights and their protection
varies from country to country. In prisons there are different types of prisoners such as convicted, under trials, preventive
detainees, women inmates, juveniles in care home, all are having distinct rights according to their needs and requirements. The
primary effect of the incarceration is the loss of liberty and the right to locomotion because of which many other liberties and
rights are restricted by law. Mahatma Gandhi observed in 1917 "Criminals should be treated as patients in hospitals, and jails
should be hospitals admitting such patients for treatment and cure. The outlook of the jail staff should be that of physicians in
hospitals. ‘The prisoners should feel that the officials are their friends"3. From the twentieth century the issue of protection to
rights of prisoners became vibrant and came into focus and come to the end of the century the concern did spread all over the
world. The learned justice V.R. Krishna Iyer told that “Imprisonment does not spell farewell to fundamental rights”.4 Government
recommends to run jails as indoor hospitals and boarding schools and to avail this goal it is necessary that prison officials would
be obligated to behave humanly with jail inmates. The officers must be obligated for not treating them inhumanly.5
Parliament with the judiciary in their combined efforts have been giving strength to the prison jurisprudence. The protection to
prisoners from being abused by the police officials is a major interest in a democratic and welfare state. The tendency of
dehumanization or inhuman treatment with prisoners by the prison authorities cannot be appreciated at all. Judicial decisions,
given by the Indian Judiciary regarding giving protection to human rights of prisoners indicates that the judiciary has been playing
a role of guardian and protector of human rights, whereas the executive and legislature have failed to address the problems of
the people. The Supreme Court has come forward to take corrective measures and issued necessary directions to the executive
1 Convention against Torture and Other Cruel, Inhuman or Degrading Treatment or Punishment, 1984. 2 ibid Article 4. 3 Quoted, Report of All India Jail Manual Committee, 1957-59, para. 3. 4Charles Sobhraj vs. Superintendent Central Tihar Jail, Tihar New Delhi, AIR 1978 SC 1514. 5 http://upprison.gov.in/pdf/admin_rpt_2010_final.pdf last visited on 25/7/21

Prison Administration in context with Prisoner’s rights in India
IJMRA, Volume 5 Issue 05 May 2022 www.ijmra.in Page 1010
and legislature for the sake of prisoners. From the perusal of the above contribution it is evident that the Indian Judiciary is very
sensitive and alive to the protection of the human rights of the prisoners. Judicial activism was applied as tool and new remedy
for the purpose of vindicating the most precious of the precious human right to life and dignity.
The scope of prisoner's rights is expanded by the judiciary with the help of the Constitution of India art. 21. The Supreme
Court has observed in Sunil Batra II, "human rights jurisprudence in India has a constitutional status and sweep ... so that this
Magna Carta may well toll the knell of human bondage beyond civilized limits.6 Though, Parliament has enacted lots of laws
to protect the prisoners from inhuman treatment and to expand their rights but only the law cannot make a miracle. The
pious efforts should be taken to protect them, and the process should be due process. The enforcement machinery should
take the step in such a way so that the aspiring goals can be achieved. As the learned Justice Krishna Iyer opined prison as:, A
reformative philosophy, rehabilitative strategy, therapeutic prison treatment and enlivening of prisoner’s personality through
a technology of fostering the fullness of being such a creative art of social defence and correctional process activating
fundamental guarantees of prisoner’s rights is the hopeful note of national prison policy struck by the constitution and the
court.7
PRISON ADMINISTRATION IN INDIA
Prison8 means any jail or place used permanently or temporarily under the general or special orders of a State Government for
the detention of prisoners, and includes all lands and buildings appurtenant thereto, but does not include—
(a) any place for the confinement of prisoners who are exclusively in the custody of the police;
(b) any place specially appointed by the State Government under section 541 of the Code of Criminal Procedure, 1882;
or
(c) any place which has been declared by the State Government, by general or special order, to be a subsidiary jail:
Prisons in official language may be called as, jail, workhouse, penitentiary, reformatory, state prison, house of correction or
whatever else, it is simply a place where the punishment of imprisonment is executed. Prisons serve main three purposes, which
may be described as custodial, coercive and correctional. Adequate administration of prisons, care homes would not harass the
rights of prisoners’. The purpose of prison administration is to reform the prisoners through the discipline of punishment. Prison
is a State subject under List-II of the Seventh Schedule of the Constitution of India. The administration of prisons fall exclusively in
the domain of the State governments, and is governed by the Prisons Act, 1894 and the Prison Manuals of the respective State
Governments. Thus, States have the primary role, responsibility and authority to change the current prison laws, rules and
regulations. Indian Penal Code, 1860 recognizes death penalty, imprisonment for life, simple and rigorous imprisonment,
forfeiture of property and fine as a punishment to be imposed.9
i) Ancient India: The penology in ancient India developed under the connotation of ''danda-niti'' which literally
means principles of punishments. The history of early penal systems of different countries reveals that
punishments were cruel and barbaric in nature. It was towards the end of 18th century that humanitarianism
began to assert its influence on penology. The common modes of punishment prevalent in different parts of the
world included corporal punishments such as flogging, mutilation, branding, pillories, chaining prisoners
together, imprisonment, forfeiture of property and fine. In ancient India at the time of Arthasastra, justice was
administered in accordance with legal rules which fell under one or the other of the following heads:
(a) Sacred Law (dharma),
(b) Secular Law (vyabhara),
(c) Custom (charitra)
(d) Royal commands (rajasasana).
Sacred law is the personification of truth, Secular law depends upon evidence. Custom is decided by the opinion of the people,
and Royal Edicts constitute administrative law.10 Vedic Culture in India laid a solid foundation for an overriding importance of
6 Sunil Batra vs. Delhi Administration (II), AIR 1980 SC 1579. 7 P. C. Harigovind, “The Indian Jurisprudence on Prison Admistration and the Legislative Concerns”, IOSR Journal of
Humanities and Social Science (IOSR-JHSS) Volume 9, Issue 5 (Mar. - Apr. 2013), PP 24-29 e-ISSN: 2279-0837, p-ISSN: 2279-
0845. www.Iosrjournals.Org 8 section 3(1) of The Prisons Act, 1894. 9 Scection 53 of Indian Penal Code,1860 (Act no. 45 of 1860) 10 John Lewis Gillin, “Criminology & Penology”, rev. ed., 1935, pp.203-204

Prison Administration in context with Prisoner’s rights in India
IJMRA, Volume 5 Issue 05 May 2022 www.ijmra.in Page 1011
Dharma in private and public life.11 Dharma was conceived as conducive for highest good and welfare of all. The omnipresent
character of Dharma provided a unified forum for interaction and balancing of several individual and social interests. There was
no prison in the Vedic periods, but the house of the accused served the purpose for jail and he was practically imprisoned in his
own house till he managed to compensate the plaintiff.12
It is on record that Brahaspati laid great stress on imprisonment of convicts in closed prisons.13 In the age of Ramayana when Sita
was confined by Ravana he kept her in Ashoka Vatika (open prison) under the surveillance of female soldiers. There is a reference
from the Mahabharata, where Kansa threw his sister Devaki and her husband Vasudeva into jail. In the early years of Ashoka,
there was an unreformed prison in which most of the traditional fiendish torture were inflicted and from which no prisoners come
out alive. But from his moral edicts which belong to his later period of rule when he was influenced by Buddhism it appears that
many reformatory measures were taken. Another reformatory method introduced by Ashoka was the visit to the prisoners made
by the authorities concerned once a day, sometimes, once in five days, to enquire about their conditions.14 Arthasastra15 describes
that the jail should be well guarded with many compartments provided with separate accommodation for men and women.
Another interesting feature of the administration of justice in ancient India is that the offenders in most cases were allowed to
pay fines to escape punishments.
ii) Medieval India: The cruel and barbarous penal system of the ancient days continued for a long time in our
country until the down fall of Mughal empire. In this regime only the Quranic law was applicable in our country,
Quran was the prominent source of law in the medieval period which prescribed brutal punishments for crimes.
During the Muslim rule in India Punishment by imprisonment was not as common as in ancient Hindu India.
Besides, convicted prisoners under trials were also kept confined in jails.16 During the period of the Sultanate,
there were no regular prisons. Only old forts and castles were used as prisons. In Muslim India prisons were used
both for detention and punishment of offenders. Muslim law divided punishment into Hadd, Tazir, Qusas, Tash-
hir.17 Hadd had the purpose to deter others from committing similar offence and was considered 'the right of
God'.
The forms of punishment in this category included stoning to death for adultery, cutting off the right hand for theft etc. Tazir is a
punishment intended to reform the criminal and inflicted for such crimes as have no hadd punishment. It was not 'the right of
God'. It could take the forms of Tajib or public condemn or threat, dragging the offender to the door and exposing him to public
scorn, imprisonment or exile, boxing on the ear; scouring. Quisas or retaliation rested on the personal types of crimes such as a
murder. Tash-hir or public degradation was a popular devised punishment of universal currency throughout the Muslim world and
even in Hindu India and Medieval Europe. It included such punishments as shaving off the offender’s head, making him ride on an
ass with his face turned towards its tail, and his body covered with dust, sometimes with a garland of old shoes placed around his
neck, parading him in this posture through the streets with noisy music and finally turning him out of the city.18
iii) British India: The modern prison in India originated with the historic Minute by T.B. Macaulay in 1835. The
contemporary prison administration in India is thus a legacy of British rule. It was only after 1858, a uniform system of
legal justice was initiated in India. It was the first time in 1835 when the Lord Macaulay drew the attention of Legislative
Council of India to the deplorable conditions of Indian prisons and he termed it as a “shocking to humanity”19
consequently, proposed to appoint a committee for the purpose of collecting information as to the state of Indian prisons
and of preparing an improved plan of prison discipline. The Council accepted Macaulay's proposal and a Prison Discipline
Committee was appointed by Lord William Bentinck. The report of the committee came out in 1838. The committee
highlighted the vices of prison administration prevailing in India at that time. The committee was of the view about the
11 Manu Smriti VII, 15 quoted by P.Ishwara Bhat, in “Fundamental Rights” Eastern Law House, page 56 12 Indra J. Singh, Indian Prison-A sociological Enquiry, concept, New Delhi, p. 20. 13 Prof. N.V.Paranjape, “Criminology, Penology & Victimology”, Central Law Publications, 15th Ed. Reprint 2012, page 428. 14 Mohammad Hamid Khuraishi, Rajgir, revised by A. G. Ghose , Director General of Archaeology, New Delhi,1958,p.p.27-28 15 Gairola, Vachaspati: Arthasastra of Kautilya, Chaukhamba Vidyabhawan, Varanasi, 2003, pp.95-96. 16A.L. Srivastava, “The History of India: 1000A.D. 1707 A.D”, Ist Edn.1964, p.522 17 C.S.Malliah, op. cit., p. 36. 18 Jadunath Sarkar, Mughal Administration, M.C. Sarkar Sons Calcutta 1952, pp. 103-107. 19 Zubair Ahmed, “Jail reforms in India: A study of Indian jail Reform Committees”, published in International Journal of
Multidisciplinary Education and Research ISSN: 2455-4588; Volume 1; Issue 3; May 2016; Page No. 01-04(page 1)

Prison Administration in context with Prisoner’s rights in India
IJMRA, Volume 5 Issue 05 May 2022 www.ijmra.in Page 1012
purpose of punishment is the great end of punishment is, according to our view, to deter all men from crime who are
capable of committing it and susceptible of the fear of punishment. The committee went through various aspects like
housing of prisoners, discipline, health, diet, remunerative rewards, punishments, education and labour in details. The
committee suggested that prisoners should be classified into different categories and should be kept separated according
to their categories.
The second committee appointed in 1864 took into considerations the aspects of juvenile delinquency, female prisoners, diet.20
Afterwards in 1876 third jail committee was appointed for introducing more uniform regulations and for making short sentence
more deterrent.21 Then the committee of 1888 was appointed by Lord Dufferin, the work of this committee was corroborated by
the recommendations of All India Committee of 1892. It resurveyed the general prison administration in India and drew up
proposals on the subject of prison offences and punishment. This report, as a manuscript was accepted by the Government of
India and got confirmed as the Prisons Act 1894. It provided for the classification of different offenders and tried to secure
uniformity of treatment to all offenders in jails. This Act was basically based on principle of deterrence.22 ‘All India Jail Committee’
(1919-1920) was appointed to suggest measures for prison reforms was headed by Sir Alexander Cardew. It is indeed a major
landmark in the history of prison reforms in India and is appropriately called the corner stone of modern prison reforms in the
country. For the first time, in the history of prison administration, reformation and rehabilitation of offenders were identified as
one of the objectives of prison administration.23 The prisons should not only have deterring influence but they should also have a
reforming effect on inmates. It recommended utilization of prison inmates in productive work so as to bring about their
reformation. The Committee also emphasized the need for an intensive after-care programme for the released prisoners for their
rehabilitation.24
iv) Post Independence India: After the advent of freedom, a new phase of humanitarian prison administration has begun
in India. Overcrowding in prisons, prolonged detention of under trial prisoners, unsatisfactory living conditions, lack of
treatment programmes and allegations of indifferent and even inhuman approach of prison staff have repeatedly
attracted the attention of the critics over the years.25 In 1957, the Government of India appointed All India Jail Manual
Committee for preparing an All India Skeleton Jail Manual, examining the Prisons Act, 1894 and other relevant central
laws, making proposals for prison reforms throughout the country. The committee believed in the philosophy of
Mahatma Gandhi that 'hate the crime not the criminal' the report of the committee held that the problems cannot be
solved neither by making punishment more deterrent nor by making the system of punishment too weak and diluted.
The Committee wanted prisons to be transformed into correctional institutions to achieve the goal of rehabilitation of
offenders.
In 1980, The Indian Government appointed an All India Jail Reform Committee under the chairmanship of Justice A.N. Mulla.26 The
Committee suggested Setting up of a National Prison Commission as a continuing body to bring about modernisation of prisons in
India.27 The Committee suggested that conditions of prisons should be improved by making adequate arrangement for food,
clothing, sanitation, ventilation, etc. It was also focussed that prison staff should be properly trained and emphasized to have
focus upon the reformation and rehabilitation of prisoners. Referring to the Justice Mulla Committee Report the Apex Court
observed that "All prisoners under sentence should be required to work to their physical and mental fitness as determined
medically. Work is not to be conceived as additional punishment but as a means of furthering the rehabilitation of the
prisoners....."28
20 Reforms of Indian Jail Committee, 1864 21 The Imperial Gazetter of India, The Indian Empire, Vol. IV-Administrative, p. 399. 22 R.N. Datir, op. cit., p. 58. 23 supra noted at 15. 24 N.V. Paranjape, Criminology & Penology with Victimology, Central Law Publications; Sixteenth Edition; 2014, p 479 25 Govt. of India: Ministry of Home Affairs, Report of All India Committee on Jail Reforms, 1980-83, p.1. (Referred also in
Article Rights of the Prisoners: Behind the Bars, published in Criminal Law Journal, 2010 Journal 179p.) 26 Prof. N. V. Paranjape, “Criminology & Penology with Victimology”, Central Law Publications, Reprint 2012, page 431. 27 Justice Mulla submitted its' Report on Jail Reforms to Home Ministry on 31st March, 1983. 28 State of Gujarat vs. Hon'ble High Court of Gujarat, AIR 1998 SC 3164.

Prison Administration in context with Prisoner’s rights in India
IJMRA, Volume 5 Issue 05 May 2022 www.ijmra.in Page 1013
Further Justice Thomas held that "The rehabilitation of a prisoner need not be by closing our eyes towards the sufferings of victims
of crimes. Dispensing justice to victims of crime cannot any longer be ignored.29 The Committee made a demand for making
possible visits of media persons and public men.30 The Committee recommended the variety of institutions for catering to the
needs of different categories of offenders. Afterwards, the another appointed National Expert Committee on Women Prisoners
headed by Justice V.R. Krishna Iyer in its' report submitted to the Government in 1988 recommended induction of more women
in the police force in view of their special role in tackling women and child offenders. The UP Jail Manual classified jails in Uttar
Pradesh in four categories:
1. central prisons;
2. district jails;
3. juvenile jail; and
4. lock-up jails
Central prisons have accommodation ordinarily for more than 1,000 prisoners. Adult prisoners sentenced to imprisonment for life
or to terms of imprisonment exceeding seven years will be sent to these jails.
There are five classes of district jails. First class, having accommodation ordinarily for prisoners exceeding 500. Prisoners sentenced
to terms of imprisonment exceeding three years but not exceeding seven years will be admitted to these jails. Second class, having
accommodation ordinarily for prisoners exceeding 300 but not exceeding 500 Prisoners, sentenced to terms of imprisonment
exceeding two years but not exceeding three years will be imprisoned in this category of jail. Third class, having accommodation
ordinarily for prisoners exceeding 150 but no exceeding 300. Fourth class, having accommodation ordinarily for prisoner exceeding
100 but not exceeding 150. In third and fourth category district jails prisoners sentenced to terms of imprisonment exceeding two
years but not exceeding three years will be imprisoned. Fifth class of district jail, will have accommodation ordinarily for 100
prisoners or less. Prisoners sentenced to terms of imprisonment not exceeding one years will be imprisoned thereto. The jail
authorities and their duties and responsibilities are composed in Prisons Act, 1894.
OFFICERS OF PRISONS AND THEIR DUTIES
Prison Act, 1894 states, an Inspector General shall be appointed for the territories and shall exercise, subject to the orders of the
State Government the general control and superintendence of all prisons situated in the territories under such Government.31 For
every prison there shall be a superintendent, a Medical Officer (who may also be the Superintendent), a Medical Subordinate, a
Jailer and such other officers as the State Government thinks necessary.32
Superintendent shall manage the prison in all matters relating to discipline, labour, expenditure, punishment and control.33 The
Superintendent shall keep, or cause to be kept a register of prisoners admitted; a book showing when each prisoner is to be
released; a punishment-book for the entry of the punishments inflicted on prisoners for prison offences; a visitors’ book for the
entry of any observations made by the visitors touching any matters connected with the administration of the prison; a record of
the money and other articles taken from prisoners; and all such other records as may be prescribed by rules under section 59 of
the Prisons Act. The superintendent or jailor shall receive and detain all the prisoners committed to his custody. The
superintendent shall report at once to the district magistrate about wounds, injuries, contusions found on prisoners which are not
relevant to crime and case for which he is committed.34 The Bombay High Court held that the principle of justice must be adhered
to by the Superintendent himself and no other person. He must ‘examine” the prisoners himself. He cannot simply rely on a
readymade statement that would not be an ‘examination’. The enquiry is of a quasi-judicial nature and includes the right of the
prisoner to be heard, to be fully informed and to cross examine. Finally, the Superintendent must pass the reasoned order. In the
instance case petitioner was punished by the prison authorities on account of an offence he had committed while serving a prison
term.35
29 State of Gujarat vs. Hon'ble High Court of Gujarat, AIR 1998 SC 3164, referred in an article by Apoorva Goyal, “Victim's
Right to Access to Justice”, Criminal Law Journal 2012 Journal 196 p. 30 supra noted as 19, page 432 31 Section 5 of the Prisons Act, 1894. 32 Section 6 of the Prisons Act, 1894 33 Section 11 of the Prisons Act, 1894 34 UP Jail Manual, 1894, Rule 22. 35 Damal H Walcott v. Superintendent, Nagpur Central Prison, 1971 Bom LR 436

Prison Administration in context with Prisoner’s rights in India
IJMRA, Volume 5 Issue 05 May 2022 www.ijmra.in Page 1014
Medical Officer shall have charge of the sanitary administration of the prison, and shall perform such duties as may be prescribed
by rules made by the State Government36 under section 59. Whenever the medical officer has reason to believe that the mind of
a prisoner is or is likely to be, injuriously affected by the discipline or treatment to which he is subjected, he will inform to the
superintendent.37 When the death is caused of any prisoner it is the duty of the medical officer to record in a register, the day on
which he was first complained of illness, when he was admitted to the hospital, the diet on that day, the labour in which he was
engaged on that day, the nature of illness, when he died and when he was last seen before the death by the medical officer.38
Whenever a prisoner is admitted to prison he will be medically checked under the general or special order of the medical officer.
Every prisoner on arrival at the main gate, and before he is locked up in the quarantine enclosure shall be examined carefully by
the assistant medical officer39 in the presence of the jailer or other officer on duty. The name of the prisoner, the time of
examination and the result of the examination, with reference to any injuries, wounds, contusions or abrasions detected shall be
entered in the jailer’s report-book and the entries shall be signed by the jailer or another officer duly authorized by the
superintendent and the assistant medical officer. The clothing of all prisoners shall be carefully examined, and if it is found to
contain any stains of a suspicious character the district magistrate shall be informed and the clothing shall be stored under lock
and key.40 If the prisoner is transferred from one jail to another jail then the medical officer will certify that he is free from illness
and can be transferred. The medical examiner shall examine the labouring prisoner from time to time.
Jailor shall reside in the prison, unless the Superintendent permits him in writing to reside elsewhere.41 Upon the death of a
prisoner, the Jailer shall give immediate notice thereof to the Superintendent and the Medical Subordinate.42 The Jailer shall be
responsible for the safe custody of the records to be kept under section 12 of the Prisons Act, for the commitment warrants and
all other documents confined to his care, and for the money and other articles taken from prisoners.43 The Jailer shall not be
absent from the prison for a night without permission in writing from the Superintendent; but, if absent without leave for a night
from unavoidable necessity, he shall immediately report the fact and the cause of it to the Superintendent.44 Section 20 of the
said Act states that where in a prison Assistant Jailor and Deputy Jailor is appointed subject to the order of superintendent he shall
be competent to do all the duties of the Jailor. If any prisoner is sick then the jailor immediately will inform to the medical officer
and will apply the directions given by medical officer or medical subordinate.
Subordinate officers as gate keeper is also the officer of the prison and he can examine anything carried in or out of the prison,
search or stop any person to ascertain, what is going into or coming out of prison and has to give immediate notice to the jailor
on finding any prohibited article or property. Officers subordinate to the jailer shall not be absent from the prison without leave
from the Superintendent or from the jailer. Prisoners who have been appointed as officers of prisons shall be deemed to be public
servants within the meaning of Indian Penal Code, 1860.45
No officer of a jail shall sell or let, nor shall any person in trust for or employed by him sell or let, or derive any benefit from selling
or letting, any article to any prisoner or have any money or other business dealings, directly or indirectly, with any prisoner. No
officer of a prison shall, nor shall any person in trust for or employed by him, have any interest, direct or indirect, in any contract
for the supply of the prison; nor shall he derive any benefit, directly or indirectly, from the sale or purchase of any article on behalf
of the prison or belonging to prisoners.46 Prison officers are obligated to treat prisoners sympathetically. They are obligated to
listen inmates are to sort out the problems of prisoners as well as not to irritate with them.47
In the present age, the society seems to have a variety of objectives in regard to control of crime and it considers imprisonment
of the means for attaining each of them. First, as is implied by the relatively recent emphasis on reform, rehabilitation and
treatment of criminals, society wants criminal changed, so that they will commit no more crimes.48 The prison is expected to
36 Section 13 of the Prisons Act, 1894 37 Section 14 of the Prisons Act, 1894 38 Section 15 of the Prisons Act, 1894 39 Medical subordinate referred to in section 6 of the Prison Act, 1894(IX of 1894), in this Manual described as Assistant Medical
Officer. 40 UP Jail Manual, 1894, Rule 20 41 Section 16 of the Prisons Act, 1894 42 section 17 of the Prisons Act, 1894 43 section 18 of the Prisons Act, 1894 44 section 19 of the Prisons Act, 1894 45 Section 21, 22, 23 of The Prisons Act, 1894 46 Section 10 of Prisons Act, 1894 47 upprison.gov.in/pdf/admin_rpt_2010_final. pdf. 48 Sutherland and Cressey, “Principles of Criminology”, Sixth Edition, Surjeet Publications, p. 460-461

Prison Administration in context with Prisoner’s rights in India
IJMRA, Volume 5 Issue 05 May 2022 www.ijmra.in Page 1015
reform or rehabilitate criminals. Society wants protection from criminals. The prison keeps exclude offenders from society so that
they cannot cause harm by commission of crimes during certain periods of time. Society wants retribution also. The prison is
expected to cause suffering in routine life of criminals as they have made other's life intolerable. It is in the benefit of the society
to minimise crime rate not only by reforming criminals but also by deterring the general public from behaviour which is punishable
by imprisonment.49 Since the prison has been assigned the task of working toward each of society's goals, the attainment of goals
may be considered the objective of punishment.50 Within the prison, the attempt to perform the duties and for achieving the goals
of incarceration various theories of punishment are made applicable to the penal structure.
SUGGESTION AND CONCLUSION
Effective prison administration is essential for the betterment of criminal jurisprudence. It will not only give strength to the system
but will also helpful in making the policies of government transparent as well as the ultimate goal of penal system will become
easy to achieve by reformation of prisoners. In the absence of proper administration of prisons prisoners’ right will become futile.
Vacant seats of prison staff must be filled without undue delay as the staff in jails are very less in comparison of required. Problems
of sanitation, congestion are very serious issues of jails which must be resolved.51 Implementation of reformation schemes in an
effective way will make the administration effective and proper in prisons. The provisions relating to arrest and their rights during
detention cannot be by-passed by alleging that that there was no arrest in real but that was only informal detention.52 Informal
detention or restraint of any kind by the police is not authorised by law.53 Jailors are bound by rule of law and cannot defeat the
primary purpose of improvement. Prison staff is the backbone of prison administration. Smooth function of prison administration,
enforcement of rights in effective way is possible by the sufficient prison staff. Their needs and requirement must be taken into
the consideration. The Court has power and responsibility to intervene and protect the prisoner against the mayhem, crude or
subtle and may use habeas corpus for enforcing imprison humanism and forbiddance of harsher restraints. Sense and sympathy
are not enemies of penal asylums. The aim of incarceration is not only punitive but restorative to be an offender a non-offender.
Rehabilitation is a prized purpose of prison hospitalization. A criminal must be cured and cruelty is not curative even as poking a
bleeding wound is not healing.
Law has been playing an important role in all the modern societies. It has become a norm of organizing all the societies because
of its promise to be universal, uniform and equal. The prisoners whether they are convicted or under trials cannot be deprived of
their human rights except the right to liberty. Dignity of a prisoner is not diminished on being convicted for the crime. Prisons are
for reform and rehabilitation. Human rights are an essential component in any measure of penal reform. The humanitarian
approach should be considered in a penal administration. Prison houses are made within the geographical boundaries of the
nation and when Part IIIrd, Constitution of India is invoked by a prisoner it cannot be said at bay by the courts of law. The right
guaranteed under the Constitution spread the humanity. The non-compliance of the related provisions and failure to inform the
accused about his rights would nullify the trial.54
REFERENCES
1) Convention against Torture and Other Cruel, Inhuman or Degrading Treatment or Punishment, 1984.
2) Quoted, Report of All India Jail Manual Committee, 1957-59, para. 3.
3) Charles Sobhraj vs. Superintendent Central Tihar Jail, Tihar New Delhi, AIR 1978 SC 1514.
4) http://upprison.gov.in/pdf/admin_rpt_2010_final.pdf last visited on 25/7/21
5) Sunil Batra vs. Delhi Administration (II), AIR 1980 SC 1579.
6) P. C. Harigovind, “The Indian Jurisprudence on Prison Admistration and the Legislative Concerns”, IOSR Journal of
Humanities and Social Science (IOSR-JHSS) Volume 9, Issue 5 (Mar. - Apr. 2013), PP 24-29 e-ISSN: 2279-0837, p-ISSN:
2279-0845. www.Iosrjournals.Org
7) section 3(1) of The Prisons Act, 1894.
8) Scection 53 of Indian Penal Code,1860 (Act no. 45 of 1860)
9) John Lewis Gillin, “Criminology & Penology”, rev. ed., 1935, pp.203-204
49 ibid. 50 Louis N Robinson, "Contradictory Purposes in Prisons", Journal of Criminal Law and Criminology, 37:449-457, March-April,
1947. 51 In Re 1382 Prisons case (2018) 52 R. V. Kelkar's, Criminal Procedure, Fifth Edition 2008, Eastern Book Company, page 88. 53 Empress vs. Madar, 1885 AWN 59 54 Suk Das vs. Union Territory of Arunachal Pradesh, 1986 SCC (Cri.) 166.

Prison Administration in context with Prisoner’s rights in India
IJMRA, Volume 5 Issue 05 May 2022 www.ijmra.in Page 1016
10) Manu Smriti VII, 15 quoted by P.Ishwara Bhat, in “Fundamental Rights” Eastern Law House, page 56
11) Indra J. Singh, Indian Prison-A sociological Enquiry, concept, New Delhi, p. 20.
12) Prof. N.V.Paranjape, “Criminology, Penology & Victimology”, Central Law Publications, 15th Ed. Reprint 2012, page 428.
13) Mohammad Hamid Khuraishi, Rajgir, revised by A. G. Ghose , Director General of Archaeology, New Delhi,1958,p.p.27-28
14) Gairola, Vachaspati: Arthasastra of Kautilya, Chaukhamba Vidyabhawan, Varanasi, 2003, pp.95-96.
15) A.L. Srivastava, “The History of India: 1000A.D. 1707 A.D”, Ist Edn.1964, p.522
16) C.S.Malliah, op. cit., p. 36.
17) Jadunath Sarkar, Mughal Administration, M.C. Sarkar Sons Calcutta 1952, pp. 103-107.
18) Zubair Ahmed, “Jail reforms in India: A study of Indian jail Reform Committees”, published in International Journal of
Multidisciplinary Education and Research ISSN: 2455-4588; Volume 1; Issue 3; May 2016; Page No. 01-04(page 1)
19) Reforms of Indian Jail Committee, 1864
20) The Imperial Gazetter of India, The Indian Empire, Vol. IV-Administrative, p. 399.
21) R.N. Datir, op. cit., p. 58.
22) supra noted at 15.
23) N.V. Paranjape, Criminology & Penology with Victimology, Central Law Publications; Sixteenth Edition; 2014, p 479
24) Govt. of India: Ministry of Home Affairs, Report of All India Committee on Jail Reforms, 1980-83, p.1. (Referred also in
Article Rights of the Prisoners: Behind the Bars, published in Criminal Law Journal, 2010 Journal 179p.)
25) Prof. N. V. Paranjape, “Criminology & Penology with Victimology”, Central Law Publications, Reprint 2012, page 431.
26) Justice Mulla submitted its' Report on Jail Reforms to Home Ministry on 31st March, 1983.
27) State of Gujarat vs. Hon'ble High Court of Gujarat, AIR 1998 SC 3164.
28) State of Gujarat vs. Hon'ble High Court of Gujarat, AIR 1998 SC 3164, referred in an article by Apoorva Goyal, “Victim's
Right to Access to Justice”, Criminal Law Journal 2012 Journal 196 p.
29) supra noted as 19, page 432
30) Section 5 of the Prisons Act, 1894.
31) Section 6 of the Prisons Act, 1894
32) Section 11 of the Prisons Act, 1894
33) UP Jail Manual, 1894, Rule 22.
34) Damal H Walcott v. Superintendent, Nagpur Central Prison, 1971 Bom LR 436
35) Section 13 of the Prisons Act, 1894
36) Section 14 of the Prisons Act, 1894
37) Section 15 of the Prisons Act, 1894
38) Medical subordinate referred to in section 6 of the Prison Act, 1894(IX of 1894), in this Manual described as Assistant
Medical Officer.
39) UP Jail Manual, 1894, Rule 20
40) Section 16 of the Prisons Act, 1894
41) section 17 of the Prisons Act, 1894
42) section 18 of the Prisons Act, 1894
43) section 19 of the Prisons Act, 1894
44) Section 21, 22, 23 of The Prisons Act, 1894
45) Section 10 of Prisons Act, 1894
46) upprison.gov.in/pdf/admin_rpt_2010_final. pdf.
47) Sutherland and Cressey, “Principles of Criminology”, Sixth Edition, Surjeet Publications, p. 460-461
48) Louis N Robinson, "Contradictory Purposes in Prisons", Journal of Criminal Law and Criminology, 37:449-457, March-April,
1947.
49) In Re 1382 Prisons case (2018)
50) R. V. Kelkar's, Criminal Procedure, Fifth Edition 2008, Eastern Book Company, page 88.
51) Empress vs. Madar, 1885 AWN 59
52) Suk Das vs. Union Territory of Arunachal Pradesh, 1986 SCC (Cri.) 166.
There is an Open Access article, distributed under the term of the Creative Commons Attribution – Non Commercial
4.0 International (CC BY-NC 4.0)
(https://creativecommons.org/licenses/by-nc/4.0/), which permits remixing, adapting and building upon the work
for non-commercial use, provided the original work is properly cited.

INTERNATIONAL JOURNAL OF MULTIDISCIPLINARY RESEARCH AND ANALYSIS
ISSN(print): 2643-9840, ISSN(online): 2643-9875
Volume 05 Issue 05 May 2022
DOI: 10.47191/ijmra/v5-i5-19, Impact Factor: 6.261
Page No. 1017-1029
IJMRA, Volume 5 Issue 05 May 2022 www.ijmra.in Page 1017
Total Quality Management School Practices, Implementation of
ISO 9001: 2015 Quality Management System and Performance of
Schools in the Division of Santa Rosa City, Laguna
May B. Basbas, LPT PhD
Celina Plains Subdivision Barangay Pooc, Santa Rosa City, Laguna, Philippines 4026
ABSTRACT: The study aimed at determining the total quality management school practices, level of implementation of ISO 9001:
2015 quality management system and level of performance of schools in the Division of Santa Rosa City, Laguna. Descriptive-
correlational research method was employed using self-made survey questionnaire. The study revealed that the respondents
strongly agreed on the total quality management school practices with an overall weighted mean of 3.50. Similarly, the level of
implementation of ISO 9001: 2015 quality management system was very high with an overall weighted mean of 3.48 and the level
of performance of schools was very high with an overall average of 3.53. The relationship ranged from moderate to high
correlation with a probability value of 0.000 for all variables at 0.01 level of significance revealed a significant relationship between
the total quality management school practices and level of implementation of ISO 9001: 2015 quality management system,
between the total quality management school practices and level of performance of schools, between level of implementation of
ISO 9001: 2015 quality management system and level of performance of schools. From the salient findings, it is imperative to
conclude that the schools in the division of Santa Rosa City focus on school practices that would instill commitment to the learning
success of the students visible in a very high learning and teaching processes with the support of school resources and external
engagement. Recognizing the value of implementing ISO 9001: 2015 quality management system for the improvement of the
school operations gives significant impact both in the micro or macro level of school management, thus improves the performance
of school heartened on a learner-centered, inclusive and inspiring learning environment.
KEYWORDS: Descriptive correlational research, Total Quality Management, Quality Management System, Performance.
INTRODUCTION
Total Quality Management (TQM) has a great contribution in forming the education system, adapting to it would make important
changes not only in the school operations but also in the dispense of quality education among learners, and has vital superiorities
in development of education system can meet the expectations of the stakeholders.
The concept of Total Quality Management (TQM) is considered as one of a popular concept which is used to manage the
quality of product and services comprehensively (Permana et al., 2021). Likewise, it is a structured effort by employees to
continuously improve the quality of their products and services through proper feedbacks and research, thus ensuring superior
quality of a product or service is not the responsibility of a single member (Juneja, 2021). Goetsch and Davis (2016) as cited in
Pambreni (2019) posited that total quality in reference with quality assurance is an approach to doing business that endeavors to
maximize the competitiveness of an organization through the continuous improvement of the quality of its products, services,
people, processes, and environments.
Moreover, TQM raises the entire process of encouraging everyone in the organization to participate in attempts to improve
or enhance the quality of the organizational operations. Likewise, it is the management of initiatives and procedures which aims
to achieve quality products and services. It includes key principles such as executive management, training, customer focus,
decision making, continuous improvement, organization culture, and employee involvement (Murray, 2019). With the said
perspective, TQM as mentioned by Sallis (2019) is undeniably considered as a concept of continuous improvement that may equip
every educational institution with a set of practical tools for addressing the requirements, wants and expectations of the
stakeholders.

Total Quality Management School Practices, Implementation of ISO 9001: 2015Quality Management System and Performance of Schools in the Division of Santa Rosa City, Laguna
IJMRA, Volume 5 Issue 05 May 2022 www.ijmra.in Page 1018
Educational institutions benefit from the ISO 9001 Certificate to the fullest extent possible. The Institutions' ISO 9001: 2015
Quality Management Systems aims for retrospective archiving, more regularity, and a comprehensive understanding of the
operations done. By adopting an approach that begins to use more efficient work procedures and focuses on the organization's
business goals, ISO 9001 standards will assist employees and boost customer satisfaction (Celik, 2018).
As comprehensively assumed by most organizations, Quality Management System must usually align all aspects of the
delivery of the company’s value proposition including procedural aspect and strategic objectives through its policies, operational
procedures, leadership and motivational methods, resource allocation, and distribution of information. In linking to the
educational practice , Quality Management System contributes to the overall system of quality processes of the educational
organizations (Gordon, 2021). Thus, it forms an integral part of the current socio-economic and environmental challenges, quality
standards which ought to be dynamic and flexible so as to cater for the different stakeholders of the educational institutions
(Kounis, 2018).
Furthermore, QMS (Quality Management System) is as useful as it can be for it serves as a coherent framework for
systematically integrating, aligning and focusing organizational processes. In connecting the above-mentioned principle in the
educational set up, it guides the educational institutions to focus on processes that would help the schools in accomplishing its
network of objectives and infrastructure of goals effectively and efficiently for the value and adeptness of processes the ensure
maximization of shareholders ‘satisfaction. Such a scope of QMS has intriguing implications on the structure of the educational
institutions considering its culture, knowledge management practices and climate.
Silva et al., (2021) posited that the organizations could follow the suggested pathway to evolve their QMS to support
solutions to some of the current challenges. At the same time, quality managers could reflect on their future professional
challenges. This work has taken a step forward, indicating sustainable quality management systems as a viable pathway to explore
QM knowledge regarding the emergency paradigm, thus enhancing leadership’s role (Silva, et al., 2021).
Consequently, an empirical research confirms that, in accordance with its conformance purpose, ISO 9001 is successful
in building conformance capability and that by using ISO 9001 practices companies can also benefit in relation to production
economics through improved process efficiency, and also to other competitive capabilities. On the other hand practitioners cannot
expect ISO to improve the level of product quality, and consecutively provide associated customer satisfaction and continuous
improvement. Improving the level of product quality is not within the scope of ISO 9001; instead it has to be determined within
the process of developing business strategy (Rusjan & Castka, 2021).
In view of this, the Department of Education (DepEd) issued DO 009 s.2021 or called Institutionalization of a Quality
Management System in the Department of Education which aims to provide offices of DepEd and schools with guidelines and
standards to integrate DepEd internal systems and processes, upgrade people capacity, ensure consistency in the delivery of
quality services, and foster continuous improvement that will result in enhanced and sustained client satisfaction. The department
saw the benefits on establishing a QMS certifiable to ISO standards which includes improvement of quality of service through
streamlining and standardization of processes and reduction of variability in implementation, increase on productivity and
efficiency through clarity in processes and process holders, strengthened accountability through transparent communication
within and among offices and personnel in the organization and its external stakeholders, enhancement of client satisfaction
through improvement of the organization’s ability to fully understand and consistently meet client requirements, and continuous
performance excellence through institutionalization of continuous improvement as a core value and practice of the Department.
The establishment of DepEd National Quality Management System (QMS) wherein the respective QMS of DepEd offices and
schools are established, implemented, and aligned in accordance with standards in these guidelines aimed at integrating DepEd’s
internal process within and across governance levels to ensure consistency in the delivery of quality services to achieve client
satisfaction (DepEd Circular, 2016).
Nonetheless, despite the number of studies that investigated particularly on knowledge and adherence to total quality
management, ISO standards and Quality Management System in selected public secondary schools in the country, no study yet
has been conducted in the schools in the division of Santa Rosa City, Laguna concerning total quality management school
practices, implementation of ISO 9001: 2015 quality management system and performance of schools.
Thus, the study is valued for it would help the schools in the division of Santa Rosa City, Laguna particularly the school
heads to identify skills deficiencies among the members of the teaching force which can easily be addressed through the conduct
of the necessary training activities and implementation of comprehensive educational programs and reforms. With emphasis on
collaboration, this can serve as a guide for the schools in the division of Santa Rosa City, Laguna in the creation of the cross-
functional academic teams and knowledge sharing mechanisms that would indeed contribute to the attainment of quality
education needed in today’s learning continuum and for the improvement of the school operations as a whole. From the

Total Quality Management School Practices, Implementation of ISO 9001: 2015Quality Management System and Performance of Schools in the Division of Santa Rosa City, Laguna
IJMRA, Volume 5 Issue 05 May 2022 www.ijmra.in Page 1019
aforementioned viewpoints, the researcher underscored that Total Quality Management school practices and implementation of
ISO 9001: 2015 Quality Management System could be the antecedents of the performance of selected schools in the city divisions
of Laguna province.
METHODS
The study used descriptive-correlational research method since it determined the total quality management school practices,
implementation of ISO 9001: 2015 quality management system and level of performance of schools in the Division of Santa Rosa
City, Laguna for the Academic Year 2021-2022. Likewise, it sought significant relationships that exist among variables and it
measured the strength and level of such correlation. The primary data used in the study was randomly selected from Teachers I-
III and Master Teachers of ten (10) public secondary schools in the division of Santa Rosa city, Laguna. The sample size was taken
using the Slovin’s formula with 5% margin of error resulting to 263 out of 767 Teachers I-III and 27 Master Teachers with a total
of 290 respondents from 794 total population.
The researcher used three sets of self-made survey questionnaire. The survey questionnaire was validated using the
Cronbach’s reliability test. The first set contained statements to determine total quality management school practices which was
measured using the Likert-Typed Scale (4-Strongly Agree, 3-Agree, 2-Disagree, 1- Strongly Disagree). The second set of survey
questionnaire included statements to determine the level of implementation of ISO 9001: 2015 quality management system which
was measured using the Likert-Typed Scale (4-Strongly Agree/Very high, 3-Agree/High, 2-Disagree/ Low, 1- Strongly Disagree/Very
Low). The third set composed of statements to determine the level performance of schools in terms access, quality and governance
using the Likert-Typed Scale (4-Strongly Agree/Very high, 3-Agree/High, 2-Disagree/ Low, 1- Strongly Disagree/Very Low).
Following the ethical principles of the study, the researcher secured a letter of request asking approval from the Schools
Division Superintendent of Santa Rosa City for the conduct of the study. Upon received of an endorsement and approval letter,
the researcher sought the approval of to the concerned school heads of the selected schools. The questionnaire was administered
by the researcher to the respondents of the study following the safety protocols to adhere to the health standards set by the Inter-
agency Task Force (IATF) related to the COVID - 19 pandemic. The researcher explained to the respondents about the nature of
their participation in the investigation and discussed with them the instructions to follow for easy and convenient ways of
answering the survey forms. The respondents were assured that the information that they would provide with the researcher
would be treated with confidentiality as part of the ethical considerations of the study. Individual consent of the respondent was
obtained explaining to them that this investigation was simply an academic requirement and would be kept with utmost privacy.
The accomplished questionnaires were collected right after they had answered by the respondents and the gathered data were
tallied, tabulated, analyzed and interpreted. Pearson -r was used to ascertain the relationship between variables while weighted
mean and ranking were used to determine the total quality management school practices, level of implementation of ISO
9001:2015 Quality Management System and the level of performance of schools.
RESULTS AND DISCUSSIONS
Discussion of the total quality management school practices, ISO 9001:2015 quality management system, and performance of
schools is presented in the succeeding tables:
Table 1. Composite Table for the Total Quality Management School
Indicators Weighted Mean Verbal Interpretation Rank
1. Service to customer 3.49 Strongly Agree 6.5
2. Leadership 3.47 Strongly Agree 9
3. Physical environment and resources 3.52 Strongly Agree 3.5
4. Effective learning and teaching 3.54 Strongly Agree 1
5. Students 3.49 Strongly Agree 6.5
6. Staff 3.44 Strongly Agree 8
7. External relations 3.52 Strongly Agree 3.5
8. Organizations 3.53 Strongly Agree 2
9. Standards 3.51 Strongly Agree 5
Overall Weighted Mean 3.50 Strongly Agree
Legend: 3.25-4.00- Strongly Agree (4), 2.5-3.24 Agree (3), 1.75-2.49 Disagree (2) 1.00- 1.74 Strongly Disagree (1)

Total Quality Management School Practices, Implementation of ISO 9001: 2015Quality Management System and Performance of Schools in the Division of Santa Rosa City, Laguna
IJMRA, Volume 5 Issue 05 May 2022 www.ijmra.in Page 1020
It is shown in table 1 that the respondents strongly agreed on the total quality management school practices as evidenced
by overall weighted mean of 3.50 in all practices revealed that the schools in the Division of Santa Rosa City improved learners’
academic competence through enhancement of the learning and teaching processes which in turn may help the teachers develop
their pedagogical skills. In addition, an effective management of resources and external supports. Kistiani and Permana (2019),
theorized that Total quality management is the management of initiatives and procedures which aims to achieve quality products
and services through leadership and physical environment and resources of the organization. It includes key principles such as
executive management, training, customer focus, decision making, continuous improvement, organization culture, and external
relations (Murray, 2019).
Paragas (2020) made a descriptive study which determined and analyzed the total quality management practices of public
secondary school heads. The study included the school heads and teachers in all Schools Division in Pangasinan. The identified
quality management practices are based on the parameters of APPES Manual. Findings of the study revealed that stakeholders
were truly a great agent in improving the public secondary schools. Therefore, school heads must be eager to do this to have a
strong partnership and participation of the stakeholders in the school.
On the other hand, Suleman (2017) revealed that public secondary schools encountered a lot of obstacles in implementing
TQM. Poor and ineffective leadership; a lack of proper physical environment and resources; workforce insubordination; a lack of
management commitment; poor and ineffective planning; poor teacher morale; political interference and externa relations ; poor
PTA performance; poor infrastructural facilities; a lack of competent teaching staff; an unstable curriculum; an unfavorable school
environment; and a lack of textbooks and instructional materials were among the challenges. TQM has unquestionably great
promise in the field of education. It should not be assumed that there will be no difficulties or roadblocks in implementing TQM
in education. However, in terms of service to customer, the schools in the Division of Santa Rosa City made appropriate strategies
like creating different platforms to guarantee that information reach the customers on time. Establishing a pro-active leadership
results a sense of ownership among personnel that leads to become more socially responsible and accountable in every decision
they make in all levels of organization and carried out well a continuous improvement in the quality of education services and
labor processes to ensure the attainment of the expected standards.
Table 2. Composite Table for the Level of Implementation of ISO 9001: 2015 Quality Management System of Schools
Indicators
Weighted Mean Verbal
Interpretation
Rank
1. Leadership 3.48 Very High 4.5
2. Engagement of people 3.50 Very High 1.5
3. Improvement 3.46 Very High 7
4. Customer focus 3.49 Very High 3
5. Process approach 3.47 Very High 6
6. Evidenced-based decision making 3.48 Very High 4.5
7. Relationship engagement 3.50 Very High 1.5
Overall Weighted Mean 3.48 Very High
Legend: 3.25-4.00- Strongly Agree/Very High (4), 2.5-3.24 Agree/High (3)
1.75-2.49 Disagree/low (2), 1.00- 1.74 Strongly Disagree/Very Low (1)
From the data shown in table 2, an average weighted mean of 3.48 revealed that the level of implementation of ISO
9001: 2015 quality management system of schools in the division of Santa Rosa city, Laguna was very high. Nabaho et al., (2020)
stated in their study the overall impact of implementation of ISO on various business performance factors. These performance
factors include information quality, operating performance, design performance, environmental performance, product and
service quality, supplier and customer focus, relationship engagement, process approach and competitive priorities.
Nabaho et al., (2020) stated in their study the overall impact of implementation of ISO on various business performance
factors. These performance factors include information quality, operating performance, design performance, environmental
performance, product and service quality, supplier and customer focus, relationship engagement , process approach and
competitive priorities. This is obviously implied that the schools’ objectives for refining its products or services, processes,
structures and management system using the results of the analysis and evaluation of its performance were well defined and the
people were empowered to join in and contribute to the fruitful attainment of school initiatives.

Total Quality Management School Practices, Implementation of ISO 9001: 2015Quality Management System and Performance of Schools in the Division of Santa Rosa City, Laguna
IJMRA, Volume 5 Issue 05 May 2022 www.ijmra.in Page 1021
Rusjan and Castka (2021),which postulated that, in accordance with its conformance purpose, ISO 9001 is successful in
building conformance capability and that by using ISO 9001 practices companies can also benefit in relation to production
economics through improved process efficiency, people engagement, customer focus and also to other competitive capabilities.
On the other hand, practitioners cannot expect ISO to improve the level of product quality, and consecutively provide associated
customer satisfaction and continuous improvement. Improving the level of product quality is not within the scope of ISO 9001;
instead, it has to be determined within the process of developing business strategy.
Kenya Seed Company has adopted organizational practices in line with ISO 9000:2008. The study analyzed the effect of
ISO 9000:2008 certification practices of leadership, continual process improvement, people involvement, customer focus and
mutual beneficial supplier relationship on operational performance of Kenya Seed Company, Kenya. The objective of the study
was to determine the effect of these practices on operational performance. A conclusion came up with a need for the company
to assess the company’s engagement with suppliers. This means that the schools in the Division of Santa Rosa City, Laguna,
recognized their institutional allies for the support extended to them hence, invited concerned parties that could help achieve the
institutional objectives and a well-communicated mission and vision to the entire school community for the employees to
internalize the very essence of the organization’s existence.
Table 3. The Level of Performance of Schools in the Division of Santa Rosa City, Laguna
Indicators Weighted
Mean
Verbal Interpretation Rank
Access
1. establishes enrolment processes in school to ensure that
all-aged learners are included in quality basic education.
3.61 Very High 1
2. uses an accurate and reliable computer-based enrolment
system that updates learners’ information data to ensure
consistency in registration of learners.
3.53 Very High 5
3. prepares safe learning environment conducive for learning
and development of learners.
3.59 Very High 2
4. strengthens community participation in all processes and
activities.
3.58 Very High 3
5. implements intervention initiatives that help improve
students’ retention rate .
3.55 Very High 4
Average 3.57 Very High
Quality
1. provides technical assistance on instruction consistent to
teaching standards and pedagogies to improve practice
and performance.
3.55 Very High 2
2. institutionalizes integration of career awareness and
opportunities into the school curriculum and other
learning experiences.
3.50 High 5
3. initiates on the innovative use of learning assessment tools
and strategies consistent with curriculum requirements.
3.52 Very High 3
4. contextualizes learning standards to effectively assist
teachers in making the curriculum relevant for learners.
3.51 Very High 4
5. promotes a learner-centered, inclusive and motivating
learning environment .
3.56 Very High 1
Average 3.53 Very High
Governance
1.implements the school developmental plans that reflect
institutions’ goals and objectives.
3.53 Very High 1

Total Quality Management School Practices, Implementation of ISO 9001: 2015Quality Management System and Performance of Schools in the Division of Santa Rosa City, Laguna
IJMRA, Volume 5 Issue 05 May 2022 www.ijmra.in Page 1022
2.promotes a culture of research to produce datadriven and
evidence-based innovations to improve school performance
and foster continuous improvement.
3.47 Very High 4.5
3.establishes a culture of transparency in the delivery of basic
educations services such as allocation, procurement and
disbursement.
3.49 Very High 3
4.creates collaborative actions with stakeholders in solving
complex issues on learner development and evolving needs
of school.
3.50 Very High 2
5.empowers school personnel in designing and implementing
needs-based programs in the school that support the
development of learners.
3.47 Very High 4.5
Average 3.49 Very High
Overall Weighted Mean 3.53 Very High
Legend: 3.25-4.00- Strongly Agree (4), 2.5-3.24 Agree (3), 1.75-2.49 Disagree (2)
1.00- 1.74 Strongly Disagree (1)
From the data shown, the level of performance of schools in the Division of Santa Rosa City in has a weighted mean of
3.75 for access, 3.53 for quality and 3.49 for governance with an overall weighted mean of 3.53. The overall weighted mean of
3.53 revealed a very high level of implementation in terms of access, quality and governance.
Linao & Gosadan (2019) aimed to find out if the school-based management system level
of implementation significantly influences the school performance. Most of the administrators’ school performance was meeting
the standards in the NAT average rating. School-based management system level of implementation in terms of leadership and
governance, curriculum and instruction, accountability, and continuous improvement and management of resources significantly
influence school performance. All of these indicators are the best significant predictors of school performance. These results
further indicate that the higher is the administrators’ level of implementation on leadership and governance, curriculum and
instruction, accountability and continuous improvement, and management of resources, the higher is the level of school
performance. The developed enrolment processes in school heartened a learner-centered, inclusive and inspiring learning
environment , and implemented the school developmental plans that reflected institutions’ goals and objectives.
Msallam et.al (2020), suggested a higher management focus on deepening and increasing awareness of total quality
management among university college administrative leaders and employees by incorporating them into training programs,
workshops, conferences, and seminars, as well as informing them of successful international university experiences in the field of
total quality management. Moreover, school performance is measured through the level of School – based management. SBM
practices related to school leadership, the school improvement process, and school performance accountability were discovered
to be linked to school leadership and staff development.
Table 4. Relationship between Total Quality Management School Practices and Level of Implementation of ISO 9001: 2015
Quality Management System of Schools in the Division of Santa Rosa City, Laguna
TQM
School
Practices
Level of Implementation of ISO 9001: 2015 Quality Management System
Leadership Engageme
nt of people
Improvem
ent
Customer
focus
Process
approach
Evidencedbased
decision making
Relationship
engagement
Service to
customer
r=0.700**
Moderate
correlation
p=0.000
r=0.698**
Moderate
correlation
p=0.000
r=0.669**
Moderate
correlation
p=0.000
r=0.732**
Moderate
correlation
p=0.000
r=0.702**
Moderate
correlation
p=0.000
r=0.706**
Moderate
correlation
p=0.000
r=0.727**
Moderate
correlation
p=0.000

Total Quality Management School Practices, Implementation of ISO 9001: 2015Quality Management System and Performance of Schools in the Division of Santa Rosa City, Laguna
IJMRA, Volume 5 Issue 05 May 2022 www.ijmra.in Page 1023
Leadership r=0.747**
Moderate
correlation
p=0.000
r=0.729**
Moderate
correlation
p=0.000
r=0.734**
Moderate
correlation
p=0.000
r=0.742**
Moderate
correlation
p=0.000
r=0.734**
Moderate
correlation
p=0.000
r=0.745**
Moderate
correlation
p=0.000
r=0.713**
Moderate
correlation
p=0.000
Physical
environme
nt and
resources
r=0.715**
Moderate
correlation
p=0.000
r=0.722**
Moderate
correlation
p=0.000
r=0.738**
Moderate
correlation
p=0.000
r=0.742**
Moderate
correlation
p=0.000
r=0.720**
Moderate
correlation
p=0.000
r=0.699**
Moderate
correlation
p=0.000
r=0.696**
Moderate
correlation
p=0.000
Effective
learning
and
teaching
r=0.753**
Moderate
correlation
p=0.000
r=0.732**
Moderate
correlation
p=0.000
r=0.753**
Moderate
correlation
p=0.000
r=0.763**
Moderate
correlation
p=0.000
r=0.740**
Moderate
correlation
p=0.000
r=0.741**
Moderate
correlation
p=0.000
r=0.727**
Moderate
correlation
p=0.000
Students r=0.656**
Moderate
correlation
p=0.000
r=0.675**
Moderate
correlation
p=0.000
r=0.664**
Moderate
correlation
p=0.000
r=0.710**
Moderate
correlation
p=0.000
r=0.668**
Moderate
correlation
p=0.000
r=0.668**
Moderate
correlation
p=0.000
r=0.694**
Moderate
correlation
p=0.000
Staff r=0.700**
Moderate
correlation
p=0.000
r=0.779**
Moderate
correlation
p=0.000
r=0.761**
Moderate
correlation
p=0.000
r=0.761**
Moderate
correlation
p=0.000
r=0.763**
Moderate
correlation
p=0.000
r=0.726**
Moderate
correlation
p=0.000
r=0.722**
Moderate
correlation
p=0.000
External
Relations
r=0.752**
Moderate
correlation
p=0.000
r=0.746**
Moderate
correlation
p=0.000
r=0.762**
Moderate
correlation
p=0.000
r=0.801**
High
correlation
p=0.000
r=0.756**
Moderate
correlation
p=0.000
r=0.739**
Moderate
correlation
p=0.000
r=0.778**
Moderate
correlation
p=0.000
Organizati
ons
r=0.806**
High
correlation
p=0.000
r=0.828**
High
correlation
p=0.000
r=0.805**
High
correlation
p=0.000
r=0.823**
High
correlation
p=0.000
r=0.827**
High
correlation
p=0.000
r=0.798**
Moderate
correlation
p=0.000
r=0.798**
Moderate
correlation
p=0.000
Standards r=0.803**
High
correlation
p=0.000
r=0.803**
High
correlation
p=0.000
r=0.792**
Moderate
correlation
p=0.000
r=0.815**
High
correlation
p=0.000
r=0.823**
High
correlation
p=0.000
r=0.797**
Moderate
correlation
p=0.000
r=0.780**
Moderate
correlation
p=0.000
**Significant @ 0.01
As shown in table 4, the relationship ranged from moderate to high correlation with a probability value of 0.000 for all
variables which were lower than the significance level at 0.01. The result revealed a significant relationship between the total
quality management school practices and level of implementation of ISO 9001: 2015 quality management system of schools in the
Division of Santa Rosa City, Laguna. The results showed that more total quality management school practices, the higher is the
level of implementation of ISO 9001: 2015 quality management system of schools in the division of Santa Rosa City, Laguna. The
findings support the study made by Sadikoglu & Olcay (2017) which explained the impacts of TQM practices on various
performance measures as well as the reasons and the barriers of the TQM practices of firms. This shown that different TQM
practices significantly affect different implementation and performance outcomes. Results revealed that primary obstacles that

Total Quality Management School Practices, Implementation of ISO 9001: 2015Quality Management System and Performance of Schools in the Division of Santa Rosa City, Laguna
IJMRA, Volume 5 Issue 05 May 2022 www.ijmra.in Page 1024
the firms face were lack of employee involvement, awareness and commitment of the employees, inappropriate firm structure,
and lack of the resources.
Table 5. Relationship between the Total Quality Management School Practices and Level of Performance of Schools in the
Division of Santa Rosa City, Laguna
TQM School Practices Level of Performance of School
Access Quality Governance
Service to customer r=0.699**
Moderate correlation
p=0.000
r=0.710**
Moderate correlation
p=0.000
r=0.688**
Moderate correlation
p=0.000
Leadership r=0.683**
Moderate correlation
p=0.000
r=0.725**
Moderate correlation
p=0.000
r=0.731**
Moderate correlation
p=0.000
Physical environment and
resources
r=0.720**
Moderate correlation
p=0.000
r=0.715**
Moderate correlation
p=0.000
r=0.673**
Moderate correlation
p=0.000
Effective learning and teaching r=0.776**
Moderate correlation
p=0.000
r=0.758**
Moderate correlation
p=0.000
r=0.752**
Moderate correlation
p=0.000
Students r=0.675**
Moderate correlation
p=0.000
r=0.733**
Moderate correlation
p=0.000
r=0.692**
Moderate correlation
p=0.000
Staff r=0.710**
Moderate correlation
p=0.000
r=0.704**
Moderate correlation
p=0.000
r=0.729**
Moderate correlation
p=0.000
External relations r=0.758**
Moderate correlation
p=0.000
r=0.757**
Moderate correlation
p=0.000
r=0.762**
Moderate correlation
p=0.000
Organizations r=0.801**
High correlation p=0.000
r=0.805**
High correlation
p=0.000
r=0.782**
Moderate correlation
p=0.000
Standards r=0.792**
Moderate correlation
p=0.000
r=0.791**
Moderate correlation
p=0.000
r=0.783**
Moderate correlation
p=0.000
**Significant @ 0.01
As shown in table 5, there was a significant relationship between the total quality management school practices and level
of performance of schools in the division of Santa Rosa City, Laguna since the relationship ranged from moderate to high
correlation with a probability value of 0.000 for all variables which were all lower than the significance level at 0.01. This means
that the more total quality management school practices, the higher is the level of performance of schools in the division of Santa
Rosa City, Laguna.
The findings support the study of Pambreni et al. (2019) mentioned in their study that the effect of total quality
management (TQM) practices on the organization performance of Small and Medium Enterprises of four critical elements of TQM
namely customer focus, continuous improvement, strategically based, and total employee involvement are used as an important
factor influencing on organization performance. The research finding indicate that TQM elements; namely customer focus,
continuous improvement, strategically based, and total employee involvement have a positive and significant effects on
organization performance.
Lushi et al. (2017), which posited that Quality management systems (QMs) are business practices that may benefit various
companies. As several empirical studies show, implementing QM effectively influences firm performance positively. Firms that
implement QM focus on providing more value for their customers or stakeholders and improving the efficiency of processes. In
this context, management system standards (MSSs) have enjoyed enormous success over the years, in the sphere of QM (ISO

Total Quality Management School Practices, Implementation of ISO 9001: 2015Quality Management System and Performance of Schools in the Division of Santa Rosa City, Laguna
IJMRA, Volume 5 Issue 05 May 2022 www.ijmra.in Page 1025
9001). This means that the quality and the satisfaction of the employees for increasing productivity, their motivation and
rewarding, the use of performance evaluation and performance measurement techniques, elimination of errors and mistakes in
the organization, concentrating on teamwork, benefitting from the experience of successful organizations, making the strategic
planning and such like targets underline at the sense of Total Quality Management (TQM).
Table 6. Relationship between the Level of Implementation of ISO 9001: 2015 Quality Management System and Level of
Performance of Schools in the Division of Santa Rosa City, Laguna
Level of Implementation of ISO
9001: 2015 Quality
Management System
Level of Performance of Sch ool
Access Quality Governance
Leadership r=0.815**
High correlation p=0.000
r=0.821**
High correlation
p=0.000
r=0.856**
High correlation p=0.000
Engagement of people r=0.835**
High correlation p=0.000
r=0.797**
Moderate correlation
p=0.000
r=0.808**
High correlation p=0.000
Improvement r=0.802**
High correlation p=0.000
r=0.812**
High correlation
p=0.000
r=0.853**
High correlation p=0.000
Customer focus r=0.826**
High correlation p=0.000
r=0.821**
High correlation
p=0.000
r=0.859**
High correlation p=0.000
Process approach r=0.801**
High correlation p=0.000
r=0.845**
High correlation
p=0.000
r=0.849**
High correlation p=0.000
Evidenced-based decision
making
r=0.829**
High correlation p=0.000
r=0.846**
High correlation
p=0.000
r=0.860**
High correlation p=0.000
Relationship engagement r=0.808**
High correlation p=0.000
r=0.851**
High correlation
p=0.000
r=0.817**
High correlation p=0.000
**Significant @ 0.01
As shown in table 6, the relationship ranged from moderate to high correlation with a probability value of 0.000 for all
variables which were all lower than the significant level of 0.01 which reveled that there was a significant relationship between
the level of implementation of ISO 9001: 2015 quality management system and level of performance of schools in the division of
Santa Rosa City, Laguna. The results imply that higher the level of implementation of ISO 9001: 2015 quality management system,
the higher the level of performance of schools in the division of Santa Rosa City, Laguna.
The findings support the study made by Bhatia (2018), which explicated that a number of organizations have
implemented Quality Management Systems (QMS) to create a culture of continuous quality improvement and improve business
performance. These standards cover aspects such as management leadership, process management, teamwork, quality
improvement, and supplier and customer relations. He found out the impact of implementation of QMS on various business
performance factors which include information quality, operating performance, design performance, environmental performance,
product and service quality, supplier and customer relationships and competitive priorities. The assessment of Figueroa (2020) on
the returns of the Quality Management System (QMS) in relation to Capitol University’s quest for excellence covering School Year
2005-2009 revealed that this university’s QMS has constantly implemented and maintained management responsibility; has at all
times implemented and maintained its human resource quality management; and that QMS has often achieved its product
realization. Implementation and constant monitoring of QMS find satisfaction in the university’s employees.

Total Quality Management School Practices, Implementation of ISO 9001: 2015Quality Management System and Performance of Schools in the Division of Santa Rosa City, Laguna
IJMRA, Volume 5 Issue 05 May 2022 www.ijmra.in Page 1026
CONCLUSION
The schools in the division of Santa Rosa City, Laguna recognized the value of total quality management school practices and
effective implementation of ISO 9001: 2015 quality management system. High level of school performance is dependent on the
number total quality management practices and the level of implementation of quality management system. Teachers looked at
all these practices and implementation as essential in its mission of towards the achievement of vision. Moreover, the developed
pedagogical skills among teachers helped improve the learning and teaching processes to achieve a very high level of high
academic competence for the students in response to the target quality basic education, heartened a learnercentered, inclusive
and inspiring learning environment, and implemented the school developmental plans that reflected institutions’ goals and
objectives.
RECOMMENDATION
The study has some limitations particularly on the sample size since the respondents covered only teachers 1-3 and master
teachers of the division of Santa Rosa during the Academic year 2021-2022 and the use of quantitative method of research. For a
more comprehensive result, it is recommended for future researchers to replicate the study using a qualitative method of research
presentation including head teachers as participants. to understand deeply the teachers’ context of practices and implementation
in their respective schools. Moreover, the city schools should prepare a contingency plan in the event that the level of
implementation and practices fall below the high level of implementation and adapting agreeable school programs with
stakeholders to sustain external and relationship engagement such as parents working with their children to develop learning
skills, teachers collaborate with co-workers, and LGUs support in school programs. This would also ensure that services rendered
are based on customer satisfaction.
REFERENCES
1) Angelos Pantouvakis & Maria Karakasnaki (2017) Role of the human talent in total quality management–performance
relationship: an investigation in the transport sector, Total Quality Management & Business Excellence
2) Ahmed, W. (2017). ISO 9001 Transition and its Impact on the Organizational Performance: Evidence from Service
Industries of Pakistan. https://www.ijrbsm.org/papers/v4-i3/4.pdf
3) Ahmudi, B. & Handayani, N. (2018). Effectiveness analysis of ISO 9001:2015 implementation at manufacturing industry.
https://www.shs-conferences.org/articles/shsconf/pdf/2018/10/shsconf_ices2018_01008.pdf
4) Assignment Point (2021). Research paper on Total Quality Management (TQM).
https://www.assignmentpoint.com/business/management/research-paper-on-total-qualitymanagement-tqm.html
5) Baba, S. & Ganie, S. (2019). Total Quality Management in Academic Perspective: An Overview.
https://digitalcommons.unl.edu/libphilprac/3007/
6) Bhaita, M. (2018). Assessing the Impact of Quality Management Systems on Business Performance.
https://spectrum.library.concordia.ca/id/eprint/978016/
7) Bester field, D., et al. (2018). Total Quality Management.
http://www.uop.edu.pk/owecontents/Total%20Quality%20Management%20by%20Dale%20H.%20Besterfield,%20Caro
l%20Besterfield-Michna,%20Glen%20H.%20Besterfield,%20Mary%20BesterfieldSacre,%20Hemant%20Urdhwareshe,
%20Rashmi%20Urdhwarshe%20(z-lib.org).pdf
8) Blanco, K., et al. (2019). Interrelation of Senior High School Academic Performance and College Basic Accounting
Performance: A Case of First Year Bachelor of Science in Accountancy Students of University of Batangas. Interdisciplinary
Research Journal, 11(1). Retrieved from http://ejournals.ph/form/cite.php?id=16343
9) Bunglawa, A. & Asthana, N. (2016). Increasing Service Quality in Education: Views of Principals and Teachers.
https://www.ejmste.com/download/increasing-service-qualityin-education-views-of-principals-and-teachers-4913.pdf
10) Calla, A. B.. (2018). Total Quality Management of Notre Dame Educational Association Higher Education Institutions.
PAGE CODGE REGION XI (Multidisciplinary Research), 1(1). Retrieved from http://ejournals.ph/form/cite.php?id=14456
11) Cetinderea, et. al, (2019), The effects of total quality management on the business performance: An application in the
province of Kütahya. https://www.sciencedirect.com/science/article/pii/S2212567115003664
12) Celik, B. (2018). What is the Contribution of ISO 9001 Quality Management System to Educational Institutions?.
https://www.researchgate.net/profile/BunyaminCelik/publication/334246172_What_is_the_Contribution_of_ISO_900
1_Quality_Manag ement_System_to_Educational_Institutions/links/5e56f29b4585152ce8f27c96/What-isthe-
Contribution-of-ISO-9001-Quality-Management-System-to-EducationalInstitutions.pdf

Total Quality Management School Practices, Implementation of ISO 9001: 2015Quality Management System and Performance of Schools in the Division of Santa Rosa City, Laguna
IJMRA, Volume 5 Issue 05 May 2022 www.ijmra.in Page 1027
13) Crosby (2017) Total Quality Management (TQM) http://asq.org/learn-about-quality/total-quality-management/
overview/overview.html
14) De Leon, P. C. (2017). Sustaining Tqm In An Iso 9001:2008 – Certified Philippine Lgu: The Case Of Calapan City.
http://ejournals.ph/form/cite.php?id=16302
15) DepEd Memo (2021). Institutionalization of a Quality Management System in the Department of Education.
https://www.deped.gov.ph/2021/02/24/february-24-2021-do009-s-2021-institutionalization-of-a-quality-management-
system-in-the-department-ofeducation/
16) Domingues, P., et al. (2019). The added value of the ISO 9001:2015 international standard from an auditors’ perspective:
A CB-SEM based evaluation. https://www.researchgate.net/publication/337497623_The_added_value_of_the_ISO_900
12015_international_standard_from_an_auditors'_perspective_A_CBSEM_based_evaluation
17) Fabian, G., et al. (2019). The Impact Of Iso Certification Towards Work- Life Balance Of Selected Employees Of Letran-
Calamba. Ani: Letran Calamba Research Report2. http://ejournals.ph/form/cite.php?id=10965
18) Figueroa, E. E.. (2020). Quality Management System: A Strategic Response to Attaining Academic Excellence.
http://ejournals.ph/form/cite.php?id=1586
19) Gordon, J. (2021). Quality Management System (QMS) – Explained.
https://thebusinessprofessor.com/en_US/mgmt-operations/quality-management-systemqms-defined
20) Gremyr, I., et al. (2021). Increasing the value of quality management systems.
https://www.emerald.com/insight/content/doi/10.1108/IJQSS-10-2020-0170/full/html
21) Hadian, D. (2018). The Development of Quality Management System ISO 9001. https://researchleap.com/development-
quality-management-system-iso-9001/
22) Juneja, P. (2020). Total Quality Management - Meaning and Important Concepts.
https://www.managementstudyguide.com/total-quality-management.htm
23) Khanam, S. (2017), “Role of Information Technology in Total Quality Management: A Literature
Review”.https://papers.ssrn.com/sol3/papers.cfm?abstract_id=2725096
24) Kounis, L. (2018). Quality Management Systems: a Selective Presentation of Case- studies Showcasing Its Evolution.
https://www.intechopen.com/books /6235
25) Kipkorir, C. & Sengwer, A. (2016). Empirical Evidence of ISO 9000:2008 Certification Practices on Operational
Performance of KenyaSeed Company. http://ejournals.ph/form/cite.php?id=12181
26) Kiran, D. R. (2017) Total Quality Management: Key Concepts and Case Studies.
https://www.sciencedirect.com/book/9780128110355/total-quality-management
27) Kristiani, D. & Permana, J. (2019). Proceedings of the 3rd International Conference on Research of Educational
Administration and Management (ICREAM 2019). https://www.atlantis-press.com/proceedings/icream-19/125933738
28) Lantajo, G. (2022). Factors Affecting Total Quality Management among Government Offices during COVID-19 Pandemic.
http://ejournals.ph/form/cite.php?id=16988
29) Linao, R. S. & Gosadan, B. D.. (2019). Meeting our Commitment: School-Based Management System in the lens of School
Performance. http://ejournals.ph/form/cite.php?id=14862
30) Lois, B., et al. (2019). Quality management system for the research process: University of Otavalo, Ecuador.
https://www.scielo.sa.cr/scielo.php?pid=S1409-4703 2019000100571&script=sci_abstract
31) Lushi, I., et al. (2016) A Literature Review On ISO 9001 Standards. https://www.idpublications.org/wp-
content/uploads/2016/01/Full-Paper-A-LITERATURE-REVIEW-ON-ISO-9001-STANDARDS.pdf
32) Madan, K. (2017). Public Servant in the Role of a Manager.
https://journals.sagepub.com/doi/abs/10.1177/0019556120060309
33) Manders, B., et al. (2018). ISO 9001 and product innovation: A literature review and research framework.
https://www.sciencedirect.com/science/article/abs/ pii/S0166497215000784
34) Mahmood, A. & Ismail, A. (2018). Factors Influencing Academic Performance of Students in Blended and Traditional
Domains. https://online journals.org/index.php/i-jet/article/view/8031
35) Manghani, K. (2017). Quality assurance: Importance of systems and standard operating procedures.
https://www.ncbi.nlm.nih.gov/pmc/articles/PMC3088954/
36) Martins, Y. & Silva, C. (2018). Risk and ISO 9001: a Systematic Literature Review.
https://www.researchgate.net/publication/327161548_Risk_and_ISO_9001_a_Systematic _Literature_Review

Total Quality Management School Practices, Implementation of ISO 9001: 2015Quality Management System and Performance of Schools in the Division of Santa Rosa City, Laguna
IJMRA, Volume 5 Issue 05 May 2022 www.ijmra.in Page 1028
37) Mashagba, I. (2017) The Impact Of Total Quality Management (TQM) On The Efficiency Of Academic Performance -
Empirical Study - The Higher Education Sector - The University Of Jordan. https://www.semanticscholar.org/paper/The-
Impact-Of-TotalQuality-Management-(TQM)-On-The-Mashagba/7c8b210636bb956f0e3bbcc2106685ea48bd9267
38) Matorera, D. (2017). Quality Management Systems in Education. https://www.intechopen.com/chapters/58341
39) Moen, R. & Norman, C. (2006). Evolution of the PDCA Cycle.
https://rauterberg.employee.id.tue.nl/lecturenotes/DG000%20DRP-R/references/MoenNorman-2009.pdf
40) Movaheda, M., et al. (2019). A study on effect of performing quality management system on organizational productivity.
https://www.researchgate.net/publication/271068409_A_study_on_effect_of_performing_quality_management_
system_on_organi zational_productivity
41) Msallam, A., et al. (2020). The Reality of Achieving the Requirements of Total Quality Management in University Colleges.
http://dstore.alazhar.edu.ps/xmlui/ handle/123456789/637
42) Murray, M. (2019). Total Quality Management and Quality Management.
https://www.thebalancesmb.com/total-quality-management-tqm-2221200
43) Nabaho, L., et al. (2020). Quality Assurance of Higher Education Governance and Management: An Exploration of the
Minimum Imperative for the Envisioned African Common Higher Education Space.
https://files.eric.ed.gov/fulltext/EJ1279859.pdf
44) Neyestani, B. & Juanzon, J. (2017). ISO 9001 Standard and Organization's Performance: A Literature Review.
file:///C:/Users/HP/Downloads/ijarm2.pdf.
45) Neyestani, B. (2016). Effectiveness of Quality Management System (QMS) on Construction Projects.
file:///C:/Users/HP/Downloads/Effectiveness%20of%20Quality%20Management%20System%20(QMS)%20on%20
Construction%20Projec ts.pdf
46) Oduwaiye, R. & Kayode, D. (2017). Total Quality Management And Students' Academic Performance In Ilorin Metropolis
Secondary Schools, Nigeria.
https://www.Researchgate.Net/Publication/280642581_Total_Quality_Management_And_Students'_Academic_
Performance_In_Ilorin_Metropolis_Secondary_Schools_Nigeria
47) Oyeniyi, O. (2017). Employees’ psychological capital, job satisfaction, insecurity, and intentions to quit: The direct and
indirect effects of authentic leadership.https://psycnet.apa.org/record/2017-06652-004
48) Pamatmat, F. (2016). Total Quality Management and School-Based Management Practices of School Principals: Their
Implications to School Leadership and Improvement. https://www.researchgate.net/publication/327665248_
Total_Quality_Management_and_School-Based_Management_Practices_of_School_Principals_Their_Implications_
to_School_Leadership_and_Improvement
49) Pambreni, Y. et al. (2019) The influence of total quality management toward organization performance.
https://www.researchgate.net/publication/333187874_The_influence_of_total_quality_management_toward_
organization_performance
50) Paragas, J. (2020). Quality Management Practices and Performance of Public Secondary School Heads in Pangasinan,
Philippines. http://ejournals.ph/form/cite.php?id=16841
51) Permana, A. et al. (2021). A systematic literature review of Total Quality Management (TQM) implementation in the
organization. https://www.researchgate.net/publication/348918996_A_systematic_literature_review_of_Total_
Quality_Management_TQM_implementation_in_the_organization
52) Peters, T. & Waterman, R. (2017). In Search of Excellence.
https://newlearningonline.com/new-learning/chapter-3/peters-and-waterman-insearch-of-excellence
53) Petkovskam, S. & Gjorgjeska, B. (2018). The significance of the quality management system in making management
decisions. https://core.ac.uk/display/35333813?utm_source=pdf&utm_medium=banner&utm_campaign=pdf-
decoration-v1
54) Pillai, L. & Vallatharai, L. (2021). Total Quality Management in Education.
http://naac.gov.in/docs/Books/Total%20Quality%20Management%20for%20Tertiary%2 0Education.pdf
55) Polka, W. S., et al. (2018). Catholic School Principals’ Decision-Making and Problem- Solving Practices During Times of
Change and Uncertainty: A North American Analysis. Journal of Catholic Education, 20(1). Retrieved from:
https://digitalcommons.lmu.edu/cgi/viewcontent.cgi?referer=https://scholar.google.com/
&httpsredir=1&article=1886&context=ce

Total Quality Management School Practices, Implementation of ISO 9001: 2015Quality Management System and Performance of Schools in the Division of Santa Rosa City, Laguna
IJMRA, Volume 5 Issue 05 May 2022 www.ijmra.in Page 1029
56) Prestiadi, D., et al. (2017). Visionary Leadership in Total Quality Management: Efforts to Improve the Quality of Education
in the Industrial Revolution 4.0. https://www.researchgate.net/publication/338445162_Visionary_Leadership_
in_Total_Q uality_Management_Efforts_to_Improve_the_Quality_of_Education_in_the_Industrial_ Revolution_40
57) Revilla, R., et al. (2019). Constructing the Constructs of Quality Management and Work Productivity from the Lenses of
Two Generational Cohorts: Millennial and NonMillennial. http://ejournals.ph/form/cite.php?id=11368
58) Rusjan, B. & Castka, P. (2021). Understanding ISO’s 9001 Benefits and Research through an Operations Strategy
Framework. https://www.fmkp.si/en/zalozba/ISSN/1581-6311/8_097-118.pdf
59) Sadikoglu, E. & Olcay, H. (2017). The Effects of Total Quality Management Practices on Performance and the Reasons of
and the Barriers to TQM Practices in Turkey. https://www.hindawi.com/journals/ads/2014/537605/
60) Sallis, E. (2011). Total Quality Management in Education.
https://www.routledge.com/Total-Quality-Management-inEducation/Sallis/p/book/9780749437961
61) Sharma, S. (2018) Total Quality Management: Concepts, Strategy and Implementation for Operational Excellence.
https://us.sagepub.com/en-us/nam/book/total-qualitymanagement
62) Silva, C., et al. (2021) Sustainable Quality Management Systems in the Current Paradigm: The Role of Leadership.
https://www.mdpi.com/2071-1050/13/4/2056?type=check_update&version=1
63) Suleman, O. (2017). Challenges to Successful Total Quality Management Implementation in Public Secondary Schools: A
Case Study of Kohat District, Pakistan. https://www.semanticscholar.org/paper/Challenges-to-Successful-Total-
QualityManagement-A-Suleman-Gul/030e14486772428c19961e9a92f0902707df5390
64) Sokovic, M, et al. (2017). Quality Improvement Methodologies – PDCA Cycle, RADAR Matrix, DMAIC and DFSS.
http://jamme.acmsse.h2.pl/papers_vol43_ 1/43155.pdf
65) Tari, J., et al. (2017). Benefits of the ISO 9001 and ISO 14001 standards: A literature review.
https://www.econstor.eu/bitstream/10419/188490/1/v05-i02-p297_488-3206-1PB.pdf
66) Tsou, Y., et al. (2021). The Effects of Total Quality Management and Corporate Social Responsibility on Firm Performance:
A Future Research Agenda. https://www.koreascience.or.kr/article/JAKO202109554061346.page
67) Yeung, C. & Chan, L. (2017) Quality Management System development: Some implications from case studies.
https://www.sciencedirect.com/science/ article/abs/pii/S0360835298000692
68) Yucel, A. & Burak, M. (2017). Comparison of Emotional Intelligence Levels of Students Studying in Summer School of
Physical Education and Sports with Their Life Satisfaction. https://redfame.com/journal/index.php/jets/article/view
/4104
69) Zaman, A. & Anjalin, A. (2016). Implementing Total Quality Management in Education: Compatibility and Challenges.
https://m.scirp.org/papers/abstract/72759
70) Zelnik, M., et al. (2017). Quality management systems as a link between management and employees.
https://ro.uow.edu.au/cgi/viewcontent.cgi?referer=&https redir=1&article=1688&context=dubaipapers
71) Zimon, D. & Dellana, S. (2019). A longitudinal exploratory study of ISO 9001 certification abandonment in small- and
medium-sized enterprises. https://www.emerald.com/insight/content/doi/10.1108/IJQRM-10-2018-0284/full/html
There is an Open Access article, distributed under the term of the Creative Commons Attribution – Non Commercial 4.0 International (CC BY-NC 4.0) (https://creativecommons.org/licenses/by-nc/4.0/), which permits remixing, adapting and building upon the work for non-commercial use, provided the original work is properly cited.

INTERNATIONAL JOURNAL OF MULTIDISCIPLINARY RESEARCH AND ANALYSIS
ISSN(print): 2643-9840, ISSN(online): 2643-9875
Volume 05 Issue 05 May 2022
DOI: 10.47191/ijmra/v5-i5-20, Impact Factor: 6.261
Page No. 1030-1037
IJMRA, Volume 5 Issue 05 May 2022 www.ijmra.in Page 1030
The Effect of Teenage Girls Class Model to Reduce Anxiety
Symptoms of Premenstrual Syndrome
Alice Leiwakabessy1, Henny Novita2, Endah Dian Marlina3, Yuliana4 1,2,3 Midwifery Departement, Poltekkes Jakarta I 4Midwifery Departement, STIKes Budi Luhur Cimahi
ABSTRACT: Premenstrual Syndrome (PMS) occurs about 75% in women of reproductive age. The impact of anxiety symptoms
experienced during PMS is that it can interfere with daily activities both academic, work, family and social problems. The PMS
symptom reduction strategy carried out in this study was the Young Women Class with the guidance of a Young Women Class
Implementation Module which was created by the researcher containing Stress Management Materials, Personal Hygiene
Guidelines and Yoga Exercises for teenagers. The purpose of this study was to analyze the effect of female adolescent class on
reducing anxiety symptoms of premenstrual syndrome in female adolescents in 2021. The research method used a
quasiexperimental design with a pretest-pottest with control design. This Young Women class starts after menstruation is over.
Therapy is given once a month and observed 4 weeks later. Reassessment (post test) of premenstrual syndrome anxiety by using
the Hamilton Anxiety Rating Scale (HAM-A) on the respondents of both groups. The results showed that most of the control group
had a menstrual period of less than 7 days (70%), and had no history of PMS (56.7%). Likewise with the intervention group, most
of the menstruation was less than 7 days (60%), and had no history of PMS (83.3%). There was a significant difference in the level
of PMS anxiety reduction between the intervention and control groups, where the difference in the mean before and after the
intervention in the form of regular counseling in the control group was only 0.97, while in the intervention group that carried out
the Young Women's Class program it was 5.94. Based on the results of data analysis with the Mann Whitney test, a significance
value of 0.000 was obtained. Based on this value, because the p value < 0.005, it can be concluded that the Young Women Class
has an effect on reducing PMS anxiety. The results of the multivariate analysis showed that the adolescents who did not attend
the class had a higher anxiety level of 5.88 than those who attended the female youth class and those who had menstruated for
more than 7 days experienced a higher anxiety level of 0.76 than those who had menstruation for less than 7 days. 7 days. It is
recommended that midwife education and services can develop midwifery care on adolescent reproductive health in achieving
optimal health status for adolescents, so that it becomes an investment to prepare for the process of pregnancy and give birth to
a quality generation.
KEYWORDS: Young Women Class, PMS, adolescent reproductive health
I. INTRODUCTION
Women who will menstruate can experience physical and psychological changes called Premenstrual Syndrome (PMS).
Premenstrual Syndrome (PMS) occurs about 75% in women of reproductive age. The impact of anxiety symptoms experienced
during PMS is that it can interfere with daily activities both academic, work, family and social problems. This situation can cause
teenagers to experience problems in terms of achievement in school and social relations with peers or disruption of daily activities
if PMS is not handled properly. This situation is exacerbated by the COVID-19 pandemic, which can cause academic stress due to
online learning and piling up assignments. To reduce PMS symptoms can be done with stress management, complementary
therapies such as yoga and breathing exercises. The PMS symptom reduction strategy carried out in this study was the Young
Women Class with the guidance of a Young Women Class Implementation Module which was created by the researcher containing
Stress Management Materials, Personal Hygiene Guidelines and Yoga Exercises for teenagers.
Before taking action on the 2 groups, the researcher informed that the purpose of the study was to reduce the symptoms of
anxiety experienced by premenstrual syndrome. In the control group, regular counseling was given, while in the intervention
group, the Young Women class was made which started after menstruation was over.37 Based on the literature that 2 weeks

The Effect of Teenage Girls Class Model to Reduce Anxiety Symptoms of Premenstrual Syndrome
IJMRA, Volume 5 Issue 05 May 2022 www.ijmra.in Page 1031
before menstruation is the luteal phase where PMS symptoms occur, so the researcher assumes that before the PMS phase occurs,
young women are already equipped with strategies to reduce anxiety during PMS. Therapy is given once a month and observed 4
weeks later.18,28,32 Reassessment (post test) of premenstrual syndrome anxiety using HAM-A on both respondents in both groups.
The final results of this study are expected to be able to contribute to midwifery services and midwifery education in order to
support fitness care for adolescents. The results of this study are also expected to be a guide for adolescent health service
providers so that young women in Indonesia become adolescents who are physically and psychologically prosperous so that they
are able to prepare themselves for the next reproductive phase (pregnancy, childbirth and postpartum).
II. METHOD
This research method is Quasi Experimental with Pretest-Pottest with Control Design. This study aims to analyze the influence of
female adolescent classes to reduce anxiety symptoms of premenstrual syndrome in young women in 2021. The population in
this study were young women who experienced premenstrual syndrome who lived in the DKI Jakarta area. Due to the Covid-19
Pandemic conditions, the research which was originally going to be conducted face-toface (outside the network), was finally
conducted online (within the network) to young women in the DKI Jakarta area from April to November 2021. The number of
respondents was 60 people, consisting of of 30 control groups and 30 intervention groups.
The instrument in this study was a questionnaire used to collect data. The instrument used is the Shortened Premenstrual
Assessment Form (SPAF) to identify subjects who experience PMS symptoms and not PMS.15,16 After getting the subjects who had
PMS, the subjects were then weighed and weighed to calculate the Body Mass Index (BMI). Respondents were given an anxiety
scale assessment questionnaire using the Hamilton Anxiety Rating Scale (HAM-A) to obtain research subjects (adolescent girls)
who experienced anxiety. HAM-A assessed by Researchers.18 Each HAM-A scale varies from 0 to 4, with higher scores indicating
more severe anxiety. The classification of symptoms on each sub-scale can be rated with 0 if none, 1 if mild, 2 if moderate, 3 if
severe and Anxiety 4 if very severe. This instrument has been widely used in research both in America and in other countries
including Indonesia and this instrument has been validated.17,18,32 Data collection was done by distributing questionnaires via
google form. Then the subject filled out a questionnaire for 1430 days according to their menstrual cycle. Adolescent Class
Interventions and adolescent health counseling are conducted online via Zoom. Both groups continued to fill out the questionnaire
until the next menstruation return. Bivariate data analysis using Mann-Whitney test, and multivariate analysis using multiple
logistic regression.

The Effect of Teenage Girls Class Model to Reduce Anxiety Symptoms of Premenstrual Syndrome
IJMRA, Volume 5 Issue 05 May 2022 www.ijmra.in Page 1032
III. RESULTS
This research is a collaboration between Poltekkes Kemenkes Jakarta 1 and STIKES Budi Luhur which aims to analyze the Effect of
Adolescent Girls Classes to Reduce Anxiety Symptoms of Premenstrual Syndrome in Young Women. This research was conducted
by taking data from DPN Junior High School students who were given treatment in the Young
Women class for the intervention group and the control group who was given counseling.
Gambar 1. Alur Penelitian
Adolescent girls in the DKI Jakarta and Bandung are as who
experience symptoms of anxiety in premenstrual syndrome.
Informed Consent
Accepted Refused Drop out
Pretest
Group A
Treatment/
in tervention group
Kelompok B
comparison group
Post Test
The HAM - A assessment interview was conducted 4 weeks after the intervention
Processing and analys is of data
Young Women Class Basic Counseling
Randomi zed

The Effect of Teenage Girls Class Model to Reduce Anxiety Symptoms of Premenstrual Syndrome
IJMRA, Volume 5 Issue 05 May 2022 www.ijmra.in Page 1033
Table 1. Univariate analysis of respondent characteristics based on age, menarche age, menstrual cycle, weight, Height, and
BMI
In table 1, it can be concluded that the average age of respondents in the intervention and control groups is 14 and 17 years and
the minimum age is 13 years and the maximum age is 16 years. The average age at menarch of respondents in both groups was
11 and 15 years with a minimum age of 9 and a maximum age of 14 years. The average menstrual cycle of respondents in both
groups was 30 days with a minimum of 25 days and a maximum of 3 days. The average body weight of respondents in both groups
was 50 kg and 48 kg with a minimum weight of 35 kg and a maximum of 71 kg. The average height of the respondents in both
groups was 156 cm with a minimum height of 140 cm and a maximum of 172 cm. The average BMI of respondents in both groups
is 20 with a minimum BMI of 14 and a maximum of 30.
Table 2. Univariate analysis of respondents' characteristics based on the length of menstruation and maternal history
Based on table 2, obtained from 60 respondents consisting of 30 intervention groups and 30 control groups. In both groups, the
majority of respondents experienced menstruation less than 7 days with a percentage of 60% in the intervention group and 70%
in the control group. In the history of the respondent's mother who experienced PMS, the majority in both groups found that the
mother did not experience PMS, which was 83.3% in the intervention group and 56.7% in the control group.
Table 3. Bivariate Analysis of the Effect of Young Women's Class on Reducing PMS Anxiety in Both Groups
PMS Anxiety Mean Different
Mean
SD P Value
Intervention Group
Before Afetr 23,77
17,83
5,94
2,063
0,834
0,000
Control Group
Before Afetr 24,60
23,63
0,97 2,415
2,205
0,000
From table 3, it is known that there is an effect of the treatment of the female adolescent class which is shown in a significant
difference in the mean in the intervention group between the PMS anxiety scores before and after the intervention with a mean
difference of 5.94. While in the control group there is a mean difference of about 0.97 after being given regular counseling.

The Effect of Teenage Girls Class Model to Reduce Anxiety Symptoms of Premenstrual Syndrome
IJMRA, Volume 5 Issue 05 May 2022 www.ijmra.in Page 1034
From table 4, it can be analyzed that there is a significant difference in mean between the group that was given the intervention
of the adolescent class and the control group who was given counseling of 30. Based on the results of data analysis with the Mann
Whitney test, a significance value of 0, 000 was obtained. Based on this value, because the p value < 0.005 it can be concluded
that the Young Women Class has an effect on reducing PMS anxiety.
Table 5. Multivariate Analysis of the Influence of Young Women's Class on PMS Anxiety Reduction
Model Unstandardized B Coefficients
Std.Error
Standardized
Coefficients Beta t Sig.
(Constant) 10.889 .947 11.501 .000
Groups 5.876 .425 .882 13.802 .000
Menstruation
Length .763 .446 .109 1.710 .093
From table 5 above, the following equation can be made:
Y= 10,889 + 5.88 Youth Class + 0.76 Menstruation Length
- In adolescents who do not attend classes, their anxiety level will be 5.88 higher than those who take youth classes
- Adolescents who experience menstruation for more than 7 days will experience higher anxiety 0.76 compared to those who
experience menstruation for less than 7 days
IV. DISCUSSION
Effect of Young Women Class on PMS Anxiety Reduction
Based on the results of the study, there was a significant effect between the intervention group who received the female
adolescent class and the control group who only received intervention counseling, showing a significant decrease in anxiety
indicators in PMS during 3 months of observation compared to the control group who only received regular counseling
interventions. The follow-up results showed that the effects continued and persisted even after 3 months. This proves that the
integration of a holistic stress management program for adolescent girls combined with Yoga for adolescents can effectively
reduce PMS stress and anxiety levels. This finding is similar to the results of previous studies (Deckor, et all, 2016) (Johnson, et al,
2016) (Galegos, et al 2015) which highlighted that providing interventions related to stress management, mind management and
yoga in adolescents significantly reduced anxiety, depression, and stress. This study provides research evidence for
classroom/group interventions among adolescent girls and facilitates wider coverage for primary care providers to implement
such interventions in school settings.
On the concept of mental health, as a general aspect that refers to all measures used to prevent the development of mental
disorders, the mental health training developed can be considered as one of the most effective methods for creating a healthy
society and preventing stress and anxiety. (Kokkinis, 2017) The results showed that the training class, in this case the young women
class, was effective in reducing the average anxiety and sleep disturbances. The results of the study by Vigerland et al. (2016)
Kilburn et al (2018) and Li et al (2017) are in line with this study. The results of Chandra-Mouli and Patel's research show that
class/group training is effective in reducing menstrual symptoms and problems (PMS) and helps obtain information about this
period. (Mouli, et al, 2017). These studies confirm that support from family and friends along with class/group health training can
reduce anxiety and will improve mental health in adolescent groups. In addition, training interventions are effective in providing
information and problem-solving skills; they can improve their quality of life and reduce their anxiety. (Willems, et al, 2017).
The results showed that the average incidence of PMS anxiety in the intervention group was significantly lower than the
control group. The research of Khodakarami et al. which aims to investigate the effect of group counseling on the severity of
premenstrual syndrome among high school students in Hamedan found a positive effect of training. (Khodakarami, 2017) The
PMS Anxiety Mean Different
Mean Z P Value
Interven tion Group (N=30)
15.50 30
- 6.709
0,000
C ontrol Group (N=30)
45 , 50
Table 4. Bivariate Analysis of the Effect of Young Women's Class on Reducing PMS Anxiety In Both Groups

The Effect of Teenage Girls Class Model to Reduce Anxiety Symptoms of Premenstrual Syndrome
IJMRA, Volume 5 Issue 05 May 2022 www.ijmra.in Page 1035
results of research conducted by Akbarzadeh et al. (2018) Zheng et al. (2015) and Li et al. (2015) is also consistent with this study.
According to a report by the World Health Organization, in developing countries there are observed rapid changes in social
behavior, economic problems and PMS disorders are increasing. The findings of this study identify the importance of psychological
characteristics and their interactive effects on the emergence of high-risk behaviors in adolescents and indicate the need for
effective assessments and interventions in eliminating negative indicators of mental health and encouraging positive indicators of
mental health.
The results showed that the training class was effective in reducing the severity of depression in adolescent girls. Parker et
al. (2016) and de Jonge-Heesen et al. (2016) also found that psychological interventions and simple training reduced depressive
symptoms. Among the limitations of this study not to mention the many factors that influence PMS anxiety disorder in most of
the studies considered a nuisance to investigate the factors that influence the desired PMS anxiety reduction. According to the
results of this study, it is recommended that schools, communities, and health workers can work together for the prevention and
treatment of mental disorders, emotional growth, and prevention of abnormal behavior in girls and anxiety disorders during PMS.
V. CONCLUSION
The conclusion of this study is that the Young Women Class Model can affect the decrease in symptoms of premenstrual syndrome
anxiety, so that teenagers can be more productive. The integration of a holistic stress management program for adolescent girls
combined with Yoga for adolescents can effectively reduce PMS stress and anxiety levels. The suggestion in this study is that the
Young Women Class can be continued as the development of midwifery care on adolescent reproductive health to practice the
health efforts that have been taught as an effort to help reduce physical and psychological discomfort throughout the menstrual
cycle. The hope is that teenagers can achieve optimal health status, so that it becomes an investment to prepare for the process
of pregnancy and give birth to a quality generation.
VI. ACKNOWLEDGMENT
The researcher would like to thank various parties who have participated and helped from the beginning to the end of this research
process including the leadership elements of the Jakarta I Poltekkes and STIKes Budi Luhur Cimahi, the Head of the Center and the
Head of the Research and Community Service Institute of the two institutions as research partners..
REFERENCES
1) Abbaspour Z, Rostami M, Najjar Sh. The effect of exercise on primary dysmenorrhea. J Res Health Sci. 2006;6:26–31.
2) Albertina A. Tingkat kecemasan pada mahasiswi yang mengalami sindrom premenstruasi. Bandung Universitas Advent
Indonesia. 2013.
3) Antai A, Udezi A, Ekanem E, Okon U, Umoiyoho A. Premenstrual syndrome: Prevalence in students of the University of
Calabar, Nigeria. African Journal of Biomedical Research. 2004;7(2).
4) Borenstein JE, Dean BB, Endicott J, Wong J, Brown C, Dickerson V, et al. Health and economic impact of the premenstrual
syndrome. The Journal of reproductive medicine. 2003;48(7):515-24.
5) Campagne DM, Campagne G. The premenstrual syndrome revisited. European Journal of obstetrics & Gynecology and
reproductive biology. 2007;130(1):4-17.
6) Chandra‐Mouli V , Patel SV . Mapping the knowledge and understanding of menarche, menstrual hygiene and menstrual
health among adolescent girls in low‐ and middle‐income countries. Reprod Health 2017;14:30.
7) Cronje W, Vashisht A, Studd J. Hysterectomy and bilateral oophorectomy for severe premenstrual syndrome. Human
Reproduction. 2004;19(9):2152-5.
8) Dahlan MS. Besar sampel dan cara pengambilan sampel edisi 3. Jakarta: Salemba Medika. 2010:2930.
9) Deadman P. Premenstrual Syndrome. Journal of Chinese Medicine. 1995 (48).
10) de Jonge‐Heesen KW, van Ettekoven KM, Rasing SP, Liempd FH, Vermulst AA, Engels RC, et al. Evaluation of a school‐
based depression prevention program among adolescents with elevated depressive symptoms: Study protocol of a
randomized controlled trial. BMC Psychiatry 2016;16:402.
11) Ford O, Lethaby A, Roberts H, Mol BWJ. Progesterone for premenstrual syndrome. The Cochrane Library. 2012.
12) Gloria R. The evaluation of a mind/body intervention to reduce psychological distress and perceived stress in college
students. J Sch Health 2016;50:220‐88.
13) Hamilton M. The assessment of anxiety states by rating. British journal of medical psychology. 1959;32(1):50-5.

The Effect of Teenage Girls Class Model to Reduce Anxiety Symptoms of Premenstrual Syndrome
IJMRA, Volume 5 Issue 05 May 2022 www.ijmra.in Page 1036
14) Holmbeck GN. A developmental perspective on adolescent health and illness: An introduction to the special issues.
Journal of Pediatric Psychology. 2002;27(5):409-16.
15) Htay TT. Premenstrual dysphoric disorder. 2002.
16) Jahromi M, Gaeini A, Rahimi Z. Influence of a physi- cal fitness course on menstrual cycle characteristics. Gynecological
Endocrinol- ogy. 2008;24:659–62.
17) Kannan P, Chapple CM, Miller D, Claydon LS, Baxter GD. Menstrual pain and quality of life in women with primary
dysmenorrhea: Rationale, design, and interventions of a randomized controlled trial of effects of a treadmill-based
exercise intervention. Contemp Clin Trials 2015;42:81-9.
18) Kanojia S, Sharma VK, Gandhi A, et al. Effect of yoga on autonomic functions and psychological status during both phases
of menstrual cycle in young healthy females. Journal of Clinical and Diagnostic Research. 2013;7:2133–2139.
19) Kilburn TR, Sørensen MJ, Thastum M, Rapee RM, Rask CU, Arendt KB, et al. Rationale and design for cognitive behavioral
therapy for anxiety disorders in children with autism spectrum disorder: A study protocol of a randomized controlled
trial. Trials 2018;19:210.
20) Kokkinis N, Galanaki E, Malikiosi‐Loizos M. Factor structure and internal consistency of the Greek version of the General
Health Questionnaire–28 (GHQ‐28). Ment Health Prev 2017;7:21‐7.
21) Kumalasari I, Andhyantoro I. Reproductive Health. Jakarta: Salemba Medika; 2012.
22) Li J, Riedel N, Barrech A, Herr RM, Aust B, Mörtl K, et al. Nine‐Year longitudinal psychosocial and mental outcomes of a
stress management intervention at work using psychotherapeutic principles. Psychother Psychosom 2017;86:113‐5.
23) L S, RH G, NG K. Clinical Gynecologic Endocrinology and Infertility 6th edition. Philadelphia Lippincot Williams and Wilkins.;
2000.
24) Mayo JL. Premenstrual Syndrome: A natural approach to management. Clin Nutr Insights. 1997;5:1-8.
25) Merdikawati A, Wihastuti TA, Yuliatun L. Aromatherapy of lavender flowers with anxiety levels of adolescent girls during
premenstrual syndrome. Journal of Nursing, Faculty of Medicine, Brawijaya University. 2012;3(2):133 - 40.
26) Nagar S, Aimol KR. Knowledge of adolescent 50 girls regarding menstruation in tribal areas of Meghalaya. Tribes Tribals
Stud. 2010;8(1):27-30.
27) Nair AR, Taylor HS. The mechanism of menstruation. Amenorrhea: Springer; 2010. p. 21-34.
28) Nyberg S. Premenstrual dysphoric disorder in relation to neuroactive steroids and alcohol. 2006.
29) Onur O, Gumus I, Derbent A, Kaygusuz I, Simavli S, Urun E, et al. Impact of home-based exercise on quality of life of
women with primary dysmenorrhoea. SAJOG 2012;18:15-18.
30) Owen J.A. Physiology of the menstrual cycle. The American Journal of Clinical Nutrition. 1975;28(4):333-8.
31) Parker AG, Hetrick SE, Jorm AF, Mackinnon AJ, McGorry PD, Yung AR, et al. The effectiveness of simple psychological and
physical activity interventions for high prevalence mental health problems in young people: A factorial randomized
controlled trial. J Affect Disord 2016;196:200‐9.
32) Park J-E, Ryu Y-H, Liu Y, Jung H-J, Kim A-R, Jung S-Y, et al. A literature review of de qi in clinical studies. Acupuncture in
Medicine. 2013:acupmed-2012-010279.
33) Ricka W. The relationship between levels of anxiety and premenstrual syndrome in junior high school students 4
Surakarta.
34) Rizk DE, Mosallam M, Alyan S, Nagelkerke N. Prevalence and impact of premenstrual syndrome in adolescent schoolgirls
in the United Arab Emirates. Acta obstetricia et gynecologica Scandinavica. 2006;85(5):589-98.
35) Sadiq MA, Salih AA. Knowledge and practice of adolescent females about menstruation in Baghdad. J Gen Pract.
2013;2(138):2.
36) Sastroasmoro S, S I. Dasar-Dasar Metodologi Penelitian Klinis. Jakarta: Sagung seto; 2011.
37) Satcher D. Mental health: A report of the Surgeon General--Executive summary. Professional Psychology: Research and
Practice. 2000;31(1):5.
38) Sheila LV. Buku ajar keperawatan Jiwa. Alih bahasa: Renata, K Jakarta: EGC. 2008.
39) Shectman Z, et al. Does self-disclosure in friendship increase following group counseling/therapy? A different case for
boys and girls. Journal Sex Roles. 1996;1-2(35):123-130
40) Smith-Adcock, et al. Benefits of a Holistic Group Counseling Model to Promote Wellness for Girls at Risk for Delinquency:
An Exploratory Study. Journal OF Humanistic Counseling. 2008;1(47):116126
41) Stuart GW. Buku Saku Keperawatan Jiwa; alih bahasa: Achir Yani S. Hamid; 2006.
42) Suparman E. Premenstrual syndrome. Jakarta: EGC. 2012.
43) Thu M, Diaz E, Kapaw S. Premenstrual syndrome among female university students in Thailand. AU J. 2006;2006:9.

The Effect of Teenage Girls Class Model to Reduce Anxiety Symptoms of Premenstrual Syndrome
IJMRA, Volume 5 Issue 05 May 2022 www.ijmra.in Page 1037
44) Vigerland S, Ljótsson B, Thulin U, Öst LG, Andersson G, Serlachius E. Internet‐delivered cognitive behavioural therapy for
children with anxiety disorders: A randomised controlled trial. Behav Res Ther 2016;76:47‐56.
45) Warren MP, Perlroth NE. Hormones and sport: the effects of intense exercise on the female reproduc- tive system.
Journal of Endocrinology. 2001;170:3– 11.
46) Yonkers KA, O'Brien PS, Eriksson E. Premenstrual syndrome. The Lancet. 2008;371(9619):120010.
47) Yustinus Semiun O. Teori Kepribadian dan Terapi Psikoanalitik Freud: Kanisius; 2006.
There is an Open Access article, distributed under the term of the Creative Commons Attribution – Non Commercial 4.0 International (CC BY-NC 4.0) (https://creativecommons.org/licenses/by-nc/4.0/), which permits remixing, adapting and building upon the work for non-commercial use, provided the original work is properly cited.

INTERNATIONAL JOURNAL OF MULTIDISCIPLINARY RESEARCH AND ANALYSIS
ISSN(print): 2643-9840, ISSN(online): 2643-9875
Volume 05 Issue 05 May 2022
DOI: 10.47191/ijmra/v5-i5-21, Impact Factor: 6.261
Page No. 1038-1050
IJMRA, Volume 5 Issue 05 May 2022 www.ijmra.in Page 1038
Servant Leadership, Decision Making, and Instructional Leadership
Practices of School Heads in Selected Elementary Schools in Deped
Cabuyao
Dearborn E. Villafranca LPT, MAEd
Santa Rosa City, Laguna, Philippines 4026
ABSTRACT: The study aimed at examining the relationship among the school heads’ level of servant leadership, level of decision
making and instructional leadership practices in elementary schools particularly in the City Schools Division of Cabuyao.
Descriptive correlational research design was employed. The study revealed that the there was a significant relationship between
the school heads’ level of servant leadership skill and their level of decision-making skill, school heads’ level of servant leadership
skill and their instructional leadership practices and school heads’ level of decision-making skill and their instructional leadership
practices. Correlations indicated that the higher the level of servant leadership skill of school heads, the higher is their level of
decision-making skill, the higher the level of servant leadership skill of school heads, the more they confirm their instructional
leadership practices, and the higher the level of decision making skill of school heads, the more they confirm their instructional
leadership practices. In essence, the results yield substantial implications to school heads’ leadership and decision making.
Similarly, an understanding of the relationship among the school heads’ level of servant leadership skill, level of decision making
skill and instructional leadership practices helps the
KEYWORDS: Descriptive correlational study, Southeast Asia, Quantitative Research. Servant Leadership. Decision Making.
Instructional Leadership Practices
INTRODUCTION
Leadership in the current global crisis, the COVID-19, requires prioritizing mental well-being of employees. Almost every leader in
an educational institution has been faced with moments of crisis, ranging from small bumps on the road to more gigantic boulders
along the path. The current crisis involving the COVID-19 pandemic is different than anything we all have faced in over a century,
one that looks to be a lengthy and possibly ethereal challenge for every organization. Servant leadership in a prolonged crisis with
such serious consequences is formidably necessary for an organization and its people, and requires physical, psychological and
emotional fortitude of the leader.
Cahapay (2022) sought to discover the essence of educational leadership practices of school principals in the context of
the current COVID-19 crisis in the form of educational leadership practices during a crisis such as navigating the crisis with adaptive
leadership, cultivating practices in crisis management, promoting inclusivity in the new normal and caring first for what is essential.
The concept of servant leadership is needed now more than ever. In the study of Kumar (2020), there are four reasons why servant
leadership is the most suited leadership philosophy for the post-COVID19 new normal: the ‘New Normal’ will transform the way
leadership uses “power”, it will demand excellence in leadership beyond the achievement of objectives, enforce values-based
leadership, and disrupt the chasing of success and replace it with pursuit of significance. Harper (2020) further adds that a servant
leader is not only sensitive but sensible and is grounded and has a reason for making certain decisions. Davis (2018) reiterates the
practical application in the workplace for shaping thoughtful decisions. Servant-leadership offers a distinct perspective and set of
values for leaders that acknowledge the worth of others with a focus on employee growth. McCann & Sparks (2018) emphasizes
that if education applies the principles, values, and practices of servant leadership to teaching, this will dramatically impact
learning and the learning experiences of students. Crippen (2017) adds that servant-leadership contributes to the scholarship of
teaching and learning excellence.
The study delved on determining the relationship among the school heads’ level of servant leadership, level of decision
making and instructional leadership practices in elementary schools particularly in the City Schools Division of Cabuyao.

Servant Leadership, Decision Making, and Instructional Leadership Practices of School Heads in Selected Elementary Schools in Deped Cabuyao
IJMRA, Volume 5 Issue 05 May 2022 www.ijmra.in Page 1039
Furthermore, the investigation addressed certain issues as research gaps that had been identified during the conduct of the study
which may serve as first-hand evidence for the improvement of the quality of leadership in elementary schools and creation of
an action plan as well. In core, the results of the investigation may certainly guide the elementary school heads to come up with
sound decisions inspired by servant leadership that are geared towards quality instructional leadership practices.
From the above-mentioned premises, servant leadership emphasizes "increased service to others; a holistic approach to
work; promoting a sense of community; and the sharing of power in decision making (Crimi, 2020). In the study of Istiqomah &
Hartini (2020), which analyzed the role of the principal in implementing servant leadership in new normal situations at Islamic
junior high school. The characteristics of servant leader are listening, empathy, healing, awareness, persuasion, conceptualization,
foresight, stewardship, commitment to the growth of people, and building community.
On the other hand, servant leadership may also have negative connotation as the kind of leadership of school heads. The
study of Bates (2022) had contrasting findings about servant leadership: It requires profound authenticity and alignment with
personal values. This could be argued to be a strength of servant leadership, however it’s certainly true that it requires profound
authenticity, it’s not possible for leaders to fake it. Gomez (2021) emphasizes that successful servant leaders have a genuine desire
to serve employees in a democratic way. Harper (2020) further adds that a servant leader is not only sensitive but sensible and is
grounded and has a reason for making certain decisions.
Remarkably, in the study made by Siebert, et.al (2021), it emphasizes decision training has a positive effect on individuals’
decision-making proactivity. Meador (2020) reiterates that school leaders who regularly include their constituents in the decision-
making process find it advantageous in many different ways. Ingersoll, et.al (2018) emphasizes that successful school leadership
is to make the core activities of teaching and learning the primary focus of those making the decisions and managing schools.
Torlak, et.al (2021) further suggests that the participative decision-making affected moral, knowledge and attitude that
contributed to leadership performance.
Toth (2020) has this to say as to why instructional leadership development is vital during and after the COVID-19 crisis:
School and district leaders already had a tough job – now it’s even tougher. As leaders try to understand best practices for virtual
learning and support their staff in learning how to navigate unfamiliar learning environments, they also face potentially long-term
impacts from unprecedented student learning losses.
With this, it is suggested that an action plan that may develop or enhance servant leadership skills, decision making skill and
instructional leadership practices must be implemented. It should also be considered that.
METHODS
The study used descriptive-correlational research design since it determined the level of the servant leadership skill, level of
decision making skill and instructional leadership practices of the school heads at the City Schools Division of Cabuyao Academic
Year 2021-2022. Likewise, it identified possible patterns of relationships that exist among variables and it measured the strength
of such correlation. Data used in the investigation came from 301 elementary public school teachers who were employed in the
City Schools Division of Cabuyao during the Academic Year 2021-2022. Out of 1038 elementary public school teachers, 29% of the
population in each subgroup was employed arriving at 301 sample respondents who were randomly given research instrument
via google form. Of which, 301 respondents were able to accomplish and return the completed survey questionnaires,
representing 100 percent retrieval rate.
The researcher used three sets of survey questionnaire. The first set included statements about the school heads’ level
of servant leadership skill which was measured using the Likert -Type Scale (Strongly Agree/ Very Positive -4, Agree/ Positive -3,
Disagree/Negative -2, Strongly Disagree/Very Negative –1). The second set of the survey questionnaire elicited the school heads’
level of decision making skill which was also measured using the Likert -Type Scale (Strongly Agree/ Very Positive -4, Agree/ Positive
-3, Disagree/Negative -2, Strongly Disagree/Very Negative –1). The third set of survey questionnaire which was composed of
indicators that determined the school heads’ instructional leadership practices. It was measured using the four-point Likert Type
scale: (Strongly Agree -4, Agree -3, Disagree -2, Strongly Disagree–1).
Notably, the researcher personally wrote a letter addressed to City Schools Division Superintendent of Cabuyao for his
approval for the conduct of the study. Prior and informed consent were accomplished by the respondents to ensure compliance
to the ethical standards of conducting research. After gaining the permission, the researcher introduced himself to the
respondents and then explained to them the very essence of the study and the procedures needed to follow in the conduct of
the survey . After which, the researcher personally floated the survey questionnaires to the respondents via google forms. To

Servant Leadership, Decision Making, and Instructional Leadership Practices of School Heads in Selected Elementary Schools in Deped Cabuyao
IJMRA, Volume 5 Issue 05 May 2022 www.ijmra.in Page 1040
make sure that the data gathered were precisely treated; weighted mean was used to determine the school heads’ level of servant
leadership skill, level of decision making skill and instructional leadership practices. Pearson Product Moment of Correlation or
Pearson-r was used to ascertain if there is relationship between the school heads’ level of servant leadership skill and their level
of decision making skill and relationship between the school heads’ level of servant leadership skill and instructional leadership
practices, and the relationship between the school heads’ level of decision making skill and instructional leadership practices.
RESULTS AND DISCUSSIONS
Discussion of the school heads; level of servant leadership skill, level of decision making skill and instructional leadership practices
is presented in the succeeding tables and textual presentations:
Table 1. The School Heads’ Level of Servant Leadership Skill
Indicators
My school head…
Weighted
Mean
Verbal
Interpretation
Rank
1. is more concerned about doing what is right than looking
good
3.47 Very High
(Strongly Agree)
4
2. promotes tolerance, kindness, and honesty in the work place 3.52 Very High
(Strongly Agree)
1
3. readily confess his/her limitations and weaknesses 3.28 Very High
(Strongly Agree)
28
4. works behind the scene and let others take the credit 3.19 High
(Agree)
29
5. finds enjoyment in serving others in whatever role or capacity 3.44 Very High
(Strongly Agree)
7
6. willing to maintain a servant's heart, even though some
people may take advantage of his/her leadership style
3.34 Very High
(Strongly Agree)
26
7. has a heart to serve others 3.48 Very High
(Strongly Agree)
3
8. focuses on finding better ways of serving others and making
them successful.
3.50 Very High
(Strongly Agree)
2
9. genuinely cares for the welfare of people working with
him/her
3.42 Very High
(Strongly Agree)
15
10. makes himself/herself available to all his/her
teachers/colleagues
3.45 Very High
(Strongly Agree)
5.5
11. consistently encourages others to take initiative 3.43 Very High
(Strongly Agree)
10.5
12. grants all his/her teachers a fair amount of responsibility and
latitude in carrying out their tasks
3.33 Very High
(Strongly Agree)
27
13. always looks for hidden talents in his/her teachers 3.10 High
(Agree)
30
14. contributes to his/her employees/colleague's personal
growth
3.43 Very High
(Strongly Agree)
10.5
15. his/her leadership is driven by values that transcend self-
interests and material success
3.35 Very High
(Strongly Agree)
24.5
16. able to inspire others with his/her enthusiasm and
confidence for what can be accomplished
3.42 Very High
(Strongly Agree)
15
17. sets clear and realistic goals 3.42 Very High
(Strongly Agree)
15
18. demands a high level of productivity from himself/herself as
well as from others
3.35 Very High
(Strongly Agree)
24.5

Servant Leadership, Decision Making, and Instructional Leadership Practices of School Heads in Selected Elementary Schools in Deped Cabuyao
IJMRA, Volume 5 Issue 05 May 2022 www.ijmra.in Page 1041
19. knows how to communicate his/her ideas to others
effectively
3.40 Very High
(Strongly Agree)
19
20. has the ability to move the group forward and get things
done
3.40 Very High
(Strongly Agree)
19
21. important part of his/her job is to inspire others to strive for
excellence
3.43 Very High
(Strongly Agree)
10.5
22. usually comes up with solutions accepted by others as
helpful and effective
3.40 Very High
(Strongly Agree)
19
23. has a good understanding of what is happening inside the
organization/school
3.43 Very High
(Strongly Agree)
10.5
24. leads by example 3.43 Very High
(Strongly Agree)
10.5
25. shows the group how to facilitate the process of group
success
3.45 Very High
(Strongly Agree)
5.5
26. make it a priority to develop relations with those who model
servant leadership
3.39 Very High
(Strongly Agree)
22
27. does not play favorites, and try to treat everyone with
dignity and respect
3.36 Very High
(Strongly Agree)
23
28. encourages cooperation rather than competition through
the group
3.43 Very High
(Strongly Agree)
10.5
29. welcomes ideas and input from others, including critics and
detractors
3.40 Very High
(Strongly Agree)
19
30. places the greatest amount of decision-making in the hands
of those most affected by the decision
3.40 Very High
(Strongly Agree)
19
Average 3.39 Very High
(Strongly Agree)
Legend:( Strongly Agree/ Very High -4, Agree/ High -3, Disagree/ Low -2, Strongly Disagree/Very Low –1)
Table 1 presents the school heads’ level of servant leadership skill, as seen in the table, indicator 2 “The school head
promotes tolerance, kindness, and honesty in the work place” got a weighted mean of 3.52 ,verbally interpreted as very high and
was ranked 1, indicator 8 “The school head focuses on finding better ways of serving others and making them successful.” with
an obtained weighted mean of 3.50 was verbally interpreted as very high and was ranked 2, indicator 7 “The school head has a
heart to serve others” had a weighted mean of 3.48,verbally interpreted as very high was ranked 3, indicator 1”The school head
is more concerned about doing what is right than looking good”, with an obtained weighted mean of 3.47 was verbally interpreted
as very high and was ranked 4, indicator 10 “The school head makes himself/herself available to all his/her teachers/colleagues”
with an obtained weighted mean of 3.45 was verbally interpreted as very high and was ranked 5, indicator 25 “The school head
shows the group how to facilitate the process of group success” with an obtained weighted mean of 3.45 was verbally interpreted
as very high and was ranked 5 respectively.
On the other hand, indicator 13 “The school head always looks for hidden talents in his/her teachers” with an obtained
weighted mean of 3.10 was verbally interpreted as high was ranked 30, indicator 4 “The school head works behind the scene and
let others take the credit” with an obtained mean of 3.14 was verbally interpreted as high was ranked 29, indicator 3 “The school
head readily confesses his/her limitations and weaknesses with an obtained mean of 3.28 was verbally interpreted as very high
was ranked 28, indicator 12 “The school head grants all his/her teachers a fair amount of responsibility and latitude in carrying
out their tasks” with an obtained mean of 3.33 was verbally interpreted as very high was ranked 27, indicator 6 “The school head
is willing to maintain a servant's heart, even though some people may take advantage of his/her leadership style” with an obtained
mean of 3.34 was verbally interpreted as very high was ranked 26 respectively.
To sum up, an average weighted mean of 3.39 revealed that the school heads’ level of servant leadership was very high.
The results imply that the school heads promote kindness, fairness and honesty in their schools. They capitalize on finding better
ways of serving others and making them successful.

Servant Leadership, Decision Making, and Instructional Leadership Practices of School Heads in Selected Elementary Schools in Deped Cabuyao
IJMRA, Volume 5 Issue 05 May 2022 www.ijmra.in Page 1042
The findings support the study of Regoli (2019) as this emphasizes the advantages of servant leadership: Decisions are
based on the benefit of all. It encourages empathy. When leaders make decisions in this kind of environment, they do so by looking
at the situation in the shoes of others. This allows leaders to refuse requests if it doesn’t benefit everyone for some reason. Bates
(2022) has this to say about the disadvantages of servant leadership: It requires profound authenticity and alignment with personal
values. This could be argued to be a strength of servant leadership, however it’s certainly true that it requires profound
authenticity, it’s not possible for leaders to fake it.
Further, Crippen (2017) defines a servant-leader as servant first. It begins with the natural feeling that one wants to serve.
Then conscious choice brings one to aspire to lead. The difference manifests itself in the care taken by the servant- first, to make
sure that other people ‘s highest priority needs are being served. Those served grow as persons; while being served, become
healthier, wiser, freer, more autonomous, more likely themselves to become servants.
Table 2. The School Heads’ Level of Decision-Making Skill
Indicators
My school head…..
Weighted
Mean
Verbal
Interpretation
Rank
1. ensures that teachers have “bought into” the decision—they
were included in the process, and they understand the incentives
for them and for their students
3.39 Very High
(Strongly
Agree)
3
2. sees to it that teachers have the resources for successful
implementation—they have the time, space, or technology
needed
3.35 Very High
(Strongly
Agree)
9.5
3. ensures that teachers have the skills needed to implement the
decision—they have been given the training and support to be
successful
3.40 Very High
(Strongly
Agree)
1.5
4. makes sure that teachers have a clear understanding of the
metrics used to inform decision-making and the pending course of
action—they are being informed of the who, what, why, when, and
where related to the decisions.
3.38
Very High
(Strongly
Agree)
4.5
5. ensures that teachers are motivated to carry out the decisions—
they see the vision
3.38 Very High
(Strongly
Agree)
4.5
6. understands the difference between operational and
professional decisions
3.40 Very High
(Strongly
Agree)
1.5
7. understands the concept of groupthink, and try to avoid this
situation
3.33 Very High
(Strongly
Agree)
12
8. understands the difference between democratic, consensus,
and unilateral decision making
3.32 Very High
(Strongly
Agree)
14
9. choices are influenced by the potential regret or rejoicing
associated with decisions selected
3.28 Very High
(Strongly
Agree)
17
10. spends time researching and reflecting before making major
decisions
3.33 Very High
(Strongly
Agree)
12
11. consciously considers all people involved and the ramifications
of a decision
3.33 Very High
(Strongly
Agree)
12

Servant Leadership, Decision Making, and Instructional Leadership Practices of School Heads in Selected Elementary Schools in Deped Cabuyao
IJMRA, Volume 5 Issue 05 May 2022 www.ijmra.in Page 1043
12. tends to gravitate toward decisions that are low risk in
outcome
3.24 High
(Agree)
18.5
13. personal bias on issues has little effect on decisions he/she
makes by himself/herself or with others
3.16 High
(Agree)
20
14. When making decisions, my school head feels that he/she can
predict or estimate the outcome of his/her decision
3.24 High
(Agree)
18.5
15. confident of the decisions made with his/her input 3.31 Very High
(Strongly
Agree)
15.5
16. knows when it is appropriate to make decisions by
himself/herself, and with input from others
3.37 Very High
(Strongly
Agree)
6.5
17. has knowledge of several decision making models 3.37 Very High
(Strongly
Agree)
6.5
18. considers issues, problems, opportunities, and decisions
systematically
3.36 Very High
(Strongly
Agree)
8
19. determines the change required to navigate multiple
scenarios/decisions
3.35
Very High
(Strongly
Agree)
9.5
20. recognizes the limits of their faculty when making decisions 3.31 Very High
(Strongly
Agree)
15.5
Average 3.33 Very High
(Strongly
Agree)
Legend:( Strongly Agree/ Very High -4, Agree/ High -3, Disagree/ Low -2, Strongly Disagree/Very Low –1)
It can be gleaned from table 2 the school heads’ level of decision making skill, as seen in the table, indicator 3“The school
head ensures that teachers have the skills needed to implement the decision—they have been given the training and support to
be successful” got a weighted mean of 3.40 ,verbally interpreted as very high and was ranked 1, indicator 6 “The school head
understands the difference between operational and professional decisions” with an obtained weighted mean of 3.40 was verbally
interpreted as very high and was also ranked 1, indicator 1“The school head ensures that teachers have “bought into” the
decision—they were included in the process, and they understand the incentives for them and for their students” had a weighted
mean of 3.39,verbally interpreted as very high was ranked 3, indicator 4”The school head makes sure that teachers have a clear
understanding of the metrics used to inform decision-making and the pending course of action—they are being informed of the
who, what, why, when, and where related to the decisions”, with an obtained weighted mean of 3.38 was verbally interpreted as
very high and was ranked 4, indicator 5 “The school head ensures that teachers are motivated to carry out the decisions—they
see the vision” with an obtained weighted mean of 3.38 was verbally interpreted as very high and was also ranked 5, indicator 25
“The school head shows the group how to facilitate the process of group success” with an obtained weighted mean of 3.38 was
verbally interpreted as very high and was ranked 5, indicator 16 “The school head knows when it is appropriate to make decisions
by himself/herself, and with input from others” with an obtained mean of 3.37 was verbally interpreted as very high was ranked
6, indicator 17 “The school head has knowledge of several decision making models” with an obtained mean of 3.37 was verbally
interpreted as very high was also ranked 6 respectively.
On the other hand, indicator 13 “The school head personal bias on issues has little effect on decisions he/she makes by
himself/herself or with others” with an obtained weighted mean of 3.16 was verbally interpreted as high was ranked 20, indicator
12 “The school head tends to gravitate toward decisions that are low risk in outcome” with an obtained mean of 3.24 was verbally
interpreted as high was ranked 18, indicator 14 “The school head, when making decisions, my school head feels that he/she can
predict or estimate the outcome of his/her decision with an obtained mean of 3.24 was verbally interpreted as high was also

Servant Leadership, Decision Making, and Instructional Leadership Practices of School Heads in Selected Elementary Schools in Deped Cabuyao
IJMRA, Volume 5 Issue 05 May 2022 www.ijmra.in Page 1044
ranked 18, indicator 9 “The school head choices are influenced by the potential regret or rejoicing associated with decisions
selected” with an obtained mean of 3.28 was verbally interpreted as very high was ranked 17, indicator 15 “The school head
confident of the decisions made with his/her input” with an obtained mean of 3.31 was verbally interpreted as very high, indicator
20 “The school head recognizes the limits of their faculty when making decisions” with an obtained mean of 3.31 was also ranked
15, indicator 9 “The school head choices are influenced by the potential regret or rejoicing associated with decisions selected”
with an obtained mean of 3.28 was verbally interpreted as very high respectively.
To sum up, an average weighted mean of 3.33 revealed that the school heads’ level of decision making skill was very high.
The results imply that the school heads ensure that teachers have the skills needed to implement the decision—they have been
given the training and support to be successful. They also understand the difference between operational and professional
decisions. The school heads also ensure that teachers have “bought into” the decision—they were included in the process, and
they understand the incentives for them and for their students.
The findings support the study of Siebert, et.al (2021) which emphasizes decision training has a positive effect on individuals’
decision-making proactivity. The study also found out that the general courses on decision making—that is, as a means to improve
individual decision-making skills—are now rarely included in school or university curricula.
Meador (2020) emphasizes that school leaders who regularly include their constituents in the decision-making process
find it advantageous in many different ways. They understand that involving stakeholders in the decision-making process can
ultimately transform a school. Progressive transformation is continuous and ongoing. It must become a mindset and regular way
of making decisions to maximize effectiveness. People will trust a decision-making process that is inclusive, transparent, and
holistic in nature. The study of Gemechu (2017) found out that teachers can take a larger role in the overall success of the school
when committed to being active participants in the decision making process.
Table 3. The School Heads’ Instructional Leadership Practices
Indicators
My school head…
Weighted
Mean
Verbal
Interpretation
Rank
1. develops a focused set of annual school-wide goals 3.39 Strongly Agree 5
2. uses needs assessment or other formal and
informal methods to secure staff input or goal development
3.35 Strongly Agree 15
3. uses data on student performance when developing the school’s
academic goals
3.41 Strongly Agree 3
4. discusses the school’s academic goals with teachers at faculty
meetings
3.43 Strongly Agree 1
5. refers to the school’s academic goals when making curricular
decisions with teachers
3.42 Strongly Agree 2
6. ensures that the school’s academic goals are reflected in highly
visible displays in the school (e.g. posters or bulletin boards
emphasizing academic progress)
3.36 Strongly Agree 11.5
7. points out specific strengths in teacher’s
instructional practices in post-observation feedback (e.g. in
conferences or written evaluations
3.40 Strongly Agree 4
8. points out specific weaknesses in teacher
instructional practices in post-observation feedback (e.g. in
conferences or written
evaluation)
3.36 Strongly Agree 11.5
9. points out specific strengths in teacher’s
instructional practices in post-observation feedback (e.g. in
conferences or written evaluations
3.36 Strongly Agree 11.5
10. draws upon the results of school-wide
testing when making curricular decisions
3.35 Strongly Agree 15
11. monitors the classroom curriculum to see that it covers the
school’s curricular objectives
3.37 Strongly Agree 8.5

Servant Leadership, Decision Making, and Instructional Leadership Practices of School Heads in Selected Elementary Schools in Deped Cabuyao
IJMRA, Volume 5 Issue 05 May 2022 www.ijmra.in Page 1045
12. participates actively in the review of
curricular materials
3.38 Strongly Agree 6.5
13. meets individually with teachers to
discuss student progress
3.33 Strongly Agree 19
14. discusses academic performance
results with the faculty to identify curricular strengths and
weaknesses
3.31 Strongly Agree 21.5
15. uses tests and other performance measure
to assess progress toward school goals
3.37 Strongly Agree 8.5
16. limits interruptions of instructional time by public address
announcements
3.28 Strongly Agree 26.5
17. ensures that students are not called to
the office during instructional time
3.34 Strongly Agree 17.5
18. limits the intrusion of extra- and co-curricular activities on
instructional time
3.29 Strongly Agree 24
19. takes time to talk informally with students and teachers during
recess and breaks
3.22 Agree 19
20.visits classrooms to discuss school issues
with teachers and students
3.29 Strongly Agree 24
21. covers classes for teachers until a late or
substitute teacher arrives
3.13 Agree 30
22. reinforces superior performance by teachers in staff meetings,
newsletters, and/or memos
3.31 Strongly Agree 21.5
23. rewards special efforts by teachers with
opportunities for professional recognition
3.32 Strongly Agree 20
24. creates professional growth opportunities
for teachers as a reward for special contributions to the school
3.35 Strongly Agree 15
25. ensures that in-service activities attended
by staff are consistent with the school’s goals
3.38 Strongly Agree 6.5
26. actively supports the use in the classroom
of skills acquired during in-service training
3.36 Strongly Agree 11.5
27. sets aside time at faculty meetings for
teachers to share ideas or information from in-service activities
3.34 Strongly Agree 17.5
28. recognizes students who do superior work with formal rewards
such as an honor roll or mention in the principal’s newsletter
3.29 Strongly Agree 24
29. Uses assemblies to honor students for
academic accomplishments or for behavior or citizenship
3.26 Agree 28
30. Contacts parents to communicate improved or exemplary
student performance or contribution
3.28 Strongly Agree 26.5
Average 3.33 Strongly Agree
Legend:( Strongly Agree -4, Agree -3, Disagree -2, Strongly Disagree–1)
From the data shown in table 3, the school heads’ instructional leadership practices, as seen in the table, indicator 4“The
school head discusses the school’s academic goals with teachers at faculty meetings” got a weighted mean of 3.43 ,verbally
interpreted as strongly agree and was ranked 1, indicator 5 “The school head refers to the school’s academic goals when making
curricular decisions with teachers” with an obtained weighted mean of 3.42 was verbally interpreted as strongly agree and was
also ranked 2, indicator 3 “The school head uses data on student performance when developing the school’s academic goals ” had
a weighted mean of 3.41,verbally interpreted as strongly agree was ranked 3, indicator 7 “The school head points out specific
strengths in teacher’s instructional practices in post-observation feedback (e.g. in conferences or written evaluations”, with an
obtained weighted mean of 3.40 was verbally interpreted as strongly agree and was ranked 4, indicator 1 “The school head

Servant Leadership, Decision Making, and Instructional Leadership Practices of School Heads in Selected Elementary Schools in Deped Cabuyao
IJMRA, Volume 5 Issue 05 May 2022 www.ijmra.in Page 1046
develops a focused set of annual school-wide goals” with an obtained weighted mean of 3.39 was verbally interpreted as strongly
agree and was ranked 5, indicator 12 “The school head participates actively in the review of curricular materials with an obtained
mean of 3.38 was verbally interpreted as strongly agree was ranked 6, indicator 25 “The school head ensures that in-service
activities attended by staff are consistent with the school’s goals” with an obtained mean of 3.38 was verbally interpreted as
strongly agree was also ranked 6 respectively.
On the other hand, indicator 13 “The school head covers classes for teachers until a late or substitute teacher arrives”
with an obtained weighted mean of 3.13 was verbally interpreted as agree was ranked 30, indicator 29 “The school head uses
assemblies to honor students for academic accomplishments or for behavior or citizenship” with an obtained mean of 3.26 was
verbally interpreted as agree was ranked 28, indicator 16 “The school head limits interruptions of instructional time by public
address announcements” with an obtained mean of 3.28 was verbally interpreted as strongly agree was ranked 26, indicator 30
“The school head contacts parents to communicate improved or exemplary student performance or contribution” with an
obtained mean of 3.28 was verbally interpreted as strongly agree was also ranked 26, indicator 28 “The school head recognizes
students who do superior work with formal rewards such as an honor roll or mention in the principal’s newsletter” with an
obtained mean of 3.29 was verbally interpreted as strongly agree was ranked 24.
To sum up, an average weighted mean of 3.33 revealed that the respondents confirmed the school heads’ instructional
leadership practices. The results imply that the school heads discuss the school’s academic goals with teachers at faculty meetings.
They also refer to the school’s academic goals when making curricular decisions with teachers.
The findings support the study of Morse (2021) as it emphasizes that principals participate in the instructional process
through their discussions with teachers about instructional issues, their observations of classroom instruction, and their
interactions with teachers when examining student data. Spencer (2018) found out that given all the steps in the supervision cycle,
the post-observation conference is the one step that must be handled effectively for teacher growth to occur. Since teacher
growth ultimately is the goal of supervision, it seemed appropriate to investigate the post-observation conference and factors
related to its success.
Brolund (2017) found out that despite evidence that practicing instructional leadership in schools has a positive effect on
student achievement, many principals perceive roadblocks to becoming effective instructional leaders. Principals have reported
that they have little time to focus on instructional tasks, they are uncomfortable visiting teachers’ classrooms, and they do not
have the knowledge or capacity to guide teachers’ practice.
Lynch (2017) pointed out that in instructional leadership, the principal’s role is deeply involved with setting the school’s
direction. The “mission” dimension focuses on the principal’s role in cooperating with staff, ensuring the school continuously runs
on clear, measurable, and time-based goals that result is the academic progress of students. Principals are responsible for
communicating goals, which should be widely known and supported throughout the school.
Table 4. Relationship between the School Heads’ Level of Servant Leadership Skill and Level of Decision-Making Skill
Pearson r p-value interpretation
School Heads’ Level of Servant
Leadership Skill and Level of
Decision-Making Skill
0.912**
High correlation
0.000
Significant
**Significant @ 0.01
As observed from the data in the table there was a significant relationship between the school heads’ level of servant
leadership skill and their level of decision-making skill. The Pearson r value of 0.912 indicates a high correlation with a probability
value of 0.000 which was less than the 0.01 significance level. This means that the higher the level of servant leadership skill, the
higher is their level of decision-making skill.
The findings support the study of Gomez (2021) which emphasizes that successful servant leaders have a genuine desire
to serve employees in a democratic way. They’re also effective, charismatic decision-makers and clear when they set expectations.
Harper (2020) further adds that a servant leader is not only sensitive but sensible and is grounded and has a reason for
making certain decisions. It doesn’t always have to be a popular decision, but it is the responsibility of the leader to make the
practical, reasonable, and realistic decision that will require others to rise to certain expectations for the benefit of everyone.

Servant Leadership, Decision Making, and Instructional Leadership Practices of School Heads in Selected Elementary Schools in Deped Cabuyao
IJMRA, Volume 5 Issue 05 May 2022 www.ijmra.in Page 1047
Davis (2018) reiterates the practical application in the workplace for shaping thoughtful decisions. Servant-leadership
offers a distinct perspective and set of values for leaders that acknowledge the worth of others with a focus on employee growth.
Making decisions can be conducted using a multitude of approaches such as heuristic and rational decision-making.
Table 5. Relationship between the School Heads’ Level of Servant Leadership Skill and Instructional Leadership Practices
Pearson r p-value Interpretation
School Heads’ Level of Servant
Leadership Skill and Instructional
Leadership Practices
0.881**
High correlation
0.000
Significant
**Significant @ 0.01
As disclosed in table 5, there was a significant relationship between the school heads’ level of servant leadership skill and
their instructional leadership practices. The Pearson r value of 0.881 indicates a high correlation with a probability value of 0.000
which was less than the 0.01 significance level. This means that the higher the level of servant leadership skill, the higher is their
level of instructional leadership practices.
The findings support the study of McCann & Sparks (2018) which emphasizes that if education applies the principles,
values, and practices of servant leadership to teaching, this will dramatically impact learning and the learning experiences of
students.
Sahawneh & Benuto (2018) found out that servant leadership has the potential to improve student satisfaction with
online learning. Bowman (2017) servant leaders as teachers must have an understanding of teaching styles and preferences and
how they impact student learning. Crippen (2017) adds that servant-leadership contributes to the scholarship of teaching and
learning excellence.
Table 6. Relationship between the School Heads’ Level of Decision-Making Skill and Instructional Leadership Practices
Pearson r p-value Interpretation
School Heads’ Level of Decision-Making
Skill and Instructional Leadership
Practices
0.945**
High correlation
0.000
Significant
**Significant @ 0.01
Table 6 unveils that there was a significant relationship between the school heads’ level of decision making skill and their
instructional leadership practices. The Pearson r value of 0.945 indicates a high correlation with a probability value of 0.000 which
was less than the 0.01 significance level. This means that the higher the level of decision making skill, the better are their
instructional leadership practices.
The findings support the study of Ingersoll, et.al (2018) which emphasizes that successful school leadership is to make
the core activities of teaching and learning the primary focus of those making the decisions and managing schools. Instructional
leadership has been the equivalent of the Holy Grail in the management and administration of elementary and secondary schools.
In this view, effective schools almost invariably emphasize key elements of instructional leadership, such as developing a shared
purpose and vision among faculty and administrators in schools; providing objective, consistent, and useful assessment of the
quality of teachers; and teaching using evidence and data to make decisions about the instructional program.
According to Schneider & Mack (2022), under school-based decision-making, schools are encouraged to make decisions
regarding the curriculum and supporting instructional strategies. Torlak, et.al (2021) further suggests that the participative
decision-making affected moral, knowledge and attitude that contributed to leadership performance.
CONCLUSION
The school heads promote kindness, fairness and honesty in their schools. They capitalize on finding better ways of serving others
and making them successful. The school heads ensure that teachers have the skills needed to implement the decision—they have

Servant Leadership, Decision Making, and Instructional Leadership Practices of School Heads in Selected Elementary Schools in Deped Cabuyao
IJMRA, Volume 5 Issue 05 May 2022 www.ijmra.in Page 1048
been given the training and support to be successful. They also understand the difference between operational and professional
decisions. The school heads also ensure that teachers have “bought into” the decision—they were included in the process, and
they understand the incentives for them and for their students. The school heads discuss the academic goals with teachers at
faculty meetings. They also refer to the school’s academic goals when making curricular decisions with teachers that they earned
the highest mean grade.
Moreover, the higher the level of servant leadership skill of school heads, the higher is their level of decision-making
skill. The higher the level of servant leadership skill of school heads, the more they confirm their instructional leadership practices.
The higher the level of decision making skill of school heads, the more they confirm their instructional leadership practices.
FUTURE DIRECTIONS
The investigation, however, has some limitations particularly on the sample size which was used in the study since it was only
limited to the public elementary teachers College of the City Schools Division of Cabuyao during the Academic Year 2021-2021.To
have a better generalization of the study, it is recommended to future researchers to conduct similar study considering a larger
number of respondents. For more comprehensive picture of the interplay of the variables, it is also important to include other
variables such as transformational leadership, dedication and loyalty to the profession as school leaders. On a practical note, the
outcomes of the study conducted yield significant implications to school heads’ leadership as a whole.
Congruently, an understanding of the relationship among the level of servant leadership, level of decision making and
instructional leadership practices helps the training section in the division design professional development program to create
positive changes and further improvement of administration in City Schools Division of Cabuyao. This is with the end view of
increasing mindfulness and perceptions on how potential school heads can become active partakers in exemplifying sound servant
leadership, decision making and instructional leadership practices.
REFERENCES
1) Aktaş, F.N., Topbaş, E.S, Dede, Y. (2018). SHS Web of Conferences 48, 01019 (2018). Retrieved from:
https://doi.org/10.1051/shsconf/20184801019
2) Azaiez (2017). Differences in Student Achievement and Principal Behavior as a Function of Years of Principal Experience:
A National Investigation. Retrieved from: https://shsu-ir.tdl.org/bitstream/handle/20.500.11875/2305/AZAIEZ-
DISSERTATION 2017.PDF?sequence=1&isAllowed=y
3) Baldanza (2018). “Baldanza’s Model of 21st Century Instructional Leadership” Professional Practices. March 2018.
Retrieved from: https://files.eric.ed.gov/fulltext/ED580924.pdf
4) Bates (2022). Extent of information and communication technology (ICT) utilization for students’ learning in tertiary
institutions in Ondo State, Nigeria. International Journal of Advance Research and Innovative Ideas in Education, 3(3),
2369-2376.
5) Bhandari, P. (2021). An Introduction to Correlational Research. Scribbr.
https://www.scribbr.com/methodology/correlational-research/
6) Bottoms & Schmidt-Davis (2017). The Three Essentials: Improving Schools Requires District Vision, District and State
Support, and Principal Leadership. Retrieved from: https://eric.ed.gov/?id=ED512028
7) Bowman (2017). The Relationship between Decision Making Styles and Leadership Styles among Public Schools Principals.
International Education Studies, v6 n7 p100-110 2013. Retrieved from: https://files.eric.ed.gov/fulltext/EJ1068554.pdf
8) Boyatzis and McKee (2018). Primal Leadership: Realizing the Power of Emotional Intelligence. Retrieved from:
https://www.researchgate.net/publication/230854764
9) Brolund (2017). Student Success Through Instructional Leadership. BU Journal of Graduate Studies in Education, Vol. 8,
Issue 2. Retrieved from: https://files.eric.ed.gov/fulltext/EJ1230490.pdf
10) Brown (2017). Educator Perceptions of Instructional Leadership in the School Improvement Process. Electronic Theses
and Dissertations. Paper 3031. https://dc.etsu.edu/etd/3031
11) Burkus (2017). Intro to Leadership Theory. Retrieved from: https://davidburkus.com/2017/01/intro-to-leadership-
theory/
12) Centers for Disease Control and Prevention (2020). Indicators for Dynamic School Decision-Making Indicators for School
Decision-Making. Retrieved from: http://blog.centersfordiseasecontrolandprevention
13) Crimi (2020). Educational Management Leadership: High School Principal’s Management Style and Parental Involvement
in School Management in Israel. Handbook of Research on Managerial Solutions in Non-Profit Organizations.

Servant Leadership, Decision Making, and Instructional Leadership Practices of School Heads in Selected Elementary Schools in Deped Cabuyao
IJMRA, Volume 5 Issue 05 May 2022 www.ijmra.in Page 1049
14) Crippen (2017). Serve, Teach, and Lead: It’s All about Relationships. InSight: A Journal of Scholarly Teaching, v5 p27-36.
15) Davis (2018). Servant Leadership Decision-Making Rubric: A Greenleaf-Inspired Assessment Tool for Employee-Based
Issues. The International Journal of Servant-Leadership, 12(1), 149 - 172
16) DeWitt (2020). What Does Remote Instructional Leadership Look Like During a Pandemic? Retrieved from:
https://www.edweek.org/education/opinion-what-does-remote-instructional-leadership-look-like-during-a-
pandemic/2020/05
17) Earp(2020). Changing school leadership during COVID-19. Retrieved from:
https://www.teachermagazine.com/au_en/articles/changing-school-leadership-during-covid-19
18) Ebrahim, A. (2020). Instructional Leadership Competencies as Interpreted by New School
Principals. Graduate Theses and Dissertations. 76. https://pilotscholars.up.edu/etd/76
19) Francisco and Nuqui (2020). School Management: Characteristics of Effective Principal. Global Journal of Human Social
Sciend Vol 13. Issue 13. Global Journals Inc., USA. Retrieved from: https://globaljournals.org/GJHSS_Volume13/2-School-
Management-Characteristics.pdf
20) Gemechu (2017). The Practices of Teachers’ Involvement in Decision Making in Government Secondary Schools of Jimma
Town. Retrieved from: https://core.ac.uk/download/pdf/29136341.pdf
21) Gomez (2021). On the Rejectability of the Subjective Expected Utility Theory. The BE Journal of Theoretical Economics
16(2). https://doi.org/10.1515/bejte-2015-0074
22) Harappa (2021). Ways through Which Principals Acquire the Leadership Competencies Required for Effective
Management of Secondary Schools in Nairobi County, Kenya. Journal of Education and Practice, v8 n9 p43-48. Retrieved
from: https://files.eric.ed.gov/fulltext/EJ1138787.pdf
23) Harper (2020). Managerial Skills of Principal in Private Secondary School Categorized Islamic Characteristic. Advances in
Social Science, Education and Humanities Research. Retrieved from: https://dx.doi.org/10.2991/icream-18.2019.29
24) Ingersoll, et.al (2018). Relationship between decision making and instructional leadership practices. Retrieved from:
https://files.eric.ed.gov/fulltext/EJ1173452.pdf
25) Investopedia (2021). School manager’s handbook. London: Dorling Kindersley Limited
Ismail, M., Mansor, A., Iksan, Z. and Nor, M. (2018) Influence of Principals’ Instructional Leadership on Science Teaching
Competency. Creative Education, 9, 2234-2244. doi: 10.4236/ce.2018.914164
26) Istiqomah & Hartini (2020). Admintrative and managerial skills for effective secondary school management.UNIZIK
Journal of Educational Management and Policy, 1(1),1-7.9
27) Lesinger, F.Y. & Şenol, H. (2017). The Relationship between Instructional Leadership Style, Trust and School Culture.
Retrieved from: https://www.intechopen.com/chapters/61096
28) Lynch (2017). Important Concepts of Instructional Leadership. Retrieved from:
https://www.theedadvocate.org/important-concepts-of-instructional-leadership/
29) Meador (2020). "Transform Your School with Collaborative Decision Making." ThoughtCo, Aug. 26, 2020, Retrieved from:
thoughtco.com/transforming-your-school-collaborative-decision-making-4063907.
30) McCann, J.& Sparks, B. (2018). The Relationship of Servant Leadership in the Classroom and Student Perceptions of
University Quality of Instruction. Archives of Business Research, 6(6), 119-133.
31) McCombes (2019). Descriptive Research. [Management and Leadership of Principals]. Bandung: Bumi Aksara.
32) Mihaela (2017). Personality variables in decision – making. Procedia - Social and Behavioral Sciences 187 (2017) 658 –
662. Retrieved from: https:// doi: 10.1016/j.sbspro.2017.03.122
33) Morse (2021). The Principal's Role in the Instructional Process: Implications for At-Risk Students. American Institutes for
Research. Retrieved from: https://sedl.org/change/issues/issues13.html
34) Murphy (2020). Analysis of administrative roles of principals in private secondary schools in Aba education zone of Abia
state. Journal of Educational Administration 2(1), 33-41.
35) Nelson (2017). Definition of Decision Making: Multiple variables contribute to decision making. Retrieved
from:https://www.wpafb.af.mil/News/Article-Display/Article/818946/multiple-variables-contribute-to-decision-
making/
36) Piorun (2021). Leading Through a Crisis: The Application of Servant Leadership During COVID-19. Handbook of Research
on Library Response to the COVID-19 Pandemic. DOI: 10.4018/978-1-7998-6449-3.ch001

Servant Leadership, Decision Making, and Instructional Leadership Practices of School Heads in Selected Elementary Schools in Deped Cabuyao
IJMRA, Volume 5 Issue 05 May 2022 www.ijmra.in Page 1050
37) Polka (2018). Administrative challenges and principal’s Managerial Effectiveness in Ogun State public secondary schools.
International Journal of Educational Administration and Policy Studies 10(5), pp. 48-56. Retrieved from:
https://academicjournals.org/journal/IJEAPS/article-full-text-pdf/39A1B4257021
38) Regoli (2019). 7 Advantages and Disadvantages of Servant Leadership. Retrieved from:
https://connectusfund.org/7-advantages-and-disadvantages-of-servant-leadership
39) Sahawneh & Benuto (2018). The Relationship between Instructor Servant Leadership Behaviors and Satisfaction with
Instructors in an Online Setting. Retrieved from:
https://olj.onlinelearningconsortium.org/index.php/olj/article/view/1066
40) Schneider & Mack (2022). School–Based Decision-making: Key Elements, Scope of Decision–
Making, Decision-Making Structures. Retrieved from:
https://education.stateuniversity.com/pages/2386/School-Based-Decisionmaking.html
41) Siebert, et.al (2021). Effects of decision training on individuals’ decision-making proactivity. European Journal of
Operational Research, Volume 294, Issue 1, 2021, Pages 264-282, ISSN 0377-2217Retrieved from:
https://doi.org/10.1016/j.ejor.2021.01.010
42) Spencer (2018). Post-observation conferences: factors related to success. Retrieved from:
https://dr.lib.iastate.edu/entities/publication/1e092436-2874-4cf2-b4896c4c54aa8dd2/full
43) Sullivan (2021). Instructional Leadership and a Coaching Approach. Retrieved from:
https://www.growthcoaching.com.au/articles-new/instructional-leadership-and-a-coaching-approach
44) Torlak, N.G., Demir, A. and Budur, T. (2021). Decision-making, leadership and performance links in private education
institutes. Rajagiri Management Journal. Vol. ahead-of-print No. ahead-of-print. Retrieved from:
https://doi.org/10.1108/RAMJ-10-2020-0061
45) Toth (2020). Strengthening Instructional Leadership: 6 strategies to promote a culture of continuous improvement, close
COVID gaps, and increase principal retention. Retrieved from:https://www.learningsciences.com/blog/https-www-
learningsciences-com-blog-strengthening-instructional-leadership-6-strategies/
46) UNICEF Europe and Central Asia (2020). Building Resilient Education Systems beyond the COVID-19 Pandemic:
Considerations for education decision-makers at national, local and school levels
47) Vogel (2018). Learning Outside the Classroom: How Principals Define and Prepare to Be Instructional Leaders. Retrieved from:
https://www.hindawi.com/journals/edri/2018/8034270
48) Zaleznik A. (2016). Manager and leaders: are they different? Harvard Business
Review. 1977; 55:67–78. Retrieved from: http://student.bms.lk/CBM/Slides/34/S
49) Wood (2017). Decision-Making Styles of Russian School Principals. Russian Education & Society, v57 n7 p590-613.
Retrieved from: https://eric.ed.gov/?q=Decision-making+of+school+principals&id=EJ1141358
50) Woudsma (2019). Instructional leadership: Refining the model. Long Reads. Retrieved from:
https://www.teachermagazine.com/au_en/articles/instructional-leadership-refining-the-model
There is an Open Access article, distributed under the term of the Creative Commons Attribution – Non Commercial 4.0 International (CC BY-NC 4.0) (https://creativecommons.org/licenses/by-nc/4.0/), which permits remixing, adapting and building upon the work for non-commercial use, provided the original work is properly cited.

INTERNATIONAL JOURNAL OF MULTIDISCIPLINARY RESEARCH AND ANALYSIS
ISSN(print): 2643-9840, ISSN(online): 2643-9875
Volume 05 Issue 05 May 2022
DOI: 10.47191/ijmra/v5-i5-22, Impact Factor: 6.261
Page No. 1051-1057
IJMRA, Volume 5 Issue 05 May 2022 www.ijmra.in Page 1051
Impact of Perceived Benefits, Security, and Privacy on Interest in
Using E-Wallet in Millennial Generation
Tri Kartika Pertiwi1, Eko Purwanto2, Irma Dwi Kusuma3, Sinta Dewi4, Lelli Kisdayanti5 1,2,3,4,5 Magister of Manajemen Study Program, Faculty of Economic and Business, UPN “Veteran” Jawa Timur, Indonesia
ABSTRACT: This study examines and analyze the effect of perceived usefulness, security, and privacy on interest in using EWallet.
Benefits can be interpreted as the extent to which someone in using financial technology in transactions will improve performance.
Perceived security and privacy reflect how users feel when their data is disclosed. A total of 116 millennial generations who live in
Surabaya were used as samples. To analyze the data used variance-based SEM analysis technique, namely SEM-PLS. The findings
of this study are that the perceived benefits, privacy and security have will increase interest in using ewallet. Interest in using e-
wallet also contributes to e-wallet usage behavior. This study provides better evidence of the usefulness of e-wallet in electronic
transactions.
KEYWORDS: Benefits, Interests, Behavior, Privacy and Security
1. INTRODUCTION
In 2021 the world will face an international disaster, namely the Covid 19 pandemic, and Indonesia is no exception. The impact of
Covid 19 has hit all fields, transportation, tourism, investment, trade, and Fin-tech. The use of Fin-tech during this pandemic is
increasing greatly, with the existence of Fin-tech it will make trading transactions easier. Advances in technology and information
provide various services that people can use using digital. Payment transactions, which are usually used traditionally using cash,
are urged to encourage people to use digital payments more. Good for buying clothes, food, and drinks, transportation. The
Indonesian government in reducing the impact of Covid-19 transmission has determined several efforts to reduce the spread of
the virus, one of which is 3M, using masks, washing hands, and maintaining distance. To facilitate transactions, one of the
electronic devices that can be used by the public to facilitate online transactions is a digital wallet (E-Wallet). E-Wallet is an
electronic wallet as a substitute for a wallet to replace money storage or is an online money storage service that can be accessed
using an application and connected to the internet. Money or balance in a digital wallet can be obtained via transfer from a savings
account, this e-wallet can be used for various transactions, from shopping for daily necessities to paying monthly bills.
The development of e-wallets in Indonesia has progressed, it is recorded that there are about 38 digital wallets, several e-wallets
that are growing rapidly, namely GoPay, OVO, LinkAja, Dana, and SakuKu. Based on APP Annie's data in Q2 2019, the five digital
wallet applications are ranked at the top of monthly active users. The growth of this digital wallet has also reached 50% in the last
two years. This percentage is driven by access from the Financial Services Authority (OJK) to banks to integrate with these services.
In fact, according to the Jakpat survey Platform and DailySocial studies, 74.6% of users of the application are aged 20-35 years
(teknoiot.com). Communities in evaluating their financial technology services tend to evaluate the benefits and risks, convenience
has a positive influence on sustainable intentions in using technology as well as the risks of its use (Sentanu et al, 2020). The
convenience used refers to the speed of the system and speeds up the time and energy used (Park et.al, 2003). (Revathy and
Balaji, 2020) using people in India, the results of the study show that perceptions of security, social influence, and performance
expectations are variables that play a role in increasing the use of e-wallet. The use of e-wallets can avoid physical touch when
exchanging money amid the Covid 19 pandemic, as well as create a positive attitude in the country's people towards the
implementation of a cash economy.
In addition to the benefits expected by e-wallet users, the use of this technology also has several risks, in Nurdin's research (2020)
the risk affects the interest in transacting using Fintech. While research (Sentanu et al, 2020) the perceived risk did not have a
negative impact on the use of e-wallet services, because the risks experienced were not too large compared to the benefits

“Impact of Perceived Benefits, Security, and Privacy on Interest in Using E-Wallet in Millennial Generation”
IJMRA, Volume 5 Issue 05 May 2022 www.ijmra.in Page 1052
received. Millennial generation respondents in research by Pertiwi et.al (2021), business expectations, financial literacy, and
performance expectations as independent variables that can increase recurring interest in adopting fintech services
The Theory of Reasoned Action (TRA)
Ajzen and Fishbein (1980) develop the theory of TRA. This theory explains that behavior is carried out because individuals have an
interest or desire to do so (behavioral intention). Interest will determine behavior. Interest is defined as the desire to perform the
behavior. Interest is not always static interest can change over time. The theory of reasoned action explains the stages of human
behavior (Jogiyanto, 2007). In the early stages, behavior is assumed to be determined by intention. In the next stage, interests can
be explained in the form of an attitude toward the behavior and subjective norms. The third stage considers attitudes and
subjective norms in the form of beliefs about the consequences of doing their behavior and about the normative expectations of
the relevant referenced person.
Behavior (actual system use)
Behavior or actual system use refers to the behavior of using new technology. Internet technology is a relatively new technology
and continues to grow and is important to be used. More importantly, if the internet is intended to be used by customers in
transacting with organizations (Yogiyanto,2007). Sukaris, et al (2021) also explained that behavior is an action taken by someone.
The use of information technology is always associated with a person's behavior in using technology in real terms. The behavior
of using a technological system can be measured by the frequency with which a person uses the system, if they already have an
interest in the technology system due to the convenience and benefits obtained, then someone will continue to use the system in
their life or in their work, so that it will improve performance. In Kim and Kwahk's research in Rattanaburi and Vongurai (2020) it
was also stated that actual use refers to the frequency and duration of technology use.
Benefits
The use of technology, such as the internet has risks in online shopping, such as the risk of losing funds, the risk of getting items
that are not in line with their expectations. In addition to the risks that may be experienced. Online shopping also has many
benefits, such as the convenience of shopping, they don't need to leave the house to get products, just by looking at the catalog
of products consumers can directly shop, this certainly saves time, consumers are satisfied and comfortable.
Bhatti and Rehman (2019), examined on-line shopping behavior, that the benefits have a positive influence and the risks have a
negative influence on consumer behavior in online shopping. According to Yani et al. (2018), perceived usefulness is the extent to
which a person believes that using a technology will improve the performance of his work. Basically, perceived benefits describe
users' cognitive expectations about the performance of information technology systems in on-line payments, therefore consumers
usually believe that using e-wallet can fulfill financial and lifestyle desires and increase efficiency in conducting various transactions
(Yang, et al, 2021). Barbuta, et al in Singha and Sinha (2021) confirm that perceived benefits will affect behavioral intentions on e-
wallet. A higher usability level of a technology will also lead to a greater interest in using it. The perceived benefits of using e-
wallet will increase along with the improvements made (Daragmeh., et al, 2021).
Security and Privacy
Security is a condition where a person feels free from danger, in the use of technology, of course there is a feeling whether the
technology to be used is safe for his personal finances, whether the technology used in online payments does not harm him. So
that users trust and are comfortable in using on-line payments. Security is also a consumer's feeling that his personal condition
will not be seen, stored, and manipulated by other parties who are not authorized when conducting online transactions (Enck in
Matemba and Li, 2017).
Privacy is defined as a person's ability to control the conditions under which their personal information is collected and used and
will not be shared with others (Smith, et al in Watat and Jonathan, 2020). This is a very important thing that all users of online
transactions want. Based on a study (Soodan., et al., 2020), one of the factors that influence the use of e-wallet is privacy and
security which are found to be more supportive. Lack of security and privacy is one of the problems that keep customers from
buying goods on-line unless the buyer feels protected by his privacy (Milberg, Smith & Bruke, 2000). If, payments via e-wallet
without security features can cause access to personal information to be used by other parties who are not responsible or can be
said to be a crime in cyberspace, which is not legal and becomes a lucrative opportunity for cybercriminals to take personal data
(Kaur et al., 2018). According to Marimuthu and Roseline (2020) e-wallet is increasingly popular in its use because it can be used
for easier transactions than conventionally, but the lack of knowledge and public awareness and fear of making transactions due
to security issues are the main factors that must be considered. Privacy and security are very much needed by users of on-line
transactions, information system providers must be aware of this, so that they do not refuse to make any transactions through
electronic payments. Due to the rapid development of technology and security issues, it is a serious concern for online payment

“Impact of Perceived Benefits, Security, and Privacy on Interest in Using E-Wallet in Millennial Generation”
IJMRA, Volume 5 Issue 05 May 2022 www.ijmra.in Page 1053
users who use transaction technology. Customers who are inexperienced in the use of technology may have security and privacy
concerns, for example in the use of credit or debit cards.
Interest (Behavioral Intention to Use)
Interest is defined as a series of actions that individuals want to achieve (Zhao in Karim, et al, 2020). Behavioral interest stated by
Chu and Chen in Abbad (2021) refers to an individual's willingness to do something. Kusumah in Rahayu, (2019) Defines that
interest as one of the aspects of the human psyche that can encourage them to achieve goals. Someone will be interested in using
it if the individual assesses something that is useful for him and brings satisfaction. Interest in the context of the technology
acceptance model is defined as individuals who tend to use and embrace new technologies (Alswaigh and Aloud, 2021). Liao, et
al (2018) stated, that behavioral intention to use is a behavioral tendency to continue to apply technology. Ajzen and Fishbein in
Stocchi (2018) assert that interest in use underlies the adoption or absorption of technology. The development of interest into
behavior will depend on one's beliefs. Interest will attract motivational factors that influence behavior. In addition, interest also
shows the level of people's willingness to try or signal their plans to implement the effort to carry out the behavior (Matemba and
Li, 2017). The interest to behave in using and implementing information systems or technology is also considered a performance
expectation (Yeow and Loo in Dwivedi, 2017). Users who believe that technology is useful in everyday life will be more motivated
to use and accept technology (Vankatesh in Lin, 2020).
Hypothesis:
H1. The perceived benefits have a significant positive effect on the interest in adopting e-wallet
H2. Security and privacy have a significant positive effect on the interest in adopting e-wallet H3.
The interest in adopting e-wallet have a significant positive effect on behavior
2. RESEARCH METHODS
Research variable
Using Behavior. Is a condition of the actual situation of a person in using an e-wallet for online shopping, which is measured by
the frequency and duration of transactions. Indicators of user behavior are adopted from (Phan et.al, 2020): the use of e-wallet
payments regularly, using an e-wallet is fun, using an e-wallet is positive
Behavioral interest in adopting an e-wallet, it is a person's desire or interest to use e-wallet continuously now and in the future.
Indicators of behavioral interest in using e-wallet (Phan et.al 2020): continue to use an e-wallet, plan to use e-wallet in the future,
have predictions of e-wallet use, hope to use e-wallet continuously in the future.
Perceived benefit, a condition where a person feels better results and performance in his work in the use of e-wallet. Indicators
of perceived benefits (Razif et. Al 2020): payment transactions are difficult to do without an e-wallet payment system, believe
using an e-wallet payment system increases the effectiveness of the payment process, believe using an e-wallet platform system
saves my time, especially in processing transactions, feel that using an e-wallet makes it easy to buy products or services, using an
ewallet is useful for paying bills, shopping, shopping online, and others.
Security and Privacy, Is a feeling of security and protection of personal data from the use of e-wallet as a payment system
Indicators of security and privacy (Phan et.al, 2020): The e-wallet payment system ensures verification among the participating
parties. believe that the e-wallet payment system is planned to be ready to face risks and there is the certainty of data security,
the e-wallet payment system ensures that my information remains intact, believes that my personal information will not be used
for other purposes, believes that my transactions through the e-wallet will be protected, believe that my personal information is
protected through the e-wallet database
Variable Measurement
To measure the attitudes and opinions of respondents used a Likert scale (1-5) with statements strongly disagree to strongly agree
Population and Sample
The population used in this study is the millennial generation who were born between 1980 and 2000 (aged between 20 to 44
years). Determination of the sample as many as 116 respondents, based on the technique of determining the sample according
to (Ghozali, 2011) namely the number of samples between 5-10 times the indicator
Analysis Techniques
Partial Least Square (PLS-SEM) is used to test the hypothesis, where the first test is the structural model testing or called the inner
model to test the relationship between constructs, the second is measurement models or called the outer model, to test the
relationship between the construct and indicator variables.

“Impact of Perceived Benefits, Security, and Privacy on Interest in Using E-Wallet in Millennial Generation”
IJMRA, Volume 5 Issue 05 May 2022 www.ijmra.in Page 1054
3. RESEARCH RESULTS AND DISCUSSION
This study analyzes the millennial generation who use financial technology services using an e-wallet. To obtain data,
questionnaires were distributed to determine and analyze behavior using e-wallets which were influenced by an interest in using,
security and privacy, and perceived benefits.
By distributing questionnaires to respondents aged 20 to 44 years via google form from July to August 2021, 116 respondents
were obtained who were eligible for analysis.
Table 1. Characteristics of Respondents
No Characteristics of
Respondents
Criteria Frequency Percentage
1 Sex Male 42 63.8
Female 74 36.2
2 Age 20-25 40 34.5
26-30 34 29.3
31-35 22 19
36-40 11 9.5
41-44 9 7.8
3 Profesion Private 62 53.4
Entrepreneur 21 18.1
Government
employees
15 12.9
Professional 12 10.3
Household 6 5.2
Measurement Model or Outer Model
For testing the outer model in this study, there are 2 exogenous variables (Security and privacy and Benefit) and 2 independent
variables (interest and behavior), the total of all latent variable indicators is 18. Therefore, this indicator needs to be tested
whether it reflects the construct, by testing level of validity and reliability.
The first step can be seen from the convergent validity of each construct. If the loading factor value is greater than 0.05 then an
indicator has good validity. In this study, all construct indicators (perceived benefits, security and privacy, interest in using and
behavior in using e-wallet) have values above 0.7 so it can be said that all indicators are valid. Outer model testing can also be
seen from the AVE value, if the value is greater than 0.5, it indicates good validity. The results of the AVE test for the variables of
security and privacy, benefits, interests, behavior are as follows table 2.
Table 2. Construct Reliability and Validity
Cronbach's
Alpha
Rho_A Composite Reliability Average Variance
Extracted (AVE)
Security and Privacy 0.902 0.909 0.924 0.672
Benefit 0.869 0.884 0.905 0.657
Interest 0.902 0.910 0.932 0.773
Behavior 0.887 0.888 0.930 0.817
Source: processed data
From table 2. Cronbach's Alpha value of the variables security and privacy, benefit, interest, behavior as follows are all above 0.8,
this indicates a very reliable construct, the composite reliability value of each construct is very good because the value is above
0.80. And the AVE value above 0.6 indicates good validity

“Impact of Perceived Benefits, Security, and Privacy on Interest in Using E-Wallet in Millennial Generation”
IJMRA, Volume 5 Issue 05 May 2022 www.ijmra.in Page 1055
Table3. Discrimination Validity
Security and
Privacy
Benefit Interest Behavior
Security and Privacy 0.819
Benefit 0.513 0.811
Interest 0.646 0.680 0.879
Behavior 0.617 0.681 0.811 0.904
In table 3, it is the discriminant validity value. According to the Fornnel-Lacker criteria (Hair et al., 2014), if the PLS results show
that the AVE root of each construct is higher than the correlation value between other constructs, then it is said to be valid, so all
constructs in the estimated model meet the discriminant validity criteria.
Goodness-Fit Mode Test
Table 4. R Square
R Square R Square Adjusted
Interest 0.582 0.575
Behavior 0.657 0.654
Source: processed data
The R-Square value is the value of the influence of the independent variable to the dependent variable, the R-square value of
interest in adopting e-wallet is 0.582 indicating that the model is "Strong Enough", the R-Square value is the contribution of
benefits, security, and privacy to interest in using e-wallet. -wallet. Or it can be said that the dependent variable is influenced by
the independent variable by 58.2% while the remaining 41.8% is explained by other variables. As for the R-Square of behavior
using e-wallet 0.657, this also shows the model is "strong enough" or can be interpreted as 65.7% of behavioral variables are
influenced by interest in using e-wallet.
Structural Model Testing (Inner Model )
The inner model test in this study is seen from the P-value. The hypothesis that states the effect of security and privacy on interest
is significant, the hypothesis that tests the effect of benefits on significant interest, and the hypothesis that tests interest in
behavior is also significant with a p-value below 0.05 at α 5%.
Table 5. Path Coefficient
Original Sample
(O)
Sample
Mean (M)
Standard
Deviation
(STDEV)
T- Statistics
(|O/STDEV|)
P-Values
Security and privacy ->
interest
0.404 0.390 0.104 3,881 0.000
Benefits -> interest 0.473 0.499 0.085 5.533 0.000
Interest -> behavior 0.811 0.817 0.032 25,732 0.000
Source: Data processed Significant: α 5%
5. DISCUSSION
The effect of perceived benefits on interest in using an e-wallet.
The perceived benefits of interest in using e-wallet are significantly positive with a P-value of 0.000 at 5%, which means that the
more respondents agree that there are perceived benefits in using e-wallet, the higher the interest in using e-wallet. . Seeing the
conditions at the time of the study were pandemic conditions, activities involving many people were limited, leaving the house
was limited, so the interest in using this e-wallet was very high, in buying a product, both goods, services, food, drinks and paying
other bills it was very easy and useful for respondents, this is supported by the respondents' answers to the highest mean in the

“Impact of Perceived Benefits, Security, and Privacy on Interest in Using E-Wallet in Millennial Generation”
IJMRA, Volume 5 Issue 05 May 2022 www.ijmra.in Page 1056
answers to using e-wallet useful for paying bills, shopping in stores, shopping on-line. The research which was also conducted by
Syahril and Rikumahu (2019), has the same result that the benefits of technology will increase interest in using e-wallet.
Effect of Security and privacy on interest in using an e-wallet.
Based on structural model testing, there is a positive influence of security and privacy on interest in using e-walllets, with a Pvalue
of 0.000 at 5%. This positive influence means that security and privacy, namely feelings of security and the delivery of respondent's
personal data when using an e-wallet will increase interest in using an e-wallet. The e-wallet service will make it easier for the
public to transact online. From the respondents' responses, the highest mean was when the respondents answered that the e-
wallet payment system had been verified by the parties involved, so they considered it safe to transact using e-wallet. The results
of this study are supported by other researchers Karim et al., (2020) to increase consumer interest, e-wallet service providers must
provide a sense of security and privacy to their customers. With good privacy and security protection, customers will trust and be
comfortable in using e-wallet payments (Wei et al., 2009).
The effect of interest in using an e-wallet on behavior using an e-wallet.
There is a positive and significant effect of interest in using behavior, with a coefficient value of 0.811 with a p-value of 0.000. This
positive effect means that interest in using e-wallet will increase behavior using e-wallet. The higher the interest in using ewallets,
the person's behavior will be reflected in the regular use of technology. The respondents' answers have the highest mean on the
respondent's desire to use e-wallet in the future and interest in using it, in the end they perceive the new technology system as
fun. This study supports the research of Karim et.al (2020), (Barry and Jan, 2018) that behavioral intention is a significant influence
on actual e-wallet usage behavior.
6. CONCLUSION
From the results of research on the millennial generation during the covid pandemic, the benefits of using an e-wallet as a
substitute for cash payments can increase interest in using an e-wallet. Respondents' responses to the security and privacy of
using e-wallets will also increase interest in using an e-wallet. While the interest itself, if the interest in using an e-wallet is
increasing, it will affect their actual behavior.
REFERENCES
1) Abbad, M. M. M. (2021). Using the UTAUT model to understand students usage of e learning system in developing
countries. Journal Education and Information Technologies, Vol. 26(6), pp. 7205-7224. https://doi.org/10.1007/s10639-
021-10573-5
2) Ajzen, I. (2012). The theory of planned behavior. In Handbook of Theories of Social Psychology: Volume 1.
https://doi.org/10.4135/9781446249215.n22
3) Barry , M., & Jan , M. T. (2018). Barry, M., & Jan, M. T. (2018). Factors Influencing the Use of MCommerce: An Extended
Technology Acceptance Model Perspective. International Journal of Economics, Management and Accounting, 26(1), 157-
183.
4) Daragmeh, A., Sagi, J., & Zeman, Z. (2021). Continuous intention to use e-wallet in the context of the COVID-19 pandemic:
integrating the health belief model (HBM) and technology continuous theory (TCT). Journal Open Innovation: Technology,
Market and Complexity, Vol.7, 132. https://doi.org/10.3390/joitmc7020132
5) Davis, F. D. (1986). A technology acceptance model for empiricaly testing new end-user information system: theory and
results. Disertation. Massachusetts Institute of Technology.
6) Dwivedi, Y. K., Rana, N. P., Jeyaraj, A., & Clement, M. (2017). Re-examining the unified theory of acceptance and use of
technology (UTAUT): towards a revised theoritical model. Information System Frontiers 21, 719-734.
https://doi.org/10.1007/s10796-017-9774-y
7) Ghozali. (2011). Aplikasi Analisis Multivariate dengan Program SPSS. Jurnal Ilmiah Universitas Pandanaran.
https://doi.org/10.1177/107049659800700202
8) Karim, M. W., Haque, A., Ulfy, M. A., Hossain, M. A., & Anis, M. Z. (2020). Factors influencing the use of E-wallet as a
payment method among Malaysian young adults. Journal of International Business and Management, 3(2), 01-12.
9) Lin, W. R., Chun, Y. L., & Yu, H. D. (2020). Factors affecting the behavioral intention to adopt mobile payment: an empirical
study in Taiwan. Mathematics Journal, Vol. 8(10). https://doi.org/10.3390/math8101851
10) Liao, S., Hong, J. C., Wen, M. H., Pan, Y. C., & Wu, Y. W. (2018). Applying technology acceptance model (TAM) to explore
users’ behavioral intention to adopt a performance assessment system for e-book production. Eurasia Journal of
Mathematics, Science and Technology Education, Vol. 14(10). https://doi.org/10.29333/ejmste/93575

“Impact of Perceived Benefits, Security, and Privacy on Interest in Using E-Wallet in Millennial Generation”
IJMRA, Volume 5 Issue 05 May 2022 www.ijmra.in Page 1057
11) Matemba, E. D., & Li, G. (2017). Consumers’ willingness to adopt and use wechat wallet: an empirical study in South Africa.
Journal Technology in Society, Vol. 53, pp.55-68. https://doi.org/10.1016/j.techsoc.2017.12.001
12) Mega, I. P., & Semara, J. (2015). Kemampuan Pelatihan Pasar Modal Memoderasi Pengaruh Pengetahuan Investasi Dan
Penghasilan Pada Minat Berinvestasi Mahasiswa. Jurnal Ilmiah Akuntansi Dan Bisnis.
13) Nizar, M. A. (2017). Teknologi Keuangan (Fintech) : Konsep dan Implementasinya di Indonesia. Retrieved January 5, 2019,
from https://www.researchgate.net
14) Nurdin, N., Azizah, W. N., & Rusli, R. (2020). Pengaruh Pengetahuan, Kemudahan dan Risiko Terhadap Minat Bertransaksi
Menggunakan Finansial Technology (Fintech) Pada Mahasiswa Institut Agama Islam Negeri (IAIN) Palu. Jurnal Perbankan
dan Keuangan Syariah Vol, 2(2).
15) Park, C., & Jun, J. K. (2003). A cross‐cultural comparison of Internet buying behavior: Effects of Internet usage, perceived
risks, and innovativeness. International Marketing Review.
16) Pertiwi, T. K., & Purwanto, E. (2021) Analysis Of Adopting Millennial Generation Financial Technology (Fintech) Services.
International Journal of Business Management and Economic Review
17) Phan, T. N., Ho, T. V., & Le-Hoang, P. V. (2020). Factors Affecting The Behavioral Intention And Behavior Of Using E-Wallets
Of Youth in Vietnam. The Journal of Asian Finance, Economics, and Business, 7(10), 295-302.
18) Rattanaburi, K. & Vongurai, R. (2020). Factors influencing actual usage of mobile shopping applications: generation Y in
Thailand. Journal of Asian Finance and Business, Vol. 8(1), pp. 901-913. https://doi.org/10.13106/jafeb.2021.vol8.no1.901
19) Razif, N. N. M., Misiran, M., Sapiri, H., & Yusof, Z. M. (2020). Perceived risk for acceptance of E-wallet platform in Malaysia
among youth: Sem approach. Management Research Journal, 9, 1-24.
20) Sentanu, W., Sagala, S. A., Marjuki, D., & Gunadi, W. (2020) Analysis Of The Effects Of Benefit And Risk Factors On The Use
Of E-Wallet.
21) Sukaris, S., Renedi, W., Rizqi, M. A., & Pristyadi, B. (2021). Usage behavior on digital wallet: perspective of the theory of
unification of acceptance and use of technology models. Journal of Physics Conference Series 1764(1).
https://doi.org/10.1088/1742-6596/1764/1/012071
22) Singh, N., & Sinha, N. (2019). How perceived trust mediates merchant's intention to use a mobile wallet t technology.
Journal of Retailing and Consumer Services, Vol. 52. https://doi.org/10.1016/j.jretconser.2019.101894
23) Stocchi, L., Michaelidou, N., & Micevski, M. (2019). Drivers and outcomes of branded mobile app usage intention. Journal
of Product & Brand Management, Vol. 28(1), pp. 28-49. https://doi.org/10.1108/JPBM-02-2017-1436
24) Revathy, C., & Balaji, P. (2020). Determinants of behavioural intention on e-wallet usage: an empirical examination in amid
of covid-19 lockdown period. International Journal of Management (IJM), 11(6), 92-104.
25) WatatWatat, J. K. & Jonathan, G. M. (2020). The inflfluence of Privacy Concerns on Intention to Use Social Media. AMCIS
2020 Proceedings
26) Wei , T. T., Marthandan , G., Chong , A. Y., Ooi, K. B., & Arumugam , S. (2009). What drives Malaysian m-commerce
adoption? An empirical analysis. Industrial management & data systems, 109(3), 370-388.
27) Yang, M., Mamun, A. A., Mohiuddin, M., Nawi, N. C., & Zainol, N. R. (2021). Cashless transaction: a study on intention and
adoption of e-wallets. Journal Sustainability, Vol. 13, 813. https://doi.org/10.3390/su13020831
28) Yogiyanto (2007) Sistim Informasi Keperilakuan, Penerbit Andi, Yogyakarta
There is an Open Access article, distributed under the term of the Creative Commons Attribution – Non Commercial 4.0 International (CC BY-NC 4.0) (https://creativecommons.org/licenses/by-nc/4.0/), which permits remixing, adapting and building upon the work for non-commercial use, provided the original work is properly cited.

INTERNATIONAL JOURNAL OF MULTIDISCIPLINARY RESEARCH AND ANALYSIS
ISSN(print): 2643-9840, ISSN(online): 2643-9875
Volume 05 Issue 05 May 2022
DOI: 10.47191/ijmra/v5-i5-23, Impact Factor: 6.261
Page No. 1058-1069
IJMRA, Volume 5 Issue 05 May 2022 www.ijmra.in Page 1058
Service Quality, Customer Satisfaction, Consumer Behavior and
Business Performance of Health and Fitness Center in Kuwait,
UAE
Lino Rosete
University of Perpetual Help System Laguna, Philippines
ABSTRACT: This study investigated the quality of service of the health and fitness center as assessed by the clients in terms of
reliability, responsiveness, assurance, empathy, and tangibles; the clients’ level of customers satisfaction on the services of the
health and fitness center; the clients’ consumer behavior towards the services of the health and fitness center; and the business
performance of the health and fitness center in terms of customer loyalty and customer retention rate. Further, it probed the
relationship between the quality of service and clients’ level of customer satisfaction on the health and fitness center’s services;
between the clients’ level of customer satisfaction and consumer behavior towards the health and fitness center’s services; and
between the quality of service and business performance of the health and fitness center. It also ascertained whether service
quality, level of customer satisfaction and level of consumer behavior could predict the business performance of the health and
fitness center.
This study utilized the descriptive-correlational research design, which involved 300 randomly selected clients of the
Oxygen Gym Health and Fitness Center, in Kuwait, UAE.
Findings revealed that the respondent-clients ‘strongly agree’ with an overall average of 3.48 to the quality of service of
the health and fitness center, the Oxygen Gym, as to its services. The respondent-clients’ level of satisfaction on the services of
health and fitness center was ‘very high’ with an overall weighted mean of 3.51. The respondent-clients ‘strongly agree’ with an
average weighted mean of 3.50 to all the indicators of customer behavior, such as psychological, personal, social and cultural
factors, towards the services of the health and fitness center. Results also revealed that the degree of customer loyalty as a
qualitative measure of the Oxygen Gym’s business performance was very high. Results also shown that there was a significant
relationship between level of customer satisfaction and consumer behavior towards the health and fitness center’s services
KEYWORDS: Keywords: Service Quality, Customer Satisfaction, Consumer Behavior, Business Performance, Health and Fitness
Center, Oxygen Gym, Qualitative Research
INTRODUCTION
The global gym industry is worth $96.7 billion in 2020, with more than 184 million gym members in total. The year 2020 is a proof
to the growing gym industry trends where the global gym industry is worth $96.7 billion (Stasha, 2021). Way back in 2018, the
wellness industry valued at more than $4 trillion according to figures from the Global Wellness Institute (GWI). The consumers’
shifting involvement with their healthcare could be the reason for the development of a vast international wellness market.
People, more than ever, have become conscious of their health and well-being – putting premium on lifestyle, personally attending
to their health and investing money on their well-being. According to the GWI, “the wellness industry now accounts for over 5%
of global economic output, yet the wellness market is often written off as a collection of fads’’ (Nelson, 2019). Despite the
pandemic, consumers still go to the gyms not only because of the professional setup in gyms but because of the social experiences
at gyms. Community in gym workouts is the top motivator for consumers to go to gyms (Kestenbaum, 2019). Thus, it is business
as usual with management and staff ever conscious of the factors that will ensure business performance or commercial
effectiveness to achieve pre-determined goals.
Such as factors include service quality, customer satisfaction and consumer behavior, among others. Service quality as
defined by Borgave and Koranne (2016) as cited by Aristayasa, et al. (2019) is the comparison of customer expectations with
service performance. It can be achieved by addressing problems and defining measures for quality service and outcomes. Thus,

Service Quality, Customer Satisfaction, Consumer Behavior and Business Performance of Health and Fitness Center in Kuwait, UAE
IJMRA, Volume 5 Issue 05 May 2022 www.ijmra.in Page 1059
good service quality leads into customer satisfaction and makes firms competitive in the market. Customer Satisfaction refers to
an individual’s perception towards the quality of service or product they received in relation to their personal expectation
(Tahanisaz & Shokuhyar, 2020). Consumer behavior refers to the actions and the decision processes of people who purchase goods
and services for personal consumption. It refers, further, to the study of customers and how they behave while deciding to buy a
product that satisfies their needs (as cited by Raither, 2018).
Business Performance, which is closely tied to commercial effectiveness, is the ability of a company to implement optimal
organization with the aim of offering a product or service that meets the expectations of consumers and customers. Aside from
the financial indicators, it can be measured in terms of non-financial indicators such as customer loyalty which is the act of
choosing one company's products and services consistently over their competitors. When a customer is loyal to one company,
they are not easily swayed by price or availability (Taysan and Duran, 2021); and customer retention which is the company's ability
to turn customers into repeat buyers and prevent them from switching to a competitor. It indicates whether a company’s product
and the quality of its service please existing customers (Al-Gharaibah, 2020).
Research has shown the interrelationships of service quality, customer satisfaction and consumer behavior and their
impact on business performance as measured in terms of non-financial indicators. For instance, Faroog et al. (2018) assessed the
impact of the SERVQUAL provided by Malaysian Airlines on their customer satisfaction. Consequently, they found out that all five
dimensions of AIRQUAL i.e., airline tangibles, terminal tangibles, personnel service, empathy, and image have a positive impact
on their customer satisfaction. Similarly, Omar Ali and Abd Hakim Amir (2020) examined the relationship between service quality
and customer satisfaction in postal service.. Their study revealed that all four service quality elements were positively associated
with customer satisfaction with responsiveness and reliability mostly influencing it. Liu et al. (2021) examined the effect of tourism
resource uniqueness and service quality to their customer behaviors such as word-of-mouth recommendations and feedback. The
result of their study suggested that both resource uniqueness and service quality directly affect their customers’ behavior. This
means that quality service makes consumer have positive word-of-mouth recommendations and feedbacks.
The study of Nair (2017) focused on the impact of service quality on business performance in the hospitality industry in
Qatar. The findings have confirmed the significant interrelationship of tangibles, reliability and empathy with financial, non-
financial, and operational performance of the hospitality industry. Responsiveness and assurance had significant interrelationship
with non-financial performance and operational performance respectively.
Macon (2020) found out that service quality is correlated with customer loyalty. This means that customers will continue
their membership in health and fitness club if they perceived that they’re receiving quality service. Othman et al. (2020), who
examined the relationship between service quality and customer retention for clothing store brands in China, found out that
customer perception of the quality of a service product in all sizes has a beneficial effect on customer retention.
Alves (2014) as cited by Chandra et al. (2018) concluded in his study that customer satisfaction has significant impact on
customer loyalty. Nurmaliki and Riyanto (2020) proved that consumer behavior significantly impacted small and medium
enterprises (SME’s) performance amidst the COVID-19 pandemic. In this regard, they suggested various options to remain having
competitive advantage towards other SMEs. Elestwani (2015) as cited by Elestwani (2018) also revealed how a customer’s trust-
related behavior can influence their loyalty to a business firm. Furthermore, Maria et al. (2018), identified the direct relationship
between consumer behavior and business performance. They identified shopping experience, awareness on diverse pricing,
privacy concerns, purchasing strategies, fair price perceptions, reprisal intentions, and self-protection as influencers of a client’s
behavior.
Evidently, a number of research have investigated the operations of health and fitness gyms, but no study has been
conducted yet on service quality, customer satisfaction and consumer behavior as predictors of the business performance of
Oxygen Gym, a reputable and the biggest health and fitness center in Adailyah, Kuwait, United Arab Emirates.
Thus, this study investigated service quality, customer satisfaction and consumer behavior as predictors of business
performance of a Health and Fitness Center in Kuwait, UAE. It will probe the relationship between quality of service and clients’
level of customer satisfaction on the health and fitness center’s services; between clients’ level of customer satisfaction and
consumer behavior towards the health and fitness center’s services; and quality of service and business performance of the health
and fitness center. Further, it will ascertain whether service quality, level of customer satisfaction and level of consumer behavior
can predict the business performance of the health and fitness center.
Findings of the study would serve as feedback to the Oxygen Gym instructors on their clients’ perception of service
quality, satisfaction, and consumer behavior from which they could learn and mull over continuous quality improvement strategies
to further improve their services. Likewise, the Oxygen Gym manager can would a basis for policy decision-making relative to
strategic initiatives towards the sustenance of the business performance and organizational growth.

Service Quality, Customer Satisfaction, Consumer Behavior and Business Performance of Health and Fitness Center in Kuwait, UAE
IJMRA, Volume 5 Issue 05 May 2022 www.ijmra.in Page 1060
METHODOLOGY
This study utilized the descriptive-correlational research design. The population of this study consisted of 3,000 clients of the
Health and Fitness Center, the Oxygen Gym, in Kuwait, UAE. Only 10% or 300 of the total population were taken as the sample
respondents of the study
A researcher-made questionnaire was constructed for the purpose of generating the needed primary data. Part I dealt
on the perceived quality of service of the Health and Fitness Center (HFC); Part II will cover the level of customer satisfaction of
the HFC clients; Part III dwelt on the HFC clients’ customer behavior; and Part IV focused on the HFC business performance as
assessed by the clients based on non-financial indicators such as customer loyalty and customer retention rate. The self-
made questionnaire went through a validation by a panel of experts - a researcher, a statistician, and a business professor, who
scrutinized it and suggested some modifications for its improvement.
The researcher wrote a formal letter requesting the Manager of the Health and fitness Center, then wrote a letter to the
identified client-respondents. Next he administered his survey questionnaire through online using Google form or in person,
retrieved them, data were coded and treated statistically and interpreted.
The weighted mean, Pearson Product Moment Correlation and regression analysis were the statistical tools used in the
treatment of data.
RESULTS AND DISCUSSIONS
Tables 1 to 5 present the quality of service of the health and fitness center in terms of reliability, responsiveness, assurance,
empathy, and tangibility.
Table 1. Quality of Service of the Health and Fitness Center as assessed by Clients: Reliability
Indicators
Weighted
Mean
Verbal
Interpretation
Rank
1. HFC counselors always stick to their words and serve you
based on the special offers on the application date.
3.43 Strongly Agree 4
2. When you have a problem, HFC staffs show a sincere
interest on solving it.
3.44 Strongly Agree 3
3. HFC staffs are reliable in providing service to member 3.47 Strongly Agree 2
4. HFC keeps members’ record accurately. 3.53 Strongly Agree 1
Average 3.47 Strongly Agree
As shown in Table 1, the respondents ‘strongly agree’ with an average weighted mean of 3.47 that the quality of service
of the health and fitness center was ‘very reliable’. Specifically, they ‘strongly agree’ with weighted means ranging from 3.43 to
3.53 that the center, Oxygen Gym, ‘keeps the records of the members accurately’ with a weighted mean of 3.53 (Rank 1), ‘the
staffs are liable in providing service to the members’ with a weighted mean of 3.47 (Rank 2), ‘when a member has a problem, the
staffs show a sincere interest on solving them’ with a weighted mean of 3.44 (Rank 3), and ‘the center’s counselors always stick
to their words and serve them based on the special offers on the application date’ with a weighted mean of 3.43 (Rank 4).
This means the Oxygen Gym possessed the ability to deliver service dependably and accurately. Reliability is the ability
to perform the promised service dependably and accurately. Thus, the reliability of the health and fitness center involves on time
performance, dependable service, understand members’ need and keep accurate records of their members (Klokkenga, 2020;
Bhasin, 2021; Kobiruzzaman, 2022).
Table 2. Quality of Service of the Health and Fitness Center as assessed by Clients: Responsiveness
Indicators
Weighted
Mean
Verbal Interpretation Rank
1. HFC employees handle your problems immediately. 3.50 Strongly Agree 1.5
2. HFC employees are eager to listen and solve problems. 3.43 Strongly Agree 4

Service Quality, Customer Satisfaction, Consumer Behavior and Business Performance of Health and Fitness Center in Kuwait, UAE
IJMRA, Volume 5 Issue 05 May 2022 www.ijmra.in Page 1061
3. HFC employees pay attention to your concerns and
understand your problems.
3.49 Strongly Agree 3
4. HFC employees have never been too busy to respond to your
requests.
3.50 Strongly Agree 1.5
Average 3.48 Strongly Agree
As indicated in Table 2, the respondents ‘strongly agree’ with an average weighted mean of 3.48 that the quality of service
of the health and fitness center was ‘very responsive’. In particular, they ‘strongly agree’ with weighted means ranging from 3.43
to 3.50 that the center’s ‘employees handle the clients’ problems immediately’ and ‘have never been too busy to respond to their
requests’, each with a weighted mean of 3.50 (Rank 1.5), ‘the employees pay attention to their concerns and understand their
problems’ with a weighted mean of 3.49 (Rank 3), and ‘the employees are eager to listen and solve problems’ with a weighted
mean of 3.43 (Rank 4).
This means the Oxygen Gym’s employees had the willingness to provide timely and efficient service for their clients.
Responsiveness is the willingness to help customers and provide prompt service. Responsiveness, as a quality service indicator for
a business such as a health and fitness center, is associated with the employees’ ability and attitude toward solving requests,
questions and complaints of clients promptly and attentively (Klokkenga, 2020; Bhasin, 2021; Kobiruzzaman, 2022).
Table 3. Quality of Service of the Health and Fitness Center as assessed by Clients: Assurance
As presented in Table 3, the respondents ‘strongly agree’ with an average weighted mean of 3.49 that they were ‘highly assured’
of the quality of service of the health and fitness. As indicated, they ‘strongly agree’ with weighted means ranging from 3.39 to
3.55 that the center’s ‘class instructors are always aware of members’ safety while class exercises are being conducted’ with a
weighted mean of 3.55 (Rank 1), ‘staffs are consistently courteous’ with a weighted mean of 3.51 (Rank 2), ‘they are safe while
attending class exercises under class instructor’s supervision’ with a weighted mean of 3.50 (Rank 3), and ‘staffs have knowledge,
capability, and skill in their job responsibilities’ with a weighted mean of 3.39 (Rank 4).
This means Oxygen Gym and its staffs demonstrated the ability to convey trust and confidence to its clients, such as the
knowledge and competence to answer questions. Assurance is the knowledge and courtesy of employees and their ability to
convey trust and confidence. As a dimension of quality, it means further that the gym’s clients could perceive the courtesy and
credibility of the staffs (Klokkenga, 2020; Bhasin, 2021; Kobiruzzaman, 2022).
Table 4. Quality of Service of the Health and Fitness Center as assessed by Clients: Empathy
Indicators
Weighted
Mean
Verbal Interpretation Rank
1. HFC gives you personalized attention while providing services. 3.55 Strongly Agree 1
2. HFC has operation hours convenient to all their customers 3.35 Strongly Agree 4
3. HFC has staffs who give members personal attention. 3.54 Strongly Agree 2
4. HFC staffs understand the specific needs of their customers. 3.52 Strongly Agree 3
Average 3.49 Strongly Agree
Indicators
Weighted
Mean
Verbal
Interpretation
Rank
1. HFC staffs are consistently courteous. 3.51 Strongly Agree 2
2. HFC staffs have knowledge, capability, and skill in their
job responsibilities.
3.39 Strongly Agree 4
3. HFC class instructors are always aware of members’ safety
while class exercises are being conducted.
3.55 Strongly Agree 1
4. You are safe while attending class exercises under
class instructor’s supervision.
3.50 Strongly Agree 3
Average 3.49 Strongly Agree

Service Quality, Customer Satisfaction, Consumer Behavior and Business Performance of Health and Fitness Center in Kuwait, UAE
IJMRA, Volume 5 Issue 05 May 2022 www.ijmra.in Page 1062
As reflected in Table 4, the respondents ‘strongly agree’ with an average weighted mean of 3.49 that they strongly felt the
‘empathy’ of the instructors and staffs the health and fitness center. Specifically, they ‘strongly agree’ with weighted means
ranging from 3.35 to 3.55 that the center ‘gives them personalized attention while providing services’ with a weighted mean of
3.55 (Rank 1), the center ‘has staffs who give members personal attention with a weighted mean of 3.54 (|Rank 2), ‘the staffs
understand the specific needs of their customers’ with a weighted mean of 3.52 (Rank 3), and ‘the center has operation hours
convenient to all their customers with a weighted mean of 3.35 (Rank 4).
This implies that the instructors and staffs of the Oxygen Gym were able to provide treatment that is individualized care
and attention to center members, such as personalized attention; and staffs understand the needs of individual members.
Empathy is the caring, individualized attention the firm provides its customers. As a dimension of service quality, it is regarded as
a very important factor in the competitive market of fitness providers (Klokkenga, 2020; Bhasin, 2021; Kobiruzzaman, 2022).
Table 5. Quality of Service of the Health and Fitness Center as assessed by Clients: Tangibles
Indicators
Weighted
Mean
Verbal Interpretation Rank
1. HFC has modern equipment. 3.57 Strongly Agree 1
2. HFC provides a variety of class exercises. 3.36 Strongly Agree 4
3. The design of HFC facilities is striking 3.56 Strongly Agree 2
4. Employees of HFC are neat and appealing. 3.48 Strongly Agree 3
Average 3.49 Strongly Agree
As gleaned from Table 5, the respondents ‘strongly agree’ with an average weighted mean of 3.49 to the ‘tangibles’ of
the services, physical facilities and equipment of the health and fitness center. Specifically, they ‘strongly agree’ with weighted
means ranging from 3.36 to 3.57 that the center ‘has modern equipment’ with a weighted mean of 3.57 (Rank 1), ‘the design of
the center facilities is striking with a weighted mean of 3.56 (Rank 2), ‘the employees of center are neat and appealing’ with a
weighted mean of 3.48 (Rank 3), and ‘the center ‘provides a variety of class exercises’ with a weighted mean of 3.36 (Rank 4).
This implies that the clients or customers of the Oxygen Gym were attracted and drawn to its modern equipment, well-
designed club, neat and well-dressed staffs and a variety of class exercises. Tangibles as a dimension of service quality refer to
physical facilities, equipment, appearance of the staff, communication materials in service process, etc. Attention to appearance
can indicate that a company takes customer comfort seriously (Klokkenga, 2020; Bhasin, 2021; Kobiruzzaman, 2022).
Table 6. Composite Table for the Quality of Service of the Health and Fitness Center as assessed by Clients
Indicators
Weighted
Mean
Verbal Interpretation Rank
1. Reliability 3.47 Strongly Agree 5
2. Responsiveness 3.48 Strongly Agree 4
3. Assurance 3.49 Strongly Agree 2
4. Empathy 3.49 Strongly Agree 2
5. Tangibles 3.49 Strongly Agree 2
Overall Weighted Mean 3.48 Strongly Agree
As shown in Table 6. the respondent-clients ‘strongly agree’ with an overall average of 3.48 to the quality of service of
the health and fitness center, the Oxygen Gym, as to its services. From the five (5) indicators of service quality, “assurance’,
‘’empathy” and ‘’tangibles’’, each with a weighted mean of 3.49 were equally ranked #2. Ranked # 4 was ‘’responsiveness’’ with
a weighted mean of 3.48; and ranked #5 was ‘’reliability’’ with a weighted mean of 3.47. This means that the respondent-clients
clearly put premium on the staff’s courtesy and credibility, on the staff’s individualized and personalized attention, staff’s
appearance and on the facilities and equipment.

Service Quality, Customer Satisfaction, Consumer Behavior and Business Performance of Health and Fitness Center in Kuwait, UAE
IJMRA, Volume 5 Issue 05 May 2022 www.ijmra.in Page 1063
2. Level of Customer Satisfaction on the HFC Services
Table 7. Clients’ Level of Customer Satisfaction on the Services of the Health and Fitness Center
As presented in Table 7, the respondent-customers’ level of satisfaction on the services of health and fitness center was
‘very high’ with an overall weighted mean of 3.51. This means that the customers had very high degree of fulfillment. They were
pleased and content with what has been experienced and received from the services of the health and fitness center along
accessibility, innovation and services, personnel, and facilities and equipment of Oxygen Gym.
Specifically, they were ‘very highly’ satisfied with the HFC’s ‘accessibility’’ with an average weighted mean of 3.54 (Rank
1) due to the location of the gym (WM=3.60) and the easy access to the gym (WM=3.47). Likewise, they were ‘very highly’ satisfied
with the HFC’s ‘innovation and services’ with an average weighted mean of 3.52 (Rank 2) because of its economical prices
Indicators
Weighted
Mean
Verbal
Interpretation
Rank
Facilities & Equipment 1. Proper facilities 3.47 Very High 7
2. Quality of equipment 3.50 Very High 3
3. Hygiene and cleanliness 3.48 Very High 6
4. Credibility 3.49 Very High 4.5
5. Spacious changing rooms 3.49 Very High 4.5
6. Coherent design 3.53 Very High 2
7. Prestige 3.54 Very High 1
Average 3.50 Very High 4
Innovation & Services 1. Economical prices 3.62 Very High 1
2. Innovative services 3.38 Very High 7
3. Capacity to solve problems 3.58 Very High 2
4. Innovative equipment 3.54 Very High 3
5. Parking services 3.48 Very High 6
6. Offered additional entertainment 3.53 Very High 4
7. Pleasant environment 3.52 Very High 5
Average 3.52 Very High 2
Personnel 1. Politeness of instructors & staff 3.60 Very High 1
2. Accuracy of information provided
by the instructors
3.37 Very High 7
3. Performance of instructors when
facing problems & complaints
3.55 Very High 3
4. Competence of instructors 3.47 Very High 5.5
5. Number of instructors available 3.47 Very High 5.5
6. Fitness Instructor
Service/Helpfulness
3.53 Very High 4
7. Reception Service/Helpfulness 3.56 Very High 2
Average 3.51 Very High 3
Accessibility 1. Location of the gym 3.60 Very High 1
2. Easy access to the gym 3.47 Very High 2
Average 3.54 Very High 1
Overall Weighted Mean 3.51 Very High

Service Quality, Customer Satisfaction, Consumer Behavior and Business Performance of Health and Fitness Center in Kuwait, UAE
IJMRA, Volume 5 Issue 05 May 2022 www.ijmra.in Page 1064
(WM=3.62), capacity to solve problems (WM=3.58), innovative equipment (WM=3.54), offered additional entertainment
(WM=3.53), pleasant environment (WM=3.52), parking services (WM=3.48), and innovative services (WM=3.38).
Further, they were ‘very highly’ satisfied with the HFC’s ‘personnel’ with an average weighted mean of 3.51 (Rank 3) due
to the politeness of instructors and staff (WM=3.60), reception service/helpfulness (WM=3.56), performance of instructors when
facing problems and complaints (WM=3.55), fitness instructor service/helpfulness (WM=3.53), competence of instructors
(WM=3.47), number of instructors available (WM=3.47), and accuracy of information provided by the instructors (WM=3.37).
Finally, they were ‘very highly’ satisfied with the HFC’s ‘facilities and equipment’ with an average weighted mean of 3.50
(Rank 4) because of prestige (WM=3.54), coherent design (WM=3.53), quality of equipment (WM=3.50), credibility (WM=3.49),
spacious changing rooms (WM=3.49), hygiene and cleanliness (WM=3.48), and proper facilities (WM=3.47).
The study’s findings find support in the study of Uğurlu (2018), which determined the satisfaction levels of individuals
who go to fitness centers. In the study, it was discovered that the participants determined the trainers’ attitude to be the most
positive perception while the hygiene was the most negative perception. In the analysis of the customer satisfaction in terms of
the personal information, it was determined that females’ trainer perception was lower compared to men and high school
graduate individuals’ atmosphere perception was lower compared to the other individuals.
Table 8. Clients’ Consumer Behavior towards the Services of the Health and Fitness Center
Indicators
Weighted
Mean
Verbal
Interpretation
Rank
1. I consider affordability as a factor for fitness club choice. 3.49 Strongly Agree 11
2. I consider convenience as a factor for fitness club choice. 3.42 Strongly Agree 15
3. I consider facilities as a factor for fitness club choice. 3.49 Strongly Agree 11
4. I want to improve my health 3.48 Strongly Agree 13.5
5. I want to lose weight 3.53 Strongly Agree 4.5
6. I want to improve my body image 3.54 Strongly Agree 1.5
7. I decide to use a fitness club based on price. 3.52 Strongly Agree 7
8. I decide to use a fitness club based on convenience 3.49 Strongly Agree 11
9. I decide to use a fitness club based on facilities 3.50 Strongly Agree 8.5
10. Health and fitness helps me to relax and unwind 3.53 Strongly Agree 4.5
11. Health and fitness gives me time to socialize 3.48 Strongly Agree 13.5
12. Health and fitness with peer group helps me reduce
anxiety
3.54 Strongly Agree 1.5
13. Health/appearance benefits can be derived from health and
fitness
3.53 Strongly Agree 4.5
14. Proper time management enable me to integrate
health and fitness with my lifestyle
3.50 Strongly Agree 8.5
15. Convenience enables me to integrate health and
fitness in my daily/weekly routines
3.53 Strongly Agree 4.5
Average 3.50 Strongly Agree

Service Quality, Customer Satisfaction, Consumer Behavior and Business Performance of Health and Fitness Center in Kuwait, UAE
IJMRA, Volume 5 Issue 05 May 2022 www.ijmra.in Page 1065
As reflected in Table 8, the respondent-customers ‘strongly agree’ with an average weighted mean of 3.50 to all the indicators of
customer behavior towards the services of the health and fitness center. This means that their behaviors were influenced by
psychological, personal, social and cultural factors as consumers of the services of the center. Specifically, they ‘strongly agree’
with weighted means ranging from 3.42 to 3.54 to the indicators that ‘I want to improve my body image’ and ‘health and fitness
with peer group helps me reduce anxiety’ (Rank 1.5), ‘I want to lose weight’, ‘Health and fitness helps me to relax and unwind’,
‘Health/appearance benefits can be derived from health and fitness’, and ‘Convenience enables me to integrate health and fitness
in my daily/weekly routines’ (Rank 4.5). Further, they ‘strongly agree’ to the following indicators: ‘I want to improve my health’
and ‘Health and fitness gives me time to socialize’ (Rank 13.5), and I consider convenience as a factor for fitness club choice (Rank
15).
Table 9. Business Performance of the Health and Fitness Center: Customer Loyalty and Customer Retention
Indicators
Weighted
Mean
Verbal
Interpretation
Rank
1. Recommend Oxygen Gym’s facilities and services to
others – a family member or friend.
4.23 Very High 2
2. Visit Oxygen Gym again for follow-up exercise classes and
other services
4.23 Very High 2
3. Choose Oxygen Gym for future health and fitness services 4.23 Very High 2
Average 4.23 Very High
The degree of customer loyalty was used as a qualitative measure of Oxygen Gym’s business performance. As shown in
Table 9, the customers’ degree of loyalty was ‘very high’ with an average weighted mean of 4.23. They intimated that they would
‘recommend Oxygen Gym’s facilities and services to others – a family member or friend’, ‘visit Oxygen Gym again for follow-up
exercise classes and other services’ and ‘choose Oxygen Gym for future health and fitness services’, each with a weighted mean
of 4.23 (Rank 2).
Further, the customer retention rate was computed for calendars years 2018-2019, 2019-2020 and 2020-2021 resulting
in a retention rate of 100%, 72% and 80% respectively (see appendix __). Thus, the business performance of Oxygen Gym, a 7-star
health and fitness center, could be characterized as highly effective commercially.
The study finding finds support in the observation of Srivastava and Rai (2018) that a loyal relationship characterized by
preference, patronage and premium is developed based on a high degree of customer satisfaction, coupled with the customer's
emotional attachment, and forged by an enduring association between the company and its customers.
Table 10. Relationship between Quality of Service and Clients’ Level of Customer Satisfaction on the Health and Fitness Center’s
Services
Quality of Service Pearson r p-value Interpretation
Reliability 0.976**
High Correlation
0.000 Significant
Responsiveness 0.971**
High Correlation
0.000 Significant
Assurance 0.971**
High Correlation
0.000 Significant
Empathy 0.978**
High Correlation
0.000 Significant
Tangibles 0.981**
High Correlation
0.000 Significant
** Significant @ 0.01
As presented in Table 10, the health and fitness center’s quality of service significantly correlated with the level of
customer satisfaction on the services shown by the Pearson r values of 0.976 for reliability, 0.971 for responsiveness, 0.971 for
assurance, 0.978 for empathy, and 0.981 for tangibles and their corresponding computed p-values of 0.000 which were all less

Service Quality, Customer Satisfaction, Consumer Behavior and Business Performance of Health and Fitness Center in Kuwait, UAE
IJMRA, Volume 5 Issue 05 May 2022 www.ijmra.in Page 1066
than the 0.01 level of significance. This means that the more the customers or clients agree or attest to the quality of service of
Oxygen Gym, the higher is their level of customer satisfaction on its various services.
The study’s finding on the significant correlation between the health and fitness center’s quality of service level of
customer satisfaction on its services is affirmed by Pradeep et al. (2020), who analyzed the factors in customers’ perception of
service quality and its relation to customer satisfaction and retention. It was revealed in his study that although a high service
quality index score and customer satisfaction indicated the drive for customer retention, the steady-state matrix apparent in the
second year in a Markov analysis suggests that firms focus on improvising their marketing mix to increase customers’ spending
time in fitness centers and maximize customers’ satisfaction with the main purpose of their visit, their own wellbeing and stress
reduction.
Table 11. Relationship between Clients’ Level of Customer Satisfaction and Consumer Behavior towards the Health and Fitness
Center’s Services
As indicated in Table 11, there was a significant relationship between level of customer satisfaction and consumer
behavior towards the health and fitness center’s services as indicated by the Pearson r of 0.984 and the computed p-value of
0.000 which was less than 0.01 level of significance. This means that customer behavior was dependent on their level of
satisfaction on the center’s services.
Table 12. Relationship between Quality of Service and Business Performance (Loyalty). of the Health and Fitness Center
As reflected in Table 12, the quality of service of the health and fitness center significantly correlated with business
performance particularly with its indicator customer loyalty as shown by the Pearson r values of 0.961 for reliability, 0.958 for
responsiveness, 0.958 for assurance, 0.962 for empathy, and 0.969 for tangibles and their corresponding computed p-values of
0.000 which were all less than 0.01 level of significance. This implies that the more the customers agree or attest to the quality of
service of Oxygen Gym by patronizing its services, the better is the business performance of the gym in terms of customer loyalty.
Pearson r p-value Interpretation
Clients’ Level of Customer
Satisfaction and Consumer Behavior
towards the Health and Fitness
Center’s Services
0.984**
High Correlation
0.000 Significant
** Significant @ 0.01
Quality of Service Pearson r p-value Interpretation
Reliability 0.961**
High Correlation
0.000 Significant
Responsiveness 0.958**
High Correlation
0.000 Significant
Assurance 0.958**
High Correlation
0.000 Significant
Empathy 0.962**
High Correlation
0.000 Significant
Tangibles 0.969**
High Correlation
0.000 Significant
** Significant @ 0.01
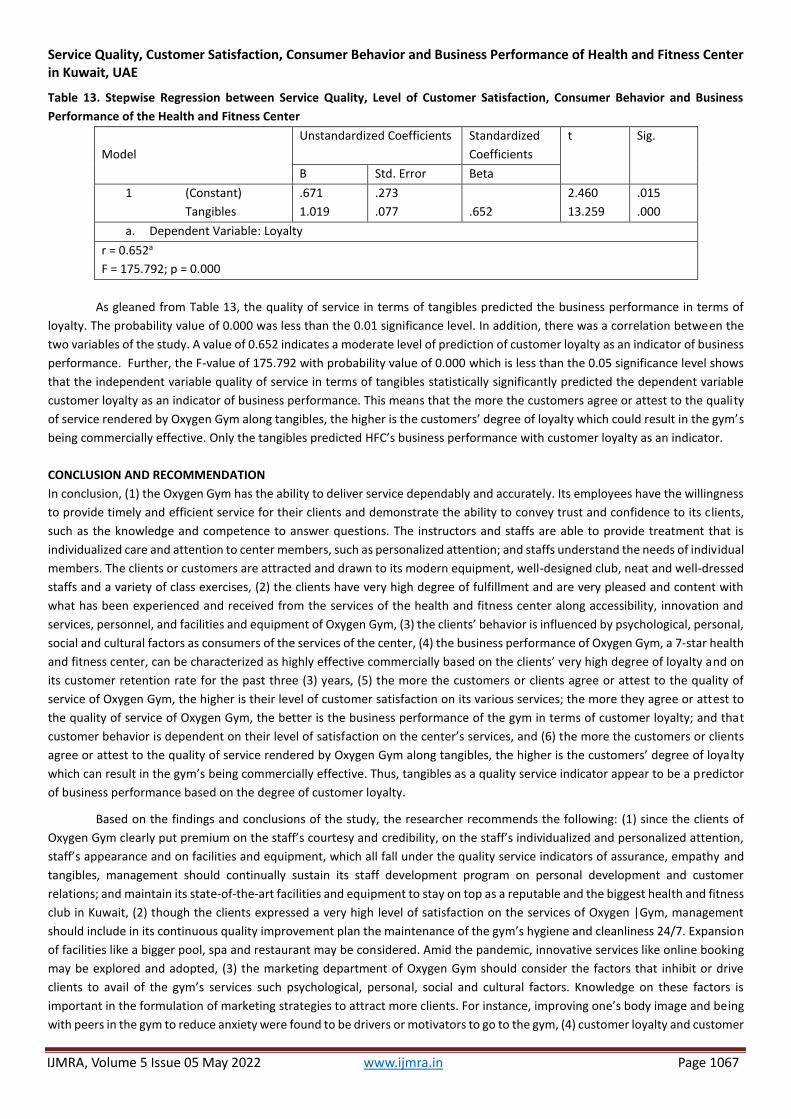
Service Quality, Customer Satisfaction, Consumer Behavior and Business Performance of Health and Fitness Center in Kuwait, UAE
IJMRA, Volume 5 Issue 05 May 2022 www.ijmra.in Page 1067
Table 13. Stepwise Regression between Service Quality, Level of Customer Satisfaction, Consumer Behavior and Business
Performance of the Health and Fitness Center
Model
Unstandardized Coefficients Standardized
Coefficients
t Sig.
B Std. Error Beta
1 (Constant)
Tangibles
.671
1.019
.273
.077
.652
2.460
13.259
.015
.000
a. Dependent Variable: Loyalty
r = 0.652a
F = 175.792; p = 0.000
As gleaned from Table 13, the quality of service in terms of tangibles predicted the business performance in terms of
loyalty. The probability value of 0.000 was less than the 0.01 significance level. In addition, there was a correlation between the
two variables of the study. A value of 0.652 indicates a moderate level of prediction of customer loyalty as an indicator of business
performance. Further, the F-value of 175.792 with probability value of 0.000 which is less than the 0.05 significance level shows
that the independent variable quality of service in terms of tangibles statistically significantly predicted the dependent variable
customer loyalty as an indicator of business performance. This means that the more the customers agree or attest to the quality
of service rendered by Oxygen Gym along tangibles, the higher is the customers’ degree of loyalty which could result in the gym’s
being commercially effective. Only the tangibles predicted HFC’s business performance with customer loyalty as an indicator.
CONCLUSION AND RECOMMENDATION
In conclusion, (1) the Oxygen Gym has the ability to deliver service dependably and accurately. Its employees have the willingness
to provide timely and efficient service for their clients and demonstrate the ability to convey trust and confidence to its clients,
such as the knowledge and competence to answer questions. The instructors and staffs are able to provide treatment that is
individualized care and attention to center members, such as personalized attention; and staffs understand the needs of individual
members. The clients or customers are attracted and drawn to its modern equipment, well-designed club, neat and well-dressed
staffs and a variety of class exercises, (2) the clients have very high degree of fulfillment and are very pleased and content with
what has been experienced and received from the services of the health and fitness center along accessibility, innovation and
services, personnel, and facilities and equipment of Oxygen Gym, (3) the clients’ behavior is influenced by psychological, personal,
social and cultural factors as consumers of the services of the center, (4) the business performance of Oxygen Gym, a 7-star health
and fitness center, can be characterized as highly effective commercially based on the clients’ very high degree of loyalty and on
its customer retention rate for the past three (3) years, (5) the more the customers or clients agree or attest to the quality of
service of Oxygen Gym, the higher is their level of customer satisfaction on its various services; the more they agree or attest to
the quality of service of Oxygen Gym, the better is the business performance of the gym in terms of customer loyalty; and that
customer behavior is dependent on their level of satisfaction on the center’s services, and (6) the more the customers or clients
agree or attest to the quality of service rendered by Oxygen Gym along tangibles, the higher is the customers’ degree of loya lty
which can result in the gym’s being commercially effective. Thus, tangibles as a quality service indicator appear to be a predictor
of business performance based on the degree of customer loyalty.
Based on the findings and conclusions of the study, the researcher recommends the following: (1) since the clients of
Oxygen Gym clearly put premium on the staff’s courtesy and credibility, on the staff’s individualized and personalized attention,
staff’s appearance and on facilities and equipment, which all fall under the quality service indicators of assurance, empathy and
tangibles, management should continually sustain its staff development program on personal development and customer
relations; and maintain its state-of-the-art facilities and equipment to stay on top as a reputable and the biggest health and fitness
club in Kuwait, (2) though the clients expressed a very high level of satisfaction on the services of Oxygen |Gym, management
should include in its continuous quality improvement plan the maintenance of the gym’s hygiene and cleanliness 24/7. Expansion
of facilities like a bigger pool, spa and restaurant may be considered. Amid the pandemic, innovative services like online booking
may be explored and adopted, (3) the marketing department of Oxygen Gym should consider the factors that inhibit or drive
clients to avail of the gym’s services such psychological, personal, social and cultural factors. Knowledge on these factors is
important in the formulation of marketing strategies to attract more clients. For instance, improving one’s body image and being
with peers in the gym to reduce anxiety were found to be drivers or motivators to go to the gym, (4) customer loyalty and customer

Service Quality, Customer Satisfaction, Consumer Behavior and Business Performance of Health and Fitness Center in Kuwait, UAE
IJMRA, Volume 5 Issue 05 May 2022 www.ijmra.in Page 1068
retention rate are two qualitative measures used in determining business performance. Such was the case for Oxygen Gym which
was found to be a commercially effective. In the future, Oxygen Gym, if possible, may look into its financial statements to
quantitatively measure business success. A combination of both qualitative and quantitative may ideally be considered, (5) since
in the case of Oxygen Gym, customer satisfaction and business performance were very highly associated with the quality of
services, the management and its personnel should revisit the indicators of quality services and the gym’s services such facilities
and equipment, innovation and services, personnel, and accessibility and identify areas for improvement like the expansion of
facilities (ex. upgrading of diet center), offering innovative services (ex. downloadable online programs), and looking into the
accuracy of information provided by instructors, etc., and (6) tangibles among other service quality indicators singly predicted
HFC’s business performance with customer loyalty as an indicator. Since the Oxygen Gym is a 7-star health and fitness center with
rich Kuwaiti clients, they put more premium on the design of the gym, physical facilities, modern equipment, and a variety of class
exercises. Thus, it behooves management to regularly maintain a state-of-the-art gym by continuously expanding and re-designing
its facilities, acquiring new equipment and innovating its services tapping online platforms to be able to retain its customers, stay
competitive, and discourage the entry of new competitors.
REFERENCES
1) Al-Gharaibah, O.B (2020). Customer retention in five-star hotels in Jordan: The mediating role of hotel perceived value.
Management Science Letters
2) Alves, G. R. (2014). Measuring Customer Satisfaction in Services Industry. (Master’s Thesis). Católica-Lisbon School of
Business and Economics.
3) Aristayasa, I. P., Paramita, N. L. P. S. P., Suciptawati, N. L. P. (2019). Customer satisfaction analysis based on service
quality: case of local credit provider in Bali. Journal of Physics: Conference Series. Retrieved from
https://iopscience.iop.org/article/10.1088/1742-6596/1321/2/022055/pdf.
4) Balinado, J. R., Prasetyo, Y. T., Young, M. N., Persada, S. F., Miraja, B. A., Perwira Redi, A. A. N. The Effect of Service
Quality on Customer Satisfaction in an Automotive After-Sales Service. J. Open Innov, 7, 116. https://doi.org/
10.3390/joitmc7020116.
5) Bamberger, B., Homburg, C., & Wielgos, D. M. (2021). EXPRESS: Wage Inequality: Its Impact on Customer Satisfaction
and Firm Performance. Journal of Marketing. http://dx.doi.org/10.1177/00222429211026655.
6) Borgave, S. & Koranne, S. (2016). Service Quality Management. Retrieved from https://www.researchgate.net.
7) Chandra, S., Chandra, T., Ng, M., & Priyono (2018). The Effect of Service Quality on Student Satisfaction and Student
Loyalty: An Empirical Study. Journal of Social Studies Education Research. 9 (3), 109 – 131.
8) Elestwani, S. F. (2015). Transfer Effect of Trust, Satisfaction and Loyalty Link: Building Loyalty Relationships through an
E-Contact Center. (Master’s Thesis). University of Houston. Retrieved from https://uh-
ir.tdl.org/bitstream/handle/10657/2979/ELESTWANI-THESIS-2015.pdf?sequence=1&isAllowed=y.
9) Elestwani, S. F. (2018). The Effect of Postsecondary Education and Previous Work Experience on Clinical Competence: A
Quantitative Analysis of Neurodiagnostic Technologists’ Credentialing Examinations. (Doctoral Dissertation). University
of Houston.
10) Farooq, M.S., Salam, M., Fayolle, A., Jaafar, N., & Ayupp, K. (2018). Impact of service quality on customer satisfaction in
Malaysia airlines: A PLS-SEM Approach. Journal of Air Transport Management. 67
11) Kestenbaum, R. (2019). The Biggest Trends In Gyms And The Fitness Industry.
https://www.forbes.com/sites/richardkestenbaum/2019/11/20/the-biggest-trends-in-gyms-and-the-fitness-
industry/?sh=5ea93da7465d
12) Klokkenga, B. (2020). How to measure the 5 dimensions of service quality.
https://www.getfeedback.com/resources/cx/how-to-measure-the-5-dimensions-of-service--quality/. Accessed 07 April
2022.
13) Liu, L., Cui T., & Ye, Y. (2021). Encouraging Tourist Citizenship Behavior through Resource Uniqueness and Service
Quality: The Mediating Role of Emotions. Journal of Vacation Marketing.
14) Macon, R. W. (2020). Customer Retention Strategies in the Fitness Industry. (Doctoral Dissertation). Walden University.
Retrieved from https://scholarworks.waldenu.edu/cgi/viewcontent.cgi?article=9350&context=dissertations
15) Maria, F. F., Nathan, R. J., Thoppan, J. J., & Victor, V. (2018). Factors Influencing Consumer Behavior and Prospective
Purchase Decisions in a Dynamic Pricing Environment—An Exploratory Factor Analysis Approach. Social Sciences. 7, 2 –
14.

Service Quality, Customer Satisfaction, Consumer Behavior and Business Performance of Health and Fitness Center in Kuwait, UAE
IJMRA, Volume 5 Issue 05 May 2022 www.ijmra.in Page 1069
16) Nelson, S. (2019). Why The Wellness Business Is Booming (And How To Succeed In The Industry).
https://www.forbes.com/sites/forbesbusinessdevelopmentcouncil/2019/10/14/why-the-wellness-business-is-
booming-and-how-to-succeed-in-the industry/?sh=6577318841aa
17) Nurmaliki, S. & Riyanto, S. (2020). The Influence of Consumer Behavior, Competitive Advantages on the Performance of
MSMEs during Covid-19. International Journal of Innovative Science and Research Technology.
18) Omar Ali, S. R. & Abd Hakim Amir, S. N. (2020). Service Quality and Customer Satisfaction: Experience of Customers in
Postal Service. Jurnal Intelek.
19) Othman, B. et al. (2020). Effect of service quality on service value and customer retention for clothing store brands
in China. Tekstilec. Vol 63 (4).
20) Pradeep, S., Vadakepat, V & Rajasenan, D. (2020). The effect of service quality on customer satisfaction in fitness firms.
Management Science Letters , 10(9), 2011-2020.
21) Raither, P. (2018). The Impact of Consumers’ Actual Behaviour on Social Media on their Purchase Behaviour. (Master’s
Thesis). Dublin Business School. Retrieved from
https://esource.dbs.ie/bitstream/handle/10788/3570/msc_raithel_p_2018.pdf?sequence=1&isAllowed=y.
22) Rego, Lopo L.; Morgan, Neil A. and Fornell, Claes (2013). Reexamining the Market Share – Customer Satisfaction
Relationship. Journal of Marketing, 77(5): 1-20
23) Stasha, S. (2021). 19+ Statistics and Facts about the Fitness Industry (2021).
https://policyadvice.net/insurance/insights/fitness-industry-statistics/
24) Tahanisaz, S. & Shokuhyar, S. (2020). Evaluation of Passenger Satisfaction with Service Quality: A Consecutive Method
Applied to the Airline Industry. J. Air Transp. Manag. 83, 101764.
25) Taysan, N. & Duran, C. (2021). The antecedents of customer loyalty. Contemporary Issues with Multidisciplinary
Perspectives on Social Science. DOI: 10.1177/109467059914007
26) Uğurlu, F.M. (2018). Satisfaction Levels of Individuals Who Go to Fitness Centers. Universal Journal of Educational
Research 6(10): 2266-2270, 2018 http://www.hrpub.org DOI: 10.13189/ujer.2018.061025
There is an Open Access article, distributed under the term of the Creative Commons Attribution – Non Commercial 4.0 International (CC BY-NC 4.0) (https://creativecommons.org/licenses/by-nc/4.0/), which permits remixing, adapting and building upon the work for non-commercial use, provided the original work is properly cited.

INTERNATIONAL JOURNAL OF MULTIDISCIPLINARY RESEARCH AND ANALYSIS
ISSN(print): 2643-9840, ISSN(online): 2643-9875
Volume 05 Issue 05 May 2022
DOI: 10.47191/ijmra/v5-i5-24, Impact Factor: 6.261
Page No. 1070-1076
IJMRA, Volume 5 Issue 05 May 2022 www.ijmra.in Page 1070
Evaluation of Teaching Specialty in Head and Neck Surgery in the
Curriculum of Medical Courses in Fortaleza, Ceará
Larissa Albuquerque Oliveira1, Monalisa Emillene Nunes Ribeiro2, Lara Hannyella Gouveia Duarte3,
Lauhelia Mauriz Marques4, Jonatas Catunda Freitas5
ABSTRACT:
Introduction: Head and neck cancer is highly prevalent, but most tumors are identified late, compromising treatment, prognosis
and patient survival. That is why it is important to include the Head and Neck Surgery discipline in the curriculum of the medicine
course, so that trained professionals are able and safe to diagnose these conditions early, thus improving teaching in this area.
This study was to analyze the teaching of head and neck surgery in medical schools in the city of Fortaleza, Ceará.
Development: This is an observational cross-sectional study in which a structured questionnaire was adopted to the coordinators
of each college, in which the institution, curriculum and internship were analyzed. It was observed that only one of the four
institutions has a structured HNS service. Only 6% of the total number of interns who completed the medical course attended the
HNS during the internship in 2019.
Conclusion: It can be observed that there are gaps in the teaching of the specialty of HNS, from the base of academic training, to
the surgical services, showing little emphasis aimed at that specialty.
KEYWORS: Head and neck surgery. Cancer. Medical education. Diagnosis.
1. INTRODUCTION
The specialty of head and neck surgerys treat oncologic and non – oncologic conditions that develop in the head , scalp, face ,
paranasal sinuses, nose, mouth, pahrynx, thyroid, larynx, parathyroid and lateral structures of the neck and esophagus. Head and
neck cancer, in general, is among the sixth most common type of cancer in the world, behind only breast, colorectal, lung, prostate
and stomach cancers. In addition, in 2020, 931,931 new cases of the disease and 467,125 deaths were estimated worldwide. In
Brazil, the scenario is also worrying. 41,000 new cases are registered per year, however, diagnosis and late treatment are still
among the main obstacles to facing the neoplasm, which in 2019 affected more than 13,000 Brazilians. 1
The largest volume of treatment by the head and neck surgeon is cancer in this region. However, most tumors are identified late,
compromising the treatment, prognosis and survival of patients2 . Delays are often due to the lack of knowledge about these
conditions, both by patients and by health professionals - they should instruct patients to look for doctors in a preventive way -
and by the barriers of the health system, leading to lack of speed for diagnosis and initiation of treatment3,9. That is why it is
important to include the Head and Neck Surgery discipline in the curriculum of the Medicine course, so that trained professionals
are able and safe to diagnose head and neck disorders early, thus improving teaching in this area³. General practitioners need to
have at least basic knowledge about diseases that affect this area, such as cervical nodules, parathyroid diseases, thyroid disorders,
neoplasms of the mouth, larynx and oropharynx, as well as knowing how to proceed with clinical and endoscopic examinations,
tracheostomies and handle emergencies in this area. This is so relevant and important, since head and neck cancer is highly
prevalent, as an example, we can mention cancer of the oral cavity, which is the fifth most prevalent cancer in the Brazilian
population. There are an estimated 11,180 new cases of the disease in men and 4,010 in women for each year of the triennium
2020-2022³. Another point to be highlighted is that neoplasms related to this area, such as mouth and oropharynx cancer, have
high mortality and low survival rates, especially if discovered late, requiring early approaches in such situations. Another example
to be mentioned is thyroid cancer, in which it is estimated that every three years 2020/2022, 13,870 new cases of the neoplasm
are diagnosed, with an increase in mortality of 0.6% per year. Therefore, it is important that general practitioners leave with good
training and knowledge about the area, in order to know how to diagnose these conditions early9.

Evaluation of Teaching Specialty in Head and Neck Surgery in the Curriculum of Medical Courses in Fortaleza, Ceará
IJMRA, Volume 5 Issue 05 May 2022 www.ijmra.in Page 1071
Thus, the study proposed to analyze the teaching of head and neck surgery in medical schools in the city of Fortaleza, Ceará.
2. METHODOLOGY
This is an observational, qualitative and analytical cross-sectional study using a structured questionnaire (Appendix A) to the
coordinators of Medicine courses. The sample was selected from the census type, and all faculties of medicine located in the city
of Fortaleza-Ce were approached, from April 2020 to October 2020. The four faculties in Fortaleza were approached: Centro
Universitário Christus (Unichristus); University of Fortaleza (Unifor); Federal University of Ceará (UFC); Ceará State University
(UECE). Data were collected as follows: the researchers went to each of the faculties, took the questionnaire, met with the
coordinator responsible for the medical course, and the questionnaire was answered by the coordinator, according to with the
specific curriculum of each university. The present study had as inclusion criteria the questionnaires duly answered by the
coordinators and /or responsible for the curriculum of each institution, and faculties that refused to participate in the research
were excluded. The curricula of each medical course were analyzed, seeking to know if there is an exclusive module for the head
and neck specialty in the basic cycle, the workload, if there are theoretical classes and experience and if the professor responsible
for the discipline is an expert in the field, invited or hired. If the subject offered is optional, the percentage of students taking it
was analyzed. If there was not an exclusive specialty module, it was investigated in which modules the classes on oral cancer,
thyroid and parathyroid cancer, skin cancer, cervical lymph node enlargement, salivary gland tumors and congenital diseases of
the neck are included; as well as the qualification of the teachers who teach these classes. Data were also collected on the
experience of the head and neck discipline at the boarding school. An analysis was made if the faculties offer the student the
possibility of going through the head and neck, or if only when the student is interested in the specialty.
Specific data for each of the colleges, such as type, whether public or private, year of foundation of the medical course, year of
foundation of the college, undergraduate and internship workload were collected and recorded in a spreadsheet (Microsoft,
Seattle, USA). The sample of this study consisted of a structured questionnaire and characterized in absolute (n) and relative (%)
terms. Statistical calculations were performed using the SPSS 20 program (SPSS INC., Chicago, IL, USA), and the significance level
of 5% was adopted.
3 .RESULTS
3.1 - Profile of the institutions studied
As a source of information, four medical teaching institutions, two public and two private, were analyzed. Both have similar
undergraduate and internship hours. (Table 1)
Table 1. Characteristics of universities.
Type No. of Formed Classes
Founded in Graduation workload Boarding school hours
Institution A Private 18 2006 8.532 3.960
Institution B Private 17 2006 8.042 4.014
Institution C Public 12 2002 8.428 3.840
Institution D Public 115 1948 8.296 3.840
Regarding the specialty of Head and Neck Surgery, a survey was carried out about the existence of a structured service on this
area in the preceptorship, the presence of a specialist, the option to offer the discipline during the internship period, in addition
to observing if there is a mandatory module in the analyzed institutions, see (Graphs 1, 2 and 3).
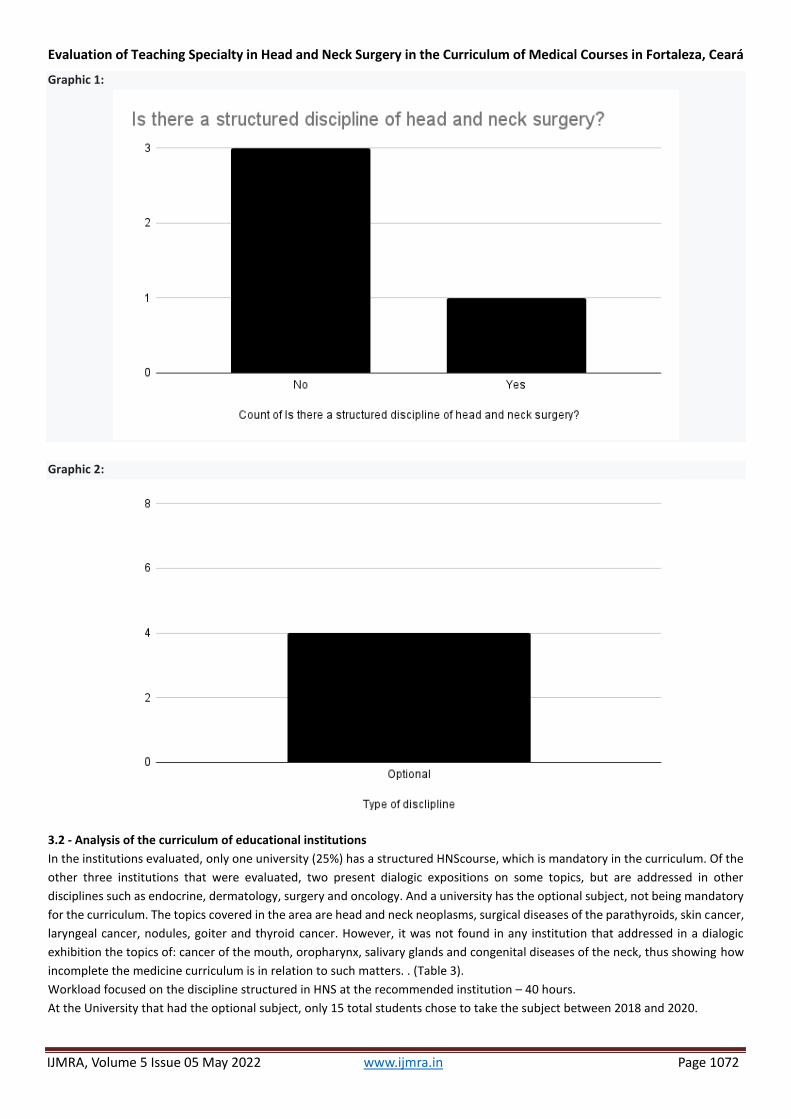
Evaluation of Teaching Specialty in Head and Neck Surgery in the Curriculum of Medical Courses in Fortaleza, Ceará
IJMRA, Volume 5 Issue 05 May 2022 www.ijmra.in Page 1072
Graphic 1:
Graphic 2:
3.2 - Analysis of the curriculum of educational institutions
In the institutions evaluated, only one university (25%) has a structured HNScourse, which is mandatory in the curriculum. Of the
other three institutions that were evaluated, two present dialogic expositions on some topics, but are addressed in other
disciplines such as endocrine, dermatology, surgery and oncology. And a university has the optional subject, not being mandatory
for the curriculum. The topics covered in the area are head and neck neoplasms, surgical diseases of the parathyroids, skin cancer,
laryngeal cancer, nodules, goiter and thyroid cancer. However, it was not found in any institution that addressed in a dialogic
exhibition the topics of: cancer of the mouth, oropharynx, salivary glands and congenital diseases of the neck, thus showing how
incomplete the medicine curriculum is in relation to such matters. . (Table 3).
Workload focused on the discipline structured in HNS at the recommended institution – 40 hours.
At the University that had the optional subject, only 15 total students chose to take the subject between 2018 and 2020.

Evaluation of Teaching Specialty in Head and Neck Surgery in the Curriculum of Medical Courses in Fortaleza, Ceará
IJMRA, Volume 5 Issue 05 May 2022 www.ijmra.in Page 1073
In none of the universities evaluated, there is no practical experience or internship focused on HNS, the practical part being seen
in the internship, however, only for students who decide to run in this area.
Regarding professors, in two institutions these topics are given by HNS professionals, and in the other two, such topics are
addressed by professionals from other areas such as endocrine, dermatogist and oncologist. And in none of the institutions is
there a preceptor specialist in HNS in the internship.
Table 3 - Classes offered by related undergraduate institutions: with head and neck themes
Classes: Number of institutions offering:
Head and neck tumors
75%
Surgical skin cancer parathyroid diseases
75%
Laryngeal cancer
50%
Nodules, goiter and thyroid cancer
100%
Cervical lymph node enlargement and differential diagnosis of cervical masses
25%
Cancer of the mouth, oropharynx, salivary gland tumors
0
Congenital neck diseases
0
3.3 - Analysis of the internship system
According to collected data, in 2019 the number of interns who attended the specialty of Head and Neck Surgery was a total of 27
students, corresponding to 6% of the total of interns who completed the medical course in that same year.
Table 1 - Internship in head and neck surgery
Total Graduates in 2019
452
Total seats available for elective in CCP
56 (12,38%)
Interns who ran in CCP
27 (6%)
Table 2 - Annual number of interns by specialty in 2019 at a tertiary health philanthropic institution in Fortaleza - Ce
Number of Interns at the Philanthropic Institution
Internal in the surgical clinic
Interns who have gone through the
head and neck surgery
207
8
Internal in the medical clinic
245
Total: 452
The curriculum of the medical faculties of Fortaleza still has gaps in the teaching of this specialty, many relevant topics, such as
mouth and oropharynx cancer, congenital neoplasms of the neck and salivary gland cancer are not addressed in the institutions,
generating a great lack of knowledge about pathologies that have high prevalence of learning, because through them, future

Evaluation of Teaching Specialty in Head and Neck Surgery in the Curriculum of Medical Courses in Fortaleza, Ceará
IJMRA, Volume 5 Issue 05 May 2022 www.ijmra.in Page 1074
professionals learn how to proceed with patients with such diseases, knowing how to perform a physical examination, diagnose
and manage them, do not occur and are not part of the curriculum, thus culminating in a serious deficiency in the knowledge of
future professionals. And in relation to the internship, few students are interested in working in the specialty, precisely because
of this lack of knowledge, and mortality. In relation to experiences, practices and internships, which are important ways, then,
many professionals leave college, really without having the general knowledge of the specialty, causing harm to the health area,
since many patients cannot even have the correct diagnosis. of the pathology, and consequently, there is an increase in mortality
due to these conditions. Therefore, cases are increasing along with morbidity and mortality.
4. DISCUSSION
A large portion of the population is unaware of the specialty of head and neck surgery. Furthermore, several doctors share this
lack of knowledge. These, in addition to knowing little about these highly prevalent diseases such as thyroid nodules, mouth and
pharyngeal cancer, also do not know which specialist to refer the patient afflicted by these conditions4. This is due to the limited
offer of the subject of head and neck surgery at graduation, which can stigmatize and make the specialty less attractive for the
vast majority of students. to search for it on their own5.
In addition, in many medical institutions, despite the existence of a specialty group, and some dialogued presentations that are
held within the curriculum, the contents are taught in a divided and separate way, taking place in disciplines such as general
surgery, otolaryngology, oncology , dermatology, endocrinology, among others, with, in most cases, not having a specific module
focused on this specialty, or even that these classes are taught by the professional in the area6.
According to BONFANTE et al1, the discipline of head and neck surgery is a medical specialty with little emphasis on graduation,
in most university education institutions, with only a structured service for the discipline of Head Surgery. and Neck in only one of
the studied institutions, in addition to not having a specialist tutor in this area in three of the analyzed institutions, thus
emphasizing the existing gap in the base of the medical student's academic education.
This is due to the fact that this area covers pathologies that are also linked to other areas such as oncology, dermatology,
endocrinology, otolaryngology, general surgery, so these subjects end up being addressed in these disciplines, which means that
there is no exclusive discipline for this area in the medical curriculum. Another reason would be the low number of professionals
in this area, precisely because of this lack of knowledge, since other professionals such as a general surgeon can perform the same
procedures as a head and neck surgeon. In addition, when patients are diagnosed with such pathologies, they usually end up being
referred to other specialists in the medical field, mainly oncology and general surgeons10.
The two medical specialties most closely related to HNS are oncology and general surgery. Many general practitioners, when faced
with pathologies that involve such areas, usually refer them to one of these two areas, precisely because in the curriculum, these
areas had a specific discipline, with experiences, which makes these professionals have, at least, general knowledge about these
specialties. In addition, within the medical residency program, residents of these areas are trained to perform the surgeries and
procedures that should be performed by head and neck surgeons, thus reducing the demand for their own specialty. 9,10
It can be observed that of the four institutions analyzed in our study regarding the content of the curriculum, none of them
specifically addresses, in dialogued exposure, classes on mouth cancer, oropharyngeal cancer, salivary gland cancer and congenital
neck diseases, being pathologies of high prevalence and mortality. As an example, we can mention mouth cancer, which is closely
related to alcoholism, smoking, poor oral hygiene, malnutrition and HPV, which has contributed to the increase in its incidence
and severity, and due to the fact that it is not addressed properly during the course. in college, many general practitioners do not
usually examine the mouth of their patients, who sometimes may already have a small lesion that goes unnoticed at the time of
the consultation. When the severity of the injury increases, where it begins to affect other areas of this region, that is when the
patient seeks the doctor, and it is precisely during this period that the diagnosis and treatment may or may not be done correctly.
But the stage of the neoplasm is already advanced, and the chances of cure decrease, so the mortality from this disease is still so
high, due to this late approach. 9,10
Thus, many medical schools lack a specific module in this area. Thus, it is important that specialists in the field linked to Universities
make their colleagues recognize the importance of a course with head and neck surgery during graduation7. Even with a restricted
workload, not breaking down the specialty contents into other disciplines should promote better fixation by the students and
enable better future management of these suffering patients. The proportion of services restricted to cancer hospitals, without a
university link, with an emphasis on graduate Latu Sensu, that is, medical residency, is not negligible8.
And yet, after graduation, only those who undergo general surgery will be required to intern in head and neck surgery. A large
part of this problem stems from a mistaken interpretation of the Curriculum Guidelines of the Undergraduate Course in Medicine,
which recommends generalist training. The physician must have a good general education during his graduation, but this does not

Evaluation of Teaching Specialty in Head and Neck Surgery in the Curriculum of Medical Courses in Fortaleza, Ceará
IJMRA, Volume 5 Issue 05 May 2022 www.ijmra.in Page 1075
mean that he should only know general contents. During graduation, they must have contact with several specialties and learn
from specialists the most prevalent conditions in that area. Second, SBCCP6, no one aims to train graduate specialists, but teaching
the contents of head and neck surgery will certainly contribute to meeting the requirements of the Guidelines.
A relevant issue in our study is that 100% of the faculties that were analyzed in this work, none of them present a subject in this
area as mandatory, only one has as an optional activity, that is, several important topics are not properly covered in the curriculum,
such as cancer mouth, oropharynx and salivary glands, which further corroborates the precarious medical education in relation to
this specialty.
Regarding the analysis carried out, specifically, in a tertiary health philanthropic institution in Fortaleza, Ceará, which receives
students in the internship of a private educational institution among the four analyzed, our study observed that, in 2019, 207
students from the internships took place in the surgical clinic/general surgery, only eight of these were in HNS, which is equivalent
to that only 4% of the trainees took part in this area in the internship, specifically, in that institution. According to the information
collected, the students were awarded the rotation in the HNS specialty through drawings.
In addition, in 2019, the number of interns who studied in the specialty of Head and Neck Surgery was a total of 27 students,
corresponding to 6% of the total interns who completed the medical course in that same year, thus showing, the low percentage
of rotation in this specialty. The total number of places made available in Fortaleza by health institutions that receive students in
the internship corresponded to the number of 56 places and the calculated probability of the intern running in head and neck
surgery, according to the places made available in 2019, was 12 .32%.
In other countries, such as the USA, it is possible to learn about all medical areas, including HNS, since there are specific modules
for each area, experiences and practices, thus, a complete education, in which general practitioners know all areas of medicine,
knowing how to act and proceed in each of them. Therefore, the prevalence of these conditions related to this area is low. 10
Finally, it is necessary for the faculties of medicine to review the medical curriculum, and try to include this area of HNS as a form
of compulsory subject, with experiences, internships and practices, addressing all relevant topics in this area, in addition, teaching
also to future professionals to know how to do an anamnesis and physical examination directed to this topic in order to, in the
future, know how to handle and proceed in the face of situations involving this area. And in relation to the internship, it would be
interesting to put preceptors in this area to encourage students to rotate and experience this specialty better in practice.
5. CONCLUSION
With this study, it is possible to observe the existence of gaps in the teaching of the specialty of Head and Neck Surgery, from the
base of academic training, to the surgery services, which, for the most part, do not have a structured service for this area,
evidencing the little emphasis given to this specialty.
In addition, the low percentage of HNS vacancies offered by the surgical services was observed, as well as the low adherence of
students to the HNS rotation, which corresponded to 6% of the interns graduated in the same period, which can make the specialty
more unknown and less attractive for the vast majority of students, which directly reflects the lack of training of general
practitioners in knowing how to diagnose and refer cases of head and neck cancer, a highly prevalent condition. Thus, we suggest
new studies that address the internship population more specifically, in addition to expanding the study to other medical
institutions in the state of Ceará and even across the country.
REFERENCES
1) Bonfante GM. Five-year survival and factors associated with oral cancer in patients undergoing outpatient cancer
treatment by the Unified Health System, Brazil. Public Health Cad. 2014;30(5):983–97.
2) Le Campion NA. Characterization of delayed diagnosis of oral and oropharyngeal cancer in two reference centers. Cad
health collect. 2016;24(2):178–84.
3) Ligier K, Belot A, Launoy G, Velten M, Bossard N, Iwaz J, Righini CA, Delafosse P, Guizard AV. Descriptive epidemiology of
upper aerodigestive tract cancers in France: incidence over 1980-2005 and projection to 2010. Oral Oncol.
2011;47(4):302–307.
4) MoroJU .Oral and oropharyngeal cancer: epidemiology and survival analysis. Einstein (São Paulo). 2018;16(2): 1-5.
5) Oliveira JL,Souza SV. Experience report in the monitoring activity developed in the discipline of basic stage of observation
of development: a text written with four hands. Academic Cad. . 2012;4(1):35–46.
6) Rev.Bras.C.C.P/S.B.C.P. 2009; 23(3) – revista completa
7) Warnakulasurya SA. Global epidemiology of oral and oropharyngeal câncer. Oral Oncol. 2009;45:309–16.

Evaluation of Teaching Specialty in Head and Neck Surgery in the Curriculum of Medical Courses in Fortaleza, Ceará
IJMRA, Volume 5 Issue 05 May 2022 www.ijmra.in Page 1076
8) World Heath Organization (WHO). Policies and managerial guidelines for national cancer control programs. Rev Panam
Salud Publ. 2002;12(5):366-70.
9) AMERICAN CANCER SOCIETY. Cancer facts & figures 2019. Atlanta: American Cancer Society, 2019.
10) INSTITUTO NACIONAL DE CÂNCER JOSÉ ALENCAR GOMES DA SILVA. Tipos de câncer. Rio de Janeiro: INCA, 2019.
Disponível em: https://www.inca.gov.br/tipos-de-cancer.
There is an Open Access article, distributed under the term of the Creative Commons Attribution – Non Commercial 4.0 International (CC BY-NC 4.0) (https://creativecommons.org/licenses/by-nc/4.0/), which permits remixing, adapting and building upon the work for non-commercial use, provided the original work is properly cited.

INTERNATIONAL JOURNAL OF MULTIDISCIPLINARY RESEARCH AND ANALYSIS
ISSN(print): 2643-9840, ISSN(online): 2643-9875
Volume 05 Issue 05 May 2022
DOI: 10.47191/ijmra/v5-i5-25, Impact Factor: 6.261
Page No. 1077-1083
IJMRA, Volume 5 Issue 05 May 2022 www.ijmra.in Page 1077
Role of NITI Aayog in Relation to Indian Public Policies: A Study
Amritanshu Pandey1, S.P. Shukla2 1PhD Research Scholar, Department of Political Science, Govt. T.R.S. College, Rewa, MP, India 2Professor & Head, Department of Political Science, Govt. T.R.S. College, Rewa, MP, India
ABSTRACT: “NITI Aayog” (National Institution for Transforming India Aayog) was introduced on the 1st January 2015, as the
replacement for ‘Planning Commission’. NITI Aayog overviews the monitoring and adoption of ‘Sustainable Development Goals’
(SDGs) and promote competitive and cooperative federalism among the States and Government undertakings. This is a
Government of India policy ‘think tank’ that aims ‘to foster involvement and participation in the economic policy making process
by the State Governments of India’. The Prime Minister serves as the Ex-officio Chairman of NITI Aayog. The NITI Aayog may
provide a critical directional and strategic input in regard to developmental processes of India. Indeed, it focuses on the
cooperative federalism of country. The centre-to-state one-way flow of policy, the hallmark of the Planning Commission era, has
been replaced by a genuine and continuing partnership with and among the Indian States. “Public Policy” is a primarily an
instrument to guide social actions in accordance with certain predetermined goals. Thus, the public policy is a ‘directional means
seeking to fulfil ideology driven aims which are usually conceived out of a dialectical interaction between the governments and
governed’. In view of this, the present research was carried out to study the ‘Role of NITI Aayog with regard to Public Policies of
India.
KEYWORDS: India, NITI Aayog, Public Policies, and Role and Functions.
INTRODUCTION
Public policy is also ethics driven. “Public Policy” is a ‘device employed to meaningfully address societal problems’. The nature of
public policy is contingent on the prevalent socio-economic and political circumstances and policy priorities are determined, to a
significant extent, by what is ideologically preferred at a particular historical juncture. Policy making is also a collaborative
venture in which both the government and stakeholders are dialectically interconnected while seeking to devise socially
relevant, politically meaningful and economically cost-efficient public policy (Dye, 2017; Chakrabarty and Chand, 2016).
NITI Aayog seeks to facilitate and empower the critical requirement of good governance, which is people-centric,
participative, collaborative, transparent and policy-driven. It provides critical directional and strategic input to the development
process, focusing on the deliverables and outcomes. This is an incubator and disseminator of fresh thought and ideas for the
development. The NITI Aayog is looking to engage the services of a consultant in the governance and public service delivery
vertical that will be responsible for the designing, management and implementation of a portfolio of policy initiatives, innovative
projects and partnerships related to the thematic area of governance and public service delivery. The responsibilities assigned
include, but not be limited to, the public administration reforms and enhancing administrative efficiency of the government
programmes, facilitating centre-state and inter-ministerial coordination in the area of governance and creation of a repository of
best practices with an aim to accelerate the developmental agenda in line with the principles of ‘Minimum Government and
Maximum Governance’. Thus, the NITI Aayog may generate the knowledge and innovation through a collaborative community of
experts, practitioners and other partners in order to become a catalyst and convener for the governance practices aimed at
enhancing the citizen centric public service delivery (NITI Aayog, 2017 & 2018; Wikipedia, 2022d; www.nitiaayog.com, 2022).
In NITI Aayog, the State Governments have an equal role in the process of national development, and thus the NITI Aayog
fulfils the principle of cooperative federalism of India. Repeatedly, it is a ‘think tank institution’ that stands not only as a hub for
knowledge but also for good governance. Therefore, the NITI Aayog is a big platform to monitor and implement all government
policies by bringing together various ministries of the Central and State Governments of India. In this, the priorities include
upliftment and empowerment of the poor, marginalised and downtrodden while simultaneously redressing identity-based
inequalities of all kinds, such as the gender, region, religion, caste and class of the people of India. At present, the NITI Aayog

Role of NITI Aayog in Relation to Indian Public Policies: A Study
IJMRA, Volume 5 Issue 05 May 2022 www.ijmra.in Page 1078
recommends various policies and their implementation is constantly being done by all the Governments for the welfare of
people and the country, as a whole (NITI Aayog, 2017 & 2018; Wikipedia, 2022d; www.nitiaayog.com, 2022).
PUBLIC POLICY
“Public Policy” is a ‘device employed to meaningfully address societal problems’. This is a primarily an instrument to guide social
actions in accordance with certain predetermined goals. Hence, the public policy is a ‘directional means seeking to fulfil ideology
driven aims which are usually conceived out of a dialectical interaction between the governments and governed’ . In making of
public policy, there are two types of actors: on one hand, there is Government which has definite ideological goals to attain
while devising the public policy. Political leadership holding State power is an important factor in so far as policy-making is
concerned; it however, functions in an ideological milieu in which the role of stakeholders, or in a more generic term,
‘governed’, is equally important. In its making, public policy is also value dependent (Dye, 2017; Chakrabarty and Chand, 2016;
Wikipedia, 2022 a, b & c).
While formulating the public policies for the democratic India, the policy-makers require to be sensitive to concerns for
public interests, right, justice, equality and efficiency. These are obligatory criteria that the decision makers cannot afford to
ignore because they uphold fundamental values of a democratic political order. Thus, it is argued that the public policy acquires
its ‘inner logic from the political ideology which the machinery of government is expected to translate into social reality’. The idea
which is dominant here is the conceptual principle that the decision makers regardless of location cannot be indifferent to the
values that inform specific political orders. The grounded in social norms and constitutional provisions, these values are
important determinants of the ‘policy making’ (Dye, 2017; Chakrabarty and Chand, 2016; Wikipedia, 2022 a, b & c).
NITI AAYOG AND ITS COMPOSITION
In accordance with an announcement made by India’s Prime Minister Hon’ble Shri Narendra Modi on Independence Day 2014,
the Union Government of India has established the “NITI Aayog” (National Institution for Transforming India Aayog), as
replacement for ‘Planning Commission’. This has been made after extensive consultation across the spectrum of stakeholders,
including State Governments, relevant institutions and domain experts. NITI Aayog overviews the monitoring and adoption of
‘Sustainable Development Goals’ (SDGs) and promote competitive and cooperative federalism among the States and
Government undertakings. NITI Aayog has to realise the goals and targets. The ‘Ministry of Statistics and Programme
Implementation’ (MoSPI) has undertaken a parallel exercise of interaction with ministries to evolve indicators reflecting targets
and SDGs. Further, the centrally sponsored schemes, including ‘core of the core’, ‘core’ and ‘optional’ schemes implemented by
the States, and some of recent initiatives undertaken by the Central Government have been mapped. Moreover, the ministries
and States are implementing Central sector schemes and State schemes, respectively that have been aligned with one or more
SDGs (www.insightsonindia.com, 2017; www.nitiaayog.com, 2022; Wikipedia, 2022d).
The monograms of NITI Aayog are depicted in Figures 1 to 2; while the introduction, composition and portfolio of Aayog
have been presented in Tables 1 to 3.
ROLE AND FUNCTIONS OF NITI AAYOG
The NITI Aayog plays an integrative role with the active involvement of States, civil society and other think tanks in the
development of a shared vision of national priorities and strategies in critical areas of human and economic development. One
of the main objectives of NITI Aayog is, ‘to design strategic and long-term policy and programme frameworks and initiatives, and
monitor their progress and their efficacy.’ The NITI is taking the lead in setting up sectoral targets, and fostering an environment
of innovation and cooperation. The target is to bring innovation, technology, enterprise and efficient management together at
the core of policy formulation and implementation (NITI Aayog Annual Report, 2020).
Rao (2015) has discussed thirteen tasks of NITI Aayog under four major functional groups:
A. Cooperative Federalism: Platform for Interface between Centre and States;
B. Strategic Planning
C. Knowledge and Innovation Hub
D. Coordination

Role of NITI Aayog in Relation to Indian Public Policies: A Study
IJMRA, Volume 5 Issue 05 May 2022 www.ijmra.in Page 1079
Figure 1 Figure 2
Figures 1 - 2: Different Monograms of “NITI Aayog” (Source: www.nitiaayog.com).
Table 1: Introducing the “NITI Aayog”
Table 2: Composition (Structure) of “NITI Aayog”
NITI AAYOG
“Niti Aayog” is a policy committee of the Indian Government.
The term “NITI” denotes to ‘National Institution for Transforming India’.
The Organisation was formed on January 1, 2015, in the capital city, New Delhi.
The Organisation is replacement and transformation of the 65 years old
‘Planning Commission / Yojana Aayog’.
The organization has its own Website which provides the citizens with all
informations related to the commission.
NITI AAYOG CONSISTS OF:
CHAIRMAN (CHAIRPERSON)- PRIME MINISTER (PM)
↓
Vice-Chairman (Vice-Chairperson): Appointed by PM
Ex-Officio Members: Maximum 4, nominated by PM
Social Invitees: Experts, Specialists, Practitioners with common knowledge
Governing Council: Chief Ministers (States) & Lt. Governors (Union Territories)
Full-Time Members: from universities, research or relevant institutions
Part-Time Members: Maximum 2, rotational, from relevant institutions
Chief Executive Officer (CEO): Appointed by PM for fixed tenure
Regional Councils: on need basis, incorporates CMs & Lt. Governors of the region
Secretariat: If necessary

Role of NITI Aayog in Relation to Indian Public Policies: A Study
IJMRA, Volume 5 Issue 05 May 2022 www.ijmra.in Page 1080
Table 3: Portfolio of “NITI Aayog”
Portfolio Name of Person
Chairman Hon’ble Shri Narendra Modi (Prime Minister)
Vice-Chairman Dr. Suman Bery
Full-Time Members Shri V.K. Saraswat, Prof. Ramesh Chand, Dr. V.K. Paul
Ex-Officio Members Shri Amit Shah, Shri Rajnath Singh, Mrs. Nirmala Sitaraman, Shri
Narendra Singh Tomar
Special Invitees Shri Nitin Gadkari, Shri Piyush Goyal, Shri Virendra Kumar, Shri
Ashwini Vaishvaw, Rao Inderjit Singh
Chief Executive Officer Shri Amitabh Kant
Governing Council All Chief Ministers of States (and Delhi and Puducherry), Lieutenant
Governor of Andaman & Nicobar Islands, Special Invites
A. Cooperative Federalism: This is a platform for interface between the Centre and States, meaning that the NITI Aayog fosters
cooperative federalism by giving structured support to the States on a continuous basis. The Seventh Schedule of the
structured support to the States on a continuous basis. The Seventh Schedule of the Constitution of India lays down the
legislative domains and functional responsibilities of the Union (Centre) and States. But there is an overlap in the functions
that needs coordination between the Union and States, and among the States as well. So to carry out stable and sustainable
developmental agenda, fostering the spirit of cooperation and cementing the federal structure are required. Recent years
have shown the need for cooperation in areas like energy and environment, education and poverty alleviation where the
need for coordinated action and speedy decisions are critical for pursuing the developmental agenda. The Union
Government may have some public services in the State also, which for reasons of nationwide externalities or for
redistribution require coordinated action to ensure minimum standards throughout the country. Such public services
include poverty alleviation, healthcare and urban development, etc. In these cases, the State Governments are the partners
to achieve a common goal. In case of Union Government also, the States may be involved in implementation as agencies.
Apart from these, NITI Aayog may facilitate the exchange of information and experiences, and promote healthy inter-
governmental competition through monitoring and regulation. Most important issue which the NITI Aayog has to deal with
is the rationalisation of ‘Centrally Sponsored Schemes’ (CSS) as there is considerable resentment by the States on them.
When schemes are discontinued, they leave large liabilities on States, so there is certainly specific purpose to have
minimum standards of services which are considered to be of national importance. Given the collaborative nature of such
schemes, they should be designed and implemented in spirit of cooperative federalism. Schemes should be holistic with
scope for flexibility in implementation depending on the local conditions and they should be limited in number (not more
than ten). New institution could provide a platform for designing the schemes, implementation systems, monitoring and
evaluating them in a collaborative framework. Thus, to enable the NITI Aayog toplay a constructive role in fostering
cooperation, it is essential to have ‘Interstate Council’, properly empowered under Article 263 of Constitution, in the Aayog.
Further, NITI Aayog should be nodal agency for discussion, negotiation, bargaining and resolution of all major matters, and
should have required expertise on inter governmental relations, constitutional law and fiscal federalism.
B. Strategic Planning: NITI Aayog can formulate the strategic vision and long-term policies, and programme framework both
for macro-economy and for various sectors. The perspective planning helps to make projections on the macro variables and
keep the policy perspective. Strategy and policies are needed to improve living standard of projected population and
improve human development to empower people to engage them in economic activities. These should be constantly
revisited to ensure their relevance. Planning should be built right from village, block and district levels, and these should be
harmonised with planning at the State level. Likewise, the national planning should be the consolidation of State-level plans
along with the planning infrastructure and service requirements. NITI Aayog can provide a framework for making plans to
the States and the latter, in turn, to lower levels of Government. It should also have a unit to guide, if any State is in need of
such assistance.
C. Innovation and Knowledge Hub: The Knowledge and Innovation hub, and research inputs are closely aligned to strategic
planning and role of NITI Aayog, which as a think tank facilitates partnership between stake holders. Formulation of
strategic vision and policies, and programmes aligned to it as well as initiating and monitoring them requires state of art
research, technology upgradation and capacity building. As a major think tank of Government working on various
developmental policies, NITI Aayog should not only have basic research capabilities but also should access and outsource

Role of NITI Aayog in Relation to Indian Public Policies: A Study
IJMRA, Volume 5 Issue 05 May 2022 www.ijmra.in Page 1081
research on relevant subjects. It should have a strong data bank, consolidating data and information on economic,
demographic, geographic and social variables relevant for research and policy. Among other functions, NITI Aayog also
provides a platform for experience sharing among States.
D. Coordination: This is the fourth important task of NITI Aayog. This institution is committed to providing a platform for inter-
departmental and intergovernmental coordination. The disastrous consequences of lack of coordination between
infrastructures including environmental and ministries on economic growth have been clearly evident before the
establishment of NITI Aayog.
The NITI Aayog plays its role and functions through the ‘Seven Pillars of Effective Governance’ as described in Figure 3; and
the important role and functions of the NITI Aayog in relation to public policies have been mentioned in Table 4 (NITI Aayog
Annual Report, 2020; www.insightsonindia.com, 2017; www.nitiaayog.com, 2022).
Figure 3: Seven Pillars of Effective Governance via “NITI Aayog” (Source: www.pib.nic.in).
Table 4: Important Role and Functions of NITI Aayog
S.
No.
Role and Functions of NITI Aayog
1 To provide a ‘think tank’ which provides Governments at the Central and State levels with relevant
strategic and technical advice across the key elements of policy.
2 To overview monitoring and adoption of ‘Sustainable Development Goals’ (SDGs) and promote
competitive and cooperative federalism among States and Govt. undertakings.
3 To provide advice and encourage partnerships between key stakeholders, and national and
international like-minded ‘think tanks’, and educational and policy research institutions.

Role of NITI Aayog in Relation to Indian Public Policies: A Study
IJMRA, Volume 5 Issue 05 May 2022 www.ijmra.in Page 1082
4 To create knowledge, innovation and entrepreneurial support system via collaborative community
of national and international experts, practitioners and other partners.
5 To evolve a shared vision of national development priorities sectors and strategies with the active
involvement of States.
6 To foster cooperative federalism through structured support initiatives and mechanisms with the
States continuously, recognizing that strong States make a strong nation.
7 To provide a critical directional and strategic input into development process.
8 To replace Centre-to-State one-way flow of policy (that was the hallmark of Planning Commission
era) by a genuine and continuing partnership of the States of India.
9 To end the slow and tardy implementation of policy, by fostering better inter-Ministry
coordination and better Centre-State coordination.
10 To develop mechanisms to formulate credible plans at the village level and aggregate these
progressively at higher levels of Government.
11 To provide a framework for preparing plans to the States and the latter, in turn, to the lower levels
of Government.
12 To ensure that the interests of national security are incorporated in economic strategy and policy
on the specifically concerned areas.
13 To pay special attention to those sections of society that may be at risk of not benefiting
adequately from economic progress.
14 To design strategic and long term policy and programme frameworks and initiatives, and monitor
their progress and their efficacy.
15 To monitor and evaluate implementation of programmes, initiatives and identification of needed
resources, so as to strengthen probability of success and scope of delivery.
16 To focus on technology upgradation and capacity building for implementation of programmes and
initiatives.
17 To offer a platform for resolution of inter-sectoral and inter-departmental issues in order to
accelerate the implementation of development agenda.
18 To maintain ‘State-of-the-art Resource Centre’, be a research repository on good governance and
practices in development, and to help their dissemination to stake-holders.
19 To have an administration paradigm in which the Government is an ‘enabler’ rather than a
‘provider of first and last resort’.
20 To progress from ‘food security’ to a mix of agricultural production, as well as actual returns that
farmers get from their produce.
21 To facilitate the exchange of information and experiences, and promote healthy inter-
governmental competition through monitoring and regulation.
22 To deal with the rationalisation of ‘Centrally Sponsored Schemes’ (CSS) as there is considerable
resentment by the States on them.
23 To undertake other activities as may be necessary in order to further the execution of the national
development agenda, and the objectives of NITI Aayog.
CONCLUSIONS
NITI Aayog is a new specialized field of Social Sciences, including Political Science and Economics. This has been recently
introduced in 2015 by Union Government of India, as a replacement of Planning Commission for welfare of people and the
country, as a whole. NITI Aayog promotes competitive and cooperative federalism among the States and Government
undertakings. This is a Government of India policy ‘think tank’ that aims ‘to foster involvement and participation in the economic
policy making process by the State Governments of India’. It provides a critical directional and strategic input in regard to
developmental processes. The NITI Aayog facilitates and empowers critical requirement of good governance, which is people-
centric, participative, collaborative, transparent and policy-driven. It provides critical directional and strategic input to
development process, focusing on deliverables and outcomes. This is an incubator and disseminator of fresh thought and ideas
for development in relation to Indian public policies.

Role of NITI Aayog in Relation to Indian Public Policies: A Study
IJMRA, Volume 5 Issue 05 May 2022 www.ijmra.in Page 1083
REFERENCES
1) Chakrabarty, B. and Chand, P. (2016). Public Policy: Concept, Theory and Practice. Sage Publications India Pvt. Ltd., New
Delhi.
2) Dye, T.R. (2017). Understanding Public Policy, 15th Edn. Prentice Hall, Pearson.
3) NITI Aayog (2017). NITI Aayog Update June 2017. NIC News.
4) NITI Aayog (2018). Strategy for New India@75. NITI Aayog, New Delhi.
5) NITI Aayog Annual Report (2020). Ann. Report 2019-20. NITI Aayog, N. Delhi.
6) Rao, G.M. (2015). Role and functions of NITI Aayog. Economic & Political Weekly (January 2015).
www.researchgate.net/publication/271845838.
7) Wikipedia (2022a). Centre for Policy Research.
8) Wikipedia (2022b). Centre for Public Policy Research.
9) Wikipedia (2022c). Indian School of Public Policy.
10) Wikipedia (2022d). NITI Aayog.
11) www.insightsonindia.com/big-picture-two-years-niti-aayog (2017). The Big Picture: Two years of NITI Aayog.
12) www.nitiaayog.com (2022). NITI Aayog.
There is an Open Access article, distributed under the term of the Creative Commons Attribution – Non Commercial 4.0 International (CC BY-NC 4.0) (https://creativecommons.org/licenses/by-nc/4.0/), which permits remixing, adapting and building upon the work for non-commercial use, provided the original work is properly cited.

INTERNATIONAL JOURNAL OF MULTIDISCIPLINARY RESEARCH AND ANALYSIS
ISSN(print): 2643-9840, ISSN(online): 2643-9875
Volume 05 Issue 05 May 2022
DOI: 10.47191/ijmra/v5-i5-26, Impact Factor: 6.261
Page No. 1084-1089
IJMRA, Volume 5 Issue 05 May 2022 www.ijmra.in Page 1084
Indigenousism, Hinduism and Christianism - A Glimpse of
Religious Transformation of the North East Indian Tribes of Tripura
Dr. Nirmal Bhadra Associate Professor, Department of History, Swami Vivekananda Mahavidyalaya, Mohanpur, Tripura, India 799210
ABSTRACT: The article is a brief report of transformation of the indigenous religion of the autochthonous tribal people of the
North East Indian State of Tripura who were inhabited in the state since the primitive age. In course of time thousands of non
tribe people from the neighboring districts of the then East Pakistan or today’s Bangladesh migrated and settle in Tripura. As a
result, this migration made a bold effort on the religious life of the tribes of Tripura and the process of religious transformation
had taken part seriously. Within a century that is 20th century the tribes of Tripura religiously converted from indigenous
practice to Hinduism or Christianity as a whole. It is unfortunate that scholar’s attention has not been focused on this aspect.
The present study aims at bring about the real fact by examining authentic sources and materials.
The North East Indian State Tripura is a land of tradition, culture and heritage. Once an imperial or monarchial state, Tripura has
undergone and witnessed many significant historical events. Passing through these events it has boldly faced many blows and
accepted the reality of destruction and reconstruction. A large population of the state is constituted of Hindu Bengalis, where as
the tribes are the autochthonous people of the state. They inhabited Tripura since the primitive age. For a long span of time
tribes of Tripura were confined among themselves, so their traditional history remained undiscovered. Meanwhile, during the
19th century when the whole world was being enlightened by various scientific inventions & discoveries, the hill tribes of this
state was far away from the modernization and remained confined limited within their dark and traditional ancient civilization.
In course of time for fostering education, trade and commerce in the state the Royal family of the then Tripura
invited administrative personals of various sort and expert farmers from Bengal of Indian Sub-Continent. On the other hand
incidents like partition of the country, communal disturbances and the Indo-Pak war of 1971 forced thousands of non tribe
people from the neighboring districts of the then East Pakistan or today’s Bangladesh to migrate and settle in Tripura. As a result
of very close contact between the Hindu Bengalis and the different tribes of Tripura a new dimension in the society of Tripura
incepted. Especially this migration made a bold effort on the religious life of the tribes of Tripura and the process of religious
transformation had taken part seriously on the socio-religious life of the indigenous tribes of Tripura.
It is unfortunate that scholar’s attention has not been focused on this aspect. Since very few academic
discussions are available about the fact under discussion, there is a paucity of literature to deal with this aspect. Gayatri
Bhattacharjee has discussed extensively on the “Refugee Rehabilitation and its Impact on the Economy of Tripura” during the
post-independence era. She is of the view that the influx of Bengali migration helped greatly in boosting the state’s economy
which is largely true. But she does not discuss the historical dimension of the religious impact of Bengali migration starting from
mid-19th century. J. Gon Choudhuri (1979), H.K., Sur (1986), R.M., Sharma (1987) have dealt in the political history of Tripura. We
don’t find any elaborate description of migration processes and its effects on the religious transformation on the tribes of
Tripura in their works. We get some related information’s in the works of W.W.Hunter (1876), Vol-VI, K.D.Menon edited District
Gazetteers of Tripura (1975) and Census Bibarani-1931 by Thakur Somendra Chandra have also mentioned several aspects on
migration and its impact in the societies of Tripura. There is a scope for exploring the archival sources, newspaper and journals
in vernacular languages to illustrate the fact under discussion. The present study aims at bring about the real nature of migration
processes and its effect on the traditional religious life of the tribal people of Tripura by examining authentic sources and
materials.
Let us cast a glance on the indigenous religious practices of the tribes of Tripura. W. W. Hunter has shown in his report
that in the nineteenth century all the sects of the tribes of the hills of Tripura followed almost the same sorts of religious
practises1. However the characteristics of the religious practices followed by the tribal at that time is described below-

Indigenousism, Hinduism and Christianism - A Glimpse of Religious Transformation of the North East Indian Tribes of Tripura
IJMRA, Volume 5 Issue 05 May 2022 www.ijmra.in Page 1085
i) Worshipping of natural elements as Gods and Goddesses similar with the religious beliefs of the primitive men these
tribes also worshipped water, river, sea, hills and mountains and Gods and Goddesses of different types2. In other
words these tribes followed religious practices of the people of pre-Vedic age.
ii) The Gods and Goddesses were divided into two categories – benevolent gods and malevolent deities i.e. Gods who
do good to people and those who do harm to people. That is why whenever they fell sick they worshiped different
evil Gods3.
iii) There was belief in some evil souls and spirit, they had the feeling that these evil souls and sprits resided in old trees,
road crossing old ponds etc. so they worshipped these souls and spirits in places as ponds, tri-junctions or junctions
of four roads04.
iv) There was no existence of temples for worshipping their indigenous Gods and Goddesses. They followed these
worshipping under the open sky by the side of the rivers or canals, on the junction of three or four roads, in the
jungles, under trees, in the play grounds etc5.
v) They worshipped formless Gods and Goddesses. They did not worship any idols made of earth, metal or cloth6.
Hunter’s report in the last part of the nineteenth century mentions that the tribes worshiped piece of bamboo
imagining it to be a representative of a particular deity7.
vi) There were no performances of any ‘oblation’ in the religious activities of the indigenous tribes of Tripura 8.
vii) Sacrificing was a popular element. The tribal’s sacrificed goat, buffalos, pigeon, pig etc. Sacrifice of one or the other
animals was a must during a worship9.
viii) Religious performances were conducted by the tribal priests. They strictly followed all the rules prescribed for
performances. These priests were called ‘Ojhai’ or ‘Uchai’. Their position was analogous to the lord Bishop of the
state. The priest subordinate to the chantai was known as galim. However, the tribal priest did not undergo any
investor ceremony sacred thread. The post of priest was not hereditary. Any young man could become a priest if he
learned the mantras10.
ix) There was a belief of one chief god among their gods and this chief was called as Matai katar. Matai means God, and
katar means chief or the best11.
x) The Gods and Goddesses who were worshipped and revered by the tribes of the hills of Tripura were not made
characters of any literature. This was unlike the case with Hindu Gods and Goddesses where a very rich store of
literature has been built with the Gods and Goddesses as characters. Mythological stories, the Ramayana, the
Mahabharata, and numerous stories relating to different gods and goddesses Vaishnava poems are example of such
literature.
xi) The Tribes of Tripura had not worshipped animals. In these matters the religious beliefs of the Tribes of the hills of
the state was different from those of ancient Indian civilization12.
Indigenous Gods and Goddesses of the tribes of Tripura13
Name of the God and Goddesses Purpose of the God/warship
1. Matai katar. 1. Mighty God.
2. Matai Katarma. 2. Wife of the Mighty God.
3. Akhtra, Bikhatra. 3. Son of the Mighty God.
4. Tuima. 4. God of Water.
5. Sangrama. 5. God of Hill.
6. Mailooma. 6. God of Paddy and Rice.
7. Khusma. 7. God of Cotton.
8. Thomnairok & Baniroc. 8. God of death.
9. Achu Sibray & others. 9. God of Jhum.
10. Boracha . 10. God of diseases & Jhum.
11. Burirok (Seven Sisters). 11. God of Magic.
12. Garaia, Kalaia. 12. God of Agriculture.
13. Lampra. 13. God of commence.
14. Saklakmatai 14. God of homestead.
15. Bichukma 15. God of Forest.
16. Sirijamdu 16. God of evil sprit.

Indigenousism, Hinduism and Christianism - A Glimpse of Religious Transformation of the North East Indian Tribes of Tripura
IJMRA, Volume 5 Issue 05 May 2022 www.ijmra.in Page 1086
There was a chequer religious environment in the Indian hilly state of Tripura throughout the ages. The religious
environment of that state stood on mutual understanding tolerance and cooperation among the different sections of the people
of the state14. There were no differences and conflict between Hinduism and the religious beliefs of the indigenous practice of
religion by the tribes of Tripura 15.The census reports of the last part of the nineteenth century show the co-existence of the
Hindus, Muslims and the Buddhists in Tripura. Practice of Christianity was new in this state. Christianity entered into Tripura
after the coming of the Europeans in India16. During the reign of Amar Manikya (1577-86) a few Portuguese introduced
Christianity in Tripura. . After that these Portuguese and the British who came to this state as government employees had
constituted the Christian population of this state. Christian missionaries came to Tripura not earlier than 191017.
Table- 01. Religious Picture of Tripura For the year 1874 to1901.
Religion 1874-75 1891 1901
Person % Person % Person %
Tribal 42345 57.03 -------- -------- ------- -------
Hindu 14224 19.15 14047 10.22 119192 68.76
Muslim 11384 15.32 38731 28.18 45323 26.14
Animist ------- ------- 84499 61.48 2673 1.54
Buddhist -------- ------- ------- -------- 5999 3.46
Other 6285 8.46 165 0.12 138 0.10
Sources:-
1. Hunter, W.W., A Statistical Account of Bengal, Vol-VI, London,1876, Re-print, 1973, p.482
2. Debbarma, S., 1340 Tring Saner Tripura Rajyer Census Bibarani, Agartala, 1931, Re-Print, 1997, p. 48.
3. Chaudhuri, A., Cencus Report of The Independent Tripura 1901, Agartala, pp. 10,14.
The census reports of 1874-75 shows that the tribes of Tripura constituted the majority of the population in Tripura.
However it was known from different sources that Tribal had their indigenous religion which included worshipping of nature,
evil spirits etc18. As a result it is seen in the census report of 1891 that the number of Hindus in Tripura was 10.28% while 61.48
were animists. But in the 1901 census, the percentage of Hindus has been shown to be 68.13%. There is mention of a few
animists in Tripura in this report. This means that during this period the tribes of Tripura had embraced on Hinduism although
they held on to their traditional beliefs and practice regarding religion. In this phase Islam, Hinduism, and the indigenous
religious practice and belief were the main religions of this state. Buddhism was not very much in practice. Mugs and Chakma
people who were followers of Buddhism came to this state much during the last part of the 19th century19.
In the topic under discussion we find that the tribal people of Tripura have been drawn in to the main stream of Hindu way
of life along with their pantheon of Gods and Goddesses. The sacred scriptures, the epics, the puranas and the socio-religious
system of Bengali speaking Hindus were highly accepted by the tribes of Tripura. Not only that they also converted some of their
Gods and Goddesses into Hindu gods and Goddesses who were fairly honoured and adored by the Hindu Bengalis. Moreover the
tribes of Tripura have contributed in building up Hinduism. On the other hand some of them received Hindu Vaishnava religion
and within the first half of the twentieth century lion part of the tribal population of Tripura accustomed with Hinduism20.
It is significant that accepting Hindu faith the tribes of Tripura engaged the Brahmin priests also during their main event
of birth, marriage, death etc, instead of their traditional priest named ‘Ochai’. The tribal people living in accessible regions of
forests, hills and hill slopes had their own Ochais only and the warships as well as all religious ceremonies were performed by
them following the traditional tribal belief and practices. Nevertheless it is observed in our survey that with the acceptation of
Hindu faith, the tribes of Tripura used to drink all the evil conservatisms of Hindu Brahminical aspects. They were exploited in
their every socio-religious programmes like marriage, birth, death rituals etc by the Brahmins of Hindus21. Moreover some of the
hypocritical devotees also cheated the tribes of Tripura by taking advantage of their simplicity22. As a result the tribes of Tripura
faced a new type of religion instead of their traditional religion. Finally some of the tribes of Tripura gave up Hindu religion and
moved to the Christian religion23.

Indigenousism, Hinduism and Christianism - A Glimpse of Religious Transformation of the North East Indian Tribes of Tripura
IJMRA, Volume 5 Issue 05 May 2022 www.ijmra.in Page 1087
Table: 02. Christianity among the original tribes of Tripura 1961-1981
SL. No. Name of the Tribes Censes Total population Christians Percentage
1. Halam 1961 16298 253 1.55
1981 28970 3017 10.41
2. Jamatia 1961 24359 Nil Nil
1981 44501 501 1.12
3. Kuki 1961 5531 2345 42.39
1981 5501 4442 80.74
4. Tripuri 1961 189799 54 0.02
1981 3,30,872 1012 0.30
5. Reang 1961 56597 1705 3.01
1981 84003 4974 5.92
Source: -
1. Censes of India, 1961, Vol.-xxvl, Tripura part lx, pp. 671-77.
2. Censes of India – 1981, series 21, Tripura, part lx, pp. 671-77.
The above statement clearly indicates that the number of the conversions from Hindu to Christianity has increased
among the tribes of Tripura. Side by side another statement regarding religion- wise percentage increase during 1971 to 1981 in
population in Tripura more effectively shows the conversion of the tribes of Tripura in Christianity.
Table- 03. Statement of religion-wise % increased in Tripura- 1971 to 1981
Hindu Muslim Christian Buddhist
31.61 33.25 58.29 29.61
Source: Directorate of census operations Tripura, A portrait of population, Agartala, 1988, pp.73, 74.
The statement shows that the increases in Hindus were 31.61%, Muslims 33.25% during 1971 to 1981. But the
percentage increase was very much high in Christian population i.e. 58.29 % rather than others. As a result Christianity opened
doors in Tripura and it was among the tribes of Tripura. During 1951 there were hardly 5000 Christians in Tripura but, in the
2001 census it showed a population 102489 and 159882 during the census of 2011.
It has been found from another statement that the percentage of Christians among the tribes of North East India is
much more than in Tripura. As a result it can be said that the tribal people of Tripura were influenced by the Hindu Bengali
religion. A few of them were converted from Hindu to Christian. The following statement clearly indicates the fact.
Table: 04. State wise Christians in North East India in 2011 census
State Total Population Total Christians %
Arunachal Pradesh 1383727 418732 30.26
Assam 31205576 1165867 3.74
Manipur 2855794 1179043 41.29
Meghalaya 2966889 2213027 74.59
Mizoram 1097206 956331 87.16
Nagaland 1978502 1739651 87.93
Tripura 3673917 159882 4.35
Source: Census of India 2011.
The above statement clearly indicates that Christianity in North East India had rapidly scattered among the tribal states.
Not only that, it has found from another statement that the first four Christian populated states of India is represented from
the tribal populated states of North East India and they are Nagaland (1st 87.93%), Mizoram (2nd 87.16%),Meghalaya (3rd
74.59%), Manipur (4th 41.29%) as per Christian population of their states. But Tripura has a Christian population of 4.35% only.

Indigenousism, Hinduism and Christianism - A Glimpse of Religious Transformation of the North East Indian Tribes of Tripura
IJMRA, Volume 5 Issue 05 May 2022 www.ijmra.in Page 1088
Meanwhile, the practice of indigenous religion by the tribes of Tripura had been ruined in course of time under
discussion. The religious picture of Tripura for the census year of 2011 clearly indicates that fact.
Table: 5. Religious picture of Tripura 2011
Sl.No Religion Persons Percentage
1. Hindu 3063903 83.40
2. Muslim 316042 8.60
3. Christian 159882 4.35
4. Buddhist 125385 3.41
5. Sikh 1070 0.03
6. Jain 860 0.02
7. Others 1514 0.04
8. Not stated 5262 0.14
The above statement of religious representation of the population of Tripura clearly indicating that autochthonous
people of Tripura has transformed themselves from their traditional indigenous religion to Hinduism or Christianity as because
there is nobody shown in the statement owing to practice so-called traditional indigenous religion. From our various survey it
has been found that the tribes of Tripura nowadays practicing either Hindu or Christian religion. Muslims of Tripura are Bengalis
and they had migrated here from British Bengal or today’s Bangladesh. Sikh and Jain also migrated from other states of India for
their livelihood. The Arakan originated Mog and Chakma tribes of Tripura represent Buddhism. Number of people representing
others and not stated is negligible. Henceforth, it has been found that during 2011 census the tribal people of Tripura
constituted 31.78%, that is 11, 66,813 out of total population 36, 71,032 of Tripura. So, its means the tribes of Tripura converted
their indigenous religion either in Hinduism or Christianity. Thus the practice of indigenous religion by the tribal people became
past. Although a few religious practice and festivals like Gariya puja, Ker puja are till performing as residual magnetism.
It may be concluded that, a man is a religious being by nature. Religion forms an inseparable feature of every society.
The right to freedom of religion as provided in the group of Articles 25 to 28 is one of the Fundamental Rights guaranteed by the
Constitution of India. Moreover Article 9 of Human Rights Act 1998 gives all individuals freedom of religion. Although as theory
of evolution in course of time the tribes of Tripura forgot their practice of indigenous religion. Within a century that is twentieth
century the indigenous tribes of Tripura had lapsed their traditional indigenous practice of religion. Many times in history,
progress has been hurdled in the name of religion and sometimes it has degenerated in dogmatism, exploitation, violence and
war like Jehads and religious crusades. Thank God, the Indian state of Tripura had never experiences such evidences at all.
REFERENCES
1) Hunter, W.W., A Statistical Account of Bengal, Vol.-VI, London, 1876, Re-print, 1973. p.483.
2) Hunter, W.W., Op. cit p.483.
3) Palit, B., History of Religion in Tripura, New Delhi, 2000, p.148.
4) Bhowmik, D.L., Tribal Religion of Tripura, Agartala, 2003. p.21.
5) Interview from Sukrai Debbarma, (75 Yrs.), Lembuchera, West Tripura, India, Dated: 08/10/2008.
6) Bhattacharjee, P.B., Tribal Pujas and Festivals in Tripura, Agartala, 1994. p.29 & Bhowmik, D.L., Op. cit. p.38.
7) Hunter, W.W., Op. cit. p.492.
8) Interview from Chantai Debbarma, (82 Yrs.), Sipahi Para, West Tripura, India, Dated: 09/10/2008.
9) Singha, K.C., Rajmala –ba-Tripurar Itihas, Commilla, 1896, Re-Print, Agartala, 1405, B.S. p.12 & Sen., K.P., Sri Rajmala,
Vol.-I, II, III, IV, Agartala, 1926, Re-Print, 2003.Vol.-II, pp.103, 104.
10) Singha, K.C., Op. cit. p.12.
11) Bhowmik, D.L., Op. cit. pp.23, 24.
12) Bhattacharjee, P.B., Op. cit. p.83.
13) Singha, K.C., Op. cit. pp.11, 12 & Chaudhury, A.C., Census Report of Tripura 1901. pp. 33, 50
14) Sen, K.P., Vol.-I, Op. cit. p.95.
15) Bhattacharjee, P.B., Tribal Pujas and Festivals in Tripura, Agartala, 1994, p.7.
16) Bhowmik, D.L., Tribal Religion of Tripura, Agartala, 2003, p.50.
17) Bhowmik, D.L., Op. cit. pp.54, 55.
18) Debbarma, S., 1340 Tring Saner Tripura Rajyer Census Bibarani, Agartala, 1931, Re-Print, 1997, pp.49, 55.

Indigenousism, Hinduism and Christianism - A Glimpse of Religious Transformation of the North East Indian Tribes of Tripura
IJMRA, Volume 5 Issue 05 May 2022 www.ijmra.in Page 1089
19) Hunter, W.W., Op. cit. p.493 & Chaudhuri, D.K., (ed.), Administration Report Of The Political Agency, Hill Tipperah,
(1878-79,--1889-90.), Vol.-II, Agartala, 1996 p.99.
20) Lewin, H.T., The Hill Tracts of Chittagong and the Dwellers Therein, Kolkata, 1869, Re-Print, New Delhi, 200. p. 95 &
Hunter, W.W., Op. cit. p. 484
21) Singha, K.C., Op. cit. p. 10.
22) Chaudhuri, A.C., Op. cit. pp. p. 32.
23) Debbarma, S., Op. cit. p. 82.
There is an Open Access article, distributed under the term of the Creative Commons Attribution – Non Commercial 4.0 International (CC BY-NC 4.0) (https://creativecommons.org/licenses/by-nc/4.0/), which permits remixing, adapting and building upon the work for non-commercial use, provided the original work is properly cited.

INTERNATIONAL JOURNAL OF MULTIDISCIPLINARY RESEARCH AND ANALYSIS
ISSN(print): 2643-9840, ISSN(online): 2643-9875
Volume 05 Issue 05 May 2022
DOI: 10.47191/ijmra/v5-i5-27, Impact Factor: 6.261
Page No. 1090-1095
IJMRA, Volume 5 Issue 05 May 2022 www.ijmra.in Page 1090
Development of Student Worksheets (LKPD) Based on Learning
Models Guided Inquiry to Improve Students Critical Thinking
Ability in Materials Cells and Plant Tissue Class XI SMA/MA
Fanni Syahuri Tinambunan 1, Lufri 2
1Master Degree Program of Biology Education, Faculty of Mathematics and Sciences, Padang State University, Jl. Prof. Dr. West
Padang Freshwater Hamka - 25131 Indonesia 2Lecturer of Biology Department, Faculty of Mathematics and Sciences, Padang State University, Jl. Prof. Dr. West Freshwater
Hamka Padang–25131, Indonesia
ABSTRACT: This study aims to design, design and develop a learning intervention. The product developed is LKPD based on
learning models guided inquiry to improve the critical thinking skills of students of SMAN 1 IX Koto Sungai Lasi that are valid,
practical, and effective. The instrument used was a validity questionnaire and a practicality questionnaire as well as a matter of
effectiveness. The validity and practicality data analysis technique uses a Likert scale scoring and the effectiveness uses a t-test
using SPSS 2.2. Based on the development and trial of LKPD based on learning models Guided Inquiry on the material of plant
cells and tissues to improve the thinking skills of class XI students of SMAN 1 IX Koto Sungai Lasi, it was concluded that the
results of the validity and practicality tests met the very valid criteria. The results of the effectiveness test have effective criteria.
KEYWORDS: Guided inquiry, development, critical thinking.
I. INTRODUCTION
Learning is aspect (LKS). important in the implementation of education. Students are expected to be able to understand the
concepts and principles of the material in the learning process. Teachers must be able to provide motivation and foster student
interest in learning, and need to create a learning atmosphere that can help students understand concepts and learning
materials. This can be done by using media, models and various approaches to facilitate students in the learning process
(Suryono and Hariyanto, 2011: 18).
Media that can be help learning is teaching material. Teaching materials are an important part in the implementation of
learning. Teachers who use teaching materials will find it easier to carry out learning and students will find it easier to
understand learning materials. One of the teaching materials that can be used to assist teachers in carrying out learning process
activities is LKPD. The teaching materials used by the teacher are in the form of textbooks, modules, and Student Worksheets
(LKPD). The Student Worksheet was originally known as the student worksheet Student worksheets are sheets that contain
assignments that must be done by students. LKPD is usually in the form of instructions, steps to complete a task, which will be
achieved (Depdiknas, 2008: 18).
LKPD is one of the teaching materials that contains the main learning materials, as well as instructions for working on
assignments that refer to the competencies that must be achieved by students. Presentation of important concepts in LKPD will
be simpler for students (Prastowo, 2010: 204). This is in accordance with Trianto's statement (2009: 222), that LKPD is a student
guide used to carry out investigations and problem solving activities. In addition, LKPD makes it easier for teachers to explain
learning materials. This is in accordance with Prastowo's statement (2010: 24) that the function of teaching materials for
teachers is to save time in teaching.
The results of the researcher's observations on the activity sheet contained in the student book found that the teacher had
indeed used teaching materials in the form of LKPD, but the LKPD used was the LKPD designed by the teacher himself. LKPD
These are only in the form of materials, questions and other sources as used. The LKPD contained in the reference book is only a
description of the material and questions to strengthen certain concepts so that the LKPD has not been able to facilitate

“Development of Student Worksheets (LKPD) Based on Learning Models Guided Inquiry to Improve Students
Critical Thinking Ability in Materials Cells and Plant Tissue Class XI SMA/MA”
IJMRA, Volume 5 Issue 05 May 2022 www.ijmra.in Page 1091
students in obtaining meaningful learning. The LKPD used is less attractive to students because it is not equipped with pictures.
This causes students to be less interested in working on and reading LKPD.
The biology learning process at SMAN 1 IX Koto Sungai Lasi has not all produced good grades in the sense that there are still
many students who do not meet the standards. in class XI which was set at SMAN 1 IX Koto Sungai Lasi, namely 79. The lack of
use of learning models and teaching materials that did not facilitate students in critical thinking and solving problems resulted in
the low learning outcomes of students.
Based on the results of the researcher's interview with the biology subject teacher (Appendix 3) who teaches at SMAN 1 IX
Koto Sungai Lasi on October 11, 2020, it is known that when learning biology, the teacher uses the LKPD analysis made by the
teacher at every meeting, however, it does not include activities and activities. clear directions. LKPD components used by
teachers include titles, competencies, teaching materials and student activities. The LKPD used has several shortcomings,
namely: first, LKPD is not yet model-based guided inquiry. Which second, is used to direct students to carry out practical
activities and investigations without being preceded by directing students to a problem, LKPD does not provide a column for the
results of the investigation and a column for concluding observations ,third LKPD has not directed students to think critically.
However, in reality, students' test results get unsatisfactory results as shown in Table 1.
Table 1. Number of Students and Average Grade XI MIPA I Test Semester 1 Academic Year 2020/2021 on Cell and Tissue
Material.
Class Mark
flat2
Amount
participant educate
Participant Educate
complete (%)
Participant
Educate
no complete (%)
XI MIPA 67.00 23 60% 40%
Source: Biology Subject Teacher at SMAN 1 XI Koto Sungai Lasi.
Based on Table 1, it can be seen that students who complete have a percentage of 60% while those who do not complete
40%. The low learning outcomes are due to the presence of students who have not mastered the subject matter, students are
also less directly involved in the learning process and students tend to be less daring in asking material that they do not
understand, the skills of students in solving every problem in the classroom are still not satisfactory.
This is reinforced based on the results of researchers' observations during the online learning process, namely every time the
teacher asks students a question on average only two or three students answer questions from the rest of the 23 students who
just stay silent and take notes on the explanation given by the teacher. This condition can also be caused by the monotonous
and unattractive learning style of a teacher at the time of teaching.
The implementation of learning which is still dominated by the teacher with the lecture method tends to be limited to the
memorization aspect so that it does not involve the activities of students which causes students to have difficulty in mastering
biological concepts and has an impact on low learning outcomes. To overcome these problems, teachers need to change the
conventional learning model with new teaching methods that allow students to be actively involved directly in learning and
further assist students in mastering biological concepts so as to achieve maximum learning outcomes..
One of the learning models that can be applied is guided inquiry (guided inquiry). Guided inquiry learning enable students to
gain opportunities to expand knowledge and help develop conceptual understanding (Pandey et al, 2011: 3 and Wenning, 2011:
2). In guided inquiry learning, the teacher does not release students to carry out investigation activities, but the teacher actively
provides direction and guidance (Kuhlthau et al, 2007: 3). With teacher guidance, students are expected to be able to
concentrate on building new knowledge and benefit from each stage of the investigation process they do.
Problem which found in learning needs a solution so that students get good learning outcomes. Several possibilities that can
be done by the teacher by applying a learning device made to focus and activate students in the learning process. Learning like
this is a form of learning that trains and develops the ability of students to analyze a problem and make their own conclusions.
Learning should be designed to follow the flow of the students' minds themselves who find the concepts contained in the
material being taught.
The thinking process itself is usually carried out through questions and answers between teachers and students or vice versa.
Starting from these questions, this is a form of learning guided inquiry carried out. This learning strategy is often also called a
learning strategy heuristic. Which comes from the Greek, namely heuriskein which means I find. According to the benchmark of
critical thinking ability, it must meet the indicators used.According to Fisher (2011), there are nine indicators of critical thinking

“Development of Student Worksheets (LKPD) Based on Learning Models Guided Inquiry to Improve Students
Critical Thinking Ability in Materials Cells and Plant Tissue Class XI SMA/MA”
IJMRA, Volume 5 Issue 05 May 2022 www.ijmra.in Page 1092
including: (1) state truth statement or questions;(2) analyze statement or question; (3) logical thinking; (4) sorting for example
cause and effect; (5) classify; (6) decide for example the evidence; (7) predict; (8) theorize; and (9) understand others and
themselves. This is in accordance with what was stated by Marjono, et al (2012: 21).
that learning with the guided inquiry model makes students learn as thinkers, not just passive recipients of knowledge. The
introduction and provision of problems that are relevant to everyday life for students, analytical to find and find answers to a
problem by themselves, make students as scientific concept builders.
Learning that demands optimal involvement in the learning process can improve Latifa's critical thinking skills (2017: 66). This
is in line with Synder & Snyder (2008: 94) which states that a learning environment that involves being active in investigating
information and applying their knowledge improves critical thinking skills. It can be concluded that by using the learning model,
guided inquiry can further improve students' critical thinking skills.
By using LKPD based on learning models guided inquiry All thoughts and skills of students can be directed to prove the
concept of learning through a series of learning activities. This is in line with the results of Melsi's research (2018) which shows
that learning activities with the learning model guided inquiry encourage students to be more active in the learning process and
can improve understanding of material concepts by inquiry involving students in investigations (investigations), helping students
identify conceptual or methodological problems in the investigation area, and asking students to design ways to solve problems
(Kemendikbud, 2014) . Inquiry learning expects students to learn a scientist in
exploring knowledge.
Based on this background, the researcher proposed the title "Development of Student Worksheets (LKPD) Based on Learning
Models".Guided Inquiry to Improve Students' Critical Thinking Ability in Materials Cells and Plant Tissue Class XI SMA/MA”.
II. RESEARCH METHODS
This type of research is development research. The product developed is model- based LKPD guided inquiry to improve the
critical thinking skills of students of SMAN 1 IX Koto Sungai Lasi that are valid, practical, and effective. The development model
used in this study is the Plomp model, consisting of three stages, namely the initial investigation stage, the development stage or
prototyping, and the assessment stage. The subject of the experiment was carried out on 23 students of class XI MIPA I and 1
biology teacher SMAN 1 IX Koto Sungai Lasi. The types of data in this study are qualitative and quantitative data. The
instruments used in data collection were observation/ interview sheets, self-evaluation instruments, LKPD validity instruments,
LKPD practical instruments, and LKPD effectiveness instruments. The validity and practicality data analysis technique uses a
Likert scale scoring and the effectiveness uses a t-test using SPSS 2.2.
III. RESULTS AND DISCUSSION
Table 2. Results of Data Analysis of the Validity of Three Validators.
No Aspec Value % Criteria
1. Didactic 93.33 Very valid
2. Construct 82.75 Very valid
3. Technical 90.28 Very valid
Total 269.85 Very valid
Average 89.78 Very valid
Table 3. Small Group Evaluation Results.
No Aspec Value % Criteria
1. Convenience 88.89 Very Practical
2. Efficiency 85.42 Very Practical
3. Attractiveness 81.25 Very Practical
4. Easy interpreted 86.11 Very Practical
5. Own equivalence 89.58 Very Practical
Average Value Practical 86.50 Very Pracktical

“Development of Student Worksheets (LKPD) Based on Learning Models Guided Inquiry to Improve Students
Critical Thinking Ability in Materials Cells and Plant Tissue Class XI SMA/MA”
IJMRA, Volume 5 Issue 05 May 2022 www.ijmra.in Page 1093
Table 4. Practicality Assessment by Teachers.
No Aspec Value % Criteria
1. Convenience 95.83 Very Practical
2. Efficiency 100 Very Practical
3. Attractiveness 91.67 Very Practical
4. Easy interpreted 87.50 Very Practical
5. Own equivalence 87.50 Very Practical
Average Value Practical 92.50 Very Pracktical
Table 5. Results of Practical Data Analysis by Students
No Aspec Value % Criteria
1. Convenience 86.41 Very Practical
2. Efficiency 82.61 Very Practical
3. Attractiveness 81.52 Very Practical
4. Easy interpreted 81.52 Very Practical
5. Own equivalence 86.41 Very Practical
Average Value Practical 83.70 Very Pracktical
Table 6. Critical Thinking Ability Assessment Results.
Class N Xmin Xmax Mean Standar Devisiation
Experimen 25 52 96 74.43 11.984
Control 25 48 84 61.91 10.435
Table 7. Prerequisite Test Results for Normality and Homogeneity of Critical Thinking Ability
No Parameter Significance Information
1 Normality 0.200 Normal
2 Homogenity 0.576 Homogeneous
Table 8. Calculation Results of Critical Thinking Ability t-test.
Class Significance Information
Control 0.000
Ho ditolak
Eksperimen
Test the validity of the LKPD based on the learning model Guided Inquiry aims to check the suitability of KI, KD, achievement
indicators, learning objectives, suitability of image display with descriptions, and grammar in LKPD.Sugiyono (2013: 137-363)
states that validation is the degree of accuracy between data that occurs in the object of research with actual data. Based on the
LKPD validation test based on the learning model Guided Inquiry validated by three experts or experts. The developed LKPD
validation is assessed by experts or experts from 3 aspects, namely didactic aspects, construction aspects and technical aspects.
has been established. The description of the material presented has supported the achievement of indicators of competency
achievement and learning objectives, and has supported the understanding of students' concepts. This is in accordance with the
opinion of the Ministry of National Education (2008) that the preparation of materials in LKPD is very dependent on the KD to be
achieved.
In addition, this LKPD also contains steps guided inquiry that is, learning activities in LKPD consist of stages of orienting
students who are asked to listen explanation with displays a topic of learning material delivered by the teacher regarding
activities and what students will do.
Ease of using LKPD based on learning models guided inquiry has very practical criteria. This is because this LKPD is very useful
for adding insight to students, because through this LKPD it is simpler than printed books. According to Sukardi (2012),
practicality can be seen from the implementation time which should be short, fast and precise. Then, the attractiveness aspect
with very practical criteria LKPD has an attractive appearance so that the use of LKPD helps teachers and motivates students in
learning because the problems given are related to everyday life related to the topic of plant cells and tissues.

“Development of Student Worksheets (LKPD) Based on Learning Models Guided Inquiry to Improve Students
Critical Thinking Ability in Materials Cells and Plant Tissue Class XI SMA/MA”
IJMRA, Volume 5 Issue 05 May 2022 www.ijmra.in Page 1094
The effectiveness of LKPD is seen from the students' critical thinking skills obtained after students use the LKPD in the learning
process. The results of the effectiveness assessment show that the developed worksheets are effectively used as teaching
materials in the learning process, students' critical thinking skills are assessed through daily tests of cell and tissue material.
The instrument used is in the form of questions essay as many as 5 items, Testing the effectiveness of the LKPD was carried
out using the t-test, because the data were normally distributed and homogeneous. Based on the t- test, the results obtained
that the hypothesis is accepted. Therefore, it can be concluded that the use of LKPD based on the learning model Guided Inquiry
on plant cell and tissue material that can effectively be used for learning On Guided Inquiry The teacher only presents the
problems and materials needed while the students design their own steps to solve the problem. At the beginning of the inquiry,
students design their own problems to be investigated. In learning biology related to scientific work, the teacher is very
appropriate if he chooses and applies the method inquiry. The teacher uses this technique with the aim that students can be
stimulated by the task, and actively seek and research problem solving themselves. Types of learning models Guided Inquiry this
is very suitable for use.
At this stage, namely orientation, students are asked to listen to an explanation by presenting a topic of learning material
presented by the teacher regarding the activities that will be carried out by students. the material presented in the LKPD is
sourced from books and journals related to cell and tissue material.
In the next stage of formulating it she problem, at this stage, students are asked to formulate problems from the discourse
that has been provided, it is hoped that later students can formulate problems properly and correctly. The problems presented
raise the curiosity of students in learning. Students must be able to identify problems and make problem formulations from the
discourse that has been given. This will stimulate the ability to think critically, logically, and systematically. The activity of
formulating problems is also an important basis in the stages of guided inquiry. Based on the validity test, the three validators
stated that the LKPD was based on the learning model Guided Inquiry which has been designed is included in the very valid
category with a validity value of 89.78%.
LKPD based on learning model Guided Inquiry declared very valid because it has fulfilled four didactic, construct, technical,
and language aspects, in terms of didactic aspects, LKPD based on learning models Guided Inquiry has been declared very valid
by the validator with a value of 93.33%. This LKPD is in accordance with the applicable 2013 curriculum and can be used in the
learning process. This LKPD has also been.
The results at the time of the study found differences in critical thinking skills in the treatment of the experimental class using
LKPD based on the learning model Guided Inquiry. While in the control class using LKPD which is commonly used by teachers in
learning. This is because the LKPD developed by the researcher has a learning model stage Guided Inquiry which can improve
students' critical thinking skills. This is in line with Synder & Snyder (2008: 94) which states that a learning environment that
involves being active in investigating information and applying knowledge they Upgrade critical thinking skills.
According to National Research Council disclose inquiry is a multiphase activity that involves making observations; asking
question; check books and other sources of information to see what is already known; investigative planning; review what is
already known in the light of experimental evidence; collect data, analyze, and interpret data; propose answers, explanations,
and predictions; and communicate the results. Inquiry requires identification of assumptions, use of critical and logical thinking,
and judgment alternative explanation.
According to Yamin (2012), critical thinking is a problem-solving ability that requires students to connect ideas that were
previously studied for problem solving. At this stage students work (not just sit, listen and write) to find answers to the problems
raised by the teacher under the incentive guidance of the teacher, then they are guided to find the best way to solve the
problem.
The next stage is to propose a hypothesis at this stage students are asked to submit a hypothesis (answer temporary) from
the formulation of the problem under study. Then students are asked to provide correct and accountable temporary answers.
Then the next stage is the stage of collecting data at this stage students are asked to conduct a reference study to examine
the hypothesis that has been put forward. At this stage, students can see internet media or material topics that have been
provided.
The next activity is the stage of testing the hypothesis at this stage students are asked to carry out experimental activities to
prove the hypothesis that has been proposed. The most important thing in testing the hypothesis is to find the level of
confidence students on the answers to the hypotheses they have formulated. This means that the truth of the answers given is
not only based on arguments, but must be supported by data found and can be accounted for.

“Development of Student Worksheets (LKPD) Based on Learning Models Guided Inquiry to Improve Students
Critical Thinking Ability in Materials Cells and Plant Tissue Class XI SMA/MA”
IJMRA, Volume 5 Issue 05 May 2022 www.ijmra.in Page 1095
Furthermore, the activities of the last stage of Guided Inquiry is to formulate Conclusions after carrying out experimental
activities at the stage of testing the hypothesis, students are asked to make conclusions based on the observations that have
been made. Ask students to present in front of the class and be able to take responsibility for what has been done.
IV. CONCLUSION
Based on the development and trial of LKPD based on learning models Guided Inquiry on the material of plant cells and tissues
to improve the thinking skills of class XI students of SMAN 1 IX Koto Sungai Lasi, it was concluded that the results of the validity
and practicality tests met the very valid criteria. The results of the effectiveness test have effective criteria.
REFERENCES
1) Ministry of National Education. 2008. Development Guide Teaching materials. Jakarta: Directorate General of Primary
and Secondary Education Management
2) Fisher, A. 2011. Critical Thinking: An Introduction. London: Cambridge University Press
3) Ministry of Education and Culture, 2014. Teacher Training Materials Implementation of the 2013 Academic Year
4) Kuhlthau, CC, Maniotes, LK and Caspari, AK 2007.Guided Inquiry: Learning in the 21st Century.Westport, Connecticut:
Libraries.
5) Latifa, BRA 2017. Effect of Model Learning Cycle 5E (Engage, Explore, Explain, Elaborate, Evaluate) on the Critical
Thinking Ability of Class X Students of MAN 1 Mataram. Journal of Physics and Technology Education. 3(1): 61-68.
6) Marjono, Sudarisman, S, & Hapsari, DP2012.The Influence of Guided Inquiry Model With Diagram V (Vee) in Biology
Learning on Critical Thinking Ability and Learning Out comes Student. Education Biology. Vol.4(3): 16-28
7) Pandey1, A. Nanda, G. K. Rajan V. 2011. Effectiveness of inquiry training model over conventional teaching method on
academic achievement of science students in India. Journal of innovative research in education,Vol.1 No.1.
8) Prastowo, A. 2010. Creative Guided to Making Innovative Teaching Materials. Yogyakarta: Diva Press.
9) Snyder, L. G & Snyder, M. J 2008. Teaching Critical Thinking and Problem- Solving Skills. The Delta Pi Epsilon Journal. 1(2),
Spring/Summer, 2008: 90-99.
10) Sugiyono. 2013. Method Study Education: Quantitative, qualitative and R&D. Bandung: Afabeta
11) Hard. 2012. Priciples of educational Evaluation and Operations. Yogyakarta: Earth Literacy.
12) Trianto. 2019. Integrated Learning Model. Jakarta: Earth Literacy.
13) Wenning, Cj. 2011. The Levels of Inquiry Models of Science Teaching. Journal of Physics Teacher Education, Vol. 6 No.2.
14) Yamin, M. 2012. New Design of Learning Constructivist. Jakarta: Reference.
There is an Open Access article, distributed under the term of the Creative Commons Attribution – Non Commercial 4.0 International (CC BY-NC 4.0) (https://creativecommons.org/licenses/by-nc/4.0/), which permits remixing, adapting and building upon the work for non-commercial use, provided the original work is properly cited.

INTERNATIONAL JOURNAL OF MULTIDISCIPLINARY RESEARCH AND ANALYSIS
ISSN(print): 2643-9840, ISSN(online): 2643-9875
Volume 05 Issue 05 May 2022
DOI: 10.47191/ijmra/v5-i5-28, Impact Factor: 6.261
Page No. 1096-1100
IJMRA, Volume 5 Issue 05 May 2022 www.ijmra.in Page 1096
Teachers’ Use 0f Higher-Order Cognitive Skills, Instructional Skills
in Online Science Teaching and Students’ Achievement in
Elementary Science
Remilyn Nacario-Arce
Doctor of Philosophy major in Educational Management, University of Perpetual Help System Laguna
ABSTRACT: This descriptive-correlational study investigated the relationship between the teachers’ use of higher-order cognitive
skills, instructional skills in online science teaching and academic achievement of students in elementary science. The respondents
of the study were 91 elementary science teachers who were randomly sampled from the 117 Grade 3-6 elementary science
teachers of DepEd Division of the City of Sta. Rosa. The research instrument was validated by experts in the field and its internal
consistency reliability was ascertained using Cronbach Alpha.
The findings revealed that the teachers always used higher order cognitive skills in online science teaching (WM=3.28).
They had very high level of instructional skills in online science teaching (WM=3.42.). Sixty-five (65) or 71.43 percent of the
elementary science teachers reported an aggregated GPA of 85 to 89 for their classes; 18 or 19.78 percent had 80 to 84; and 8 or
8.79 percent got 90 to 94. There were no significant relationships between the respondents’ frequency of use of higher-order
cognitive skills in online science teaching and the students’ academic achievement in elementary science (p>0.05); and between
the respondents’ level of instructional skills in online science teaching and the students’ academic achievement in elementary
science(p>0.05). It was concluded in the study that the teachers’ use of higher order teaching skills in online science teaching and
their instructional skills have no bearing on the academic achievement of the students. A study on the correlation between higher-
order skills of students and their academic achievement in elementary science may be conducted to verify this study’s findings
and confirm the other studies’ findings.
KEYWORDS: Higher-Order Cognitive Skills, Instructional Skill, Online, Science Teaching , Students achievement
INTRODUCTION
The Science Framework for Philippine Basic Education (2011) emphasizes the importance of science as a link between technology
and industry which are areas of high priority for national development. Science enables one to view the world systematically. It
can develop students’ scientific inquiry skills, values and attitudes which are essential for his own personal and professional
development, and life in general. Thus, science education is important in all schools.
Research have shown the interrelationship of the use of higher order thinking skills, and instructional skills and their impact on
the academic achievement of students in science. For instance, Astutik et al. (2018) found out that students who struggle in
analyzing, solving, and writing investigative reports have low academic performance and needs to be exposed to higher order
thinking skills. Afifah and Retnawati (2019) proved that even educators struggle in teaching higher order cognitive processes due
to lack of knowledge in constructing higher order thinking skills (HOTS) problems and lack of experience in utilizing suitable
learning media.
While several studies provided a room for science teachers to enhance their quality of learning and nurturing higher order thinking
skills to students, little research has been done to thoroughly determine ways in improving it. In particular, in the DepEd City
Division of Sta. Rosa no study has been conducted evaluating the use of higher-order cognitive skills or higher-order thinking skills
(HOTS) in science teaching, instructional skills and academic achievement in science of elementary students.
Thus, this study attempted to investigate the teachers’ use of higher-order cognitive skills or the HOTS, instructional skills in online
science teaching and academic achievement of students in elementary science. It probed relationship between the teachers’
frequency of use of higher-order cognitive skills in online science teaching and students’ academic achievement in elementary

Teachers’ Use 0f Higher-Order Cognitive Skills, Instructional Skills in Online Science Teaching and Students’
Achievement in Elementary Science
IJMRA, Volume 5 Issue 05 May 2022 www.ijmra.in Page 1097
science; and between teachers’ instructional skills in online science teaching and students’ academic achievement in elementary
science.
METHODOLOGY
This study on teachers’ frequency of use of higher-order cognitive skills, instructional skills in online elementary science teaching
and academic achievement of students in elementary science employed the descriptive-correlational research design
Correlational research design measures a relationship between two variables without the researcher controlling either of them.
The study engaged the participation of the elementary science teachers of DepEd Division of the City of Sta. Rosa, who comprised
the sample respondents in this study, as the primary sources of data. Secondary sources of data for the GPA were the teachers’
electronic class records.
The population of this study consisted of 117 elementary science teachers who taught online during this pandemic in seventeen
(17) elementary schools in the DepEd Division of the City of Sta. Rosa. Using the Slovin’s formula, a sample size of 91 was
considered in this study. Actual selection of the respondents was done using stratified random sampling. This descriptive-
correlational study had 88 respondents who were randomly sampled from the Grade 3-6 elementary science teachers of DepEd
Division of the City of Sta. Rosa.
A researcher-made questionnaire was constructed for the purpose of generating the needed primary data. Part I covered the
frequency of use of higher-order cognitive skills in online science teaching; Part II dealt on the teachers’ instructional skills in online
science teaching; and Part III focused on the students’ academic achievement in elementary science.
RESULTS AND DISCUSSIONS
Based on the data gathered, analyzed and interpreted, the salient findings of the study are the following:
1. The respondents ‘always’ used higher order cognitive skills in online science teaching with an overall weighted mean of 3.31
along analyzing, evaluating and creating. They ‘always’ asked their students to do the process of evaluating with an average
weighted mean of 3.40 (Rank 1); to do the method of analyzing with an average weighted mean of 3.36 (Rank 2); and to do
the task of creating with an average weighted mean of 3.16 (Rank 3).
2. The teacher-respondents’ level of instructional skills in online science teaching was ‘very high’ with an average weighted
mean of 3.42.
3. Sixty-five (65) or 71.43 percent of the elementary science teachers reported an aggregated GPA of 85 to 89 for their classes;
18 or 19.78 percent had 80 to 84; and 8 or 8.79 percent got 90 to 94.
4. There was no significant relationship between the respondents’ frequency of use of higher-order cognitive skills in online
science teaching and the students’ academic achievement in elementary science as shown by the Pearson r values of -0.066,
-0.060 and 0.119 for analyzing, evaluating and creating, respectively and the computed p-values which were higher than
0.05 level of significance for analyzing (p=0.531> 0.05), evaluating (p=0.574> 0.05) and creating (p=0.260> 0.05).
5. No significant relationship was noted between the respondents’ level of instructional skills in online science teaching and
the students’ academic achievement in elementary science as shown by the Pearson r value of 0.014 (negligible correlation)
and the computed p-value of 0.894 which was higher than 0.05 level of significance.
The conclusions drawn from the findings of the study:
1. The teacher-respondents continually promote to the students the use higher order cognitive skills in science learning to
help them solve problems efficiently by anticipating connections between different ideas. They recognize the fact that for
high-ability students, there is always more to learn.
2. The elementary science teachers are highly proficient and technically adept in techno-pedagogy, which consists of
content, pedagogy and technology within the context of online teaching amid the pandemic.
3. The academic achievement of the students in elementary science is above-average.
4. The academic performance of the students in elementary science is not directly dependent on the teachers’ frequency of
use of higher-order cognitive skills in online science teaching. The teachers’ use of higher-order cognitive skills in science
teaching could lead to the development of the higher-order thinking skills of the students, which in turn, can influence
student academic performance.
5. The students’ academic achievement is not dependent on the very high level of instructional skills of the teachers in online
science teaching.

Teachers’ Use 0f Higher-Order Cognitive Skills, Instructional Skills in Online Science Teaching and Students’
Achievement in Elementary Science
IJMRA, Volume 5 Issue 05 May 2022 www.ijmra.in Page 1098
6. An action plan is deemed important to address the issues and concerns regarding the use of HOTS in teaching science and
the development of HOTS in students.
RECOMMENDATIONS
Based on the findings and conclusions of the study, the following recommendations are hereby made:
1. The teachers may determine whether the use of higher-order thinking skills in teaching elementary science is effective in
developing higher-order thinking skills among the students by empirically ascertaining the students’ level of higher order
thinking skills.
2. A study on the lower thinking skills may be conducted to determine the status and growth of the cognitive skills of the
students before promoting higher level of thinking skills.
3. The techno-pedagogical skills of the elementary science teachers, post-pandemic, may be revisited and re-calibrated
through an in-service training in preparation for the new normal.
4. A study on the correlation between higher-order skills of students this time and their academic achievement in elementary
science may be conducted to verify this study’s findings and confirm the other studies’ findings.
5. The proposed action plan be submitted for review and subsequent implementation when deemed feasible.
6. A comparative study be conducted on limited face to face and online teaching-learning modalities is suggested.
REFERENCES
1) Adnan, M., Ahmad, A., Hua, A. K., & Ping, O. W. (2017). Effectiveness of Higher Order Thinking Skills (HOTS) Based I-Think
Map Concept towards Primary Students. AIP Conference Proceedings. 1847 (1). https://doi.org/10.1063/1.4983886.
2) Afifah, I. R. N. & Retnawati, H. (2019). Is it difficult to teach higher order thinking skills? Journal of Physics: Conference
Series.
3) Agbisit, M. J. P., Arietta, G. S., & Dancel, J. C. (2020). Teaching Science in The New Normal: Understanding the Experiences
of Junior High School Science Teachers. Jurnal Pendidikan Mipa. DOI:10.23960/jpmipa/v21i2.pp146-162
4) Ahmad, A. A. K., Halim, A. S., Ibrahim, M. F., Mohd Aziz, M. S. A., & Osman, K. (2021). The Competency of Science Teachers
in Integrating Higher Order Thinking Skills in Teaching and Learning. Journal of Physics: Conference Series.
doi:10.1088/1742-6596/1793/1/012005.
5) Ahmad, N., Gohar, S., & Shaheen, N. (2018). 5E Instructional Model: Enhancing Students Academic Achievement in the
Subject of General Science at Primary Level. Sir Syed Journal of Education & Social Research. 1 (1), 91 – 100.
6) Albrahim, F. A. (2020). Online Teaching Skills and Competencies. TOJET: The Turkish Online Journal of Educational
Technology. 19 (1), 9 – 20.
7) Alifiani, D. P., Khoerunnisa, R. S., Nuraeni, E., & Rahman, T. (2017). International Conference on Mathematics and Science
Education. doi :10.1088/1742-6596/895/1/012119.
8) Ali, G. & Nisa Awan, R. (2021). Thinking based Instructional Practices and Academic Achievement of Undergraduate
Science Students: Exploring the Role of Critical Thinking Skills and Dispositions. Journal of Innovative Sciences, 7(1), 56 -
70.
9) Almeida, L. S., Alves, A. F., Gomes, C. M. A., & Martin, A. (2017). Cognitive Performance and Academic Achievement: How
do Family and School Converge? European Journal of Education and Psychology. 10 (2), 49 – 56.
10) Anggraini, N. P., Budiyono, & Pratiwi, H. (2019). Analysis of Higher Order Thinking Skills Students at Junior High School in
Surakarta. IOP Conf. Series: Journal of Physics: Conf. Series. doi:10.1088/1742-6596/1211/1/012077
11) Astutik, S. S., Bektiarso, S., Lesmono, A. D., & Nuraini, L. (2018). What can Students show about
12) Higher Order Thinking Skills in Physics Learning? IOP Conference Series: Earth and Environmental Science.
doi:10.1088/1755-1315/243/1/012127
13) Batlolona, J. R., Corebima, A. D., Leasa, M., & Tuaputty, H. (2021). The Correlation between Critical Thinking Skills and
Cognitive Learning Outcomes. Ilkogretim Online - Elementary Education Online. 20 (1), 302 – 317.
14) Biñas, E. E. & Elesan, J. D. (2021). Learned Skills and Cognition in Science Subject of Grade 8 Students: Input to Skills
Enhancement Strategies and Programs. European Journal of Humanities and Educational Advancements (EJHEA), 2 (1),
54 – 63.
15) Carter, K. C. (2020). STEM Education in the Elementary School Classroom. (Master’s Thesis). Dominican University of
California. https://doi.org/10.33015/dominican.edu/2020.EDU.

Teachers’ Use 0f Higher-Order Cognitive Skills, Instructional Skills in Online Science Teaching and Students’
Achievement in Elementary Science
IJMRA, Volume 5 Issue 05 May 2022 www.ijmra.in Page 1099
16) Cairns, D. (2019). Investigating The Relationship Between Instructional Practices and Science Achievement in an Inquiry-
Based Learning Environment. International Journal of Science Education. 41 (15), 2113 – 2135.
17) Cetin, A. & Ozdemir, O. F. (2018). Mode-Method Interaction: The Role of Teaching Methods on The Effect of Instructional
Modes on Achievements, Science Process Skills, and Attitudes Towards Physics. EURASIA Journal of Mathematics, Science
and Technology Education, 14 (5) 1815 – 1826.
18) Chiang, P. J., Lin, Y. W., & Tseng, C. L. (2016). The Effect of Blended Learning in Mathematics Course. EURASIA Journal of
Mathematics Science and Technology Education. 13 (3), 741 – 770.
19) Curran, F. C., Kitchin, J. (2019). Early Elementary Science Instruction: Does More Time on Science or Science Topics/Skills
Predict Science Achievement in the Early Grades? SAGE Journals. https://doi.org/10.1177/2332858419861081
20) Damahuri, A. A., Ganaprakasam, C., Nachiappan, S., & Suffian, S. (2018). Application of Higher Order Thinking Skills (Hots)
in Teaching and Learning Through Communication Component and Spiritual, Attitudes and Values Component in
Preschool. International Journal of Early Childhood Education Care. 7, 24 – 32.
21) Dowd, J. E., Reynolds, J. A., Schiff, L. A., & Thompson, R. J. (2018). Understanding the Complex Relationship between
Critical Thinking and Science Reasoning among Undergraduate Thesis Writers. CBE—Life Sciences Education. 17 (1),
22) Driana, E., Ernawati, A. S., Ghani, A. R. A., & Susilowati, A. (2021). Assessing Students' Higher-Order Thinking Skills:
Knowledge and Practices of Chemistry Teachers in Vocational Senior Secondary Schools. Jurnal Pendidikan Teknologi dan
Kejuruan. 27 (1), 37 – 47.
23) Education Development Center. (2018). Reigniting Elementary Science Education. Retrieved from
https://www.edc.org/reigniting-elementary-science-education.
24) Firdaus, A. R. & Rahayu, G. D. S. (2019). Effect of STEM-based Learning on the Cognitive Skills Improvement. Mimbar
Sekolah Dasar. 6 (2), 198 – 207.
25) Fitriani, A. (2020). The Correlation between Critical Thinking Skills and Academic Achievement in Biology through Problem
Based Learning-Predict Observe Explain (PBLPOE). International Journal of Learning and Teaching. 6 (3), 170 – 176.
26) Gomez, R. L. & Suarez, A. M. (2020). Do Inquiry-Based Teaching and School Climate Influence Science Achievement and
Critical Thinking? Evidence From Pisa 2015. International Journal of STEM Education. 7 (43).
27) Hasana, U. & Shimizu, K. (2020). Crucial Cognitive Skills in Science Education: A Systematic Review. Jurnal Penelitian dan
Pembelajaran IPA JPPI, 6 (1), 36 – 72.
28) Jatmiko, B., Sartika, S. B., & Susantini, E. (2019). Analytical Thinking Skills Through The 4A
29) Learning Models on Science Education. International Journal of Scientific and Research Publications, 9 (8), 209 – 213.
30) Kang, H. T. & Noh, S. G. (2017). The Effect on Elementary Science Education Based on Student’s Pre-inquiry. Universal
Journal of Educational Research, 5 (9), 1510-1518
31) Kacan, S. D. & Sahin, F. (2018). The Impact of Scientific Creative Thinking Skills on Scientific Process Skills. SHS Web of
Conferences. https://doi.org/10.1051/shsconf/20184801060.
32) Kamp, L. (2021). How to teach Science in a Virtual Classroom. Around the Kampfire.
33) Limueco, J. & Prudente, M. (2018). Predicting Progression Trends of Scientific Reasoning Skills and Metacognitive
Awareness among Secondary Level Students. https://www.dlsu.edu.ph/wp-content/uploads/pdf/conferences/research-
congress-proceedings/2018/lli-14.pdf.
34) Malyk, A., Malyk, S., & Tikhomirova, T. (2020). Predicting Academic Achievement with Cognitive Abilities: Cross-Sectional
Study across School Education. Behavioral Science. 10 (158), 1 – 13.
35) Maranan, V. M. (2017). Basic Process Skills and Attitude toward Science: Inputs to an Enhanced Students’ Cognitive
Performance. (Master’s Thesis). Laguna State Polytechnic University. Retrieved from
https://files.eric.ed.gov/fulltext/ED579181.pdf.
36) Marcos, M. C., Pascual, L., Subia, G., & Tomas, A. V. (2020). Cognitive Levels as Measure of Higher-Order Thinking Skills in
Senior High School Mathematics of Science, Technology, Engineering and Mathematics (STEM) Graduates. Technology
Reports of Kansai University, 62 (3), 261 - 268.
37) Pratama, G. S. & Retnawati, H. (2018). Urgency of Higher Order Thinking Skills (HOTS) Content Analysis in Mathematics
Textbook. Journal of Physics
38) Peng, Y. (2019). Effects of Creativity Instruction in Science on Creativity Instruction in Science on Creative Thinking e
Thinking and Science Achievement in Chinese Students. (Master’s Thesis). University of Nevada, Las Vegas.
39) Rajendran, N. S., (2008) Teaching & Acquiring Higher-Order Thinking Skills: Theory & Practice. Tanjong Malim Penerbit
Universiti Pendidikan Sultan Idris.

Teachers’ Use 0f Higher-Order Cognitive Skills, Instructional Skills in Online Science Teaching and Students’
Achievement in Elementary Science
IJMRA, Volume 5 Issue 05 May 2022 www.ijmra.in Page 1100
40) Sensoy, O. & Yildirim, H. I. (2018). Effect of Science Teaching Enriched with Technological Practices on Attitudes of
Secondary School 7th Grade Students towards Science Course. Universal Journal of Educational Research 6 (5), 947 – 959.
DOI: 10.13189/ujer.2018.060516.
41) Stephenson, R. L. (2017). Elementary Teachers' Perceptions of Teaching Science to Improve Student Content Knowledge.
(Doctoral Dissertation). Walden University. Retrieved from https://scholarworks.waldenu.edu/dissertations/3840/.
42) Sutton, S. (2020). Adapting Science Lessons for Distance Learning. Edutopia. Retrieved from
https://www.edutopia.org/article/adapting-science-lessons-distance-learning.
43) Sparks, S. D. (2021). Science Teaching and Learning Found to Fall Off in Pandemic. Education Week.
44) Sydoruk, P. D. (2018). An Analysis of the Higher Order Thinking Requirements of a Grade 8 Online-Based English Language
Arts Skills Program. (Doctoral Dissertation). Selton Hall University. Retrieved from
https://core.ac.uk/download/pdf/159478812.pdf/.
45) Yang, D. (2017). Instructional strategies and course design for teaching statistics online: perspectives from online
students. International Journal of STEM Education. Retrieved from
https://stemeducationjournal.springeropen.com/articles/10.1186/s40594-017-0096-x.
There is an Open Access article, distributed under the term of the Creative Commons Attribution – Non Commercial 4.0 International (CC BY-NC 4.0) (https://creativecommons.org/licenses/by-nc/4.0/), which permits remixing, adapting and building upon the work for non-commercial use, provided the original work is properly cited.

INTERNATIONAL JOURNAL OF MULTIDISCIPLINARY RESEARCH AND ANALYSIS
ISSN(print): 2643-9840, ISSN(online): 2643-9875
Volume 05 Issue 05 May 2022
DOI: 10.47191/ijmra/v5-i5-29, Impact Factor: 6.261
Page No. 1101-1106
IJMRA, Volume 5 Issue 05 May 2022 www.ijmra.in Page 1101
Biology Practicum Guides Problem Based Learning-Based to
Improve Critical Thinking Skills for Class XI Students of SMA
Widia Rahayu Safitri 1, Yuni Ahda 2 1Master Degree Program of Biology Education, Faculty of Mathematics and Sciences, Padang State University, Jl. Prof. Dr. West
Padang Freshwater Hamka - 25131 Indonesia 2Lecturer of Biology Department, Faculty of Mathematics and Sciences, Padang State University, Jl. Prof. Dr. West Freshwater
Hamka Padang–25131, Indonesia
ABSTRACT: This study aims to design, design and develop a learning intervention.-based Practicum Guide problem-based
learning to improve the critical thinking skills of class XI SMA students that are valid, practical, and effective. The instrument
used was a validity questionnaire and a practicality questionnaire as well as a matter of effectiveness. The validity and
practicality data analysis technique uses a Likert scale scoring and the effectiveness uses a t-test using SPSS 2.2. Based on the
development and trial of problem-based learning to improve the thinking skills of students in class XI SMA, it was concluded that
the results of the validity and practicality tests met the very valid criteria. The results of the effectiveness test have effective
criteria.
KEYWORDS: problem based learning, practical guide, development, critical thinking.
I. INTRODUCTION
Education intends to develop the potential of students into quality human resources. The quality resources in question are
human beings who believe and are devoted to God Almighty, have noble character, are healthy, knowledgeable, capable,
creative, independent, able to compete and become democratic and responsible citizens. In order to achieve this goal, the
government has attempted through the establishment of various regulations to ensure that every citizen gets a quality
education (Hermawati, 2012). According to Salamah (2019) that the quality of education can be seen from the quality of
education that produces quality, productive, and competitive human resources (HR). One of the efforts to improve the quality of
education is to make various innovations in the curriculum. One of the innovations currently being carried out is to include life
skills education, namely life skills, soft skills and character education (Setyawati, 2013). The three educations are required to be
able to develop higher-order thinking skills, one of which is critical thinking skills. According to Sudarma (2013), basically humans
are creatures who can create creativity and are able to think critically in producing something innovative. These abilities must
be supported by characters who are able to create innovations themselves so that critical thinking skills are very important to be
raised in every individual, especially students. According to Liliasari (2011), "The ability to think which is the basis of other
thinking skills is the ability to think critically". Critical thinking skills affect the formation of students' scientific work.
Scientific work is an activity that emphasizes the scientific approach or method (Razi, 2013). According to Colburn (2000),
scientific work-based learning is learning where students are involved in open problems, are student centered and involve
hands-on. According to Subagyo, et al (2009), the learning process using scientific work can familiarize scientific behavior like
scientists in finding concepts. In biology learning, scientific work can be integrated into learning tools, one of which is a
practicum guide.
According to Killinct (2007), a practicum guide is a practicum facility that helps practitioners in carrying out practicum activity.
Biology practicum activities have been formulated in the basic competencies of the 2013 curriculum in accordance with the
Ministry of National Education No. 69 of 2013 concerning the basic framework and structure of the SMA/MA curriculum, so that
teachers are required to carry out practical activities in order to achieve the expected learning objectives. Through practicum,
students can be actively involved in observing, observing, hypothesizing, analyzing and drawing conclusions, so that students can
correlate the theory and the results they get.

“Biology Practicum Guides Problem Based Learning-Based to Improve Critical Thinking Skills for Class XI Students of SMA”
IJMRA, Volume 5 Issue 05 May 2022 www.ijmra.in Page 1102
Based on the results of critical thinking questions to students on the circulation system material at SMA Pertiwi 1 Padang, in
October 2021 by giving essay by researchers to students, students' critical thinking skills were obtained with an average value of
55.8%. This figure, according to Maulana (2017), shows that the critical thinking skills of students at SMA Pertiwi 1 Padang are
categorized as less critical.
Based on the results of interviews with the biology teacher of SMA Pertiwi 1 Padang, namely Mrs. Widya Aziz, S.Pd, M.Sc. in
November 2021, it was discovered that practicum activities in schools were still using practicum instructions obtained from
biology textbooks and LKPD (student worksheets) which are commonly used in the classroom learning process. The teacher
usually duplicates the LKPD personally which is then distributed to students. The practical instructions listed in the package book
and LKPD only contain a brief explanation, namely indicators, brief material and discussion columns. In the practical instructions
there are no tools and materials and work procedures that should be in the components of the practicum guide, tools and
materials and work procedures are only demonstrated in front of the class by the teacher. The practicum instructions used have
not applied the approach or learning model and have not been able to develop the ability to think systematically, critically,
logically, and analytically. In the practicum instructions there are only ordinary concept understanding questions, so that
students only get the ability to memorize and remember levels.
Based on the results of the researcher's analysis of the questionnaire on the problems of biology practicum activities at
Pertiwi 1 Padang High School which was filled out by 30 students, several problems were found regarding the implementation of
practical activities which can be explained as follows. First, in the implementation of practicum, students tend to be passive and
not fully involved. The results of the questionnaire show that only 26% of students are active in practicum activities. Second, the
practicum guide emphasizes more on the results than on the process. This is due to the practicum guide used in the form of
LKPD which does not meet the components of a practicum guide. The practical instructions listed on the LKPD only contain a
brief explanation, namely indicators, brief material and discussion columns. In the practicum manual, there are no tools and
materials and work procedures that should be included in the practicum guide component. According to Arifin (1995), the
practicum components include 1) practicum title, 2) practicum objectives, 3) theoretical basis, (4) tools and materials, (5)
working methods, (6) questions. The LKPD does not yet have an approach and has not facilitated students in working
scientifically so that during practicum activities students cannot solve a problem in practicum activities and only focus on results.
The results of the questionnaire show that 72% of students have not been able to solve a problem in practical activities. Third,
students are less interested in the appearance of the practicum guide. The results of the questionnaire showed that 73% of
students stated that the practicum guide did not have an attractive color combination and 77% of the students stated that the
practicum guide did not have pictures that supported the material being practiced.
Based on this, it is necessary to have a practical guide that can facilitate students in gaining understanding and scientific work
skills and able to improve the ability of students to solve a problem in learning. Efforts that can be made to improve students'
critical thinking skills are through practicum activities supported by a practicum guide with a problem-based learning
model.learning model is one of the learning models used to improve students' higher-order thinking in real-world situations
(Rusman, 2012). Arends (2008) states that the essence of the problem-based learning model is to present a variety of authentic
and meaningful problem situations to students, which can serve as a springboard for investigations and investigations, meaning
that problem-based learning teaches students to start learning activities with a specific problem. must be solved so as to
produce new knowledge. Problem-based learning models are suitable for use in biology learning, because problem-based
learning models can increase students' understanding of what they are learning so that it is hoped that they can apply it in real
conditions in everyday life and can improve students' critical thinking skills in solving problems. which is more complex.
According to the Ministry of Education and Culture (2016) that in the 21st century students must be able to develop Higher
Order Thinking Skills (HOTS). Students' critical thinking skills must be developed to analyze, evaluate and draw conclusions in
solving a problem. The results of the PISA (The Program For International Student Assessment) analysis from year to year show
that the critical thinking skills of Indonesian students have not increased significantly. This can be proven, especially science
material in 2012 which was ranked 65 out of 69 countries with a score of 382, while in 2015 it was ranked 62 out of 69 countries
with a score of 403 from the international average score of 500 (Organization for Economic Cooperation and Development),
2015). The results of the PISA analysis are also in line with the learning outcomes of students at school.
Research conducted by Salmeri (2018) entitled, “Development of a Problem Based Learning to improve critical thinking skills
of Bengkulu City Senior High School students. The results obtained from this study indicate that the Biology practicum guide
based on Problem Based Learning has been said to be valid, practical and effective.-based Biology Practicum Guide Problem
Based Learning that was developed has an effect on increasing students' critical thinking skills. based practicum guide is The
Problem-Based Learning- expected to stimulate students to think critically to understand biological material and solve the

“Biology Practicum Guides Problem Based Learning-Based to Improve Critical Thinking Skills for Class XI Students of SMA”
IJMRA, Volume 5 Issue 05 May 2022 www.ijmra.in Page 1103
problems contained in it so that learning can be student-centered. The current generation is very sensitive to technology,
meaning that they have the advantage of being able to use technology to develop knowledge. This great potential should be
utilized optimally by teachers so that learning can be carried out in a directed and effective manner, such as by presenting
teaching materials in the form of Problem-Based Learning- order to achieve the objectives of the learning itself.
The practicum guide developed contains three basic competencies, namely the material on the motion system is KD 3.5,
namely Analyzing the relationship between the structure of the organ making up the organ network in the motion system and
linking it to the bioprocess so that it can explain the mechanism of motion and functional disorders that may occur in the human
movement system through literature studies, Observations, experiments, and simulations, the material about the circulatory
system is KD 3.6 Analyzing the relationship between the structure of the tissues making up organs in the circulatory system in
relation to bioprocesses and functional disorders that can occur in the human circulatory system and material about the
digestive system is KD 3.7 Analyzing the relationship between the structure tissues that make up organs in the digestive system
in relation to nutrition, bioprocesses and functional disturbances that can occur in the human digestive system.
Based on this background, the researchers conducted research on the development of a practicum guide with the title
"Development of Problem Based Learning to Improve Critical Thinking Skills for Class XI High School Students".
II. RESEARCH METHODS
Type of research is development research. The product developed is problem-based learning to improve the critical thinking
skills of class XI high school students that are valid, practical, and effective. The development model used in this study is the
Plomp model, consisting of three stages, namely the initial investigation stage, the development stage or prototyping, and the
assessment stage. The subjects of the experiment were 30 students of class XI MIPA 2 and 1 biology teacher at SMA Pertiwi 1
Padang. The types of data in this study are qualitative and quantitative data. The instruments used in data collection were
observation/interview sheets, self-evaluation instruments, the validity instruments of the Practicum Guide, the practicality
instruments of the Practicum Guide, and the effectiveness of the Practicum Guide instruments. The validity and practicality data
analysis technique uses a Likert scale scoring and the effectiveness uses a t-test using SPSS 2.2.
III. RESULTS AND DISCUSSION
Table 1. Results of Data Analysis Validation of Three Validators
No Aspect Value (%) Criteria
1. Didactic 91.67% Very Valid
2. Construct 88.09% Very Valid
3. Technical 88.09% Very Valid
Average - Average 89.28% Very Valid
Table 2. Small Group Evaluation Results.
No Aspect Value (%) Criteria
1. Ease of Use 95.83% Very practical
2. Efficiency of use 91.67% Very practical
3. Attractiveness 93.75% Very practical
4. Easy to interpret 87.5% Very practical
5. Has equivalent 85.41% Very practical
Average Practicality 89.28% Very practical

“Biology Practicum Guides Problem Based Learning-Based to Improve Critical Thinking Skills for Class XI Students of SMA”
IJMRA, Volume 5 Issue 05 May 2022 www.ijmra.in Page 1104
Table 3. Practicality Assessment by Teachers.
No Aspect Value (%) Criteria
1. Ease of Use 95.83% Very practical
2. Efficiency of use 100% Very practical
3. Attractiveness 91.67% Very practical
4. Easy to interpret 87.5% Very practical
5. Has equivalent 87.5% Very practical
Average Practicality Value 92.5% Very practical
Table 4. Results of Practical Data Analysis by Students.
No Aspect Value (%) Criteria
1. Ease of Use 89.58% Very practical
2. Efficiency of Use 87.5% Very practical
3. Attractiveness 86.67% Very practical
4. Easy to interpret 88.8% Very practical
5. Has equivalent 87.5% Verypractical
Average Practicality 88.02% Very practical
Table 5. Critical Thinking Ability Assessment Results.
Class N Xmin Xmax Mean Standard deviation
of Experiment 30 60 90 78.00 7.086
Control 30 48 78 61.60 7.509
Table 6. Prerequisite Test Results for Normality and Homogeneity of Critical Thinking Ability.
No. Parameter Significance Description
1. Normality 0.200 Normal
2. Homogeneity 0.791 Homogeneous
Table 7. Calculation Results of Critical Thinking Ability t-test.
Class Significance Conclusion
Control 0.000 H0 rejected
Experiment The

“Biology Practicum Guides Problem Based Learning-Based to Improve Critical Thinking Skills for Class XI Students of SMA”
IJMRA, Volume 5 Issue 05 May 2022 www.ijmra.in Page 1105
Practical guide before being used is validated first to be validated by experts. This is in accordance with Yusuf (2007)'s
statement that validation is carried out with the help of experts in accordance with competence in their fields. The validator
carefully rereads the contents of the practicum guide, checking whether the description of the practicum guide is in accordance
with the rules for compiling the practicum guide. The higher the validity of a product, the better the conclusions drawn and the
better the level of meaning and usefulness. This is supported by research conducted by Afriadi et al., (2013), a product that is
very valid shows the suitability, significance, and usability of the product.
The validity of the practicum guide was assessed by three validators. Analysis of the data from the validity assessment sheet
of the practicum guide that was developed in terms of didactic aspects, construct aspects, and technical aspects. If the data
generated from a product is valid, it can be said that the product developed has provided an overview of the development goals
correctly and in accordance with the reality and actual conditions (Arikunto, 2013). The results of the validation data analysis of
the practicum guide show that the developed practicum guide has a validity value of 89.28% with very valid criteria.
Based practicum guide problem-based learning on the material of the motion system, circulation system and digestive system
is related to the ease of practicum guidance by teachers and students in learning.-based practicum guide problem-based
learning on the material of the motion system, circulation system and digestive system is carried out in stages. The first
assessment is carried out on a small group or small group. Students are selected based on high, medium and low ability levels.
Each level of ability consists of two students, so the total number of students in the small group test is six people. based
practicum guide problem-based learning starts from the assessment of 6 students in the small group getting an average score of
90.83% with the criteria of "very practical". Furthermore, the assessment of the practicality of problem-based learning on the
field test test by 30 students got an average score of 88.02% with the criteria "very practical" and the assessment from the
biology teacher got an average score of 92.5% in the "very practical" category. The practicum guide that has been developed
provides convenience in terms of use, both in presenting material using language that is easy to understand and also in clear
font sizes.
The effectiveness of the practicum guide can be seen from the students' critical thinking skills obtained after students use the
practicum guide in the learning process. The results of the assessment of the effectiveness of the developed practicum guide are
effectively used as teaching materials in the learning process. Students' critical thinking skills are assessed through daily tests of
the movement system, circulation system and digestive system. The instrument used in the form of essay as many as 10 items.
Testing the effectiveness of the practicum guide was carried out using the t-test, because the data were normally distributed
and homogeneous. Based on the t-test, the results obtained that the hypothesis is accepted. Therefore, it can be concluded that
the use of problem-based learning on the material of the motion system, circulation system and digestive system is effectively
used for learning.
Teachers participate in building students' understanding.
Teacher participation, for example, presents problems from the material studied in a problem-based learning. According to
Strobel and Barneveld (2009) Problem Based Learning is student-centered learning, where students get solutions to the
problems they face and build their own knowledge.
Learning model Problem Based Learning improves students' critical thinking skills about a given problem. According to
Yulianti, et al., (2018) Problem Based Learning can develop students' critical thinking skills to become people who are able to
make their own decisions to make decisions and solve problems. According to Nasution (2008) thinking skills are a means to
achieve educational goals so that students are able to solve problems at a higher level.
At the stage of problem orientation, students can analyze the information presented. The problems presented in the
practicum guide in the form of discourse are sourced from news and journals related to the material of the motion system,
circulation system and digestive system. The problems given in the practicum guide aim to arouse the curiosity of students by
connecting theory with everyday life. Students are required to determine problem identification and formulate problems at the
problem orientation stage.
The next stage is to develop and implement a plan. This stage is carried out so that students conduct a literature study to
answer the formulation of the problem that has been made. Students think in groups to relate the problem to the practicum
guide by conducting a literature study so that the problem can be solved optimally.
Then the stage of determining the solution, students present the results of the discussion by presenting in front of the class.
At this stage, group discussions are carried out. At this stage, students are also trained to be responsible for answering problems
in the practicum guide during the discussion. The courage possessed by students to express opinions requires students to make
presentations in front of the class.

“Biology Practicum Guides Problem Based Learning-Based to Improve Critical Thinking Skills for Class XI Students of SMA”
IJMRA, Volume 5 Issue 05 May 2022 www.ijmra.in Page 1106
The last stage is evaluation, students assess the strengths and weaknesses of other groups and then make conclusions. The
presenter group looks for answers
from the responses that have been given by other groups. Then the teacher evaluates the results of the discussion and
together concludes the learning materials contained in the practicum guide.
IV. CONCLUSION
Based on the development and testing of Problem Based Learning to improve critical thinking skills of students in class XI SMA, it
was concluded that the results of the validity and practicality tests met the very valid criteria. The results of the effectiveness
test have effectivecriteria.
REFERENCES
1) Afriadi, R., Lufri., and Razak. A. (2013). Development of a Biology Module with Character Education on Human
Reproductive System Material for Class XI SMA. Collaborative Journal, 1(2), 19–30.
2) Arends, RI 2008. Learning To Teach. Helly Prajitno's translation. Yogyakarta: Learning Library.
3) Arikunto, S. 2013. The Basics of Educational Evaluation, Edition 2. Jakarta: Earth Literacy. Hermawati, NWM 2012. "The
Influence of Inquiry Learning Models on Mastery of Biological Concepts and Scientific Attitudes of High School Students
in View of Students' Interest in Learning". Article (4).
4) Ministry of Education and Culture. 2016. Guidelines for Assessment by Educators and Education Units for SMA.
Directorate of High School Development.
5) Liliasari. 2011. Development of Science Generic Skills to Improve Students' Critical Thinking Ability. UiTM joint-sem
papers.
6) Maulana. 2017. Basic Concepts of Mathematics and Development of Critical-Creative Thinking Skills. Bandung: UPT
Sumedang Press.
7) Nasution, (2008). Various Approaches in the Teaching and Learning Process. Jakarta: Earth Literacy.
8) Permendikbud of 2013 Number 69. Regarding the Basic Framework and Curriculum Structure of Senior High
Schools/Madrasah Aliyah.
9) Razi. 2013. "The Relationship of Motivation With Students' Scientific Work In Learning Physics Using Virtual Laboratory
In Class X SMAN Padang City". Journal of Information Technology & Education. VOL. 6, No. 2. Page 121.
10) Rusman. 2012. Learning Models to Develop Teacher Professionalism: Jakarta: Raja Grafindo Persada.
11) Salam. 2019. Improving the Quality of Education Through Qualifications and Academic Competencies. ISSN 2580 – 3387.
12) Subagyo, Y., Wiyanto, Marwoto, P. 2009. "Learning With Science Process Skills Approach To Improve Mastery Of The
Concept Of Temperature And Expansion". Indonesian journal of physics education, 5(1): 42-46.
13) Sudarma, Momon. 2013. Developing Skills/Creative Thinking. Jakarta: Raja Grafindo Persada.
14) Yuliati, L., Fauziah, R., & Hidayat, A. (2018). Student's Critical Thinking Skills in Authentic Problem Based Learning. Journal
of Physics: Conference Series.
15) Yusuf, M. 2007. Research Methodology. Padang: UNP Press.
There is an Open Access article, distributed under the term of the Creative Commons Attribution – Non Commercial 4.0 International (CC BY-NC 4.0) (https://creativecommons.org/licenses/by-nc/4.0/), which permits remixing, adapting and building upon the work for non-commercial use, provided the original work is properly cited.

INTERNATIONAL JOURNAL OF MULTIDISCIPLINARY RESEARCH AND ANALYSIS
ISSN(print): 2643-9840, ISSN(online): 2643-9875
Volume 05 Issue 05 May 2022
DOI: 10.47191/ijmra/v5-i5-30, Impact Factor: 6.261
Page No. 1107-1124
IJMRA, Volume 5 Issue 05 May 2022 www.ijmra.in Page 1107
Viability, Prospects and Challenges of Ecotourism in Lobo,
Batangas
Rizza Ramos-Gonzales1, Dr. Pedrito Jose V. Bermudo2
1,2 University of Perpetual Help System Laguna, Binan Laguna, Philippines ABSTRACT: This descriptive correlational study aimed at determining the viability, prospects and challenges of ecotourism in Lobo,
Batangas. It engaged 120 members of the people’s organizations involved in ecotourism. Majority of the respondents aged 56 to
59, male, a high school graduate, had been involved in ecotourism business for either 1 to 4 years or 5 to 8 years, and had attended
1 to 2 trainings. The level of viability of ecotourism in Lobo, Batangas was ‘very high’ with a weighted mean of 3.43. The
respondents strongly agreed with a weighted mean of 3.38 to the prospects of growth and development of ecotourism in Lobo,
Batangas. Likewise, they agreed with a weighted mean of 3.03 to the myriad of challenges encountered in their involvement in
ecotourism. There was a significant difference in their understanding of the viability of ecotourism along marketing aspect, when
grouped according to the number of years of involvement in ecotourism and number of trainings attended in ecotourism. The
respondents with 5 or more trainings had higher appreciation of the level of viability of ecotourism in the locality than those with
1 to 2 trainings and those with 3 to 4 trainings. Members of the people’s organizations recognize the business prospects and
abundant opportunities for growth and development for the community and its residents in the ecotourism sites despite the
myriad of problems that beset them. Thus, the proposed action plan should be considered by stakeholders in the ecotourism
business in Lobo, Batangas.
KEYWORDS: viability, prospects, challenges, ecotourism
INTRODUCTION
The International Union for Conservation of nature defines ‘’ecotourism as the “environmentally responsible travel and visitation
to relatively undisturbed natural areas, in order to enjoy and appreciate nature (and any accompanying cultural features—both
past and present) that promotes conservation, has low visitor impact, and provides for beneficially active socio-economic
involvement of local populations” (IUCN, 2018). This means that those who implement and participate in ecotourism activities
should follow the following principles: minimize impact, build environmental and cultural awareness and respect, provide positive
experiences for both visitors and hosts, provide direct financial benefits for conservation, provide financial benefits and
empowerment for local people, and raise sensitivity to host countries' political, environmental, and social climate (TIES, 2019).
A sustainable plan of ecotourism requires a deeper understanding of a locale’s viability, prospect and met challenges.
This was verified by Yu (2020) who examined Philippines’ destinations, its viability and faced challenges before exploring how
sustainable ecotourism strategies benefit the Philippines. He then connoted ecotourism as a viable solution to both environmental
and economic issues that have plagued the country; but highlighted the need to implement strategies for conservation and further
development. Meanwhile, Armando (2017) found out that marineprotected areas in Iloilo have a high level of viability of
ecotourism due to being established, developed, and regularly maintained. Hence, its management is required to focus on
improving its Information, Education Communication (IEC) activities, monitoring, and evaluation.
In contrast, Brillo (2021) revealed th at Philippines despite being blessed with abundant natural-cultural attractions with
excellent prospects for ecotourism development, continue to be left behind in ecotourism development. This is rooted from the
fact that its natural resources remain untapped, underdeveloped, arbitrarily governed, and ecologically threatened. This proved
the findings of study of Anastacio and Brillo (2020) which claimed that Philippines’ ecotourism is exacerbated by absence of
sustainability plans and scarcity of scholarly works.
Although, several research emphasized the need for action plans on ecotourism sustainability, current studies are only
concerned on the negative impacts of activities on sites and to the local communities of the sites and only limited works have

Viability, Prospects and Challenges of Ecotourism in Lobo, Batangas
IJMRA, Volume 5 Issue 05 May 2022 www.ijmra.in Page 1108
been done to develop sustainable ecotourism indicators (Ebisa et al., 2018). The United Nations World Tourism Organization
(UNWTO) then worked with a study on the Sustainable Tourism for Development that will enhance a common understanding and
commitment on Sustainable Tourism and will demonstrate how it will serve as a vehicle to foster economic and social growth
through achievement of development imperatives and action steps on the negative social, cultural, and environmental impacts.
Set criteria can also be used for education and awareness-raising, policy making for businesses and government and non-
government agencies, and a measurement and evaluation tool.
Thus, this study endeavored to investigate the level of viability, prospects and challenges met of ecotourism sites in Lobo,
Batangas, Accordingly, results of this study could be referred to in framing a sustainable plan on ecotourism. Likewise, it could
distinguish research areas and points to ponder for further investigation.
METHODS
The researcher notified the municipal mayor, the Sangguniang Bayan and municipal tourism officer of Lobo, Batangas about her
study. Then she secured the permission of the officers and members of the people’s organizations that were registered with the
Sangguniang Bayan and the Department of Labor. After a brief explanation of her study, she personally administered the
questionnaire and retrieved the same. A 100% retrieval of the accomplished questionnaires was realized. Thereafter, the data
generated were coded and encoded in Excel format and sent to the statistician for statistical treatment and initial analysis.
The statistical tools used in the treatment of data were frequency count, percentage, weighted mean and ANOVA.
RESULTS AND DISCUSSION
1. The Respondents’ Profile
Table 1. Profile of the Respondents
Profile Frequency Percentage
Age Below 30 36 30.00
40-49 22 18.30
50-59 39 32.50
59 and above 23 19.20
Gender Male 63 52.50
Female 57 47.50
Educational
attainment
Elementary
undergraduate
9 7.50
Elementary
graduate
23 19.20
HS undergraduate 20 17.00
HS graduate 40 33.00
College
undergraduate
10 8.30
College graduate 18 15.00
Number of years of
involvement in
ecotourism
1-4 60 50.00
5-8 60 50.00
Number of
trainings attended
in ecotourism
1-2 45 37.50
3-4 44 36.70
5 and above 31 25.80
Number of respondents = 120
Shown in Table 1 is the profile of the 120 respondents in the study. Age: 39 or 32.50 percent were 56 to 59 years old; 36 or 30.00
percent were below 30 years of age; 23 or 19.20 percent were 59 years old and above; and 22 or 18.30 percent were between 40
and 49 years old. Gender: 63 or 52.50 percent were male and 57 or 47.50 percent were female. Educational attainment: 40 or
33.00 percent finished their high school education; 23 or 19.20 percent were elementary graduates; 20 or 17.00 percent were
high school undergraduates; 18 or 15.00 percent were college graduates; 10 or 8.30 percent college undergraduates; and 9 or

Viability, Prospects and Challenges of Ecotourism in Lobo, Batangas
IJMRA, Volume 5 Issue 05 May 2022 www.ijmra.in Page 1109
7.70 percent did not finish elementary education. Number of years of involvement in ecotourism: 60 of 50.00 percent of the
respondents had been involved in ecotourism for 1 to 4 years, while the other 60 respondents or 50 percent for 5 to 8 years.
Number of trainings attended in ecotourism: 45 or 37.50 percent had attended 1 to 2 trainings in ecotourism; 44 or 36.70 percent
had 3 to 4 trainings; and 31 or 25.80 percent had 5 or more trainings in ecotourism.
A typical respondent in this study is aged 56 to 59, male, a high school graduate, has been involved in the business of
ecotourism for either 1 to 4 years or 5 to 8 years, and has attended 1 to 2 trainings in ecotourism as of this study.
2. Viability of Ecotourism in Lobo, Batangas
Table 2. Level of Viability of Ecotourism in Lobo, Batangas as perceived by the Respondents
Indicators Weighted
Mean
Verbal
Interpretation
Rank
Market
1. The ecotourism sites attract a high number of
tourists.
3.75 Very High 1
2. Stakeholders promote the conservation of natural
resources.
3.63 Very High 2
3. The community ensures the preservation of the
endemic culture in the locality.
3.44 Very High 4
4. A number of ecotourism establishments have
increased.
3.47 Very High 3
Average 3.57 Very High 1
Economic
1. A clear improvement in life and livelihood of the
community is felt.
3.38 Very High 3
2. Ecotourism has brought benefits to the community. 3.53 Very High 1
3. Governmental support to ecotourism in the locality
is visible.
3.47 Very High 2
4. Quality ecotourism products have emerged in the
local market.
3.20 High 4
Average 3.39 Very High 2
Financial
1. Investors in ecotourism-related activities have
realized returns in their investment.
3.10 High 2
2. Local bookings for nature tours were high prior to
the pandemic.
3.53 Very High 1
Average 3.31 Very High 3
Overall Weighted Mean 3.43 Very High
As presented in Table 2, the level of viability of ecotourism in Lobo, Batangas is ‘very high’ with an overall weighted mean
of 3.43 along marketing, economic and financial aspects. This means the ecotourism business in Lobo, Batangas has the potentials
to survive, grow and continue to be successful with all the stakeholders in it responsibly contributing its share to ensure its
sustainability.
Market Viability
As indicated, the market viability is ‘very high’ with an average weighted mean of 3.57. The respondents rated all its
indicators very high with weighted means ranging of 3.44 to 3.75 as the ecotourism sites attract a high number of tourists (Rank
1), stakeholders promote the conservation of natural resources (Rank 2), a number of ecotourism establishments have increased
(Rank 3), and the community ensures the preservation of the endemic culture in the locality (Rank 4).
This finding finds support in the study of Hassan (2019) at the World Heritage Site (WHS) of Morten village, Melaka,
Malaysia from the beginning of September 2016 to the end of January 2017. It was noted that the respondents realized the impacts
that community-based-tourism (CBT) had produced in respect of the destination. Concerning the economic impacts, with the

Viability, Prospects and Challenges of Ecotourism in Lobo, Batangas
IJMRA, Volume 5 Issue 05 May 2022 www.ijmra.in Page 1110
exception of the tourists, all of the respondents confirmed the positive role played by CBT in producing economic benefits for the
village and local area. However, it was suggested that in order for CBT to be sustainable, the concerns of every stakeholder need
to be considered, especially with regard to the cultural and authenticity impacts. The stakeholders should be encouraged to not
only enjoy participating in sharing the economic benefits of tourism but also to have the opportunity to preserve the culture and
heritage. Magio, Arguelles and Guillen (2017) found that ecotourism can generate significant economic benefits to the local
communities and encourage their participation in conservation initiatives avoiding environmentally harmful practices. It was also
found that direct economic incentives are not the only factors that influence attitudes and practices towards conservation. It is
recommended to consider ecotourism as only one of the strategies within a broader plan that seeks to integrate conservation and
socioeconomic development.
Murungi, Mbugua and Gitonga (2020) determined the factors influencing sustainability of community-based ecotourism
development projects in Kenya, specifically Northern Rangeland Trust Conservancy in Meru County. The study findings revealed
that community participation influences the sustainability of community-based ecotourism projects in Meru County very greatly;
that networking with tourism expertise and facilitating links to market influence sustainability of community-based ecotourism
projects in Meru County to a great extent; and that transparent management of financial resources affect sustainability of
communitybased ecotourism projects in Meru County to a very great extent. It was concluded that community participation had
the greatest influence on sustainability of community-based ecotourism development projects in Meru County, followed by
financial viability, then stakeholders’ collaborations. According to DLA Piper (2018), the Global Challenge of Delivering Community
Benefits from Ecotourism, Case Studies from Ecuador 1 found that many of the community-based tourism enterprise (CBTE)
projects started by donors and run by NGOs in Ecuador did not have a proper demand-driven approach to development and were
not integrated into the existing, local tourism supply chain. This rendered many small communities without the capability to enlist
a market and make their projects viable. However, the study showed that with proper efforts to plan community-based tourism
(CBT) projects like micro or small businesses and with efforts to link them to the local tourism industry, it was highly likely that
more would succeed. CBTEs are of interest to the sustainable development community, because they are small, medium and
micro-enterprises that can generate a variety of positive social and economic development impacts in highly rural, biodiverse
areas.
Economic Viability
In terms of the economic viability, it is ‘very high’ with an average weighted mean of 3.39. Specifically, the respondents
rated ‘very high’ indicator #2 – Ecotourism has brought benefits to the community with a weighted mean of 3.53 (Rank 1), indicator
#3 – Governmental support to ecotourism in the locality is visible with a weighted mean of 3.47 (Rank 2), and indicator #1 – A
clear improvement in life and livelihood of the community is felt with a weighted mean of 3.38 (Rank 3). However, indicator #4 –
Quality ecotourism products have emerged in the local market was rated ‘high’ with a weighted mean of 3.20 (Rank 4).
This finding confirms the study of Anup (2017), who stated that ecotourism had more beneficial impacts compared to
adverse impacts on the environment, society and culture. It emphasizes the protection of natural resources, biological diversity
and sustainability of resource. It increases mobility of people, social stability and harmony; strengthen traditional culture,
hospitality and folkway; and decreases political conflicts. Economic benefits from ecotourism include direct employment in hotels,
lodges, tourist restaurants, and tourist chauffeuring. It is an integral part of the master development strategy of a developing
nation. In the early stage of ecotourism development, it is difficult to have adequate private agencies and local people involved in
delivering lodging, foods, tour management and tourism activities during peak visitation season. Hence, there is need of training
on nature guiding, cooking, sustainable use of tourism resources, proper handling of tourism demands, expertise in park
management and finance management. Magio and Valdez (2019) found in their study on ecotourism as a strategy for conservation
and sustainable development in Biosphere Reserves that ecotourism has potential for generating significant economic benefits to
the local communities and for encouraging their participation in conservation initiatives. However, they also observed that direct
economic incentives are not sufficient to change residents' attitudes and practices in favor of conservation. Karmini (2020), in a
study on ecotourism management based on local wisdom in Tenganan Village, Karangasem Bali, found that the local wisdom
owned by indigenous people in Tenganan Village was in the written customary law, namely awig-awig which is used to preserve
local tourism forests by not damaging the potential of flora and fauna at forest, and utilizing forest products in an adaptive manner.
The implementation of awig-awig in the tourism forests management had positive implications for the diversity of spatial planning
and the Tenganan forest preservation. Second, ecotourism management accompanied by efforts to preserve local village forests
was able to support the sustainable tourism, namely development that ensured economic sustainability, ecological sustainability,
and the socio-cultural viability of the local community.

Viability, Prospects and Challenges of Ecotourism in Lobo, Batangas
IJMRA, Volume 5 Issue 05 May 2022 www.ijmra.in Page 1111
Financial Viability
Finally, financial viability is ‘very high’ with an average weighted mean of 3.31. The respondents rated indicator #2 - Local
bookings for nature tours were high prior to the pandemic ‘very high’ with a weighted mean of 3.53 (Rank 1) and indicator #1 -
Investors in ecotourism-related activities have realized returns in their investment ‘high’ with a weighted mean of 3.10 (Rank 2).
The study’s finding on the investors’ high ROI is related to the study of Salera et al. (2019) on the economic viability of
the community-based homestay service as a livelihood project of the Dumagats who are native residents of Daraitan. The main
service of the project is to provide accommodation and campsite for tourists who usually go for trekking at Mt. Daraitan. The
results showed that the financial assessment of the homestay service yielded an average of 27.25% return on sales; 85.4% gross
profit ratio, and 79.37% return on capital. A portion of the profit will be appropriated for charitable purposes.
Financial viability is crucial for public nature-based attractions, especially in the context where many are seeking to
transform their business model and goals in order to survive because of the heavy hit by COVID-19 and pressure from Chinese
central government policies to lower entrance fees in state-owned attractions. A case study of Shanghai Sheshan National Forest
Park (SNFP) tested the framework “resource–function–transformation–cost” and revealed that (a) transformation happened
because of the recombination of resources, followed by the change of functions, leading to capital expenditure being more
prominent during the early stages and management costs more so in the latter stage. It was concluded that the elasticity of the
cost structure, which measures the responsiveness of total cost to changes in output is low; (b) the structure of functions tended
to be stable over the years; and (c) the cost structure of the management, production and business, and tourism and leisure
functions did not change much, while that of ecological protection functions changed significantly from capital expenditure to
management costs (Liu, Li, Sigley, and Quan, 2021).
Moving on, Müllera, Hucka and Markovab (2020) stated that the oftenmissing financial sustainability in community-based
tourism (CBT) in Cambodia frequently happens due to a lack of management skills and a lack of knowledge of pricing in the
communities. Their paper contributed to the discussion by examining the willingness to pay of different target groups (i.e., locals,
expatriates, and international tourists), and presents two arguments in support of a stronger emphasis of the local and, especially,
the expatriate market, expatriates display significantly higher willingness to pay than international tourists, and, secondly,
expatriate support allows CBT sites to build an understanding of potential customers' needs, thereby supporting a more organic
and sustainable growth.
3. Prospects of Ecotourism in Lobo, Batangas
Table 3. Prospects of Ecotourism in Lobo, Batangas as assessed by the Respondents
3. nurtures the entrepreneurial culture
among community residents
(pasalubong store, establishment of
cooperatives).
3.33 Strongly Agree 6
4. supplements women employment or livelihood 3.28 Strongly Agree 8
5. develops/improves transport sector 3.26 Strongly Agree 9.5
6. promotes eco-friendly initiatives such as use of
biodegradable products.
3.40 Strongly Agree 5
7. engenders public-private partnership for sustainable
nature tourism
3.42 Strongly Agree 4
8. creates employment opportunities 3.48 Strongly Agree 2
9. promotes conservation of wildlife 3.56 Strongly Agree 1
Indicators Weighted
Mean
Verbal
Interpretation
Rank
The ecotourism in Lobo, Batangas . . . .
1. opens opportunities for local business in the
community (i.e., local products,
delicacies, souvenirs).
3.26 Strongly Agree 9.5
2. provides alternative source of livelihood for
the community people.
3.31 Strongly Agree 7

Viability, Prospects and Challenges of Ecotourism in Lobo, Batangas
IJMRA, Volume 5 Issue 05 May 2022 www.ijmra.in Page 1112
10. contributes to the economic development of
the locality.
3.47 Strongly Agree 3
Average 3.38 Strongly Agree
As indicated in Table 3, the respondents ‘strongly agree’ with an average weighted mean of 3.38 to the development
prospects of ecotourism in Lobo, Batangas. This means that the members of the people’s organizations in the locality, who are
involved in ecotourism, realized the abundant opportunities for growth and development for the community and its residents in
the ecotourism sites.
Emphatically, they ‘strongly agree’ with weighted means ranging from 3.26 to 3.56 that promotes conservation of wildlife
(Rank 1), creates employment opportunities (Rank 2), contributes to the economic development of the locality (Rank 3), engenders
public-private partnership for sustainable nature tourism (Rank 4), and promotes eco-friendly initiatives such as use of
biodegradable products (Rank 5). Notably, conservation of wildlife was paramount in their minds for sustainable tourism or
ecotourism.
Further, the respondents ‘strongly agree’ that ecotourism in Lobo, Batangas nurtures the entrepreneurial culture among
community residents (pasalubong store, establishment of cooperatives) (Rank 6), provides alternative source of livelihood for the
community people (Rank 7), supplements women employment or livelihood (Rank 8), and opens opportunities for local business
in the community (i.e., local products, delicacies, souvenirs) and develops/improves transport sector (Rank 9.5).
This finding is buttressed by the following studies: The Philippines is rich in natural-cultural attractions with excellent
prospects for ecotourism development. Brillo’s study (2021) explored the prospects of establishing ecotourism at the municipa l
level by investigating the experiences of two sites: Pandin Lake of San Pablo City and Tayak Hill of Rizal Municipality, both in Laguna
province of the Philippines. In Pandin Lake, the ecotourism development is a locally driven and nongovernmental organization-
inspired initiative, and in Tayak Hill, it is a top-down driven endeavor where the initiatives are primarily personal actions of the
local executives. According to Brillo, in Pandin Lake, the initiating conditions in the development of Pandin Lake were: the
awareness brought about by the save Sampaloc Lake movement; the constraint to aquaculture expansion; the scenic natural
beauty of the small lake; and the lack of development-oriented actions by its administrative agencies. Whereas, in Tayak Hill the
triggering situations consisted of: the urgent need for instituting a promotional identity for the town and a catalyst for the local
socioeconomic development; the advent of a new local government administration that is open to novel development strategies;
and the discovery of Tayak Hill as a historical landmark.
Various destinations in Batangas have showed prospects on ecotourism. As an eco-friendly destination, it evidently has
admirable seascape, inland water, and majestic Taal Volcano. Moreover, it is rich in culture, heritage, and historical evidence. It
also has pleasantly built environment, friendly local people, various local transport type, and personal safety and security. Apritado
and Borbon (2021) recommended that the management should focus on developing new facilities, improving existing tourist
activities, and investing on providing new trends in tourists activities.
Serebryakova, Dorohova, and Isaenko (2021) discussed the potential for the development of eco-tourism in Russia, which
has many natural objects of interest to tourists. But a number of factors hinder the development of this type of tourism such as
insignificant information support and promotion of Russia as a place suitable for tourist recreation, including nature-oriented, in
foreign markets; unfavorable visa regime for tourists, which makes it much more difficult for foreign citizens to visit Russia;
undeveloped tourist infrastructure; low level of service, mismatch of prices for offered tourist goods and services to their quality;
low level of development of transport infrastructure, high degree of deterioration of the transport base and lack of comfortable
tourist vehicles.
In spite of picturesque landscapes, natural beauties and authentic traditional lifestyles to be seen in East Kazakhstan,
tourism is far from being developed. The study of Chlachula et al. (2020) presents a roster of geo-tourism and ecotourism loci for
the broader Altai area within a framework of sustainable development. Prospects for travel to these places are enhanced by the
presence of numerous prehistoric archaeological sites and historical monuments, which document the rich, multi-ethnic
background of Kazakhstan and the ancient Silk Road that traverses it. These geological, environmental and cultural resources, and
the regional geo-heritage and environmental conservation concepts have been figured into strategies for economic growth of
rural Kazakhstan.
Ramaano (2021) evaluated the prospects of using ecotourism industry to advance community livelihoods in Musina
Municipality, Limpopo, South Africa. The findings confirmed substantial ecotourism potential of the Musina Municipality and that
this potential is manifest irrespective of geographic and demographic factors. However, it was revealed that there was a low
current ecotourism impact in the Musina Municipality with consequential minimal benefits accruing to the enhancement of the

Viability, Prospects and Challenges of Ecotourism in Lobo, Batangas
IJMRA, Volume 5 Issue 05 May 2022 www.ijmra.in Page 1113
standard of living in the local community. This situation was attributed to the lack of a well-articulated tourism strategy linked to
the sustainable economic development of the communities involved.
Das (2021) observed that ecotourism has a significant role in community development in the host areas through
alternative but sustainable livelihood. In Darjeeling and Kalimpong districts of West Bengal, ecotourism is still a communitybased
activity which involves local people and their culture. Most of the ecotourism sites in this part of West Bengal are within forest
and hilly tract. Here growth of ecotourism has been phenomenal during the last decades with the influx of tourists that boosted
the local economy. Sillery Gaon, a small village, in ‘Silk Route Circuit’ of West Bengal, is a new addition to it and a perfect example
of this scenario. It is situated in Kashyone, gram panchayat of Kalimpong District. This pictorial village is surrounded with the dense
forest of Pankhasari range and blessed with the panoramic view of Tista River and Kanchenjunga. In the last ten years, the villagers
have developed ecotourism facilities and activities which transformed their traditional agrarian economy to tourism-based
livelihood.
4. Challenges met by Respondents in the Involvement in Ecotourism
Table 4. Challenges Met by the Respondents in their Involvement in Ecotourism in Lobo, Batangas
Indicators Weighted
Mean
Verbal
Interpretation
Rank
1. Lack of eco-friendly infrastructure and facilities 3.03 Agree 5
2. Lack of capacity building of organizational members
towards sustainable development
3.09 Agree 2
3. Visitors’ lack of knowledge on environmental
protection and
conservation
3.01 Agree 6.5
4. Poor promotional marketing/strategies 3.04 Agree 4
5. Maintenance fund for infrastructure and facilities is
insufficient
3.14 Agree 1
6. Lack of ecotourism plan and strategy 2.96 Agree 10
7. Insufficient training on business management 2.98 Agree 9
8. Funds for other business opportunities are not
available
3.08 Agree 3
9. Properly trained personnel/staff are scarce. 3.01 Agree 6.5
10. Tourist guides’ lack of information on sites and
history.
2.99 Agree 8
Average 3.03 Agree
As seen in Table 4, the respondents confirmed by ‘agreeing’ with an average weighted mean of 3.03 to the challenges
encountered in their involvement in ecotourism in Lobo, Batangas. This implies that that the members of the people’s
organizations were beset by a myriad of problems involving physical, human and financial infrastructures, etc. that could hinder
growth and development in ecotourism if left unsolved or disregarded. Specifically, they ‘agreed’ with weighted means ranging
from 2.96 to 3.14 to the following challenges: maintenance fund for infrastructure and facilities is insufficient (Rank 1); lack of
capacity building of organizational members towards sustainable development (Rank 2); funds for other business opportunities
are not available (Rank 3); poor promotional marketing/strategies (Rank 4); lack of eco-friendly infrastructure and facilities (Rank
5); visitors’ lack of knowledge on environmental protection and conservation and properly trained personnel/staff are scarce (Rank
6.5); tourist guides’ of lack information on sites and history (Rank 8); insufficient training on business management (Rank 9); and
lack of ecotourism plan and strategy (Rank 10).
The findings on the challenges encountered by the respondents in their involvement in ecotourism in Lobo, Batangas
were more or less similar to the challenges expounded in the succeeding studies: Mnini and Ramoroka (2020) investigated the
challenges of ecotourism towards poverty alleviation. Ecotourism is believed to be associated with various challenges which are
environmental deterioration, inability to contribute to local economy as, well as cultural exploitation and deterioration. Regardless

Viability, Prospects and Challenges of Ecotourism in Lobo, Batangas
IJMRA, Volume 5 Issue 05 May 2022 www.ijmra.in Page 1114
of the challenges ecotourism has, the paper concluded that ecotourism positively contributes towards poverty alleviation in South
Africa.
The study of Kunjuraman (2021) on local community participation challenges in community-based ecotourism
development in Sabah, Malaysian Borneo discovered that local communities’ challenges in ecotourism development are manifold,
thematically categorized into internal and external challenges. The study advised that ecotourism development in Sabah, Malaysia
will be in danger, if it fails to emphasize the local community participation and their aspirations, thus weakening the sustainability.
The study proposes that stakeholder approach be taken as a remedy to overcome the challenges faced by the local communities
in ecotourism in the study site.
Petros and Firew (2020) determined the opportunities and challenges for ecotourism development in the Dilla University
Botanical and Ecotourism Garden. The results revealed that low level community benefit, inadequate community participation,
absence of ecotourism plan and unsustainable use of resources were the major challenges of ecotourism development in the
garden. It also identified absence of sufficient accommodation and lack of local guides as first and second facility problems in the
garden. To address the different problems and implement an integrated ecotourism development approach, involving
communities and enhancing their role has been recommended as the key component of ecotourism development in the area.
Wondirad’s study (2020) systematically determined the challenges and opportunities of ecotourism development in
Wondo Genet and its vicinity, Southern Ethiopia. The research findings unfolded several constraints, i.e., budget and human
resource, etc., that deter successful ecotourism development along with opportunities that can be used in future development in
Wondo Genet and its vicinity, as the area is known for its natural and cultural resources. The findings offer substantive insights to
policymakers, private investors and local communities about the existing challenges and opportunities of ecotourism development
in the context of emerging destinations.
Ezequias (2020) presented the challenges of ecotourism in Angola in the face of the new trend of sustainable
development, taking into account endogenous and exogenous conditions. The qualitative study allowed the identification of
natural, mineral and cultural potential favorable to the sector, but also challenges such as the lack of economic and social
infrastructure, training, high prices and credits, the overcoming of which will foster ecotourism in the country.
A case study was conducted by Mondino and Beery (2019) to understand the many challenges ecotourism faces despite
its role in sustainable development in the Monviso Transboundary Biosphere Reserve, Italy. Study results showed that ecotourism
had some positive effects, such as the creation of a network for collaboration between various stakeholders. However, negative
perceptions still play an inhibiting role such as the lack of proper environmental education.
5. Difference in the Respondents’ Perception of Viability of Ecotourism
Table 5. Difference in the Level of Viability of Ecotourism in Lobo, Batangas as Perceived by the Respondents when grouped
according to Profile Variables
Profile Marketing Economic Financial Overall
Age Below 30 (F-test)
F = 1.588 p=
0.196
F = 0.702 p=
0.553
F = 0.035 p=
0.991
F = 0.415 p=
0.743
40-49
50-59
59 and above
Gender Male (t-test)
t = 0.537 p =
0.593
t = 0.397 p =
0.692
t = 0.992 p =
0.323
t = 0.838 p =
0.404
Female
Educational
attainment
Elementary
undergraduate
(Kruskal-
Wallis test)
x2 = 5.188 p =
0.393
x2 = 5.897
p = 0.316
x2 = 3.043
p = 0.693
x2 = 5.446
p = 0.364
Elementary
graduate
HS
undergraduate
HS graduate
College
undergraduate
College
graduate
1-4 (t-test) t = -1.805 t = -0.140

Viability, Prospects and Challenges of Ecotourism in Lobo, Batangas
IJMRA, Volume 5 Issue 05 May 2022 www.ijmra.in Page 1115
Number of
years of
involvement
in
ecotourism
5-8 x 1-4 = 3.65 x 5-8 =
3.50 t = 2.184 p
= 0.031*
t =0.214 p =
0.831
p = 0.074 p = 0.889
Number of
trainings
attended in
ecotourism
1-2 (F-test)
x 1-2 = 3.63 x 3-4 =
3.46
x 5-above =
3.65
F= 3.331 p =
0.039*
F= 0.740 p =
0.479
F= 0.289 p =
0.750
F= 1.391 p =
0.253 3-4
5 and above
*Significant @ 0.05
As reflected in Table 5, there was no significant difference in the respondents’ perception of the level of viability of
ecotourism along marketing economic and financial aspects in Lobo, Batangas, when grouped according to age (F = 0.415; p=
0.743 > 0.05); gender (t= 0.838; p = 0.404 > 0.05); and educational attainment (x2 = 5.446; p = 0.364 > 0.05). This means that the
level of viability of ecotourism based on their own understanding of the phenomenon was not dependent on whether he or she
was younger or older, whether he or she was a male or female, and whether he or she was an elementary, high school or college
graduate.
However, a significant difference was noted in the respondents’ perception of the level of viability of ecotourism along
marketing aspect in Lobo, Batangas, when grouped according to the number of years of involvement in ecotourism (t = 2.184; p =
0.031< 0.05) and number of trainings attended in ecotourism (F= 3.331; p = 0.039 < 0.05). The implies that the respondents with
1 to 4 years of involvement in ecotourism (x1-4 = 3.65) had higher appreciation of the level of viability of ecotourism in Lobo,
Batangas than those with 5 to 8 years of involvement (x5-8 = 3.50). This could further mean that those who were relatively new in
ecotourism business were either earning profitably or simply recognized the opportunities to earn and succeed. Further, the
respondents with 5 or more trainings attended in ecotourism (x5-above = 3.65) had higher appreciation of the level of viability of
ecotourism in the locality than those with 1 to 2 trainings (x1-2 = 3.63) and those with 3 to 4 trainings (x3-4 = 3.46). This could mean
that the more trainings they attended, the more opportunities given them to widen their business horizons while interacting with
various resource persons and benchmarking with their fellow trainees or attendees.
Generally, the respondents’ perception of the viability of ecotourism in Lobo, Batangas was similar. Such finding is
corroborated by Hassan’s (2019) critical analysis of stakeholders’ perceptions of community-based tourism (CBT) impacts in World
Heritage Sites (WHS) which analyzed, among others, the stakeholders’ perceptions concerning the economic, environmental and
socio-cultural impacts of CBT. It was revealed that the respondents were found to clearly realize the impacts that CBT had
produced in respect of the destination. Concerning the economic impacts, with the exception of the tourists, all of the respondents
confirmed the positive role played by CBT in producing economic benefits for the village and local area.
However, in Collado’s study (2019), when grouped according to province, there was a significant difference in the
respondents’ perceived impacts of river-based tourism destinations in Panay Island in terms of economic viability, socio-cultural
equity, and environmental conservation. The author’ study aimed to determine the impacts of river-based tourism destinations
sustainability of Panay Island in terms of economic viability, socio-cultural equity, and environmental conservation. Results
revealed from across four provinces, river-based tourism destinations in Panay Island have high economic, socio-cultural, and
environmental significance among its stakeholders. When rank in terms of the sustainability indicators, data showed that the most
favored response in the economic viability was to “create income opportunity”. Likewise, Mejere et al. (2022) found a significant
difference on their respondents’ perceived viability of tourism in Baltic Sea Countries when grouped according to their age.
Further, young people tend to be indifferent to tourism policies and benefits, are neutral in addressing environmental
sustainability issues, and are skeptical on the development of sustainable tourism. Socio-economic type which compromises 71.5%
of young people is more focused on the long-term socio-economic wellbeing of the destinations which for them can be achieved
through efficient management, tourism planning, and active participated on the implement tourism policies. This was
corroborated by Gkoumas (2019) who connoted tourism as a multi-actor field as people have their own interests, espouse certain
views, and have varying degrees of the influence of policies. For instance, hoteliers, restaurateurs, and bar owners claimed
Mediterranean Standard for Sustainable Tourism (MESST) as a viable tool for enterprises to put sustainability into action; while

Viability, Prospects and Challenges of Ecotourism in Lobo, Batangas
IJMRA, Volume 5 Issue 05 May 2022 www.ijmra.in Page 1116
tourism professionals negate them as absence of follow-up activities, limited use of networking and its inability to obtain national
recognition led to poor applicability of standard.
6. Difference in the Prospects of Ecotourism as Assessed by the Respondents
As shown in Table 6, no significant difference was noted in the prospects of ecotourism in Lobo, Batangas as assessed by
the respondents when grouped according to age (F= 0.404; p=0.750 > 0.05), gender (t=0.224; p=0.823 > 0.05), educational
attainment (x2 = 10.213; p=0.069 > 0.05), number of years involvement in ecotourism (t = 1.316; p=0.191 > 0.05), and number of
trainings attended in ecotourism (F = 2.227; p= 0.112 > 0.05).
Table 6. Difference in the Prospects of Ecotourism in Lobo, Batangas as assessed by the Respondents when grouped according
to Profile Variables
Profile Test statistic p-value Interpretation
Age F = 0.404 0.750 Not Significant
Gender t= 0.224 0.823 Not Significant
Educational attainment x2 = 10.213 0.069 Not Significant
Number of years of involvement
in ecotourism
t = 1.316 0.191 Not Significant
Number of trainings attended in
ecotourism
F = 2.227 0.112 Not Significant
Significance level @ 0.05
This means that regardless of their profile variables, they all similarly strongly agreed to the prospects and opportunities
of ecotourism in their place that are waiting for them to study and explore with the support of national and local government
units, non-government organizations and together with local initiatives.
This finding, which shows the respondents’ unanimity in their assessment of the prospects and opportunities of ecotourism
in Lobo, Batangas, deviates from the findings of Chen et al. (2020), which analyzed the heterogeneity of different groups, including
the differences between local people and tourists, different occupational groups and groups with different educational levels,
thus clarifying the problems existing in the development of marine park ecotourism, and providing reference for the further
development and management of the marine park.
The results show that Dongshan Island has a good carrying capacity and a certain level of tourism development
foundation, which can provide opportunities for mass tourists to participate in ecotourism. However, weak environmental
awareness of Dongshan Island residents will become an important obstacle to the island's ecotourism development. Barnes and
Sutcliffe (2018) noted the perceived diverse prospects of ecotourism in Hawaii. For some, only environmentally minded people
will be attracted to cage free shark diving ecotourism program and their participation will not lead to meaningful conservation
gains. On the other hand, tour participants who have knowledge on the ecological role of sharks negate this premise. Sarpong,
Blankson and Britwum (2018) brought to the fore issues on residents’ views on the benefits and costs of ecotourism projects at
Bobiri Forest and Butterfly Sanctuary in Ghana. Their study revealed that socio-demographic characteristics, native status, place
of residence and length of stay influence residents’ perceptions of tourism. Statistically a significant difference was found between
place of residence and economic, socio-cultural and environmental impacts of tourism. It was concluded that for the goal of
ecotourism development to be achieved, there is the need for residents’ views on the project to be considered and thereby
involving residents in ecotourism development.
Le et al. (2021) studied the key factors that affect tourists’ awareness and perception of entomological ecotourism based
on their demographic profiles. Results showed little difference in perception and awareness between Malaysian and
NonMalaysian respondents. Respondents also show three main factors, such as ‘Knowledge’, ‘Experience’ and ‘Appearance’ that
may cause different perceptions of insects other than their cultural background. Though there are no significant differences
between the respondents’ perceptions of insects, there are still some items among the respondents’ perceptions need to be
considered. These items include the respondents’ perspective on diversity, behaviors, life cycle, and insects' appearance.
Additionally, Nigatu and Tegegne (2021) concluded significant difference on respondents perceived prospect of ecotourism on the
conserved forest of Ethiopia. They have considered the areas as factors on perceiving potential for outdoor recreation.
Consequently, education also influence the diverse perspective as 92.9% of high school completers who have limited knowledge
on ecotourism and outdoor recreation perceived no prospect of tourism in the place; while, 86.7% of college graduates and 92.9%

Viability, Prospects and Challenges of Ecotourism in Lobo, Batangas
IJMRA, Volume 5 Issue 05 May 2022 www.ijmra.in Page 1117
proved the contradictory. The local communities either have positive and negative perception towards outdoor recreation and
ecotourism.
7. Difference in the Challenges met by the Respondents in their involvement in ecotourism in Lobo, Batangas
Table 7. Difference in the Challenges Met by the Respondents in their Involvement in ecotourism in Lobo, Batangas when
grouped according to Profile Variables
Profile Test statistic p-value Interpretation
Age F = 0.398 0.755 Not Significant
Gender t= -0.286 0.775 Not Significant
Educational attainment x2 = 2.941 0.709 Not Significant
Number of years of involvement
in ecotourism
t = 0.966 0.336 Not Significant
Number of trainings attended in
ecotourism
F = 0.216 0.806 Not Significant
Significance level @ 0.05
As seen in Table 7, there was no significant difference in the challenges encountered by the respondents in their
involvement in ecotourism in their own town when grouped according to age (F= 0.398; p=0.755 > 0.05), gender (t=0.286; p=0.775
> 0.05), educational attainment (x2 = 2.941; p=0.709 > 0.05), number of years involvement in ecotourism (t = 0.966; p=0.336 >
0.05), and number of trainings attended in ecotourism (F = 0.216; p= 0.806 > 0.05). This means that regardless of their profile
variables, they all uniformly agreed to the various challenges they encountered in their involvement in ecotourism in their locality.
Such challenges, problems or difficulties, however, were perceived to be surmountable with the support of national and local
government units and non-government organizations, and the steady stream of domestic and international tourists and visitors
in the new normal bringing revenues to the local government unit and to the community and local enterprises.
This finding on the common challenges encountered by the respondents in their involvement in the ecotourism in Lobo,
Batangas, differs from the study conducted by Joushi and Poudel (2020), which revealed a significant difference on the perceived
challenges met by ecotourism. In fact, their respondents who are found to be mostly high school graduates, age around 35 – 45
years, and with a few involvement agriculture activities, perceived that lack of transportation and ineffective communication
strategies limit the promotion of ecotourism in the area. Those who stayed longer in the area observed the declining number of
tourists year by year due to the unstable condition of the country and lack of promotion. Meanwhile, younger respondents saw
the increase of domestic tourists because of trekking, trainings, and tours. Likewise, Lee’ study (2022) quantified and revealed the
diverse perception between the majority and minority of places where there is severe conflict. In fact, Korean public officials and
tour guides seek for the establishment of a river-centered tourism plan, while residents and environmental groups prayed for the
implementation of a conservation plan thru farming in the outskirts of the river. Moreover, Lelloltery, Hitipeuw and Sahureka
(2020) determined the strategy of developing ecotourism based on community participation and stakeholder involvement. FGD
was conducted to get the same perception between the community and stakeholders. The findings revealed that community
perception shows that 83.3% of respondents agreed to develop ecotourism activities and community participation related to
tourism activity planning, implementation of activities and development of tourism facilities supported by tourism stakeholders
such as local governments and NGOs. In addition, Xiaboa and Xiaoying (2020) found in their study challenges that are common in
most countries. In Liaoning Province, China, there were two kinds of obstacles to the sustainable development of ecotourism in
nature reserves. The first group of obstacles all represent common problems in China including: (1) environmental education is
ignored; (2) community participation occurs on an ad hoc basis; (3) tourism management is not rigorous; (4) nature reserve
administration is in a state of confrontation with local governments and residents. The second group of obstacles consists of
specific problems faced by ecotourism in the three nature reserves, each of which has its own natural, social, cultural and
economic environment that generate unique difficulties for ecotourism

Viability, Prospects and Challenges of Ecotourism in Lobo, Batangas
IJMRA, Volume 5 Issue 05 May 2022 www.ijmra.in Page 1118
8. Action Plan
PROPOSED ACTION PLAN FOR SUSTAINABLE ECOTOURISM IN LOBO, BATANGAS
Area
Thrust
Objectives Strategies Time
Frame
Persons
Involved
Sources of
Funds
Budget
(Php)
Success
Indicator
Infrastru
cture and
Facilities
Develop
ment/
Maintena
nce Fund
To improve
the
infrastructur
e (roads/
tourist
routes) and
facilities to
attract more
visitors and
promote
eco-friendly
tourism sites
Request fund
from Local
Governme nt
Office (LGU),
NonGovernme
nt Units
(NGOs),
Environme
ntal Organizati
on
As the
need
arises
Governm
ent
Officials
/
Organizat
ional
Member
and
Officers /
Approve d
Fund from
LGU, NGO,
and
environm
ental
organizat
ion
1 Million Improved
and well
maintained
infrastructu
re and
facilities
To provide
fund for the
maintenanc e
of
infrastructur
es/ facilities
Allocate fund
from the
organizatio n’s
income
Allocate d
fund of
the
organizat
ion
Capacity
Building
/
Personne
l
Training
To
strengthen
the capacity
building of the
organizatio
nal
members to
promote
sustainable
developmen
t
Workshop
Seminar and
Training
Need
Assessmen
t
Year
round
Organizat
ional
Members
DENR/
DA/
Tourism
Office/L
GU,
NGO
Allocate d
Fund from
Tourism
Office
Training
provided
by Bantay
Kalikasa n
Foundati
on
200,000 Strengthen
ed capacity
building of
the
organizatio
nal
members
To train
personnel
Collaborati on
with National
&
Local
Tourism
Office
Tourism
Office/N
GO LGU
Well
trained
personnel

Viability, Prospects and Challenges of Ecotourism in Lobo, Batangas
IJMRA, Volume 5 Issue 05 May 2022 www.ijmra.in Page 1119
Visitor’s
Knowled
ge on
Environ
mental
Protectio n
and
Conserva
tion
To provide the
visitors
knowledge on
environmen
tal protection
and
conservatio n
Orientation
on
wast
e manageme
nt and
protection of
wildlife
Upon
arrival
Tourism
Office /
Organizat
ional
Members
/ Visitors
N/A N/A Well
oriented
visitors
Ecotouri
sm
Planning
/
Marketin g
Strategy
To adopt a
marketing
strategy that
will help
attract more
tourists and
promote
tourism sites
and products
Create social
media sites,
and channel
Produce
campaign
materials/
advertisem
ent
Period
ically
Visitors /
Organizat
ional
Officers
&
Members
/ Tourism
Office /
LGU /
Commerc
ial
Establish
ment
Allocate d
Fund from
organizat
ion and
LGU 250,000
Ecotourism
Plan / Well
promoted
sites
To develop
ecotourism
plan to
increase the
income of the
organizatio
n
Collaborati on
with LGU and
Tourism
Office
Every
five
years
Tourism
Office/N
GO/
LGU
Training
on
Business
Manage
ment
Skills
To develop
skills
needed in
managing
ecotourism
business
Training on
business
manageme nt,
such as
Financial
manageme nt
training,
e.g. Budget
allocation,
Market
planning
Year
round
Sponsori ng
Agency/
Tourism
Office
NGO/LG
U
Allocate d
Funds from
LGU and
Tourism
Office
100,000 Well
trained
Ecotourism
Business
Managers
Environ
mental
Informati
on
Campaig n
To provide the
tour guides
with the
knowledge on
history of the
Training on
environme
ntal
informatio n
campaign
Year
round
Sponsori ng
Agency/
Tourism
Office/N
GO/
LGU
Allocate d
fund of
the
organizat
ion and
NGO
100,000
Knowledge
able tour
guides

Viability, Prospects and Challenges of Ecotourism in Lobo, Batangas
IJMRA, Volume 5 Issue 05 May 2022 www.ijmra.in Page 1120
locale/site and
environmen
tal protection
Local
Business
Opportu
nities
To create more
local
businesses/e
nterprises that
will offer further
employmen
t
opportunitie s
Partnership
with NGO and
private
organizatio n
Seek
investment
from
potential
investors/c
apitalists
As the
need
arises
Tourism
Office/N
GO/LGU
Investme
nt/Capita l
from
individua l/
private
sector
N/A More local
businesses
Entrepre
neurial
Culture
To develop
entrepreneu
rial culture
among
community
residents
To
establish
cooperativ e
and pasalubon
g store
N/A Tourism
Office/P
O’s
Equity
capital
from the
members of
the
organizat
ion
N/A Well
developed
entreprene
urial culture
Private and
public
partnersh ip
To establish
private and
public
partnership
with agencies
that will provide
services for
sustainable
operations
Partnership
with public and
private
agencies
As the
need
arises
Tourism
Office/Pr
ivate
Agencies
Allocate d
fund and/or
services by
the
private
agencies
N/A Established
private and
public
partnership
CONCLUSIONS
Based on the findings of the study, the following conclusions were drawn: (1) A typical respondent in this study is aged 56 to 59,
male, a high school graduate, has been involved in the business of ecotourism for either 1 to 4 years or 5 to 8 years, and has
attended 1 to 2 trainings in ecotourism as of this study. (2) The ecotourism business in Lobo, Batangas has the potentials to survive,
grow and continue to be successful with all the stakeholders in it responsibly contributing its share to ensure its sustainability. (3)
The members of the people’s organizations in the locality who are involved in ecotourism recognize the business prospects and
abundant opportunities for growth and development for the community and its residents in the ecotourism sites. (4) The members
of the people’s organizations are beset by a myriad of problems involving physical, human and financial infrastructures, etc. that
could hinder growth and development in ecotourism if left unsolved or disregarded. (5) The respondents’ perception of the level
of viability of ecotourism based on their own understanding of the phenomenon is not dependent on whether he or she was
younger or older, whether he or she was a male or female, and whether he or she was an elementary, high school or college
graduate. The respondents with 1 to 4 years of involvement in ecotourism (x1-4 = 3.65) have higher appreciation of the level of
viability of ecotourism in Lobo, Batangas than those with 5 to 8 years of involvement (x5-8 = 3.50). The more trainings the
respondents attend, the more opportunities given them to widen their business horizons while interacting with various resource
persons and benchmarking with their fellow trainees or attendees. (6) Regardless of their profile variables, they all similarly
strongly agree to the prospects and opportunities of ecotourism in their place that are waiting for them to study and explore with

Viability, Prospects and Challenges of Ecotourism in Lobo, Batangas
IJMRA, Volume 5 Issue 05 May 2022 www.ijmra.in Page 1121
the support of national and local government units, non-government organizations and together with local initiatives. (7)
Regardless of their profile variables, they all uniformly agree to the various challenges they encountered in their involvement in
ecotourism in their locality.
RECOMMENDATIONS
Based on the findings and conclusions of the study, the following recommendations are forwarded: (1) The local government unit
together with the people’s organizations should encourage the stakeholders in the locality’ ecotourism to attend more trainings
not only on ecotourism conservation and sustainability but likewise on the entrepreneurial aspects of it by sponsoring such
activities. (2) More employment and income from ecotourism can encourage more conservation, but the loss of benefits may
signal degradation. Thus, the local government unit, the tourism office and local entrepreneurs in Lobo should sustain its viability
by revisiting its development tourism plan and ensuring that the key result areas along marketing, economic and financial aspects
are on target. (3) The members of the peoples’ organizations ranked promotion of wildlife conservation and creation of
employment opportunities 1st and 2nd among the prospects of ecotourism in Lobo. Thus, the goal is to ensure that ecotourism
benefits are sufficient to provide incentives for local residents to conserve natural habitat, species and other natural resources.
(4) The local government could address the number one identified challenge in the respondents’ involvement in ecotourism which
was the insufficiency of maintenance fund for infrastructure and facilities through prioritization in its budget allocation or by
tapping external sources. (5) Another problem identified was the lack of capacity building of organizational members towards
sustainable development. The local tourism office can spearhead this human resource development project in coordination with
concerned government agencies like the Department of Environment and National Resources and Department of Agriculture and
non-government organizations like the Global Sustainable Tourism Council (GSTC) and the Society for Sustainable Tourism &
Development Inc. (SSTDI). (6) The proposed action plan may be reviewed and adopted by the local government and people’s
organizations for implementation.
REFERENCES
1) Adeniyi, E. E., & Nwokorie, E. C. (2020). Tourists’ Perception of Ecotourism Development in Lagos Nigeria: The Case of
Lekki Conservation Centre. Turizam, 25 (1).
2) Afritado, J. M. & Borbon, N. M. D. (2021). Expectations and experiences of tourists on attractions in Batangas Province.
International Journal of Research Studies in Education, 10 (1), 13 – 22.
3) Afroz, N. & Mahmud, S. (2017). Analyzing the Problem and Prospects of Ecotourism: A Review in Bangladesh. IOSR Journal
of Business and Management, 19 (5), 59 – 65.
4) Anastacio, N. J. C. & Brillo, B. B. C. (2020). Potentials for Ecotourism Development at the Tikub Lake: The Obscure Small
Lake of Tiaong, Quezon, Philippines. Asian Journal of Water, Environment and Pollution, 17 (4), pp. 53-58, 53 – 58. DOI:
10.3233/AJW200051.
5) Anup, K.C. (2017) Ecotourism in Nepal.The Gaze: Journal of Tourism and Hospitality, Vol. 8 No.1. 10.3126/gaze.v8i0.17827
6) Armando, H. (2017). An Assessment of the Viability of Marine Protected Areas in the Province of Iloilo as Ecotourism
Destinations. [Doctoral Disseration, Iloilo State College of Fisheries].
https://repository.cpu.edu.ph/bitstream/handle/20.500.12852/1802/CHM_DM_HisuanAMJr_2017_Ab.pdf?sequence=
1&isAllowed=y.
7) Barnes, M. L., & Sutcliffe, S. R. (2018). The role of shark ecotourism in conservation behaviour: Evidence from Hawaii.
Marine Policy, 97, 27 – 33.
8) Belay, E. M. & Eyassu, A. W. (2018). Challenges of Natural Resources Conservation Management in Mekit Ecotourism
Sites, Ethiopia. Research Journal of Social Science and Management, 8 (7), 61 – 71.
9) Blumer, A., Candrea, A. C., Constantin, C. P., Gabriela – Alpu, R., Ispas, A., PapucDamascan, V., & Suciu, T. (2021). Profiling
Visitors to Romanian Ecotourism Destinations. Sustainability, 13 (5), 2958. https://doi.org/10.3390/su13052958.
10) Borbon, N. M. D. & Ricafort, M. V. (2020). Status of marketing strategies towards tourist attraction and local products: In
the case of Lobo, Batangas, Philippines. International Journal of Research Studies in Education, 9 (7), 91 – 96.
11) Brillo, B. B. C. (2021). Initiation and establishment of ecotourism development: Pandin Lake of San Pablo City and Tayak
Hill of Rizal, Laguna, Philippines. Geo Journal, 86, 2573 – 2586.
12) Chachava, N. T. & Khoshtaria, T. K. (2017). Prospects of ecotourism development in recreation areas of South Georgia.
Annals of Agrarian Science, 15 (3), 312 – 317.
13) Chen, F., Huang, H., & Lai, M. (2020). Can marine park become an ecotourism destination? Evidence from stakeholders'
perceptions of the suitability. Ocean and Coastal Management, 196 (1).

Viability, Prospects and Challenges of Ecotourism in Lobo, Batangas
IJMRA, Volume 5 Issue 05 May 2022 www.ijmra.in Page 1122
14) Chlachula, J. et al. (2021). Territorial assessment of the east Kazakhstan geo/ecotourism: Sustainable travel prospects in
the southern Altai area. Geosciences (Switzerland). DOI: 10.3390/geosciences11040156
15) Choi, Y. E., Kim, M., Lee, J., & Song, K. (2017). Transformation Planning for Resilient Wildlife Habitats in Ecotourism
Systems. Sustainability (9), 4, 487.
16) Choi, Y. E., Chon, J., Doh, M., & Park, S. (2017). Transformation Planning of Ecotourism Systems to Invigorate Responsible
Tourism. Sustainability, 9 (12), 2248.
17) Collado, M. F. C. (2019). A Sustainability Framework of River-based Tourism in Panay Island. APJIHT, 8, 1 – 18.
18) Das, P. Kr. (2021). Ecotourism and Sustainable Community Development: A Case Study of Sillery Gaon, West Bengal.
International Journal of Social Sciences. DOI: 10.46852/2249-6637.01.2021.3
19) De Leon, R. C. & Kim, M. S. (2017). Stakeholder perceptions and governance challenges in urban protected area
management: The case of the Las Piñas – Parañaque Critical Habitat and Ecotourism Area, Philippines. Land Use Policy,
63, 470 – 480.
20) DLA Piper (2018). DLA Piper global data protection laws of the world - World Map. DATA PROTECTION LAWS OF THE
WORLD.
21) Ebisa, J. A., Escoto, M. G., Ocampo, L., & Ombe, J. (2018). Sustainable ecotourism indicators with fuzzy Delphi method –
A Philippine perspective. Ecological Indicators, 93, 874 – 888. https://doi.org/10.1016/j.ecolind.2018.05.060.
22) Erdogan, N. (2017). Critical Views of Mainstream Approaches on Ecotourism. Journal of Tourism and Gastronomy Studies,
5 (1), 20 – 31.
23) Ezequias, J.E. (2020). Ecotourism challenges in Angola: Sustainable development trends. Journal of Tourism and
Development. DOI: 10.34624/rtd.v0i34.22366
24) Fennell, D.A. (2020). Ecotourism. 5th Ed. London: Routledge. DOI:
https://doi.org/10.4324/9780429346293 article=2524&context=scripps_theses.
25) Ghilardi-Lopes, N. P., Pedrini, A. D. G., & Rhormens, M. S. (2017). Implementation feasibility of a marine ecotourism
product on the reef environments of the marine protected areas of Tinharé and Boipeba Islands (Cairu, Bahia, Brazil).
Ocean and Coastal Management, 139. 1 – 11.
26) Gkoumas, A. (2019). Evaluating a standard for sustainable tourism through the lenses of local industry. Heliyon, 5 (11).
27) Global Ecotourism Network (2016). https://www.gstcouncil.org/ecotourism/
28) Gutyj, B. V., Hrymark, O. Y., Kalaitan. T. V., Kindrat, O. V., Kushnir, L. P., Stybel, V. V., Vovk, M. V., Yaroshevych, N. B.
(2017). Ecotourism and sustainable development. Prospects for Ukraine. Ukrainian Journal of Ecology.
29) Hassan, Z. A. (2019). Critical Analysis of Stakeholders' Perceptions of Community Based Tourism Impacts in a World
Heritage Site (WHS). PQDT - Global
30) Hwang, K. & Lee, J. (2018). Antecedents and Consequences of Ecotourism Behavior: Independent and Interdependent
Self-Construals, Ecological Belief, Willingness to Pay for Ecotourism Services and Satisfaction with Life. Sustainability, 10
(3), 789.
31) Ibrahim, I., Rendy, R., & Zukhri, N. (2019). Ecotourism Among Dilemma Voluntarism and Ecological Commitment (A
Review of the Challenges of Community-Based Environmental Tourism Development in Bangka Island). Research Gate.
32) Jaafar, M., Malik, S., Mohamad, D., & Salman, A. (2021). Ecotourism development in Penang Hill: a multi-stakeholder
perspective towards achieving environmental sustainability. Environmental Science and Pollution Research, 28, 42945 –
42958.
33) Joushi, R. & Poudel, B. (2020). Ecotourism in Annapurna Conservation Area: Potential, Opportunities and Challenges.
Grassroots Journal of Natural Resources, 3 (4), 51 – 73.
34) Karmini, N.W (2020). Ecotourism management based on local wisdom in tenganan village, Karangasem Bali. International
Research Association for Talent Development and Excellence.
http://repo.unhi.ac.id/jspui/handle/123456789/952
35) Kunjuraman, V. (2021).Local community participation challenges in communitybased ecotourism development in Sabah,
Malaysian Borneo. Community
Development Journal. DOI: 10.1093/cdj/bsaa065
36) Le, G. et al. (2021). Factors of tourists’ perspective and awareness of insects based on demographics distribution in the
tropical ecosystem. Serangga. https://ejournal.ukm.my/serangga/article/view/4877...
37) Lee, J. (2022). Managing conflict by mapping stakeholders’ views on ecotourism development using statement and place
Q methodology. Journal of Outdoor Recreation and Tourism, 37.
38) Liegey, V., & Nelson, A. (2020). Exploring degrowth: A critical guide. Pluto Press. eBook ISBN: 9781786807601

Viability, Prospects and Challenges of Ecotourism in Lobo, Batangas
IJMRA, Volume 5 Issue 05 May 2022 www.ijmra.in Page 1123
39) Liliquist, M. (2020). What Is a Prospect? https://www.thebalancesmb.com/marketing-sales-prospect-
1794386#:~:text=A%20prospect%20is%20a%20potential,step%20in%20the%20selling%20process. Retrieved om
02.02.22
40) Liu, J.Y., Li, Q.J., Sigley, G. & Quan. H. (2021). How will the cost change after transformation in public nature-based
attractions? A framework and case study. Sustainability (Switzerland). DOI: 10.3390/su13116468
41) Madzunye, T., Nheta, D. S., & Tshipala, N. (2017). Profile of Ecotourists within the Capricorn District Municipality, South
Africa. African Journal of Hospitality, Tourism and Leisure, 6 (4), 1 – 20.
42) Magio, K.O., Arguelles, E. G., & Guillen, E.M.C. (2017). Ecotourism and conservation in the Ruiz Cortinez Ejido, Los Tuxtlas.
TEORIA Y PRAXIS. ISSN: 1870-1582
43) Magio, K.O. & Valdez, M.V. (2019). El ecoturismo en las reservas de la biósfera: Prácticas y actitudes hacia la conservación.
PASOS. Revista de Turismo y Patrimonio Cultural DOI: 10.25145/j.pasos.2019.17.00
44) Mallick, S. K., Rudra, S., & Samanta, R. (2020). Sustainable ecotourism development using SWOT and QSPM approach: A
study on Rameswaram, Tamil Nadu International Journal of Geoheritage and Parks, 8 (3), 185 – 193.
45) McCombes, S. (2020). Descriptive Research Design | Definition, Methods and Examples. Scribbr.
https://www.scribbr.com/methodology/descriptiveresearch/. Accessed 21March 2022.
46) Mejere, O., Jukneviciene, V., Raisutiene, J., Rupuleviciene, R., & Saparniene, D. (2022). Expression of Behavior and
Attitudes toward Sustainable Tourism in the Youth Population: A Search for Statistical Types. Sustainability, 14, 473.
https://doi.org/10.3390/su14010473.
47) Michael, W. (2017). Environmentally Friendly Industries: An Examination of Ecotourism as the Solution to the
Environmental Degradation Caused by the International Tourism Industry. [Honor’s Thesis, Johnson & Whales University].
https://core.ac.uk/download/pdf/303926342.pdf.
48) Miller, C. C. (2017). Challenges and Potentials of Ecotourism as a form of Conservation and Sustainable Development on
Zapatera Island, Nicaragua. [Master’s Thesis, Swedish University of Agricultural Sciences].
https://stud.epsilon.slu.se/10096/1/miller_c_c_170406.pdf.
49) Mnini, P. & Ramoroka, T. (2020). Challenges of Ecotourism and Poverty Alleviation in South Africa. International Journal
of Economics and Finance Studies, 12 (2), 321 – 334.
50) Mondino, E. & Beery, T. (2019). Ecotourism as a learning tool for sustainable development. The case of Monviso
Transboundary Biosphere Reserve, Italy. Journal of Ecotourism. DOI: 10.1080/14724049.2018.1462371
51) Muboko, N., Mudzengi, B. K., Mutanga, C. N., & Gandiwa, E. (2020). Towards sustainable community conservation in
tropical savanna ecosystems: a management framework for ecotourism ventures in a changing environment.
Environment, Development and Sustainability, 23, 3028 – 3047.
52) Müllera, S., Hucka, L., & Markovab, J. (2020). Sustainable community-based tourism in Cambodia and tourists' willingness
to pay? Austrian Journal of South-East Asian Studies (2020) DOI: 10.14764/10.ASEAS-0030
53) Murray, J. (2020). What is business viability. https://www.thebalancesmb.com/what-is-business-viability-3884327.
Retrieved on 02.02.22
54) Murungi, T.M. Mbugua, J., & Gitonga, A.K. (2020). Determinants of Sustainability of Community Based Ecotourism
Development Projects in Kenya: A Case of Northern Rangeland Trust Conservancy, Meru County. International Academic
Journal of Information Sciences and Project Management
55) Nigatu, T. F. & Tegegne, A. A. (2021). Potential Resources, Local Communities’ Attitudes and Perceptions for Outdoor
Recreation and Ecotourism Development in Urban Fringe Harego and Bededo Conserved Forest, South Wollo Zone,
Ethiopia. GeoJournal of Tourism and Geosites, 39 (4), 1421 – 1429.
56) Petros, M.I. & Firew. A. (2020). Challenges and opportunities for ecotourism development: A case studyin dilla university
botanical and ecotourism garden, South Ethiopia. Global Journal of Ecology. DOI: 10.17352/gje.000035
57) Pettinger, Tejva (2020. Degrowth - Definition, examples and criticisms https://www.economicshelp.org. Retrieved on
04.02.22
58) Ramaano, A. I. (2021), Potential of ecotourism as a mechanism to buoy community livelihoods: the case of Musina
Municipality, Limpopo, South Africa, Journal of Business and Socio-economic Development, 1 (1), 47 – 70.
https://doi.org/10.1108/JBSED-02-2021-0020.
59) Salera, J.P. et al. (2019). Community-Based Homestay Service: A Proposed Livelihood Project for the Dumagats. Abstract
Proceedings International Scholars Conference. DOI: 10.35974/isc.v7i1.1571

Viability, Prospects and Challenges of Ecotourism in Lobo, Batangas
IJMRA, Volume 5 Issue 05 May 2022 www.ijmra.in Page 1124
60) Sarpong, G. O., Blankson, B. & Britwum, C.T. (2018). Residents’ views on benefits and costs of ecotourism projects: A
study of bobiri forest and butterfly sanctuary in Ghana International Journal of Hospitality and Tourism Systems.
International Journal of Hospitality & Tourism Systems, vol. 11 No.1
61) Serebryakova, N., Dorohova, N., & Isaenko. M. (2021). Current State and Prospects of Ecotourism Development in Russia.
Actual directions of scientific researches of the XXI century: theory and practice. DOI: 10.34220/23088877-2021-8-4-77-
86
62) Sharpley, R. (2022) Tourism and Development Theory: Which Way Now?, TourismPlanning & Development, 19:1, 1-
12, DOI: 10.1080/21568316.2021.2021475
63) Spacey, J. (2018). 30 Examples of Business Problems.
https://simplicable.com/new/business-problems. Retrieved on 02.02.22
64) TIES (2019). What is Ecotourism? https://ecotourism.org/what-is-ecotourism/.Accessed 21 January 2022
65) Vitali, S. (2020). Sustainable tourism: the theory.
https://www.sustainabletourismworld.com/sustainable-tourism-the-theory/ (accessed 21 March 2022)
66) Wondirad, A. (2020). Ecotourism development challenges and opportunities in Wondo Genet and its environs, southern
Ethiopia. Journal of Place Management and Development. DOI: 10.1108/JPMD-12-2018-0109
67) Yu, S. B. (2020). Paraisong Nawala: Exploring Sustainable Ecotourism in the Philippines.[Bachelor’s Thesis, Scripps
College]. https://scholarship.claremont.edu/cgi/viewcontent.cgi?

INTERNATIONAL JOURNAL OF MULTIDISCIPLINARY RESEARCH AND ANALYSIS
ISSN(print): 2643-9840, ISSN(online): 2643-9875
Volume 05 Issue 05 May 2022
DOI: 10.47191/ijmra/v5-i5-31, Impact Factor: 6.261
Page No. 1125-1132
IJMRA, Volume 5 Issue 05 May 2022 www.ijmra.in Page 1125
Perception of Secondary School Teachers on Examination
Malpractice in Ibadan Metropolis, Ibadan, Nigeria
Prof. Babatunde Adeniyi Adeyemi1, Dr. Monilola Dasola Oyetade2
1Institute of Education, Faculty of Education, Obafemi Awolowo University, Ile- Ife. 2Department of Arts and Social Science Education, Lead City, Ibadan.
ABSTRACT: The study examined the perception of teachers towards examination malpractice in Ibadan metropolis, Ibadan,
Nigeria. It ascertained the causes of examination malpractice in the study area and identified ways of curbing related
examination malpractice. These were with a view to curbing examination malpractice in the study area. The study adopted a
descriptive survey research design. The sample size for the study comprised one hundred (100) teachers selected using simple
random sampling technique. An instrument tagged “Perception of Teachers on Examination Malpractice Questionnaire”
(PTEMQ) was used for data collection. The data were analyzed using descriptive statistics, mainly frequency counts,
percentages, mean and standard deviation. The findings of this study among others revealed that teachers’ perception of
examination malpractice in secondary schools was good (52%) in the study area. The most reported measures that curb
examination malpractice in study area were: prevention of students from bringing prepared answers to the examination halls (x ̄
= 3.42); and intensifying efforts in effective supervision of students during examinations (x ̄= 3.41); and strict punishment meted
out to officials caught with the act of examination malpractice (x ̄ = 3.39). The study concluded that teachers had good
perception of examination malpractice in secondary schools in the study area.
KEYWORDS: Examination malpractice, Perception, Teachers, Students, Secondary schools
INTRODUCTION
An examination is a veritable tool for evaluating the understanding of the knowledge gained in a particular task being exposed
to. Examination is extremely important not just in educational system, but also for the society at large. It is an activity
undertaken to ascertain the level of mastery of certain skills. Hence, it is an activity embarked upon at both formal and informal
settings of education since education is the process of facilitating learning, or the acquisition of knowledge, skills, values, morals,
beliefs, habits, and personal development for transmission of cultural heritage from one generation to the next. However, in
educational institutions, students are groomed through teaching to build required skills in them and promote knowledge of the
organized contents of study. Apart from teacher-made examination conducted to quantify the extent to which the curriculum
objectives are being achieved, examination bodies also conduct examinations especially at the completion of particular level in
order for the award of certification or placement.
Certain learning outcomes are set for the students to build their knowledge and skills, and to check either the students have
achieved those learning outcomes or not, the test is designed (Adegoke, 2011). In the early grades, schools are responsible to
conduct an exam in school premises and evaluate students’ performance. At the higher grades, students are appeared in
standardized test. Examination is a formal test of someone's knowledge or aptitude in a certain topic, notably via answering
questions or practical exercises, and that it is used to determine how much of a subject matter in a particular field of study the
applicant has learned (Aslam, Niazi and Iqbal, 2021).
Examinations are extremely important not just in our educational system, but also for our society (Amadi & Opuiyo, 2018). In
Nigeria for instance, different types of examinations are conducted by different authorities, for example, common entrance
examination conducted at the completion of primary education for placement into junior secondary school, basic education
certificate examination at the end of the junior secondary education, senior secondary school examination, a diploma or degree
exams, entrance test among others etc. Students have to pass a particular examination in which they appeared to guarantee

Perception of Secondary School Teachers on Examination Malpractice in Ibadan Metropolis, Ibadan, Nigeria
IJMRA, Volume 5 Issue 05 May 2022 www.ijmra.in Page 1126
their achievement of the learnt concepts. However, students have a variety of options for gaining success in these examinations,
one of which is cheating in examinations by copying from others or leaking exams papers (Birks, Mills, Allen and Tee, 2020).
Exam malpractice is defined as a purposeful violation of official examination norms intended to give unfairly advantage or
disadvantage to a candidate (Aslam, Niazi and Iqbal, 2021). Examination malpractice is any illegal act committed by a student
single handled or in collaboration with others like fellow students, parents, teachers, supervisors, invigilators, printers and
anybody or group of people before, during or after examinations in order to obtain undeserved marks or grades (Omebe, 2014).
Examination malpractice is any form of misbehavior that leads to the alteration of or a tempering with the prescribed ways of
conducting examination in any given system. It is a punishable offence which is committed during the process of normal and
recognized examination (Amadi and Opuiyo, 2018).
The wide spread and persistence of examination malpractices have been attributed to various reasons. The causes as identified
by Petters and Maureen (2014) include fear of failure, craze for certificate, desire of parents to have their children in choice
professions and university, pressure on students to pursue courses which they have no aptitude, pressure on teachers who want
to gain favour of student and overcrowded sitting arrangement. George & Ukpong (2013) links the increasing rate of
examination malpractice to poor teaching, ineffective preparation by students, ill-equipped library facilities, and dubious
admission policy.
Also, Akaranga & Ongong (2013) views the cause of examination malpractice to parental upbringing. They opined that because
of social status and economic ability, most parents are easily persuaded to bribe their way through for the sole success of their
children and self-gratification. The overdependence on educational certificates as a measure of one’s knowledge and
competence has led to a mad rush by most people for educational certificates through unethical means. The Nigerian society
today is characterized by a heavy emphasis on success and wealth without a corresponding emphasis on legitimate means and
avenues to be used in achieving the success. The country has become a commercial venture and no longer a place for selfless
service (Aslam, Niazi and Iqbal, 2021). Examination malpractice has been a problem affecting the quality of education worldwide
and in turn has negative implications on the overall development of a nation. Despite all efforts by professionals in the
education sector and policy makers to curb the wide spread of examination malpractice, examination malpractice still prevails in
most secondary schools (Akunne, Chigbo-Obasi and Iwogbe, 2021). This unethical behaviour has led to cancellation and seizing
of examination results by examination bodies and so requires urgent attention for more serious reason.
Curbing the unethical practices in examination conduct is achievable through a concerted effort of all the stakeholders in
education. Researches were and are been conducted on the possible ways of curbing examination malpractices. Mashanyare
and Chinamasa (2014) suggested, as a way of reducing examination malpractices, the need for debates on examinations
leakages on mass media to raise public awareness. Adeyemi (2010) called for increased efforts on effective supervision of
students during examinations, for instance, checking for electronic devices on students before entering examination halls,
termination of examination officials and teachers involved in perpetrating examination malpractices so as to deter others from
doing the same. Maheka (2015) recommended schools to conduct intensified sensitization to both teachers and learners; the
relevant Ministry, through the standards officers and school managers, should intensify monitoring in order to ensure quality
delivery of lessons so as to develop confidence in learners; conduct student awareness campaigns and workshops to highlight
the importance of the integrity of the education system and also to stiffen and enforce security policies.
Tawiah, Alberta, Bossman and Ata (2015) recommended withdrawal, rustications and imprisonment of culprits while Pana Press
(2016) emphasized the idea of arresting the culprits. In Kenya, Muthaa, Muriungi and Njue (2014) recommended that
governments should develop policies that ensure examinations are only manned by security officers trained on examination
management and that security officers should be training on examinations management and their role expectations.
Muchemwa and Dhliwayo (2017) concluded in their study that it is possible to curb examination malpractices at all examination
related levels, that is, student, teacher, examination boards, examination storage and transportation by providing necessary
facilities, establishment of standing examination policies and decrees, proper training to all involved, awareness campaigns and
workshops, arresting and terminating the culprits and abolishing ranking of schools per examination results.
STATEMENT OF THE PROBLEM
Examination is essential to student’s academic experience at any educational level because the assessment of students’
academic achievement hinges on it. Future progress, as well as employment opportunities of students, depends on the results of
the examination taken which invariably means that such examination should be conducted properly to ensure that it tests what
it is supposed to test and that the results reflect a candidate's genuine position. Despite the great value placed on examinations,
examination misconduct is, however, widespread as researches suggest that examination misconduct is increasing day by day.

Perception of Secondary School Teachers on Examination Malpractice in Ibadan Metropolis, Ibadan, Nigeria
IJMRA, Volume 5 Issue 05 May 2022 www.ijmra.in Page 1127
To this end, the perception of teachers who are directly involved in the conduct of examinations on the examination
malpractices among the students they teach and interact with, becomes necessary, hence this study.
Purpose of the Study
The main purpose of the study is to investigation the perception of teachers towards examination malpractice in Ibadan
metropolis:
The specific objectives of the study are to:
1. examine the perception of secondary school teachers on examination malpractice in Ibadan metropolis;
2. ascertain the causes of examination malpractice among secondary school students in the study area; and
3. Identify ways of curbing related examination malpractice in the study area.
Research Questions
The following research questions guided the study and they are stated below:
1. What are the perceptions of secondary school teachers on examination malpractice in Ibadan metropolis?
2. What are the causes of examination malpractice among secondary school students in the study area?
3. What are the strategies for curbing examination malpractice in the study area?
METHODOLOGY
The study adopted a descriptive survey design since the intention was to determine the perception of public secondary school
students towards examination malpractices and examination ethics. The population for the study comprised secondary
school teachers in Ibadan metropolis. The sample for this study consisted of one hundred (100) secondary school teachers. Ten
schools were selected for this study using simple random sampling technique. In each school, ten (10) teachers were selected
using simple random sampling technique giving a total number of 100 teachers that constituted the sample for the study. An
instrument tagged “Perception of Teachers on Examination Malpractice Questionnaire” (PTEMQ) was used to collect data for
the study. The PTEMQ has four sections. Section A consisted of socio-demographic information of the respondents; Section B
contained 10 items on the teachers perception of examination malpractice; Section C consisted 10 items on the causes of
examination malpractice and Section D consisted 10 items on strategies for curbing examination malpractice based on Likert
rating scale of Strongly Agreed (SA), Agreed (A), Disagree (D) and Strongly Disagree (SD).
A structured questionnaire used as the research instrument was subjected to face and content validity. The research instrument
was adequately checked by experts in Test and Measurement and later administered on 40 teachers outside the study area and
was validated in which the Cronbach Alpha yielded 0.74. The researchers personally visited the selected secondary schools and
sought permission from the school principal to make use of the schools for the study. The researchers then approach the
teachers and explain the purpose of the study to them. Thereafter, the researcher administered the questionnaire to the
respondents to elicit information on their perception of examination malpractice. The data collected were analysed using
frequency count, percentage, mean and standard deviation through (SPSS).
RESULTS
Socio-demographic information of secondary school teachers in Ibadan metropolis.
Table 1: Descriptive analysis of socio-demographic information of secondary school teachers in Ibadan metropolis
S/N Variables Frequency (f) Percentage (%)
1. Gender Male 52 52.0
Female 48 48.0 2. Age Less than 30 years 40 40.0 30-40 years 58 58.0 41 years and above 2 2.0 3. Teaching Experience Less than 10 years 48 48.0 10-20 years 46 46.0 21 years and above 6 6.0 4. Qualifications NCE 32 32.0 BSc.Ed./BEd./BSc. 56 56.0 Others 12 12.0

Perception of Secondary School Teachers on Examination Malpractice in Ibadan Metropolis, Ibadan, Nigeria
IJMRA, Volume 5 Issue 05 May 2022 www.ijmra.in Page 1128
Results in Table 1 showed the descriptive analysis of socio-demographic information of secondary school teachers in Ibadan
metropolis. From the Table 1, it can be gathered that 52.0% of the respondents are males while the remaining 48.0% are
females even as 40.0%, 58.0% and 2.0% are in the age range of less than 30 years, 30-40 years and 41 years and above
respectively. Additionally, 48.0%, 46.0% and 6.0% of the teachers had less than 10 years, 10-20 years and 21 years and above
teaching experience respectively. Considering educational qualifications, 32.0% qualified with NCE, 56.0% qualified with
BSc.Ed./BEd./BSc. and the remaining 2.0% pointed at others in the study area
Research Question 1: What is the teachers’ perception of examination malpractice in secondary schools in Ibadan metropolis?
In order to answer this research question, items in teachers’ perception of examination malpractice considering the 10 items on
the perception were scored using the format of ‘’Strongly Agree’’ (SA) response that was allotted 4 points, ‘’Agree’’ (A) response,
3 points, ‘’Disagree’’ (D) response, 2 points and ‘’Strongly Disagree’’ (SD) response, was allotted 1 point. Responses from
individual to each item were computed and minimum and maximum scores obtained in this scale were 10 and 40 respectively.
Scores of 10-15 (0.0%-39.9%) = Low Perception; 16-23 (40.0%-59.9%) = Moderate Perception; and 24-40 (60.0%-100.0%) = High
Perception.
Table 2: Descriptive statistics of the teachers’ perception of examination malpractice in secondary schools in Ibadan
metropolise
S/N Perception Frequency (f) Percentage (%)
1. Low 22 22.0
2. Moderate 26 26.0
3. High 52 52.0
Total 100 100.0
N = 100
Results in Table 2 showed the descriptive analysis of the teachers’ perception of examination malpractice in secondary schools
in Ibadan. From the Table 2, it can be deduced that the teachers’ perception of examination malpractice in secondary schools is
high at 52.0% in the study area. However, 22.0% and 26.0% of the respondents had low perception and moderate perception of
examination malpractice respectively in the study area.
Figure 1: Teachers’ Perception of Examination Malpractice in Secondary Schools in Ibadan metropolis
Research Question 2: What are the causes of examination malpractice in secondary schools in the study area?
In order to answer this research question, data collected on various causes of examination malpractice considering the teachers’
responses to the 10 items in Section B based on Strongly Agree (SA), Agree (A), Disagree (D) and Strongly Disagree (SD) were
subjected to descriptive analysis of mean and standard deviation and the results are presented in Table 3.
0
10
20
30
40
50
60
Low Moderate High
Fre
qu
en
cy
Teachers' Perception of Examination Malpractice in Secondary Schools in Ibadan Metropolis

Perception of Secondary School Teachers on Examination Malpractice in Ibadan Metropolis, Ibadan, Nigeria
IJMRA, Volume 5 Issue 05 May 2022 www.ijmra.in Page 1129
Mean value below 2.00 = Not Causes of Examination Malpractice
Mean value of 2.00 and above = Causes of Examination Malpractice
Mean = x;̄ Standard Deviation = SD
Table 3: Descriptive analysis of the causes of examination malpractice in secondary schools in the study area
S/N Items x̄ SD
1. Lack of seriousness of students 3.75 0.48
2. Inability of parents to provide textbooks 3.03 0.87
3. Fear of failure 3.38 0.74
4. Lack of proper supervision during examination 3.21 0.84
5. Lack of necessary instructional facilities and resources 3.32 0.71
6. Peer group influence 3.47 0.67
7. Lack of ability to cope with both social and academic 3.32 0.80
8. Lack of confidence by the students 3.26 0.72
9. Scarcity of books in the library 2.98 0.95
10. Overcrowded sitting arrangement 3.02 0.89
N = 100
Results in Table 3 showed the descriptive analysis of the causes of examination malpractice in secondary schools in the study
area. Considering the mean scores, it can be observed from the Table that lack of seriousness of students, inability of parents to
provide textbooks, fear of failure, lack of proper supervision during examination, lack of necessary instructional facilities and
resources, peer group influence, lack of ability to cope with both social and academic, lack of confidence by the students,
scarcity of books in the library and overcrowded sitting arrangement at the mean scores of 3.75, 3.03, 3.38, 3.21, 3.32, 3.47,
3.32, 3.26, 2.98 and 3.02 respectively are the causes of examination malpractice in secondary schools in Ibadan metropolis.
Research Question 3: What are the measures that can curb examination malpractice in secondary schools in the study area?
In order to answer this research question, data collected on various measures that can curb examination malpractice
considering the teachers’ responses to the 10 items in Section B based on Strongly Agree (SA), Agree (A), Disagree (D) and
Strongly Disagree (SD) were subjected to descriptive analysis of mean and standard deviation and the results are presented in
Table 4.
Mean value below 2.00 = Not Measures that can Curb Examination Malpractice
Mean value of 2.00 and above = Measures that can Curb Examination Malpractice
Mean = x;̄ Standard Deviation = SD
Table 4: Descriptive analysis of the measures that can curb examination malpractice in secondary schools in the study area
S/N Items x̄ SD
1. Prevention of students from bringing prepared answers 3.42 0.67 to the examination halls 2. Cancellation of affected students’ results 3.21 0.61 3. Cancellation of the affected schools’ results 3.03 0.74 4. Blacklisting of the affected examination centres 3.19 0.69 5. Making concerted efforts in enhancing discipline among 3.35 0.72 students through counseling services in the schools 6. Full implementation of the examination malpractice decree 3.05 0.82 which provides for the imprisonment of culprits to 21 years jail term 7. Using electronic devices to check candidate before 3.35 0.72
entering examination halls 8. Intensifying efforts in effective supervision of students 3.41 0.62 during examinations 9. Increased emphasis on the use of continuous assessment 3.33 0.67 assessment by schools and examination boards 10. Strict punishment should be meted out to officials 3.39 0.63 caught with the act of examination malpractice
N = 100

Perception of Secondary School Teachers on Examination Malpractice in Ibadan Metropolis, Ibadan, Nigeria
IJMRA, Volume 5 Issue 05 May 2022 www.ijmra.in Page 1130
Results in Table 4 showed the descriptive analysis of the measures that can be used to curb examination malpractice in
secondary schools in the study area. Considering the mean scores, it can be deduced that prevention of students from bringing
prepared answers to the examination halls, cancellation of affected students’ results, cancellation of the affected schools’
results, blacklisting of the affected examination centres, making concerted efforts in enhancing discipline among students
through counseling services in the schools, full implementation of the examination malpractice decree which provides for the
imprisonment of culprits to 21 years jail term, using electronic devices to check candidate before entering examination halls,
intensifying efforts in effective supervision of students during examinations, increased emphasis on the use of continuous
assessment by schools and examination boards, strict punishment should be meted out to officials caught with the act of
examination malpractice at the mean scores of 3.42, 3.21, 3.03, 3.19, 3.35, 3.05, 3.35, 3.41, 3.33 and 3.39 respectively are the
measures that can be used to curb examination malpractice in secondary schools in the study area.
DISCUSSION OF FINDINGS
The results revealed that teachers’ perception of examination malpractice in secondary schools in Ibadan is good. This means
that it is an undeniable fact that examination malpractices is still very much been practiced despite the campaign against the act.
This might also not be unconnected with the fact some teachers are also involved in perpetrating the unholy acts as pointed out
by Situma and Wasike (2020) that teachers have been accused of facilitating test misconduct in numerous ways. Teachers give
answers to students in the examination hall and even work sums for students to copy rapidly before they are rubbed. Teachers
may believe that if the students do not get good marks in examinations, it may result to questioning their teaching activities as
well as that of the school management and society will know that they did not provide instruction effectively, which ultimately
cause bad appraisal. Therefore, they help students to cheat in examinations or assist them to write answers to protect their own
false image (Aslam, Niazi and Iqbal, 2021).
The results further revealed several causes of examination malpractices especially in the study area. Some of the causes
identified include lack of seriousness of students, inability of parents to provide textbooks, fear of failure, lack of proper
supervision during examination, lack of necessary instructional facilities and resources, peer group influence, lack of ability to
cope with both social and academic, lack of confidence by the students, scarcity of books in the library and overcrowded sitting
arrangement. This tallied with the submissions of Nwankwo & Nwankwo (2020) and Osadebe & Bini, (2018) that students’
attitude also play a significant role in examination misconduct. Because they are either sluggish or suspicious, certain pupils are
more likely to cheat than others. Azar & Applebaum, (2020) asserted that youngsters witness and copy what other persons do,
whether they are their teachers, friends, parents, relatives, or any person from the society. According to Gentina, Tang and Gu
(2017), children are merely replicating what they observe in society. They may have witnessed their parents using money to get
admittance, jobs, and other favours, either for themselves or for their children.
On curbing the prevalence of examination malpractices in schools, the results revealed that prevention of students from
bringing prepared answers to the examination halls, cancellation of affected students’ results, cancellation of the affected
schools’ results, blacklisting of the affected examination centres, making concerted efforts in enhancing discipline among
students through counseling services in the schools, full implementation of the examination malpractice decree which provides
for the imprisonment of culprits to 21 years jail term, using electronic devices to check candidate before entering examination
halls, intensifying efforts in effective supervision of students during examinations, increased emphasis on the use of continuous
assessment by schools and examination boards, strict punishment should be meted out to officials caught with the act of
examination malpractice can be adopted to curb examination malpractice in secondary schools. This is in line with the assertion
of Adeyemi (2010) who called for increased efforts on effective supervision of students during examinations such as serious
searching to check for electronic devices on students before entering examination halls, termination of examination officials and
teachers involved in perpetrating examination malpractices so as to deter others from doing the same.
Also, Maheka (2015) supported this view by recommending that schools conduct intensified sensitization to both teachers and
learners. He further stated that the relevant Ministry, through the standard officers and school managers, should intensify
monitoring in order to ensure quality delivery of lessons so as to develop confidence in learners; conduct student awareness
campaigns and workshops to highlight the importance of the integrity of the education system and also to stiffen and enforce
security policies.
Tawiah, Alberta, Bossman and Ata (2015) recommended withdrawal, rustications and imprisonment of culprits while Pana Press
(2016) emphasized the idea of arresting the culprits. In furtherance, Muthaa, Muriungi and Njue (2014) recommended that
governments should develop policies that ensure examinations are only manned by security officers trained on examination
management and that security officers should be training on examinations management and their role expectations.
Corroborating this finding, Muchemwa and Dhliwayo (2017) also concluded in their study that it is possible to curb examination

Perception of Secondary School Teachers on Examination Malpractice in Ibadan Metropolis, Ibadan, Nigeria
IJMRA, Volume 5 Issue 05 May 2022 www.ijmra.in Page 1131
malpractices at all examination related levels, that is, student, teacher, examination boards, examination storage and
transportation by providing necessary facilities, establishment of standing examination policies and decrees, proper training to
all involved, awareness campaigns and workshops, arresting and terminating the culprits and abolishing ranking of schools.
CONCLUSION
The study concluded based on the findings of the study that the teachers’ perception of examination malpractice in secondary
schools is high meaning they are well aware of the unethical act perpetrated during examinations. Also, lack of seriousness on
the part of students, inability of parents to provide textbooks, fear of failure, lack of proper supervision during examination, lack
of necessary instructional facilities and resources as well as peer group influence, are some of the reasons for indulging in the
practices. Finally, prevention of students from bringing prepared answers to the examination halls, cancellation of affected
students’ results, cancellation of the affected schools’ results, blacklisting of the affected examination centres, making concerted
efforts in enhancing discipline among students through counseling services in the schools and full implementation of the
examination malpractice decree are some of the ways to curbing examination malpractices in senior secondary schools.
RECOMMENDATIONS
The following recommendations are put forward based on the findings of the study.
Students should be well prepared for examinations at all times.
Teachers are expected to be more vigilant during examination invigilation
Parents should endeavour to make available every necessary equipment and materials needed to complement the
school effort to adequately enhance teaching and learning and to prepare students for examinations without engaging in
malpractices
Government through examination bodies or agencies should put every mercenaries to checkmate the practice of
examination malpractices
REFERENCES
1) Adegoke, B. (2011). A survey of examination: Malpractice among secondary school students causes, effects and
solutions. GRIN Verlag.
2) Adeyemi, T. O. (2010). Examination malpractices among secondary school students in Ondo State, Nigeria: Perceived
causes and possible solutions. Journal of Education Administration and Policy Studies, 2(3), 48-55.
3) Akaranga, S. I., & Ongong, J. J. (2013). The phenomenon of Examination Malpractice: An Example of Nairobi and
Kenyatta Universities. Journal of Education and Practice, 4(18): 87 – 96.
4) Akunne, L., Chigbo-Obasi, T. & Iwogbe, E. (2021). Perceived Strategies for Curbing Examination Malpractice Among
Secondary School Students in Nigeria. Asian Journal of Education and Social Studies, 8-17.
5) Amadi, E. C. & Opuiyo, A. R. (2018). Forms and causes of examination malpractice among university students: A case of
Rivers State University, Port Harcourt. International Journal of Innovative Education Research, 6(1), 37-41.
6) Aslam, R., Niazi, S. & Iqbal, S. (2021). Teachers' Perceptions on Examination Malpractice at Secondary School Level: A
Descriptive Investigation. PAPER INFO ABSTRACT, 5, 181-192.
7) Azar, O. H. & Applebaum, M. (2020). Do children cheat to be honored? A natural experiment on dishonesty in a math
competition. Journal of Economic Behavior & Organization, 169, 143-157.
8) Birks, M. Mills, J. Allen, S. & Tee, S. (2020). Managing the mutations: academic misconduct Australia, New Zealand, and
the UK. International Journal for Educational Integrity, 16(1), 1-15.
9) Gentina, E. Tang, T. L. P. & Gu, Q. (2017). Does bad company corrupt good morals? Social bonding and academic
cheating among French and Chinese teens. Journal of Business Ethics, 146(3), 639-667.
10) George, I. N., & Ukpong, D. E. (2013). Contemporary Social Problems in Nigeria and its Impact on National
Development: Implication for Guidance and Counselling Services. Journal of Educational and Social Research, 3(2), 167
– 173.
11) Maheka, G. (2015). Nature and causes of examination malpractices in selected secondary schools in Kitwe District,
Zambia. A dissertation in the University of Zambia
12) Mashanyare, I. & Chinamasa, E. (2014). School Examinations leakage: Case of Zimbabwe Schools Examinations Council.
IOSR Journal Of Humanities And Social Science (IOSR-JHSS) Volume 19, Issue 4. www.iosrjournals.org
13) Muchemwa, S. & Dhliwayo, A. (2017). Curbing Examination Malpractices in Africa: Content Analysis. Journal of Research
Innovation and Implications in Education, 1(3), 126-139.

Perception of Secondary School Teachers on Examination Malpractice in Ibadan Metropolis, Ibadan, Nigeria
IJMRA, Volume 5 Issue 05 May 2022 www.ijmra.in Page 1132
14) Muthaa, G.M., Muriungi, P.K. and Njue, E.K. (2014). Competence of security officers in the management of national
examinations in secondary schools in Eastern Province, Kenya. Open Journal of Social Sciences, 2, 73-78.
15) Nwankwo, C. A. & Nwankwo, C. A. (2020). Relationship between students’ academic achievement motivation and their
attitude towards examination malpractice. Nnadiebube Journal of Education, 5(1), 71-83.
16) Omebe, C. A. (2014). Curbing Examination Malpractices in West African Senior School Certificate Examinations in
Nigeria. International Journal of Scientific & Engineering Research, 5(6), 1006-1011.
17) Petters, J. & Maureen, O. O (2014). Students’ Perception of Causes and Effects of Examination Malpractice in the
Nigerian Educational System: The Way Forward for Quality Education. Procedia - Social and Behavioral Sciences, 114,
125-129.
18) Situma, J. & Wasike, M. (2020). The challenge of examination malpractices in institutions of higher learning in Kenya.
International Journal of Academic Research in Business and Social Sciences, 10(9), 699-710.
19) Tawiah, D. K.; Alberta, G. Y.; Bossman, F. I.; Ata, D. (2015). The perception and reasons of examination malpractice
among students. International Journal of Innovative Research and Development, 4(4), 145-148.
There is an Open Access article, distributed under the term of the Creative Commons Attribution – Non Commercial 4.0 International (CC BY-NC 4.0) (https://creativecommons.org/licenses/by-nc/4.0/), which permits remixing, adapting and building upon the work for non-commercial use, provided the original work is properly cited.

INTERNATIONAL JOURNAL OF MULTIDISCIPLINARY RESEARCH AND ANALYSIS
ISSN(print): 2643-9840, ISSN(online): 2643-9875
Volume 05 Issue 05 May 2022
DOI: 10.47191/ijmra/v5-i5-32, Impact Factor: 6.261
Page No. 1133-1141
IJMRA, Volume 5 Issue 05 May 2022 www.ijmra.in Page 1133
Stress, Techno-Pedagogical Skills, and Quality of Life among
Faculty of a Local University in Laguna
Ma. Gloria G. Greganda1, Antonio R. Yango, PhD2 1,2 University of Perpetual Help System Laguna, Binan, Laguna, Philippines
ABSTRACT: The study determined the stress, techno-pedagogical skills, and quality of life among faculty of a local university in
Laguna. Descriptive correlational research design was employed. The study revealed that the faculty of a local university has a
high-level stress along pandemic stress and job-related stress; very high level of techno-pedagogical skills along content
knowledge, pedagogical knowledge, and technological knowledge; and have maintained satisfactory quality of life along physical
health, psychological well-being, social relationships, and environmental factors. The study revealed that there was no significant
association between level of stress and techno-pedagogical skills. However, there was a significant connection noted between
level of stress and quality of life, on most of its domains. Lastly, the level of techno-pedagogical skills among faculty can be equated
with better quality of life, that the higher the level of techno-pedagogical skills the more satisfied with their quality of life.
Essentially, the results yield worthwhile implications to faculty of a local university. Similarly, in managing stress, maintaining their
level of techno-pedagogical skills that will assist them in becoming more content and satisfied with many aspects of quality of life.
KEYWORDS: stress, techno-pedagogical skills, quality of life, faculty, local university
INTRODUCTION
The idea of quality of life has become a primary priority in modern society. Even though it is mixed up with living standards, it has
recently moved from many angles. Possession of riches does not automatically imply better happiness. Increases in the world's
richest countries' standard of living do not appear likely make a meaningful difference in people's quality of life, and they do not
necessarily reflect happiness, contentment, or well-being. (Eustress and Distress: Reactivation, 2019).
A person's impression of life in the context of their culture and value systems, as well as their objectives, aspirations,
perspectives, norms, and interests, is referred to as quality of life. (Mason et al., 2018). Even while a stress-free living might be
considered a good quality of life, each person encounters their own myriad of challenges, hardships, and challenges. These
difficulties include personal, psychological, biological, interpersonal, and even professional or work-related stress. (Jhon et al.,
2017).
In terms of Covid-19's impact on teachers' quality of life, the worldwide crisis has harmed people's mental, psychological,
and physical health. However, it was also said that the current scenario has a modest impact on quality of life, therefore the quality
of life of instructors' educators must be highlighted, and repercussions must be supplied with support as they continue to thrive
the current situation's impact, (Rabacal et al., 2020).
Stress is one of the most significant challenges faced by all as a result of global pandemic, which affects people from all
walks of life. Similarly on the study, that among Filipino school personnel, the quality of life and mental and emotional stress have
an adverse connection; as psychological distress and anxiety rise, so do psychological well-being, physical factors, social
interactions, and environmental factors, (Clavecillas et al., 2020). Moreover, Filipino teachers' sources of stress include discipline
and motivation, professional pain at work and expectations as they do their tasks and obligations, and time management, (Yazon
et al., 2019).
Furthermore, all school employees reported the same level of mental anguish and overall quality of life; however,
unmarried employees appeared to have more anxiety and stress symptoms than married employees. Moreover, on the study
conducted by Gang, (2022) revealed a connection between workplace spirituality and stress, as well as the mediation effect of
constructive deviance, which stated that work engagement promotes constructive deviance, thus, influences educators’
psychological stress.

Stress, Techno-Pedagogical Skills, and Quality of Life among Faculty of a Local University in Laguna
IJMRA, Volume 5 Issue 05 May 2022 www.ijmra.in Page 1134
Since then, teachers were already dealing with work-related stress, and additional burden imposed by the pandemic
stress was due to the seminars and training required to simply upskill themselves in handling students using the internet so that
they could improve their techno-pedagogical skills and offer lectures remotely to their students displaced to their homes and
provinces due to lockdowns implemented, (Albrahim, 2020).
In addition, educators are negotiating new technologies, balancing different types of training, and expressing doubts
about returning to face-to-face instruction and making teaching considerably more difficult and demanding due to having
increased their working hours by working remotely via internet, indicated 86 percent on the effects on their work family balance,
(Cardoza, 2021; Lizana et al., 2021). Further, efficient implementation of technologies in education necessitates teachers’ prowess,
which can entangle the linkage of curriculum requirements, (Tanucan et al., 2021).
There were numerous studies conducted about quality of life particularly the assessment of quality of life based on a
comprehensible theoretical framework, established methods, and a variety of applications and quality of life among elders.
Recently, the evaluation of quality of life has become useful in a wide range of fields, together with education, attempting to
determine the impact of illness/disease, and many other instances. However, there were no study yet conducted among faculty
on a local university particularly on stress, techno-pedagogical skills, and quality of life. In addition, there were no studies
conducted about the significant relationships among the three variables.
Thus, the study was attempted to assess the level of stress, techno-pedagogical skills, and quality of life among faculty
on a local university and addressed issues and concerns of the faculty stress, techno-pedagogical skills, and quality of life and
served as a guideline and reference for the local university administrators in the policy making and establishing faculty
development programs and activities in maintaining and improving employee’s quality of life while achieving the university’s
mission and vision.
METHODS
Research Design
Descriptive-correlational research design was used specifically in this study as it is the most effective research model for
this particular study. The study looked at the level of stress, level of techno-pedagogical skills, and quality of life among faculty at
a local university in Laguna. The researcher used this research design to investigate the significance of a relationship between two
or more factors or characteristics, (Bermudo et al. 2014, Polka, 2018).
Participants of the Study
The researchers used stratified random sampling to determine 160 faculty from a local university in Laguna. Slovin's
formula had been used to extract the data. 114 participants were taken from four colleges at a local university. There are 27
faculty from the College of Computing and Engineering (CCE), 24 from the College of Business Administration and Accountancy
(CBAA), 33 from the College of Education, Arts, and Sciences (CEAS), and 30 from the College of Health and Allied Sciences (CHAS).
These faculty were teaching at a local university prior to the Pandemic and are currently employed in the Pamantasan ng Cabuyao
Academic Year 2021-2022.
Data Analysis
For data processing, the following statistical tools were used, the Weighted Mean was used to calculate the level of stress
along pandemic stress and job-related stress and level of techno-pedagogical skills along to content knowledge, pedagogical
knowledge, and technological knowledge. For Quality of Life the researcher followed the Scoring of the WHOQOL-BREF for
converting raw scores to transformed scores of the four domains such as physical health, psychological well-being, social
relationships, and environmental factors all contribute to one's quality of life. Pearson r was used to determine whether there is
a statistically significant relationship between respondents’ level of stress and techno-pedagogical skills; and between level of
stress and quality of life and level of techno-pedagogical skills and quality of life.
Through in-depth literature and related study readings, verification and validation were used to build links that support
the findings of this paper. The Cronbach-Alpha reliability test was used to validate the questionnaires and guarantee that a
substantial sample of respondents was used.
RESULTS AND DISCUSSION
The study aimed to determine the stress, techno-pedagogical skills, and quality of life among faculty of a local university in
Laguna.
Specifically, the study sought answers to the following questions:

Stress, Techno-Pedagogical Skills, and Quality of Life among Faculty of a Local University in Laguna
IJMRA, Volume 5 Issue 05 May 2022 www.ijmra.in Page 1135
Table 1. Summary Table for the Respondents’ Level of Stress
Legend: (Strongly Agree/Very High - 4, Agree/High – 3, Disagree/Low – 2, Strongly Disagree/ Very Low – 1)
Table 1 illustrated the summary for the respondents’ level of stress along pandemic stress and job -related stress. The
respondents’ level of pandemic stress ranked 1st, with a weighted mean of 2.59 and a verbal interpretation of “high”, while
respondents’ level of job-related stress ranked 2nd, with a verbal interpretation of “high”.
To summarize, the overall weighted mean of 2.58 revealed that faculty of a local university experienced high-level of
stress both related due to pandemic and job- related stress which means that they felt that something would occur abruptly, and
the students were unable to participate actively during online activities due to internet disruptions and erratic connections.
The findings support the studies that individuals’ lives were severely disrupted during pandemic, with daily interaction
being replaced by long periods of isolation and loneliness, (Armigate et al., 2020). In addition, many people were terrified of
infection and death, worried about their loved one’s safety and worried about the future, (Brooks et al. 2020). Furthermore,
Cardoza, (2021) mentioned that teachers have been challenged by the new working conditions as a result of pandemic, making
teaching considerably more difficult and demanding job in the Philippines since teachers are deeply challenged by the demands
of the work and the situations.
Overall, on the study made by Jhon et al. (2017); Riberion et al. (2017); Oducalo et al. (2021); and Yazon et al. (2019), that
stress is a circumstance in which a worker's job-related influences move away from normal functions and can contribute to the
emergence of job-burn out. Moreover, they asserted that stress may be harmful to one's health. Further to that, the infection risk
was regarded as one of half of the professional teachers' sources of stress. Moreover, that due to stress, teachers tend to be less
committed in teaching and may experiences job burnout which is characterized by a state of physically and psychologically
exhaustion related to work or caregiving activities.
Table 2. Summary Table for the Respondents’ Level of Techno-pedagogical Skills
Indicators
Weighted
Mean
Verbal
Interpretation
Rank
1. Content knowledge 3.44 Very High
(Strongly Agree)
1
2. Pedagogical knowledge 3.37 Very High
(Strongly Agree)
3
3. Technological knowledge 3.40 Very High
(Strongly Agree)
2
Overall Weighted Mean 3.40 Very High
(Strongly Agree)
Legend: (Strongly Agree/Very High - 4, Agree/High – 3, Disagree/Low – 2, Strongly Disagree/ Very
Low – 1)
As shown on Table 2, the summary for the respondents’ level of techno-pedagogical skills among faculty where the level of
techno-pedagogical skills along content knowledge. The overall weighted mean obtained 3.40, revealed that the faculty of a local
university has a very high level of techno-pedagogical skills along content knowledge, pedagogical knowledge, and technological
knowledge. This means that faculty respondents are techno-pedagogically proficient such that they can draft and develop learning
and assessment activities that align with learning goals and objectives, had the ability to motivate students and show enthusiasm
and interest while teaching virtually, had the ability to make use of technology effectively in teaching.
Indicators
Weighted Mean Verbal
Interpretation
Rank
1. Pandemic stress 2.59 High
(Agree)
1
2. Job-related stress 2.56 High
(Agree)
2
Overall Weighted Mean 2.58 High
(Agree)

Stress, Techno-Pedagogical Skills, and Quality of Life among Faculty of a Local University in Laguna
IJMRA, Volume 5 Issue 05 May 2022 www.ijmra.in Page 1136
The findings support the study made by Bold et al. (2017); Sen et al. (2022) which states that teachers’ decision about
components, instructional approaches, assessing student learning feedbacks, and other factors are influenced between content
knowledge and pedagogical content knowledge. In addition, on the study conducted by Nami, (2022) which states that through
professional development courses promotes teachers’ pedagogical knowledge by providing them opportunities for reflection and
practice course preparation. Further, in the other study conducted, in the emerging economy in education, technological
innovation can be used to incorporate different strategies in teaching practice, thus further improving teachers teaching
performance and in order to become competent teachers, they must be familiar with and apply all the necessary pedagogical skills
for teaching with technological knowledge, (Gallegos et al., 2022; Tondeur et al., 2019).
Overall, the findings support the studies made by Albrahim, (2020); Sikshanamadira; (2020); and Guru et al. (2019) , since
they gained similar results with the attributes or skills of e- moderators defined in five categories such as understanding the online
process, technical skills, online communication skills, content expertise and personal characteristics, Further, it was also
mentioned that effective online educators should be familiar with the fundamentals of online pedagogy and instructions such
learning theories and design. Likewise, technology -based scientific pedagogical approach is an unavoidable requirement for
teachers in the rest of Covid-19 era. Lastly, techno-pedagogical competency of teachers is significant to the academic achievement
of students, (Guru et al., 2019).
Table 3. The Respondents’ Quality of Life
Domains Mean Transformed Score
(0-100)
Verbal
Interpretation
Rank
1. Physical Health 64.05
Good
(Satisfied)
4
2. Psychological Well-Being 67.85 Good
(Satisfied)
2
3. Social Relationships 69.48 Good
(Satisfied)
1
4. Environmental Factors 65.35 Good
(Satisfied))
3
Average 66.68 Good
(Satisfied)
Legend: less than median (poor QoL/ unsatisfied feeling with physical health and other domains) and those who
had score equal or more than medium (good QoL/ satisfactorily feeling with physical health and other domains.
Table 3 illustrates the respondents’ quality of life along physical health, psychological well- being, social relationships, and
environmental factors. The domain/dimension 3 which is the social relationships with the highest Mean Transformed Scores of
69.48 out of 100 which means that the respondents were satisfied with their personal relationships, as well as with their sex life
and satisfied with the support they had gotten from their friends.
Domain 2/dimension 2 which is the psychological well-being with the second highest mean transformed scores of 67.85
out of 100 which means that the respondents had mostly accepted, felt good and satisfied with their body appearance and were
very much able to concentrate.
The domain/dimension 4 which is the environmental factors ranked 3rd with the Mean Transformed Scores of 65.35 out of
100 which means that faculty of a local university were satisfied/good and had very much felt safe in their daily lives, healthy with
their physical environment, and mostly had enough money to provide their needs as well as mostly had the opportunity for leisure
activities.
The domain/dimension 1 which is the physical health ranked 4th with the Mean Transformed Scores of 64.05 out of 100
which means that the faculty were satisfied with their ability to perform daily activities and gained high energy for their daily lives.
To summarize, with the Weighted Mean Transformed Scores of 66.68 out of 100, this indicated that the quality of life among
faculty in a local university was satisfied since it is above median even during this pandemic, above all, this implies that despite of
struggles and challenges, faculty still had found time to maintain a reasonable quality of life along with social relationships,
psychological well-being, environmental factors and physical health.
The results of the study showed similarity in the study conducted that the concept of Quality of Life had become a key goal
of the modern world. However, based on the Eustress and Distress: Reactivation, (2019) that resource possession does not always
lead to greater happiness. Moreover, increases in the standard of living in the world's richest countries do not appear to make a

Stress, Techno-Pedagogical Skills, and Quality of Life among Faculty of a Local University in Laguna
IJMRA, Volume 5 Issue 05 May 2022 www.ijmra.in Page 1137
significant difference in people's quality of life, and they do not necessarily indicate happiness and contentment or well-being.
Furthermore, quality of life is the subjective assessment of how an individual interacts with the world in the setting that they are
now experiencing, particularly during this pandemic moment, (Mason et al., 2018).
In addition, on the studies made by Camara et al. (2017); CIS, (2018); Riberion et al. (2021); and Benevene, (2020), the
following dimensions of social relationships, physical health, psychological well-being, and environmental factors all have an impact
on faculty quality of life. Since it was noted that social relationships are associated with a reduced level of psychological challenges
and shield people from the onset of any depression symptoms, it has been related to a reduced number of psychological issues.
Additionally, teachers who had been teaching for a long time had developed a stronger sense of resilience and had a greater ability
to build a positive dynamic equilibrium through resources, emotional difficulties, and struggles. Likewise, teachers' physical and
psychological health have suffered as a result of the negative influence on their quality of life. Teachers' physical health and
psychological well-being are impacted by burnout and attrition. As a result, poor physical health, mental health, and chronic
insomnia all contributed to a much lower quality of life. Lastly, in terms of environmental factors, a favorable classroom environment
helps teachers and students pay attention, alleviate anxiety, and maintain emotional and social rules. As a result, a positive school
climate and healthy surroundings promote teachers' emotional and physical well-being, and a favorable school climate increases
faculty and teacher quality of life.
However, on the study conducted about the WHOQOL-BREF Scale, there is no clear cut -off to determine “good or poor
Quality of Life or feeling satisfied with physical health and other domains. Thus, it can be classified that faculty who had less than
median (poor QoL/ unsatisfied feeling with physical health) and those who had score equal or more than medium (good QoL/
satisfactorily feeling with physical health and other domains, (Singh et al., 2022). In conclusion, the domain scores were scaled in
a positive direction, the higher the transformed scores denote higher quality of life, (WHOQOL- BREF).
Table 4. Relationship between the Respondents’ Level of Stress and Level of Techno-pedagogical Skills
Stress
Techno-pedagogical skills
Content knowledge Pedagogical knowledge Technological
knowledge
Pandemic stress r = -0.043
Negligible correlation
p = 0.651
r = -0.077
Negligible
correlation
p = 0.413
r = 0.003
Negligible
correlation
p = 0.972
Job-related stress r = -0.035
Negligible correlation
p = 0.712
r = -0.079
Negligible
correlation
p = 0.406
r = -0.048
Negligible
correlation
p = 0.609
Significance level @ 0.05
Table 4 showed that the conducted Pearson r correlation analysis generated a computed Pearson r values ranged from -
0.077 to 0.003 interpreted as negligible correlation with probability values ranged from 0.406 to 0.972 were greater than the 0.05
significance level. In this case, the decision is failed to reject the null hypothesis, which means there was no significant relationship
between the respondents’ level of stress and level of techno-pedagogical skills.
This implies that no matter how low or high the level of stress it did not affect their level of techno-pedagogical skills among
faculty. Furthermore, this would also mean that majority of the faculty were resilient with stress and frustrations while there is
transition on the delivery of instructions.
The results of the study contradicted the findings of the study by Albrahim, (2020) that the infusion of technology may
bring discomfort to the teachers especially when dealing with technology-enhanced classrooms. and how to deal with stress and
frustrations while making the transition to online learning environment. In addition, Steiner et al. (2021) mentioned the top ranked
sources of stress among teachers are teaching in person and remotely at the same time. Further, changes in school’s instructional
model and other workloads including attending seminar and training to get familiarized with different platforms during the
beginning of pandemic since teachers are negotiating new technology as well as balancing different forms of instructions,
(Pressley, 2021).
However, it was mentioned that online faculty members require a framework and guidelines that support them improve
their abilities, and aid in the design of appropriate training programs. Therefore, continuous training and seminars for teachers
must be provided in the technology emerging profession, (Albrahim, 2020).

Stress, Techno-Pedagogical Skills, and Quality of Life among Faculty of a Local University in Laguna
IJMRA, Volume 5 Issue 05 May 2022 www.ijmra.in Page 1138
Table 5. Relationship between the Respondents’ Level of Stress and Quality of Life
Stress
Quality of Life
Physical health Psychological
well-being
Social relationship Environmental
factors
Pandemic stress r = -0.321*
Low correlation
p = 0.001
r = -0.379*
Low correlation
p = 0.000
r = -0.133
Low correlation
p = 0.159
r = -0.191*
Low correlation
p = 0.042
Job-related stress r = -0.348*
Low correlation
p = 0.000
r = -0.365*
Low correlation
p = 0.000
r = -0.200*
Low correlation
p = 0.033
r = -0.329*
Low correlation
p = 0.000
*Significant @ 0.05
As shown in the table above, for the relationship between the respondents’ level of stress and quality of life among faculty
of a local university in Laguna, specifically pandemic stress and quality of lifebalong physical health, psychological well- being, and
environmental factors, and social relationships along job-related stress with a Pearson r correlation analysis generated a computed
values ranged from -0.321 to 0.379 interpreted as low correlation with probability ranged from 0.000 to 0.042 which were less
than the 0.05 level of significance. However, on the social relationship along pandemic stress with a Pearson r value of -0.133
with probability value of 0.159 which was greater than 0.05 level of significance. This means there was significant relationship
between stress along pandemic stress and job-related stress and quality of life along physical health, psychological well-being, and
environmental factors, job related stress along social relationship, however, pandemic stress along social relationship showed no
significant relationship.
This implies that the higher the level of pandemic stress and job-related stress the lower the satisfaction of the quality of
life along of physical health, psychological well-being, and environmental factors. Furthermore, job related stress had inverse
relationship along social relationships which means that the higher the job-related stress the lower the satisfaction along social
relationships, however, no matter how high or low the pandemic stress, the quality of life along social relationships remains
unaffected. To summarize, this means that in general stress had affected most of the domains of quality of life but not all.
The findings support the study made by Riberion et al. (2017) which states that teachers’ well - being has received more
attention, owing to a significant increase in sick leave and job deciding to quit across countries and culture as a result teaching is
a demanding, more difficult profession that is prone to stress and higher rate of attrition. In addition, it was also stated that
perceived stress was significantly has negative correlation association with quality of life specifically with physical health and
psychological well-being, which means if the person has a high level of stress, more likely the immune system will be affected they
tend to get physically sick and prone to mental exhaustion and depression. Moreover, environmental factors played a significant
role in teachers achieving a high quality of life. A positive classroom environment improves attention, reduces anxiety, and upholds
emotional and social regulation for both teachers and students, (CIS, 2018). However, the result of the findings on social
relationship contradicted the findings of Camara et al. (2017); Alsubaie et al. (2019), and Kim, (2020) that social relationship has
positive association with quality of life with three sources of social support such as family, friends and significant others which
means that stress can be avoided if you have better social relationship with the people around you. In addition, positive
relationships can manifest stress free environment. Furthermore, a positive culture associated with a positive school climate
improves the quality of life for both students and teachers, (Kim, 2020).
Table 6. Relationship between the Respondents’ Level of Techno-pedagogical Skills and Quality of Life
Techno-pedagogical
skills
Quality of Life
Physical health Psychological
well-being
Social
relationship
Environmental
factors
Content knowledge r = 0.246*
Low correlation
p = 0.008
r = 0.281*
Low correlation
p = 0.002
r = 0.214*
Low correlation
p = 0.022
r = 0.303*
Low correlation
p = 0.001

Stress, Techno-Pedagogical Skills, and Quality of Life among Faculty of a Local University in Laguna
IJMRA, Volume 5 Issue 05 May 2022 www.ijmra.in Page 1139
As shown in the table above, Pearson r correlation analysis generated computed values ranging from 0.214 to 0.391
interpreted as low correlation with probability values in the range from 0.000 to 0.022 were less than 0.05 level of significance for
the relationship between respondents' level of techno-pedagogical skills and quality of life. This means that domains/dimensions
of quality of life along physical health, psychological well-being, social relationships, and environmental factors and techno-
pedagogical skills along content knowledge, pedagogical knowledge, and technological knowledge were significant at the 0.05
level of significance. Therefore, rejected the null hypothesis. Furthermore, this implies that the higher the level of content
knowledge, pedagogical knowledge and technological knowledge the higher the quality of life along physical health, psychological
well-being, social relationships, and environment factors among the faculty of a local university in Laguna. In general, there was a
link between respondents' level of techno-pedagogical skills and their overall quality of life.
The findings support the studies made by Dhawan, (2020) ; Favale et al. (2020); and Fernandez et al. (2020) which state
that there was the existence of a connection between techno-pedagogical skills along content knowledge, pedagogical knowledge,
and technological knowledge and quality of life along physical health, psychological well -being, social relationships, and
environmental factors since there are drawbacks to using technological -pedagogical practices because to the current situation
such as virtual learning and teaching, an imbalance due to insufficient similitude. Similarly, the psychological well-being such as
the level of anxiety and silent attitude toward using the latest technology in teaching it was revealed which played a huge part in
obstructing techno-pedagogical practices. As a result, technologies have caused mental problems due to a variety of factors such
as lack of training and herd mentality to use them.
However, these endeavors that teachers exhibit anxiety issues or stress as a result of their information technology in the
classroom, and digital literacy has become effective venue in education and teachers’ professional development, thus that virtual
professional development supports the challenges that teachers face in the current digital age, and that teaching-based
professional development can improve teachers' digital learning identities that can improve their quality of life. (Zimmer et al.,
2022) Moreover, on the study conducted that those teachers had low mean Quality of Life scores particularly on Mental
Component Summary due to adverse effects and detrimental effects of teaching digitally and remotely, (Lizana et al., 2021).
CONCLUSIONS
That the faculty of al local university experienced high level of stressed both related to pandemic and job-related stress due to
current situation brought by many uncertainties of Covid-19 as well as the fear of getting infected by the deadly virus and the
attitudes of students during online due to intermittent internet signals. They were techno-pedagogically proficient since they had
the ability to express various strategies and techniques about the course being taught, their expertise helped them develop their
deep understanding of the corresponding curriculum, they have had very high level of specialized knowledge displayed for
effective learning environments to diverse students. Lastly, they were technologically proficient in which they understood the
basic computer functions, operations, and other online platforms. Moreover, respondents’ quality of life along physical
health, psychological well-being, social relationships, and environmental factors were satisfied because they maintained good
physical health despite of pandemic and threat on their health, they have mostly accepted their body appearance, they were
satisfied with their personal relationships, sex life, and to the support they have gotten from their friends, and lastly, had very
much felt safe in their lives, satisfactorily healthy with their physical health.
The results showed that faculty’s level of stress has nothing to do with their level of techno-pedagogical skills, that despite
of their anxieties, and fear felt they will continue to be techno-pedagogically proficient in order to perform their duties and
responsibilities in the delivery of instruction. On the other hand, there was a connection between the level of stress and quality
of life more particularly the physical health, psychological well-being and environmental factors, however pandemic stress had
nothing with the social relationships. Overall, low level of stress among faculty assured good quality of life in most of its domains.
Furthermore, there was a significant relationship between level of techno-pedagogical skills and quality of life. Thus, the
higher the level of techno-pedagogical skills the better the quality of life among faculty.
Pedagogical
knowledge
r = 0.320*
Low correlation
p = 0.001
r = 0.300*
Low correlation
p = 0.001
r = 0.331*
Low correlation
p = 0.000
r = 0.391*
Low correlation
p = 0.000
Technological
knowledge
r = 0.219*
Low correlation
p = 0.019
r = 0.240*
Low correlation
p = 0.010
r = 0.270*
Low correlation
p = 0.004
r = 0.298*
Low correlation
p = 0.001
*Significant @ 0.05

Stress, Techno-Pedagogical Skills, and Quality of Life among Faculty of a Local University in Laguna
IJMRA, Volume 5 Issue 05 May 2022 www.ijmra.in Page 1140
Lastly, there is a need to continuously implement the action plan to improve, and enhance on managing stress, sustain
and maintain the level of techno-pedagogical skills and sustain the quality of life among faculty of a local university in Laguna.
FUTURE DIRECTIONS
The investigation, however, has some limitations, most notably the sample size, which was limited to the faculty of a local
university in Laguna during the Academic Year 2021-2022. It is proposed that future researchers conduct a similar study with such
a larger number of respondents to optimize generalization. Other employees of the local university, as well as other variables,
may be considered for a more comprehensive picture of the interplay of the variables. On a practical level, the study's findings
have important impacts for faculty at a local university as a whole, particularly in terms of stress and quality of life, as well as
degree of techno-pedagogical skills and quality of life. A knowledge of the links between stress, techno-pedagogical skills, and
quality of life were determined to assist faculty in better managing stress, keeping their techno-pedagogical skills, and enhancing
and sustaining their quality of life’s satisfaction. Thus, stress management and techno-pedagogical skills will assist faculty at a local
university in becoming more content and satisfied with many aspects of quality of life.
REFERENCES
1. Albrahim, F.A. (2020). Online Teaching Skills and Competencies, Ministry of Education. The Turkish Online Journal of
Educational Technology. vol. 19, issue no.
2. Alsubie, M., Stain H. J., Webster, L.A.D, Wadman R. (2019). The Role of Sources of Social Support on Depression and
Quality of Life for Students. International Journal of Adolescence and Youth, 24:4 484-496.
doi:10.1080/02673843.2019.156887
3. Armitage, R., Nellums, L. B. (2020). Covid-19 and Consequences of Isolating the Elderly. The Lancet Public Health,
5(5).https://doi.org/10.1016/s2468-2667(20)30061-x
4. Benevene, P. (2020). Well-Being of Teachers in Their Work Environment. Frontiers in Psychology.
https://doi.org/10333889/fpsyg.2020.01239
5. Bold, T., Svensson, K., Molina, E., Stacy, B.W., Rockmore, C., Martin, G., Filmer, D., Wane, P. (2017). What do teachers
know and do? Does it matter? Evidence from primary school in Africa? Washington D.C.: World Bank.
https://documents.wworldbank.org/curated/en/882091485440895147/pdf/WPS7956.pdfB
6. Camara, M., Padilla, G.B.D. (2017). The Role of Social Support in Adolescents: Are you helping me or stressing me out?
(o. S. Council for Childrens's Right by: Camara, Ed.) International Journal Of Adolescence and Youth, 22(2), 123-126.
https://Cfcrights.org/the-effects-of- positive-school-environment
7. Cardoza, K. (2020). "We Need To Be Nurtured Too: Many Teachers Say They're Reaching a Breaking Out,".
https://www.npr.org/2021/04/19/9888211478
8. Clavecillas, E. & Perez, H. (2020). Psychological Distress as a Predictor of Quality of Life Among Selected Filipino School
Personnel. International Journal of Psychology and Counselling, Volume 12(3), 73-84.
https://doi.org/10.5897/IJPC2020.0608 Community in Schools (CIS), 2018
9. Dhawan, S. (2020). Online Learning: Panacea in the Time of Covid-19 Crisis. Journal of Educational Technology System,
49(1), 5-22. Eustress and Distress: Reactivation. (2019)
10. Favale, T., Soro, F., Trevisan, M., Drago, I., & Mellia, M. (2020). Campus Traffic and e-Learning during Covid-19
Pandemic.Computer Networks,176,107290
11. Ferguson, K., Mang, C., &Frost, L. (2017). Teacher Stress and Social Support Usage, Nipissing University. Brock Educationa
Journal, 26(2).
12. Fernandez- Batanero, J.M., Gravan, P., Rebollo, M., Rueda, M. (2021). Impact of Educational Technology on Teacher Stress
and Anxiety: A Literature Review. International Journal on Research Public Health, 18(548).
13. Fundacion, (2020). Chile Engagement and Exhaustion in Chilean Teachers: A Look from the Covid-19 Reality.
https://fch.cl/wpcontent/uploads/2020/09
14. Gallegos, J.V.,& Luna, J.P. (2022). The Effect of Technological Innovation on Low-Tech Peruvian Manufacturing Firms
Performance: The Role of External Sources of Knowledge. Academic Revista Latino Americano de Administration.
15. Gang, N. (2022). Resolving Stress of University Teacher: Exploring Role of Workplace Spirituality and Constructive
Workplace Deviance. South Asian Journal of Business Studies.https://doi.org/10.1108/SAJBS-042020-0118
16. Geopolitica. (2020). CEPAL-UNESCO Education in the Tme of Covid-19.

Stress, Techno-Pedagogical Skills, and Quality of Life among Faculty of a Local University in Laguna
IJMRA, Volume 5 Issue 05 May 2022 www.ijmra.in Page 1141
17. Grenon, V., Lafleur, F., &Samson, G. (2019). Developing the Techno-pedagogical Skills of Online University Instructors.
International Journal of E-Learning &Distance Education, Volume24(2).
18. Guru, N. & Beauru, M. H. (2019). Techno-Pedagogical Comepetency of Higher Secondary School Teachers in Relation to
Student's Academic Achievement in Science. International Journal of Applied Science, Volume 5(Issue 2), 362-370.
https://www.allresearchjournal.com
19. Jhon & Akos. (2017). Teacher Job Stress. Kwame Nkrumeh University of Science and Technology.
20. Kim, J. (2020). The Quality of Social Relationships in Schools and Adult Heath: Differential Effects of Student-Student
Versus Student-Teacher Relationships, American Psychological Association, http://dx.doi.org/10.1037spq000037
21. Lizana, P.A.; Vega-Fernandez, G. (2021). Teacher Teleworking during the COVID-19 Pandemic: Association between Work
Hours, Work–Family Balance and Quality of Life. Int. J. Environ. Res. Public Health 2021, 18, 7566. https://
doi.org/10.3390/ijerph18147566
22. Mason, D., McConachie, H., Garland, D., Petrov. A. J., Rodgers, J., & Parr, J. R. (2018). Predictors of Quality of Life for
Austistics Adults. International Society for Autism Research and Wiley Periodicals, Incorporation. doi:10.1002/aur.1965
23. Nami, F. (2022). Developing in Service Teachers' Pedagogical Knowledge of CALL Through Project-Oriented Tasks: The
Case of an Online Professional Development Course. doi:10.1017/s09583440210001148.2022
24. Oducalo, R., Rabacal, J., Moralista, R., & Tamdang, K. (2021). Perceived Stress due to Covid-19 Pandemic Among Employed
Professional Teachers. International Journal of Educational Research and Innovation. Retrieved from
https://doi.org/10.4666/ijeri.5284
25. Pressley, Tim, (2021) “Factors Contributing to Teacher Burnout During COVID-19,” Educational Researcher
26. Rabacal, J.S., Oducalo, R.F., Tamdang, K.A. (2020). Covid-19 Impact on the Quality of Life of Teachers: A Cross- Sectional
Study, Asian Journal for Public Opinion Research, Vol.8 No.4 Nov.2020, http://dx.doi.org/10.152006/ajpor.2020.8.4.478
27. Sen, M. Demirdogen, B., & Oztenkin, C. (2021). Interactions Among Topic- Specific Pedagogical Content Knowledge for
Science Teachers: The Impact of Content Knowledge. Retrieved from https://doi.org/10.1080/1046560x.2021.2012630
28. Singh, A., Palaniyandi, S., Palaniyandi A., & Gupta, V., (2022). Health Related Quality of Life Among Elderly Using
WHOQOL- BREF in the Most Backward District of India, Journal of Family Medicine, and Primary Care 2022; 11:1162-8
29. Sikshanamandira, R. (2020). Infusion of Techno-Pedagogy During Covid-19: Teachers’ Perspective, International Journal
of Creative Research Thoughts (IJCRT), Volume 8, Issue11, November 2020
30. Steiner, D.E., and Ashley Woo (2021). Job Related Stress Threatens the Teachers Supply: Key Findings from the 2021
State of the US Teacher Survey.
31. Tanucan, J.C.M., Hernani, M.R.A. (2021). Filipino Physical Education Teachers’ Technological Pedagogical Content
Knowledge on Remote Digital Teaching, International Journal of Information and Education Technology, Vol.11, No. 9.
32. Taylor, S. (2020). Development and Initial Validation of the Covid Stress Scales. Journal of Anxiety Disorders.
https://www.elsevier.com/locate/janxdis
33. Tondeur, S., Scherer, R., Baran, E. Siddiq, F., Valtoner, T & Sointu, E. (2019). Teacher Educators as gatekeepers: Preparing
the next generation of teachers for technology integration in Education. British Journal of Educational Technology, 50
(3) 1189-1209, https://doi.org/10.1111/bjet.12748
34. UNESCO International Institute for Educational Planning,
https://policytoolbox.iiep.unesco.org/glossary/content-knowledge
35. World Health Organization Quality of Life (WHOQOL – BREF), (2020). Introduction, Administration, Scoring, and Generic
Version of the Assessment) World Health Organization (2020) https://www.who.org.com/ from the trial version, (1996)
36. World Health Organization. (2020). Naming Corona Virus Diseases (Covid-19) and the Virus that Causes it. World Health
Organization.https://www.who.it/emergencies/diseases/novelcoronavirus2019/technicalguidance/naming-the-
coronavirus-disease-(Covid-2019)-and-the-virus-that-causes-it
37. Yazon, A., & Manaig-Ang, K. (2019). Emotional Intelligence and Occupational Stress Among Filipino Teachers. Universal
Journal of Educational Research, 7(11), 2303-2308. doi:1013189/ujer.2019.071108
38. Zimmer, W., & Matthews, S. (2022). A Virtual Coaching Model of Professional Development to Increase Teachers' Digital
Learning Competence. Volume 9. https://doi.org/10.1016/j.tate.20211103546
There is an Open Access article, distributed under the term of the Creative Commons Attribution – Non Commercial 4.0 International (CC BY-NC 4.0) (https://creativecommons.org/licenses/by-nc/4.0/), which permits remixing, adapting and building upon the work for non-commercial use, provided the original work is properly cited.

INTERNATIONAL JOURNAL OF MULTIDISCIPLINARY RESEARCH AND ANALYSIS
ISSN(print): 2643-9840, ISSN(online): 2643-9875
Volume 05 Issue 05 May 2022
DOI: 10.47191/ijmra/v5-i5-33, Impact Factor: 6.261
Page No. 1142-1151
IJMRA, Volume 5 Issue 05 May 2022 www.ijmra.in Page 1142
Wellbeing, Online Course Delivery, and Learning Loss of College
Students in a Local University in Laguna
Edgardo C. Salazar1, LPT, MAT, Antonio R. Yango2, LPT, PhD
ABSTRACT: The purpose of the study was to determine the manifestation of wellbeing, the attitude toward online course delivery,
and the learning loss among college students at a local university in Laguna and the relationship between these variables, which
are crucial during the pandemic delivery of academic instruction. In this study, the descriptive correlational methodology was
employed. The study found that college students had a moderate level of manifestation of the domains of wellbeing, a positive
attitude toward online course delivery, and a high level of learning loss. Correlations suggested that the more domains of
wellbeing a student manifests, the more favorable their attitude toward online course delivery and the less learning loss will be
encountered. The results have considerable consequences for the new form of academic delivery at the local institution. Similarly,
understanding the relationship between the students' wellbeing, the university's online course delivery, and the resulting learning
loss aids the academic institution in implementing the new form of online learning without jeopardizing the students' wellbeing
and minimizing learning loss.
KEYWORDS: descriptive correlational study, wellbeing, online course delivery, learning loss, college students, local university
INTRODUCTION
In the context of the pandemic, terms such as lockdown, social distancing, face mask, and new normal have defined the last two
years. On January 30, 2020, the World Health Organization (WHO) declared the SARS-CoV-2 epidemic an International Public
Health Emergency, then a global pandemic on March 11, 2020. Since then, the virus has wreaked havoc on individual private lives,
economies, scientific communication, and the environment. Even the educational system was not spared.
The Covid-19 pandemic has caused considerable interruptions and modifications to the education of the student
population. Worse, many of these modifications are not intended to increase educational quality and equity. In response to the
unexpected arrival of the pandemic and accompanying school closures, educators and academic institutions around the world
exerted enormous efforts to adapt and innovate. Due to the current circumstance, these adjustments had to be done immediately
(Zhao & Watterston, 2021).
The change from on-site to online education has substantially affected the individual’s wellbeing. Individuals' anxiety
levels increased, and as a result, their behavior altered. Fear of infection has had a detrimental effect on the wellbeing of young
people, which has been aggravated by unanticipated isolation and online learning. The pandemic has had a negative effect on
mental health, particularly among individuals who lack job security or who are exposed to significant dangers, such as the prospect
of losing one's work or being unable to find another, such as young people still in school. The COVID-19 pandemic has had several
short-term detrimental consequences on young people's mental health, including social isolation and the near-total stoppage of
all social activities, as well as school, job, and training. Predictions of a large-scale economic disaster might be detrimental to the
psychological wellbeing of children (Butnaru, et al., 2021).
Mateo reported in September 2020 that 748 of 14,435 private educational institutions in the Philippines ceased
operations for the academic year 2020-2021 when the pandemic began on 2020, affecting roughly 3,233 teachers and 40,335
students. Due to the potential of a COVID-19 pandemic, face-to-face classes for the balance of the year have been suspended.
This spurred schools to create strategies for distant learning, such as online or modular instruction. Nevertheless, the change to
online education affected the students. According to Chakraborty et al. (2020), students believe they study more effectively in a
physical classroom and that online education is unpleasant and negatively affects their health and social lives.

Wellbeing, Online Course Delivery, and Learning Loss of College Students in a Local University in Laguna
IJMRA, Volume 5 Issue 05 May 2022 www.ijmra.in Page 1143
According to more than half of K-12 public school teachers, the pandemic has resulted in a significant loss of academic
and social-emotional development for their students. Comparing the current year to previous years, virtually all educators stated
that their students had experienced some learning loss. The majority of educators felt that their students' social and emotional
development had fallen behind by more than three months (Dickler, 2021). Another research done between April and June of
2021 in 165 countries, including 7,000 replies from the Philippines, indicated that 72% of teachers reported declining academic
performance among children from poor homes during the epidemic. In the Philippines, the most significant element was poverty,
which also represented the digital divide (Dumlao-Abadilla, 2021).
During the compilation of the current study, several gaps in the collected literature and studies were discovered. There
are few studies on the relationship between student wellbeing, online course delivery, and learning loss in the Philippines.
Similarly, there have been few studies on perceived learning loss, especially in higher education institutions. In addition, few
studies have been undertaken on the variables relating to the investigation site, which is a local institution.
Consequently, the objective of this study was to assess the wellbeing, perceptions of online course delivery, and degree
of learning loss among college students at a local university. The study's findings guided the formulation of action plans to enhance
the wellbeing of students, their attitude toward online course delivery, and the prevention of learning loss.
METHODS
The researcher employed the descriptive-correlational method since this method was suitable to determine the relationship
between the wellbeing, the online course delivery, and the learning loss of the students in a local university in Laguna.
Descriptive research is used to describe a population's characteristics. It collects data to answer what, when, and how
inquiries about a population or group. It doesn't explain why something happens or what causes it. Descriptive research is used
to describe individuals, events, or conditions in their natural setting. The researcher does not modify any of the variables; but,
they simply describe the sample and/or the variables. Although descriptive research can investigate several variables, it is the
only design that can examine only one variable (Siedlecki, 2020). According to Creswell, correlational research is a non-
experimental quantitative approach in which the researcher uses correlational statistics to assess and characterize the degree of
relationship between variables or sets of scores and then they try to find links between the respondents' attributes and their
reported behaviors and opinions (Asenahabi, 2019).
The responses of the study's participants were used to gather empirical data. The primary data sources were 362 college
students from a local university in Laguna.
The study population was 5904 college students from a local university – Pamantasan ng Cabuyao. The actual sample of
the study was 362 students computed using Slovin’s formula and was chosen from the four colleges across all 12 programs through
a stratified random sampling technique. The distribution of the respondents was as follows: BS Psychology, 54; BS Accountancy,
21; BS Business Administration major in Financial Management, 36; BS Business Administration major in Marketing Management,
32; BS Computer Science, 10; BS Information Technology, 36; BS Nursing, 36; BS Electronics Engineering, 21; BS Industrial
Engineering, 43; BS Computer Engineering, 14; Bachelor in Elementary Education, 14; and Bachelor of Secondary Education, 45.
The researcher used standardized, adapted, and self-made questionnaires. Part I focused on the respondents' wellbeing
using the instrument called The EPOCH Measure of Adolescent Wellbeing. The instrument was divided into the five different
positive characteristics that support higher levels of wellbeing: engagement, perseverance, optimism, connectedness, and
happiness. Part II focused on the perception of the online course delivery using the Community of Inquiry Survey Instrument. The
instrument was composed of 34 items and divided into three major categories: teaching presence, social presence, and cognitive
presence. The last part focused on the level of learning loss, a self-made research instrument. Since the instrument was self-
made, it was presented to a panel of experts for validation. It was also tested for reliability using Cronbach's Alpha, which resulted
in a reliability index of 0.953.
The researcher sought for the approval of the president of the local university to survey the respondents. After the
request was approved, questionnaires were delivered to respondents using an online form. The respondents were guaranteed
that the researcher would treat the information they provided with utmost confidentiality as part of the study's ethical
considerations.
The respondents were asked to answer three types of online questionnaires using google form by choosing the
appropriate answer for every statement that best represents their wellbeing, their attitude on the online course delivery, and the
level of their learning loss. The responses to the online forms were subsequently counted, tabulated, and subjected to statistical
treatment with the guidance of the researcher's statistician. Statistical tools were used for the treatment of data, notably the
weighted mean and ranking, to determine the (a) the students' manifestation of wellbeing; (b) the students' attitude toward the

Wellbeing, Online Course Delivery, and Learning Loss of College Students in a Local University in Laguna
IJMRA, Volume 5 Issue 05 May 2022 www.ijmra.in Page 1144
online course delivery; and (3) the students' level of learning loss. Pearson r Moment Correlation Coefficient was used to
determine if there is a significant relationship between the respondents' (a) manifestation of wellbeing and the attitude toward
the online course delivery, (b) manifestation of wellbeing and the level of learning loss, and (c) attitude on the online course
delivery and the level of learning loss.
RESULTS AND DISCUSSIONS
The following tables and textual presentations discuss the level of manifestation of the domains of wellbeing, the attitude toward
online course delivery, and the level of learning loss, as well as their relationship:
Table 1. The Respondents’ Overall Wellbeing
Components
Weighted Mean Verbal Interpretation Rank
1. Engagement 2.99 Moderate
Manifestation
5
2. Perseverance 3.43 Moderate
Manifestation
2
3. Optimism 3.41 Moderate
Manifestation
3
4. Connectedness 3.47 Moderate
Manifestation
1
5. Happiness 3.20 Moderate
Manifestation
4
Overall Weighted Mean 3.30 Moderate
Manifestation
Legend: (Very High Manifestation – 5, High Manifestation – 4, Moderate Manifestation – 3, Low Manifestation – 2,
Very Low Manifestation – 1 )
Table 1 gives a composite summary of the manifestation of the components of respondents' wellbeing with an overall weighted
mean of 3.30. This means that overall, the respondents had a moderate level of manifestation of wellbeing. Among the
components, Connectedness ranked 1st with a weighted mean of 3.47, followed by Perseverance with a weighted mean of 3.43,
Optimism, with a weighted mean of 3.41, Happiness with a weighted mean of 3.20, and ranked 5th and last is Engagement with a
weighted mean of 2.99.
During the pandemic, physical isolation was imposed to prevent the spread of the Covid-19 virus; nevertheless, this
distance or separation inhibits people's in-person social ties, which is worrying given that social connection is essential to
wellbeing, according to research. However, individuals have new opportunities to connect, such as through digital interactions
(Okabe-Miyamoto et al., 2021). In contrast, the EdWeek Research Center discovered in 2021 that student motivation and morale
had deteriorated due to the pandemic. Fifty percent of the students reported reduced motivation, and forty-nine percent
reported lower morale compared to the past. This reinforces the conclusion that the mean average of engagement is the lowest
contributor to the overall wellbeing of respondents (Toth, 2021).
While completing their program under pandemic conditions, students face several obstacles, expectations, and setbacks
that influence their wellbeing including different social and economic demands, balancing education, family, and work
responsibilities, social isolation, and other experiences. Students at all educational levels and in all disciplines must have adequate
and timely resources to meet these demands and succeed in their pursuit of education. These resources assist in satisfying the
needs of students, minimizing burnout and stress while promoting engagement in learning, meaning-making, and life satisfaction
(Plakhotnik et al., 2021).
According to a study, wellbeing, engagement, and learning all positively influence one another. The study concludes that
schools and education systems can achieve synergy by focusing on all three components concurrently. The report provides
excellent encouragement for educational systems, schools, and teachers to enhance students' social and emotional development
so that each student can realize their maximum learning potential. The report revealed the relationship between wellbeing, school
involvement, and academic achievement (Evans-Whipp et al., 2018).
According to the World Happiness Report, psychological and social aspects are among the protective variables for positive
wellbeing during COVID-19. Social protective factors include the quality and number of connections, connectedness and positivity

Wellbeing, Online Course Delivery, and Learning Loss of College Students in a Local University in Laguna
IJMRA, Volume 5 Issue 05 May 2022 www.ijmra.in Page 1145
resonance, and prosocial activities. Increased experiences of connectedness before and during the pandemic were associated
with better levels of life satisfaction, whereas increased feelings of loneliness were associated with lower levels of life satisfaction.
Similarly, higher levels of relatedness (i.e., connectedness) were associated with improved wellbeing during COVID-19, and related
research demonstrated that having a team of people rather than a single close individual to rely on for support may be protective
of wellbeing during the pandemic (Okabe-Miyamoto, Lyubomirsky, 2021).
Table 2. The Respondents’ Attitude on Online Course Delivery
Indicators
Weighted Mean Verbal Interpretation Rank
1. Teaching presence 3.14 Positive 2
2. Social presence 2.91 Positive 3
3. Cognitive presence 3.15 Positive 1
Average 3.07 Positive
Legend: (Strongly Agree/Very Positive – 4, Agree/Positive – 3, Disagree/Negative – 2, Strongly Disagree/Very Negative – 1 )
The respondents' attitude toward the online course delivery was positive, with an overall weighted mean of 3.07, as shown in
Table 2. The cognitive presence ranked 1st with a weighted mean of 3.15, followed by the teaching presence with a weighted
mean of 3.14, and lastly, the social presence with a weighted mean of 2.91. This indicates that respondents value the quality and
quantity of critical thinking, collaborative work, and meaning construction in an online setting and that someone is fully
responsible for the design, facilitation, and direction of all online processes to achieve worthwhile learning outcomes.
During the COVID-19 epidemic, Meda et al. (2021) explored how certified online teachers established social, cognitive,
and teacher presences in their online classes. Students' involvement, critical thinking, self-directed learning, and constant
engagement were found to be vital for their distance learning. The study found that developing the three components of a
community of inquiry enhances students' learning experiences and enables teachers to react to the diverse learning needs of all
students in an online community.
A study was undertaken on the impact of online education on the mental health of college students. Among the
noteworthy findings of the study was an increase in mental health issues among students. This is due to the lack of engagement
with peers and instructors, the difficulty of using online platforms, the absence of aid and counseling, and the presence of
numerous distractions. The inability to communicate with peers and teachers is a significant source of stress for students. Despite
providing a solution to the pandemic of lockdown to learning, online learning has been shown to cause severe stress (Akpnar,
2021). Another quasi-experimental study investigated students' perceptions of a community of inquiry through online learning
activities based on the notion of a community of inquiry. Due to the pandemic of COVID-19, the research was undertaken
simultaneously. The experimental group was instructed utilizing the community of inquiry approach, while the control group was
instructed through direct instruction and question-and-answer sessions. The experimental group outperformed the control group
in terms of cognitive and teaching presence. In terms of social presence, there was no substantial difference between the groups.
Overall, experimental students did better in the community of inquiry than control students (Aslan et al., 2021).
Due to the COVD-19 outbreak, Australian schools closed in early 2020, forcing students to learn remotely. The study
sought to investigate how instructors developed and implemented mathematics learning programs for their students, the
problems they faced, and how motivated or engaged their students were. Teachers were concerned about catering to all students
and monitoring their development and participation in tasks. Most students enjoyed remote learning, except for the lack of ability
to learn mathematics with and from classmates (Kalogeropoulos et al., 2021).
Table 3. The Respondents’ Level of Learning Loss
Indicators
Weighted
Mean
Verbal Interpretation Rank
1. Ask questions or participate in class discussions. 2.06 High
(Sometimes)
23
2. Make your own class presentation. 2.04 High
(Sometimes)
22
3. Make two or more drafts before submitting a paper or
assignment.
2.00 High
(Sometimes)
21

Wellbeing, Online Course Delivery, and Learning Loss of College Students in a Local University in Laguna
IJMRA, Volume 5 Issue 05 May 2022 www.ijmra.in Page 1146
4. Work on a paper or project that requires combining ideas or
information from multiple sources.
1.66 Very High
(Seldom)
3
5. Come to class prepared and with all readings and homework
completed.
1.94 High
(Sometimes)
19
6. Collaborate with other students on class tasks. 1.65 Very High
(Seldom)
2
7. Collaborate with classmates outside of the LMS to complete an
assignment.
1.83 High
(Sometimes)
12.5
8. Utilize an electronic medium (Internet, chat group, etc.) to
discuss an assignment or to complete it.
1.51 Very High
(Seldom)
1
9. Discuss homework with the instructor. 2.15 High
(Sometimes)
24
10. Discuss concepts from readings or classes with other faculty
members.
2.41 High
(Sometimes)
25
11. Discuss ideas from readings or classes with your classmates. 1.87 High
(Sometimes)
15
12. Memorize information, ideas, or approaches from classes and
readings so that they can be repeated in a similar format.
1.92 High
(Sometimes)
18
13. Analyze the fundamental parts of a concept, event, or theory,
such as thoroughly investigating a specific case or situation and
considering its components.
1.79 High
(Sometimes)
8
14. Create new, more complicated interpretations and
relationships by synthesizing and organizing ideas, information, or
experiences.
1.83 High
(Sometimes)
12.5
15. Make value judgments regarding information, arguments, or
procedures, such as reviewing how others acquired and
interpreted data and evaluating the validity of their conclusions.
1.83 High
(Sometimes)
12.5
16. Apply theories or concepts to real-world problems or
situations.
1.96 High
(Sometimes)
20
17. Obtain job-related knowledge and skills. 1.91 High
(Sometimes)
16.5
18. Write clearly and effectively. 1.80 High
(Sometimes)
9.5
19. Speak clearly and effectively. 1.91 High
(Sometimes)
16.5
20. Think critically and analytically. 1.80 High
(Sometimes)
9.5
21. Use computing and information technology. 1.84 High
(Sometimes)
12.5
22. Collaborate effectively with others. 1.71 Very High
(Seldom)
5
23. Learn effectively on your own. 1.75 High
(Sometimes)
6
24. Self-evaluation to improve self-awareness. 1.68 Very High
(Seldom)
4
25. Participate in research projects. 1.76 High
(Sometimes)
7
Average 1.87 High
Legend: (Almost Always/Very Low – 4, Often/Low – 3, Sometimes/High – 2, Seldom/Very High – 1 )

Wellbeing, Online Course Delivery, and Learning Loss of College Students in a Local University in Laguna
IJMRA, Volume 5 Issue 05 May 2022 www.ijmra.in Page 1147
It is shown in Table 3 that the students had high learning loss, as evidenced by the obtained overall weighted mean of
1.87. The very high learning loss indicators imply that respondents were having difficulty using electronic media during the new
learning mode to finish an assignment or work on a paper integrating information from numerous sources. The still-existing
pandemic norms on social isolation limit students' physical contact with one another, as does the problem with the digital divide
for online connectivity. The high learning loss indicators, on the other hand, suggested that respondents depended heavily on
their instructors to grasp their lessons and to provide input during online class discussions to limit learning loss.
The findings support the study of Haser et al. (2022). They found that existing disparities and students’ limited or lack of
access to the instructor, learning environment, and learning materials were the primary causes of learning loss among Turkish
middle school students. Although teachers created ways to engage students in teaching and learning interactions, the effects of
disparities and access to learning resources were mitigated by students' participation, teaching approaches, and family
socioeconomic position and involvement.
Donnelly et al. (2021) conducted an early systematic review on pandemic-related learning losses. Researchers are
concerned about the impact of Covid-19 on student learning development and, in particular, whether students have experienced
learning loss. Between March 2020 and March 2021, the authors examined all evidence of reported learning loss. That being
said, eight studies were found, seven of which showed student learning loss, while one showed student learning improvements
in a subgroup. Participants in the remaining studies gained more knowledge. The research found that certain student groups
suffered more learning deficits than others. Increasing the number of investigations, geographical focus, and student observation
is considered to be necessary.
Engzell et al. (2021) used national exams in The Netherlands that were given before and after a lockdown as a natural
experiment to determine how school closures affect students' learning. The Netherlands is an interesting "best-case" scenario
because it has a short lockdown, fair funding for schools, and the highest broadband access rates in the world. Even though the
conditions were good, it was found that students who learned from home made little or no progress. Most of the learning loss
was seen in students from poor homes, and it was thought that the loss might be even more significant in countries with worse
infrastructure or longer school breaks.
Table 4. Relationship between the Respondents’ Wellbeing and Attitude on the Online Course Delivery
Wellbeing Online course delivery
Teaching Social Cognitive
Engagement r = 0.153**
Low correlation
p = 0.004
r = 0.222**
Low correlation
p = 0.000
r = 0.259**
Low correlation
p = 0.000
Perseverance r = 0.194**
Low correlation
p = 0.000
r = 0.216**
Low correlation
p = 0.000
r = 0.288**
Low correlation
p = 0.000
Optimism r = 0.187**
Low correlation
p = 0.000
r = 0.206**
Low correlation
p = 0.000
r = 0.260**
Low correlation
p = 0.000
Connectedness r = 0.190**
Low correlation
p = 0.000
r = 0.174**
Low correlation
p = 0.000
r = 0.197**
Low correlation
p = 0.000
Happiness r = 0.239**
Low correlation
p = 0.000
r = 0.251**
Low correlation
p = 0.000
r = 0.293**
Low correlation
p = 0.000
**Significant @ 0.01
As observed from the data in Table 4, there was a significant relationship between the respondents' wellbeing and their
attitude on online course delivery. The Pearson r values ranged from 0.153 to 0.239, interpreted as low correlation, and were
obtained with a probability value of 0.000 for all indicators which were less than the 0.01 significance level. This means that the
more the respondents manifest the domains of wellbeing, the more positive is their attitude on the online course delivery.
Alibudbud (2021) reached a similar conclusion when he stated that the negative mental health repercussions of online
learning among students include increased anxiety and absenteeism, which can be attributed to increased demand for new

Wellbeing, Online Course Delivery, and Learning Loss of College Students in a Local University in Laguna
IJMRA, Volume 5 Issue 05 May 2022 www.ijmra.in Page 1148
technology skills, productivity, and information overload. The COVID-19 pandemic exacerbated these repercussions by shifting
educational institutions away from face-to-face activities and toward predominantly online learning modes to combat the spread
of COVID-19. Given these factors, a digital divide caused by socioeconomic inequities may result in mental health disparities
among students during the pandemic.
Another study supported by the findings was the study conducted by Walters et al. (2021). They found that high levels
of self-reported focus, engagement, learning capacity, and self-worth through learning were linked to high mental wellbeing levels.
Notably, online education is connected to a drop in students' concentration and perceived capacity to study and a decline in their
wellbeing.
Mustika et al. (2021) discovered that students had moderate to high degrees of positive perception of online learning,
high levels of positive emotions, and average levels of negative emotions, according to their findings. It was discovered that there
were statistically significant disparities between groups based on the gender, year of study, and academic program of students.
Student wellbeing was significantly predicted by almost all online learning environment features, with personal relevance and
evaluation and assessment being the two most important predictors of wellbeing.
Table 5. Relationship between the Respondents’ Wellbeing and Level of Learning Loss
Indicators Pearson r p-value Interpretation
Engagement -0.268**
Low correlation
0.000
Significant
Perseverance -0.357**
Low correlation
0.000
Significant
Optimism -0.338**
Low correlation
0.000
Significant
Connectedness -0.311**
Low correlation
0.000
Significant
Happiness -0.297**
Low correlation
0.000
Significant
**Significant @ 0.01
Table 5 shows the relationship between the respondents' wellbeing and learning loss. As shown in the table, there was
a significant relationship between the respondents' manifestation of wellbeing and the level of their learning loss. The Pearson r
values ranged from -0.268 to -0.357, interpreted as low correlation, and were obtained with a probability value of 0.000 for all
indicators which were less than the 0.01 significance level. This means that the more the respondents manifest the domains of
wellbeing, the less learning loss will be experienced.
It is crucial to emphasize that changes in the emotional wellbeing of students throughout the COVID-19 pandemic are
not independent of their academic performance. According to a survey, more than half of high school and college students are
concerned about their mental health as a result of the COVID-19 pandemic. As children of various ages, races, and geographic
locations return to school, they feel the effects of these interruptions on mental health and learning loss. Students have lost much
more than just academic knowledge and interpersonal relationships. According to research, students who are exposed to such
events have poorer academic performance, shorter school days, and fewer educational and employment opportunities. Since the
onset of the pandemic, students have reported an increase in mental health issues such as social disengagement, self-isolation,
anxiety, and sadness (mindfulphilantrophy.org, 2021).
In addition to catching up on lost learning, many countries have put in place special measures to promote the wellbeing
of their students. There was recognition of the link between wellbeing and learning outcomes. Some stated that investing in
learners' wellbeing was critical to ensure that they are resilient, able to cope with adversity and thus catch up on missed learning.
Many had mentioned specific attempts to provide psychosocial support to children and young people in recognition of the toll
that the pandemic has taken on their emotional wellbeing (UNESCO, 2021).
When Italy's pandemic suddenly forced schools to switch to online learning platforms, a study was conducted to
determine what factors impacted the quality of teaching and learning and general human comfort and wellbeing. In the survey,
some findings included a lack of engagement with colleagues and the need for several gadgets. An inquiry into the relationships
and connections between specified parameters and the characteristics of products/interactions/environment during eLearning
courses could serve as a basis for future research and optimization. (Alessandro et al., 2021).

Wellbeing, Online Course Delivery, and Learning Loss of College Students in a Local University in Laguna
IJMRA, Volume 5 Issue 05 May 2022 www.ijmra.in Page 1149
Table 6. Relationship between the Respondents’ Attitude on the Online Course Delivery and the Level of Learning Loss
Indicators Pearson r p-value Interpretation
Teaching presence -0.333**
Low correlation
0.000
Significant
Social presence -0.458**
Moderate correlation
0.000
Significant
Cognitive presence -0.535**
Moderate correlation
0.000
Significant
**Significant @ 0.01
Table 6 reveals a significant relationship between the respondents' attitude toward online course delivery and the level
of learning loss. The Pearson r values -0.333, -0.458, and -0.535, as a low correlation for teaching presence and moderate
correlation for both social and cognitive presences, were obtained with a probability value of 0.000 for all indicators which were
less than the 0.01 significance level. This means that the more positive the respondents' attitude toward the online course
delivery, the lower is their learning loss.
According to a March 2020 RAND Corporation survey, fully remote students experienced 90 percent less instructional
time than their face-to-face or hybrid counterparts (those with a combination of in-person and remote instruction). According to
a study conducted by MMS for GENYOUth Insights in Spring 2021, students are experiencing a diminished learning experience in
a distant situation. Sixty-eight percent of students reported that it was more challenging to concentrate and recall information
during remote learning. 53% of students believe the pandemic has had a "significant" influence on their academic preparation,
and 30% say they are not studying or keeping up with their coursework before the pandemic. Remote learning made it harder to
absorb knowledge and focus; there were no hands-on learning choices; it was difficult to seek individual guidance; there was too
much solo work; and too many distractions (MMSEducation, 2021).
On the contrary, Spitzer et al. (2021) reported the favorable impact on academic achievement using online instruction.
Closing schools due to the rapid growth of COVID-19 endanger young children's education and widens the educational gap. Over
2,500 K-12 students computed over 124,000 mathematical problem sets before and during the closure in 2020, and their
performance improved compared to the year before. Analyses also demonstrated that low-achieving students improved more
than high-achieving students, narrowing performance disparity. Online learning environments may be beneficial in avoiding
educational losses related to school closures now and in the future.
CONCLUSION
The respondents' overall manifestation of wellbeing was characterized by "Moderate Manifestation," with the social connection
being regarded as crucial for wellbeing and engagement being rated as the lowest essential component of their overall wellbeing.
The respondents' attitude toward the online course delivery was "positive". They value the quality and quantity of cognitive
activities in an online setting and the presence of the instructor who is in charge of the design, facilitation, and direction of all
online activities to accomplish worthwhile learning outcomes. However, the respondents' learning loss was "high". Respondents
reported having difficulty using electronic media or finishing an assignment or working on papers that combined material from
multiple sources utilizing electronic media. The social isolation, physical and online, contributed to the loss of learning. Moreover,
the more the respondents manifest the domains of wellbeing, the more positive their attitude toward the online course delivery,
and the lower their learning loss.
FUTURE DIRECTIONS
The current investigation has certain limitations, specifically regarding the respondents' location and level of education. The
research centered on a single local university and college students. Future researchers are encouraged to undertake a similar
study with respondents from other local and private institutions to comprehend further and generalize the results of this study.
The digital gap, family economic status, and the type of learning management system (LMS) utilized to deliver online courses are
other variables that can be included in the study for a complete picture of academic delivery and performance during the
pandemic. For a better understanding of the interplay of the variables, faculty members' perspectives can be examined. On the
practical side, the results of the conducted study presented significant implications to higher education institutions for the delivery
of online courses without jeopardizing the wellbeing of students and minimizing learning loss. Similarly, understanding the
interaction of the variables enables students to be attentive to their wellbeing for improved academic performance and reversing
learning loss.

Wellbeing, Online Course Delivery, and Learning Loss of College Students in a Local University in Laguna
IJMRA, Volume 5 Issue 05 May 2022 www.ijmra.in Page 1150
REFERENCES
1) Akpınar, E. (2021). The Effect of Online Learning on Tertiary Level Students' Mental Health During the Covid-19 Pandemic.
The European Journal of Social and Behavioural Sciences Volume XXX, Issue I.
2) Alessandro, N., Rosaria, C., & Iolanda, F. (2021). Identifying factors that influenced wellbeing and learning effectiveness
during the sudden transition into eLearning due to the COVID-19 lockdown. Work, vol. 68, no. 1, 10.3233/WOR-203358.
3) Alibudbud, R. (2021). On online learning and mental health during the COVID-19 pandemic: Perspectives from the
Philippines. Asian Journal of Psychiatry 66, doi: 10.1016/j.ajp.2021.102867.
4) Asenahabi, B. M. (2019). Basics of Research Design: A Guide to Selecting appropriate research. International Journal of
Contemporary Applied Researches, Vol. 6, No. 5.
5) Aslan, S. A., & Turgut, Y. E. (2021). Effectiveness of community of inquiry-based online course: Cognitive, social and
teaching presence. Journal of Pedagogical Research, https://doi.org/10.33902/JPR.2021371365.
6) Butnaru, G. I., Haller, A.-P., Dragolea, L.-L., Anichiti, A., & Hârsan, G.-D. T. (2021). Students’ Wellbeing during Transition
from Onsite to Online. International Journal of Environmental Research and Public Health.
7) Chakraborty, P., Mittal, P., Gupta, M. S., Yadav, S., & Arora, A. (2020). Opinion of students on online education during
the COVID-19 pandemic. Wiley Periodicals, https://doi.org/10.1002/hbe2.240.
8) Donnelly, R., & Patrinos, H. A. (2021). Learning loss during Covid-19: An early systematic review. Prospects (Paris),
https://doi.org/10.1007/s11125-021-09582-6.
9) Dumlao-Abadilla, D. (2021, October 1). Int’l study notes worst ‘learning loss’ among poorest PH kids. Inquirer.net, pp.
https://globalnation.inquirer.net/199341/intl-study-notes-worst-learning-loss-among-poorest-ph-kids.
10) Engzell, P., Frey, A., & Verhagen, M. D. (2021). Learning loss due to school closures during the COVID-19 pandemic.
Proceedings of the National Academy of Sciences 118 (17), https://doi.org/10.1073/pnas.2022376118.
11) Evans-Whipp, T., Mundy, L., Canterford, L., & Patton, G. (2018). Student Wellbeing, Engagement, and Learning across
the Middle Years. The Centre for Adolescent Health.
12) Haser, Ç., Doğan, O., & Erhan, G. K. (2022). Tracing students’ mathematics learning loss during school closures in teachers’
self-reported practices. International Journal of Educational Development Volume 88,
https://doi.org/10.1016/j.ijedudev.2021.102536.
13) Kalogeropoulos, P., Roche, A., Russo, J., Vats, S., & Russo, T. (2021). EURASIA Journal of Mathematics, Science and
Technology Education. Learning Mathematics From Home During COVID-19: Insights From Two Inquiry-Focused Primary
Schools, https://doi.org/10.29333/ejmste/10830.
14) Meda, L., & ElSayary, A. (May 2021). Establishing Social, Cognitive and Teacher Presences During Emergency Remote
Teaching: Reflections of Certified Online Instructors in the United Arab Emirates. Contemporary Educational Technology
13(4), https://doi.org/10.30935/cedtech/11073.
15) mindfulphilantrophy.org. (2021). Mental Health and Learning Loss: An Intrinsically Connected Crisis.
https://www.mindfulphilanthropy.org/thrivinginschools.
16) MMSEducation. (2021, September 7). https://www.mmseducation.com/viewpoint/. Retrieved from
https://www.mmseducation.com/: https://www.mmseducation.com/the-impacts-of-covid-on-education-what-does-
the-research-say/
17) Mustika, R., Yo, E. C., & Faruqi, M. Z. (2021). Evaluating the Relationship Between Online Evaluating the Relationship
Between Online Wellbeing During COVID-19 Pandemic. Malays J Med Sci. 28(5),
18) https://doi.org/10.21315/mjms2021.28.5.11.
19) Okabe-Miyamoto, K. L. (2021, March 20). World Happiness Report. Retrieved from World Happiness Report:
https://worldhappiness.report/ed/2021/social-connection-and-well-being-during-covid-19/
20) Okabe-Miyamoto, K., & Lyubomirsky, S. (2021). Social Connection and Wellbeing during COVID-19. World Happiness
Report.
21) Plakhotnik, M. S., Volkova, N. V., Jiang, C., Yahiaoui, D., Pheiffer, G., McKay, K., . . . Reibig-Thust, S. (2021). The Perceived
Impact of COVID-19 on Student Wellbeing and the Mediating Role of the University Support: Evidence from France,
Germany, Russia, and the UK. Frontiers in Psychology.
22) Siedlecki, S. L. (2020). Understanding Descriptive Research Designs and Methods. Clinical Nurse Specialist 34(1), 8-12.
23) Spitzer, M., & Musslick, S. (2021). Academic performance of K-12 students in an online-learning environment for
mathematics increased during the shutdown of schools in wake of the COVID-19 pandemic. PLoS ONE 16(8),
https://doi.org/10.1371/journal.pone.0255629.
24) Toth, M. D. (2021, March 17). Learning Sciences International. Retrieved from

Wellbeing, Online Course Delivery, and Learning Loss of College Students in a Local University in Laguna
IJMRA, Volume 5 Issue 05 May 2022 www.ijmra.in Page 1151
https://www.learningsciences.com/blog/why-is-student-engagement-important/
25) UNESCO. (2020). UNESCO. https://en.unesco.org/covid19/educationresponse/consequences
26) Walters, T., Simkiss, N. J., Snowden, R. J., & Gray, N. S. (2021). Secondary school students’ perception of the online
teaching experience during COVID-19: The impact on mental wellbeing and specific learning difficulties. British Journal
of Educational Psychology, https://doi.org/10.1111/bjep.12475.
27) Zhao, Y., & Watterston, J. (2021). The changes we need: Education post-COVID-19. Journal of Educational Change, 22,
3-12. doi:https://doi.org/10.1007/s10833-021-09417-3
There is an Open Access article, distributed under the term of the Creative Commons Attribution – Non Commercial 4.0 International (CC BY-NC 4.0) (https://creativecommons.org/licenses/by-nc/4.0/), which permits remixing, adapting and building upon the work for non-commercial use, provided the original work is properly cited.

INTERNATIONAL JOURNAL OF MULTIDISCIPLINARY RESEARCH AND ANALYSIS
ISSN(print): 2643-9840, ISSN(online): 2643-9875
Volume 05 Issue 05 May 2022
DOI: 10.47191/ijmra/v5-i5-34, Impact Factor: 6.261
Page No. 1152-1158
IJMRA, Volume 5 Issue 05 May 2022 www.ijmra.in Page 1152
Dean’s Visionary Leadership, Institution’s Academic Culture and
Faculty Performance of a Hei in Laguna
Emirose B. Gonzales, LPT PhD1, Antonio R. Yango, LPT PhD2
ABSTRACT: This study attempted to determine the dean’s visionary leadership, institution’s academic culture, and faculty
performance in the higher education institution in Laguna. The results or the findings of the study served as realization of the
current status of the visionary leadership, academic culture, and faculty performance of the university. The study was conducted
in Pamantasan ng Cabuyao. It is a local university located in Katapatan Subdivision, Brgy. Banay-banay, Cabuyao, Laguna. The
respondents were the 361 college students of the mentioned higher educational institution for Academic Year 2021-2022. The
researcher utilized the descriptive-correlational research design which was the most effective research model to use for this
particular study. The research design determined the dean’s visionary leadership, institution’s academic culture, and level of
faculty performance of a higher educational institution in Laguna. The findings showed that a significant relationship was noted in
the dean’s visionary leadership and the institution’s academic culture; in the dean’s visionary leadership and the level of faculty
performance; and in the institution’s academic culture and the level of faculty performance. It was therefore concluded that the
more effective the dean’s visionary leadership, the more positive the institution’s academic culture; that the more effective the
visionary leadership, the higher the level of faculty performance; and that the more positive the institution’s academic culture,
the higher the level of faculty performance.
KEYWORDS: Descriptive Correlational Study, Quantitative Research, Visionary Leadership, Academic Culture, Faculty Performance
INTRODUCTION
A leader is someone who sets goals and then helps people achieve them by utilizing their skills. The finest leaders understand their
employees and are more aware of their strengths than of their flaws. Great leaders are aware of their own and others' flaws; they
just recognize that their competitive advantage resides in their strengths. Nwachukwu, Chladkova, Zufan, & Olatunji (2017) stated
that good leaders are seen as inspiring and empowering their followers to experience growth and change in the organizational
function by considering the relevance of the institution's vision or mission. In the study Alegado (2018), it was stated that the
concept of teacher leadership still struggles to thrive in school organizations. It emphasized two factors that make it difficult for
teacher leadership to flourish: the traditional 'principal-oriented' nature of leadership, which is deeply ingrained in the system,
and the lack of leadership training and teacher categorization. These circumstances severely limit the role of instructors in the
classroom. Furthermore, in the study of Alegado (2018), it demonstrates that using teacher leadership in the classroom can help
shape the culture of their schools, advance student learning, and influence practice among their peers.
Visionary leadership is defined as a leadership style that aims to provide direction and meaning to work and efforts that
must be done collaboratively by members of the company by focusing on a clear vision (Sunarto, Tanjung, & Ellesia, 2020). In the
study of Prestiadi, Zulkarnain, & Sumarsono (2019), it was stated that the role of visionary leadership in total quality management
is the effort of an educational leader who is not only able to formulate a vision and strategic steps forward but is also able to
improve the quality of education. Additionally, in the study of Migallos (2021), she explained how visionary leadership can be of
use to higher educational institutions as they go through volatile changes.
On both instrumental and symbolic levels, academic culture has a substantial impact on "what is done, how it is done,
and who is involved in doing it" in terms of decisions, actions, and communication (Mangue & Gonondo, 2021). Academic culture
focuses on the socialization of organizational members in order to build educational views, values, and beliefs (Gopinath, 2020).
The effectiveness of the teacher is an important issue to consider. In the study of Karadag & Oztekin Bayir (2018), it was mentioned
that that the school principals' authentic leadership behaviors had positive effect on teachers' perceptions of school culture.

Dean’s Visionary Leadership, Institution’s Academic Culture and Faculty Performance of a Hei in Laguna
IJMRA, Volume 5 Issue 05 May 2022 www.ijmra.in Page 1153
The importance of measurable teaching performance quality in the learning process cannot be overstated. This
demonstrates that the quality of a faculty member's teaching performance is regarded as the most important aspect in a student's
success (Elmunsyah, Hidayat, & Asfani, 2019). In the study of Karmaker, Ahmed, Rahman, Tahiduzzaman, Biswas, Rahman, &
Biswas (2018), it was concluded that assessment of faculty performance in education is very pivotal to enrich their knowledge as
well as estimate each individual’s contribution to the organization. Furthermore, in the study of Patimo & Lucero (2021), it was
mentioned that the best predictor of the academic performance of the advance higher education students is the work experience
of the faculty members.
The relationship among the variables, visionary leadership, academic culture, and faculty performance, has been explored
in different studies conducted. In the study of Kurniadi, Lian, & Wahidy (2020) it was stated that visionary leadership and
organization culture jointly have a positive and significant effect on the performance of the teachers. The claim was further
strengthened in the study of Shanti, Gunawan, & Sobri (2020) where the result presented that there was a positive relationship
between visionary leadership and organizational climate with teacher performance. Amorin (2021) stated in his study how each
type of leadership behavior and organizational culture had positive and significant correlations. Furthermore,
"management/administrative" and "encouraging/coaching" leadership behaviors significantly impact organizational culture.
METHODS
The researcher utilized the descriptive-correlational research design which was the most effective research model to use for this
particular study. The research design determined the dean’s visionary leadership, institution’s academic culture, and level of
faculty performance of a higher educational institution in Laguna. The researcher used empirical data and documentary data for
the conduct of the study. The empirical data were acquired from the respondents of the study who were 361 college students
from Pamantasan ng Cabuyao.
The study aimed at determining the dean’s visionary leadership, institution’s academic culture, and faculty performance
of the higher education institution in Laguna. The respondents of the study were the college students of Pamantasan ng Cabuyao.
The sample size was taken using Raosoft’s Formula and stratified sampling technique was used to get the sample population.
From the total population 5,904 students enrolled in Pamantasan ng Cabuyao, there were 361 student-respondents for
this study. Specifically, 59 students are from the College of Education, Arts, and Sciences; 87 students from the College of Business,
Administration, and Accountancy; 126 students from the College of Computing and Engineering; and 89 students from the College
of Health and Allied Sciences. The respondents are the currently enrolled in Pamantasan ng Cabuyao for the Academic Year 2021-
2022.
The researcher used self-made questionnaire. The research questionnaire was composed of validated questionnaires,
which attempted to determine the dean’s visionary leadership, institution’s academic culture, and faculty performance of the
higher education institution. The questionnaire was divided into three parts. The first part of the questionnaire was about the
dean’s visionary leadership; the second part dealt in institution’s academic culture; and the third part focused on the level of
faculty performance.
Since the questionnaire was self-made, it was subjected to face and content validity. It was shown to the panel of experts
in educational management, in statistics, and in research for their comments and suggestions. After some modifications, it was
shown to the adviser for final approval and then distributed to the target respondents. Also, the research made questionnaire
underwent Cronbach’s Alpha reliability test, and the results were as follows: for the dean’s visionary leadership: 0.904; for the
institution’s academic culture: 0.875; and for level of faculty performance: 0.886.
The results of the study were collected from a survey questionnaire. The questions were typed on Google form and the
digital questionnaire was disseminated online. A letter of request was forwarded to the Office of the University President seeking
approval for the conduct of the study. The survey was devised from writing down the appropriate and pertinent questions and
measures to ensure that the respondents would answer accordingly, based on the variables presented to them. It was composed
of 54 questions, which evaluated the dean’s visionary leadership, institution’s academic culture, and faculty performance of a
higher educational institution in Laguna. The Likert scale was implemented to rate the independent and dependent variables of
the respondents by making them placed a check mark in one of the scale measures for each question. The researcher
comprehended the respondents’ conscious thoughts regarding their answers which might reflect upon their personalities and
affect their reputations. That’s why they would remain anonymous. The questionnaires were allocated after the respondents
answer and have them tallied, tabulated, analyzed, and interpreted.

Dean’s Visionary Leadership, Institution’s Academic Culture and Faculty Performance of a Hei in Laguna
IJMRA, Volume 5 Issue 05 May 2022 www.ijmra.in Page 1154
RESULTS AND DISCUSSIONS
Discussion of the dean’s visionary leadership, institution’s academic culture and faculty performance of an HEI is presented in the
succeeding tables and textual presentations:
Table 1. Composite Table of the Dean’s Visionary Leadership
Indicators
Weighted
Mean
Verbal Interpretation Rank
1. Communication 3.50 Highly Effective 1
2. Emotional intelligence 3.44 Highly Effective 3
3. Organizational climate 3.46 Highly Effective 2
Overall Weighted Mean 3.47 Highly Effective
Legend: (Strongly Agree/Highly Effective - 4, Agree/Effective - 3, Disagree/Less Effective -2, Strongly Disagree/Least Effective -
1)
Table 1 shows the sub-variables of visionary leadership. Among the sub-variables, communication ranked 1st with a
weighted mean of 3.50 and a verbal interpretation of “Highly Effective.” The organizational climate ranked the 2nd with a general
weighted mean of 3.46 and a verbal interpretation of “Highly Effective.” The sub-variable emotional intelligence ranked 3rd with a
weighted mean of 3.44 and a verbal interpretation if “Highly Effective.”
To summarize, an average weighted mean of 3.47 revealed that the dean’s visionary leadership was highly effective. This
means that the college dean earned the respect of the students, showed a warm and approachable personality, and was firm in
the implementation of quality instruction in the college.
In the study of Banwart (2020), he mentioned that while persuasive communication has long been at the heart of
leadership development, the discipline’s contributions to effective leadership also range from advancing the understanding of
organizational communicative systems to the development of skills for deliberative democracy and civic engagement.
Furthermore, Mascareno, Rietzschel, & Wisse (2019) explained how visionary leaders paint an image of the future with the
intention to persuade others to contribute to the realization of that specific future. Visionary leadership to be related to both
team creativity and innovation through goal alignment. Communication quality strengthened the relationship between goal
alignment and team innovation. In the study Van der Voet & Steijin (2020), the intended contribution was to bridge research on
leadership in collaborative governance and visionary leadership by examining vision communication as a driver of innovation of
multidisciplinary teams. The study further discussed how visionary leadership strengthened internal team cohesion and enabled
team members to more effectively span the boundaries of the team and collaborate with external stakeholders.
Table 2. Composite Table of the Higher Education Institution’s Academic Culture
Indicators
Weighted
Mean
Verbal
Interpretation
Rank
1. Academic outlook 3.39 Very Positive 3
2. Academic ethics 3.41 Very Positive 1
3. Academic environment 3.40 Very Positive 2
Overall Weighted Mean 3.40 Very Positive
Legend: (Strongly Agree/Very Positive - 4, Agree/Positive - 3, Disagree/Negative -2, Strongly Disagree/Very Negative - 1)
Table 2 shows the sub-variables of academic culture. Among the sub-variables, academic ethics ranked 1st with a
weighted mean of 3.41 and a verbal interpretation of “Very Positive.” The academic environment ranked the 2nd with a general
weighted mean of 3.40 and a verbal interpretation of “Very Positive.” The sub-variable academic outlook ranked 3rd with a
weighted mean of 3.39 and a verbal interpretation of “Very Positive.”
To summarize, an average weighted mean of 3.40 revealed that the institution’s academic culture was very positive. This
means that the institution gave recognition to student’s achievement, persuaded them to be part of the educational or research
activities of the college, and gave them opportunities to be part of these activities.
In the study of Glusac, Tasic, Nikolic, & Gligorovic (2017), it was mentioned that the culture of the school has a strong and
positive impact on teaching and learning. Furthermore, Agi (2019) stated that school leadership and staff commitment towards
school vision are strong combination in creating and sustaining most of the school culture. Amtu, Makulua, Matital, & Pattiruhu
(2020) explained that there is a direct or indirect influence of school culture and work motivation on student learning outcomes

Dean’s Visionary Leadership, Institution’s Academic Culture and Faculty Performance of a Hei in Laguna
IJMRA, Volume 5 Issue 05 May 2022 www.ijmra.in Page 1155
through teacher performance. This emphasizes that the culture of each school needs to encourage teacher performance in an
integrated and continuous manner so that it can encourage student learning outcomes.
Table 3. Composite Table of the Level of Faculty Performance
Indicators
Weighted
Mean
Verbal Interpretation Rank
1. Competence 3.21 High 1
2. Emotional intelligence 3.12 High 3
3. Work environment 3.15 High 2
Overall Weighted Mean 3.16 High
Legend: (Strongly Agree/Very High - 4, Agree/High - 3, Disagree/Low -2, Strongly Disagree/Very Low - 1)
Table 3 shows the sub-variables of faculty performance. Among the sub-variables, competence ranked 1st with a weighted
mean of 3.21 and a verbal interpretation of “High.” The work environment ranked the 2nd with a general weighted mean of 3.15
and a verbal interpretation of “High.” The sub-variable emotional intelligence ranked 3rd with a weighted mean of 3.12 and a
verbal interpretation of “High.”
To summarize, an average weighted mean of 3.16 revealed that the level of faculty performance was high. This means
that the faculty had shown mastery of the subject matter by providing comprehensive, accurate, and up-to-date knowledge on
the topic being discussed, allowed students to be active in the classroom learning environment but at the same time established
an appropriate control mechanism in keeping order in the classroom, showed respect to students and in return encouraged them
to show the same respect to themselves.
In the study of Wajdi, Rahayu, Ulfatin, Wiyono, & Imron (2018), it was stated that the teacher professional competence
is able to meditate the effect of the teacher innovation and the emotional intelligence on the school effectiveness. Fauth,
Decristan, Decker, Buttner, Hardy, Klieme, & Kunter (2019) further explained how teacher competence (pedagogical content
knowledge, self-efficacy, and teaching enthusiasm) was positively related to student achievement. In the study of Caena &
Redecker (2019), it was recommended for teachers to upgrade their competency profiles to meet the demands of the twenty-first
century. To enable 21st-century learners, teaching practices must change, as must the competencies that instructors must build.
Table 4. Relationship between the Dean’s Visionary Leadership and the Institution’s Academic Culture
Visionary Leadership Academic Culture
Academic outlook Academic ethics Academic environment
Communication r=0.608**
Moderate correlation
p=0.000
r=0.599**
Moderate correlation
p=0.000
r=0.503**
Moderate correlation
p=0.000
Emotional intelligence r=0.629**
Moderate correlation
p=0.000
r=0.631**
Moderate correlation
p=0.000
r=0.462**
Moderate correlation
p=0.000
Organizational climate r=0.688**
Moderate correlation
p=0.000
r=0.561**
Moderate correlation
p=0.000
r=0.407**
Moderate correlation
p=0.000
**Significant @ 0.01
Table 4 presents the dean’s visionary leadership and the institution’s academic culture. As observed, the obtained
probability value of 0.000 for all the sub-variables was less than the 0.01 significance level; therefore, a significant relationship
was noted in the dean’s visionary leadership and the institution’s academic culture. The result implies that the more effective the
dean’s visionary leadership, the more positive the institution’s academic culture.
This correlation is further proven by the study of Kurniadi, Lian, & Wahidy (2021) where it states that visionary leadership
and organization culture jointly have a positive and significant effect on performance. In addition, Mahmud (2017) mentioned
how building an effective school culture establishes the commitment of an effective culture, providing a thorough understanding
of vision, mission, and objectives of the school, determining clear policy direction, and emphasizing the importance of creativity

Dean’s Visionary Leadership, Institution’s Academic Culture and Faculty Performance of a Hei in Laguna
IJMRA, Volume 5 Issue 05 May 2022 www.ijmra.in Page 1156
and innovation. Furthermore, Widodo & Chandrawaty (2021) explained how the devotion of employees, especially teachers, is
critical to the success of any organization, including schools. This has to do with the existence of a commitment that is necessary
for employees and the business to succeed.
Table 5. Relationship between the Dean’s Visionary Leadership and Level of Faculty Performance
Visionary Leadership Faculty Performance
Competence Emotional
Intelligence
Work environment
Communication r=0.406**
Moderate correlation
p=0.000
r=0.458**
Moderate correlation
p=0.000
r=0.448**
Moderate correlation
p=0.000
Emotional intelligence r=0.372**
Low correlation
p=0.000
r=0.405*
Moderate correlation
p=0.000
r=0.430*
Moderate correlation
p=0.000
Organizational climate r=0.322**
Low correlation
p=0.000
r=0.340**
Low correlation
p=0.000
r=0.481**
Moderate correlation
p=0.000
**Significant @ 0.01
Table 5 presents the dean’s visionary leadership and the level of faculty performance. As observed, the obtained
probability value of 0.000 for all sub-variables was less than the 0.01 significance level; therefore, a significant relationship was
noted in the dean’s visionary leadership and the level of faculty performance. The result implies that the more effective the
visionary leadership, the higher the level of faculty performance.
This correlation is further proven by the study of Sunarto (2020) where it was found out that the principal’s visionary
leadership style, competence, and work discipline have positive and significant effect on teacher performance. Ulfa & Waluyo
(2021) explained in their study that there is a significant relationship between the visionary leadership and the teacher’s
performance – the stronger the visionary leadership of the principal, the better the teachers’ performance. In addition, Zhou,
Zhao, Tian, Zhang, & Chen (2018) stated that employee creativity in firms is positively associated with visionary leadership, and
the relationship is positively mediated by employee knowledge sharing.
Table 6. Relationship between the Institution’s Academic Culture and Level of Faculty Performance
Academic culture Faculty Performance
Competence Emotional Intelligence Work environment
Academic outlook r=0.351**
Low correlation
p=0.000
r=0.371**
Low correlation
p=0.000
r=0.488**
Moderate correlation
p=0.000
Academic ethics r=0.474**
Moderate correlation
p=0.000
r=0.410*
Moderate correlation
p=0.000
r=0.453*
Moderate correlation
p=0.000
Academic
environment
r=0.534**
Low correlation
p=0.000
r=0.427**
Low correlation
p=0.000
r=0.431**
Moderate correlation
p=0.000
**Significant @ 0.01
Table 6 presents the institution’s academic culture and the level of faculty performance. As observed, the obtained
probability value of 0.000 for all sub-variables was less than the 0.01 significance level; therefore, a significant relationship was
noted in the institution’s academic culture and the level of faculty performance. The result implies that the more positive the
institution’s academic culture, the higher the level of faculty performance.
This correlation is further proven in the study of Amtu, Makulua, Matital, & Pattiruhu (2020) which explains that there is
a direct or indirect influence of school culture and work motivation on student learning outcomes through teacher performance.

Dean’s Visionary Leadership, Institution’s Academic Culture and Faculty Performance of a Hei in Laguna
IJMRA, Volume 5 Issue 05 May 2022 www.ijmra.in Page 1157
This emphasizes that the culture of each school needs to encourage teacher performance in an integrated and continuous manner
so that it can encourage student learning outcomes. In addition, Fitria (2018) mentioned in her study that there is a direct positive
effect of organizational culture to the teacher performance. This means that conducive school organizational culture will lead to
increased performance of teachers. Furthermore, Ozgenel, Pinar, & Parlar (2020), stated that the effective leadership qualities of
school principals and the performance of teachers have a medium and positive association, and the effective leadership
characteristics of school principals strongly predict the performance of instructors.
CONCLUSION
From the collected findings, it was concluded the college dean earned the respect of the students, showed a warm and
approachable personality, and was firm in the implementation of quality instruction in the college. The institution gave recognition
to student’s achievement, persuaded them to be part of the educational or research activities of the college, and gave them
opportunities to be part of these activities. Additionally, the faculty had shown mastery of the subject matter by providing
comprehensive, accurate, and up-to-date knowledge on the topic being discussed, allowed students to be active in the classroom
learning environment but at the same time established an appropriate control mechanism in keeping order in the classroom,
showed respect to students and in return encouraged them to show the same respect to themselves. Furthermore, the more
effective the dean’s visionary leadership, the more positive the institution’s academic culture. It is also noted that the more
effective the visionary leadership, the higher the level of faculty performance. Likewise, the more positive the institution’s
academic culture, the higher the level of faculty performance.
FUTURE DIRECTIONS
The investigation, however, has some limitations particularly on the sub-contracts used for each variable. It is recommended that
the future researchers may duplicate the present study by considering other variables not mentioned such as other types of
leadership like transactional, transformational, etc.
Furthermore, an understanding of the relationship among the dean’s visionary leadership, institution’s academic culture
and faculty performance helps the higher educational institution to adapt an action plan that would sustain or enhance the above-
mentioned variables. This will further develop the skills of the deans as visionary leaders who set out concrete steps to bring a
vision to life, and lead the people in the college to that direction.
REFERENCES
1) Alegado, P. J. E. (2018). The challenges of teacher leadership in the Philippines as experienced and perceived by
teachers. International Journal of Education and Research, 6(6), 291-302.
2) Amorin, R. (2021). The Influence of Leadership Behaviour on Organizational Culture Among the Academic Deans of State
Universities and Colleges (SUCs) in Panay Island, Philippines. Journal of Business and Management Studies, 3(2), 256-267.
3) Amtu, O., Makulua, K., Matital, J., & Pattiruhu, C. M. (2020). Improving Student Learning Outcomes through School
Culture, Work Motivation and Teacher Performance. International Journal of Instruction, 13(4), 885-902.
4) Banwart, M. (2020). Communication studies: Effective communication leads to effective leadership. New Directions for
Student Leadership, 2020(165), 87-97.
5) Caena, F., & Redecker, C. (2019). Aligning teacher competence frameworks to 21st century challenges: The case for the
European Digital Competence Framework for Educators (Digcompedu). European Journal of Education, 54(3), 356-369.
6) Elmunsyah, H., Hidayat, W. N., & Asfani, K. (2019, September). Influence of Augmented Reality on the Achievement and
Student Learning Independence. In 2019 International Seminar on Application for Technology of Information and
Communication (iSemantic) (pp. 559-563). IEEE.
7) Fauth, B., Decristan, J., Decker, A. T., Büttner, G., Hardy, I., Klieme, E., & Kunter, M. (2019). The effects of teacher
competence on student outcomes in elementary science education: The mediating role of teaching quality. Teaching and
Teacher Education, 86, 102882.
8) Fitria, H. (2018). The influence of organizational culture and trust through the teacher performance in the private
secondary school in Palembang. International Journal of Scientific & Technology Research, 7(7), 82-86.
9) Glušac, D., Tasic, I., Nikolic, M., & Gligorovic, B. (2017). A study of impact of school culture on the teaching and learning
process in Serbia based on school evaluation. International Journal of Leadership in Education, 12(2), 255-268.
10) Gopinath, R. (2020). An Investigation Of The Relationship Between Self-Actualizationand Job Satisfaction of Academic
Leaders.

Dean’s Visionary Leadership, Institution’s Academic Culture and Faculty Performance of a Hei in Laguna
IJMRA, Volume 5 Issue 05 May 2022 www.ijmra.in Page 1158
11) Karadağ, E., & Oztekin Bayir, ö. Z. G. E. (2018). The effect of authentic leadership on school culture: A structural equation
model. International Journal of Educational Leadership and Management, 6(1).
12) Karmaker, C. L., Ahmed, S. M. T., Rahman, M. S., Tahiduzzaman, M., Biswas, T. K., Rahman, M., & Biswas, S. K. (2018). A
framework of faculty performance evaluation: A case study in Bangladesh. International Journal of Research in Advanced
Engineering and Technology, 4(3), 18-24.
13) Kurniadi, R., Lian, B., & Wahidy, A. (2020). Visionary leadership and organizational culture on teacher’s
performance. Journal of Social Work and Science Education, 1(3), 249-256.
14) Mahmud, H. (2017). Building Effective School Culture Through Visionary Leadership. In 2nd International Conference on
Education, Science, and Technology (ICEST 2017) (pp. 136-138). Atlantis Press.
15) Mangue, C. L. D., & Gonondo, J. (2021). Academic Culture and Talent Cultivation: The Chinese Experience. Journal of
Comparative and International Higher Education, 13(1), 133-150.
16) Mascareño, J., Rietzschel, E., & Wisse, B. (2020). Envisioning innovation: Does visionary leadership engender team
innovative performance through goal alignment?. Creativity and Innovation Management, 29(1), 33-48.
17) Migallos, K. M. (2021). Achieving the Desired: A Grounded Theory of Visionary Leadership among higher Educational
Institutions in the Philippines.
18) Nwachukwu, C., Chladkova, H., Zufan, P., & Olatunji, F. (2017). Visionary leadership and its relationship to corporate social
performance. Imperial Journal of Interdisciplinary Research, 3(4), 1302-1311.
19) Özgenel, M., Pınar, M. E. R. T., & Parlar, H. (2020). Improving teacher performance: Leadership qualities of school
principals as a tool. İstanbul Ticaret Üniversitesi Sosyal Bilimler Dergisi, 19(39), 1127-1148.
20) Patimo, D. M., & Lucero, M. B. A. (2021). Predictors of Success in Advance Higher Education: A Case in Northwest Samar
State University, Philippines. Research in Social Sciences and Technology, 6(1), 40-52.
21) Prestiadi, D., Zulkarnain, W., & Sumarsono, R. B. (2019, December). Visionary leadership in total quality management:
efforts to improve the quality of education in the industrial revolution 4.0. In the 4th International Conference on
Education and Management (COEMA 2019). Atlantis Press.
22) Shanti, C. M., Gunawan, I., & Sobri, A. Y. (2020, December). Relationship of school visionary leadership and organizational
climate with teacher performance. In 1st International Conference on Information Technology and Education (ICITE
2020) (pp. 624-629). Atlantis Press.
23) Sunarto, A., Tanjung, A. W., & Ellesia, N. (2020). Teacher Performance Based on The Visionary Leadership Style of School,
Competency and Work Discipline (Study at Muhammadiyah Setiabudi Pamulang College). Journal of Research in Business,
Economics, and Education, 2(5), 1046-1052.
24) Van der Voet, J., & Steijn, B. (2021). Team innovation through collaboration: How visionary leadership spurs innovation
via team cohesion. Public Management Review, 23(9), 1275-1294.
25) Wajdi, m. B. N., Rahayu, s., Ulfatin, n., Wiyono, b. B., & Imron, a. (2018). The professional competency teachers mediate
the influence of teacher innovation and emotional intelligence on school security. Journal of Social Studies Education
Research, 9(2), 210-227.
26) Widodo, W., & Chandrawaty, C. (2021). Exploring the Principals' Visionary Leaderships' Effect on School Organizational
Culture and Teachers' Affective Commitment. Technium Soc. Sci. J., 18, 21.
27) Zhou, L., Zhao, S., Tian, F., Zhang, X., & Chen, S. (2018). Visionary leadership and employee creativity in
China. International Journal of Manpower.
There is an Open Access article, distributed under the term of the Creative Commons Attribution – Non Commercial 4.0 International (CC BY-NC 4.0) (https://creativecommons.org/licenses/by-nc/4.0/), which permits remixing, adapting and building upon the work for non-commercial use, provided the original work is properly cited.

INTERNATIONAL JOURNAL OF MULTIDISCIPLINARY RESEARCH AND ANALYSIS
ISSN(print): 2643-9840, ISSN(online): 2643-9875
Volume 05 Issue 05 May 2022
DOI: 10.47191/ijmra/v5-i5-35, Impact Factor: 6.261
Page No. 1159-1172
IJMRA, Volume 5 Issue 05 May 2022 www.ijmra.in Page 1159
21st Century Digital Skills, Technology Integration in Instruction
and Challenges Encountered by Senior High School Teachers in
Muntinlupa National High School
Hazel Jhoy C. Del Mundo
Muntinlupa National High School, PHILIPPINES
ABSTRACT: This descriptive-correlational study determined the 21st-century digital skills, technology integration in instruction,
and challenges encountered in integrating technology. The participants in this study were composed of ninety-five Senior High
School teachers in Muntinlupa National High School. The study sought to find a significant association between 21st-century
digital skills and level of technology integration in instruction; challenges encountered and the level of technology integration of
teachers in instruction. The study revealed that the majority of the respondents were female, aged 40 to 49 years old, acquired
MA units, 7 – 12 years of teaching experience, and attended less than 3 related training on technology integration in instructions
for the last past 6 months. Findings showed that the level of 21st-century digital skills and level of technology integration in
instructions of the SHS teachers was very high. Teachers highly used video conferencing software such as Zoom, Microsoft
Teams, GoogleMeet, Cisco, WebEx, and others as the technology they integrate for their instructions. The challenges
experienced by teachers in integrating technology in instructions were the following; poor internet connection, students' lack of
support system, limited electronic materials and equipment, and lack of technological support from the school experts. Senior
high school teachers aged 40 to 49 have higher skills in the information of 21st-century digital skills than teachers aged 50 and
above. And, female senior high school teachers have higher skills in communication, collaboration, and problem-solving in 21st-
century digital skills than male senior high school teachers. Meanwhile, the teachers’ level of technology integration in
instruction and the challenges encountered in integrating technology were the same regardless of teachers’ profiles. The result
further revealed that the higher the 21st-century digital skills of the teachers, the higher the teachers’ level of technology
integration in instructions. And, the more challenges teachers encountered in integrating technology into instructions, the
higher their level of technology integration into instructions.
KEYWORDS: 21st century digital skills, technology integration in instructions, challenges encountered, teachers, technology.
I. INTRODUCTION
Change is already inevitable. With that, the academic institution as one of the responsible bodies for preparing a new breed of
workforce and leaders must adapt and be flexible with these transformations. Likewise, World Economic Forum [1] emphasizes
that education models must adapt to globalization and rapid technological advancements to equip learners with the skills to
create a more inclusive, cohesive, productive and innovative world. In response, the Philippines is embarking on a journey to
deliver an excellent education to achieve excellence in learning and effective teaching, and produce competent lifelong learners
who can respond to challenges and opportunities.
Technology is constantly developing and emerging. Back then, students had to go to the library and open books to obtain
information and materials they needed. In the twentieth century, information has been transformed into readily available
because of computers, devices, and the internet. Integrating technology into the teaching-learning process becomes a teaching
strategy and it additionally provides an opportunity for accessible communication among learners and teachers. With this
pandemic, the importance and role of technology in education have become clearer and expanded. Technology is helping new
educational modalities for learning to be possible. In October 2020, nonconventional learning modalities were launched which
include digital classes, printouts, lessons broadcast on television, radio and social media channels. As a result, the alternative
learning modality rely on students and teachers having access to the internet, as well as the necessary devices and abilities to

21st Century Digital Skills, Technology Integration in Instruction and Challenges Encountered by Senior High School Teachers in Muntinlupa National High School
IJMRA, Volume 5 Issue 05 May 2022 www.ijmra.in Page 1160
use them. Classroom interactions are transformed into a digital setup wherein teaching and learning happen with the aid of
technology such as gadgets, digital tools, applications, and the internet.
There are numerous studies establishing the importance of technology in education even before the strike of the pandemic.
Studies describe that technology integration would improve the teaching instructions and learning experiences [2]. It can cover
the design, development, application, and evaluation of education at all levels of education either formal, non-formal, informal,
special, inclusive, or lifelong education [3].And with the practice of technology integration, educators find convenience, ease,
and confidence that students could have rich learning experiences in class [4]. However, there are still limited empirical studies
that recognize whether teachers have high integration of technology in the classroom.
Teachers must have the essential skills and knowledge to fully utilize and take full advantage of the potential of technology
while using it in the classroom [5]. Learning certain skills requires teaching. Thus, teachers should be knowledgeable in the
implementation and application of various teaching and learning tools and have mastered the necessary skills for teaching 21st-
century learners. UNESCO [6] stresses the significance of Information and Communication Technology (ICT) on student learning,
especially its importance for the teachers to be digitally literate and understand how to incorporate it into the curriculum. Van
Laar et al. [7] suggested investigating the 21st-century digital skills of educators as the use of technologies emerges in their work
description. Organization, such as education, that deals and concern with fast moving technology need highly proficient teachers
in 21st century digital skills. Apparently, 21st-century digital skills are still not completely understood and scientifically
investigated in the field of education, especially in the local setting. And most of the available articles aim to investigate 21st-
century skills and digital skills, separately. Thus, there’s a funding gap in incorporating digital skills into the actual 21st-century
skills and another gap in determining whether teachers have a high level of 21st-century digital skills.
In this manner, the present study aimed to measure the 21st-century digital skills and level of technology integration in
instructions in the field of education. Teachers may find it useful for enhancing their 21st-century digital skills and use of
technology in instruction since they can incorporate it into lessons, teaching strategies, and student activity. Furthermore, the
teachers’ improvement on these levels may promote meaningful lifelong learning experiences for students. Since there’s a
transformation happening in teaching instructions and learning setup, the study's further aim was to identify the challenges
encountered by the Senior High School teachers in integrating technology into instructions. Therefore, this study was intended
to correlate the teachers’ level of 21st-century digital skills and challenges faced by them in integrating technology with
instructions to their level of technology integration in instructions.
II. METHODS
This study used the descriptive-correlational research design. Descriptive research aims to accurately and systematically
describe a population, situation or phenomenon. It can answer what, when, where, and how questions [8]. The study looked
into the significant difference in 21st century digital skills, technology integration and challenges between groups of teachers in
accordance with their personal and academic characteristics. It also aimed to present the significant relationship, through
correlation, between 21st century digital skills and technology integration; between technology integration and challenges
experienced by teachers in instruction. Data used in the investigation came from the 95 Senior High School teachers from
Muntinlupa National High School. Sample size was determined by Raosoft.com and the actual selection of the sample
respondents was done using random sampling technique where each member of the population had an exact equal probability
of being chosen using this sampling procedure [9].
The research used a questionnaire for the purpose of collecting the needed primary data. The research instrument was
divided into four (4) parts. Part I dealt with the profile of the respondents. Part II pertained to the 21st century digital skills. Part
III covered the level of technology integration in instruction. And Part IV concern on challenges in technology integration in
instruction. The Part II of the questionnaire was adopted from van Laar et al. [10]. They used a three-fold approach to test the
validity and reliability of the questionnaire. It included cognitive interview to enhance the clarity of the proposed skill items;
pilot testing to explore the factor structure; and full survey to measure the consistency of the skill factors. Three items were not
included in the final administration of the survey because the technical content is misaligned to the job description of the
education profession under dimension of communication. While Part I, Part III and Part IV were researcher-made
questionnaires. The items included in these parts were derived from different related literature. The whole questionnaire was
subjected to face and content validity by seeking the opinions and insights of the panel of experts such as researcher, ICT
teacher and a professional teacher for further improvements. The tools of 21st century digital skills, technology integration and

21st Century Digital Skills, Technology Integration in Instruction and Challenges Encountered by Senior High School Teachers in Muntinlupa National High School
IJMRA, Volume 5 Issue 05 May 2022 www.ijmra.in Page 1161
challenges scored its reliability 0.967, 0.802, and 0.824, respectively on Cronbach alpha testing. Part II and III of the
questionnaires were measured using the 4-point Likert scale: Always/Very High (3.25 - 4.00), Sometimes/High (2.50 - 3.24),
Rarely/Low (1.75 - 2.49) and Never/Very Low (1.00 - 1.74). And Part III was encoded using the following scale: Strongly Agree
(3.25 - 4.00), Agree (2.50 - 3.24), Disagree (1.75 - 2.49) and Strongly Agree (1.00 - 1.74).
Data were collected from the respondents through a paper and pen survey and an online survey using Google Form.
Permission to conduct the study and administer the questionnaire were secured from the School Division Office of Muntinlupa
City and school head. The respondents were given a consent letter together with the survey questionnaires and they
participated voluntarily. The study achieved 100% retrieval of survey questionnaires through a paper and pen survey and online
survey using Google Form. Data were organized, analyzed and interpreted using the following statistical tools: (1) Frequency
count and percentage were used to describe the profile of the respondents. (2) Weighted mean was used to describe the level
of 21st-century digital skills, level of technology integration in instruction, and challenges encountered by teachers in technology
integration in instruction. (3) Tests of difference such as t-test for independent means, Kruskal Wallis Test, chi-square and
ANOVA were used to determine the difference in the teachers’ level of 21st-century digital skills when grouped according to
profile variables; the difference in the teachers’ level of technology integration in instruction when grouped according to profile
variables; and the difference in the challenges encountered by teachers in technology integration in instruction when grouped
according to profile variables. And, (4) Pearson product-moment correlation coefficient was utilized to determine the
relationship between the teachers’ level of 21st century digital skills and level of technology integration in instruction; and
between the teachers’ challenges encountered and level of technology integration in instruction.
III. RESULTS AND DISCUSSIONS
Discussion of the 21st-century digital skills, technology integration in instruction, and challenges encountered in integrating
technology is presented in the succeeding tables and textual presentations:
Table 1. The Personal and Academic Characteristics of the Respondents
Demographic Variables Frequency
(n = 95)
Percentage
Personal
Characteristics
Age
Below 30 17 17.90
30-39 27 28.40
40-49 31 32.60
50 and above 20 21.60
Gender
Male 34 35.80
Female 61 64.20
Academic
Characteristics
Highest Educational Attainment
Bachelor’s Degree 9 9.50
With MA units 55 57.90
Master’s degree 19 20.00
With PhD/EdD units 8 8.40
Doctorate degree 4 4.20
Number of Years in Teaching
1-6 33 34.70
7-12 35 36.80
13 and above 27 28.40
Number of Trainings Attended
0-2 37 38.90
3-5 36 37.90
6 and above 22 23.20

21st Century Digital Skills, Technology Integration in Instruction and Challenges Encountered by Senior High School Teachers in Muntinlupa National High School
IJMRA, Volume 5 Issue 05 May 2022 www.ijmra.in Page 1162
Table 1 shows the personal and academic characteristics of the respondents. The majority of the respondents were 40-
49 years (32.60%) of age, female (64.20%), with MA units (57.90%), had 7-12 years of teaching experience (36.80%), and had 0-2
training attended (38.90%) in technology integration.
Table 2. Composite Table of the Teachers’ Level of 21st Century Digital Skills
Skills Weighted
Mean
Verbal
Interpretation Rank
Information Digital Skills 3.43 Very High 2
Communication Digital Skills 3.24 High 6
Collaboration Digital Skills 3.53 Very High 1
Critical Thinking Digital Skills 3.39 Very High 4
Creativity Digital Skills 3.40 Very High 3
Problem Solving Digital Skills 3.29 Very High 5
Overall Weighted Mean 3.38 Very High
It is shown in Table 2 that the Senior High School teachers had very high level of 21st century digital skills as evidenced
by obtained overall weighted mean of 3.38. This suggests that senior high school teachers believe that they are proficient on the
technical aspect of digital skills to listed competencies on 21st century skills. Results are related to the study of van Laar et al. [7]
that working professionals are performers of 21st-century digital skills and in a greater range.
The table 2 also reveals that the respondents’ highest level is on Collaboration Digital Skills as rank 1 with weighted
mean of 3.52 signify very high level. This means that respondents have very high-level skills for searching, evaluating, and
organizing information in digital environment. It also defined as the ability to reach a goal as a team, to complement and support
each other [11]. As Kaur and Debel [12] study gives emphasis on teachers’ collaboration as part of teachers’ daily routines and
they need to be involved in planning, implementing, and evaluation. This is congruent with the study made by Gonzales [13],
teachers have a very high level of collaboration in 21st century skills, which is defined as the capacity to operate as a team, work
effectively and respectfully in teams to achieve a common objective, and take shared responsibility for accomplishing a task.
The composite skills of Information Digital Skills (MW= 3.43), Creativity Digital Skills (MW=3.40), Critical Thinking Digital
Skills (MW =3.39) and Problem-Solving Digital Skills (MW =3.29) where the respondents classified as having very high level. Van
Laar et al. [7] corroborate the finding that information digital abilities include the capacity to clearly describe information
demands, assess digital information, and pick digital information in an effective and efficient manner. Serezhkina [14] supported
the findings that school teachers had a high level of digital competence, particularly in the areas of information management
and technical internet use. Promoting critical thinking within media literacy education will lead to real integration of media and
digital skills in the classroom [15]. Same findings on Gonzales [13] that faculty members on State University had a high degree of
critical thinking, creativity and invention which includes the ability to examine a wide range of issues, explore and assess many
points of view, and develop suitable conclusions and ability to produce and refine solutions to complicated issues or tasks based
on synthesis, analysis, and then merging or presenting what they learnt in new and creative ways. While, Rensburg [16]
emphasize developing creative digital abilities, which entails using digital tools and technology to test creative ideas. Castek et
al. [17] describe digital problem solving involves the use of the skills, strategies and approaches needed to navigate online. And
Gepila [18] claimed that Highly Proficient Teachers have superior educational situation cognition, are better at problem solving,
and maximize possibilities obtained through experience.
Meanwhile, Communication Digital Skills is considered as the least performed skills among 21st century digital skills as it
gains weighted mean of 3.24 which classify as high level. This finding conforms Al-Qahtani [19] study indicating that the current
learning modality offered such as online class and virtual courses may enhance communication skills.
The result of the study confirms the discovery of van Laar et al. [20] that sub-skills among 21st century digital skills have
interrelationship and it build on each other sequentially. Except for critical thinking, all dimensions affirm to lead directly to
problem-solving digital abilities [20]. The findings were also discussed in the study of Benson [21]; Liwa [22]; and Caluza [23] on
having high level of 21st century skills and other similar ICT competency of teachers. Meanwhile, Mannila, Norden & Pears [24]
study supported these findings that the highest composite self-efficacy in digital competence was information and data literacy
followed by collaboration. For the result in communication, it was explained by French [25] that it is included on the soft skills

21st Century Digital Skills, Technology Integration in Instruction and Challenges Encountered by Senior High School Teachers in Muntinlupa National High School
IJMRA, Volume 5 Issue 05 May 2022 www.ijmra.in Page 1163
that are describe in more complex and less tangible skills that needed for communicate confidently and clearly with online
contacts.
Table 2. The Teachers’ Level of Technology Integration in Instruction
Indicators Weighted
Mean
Verbal
Interpretation Rank
1. I use social networking groups such as Facebook, Twitter,
LinkedIn, and others to interact with students.
3.67 Very High 7
2. I utilize online integrated software such as google classroom, MS
Teams, Moodle, EdApp, and others to plan, implement, facilitate,
assess, and monitor student learning.
3.63 Very High 8
3. I use video-conferencing software such as Zoom, Microsoft
Teams, Google Meet, Cisco Webex and others to communicate
with students, colleagues, community, and others.
3.80 Very High 1
4. I incorporate video and multimedia into lessons and
presentations.
3.69 Very High 4
5. I use online software tools such as Google Forms, MS Forms,
SurveyMonkey, Facebook poll to solicit opinions, create forms,
surveys, and quizzes.
3.69 Very High 4
6. I use video editing apps such as Filmora, iMovie, OBS and others
to create video recorded lesson.
3.24 High 10
7. I let my students to use technology as learning tool that may
produce and achieve learning objectives.
3.69 Very High 4
8. I give my students a project-based activities where they need the
help of technology such as creating videos, poster and others.
3.59 Very High 9
9. I let my students to use technology to help them solve real-world
problems and learn to assess information.
3.72 Very High 2
10. I allow my students to use technology as medium to share their
ideas to other students that will promote teamwork, cooperation
and collaboration.
3.68 Very High 6
Average 3.64 Very High
From the data shown in the table 3, the level of technology integration in instruction of Senior High School teachers
was very high based on overall weighted mean score of 3.64. This means that respondents have very high level of using
technology resources such as computers, smartphones, tablets, digital cameras, social media platforms and networks, software
applications, the Internet and others in teaching and learning class practices. TPACK framework of Mishra & Koehler [26]
describe how teachers integrate technology into instruction in bringing meaningful learning experiences to the students.
It shows that teachers have a very high level of using technology to enhance and support the educational environment
and support classroom instruction by using technology in presenting lessons and creating opportunities for students to complete
the assigned task using different technological tools rather than with normal pencil and paper. Implementation of technology in
classroom, the teachers need to guide students to ensure that they are meeting their learning objectives [27]. Likewise, Ivus et
al. [5] emphasized the need for the teachers to develop skills needed to fully utilize digital technology in the classroom and in an
online setting.
The finding conforms the following study: Gamboa & Gamboa [28] revealed that teachers are highly competent on MS
Word, MS Excel and MS PowerPoint; Javier [29] claimed that most teachers are ‘good’ in ICT skills to utilized ICT tools and
applications for teaching with the internet; Nueva [30] showed that teachers have high level of perceived technology integration
practices; Albacete & Banhaw [31] revealed that Filipino found convenience and ease on the practice of technology integration;
Ruman & Praksha [32] used TIM in measuring the extent of technology integration among teachers to facilitate their lesson;
DeCoito & Richardson [33] proposed professional development opportunities for instructors to learn about the interaction of

21st Century Digital Skills, Technology Integration in Instruction and Challenges Encountered by Senior High School Teachers in Muntinlupa National High School
IJMRA, Volume 5 Issue 05 May 2022 www.ijmra.in Page 1164
technology, pedagogy, and subject matter; Hero et al. [34] reported that Filipino teachers highly practiced the ICT integration as
part of their instructional practices and strategies in teaching; Samote & De Guzman [35] describe public school teachers are
advanced on the ICT competencies and technological operations; Lestiyanawati [36] indicated that online chat, using video
conference, and combining both online chat and video conference in online teaching and learning process were the teaching
strategies applied by teacher with the aid of technology; and Hero [37] affirmed that technology integration in instruction helps
and assists teachers to bridge the gap between traditional teaching approaches and technology-based teaching and learning
tools and facilities.
Table 4. The Challenges Encountered by Teachers in Technology Integration in Instruction
Indicators Weighted
Mean
Verbal
Interpretation Rank
1. Internet connection issues in the area. 3.55 Strongly Agree 1
2. Lack of knowledge to facilitate online application such as Google
Classroom, LMS, MS Teams, Moodle, EdApp and others. 2.98 Agree 9
3. Lack of a good internet connection of the student for
participating to the online activities. 3.40 Strongly Agree 2
4. Students lack of support system. 3.34 Strongly Agree 3
5. Lack of ability to perform necessary skills needed for successful
online teaching. 2.98 Agree 9
6. Limited electronic materials and equipment such as gadgets,
laptop and others. 3.15 Agree 4
7. Lack of available technological support from the expert in
school. 3.12 Agree 5
8. Lack of proper training and mentoring to fully gasps the use of
such tools. 3.09 Agree 6
9. Problem in conducting video-conferencing software such as
Zoom, Microsoft Teams, Google Meet, Cisco Webex and others
to communicate with students, colleagues, community, and
others.
3.02 Agree 7
10. Low computer literacy level. 2.89 Agree 10
Table 4 displays that Internet connection ranks one (1) as the challenge encountered by Senior High School teachers in
technology integration in instructions based on weighted mean of 3.55. Senior High School teachers also strongly agree that
they experience challenges such as lack of a good internet connection of the student for participating to the online activities
(WM =3.40), and lack of support system for students (WM=3.34). Another hindrance for successful integration of technology in
instruction are the following: limited electronic materials and equipment such as gadgets, laptop and others (WM =3.15); Lack of
available technological support from the expert in school (WM = 3.12); lack of proper training and mentoring to fully gasps the
use of such tools (WM = 3.09); Problem in conducting video-conferencing software such as Zoom, Microsoft Teams, Google
Meet, Cisco Webex and others to communicate with students colleagues, community, and others (WM = 3.02); lack of ability to
perform necessary skills needed for successful online teaching (WM = 2.98); Lack of knowledge to facilitate online application
such as Google Classroom, LMS, MS Teams, Moodle, EdApp and others (WM = 2.98), and low computer literacy level
(WM=2.89).
This means that teachers admitting that they are experiencing problems related to internet connection, gadgets,
computers, required skills, and difficulty in using technology as learning and teaching tool. The findings about challenges
encountered by teachers in technology integration in instruction strengthened by König et al. [38] which analyzed the teachers’
digital competencies were related to how they mastered the challenges during emergency remote education. Furthermore
Fabito et al. [39]; Azhar and Iqbal [40]; Lestiyanawati [36]; Almazova et al.[41]; Ivus et al. [5]; Tomaro [42]; Alda et al. [43]; Emre
[44]; Klapproth et al.[45]; Hero [46], Samifanni & Gumanit [46]; and Tarman, Kilinc & Aydin [47]; and Javier [29] listed challenges
experienced by the teachers on using technology in teaching and learning process. These includes lack of working are for doing
online activities, lack of good internet connection, feedback and clarification from instructors, difficulty in using online and

21st Century Digital Skills, Technology Integration in Instruction and Challenges Encountered by Senior High School Teachers in Muntinlupa National High School
IJMRA, Volume 5 Issue 05 May 2022 www.ijmra.in Page 1165
offline tools and application, lack of facilities, lack of parents’ support system, computer literacy level, school support, lack of
training, and lack of long-term supports.
Table 5. Difference in the Teachers’ Level of 21st century Digital Skills when grouped according to Age
21st Century Digital Skills F-test p-value Interpretation
Information
xbelow30=3.46
x30-39=3.43
x40-49=3.56
x50&above=3.19
2.894
0.040*
Significant
(Between 40-49 &
50&above)
Communication 0.687 0.562 Not Significant
Collaboration 1.511 0.217 Not Significant
Critical thinking 1.445 0.235 Not Significant
Creativity 1.150 0.333 Not Significant
Problem solving 0.645 0.588 Not Significant
*Significant @ 0.05
As disclosed in table 5, there was no significant difference in communication, collaboration, critical thinking, creativity,
problem solving on teachers’ level of 21st century digital skills when grouped according to age. While 21st century digital skills
under information revealed to have significant difference between teachers aged 40 - 49 and 50 & above with p-value of 0.040
at 0.05 margin of error. This means that the respondents who were 40-49 years of age had higher level of 21st century digital
skills along information that those who were 50 years of age and above. Supported by the study of Gonzales [13] which revealed
significant difference between the level of 21st century skills of faculty members when grouped according to age. Findings
support the suggestion of Samifanni and Gumanit [46] that elderly teachers should be providing better technical support to
provide quality education. And similar to Hinojo-Lucena et al. [48] that age as conditioning factor when developing digital
competence of teachers, especially in the information and data literacy.
Table 6. Difference in the Teachers’ Level of 21st century Digital Skills when grouped according to Gender
21st Century Digital Skills t-test p-value Interpretation
Information 0.179 0.858 Not Significant
Communication
x male=3.43
x female=3.56
2.375
0.020*
Significant
Collaboration
x male=3.43
x female=3.56
3.204
0.002*
Significant
Critical thinking 1.029 0.071 Not Significant
Creativity 1.829 0.071 Not Significant
Problem solving
x male=3.43
x female=3.56
3.735
0.000*
Significant
*Significant @ 0.05
As observed from the data in table 6, the constraints under 21st century digital skills such as information, critical
thinking and creativity have no significant difference between male and female teachers. While the computed p-value of
communication (0.020), collaboration (0.002) and problem solving (0.000) revealed to have a significant difference between
male and female senior high school teachers at 0.05 margin of error. This means the female teachers (WM=3.56) had higher
level of 21st century skills along communication, collaboration and problem-solving digital skills than the male teachers
(WM=3.43). The result of the study is parallel with the result of Rubach and Lazarides [49] about gender being correlated with

21st Century Digital Skills, Technology Integration in Instruction and Challenges Encountered by Senior High School Teachers in Muntinlupa National High School
IJMRA, Volume 5 Issue 05 May 2022 www.ijmra.in Page 1166
the six dimension of teachers’ basic ICT competence which includes problem solving, communication and collaboration while
argue the result of Gonzales [13] that there is no significant difference between male and female teachers’ level of skills.
Table 7. Difference in the Teachers’ Level of 21st century Digital Skills when grouped according to Academic Characteristics
Profile Variables
Highest Educational Attainment Number of Years in Teaching Number of Related Trainings
Attended
21st Century
Digital Skills
Kruskal-
Wallis
test
p-value Interpretation F-test p-
value Interpretation
F-
test
p-
value Interpretation
Information 0.932 0.920 Not Significant 0.419 0.659 Not Significant 1.082 0.343 Not Significant
Communication 3.343 0.502 Not Significant 0.402 0.670 Not Significant 1.931 0.151 Not Significant
Collaboration 1.575 0.813 Not Significant 0.723 0.488 Not Significant 0.139 0.870 Not Significant
Critical thinking 2.898 0.575 Not Significant 1.260 0.288 Not Significant 0.167 0.846 Not Significant
Creativity 3.147 0.534 Not Significant 0.573 0.566 Not Significant 1.342 0.267 Not Significant
Problem
solving 4.850 0.303 Not Significant 0.174 0.840 Not Significant 1.443 0.242 Not Significant
Significance level @ 0.05
Table 7 unveils that the constraints under 21st century digital skills have no significant difference on grouped according
to highest educational attainment, number of years in teaching, and number of related trainings attended. This means that the
level of 21st century digital skills of the teachers was the same, regardless of their highest education attainment, number of
years in teaching, and number of related trainings attended. This finding supported by Garcia et al. [50] that the teacher’s level
of education was not related to the level of digital abilities in the twenty-first century. Same with Blažič & Blažič [51] study that
instructors' attitudes regarding seminars and training are the primary cause of inadequate outcomes, particularly in bridging the
digital divide with digital skills. It reveals that regardless of how many trainings the teachers attended, their level of digital
abilities in the twenty-first century was the unaffected. The same result on Gonzales [13] that length of service of teaching
personnel had nothing to do with their level of skills. The result contradicts the study of Hinojo-Lucena et al. [48] claiming that
Master’s Degree and teaching experiences have significant weight and makes greatest impact on digital competence
development of teachers. And, prior training on ICT confirmed that it may affect to for teachers to have low digital competence.
Table 8. Difference in the Teachers’ Level of Technology Integration in Instruction and Challenges Encountered by Teachers in
Technology Integration in Instruction when grouped according to Profile Variables
Technology Integration in Instruction Challenges Encountered
Profile Test
statistic p-value Interpretation
Test
statistic p-value Interpretation
Age F=1.419 0.242 Not Significant F=0.421 0.738 Not Significant
Gender t=1.265 0.209 Not Significant t=-1.296 0.198 Not Significant
Highest
educational
attainment
x2=4.099 0.393 Not Significant x2=2.751 0.600 Not Significant
Number of years
in teaching F=0.111 0.895 Not Significant F=1.516 0.225 Not Significant
Number of related
trainings attended F=0.495 0.611
Not Significant
F=1.495 0.230
Not Significant
Significance level @ 0.05

21st Century Digital Skills, Technology Integration in Instruction and Challenges Encountered by Senior High School Teachers in Muntinlupa National High School
IJMRA, Volume 5 Issue 05 May 2022 www.ijmra.in Page 1167
Table 8 revealed that the teachers’ level of technology integration in instructions and challenges encountered have no
significant difference when group according to their profile. This means that regardless of the teachers’ profile variables, their
level of technology integration in instruction and challenges encountered in integrating technology in instructions was the same.
Javier [29] exposed that age and year in teaching are not associated with practices in the use of digital teaching and
learning tools, similar to Nueva [30] claimed that age has weaker association with the teachers’ belief on using technology. It
also underpinned to Sawyer [52] claims that one's ability to integrate ICT into the classroom is not determined by their
educational achievement or profile characteristics. As a result, the extent of technology integration in instruction was the same
despite of the teachers' profile characteristics. Moreover, findings of the study are comparable with Moralista and Oducado [53]
where educational attainment has significantly differed in the favorability toward online education while number of trainings in
online teaching was not. The result opposes with Claro et al. [54] assertion that younger teachers with more years of teaching
experience performed better on solving information and communication tasks in a digital environment. And contrasting the
findings of Germino [55] and Adedokun [56], that there is significant association between the teachers’ profile and teachers’
capability in technology integration especially on using computers and internet.
While the result in challenges experience by teachers has the same findings with the study of Li et al. [57], where
obstacles in utilizing technology into classrooms are observed whatever of the teachers’ profile characteristics. Similar to the
findings of Tarman, Kilinc & Aydin [47] that there is no statistical difference between male and female teachers’ perceived
barriers but contradict significant difference between teachers who attended technology-related professional development and
those who did not. It also contradicts the study of Hamutogly and Basarmak [58] that lack of training as part of external barriers
affects the internal barriers directly and positively in technology integration. Meanwhile, experienced educators suggested way
to overcome barriers as posted on the study of Atabek [59], improve quality of in-service and preservice training, allow teachers
more time by simplifying number of courses in the instructional program and supplying teachers with technology incentives and
technical assistance.
Table 9. Relationship between the Teachers’ Level of 21st century Digital Skills and Level of Technology Integration in
Instruction
21st Century Digital Skills Pearson r p-value Interpretation
Information
0.516
Moderate
Correlation
0.000**
Significant
Communication
0.477
Moderate
Correlation
0.000**
Significant
Collaboration
0.564
Moderate
Correlation
0.000**
Significant
Critical thinking
0.411
Moderate
Correlation
0.000**
Significant
Creativity
0.593
Moderate
Correlation
0.000**
Significant
Problem solving
0.484
Moderate
Correlation
0.000**
Significant
**Significant @ 0.01
Based on table 9 the computed r-value under information is 0.516, communication is 0.477, collaboration is 0.564,
critical thinking is 0.411, creativity is 0.593, problem solving is 0.484 are indicating a moderate correlation to level of technology
integration. Furthermore, calculated p-value from the pair of 21st century digital skills and technology integration in instructions
is less than the level of significance at 0.01. Thus, it reveals a significant relationship between the teachers’ level of 21st century

21st Century Digital Skills, Technology Integration in Instruction and Challenges Encountered by Senior High School Teachers in Muntinlupa National High School
IJMRA, Volume 5 Issue 05 May 2022 www.ijmra.in Page 1168
digital skills and level of technology integration in instruction. This means that the higher the level of teachers 21st century
digital skills, the higher their level of technology integration in instruction. The result is related to the Samonte and De Guzman
[35] study which give emphasize on the role of teachers’ professional development as a critical factor on the successful
integration of computers in teaching. It is also similar to claims of Manco-Chavez et al. [60] and Limjuco [61] about the
significant relationship of utilization of technology and level of digital skills.
Table 19. Relationship between the Level of Technology Integration in Instruction and Teachers’ Challenges Encountered
Indicator Pearson r p-value Interpretation
Level of Technology Integration
in Instruction and Challenges
Encountered by teachers
0.214
Low correlation
0.037*
Significant
*Significant @ 0.05
Table 19 shows the result of relationship between and level of technology integration in instruction and challenges
encountered by teachers. The computed Pearson r-value is 0.214 that shows low correlation between teachers’ level of
technology integration in instruction and their challenges encountered. There is significant relationship between teachers’ level
of technology integration in instruction and their challenges encountered based on the calculated p-value of 0.037. Since the p-
value is less than the level of significance set for the study (p=0.05) thus, the level of technology integration in instruction of
senior high school teachers have significant relationship to the challenges they encountered. It means that the higher is the level
of technology integration in instruction, the more challenges the teachers encounter in integrating technology in instructions.
When teachers have low integration of technology in the classroom, it means that the chance of encountering challenges is also
low. Similar to the claimed of König et al. [38] that teacher’s digital competencies to integrate technology were related to how
they mastered the challenges during emergency remote education. It conveys an idea that teachers who had experienced more
challenges the more likely they mastered technology integration. Findings also comparable to the findings of Sillat et al. [62] on
the connection between the use of emerging technologies and teacher’s barriers in integrating technology.
IV. CONCLUSIONS
The 21st Century Digital Skills of the Senior High School teachers in Muntinlupa National High School is in very high level. Its
composite skills of information, communication, collaboration, critical thinking, creativity, and problem-solving is in very high
level while their communication is in high level. The level of technology integration in the instruction of the Senior High School
teachers in Muntinlupa National High School is very high. Teachers highly use video conferencing software such as Zoom,
Microsoft Teams, Google meet, Cisco, Webex, and others as the technology they integrate for their instructions. The challenges
experienced by teachers in integrating technology in instructions are the following; poor internet connection, students' lack of
support system, limited electronic materials and equipment, and lack of technological support from the school experts. Senior
high school teachers aged 40 to 49 have higher skills in the information of 21st-century digital skills than teachers aged 50 and
above. On the other hand, female senior high school teachers have higher skills in communication, collaboration, and problem-
solving in 21st-century digital skills than male senior high school teachers. Hence, it can be viewed that the higher the 21st-
century digital skills of the teachers, the higher the teachers’ level of technology integration in instructions. And, the more
challenges teachers encountered in integrating technology into instructions, the higher their level of technology integration into
instructions.
V. RECOMMENDATIONS
Teachers should attend and be active in collaboration, participate in peer-to-peer teaching, and promote and maintain effective
and active learning communities that promote innovation in technology and 21st-century digital skills. To create an expert
teacher that could transform their students to be 21st century digitally skilled, leaders, administrators, and school heads should
analyze, design, develop, implement and evaluate programs such as professional development programs to sustain and improve
teachers’ competence and skill for successfully and effectively using technology in the teaching and learning process. Leaders
and school heads should establish continuous training and development through seminars and hands-on workshops for teachers
to expand and achieve proficiency levels in using different technological teaching and learning tools for teaching instruction and
practices. There is a need for strengthening the partnership between the community and school. Reinforcement is needed from
local government, NGOs, barangays, and others to address the problems that hinder the effective adaptation of digital

21st Century Digital Skills, Technology Integration in Instruction and Challenges Encountered by Senior High School Teachers in Muntinlupa National High School
IJMRA, Volume 5 Issue 05 May 2022 www.ijmra.in Page 1169
classrooms and distance learning. School heads should adopt the proposed action plan in this study to resolve issues with the
integration of technology in the classroom. It will help to strengthen engagement and enhance the learning experience of
learners. Teachers should be innovative and adaptive in integrating essential technological tools for teaching. They should have
their initiatives to develop skills and learn operational ability to perform the necessary and critical teaching tools for embracing
Education 4.0. Furthermore, similar studies must be conducted using the other population and environments not considered in
this study such as investigating 21st-century digital skills of other professions and assessing of actual use of technological
learning and teaching tools. They may also consider creating and evaluating a program that will enhance teachers’ skills and
integration of technology in the classroom.
REFERENCES
1) World Economic Forum. (2016, March). New Vision for Education: Fostering social and emotional learning through
technology. Retrieved February 13, 2022, from https://www3.weforum.org/docs/WEF_New_Vision_for_Education.pdf
2) Montealegre, M. (2019). Education 4.0: Rebooting Phl teacher education. Retrieved March 2022, from PhilStar global:
https;//www.philstar.com/other-sections/education-and-home/2019/07/28/1938565/education-40-rebooting-phl-
teacher-education
3) Mishra, S. & Panda, S. (2020). Technology-enabled learning: Policy, pedagogy and practice. Commonwealth of Learning.
Retrieved from
http://oasis.col.org/bitstream/handle/11599/3655/Mishra_Panda_TEL_Policy_Pedagogy_Practice_2.pdf?sequence=4&i
sAllowed=y
4) Albacete, D. V. & Banhaw, P. (2019). iTEACH (Integrating Technology in Teaching): Narratives of Teacher
Educators. West Visayas State University Research Journal, 8(2). Retrieved from
scahttp://ejournals.ph/form/cite.php?id=16798
5) Ivus, M., Quan, T. & Snider, N. (March 2021). 21st Century Digital Skills: Competencies, Innovations and Curriculum in
Canada. Information and Communications Technology Council (ICTC).
6) UNESCO (2018, March 16). Digital Skills Critical for Jobs and Social Inclusion. Retrieved March 2, 2022, from
https://en.unesco.org/news/digital-skills-critical-jobs-and-social-inclusion
7) van Laar, E., van Deursen, A. J., van Dijk, J. A., & de Haan, J. (2020). Determinants of 21st-century skills and 21st-century
digital skills for workers: A systematic literature review. Sage Open, 10(1), 2158244019900176.
8) McCombes, S. (2022, January 22). Understanding Types of Research. Scribbr. Retrieved February 22, 2022, from
https://www.scribbr.com/methodology/types-of-research/
9) Thomas, L. (2020, October 2). An introduction to simple random sampling. Scribbr. Retrieved February 22, 2022, from
https://www.scribbr.com/methodology/simple-random-sampling/
10) van Laar, E., van Deursen, A. J., van Dijk, J. A., & de Haan, J. (2018). 21st-century digital skills instrument aimed at
working professionals: Conceptual development and empirical validation. Telematics and informatics, 35(8), 2184-2200.
11) Oudeweetering, K., & Voogt, J. (2018). Teachers’ conceptualization and enactment of twenty-first century
competences: exploring. The Curriculum Journal, 29(1), 116-133. doi:https://doi.org/10.1080/09585176.2017.1369136
12) Kaur, J., & Debel, O. (2019). Teacher collaboration and professional development in secondary schools of Ethiopia: A
literature review. IAHRW International Journal of Social Sciences Review, 7(5), 1031-1034.
13) Gonzales, N. A. P. (2020). 21st Century Skills in Higher Education: Teaching and Learning at Ifugao State University,
Philippines. Asian Journal of Assessment in Teaching and Learning, 10(2), 72-81.
14) Serezhkina, A. (2021). Digital Skills of Teachers. In E3S Web of Conferences (Vol. 258). EDP Sciences.
15) Pérez-Escoda, A., García-Ruiz, R., Castro-Zubizarreta, A., & Aguaded, I. (2017, October). Media literacy and digital skills
for enhancing critical thinking in networked society. In Proceedings of the 5th International Conference on Technological
Ecosystems for Enhancing Multiculturality (pp. 1-7).
16) Rensburg, C., Coetzee, S. A., & Schmulian, A. (2021). Developing digital creativity through authentic
assessment. Assessment & Evaluation in Higher Education, 1-21.
17) Castek, J., Jacobs, G., Gibbon, C., Frank, T., Honisett, A., & Anderson, J. (2018). Defining digital problem solving.
18) Gepila Jr, E. (2020). Assessing teachers using Philippine standards for teachers. Universal Journal of Educational
Research, 8(3), 739-746.

21st Century Digital Skills, Technology Integration in Instruction and Challenges Encountered by Senior High School Teachers in Muntinlupa National High School
IJMRA, Volume 5 Issue 05 May 2022 www.ijmra.in Page 1170
19) Al-Qahtani, H. (2020). Teachers’ and Students’ Perceptions of Virtual Classes and the Effectiveness of Virtual Classes in
Enhancing Communication Skills. Arab World English Journal (AWEJ)Special Issue: The Dynamics of EFL in Saudi Arabia.
http://dx.doi.org/10.2139/ssrn.3512530
20) van Laar, E., van Deursen, A. J., van Dijk, J. A., & de Haan, J. (2019). Determinants of 21st-century digital skills: A large-
scale survey among working professionals. Computers in human behavior, 100, 93-104.
21) Benson, E. M.. (2018). Organizational Commitment and 21st Century Skills among Teachers of Caraga South District
Division of Davao Oriental . Tin-aw, 2(1). Retrieved from http://ejournals.ph/form/cite.php?id=13677
22) Liwa, I. (2018). School Principals’ Leadership Behaviors Vis-à-vis Teachers’ Instructional Practices. West Visayas State
University Research Journal, 7(2). Retrieved from http://ejournals.ph/form/cite.php?id=14670
23) Caluza, LJ.(2018). Predicting Teachers’ ICT Competence in a Philippine University Using J48 Algorithm. Indian Journal of
Science and Technology, 11(7), DOI: 10.17485/ijst/2018/v11i7/119062
24) Mannila, L., Nordén, L. Å., & Pears, A. (2018, August). Digital competence, teacher self-efficacy and training needs.
In Proceedings of the 2018 ACM Conference on International Computing Education Research (pp. 78-85).
25) French, J. (2019, October 29). Digital Communication Skills You Need in the 21st Century. Communication Guru.
Retrieved March 1, 2022, from https://communicationguru.co.za/digital-communication-skills-you-need-in-the-21st-
century/
26) Mishra, P., & Koehler, M. J. (2006). Technological pedagogical content knowledge: A framework for teacher
knowledge. Teachers college record, 108(6), 1017-1054.
27) D'Angelo, C. (2018, July 9). The impact of technology: Student engagement and success. Go to the cover page of
Technology and the Curriculum: Summer 2018. Retrieved May 23, 2022, from
https://techandcurriculum.pressbooks.com/chapter/engagement-and-success/ s
28) Gamboa, J., & Gamboa, A. G. (2020). Impact to information computer technology: computer competency of Tinajero
high school teachers in Philippines. Religación: Revista de Ciencias Sociales y Humanidades, 5(24), 152-157.
29) Javier, B. (2021). Practices of Filipino Public High School Teachers on Digital Teaching and Learning Technologies during
the COVID-19 Pandemic. International Journal of Computing Sciences Research, 6, 707-722. Retrieved from
//stepacademic.net/ijcsr/article/view/240
30) Nueva, M. (2019). Filipino teachers’ attitude towards technology- its determinants and association with technology
integration practice. Asia-Pacific Social Review, 19(3) 2019, pp. 167-184
31) Albacete, D. V. & Banhaw, P. (2019). iTEACH (Integrating Technology in Teaching): Narratives of Teacher
Educators. West Visayas State University Research Journal, 8(2). Retrieved from
scahttp://ejournals.ph/form/cite.php?id=16798
32) Ruman, M., & Prakasha, G. (2017). Application of Technology Integration Matrix (TIM) in teaching and learning of
secondary school science subjects. IOSR Journal of Humanities And Social Science, 22(12), 24-26.
33) DeCoito, I., & Richardson, T. (2018). Teachers and technology: Present practice and future directions. Contemporary
Issues in Technology and Teacher Education, 18(2), 362-378.
34) Hero, J. L., Zulueta, Md, Msph, M. E., Gloria, D. S., Tongol, J. L., Dela Cruz, Sr., A. C., Sagun, A. T., Cajurao, F. V. &
Cabrera, W. C. (2021). Mastering Innovations in the Lens of Information and Communications Technology (ICT)
Competence and Practices of 21st Century Filipino Teachers: A Comparison among Thailand, Vietnam, and the
Philippines. International Journal of Multidisciplinary: Applied Business and Education Research, 2(4). Retrieved from
http://ejournals.ph/form/cite.php?id=16787
35) Samonte, K. & De Guzman, P. (2019). ICT Competencies among Public Secondary School MAPEH Teachers: An
Assessment. JPAIR Institutional Research Journal, 12(1). Retrieved from http://ejournals.ph/form/cite.php?id=15278
36) Lestiyanawati, R. (2020). The strategies and problems faced by Indonesian teachers in conducting e-learning during
COVID-19 outbreak. CLLiENT (Culture, Literature, Linguistics, and English Teaching), 2(1), 71-82.
37) Hero, J. L. (2019). The Impact of Technology Integration in Teaching Performance. Online Submission, 48(1), 101-114.
38) König, J., Jäger-Biela, D. J., & Glutsch, N. (2020). Adapting to Online Teaching During COVID-19 School Closure: Teacher
Education and Teacher Competence Efects Early Career Teachers in Germany. European Journal of Teacher Education.
https://doi.org/10.1080/02619768.2020.1809650
39) Fabito, B. S., Trillanes, A. O., & Sarmiento, J. R. (2020). Barriers and challenges of computing students in an online
learning environment: Insights from one private university in the Philippines. arXiv preprint arXiv:2012.02121.

21st Century Digital Skills, Technology Integration in Instruction and Challenges Encountered by Senior High School Teachers in Muntinlupa National High School
IJMRA, Volume 5 Issue 05 May 2022 www.ijmra.in Page 1171
40) Azhar, K. A., & Iqbal, N. (2018). Effectiveness of Google classroom: Teachers’ perceptions. Prizren Social Science
Journal, 2(2), 52.
41) Almazova, N., Krylova, E., Rubtsova, A., & Odinokaya, M. (2020). Challenges and opportunities for Russian higher
education amid COVID-19: Teachers’ perspective. Education Sciences, 10(12), 368.
42) Tomaro, Q. P. V. (2018). ICT integration in the educational system of Philippines. Journal of Governance and Public
Policy, 5(3), 259-282. https://doi.org/10.18196/jgpp.5399
43) Alda, R., Boholano, H.& Dayagbil, F. (2020). Teacher Education Institutions in the Philippines towards Education 4.0.
International Journal of Learning, Teaching and Educational Research, 19(8)
44) Emre, D. İ. N. C. (2019). Prospective teachers’ perceptions of barriers to technology integration in
education. Contemporary Educational Technology, 10(4), 381-398.
45) Klapproth, F., Federkeil, L., Heinschke, F., & Jungmann, T. (2020). Teachers' Experiences of Stress and Their Coping
Strategies during COVID-19 Induced Distance Teaching. Journal of Pedagogical Research, 4(4), 444-452.
46) Samifanni, F. & Gumanit, R. (2021). Survival with technology: Elderly teachers’ perspective towards emergency online
learning during the covid-19 pandemic in the Philippines. Studies in Learning and Teaching. 2(2).
https://doi.org/10.46627/silet.v2i3.87
47) Tarman, B., Kilinc, E., & Aydin, H. (2019). Barriers to the effective use of technology integration in social studies
education. Contemporary Issues in Technology and Teacher Education, 19(4). https://citejournal.org/volume-19/issue-
4-19/social-studies/barriers-to-the-effective-use-of-technology-integration-in-social-studies-education
48) Hinojo-Lucena, F. J., Aznar-Diaz, I., Caceres-Reche, M. P., Trujillo-Torres, J. M., & Romero-Rodriguez, J. M. (2019).
Factors influencing the development of digital competence in teachers: Analysis of the teaching staff of permanent
education centres. IEEE Access, 7, 178744-178752.
49) Rubach, C., & Lazarides, R. (2021). Addressing 21st-century digital skills in schools–Development and validation of an
instrument to measure teachers' basic ICT competence beliefs. Computers in Human Behavior, 118, 106636.
50) García-Vandewalle García, J. M., García-Carmona, M., Trujillo Torres, J. M., & Moya Fernández, P. (2021). Analysis of
digital competence of educators (DigCompEdu) in teacher trainees: the context of Melilla, Spain. Technology,
Knowledge and Learning, 1-28.
51) Blažič, B. J., & Blažič, A. J. (2020). Overcoming the digital divide with a modern approach to learning digital skills for the
elderly adults. Education and Information Technologies, 25(1), 259-279
52) Sawyer, L. M. (2017). Perceptions and practice: The relationship between teacher perceptions of technology use and
level of classroom technology integration (Doctoral dissertation, Southeastern University).
53) Moralista, R & Oducado, R. M. (2020). Faculty perception toward online education in a state college in the Philippines
during the coronavirus disease 19 (COVID-19) pandemic. Universal Journal of Educational Research, 8(10), 4736-4742.
DOI: 10.13189/ujer.2020.081044
54) Claro, M., Salinas, A., Cabello-Hutt, T., San Martín, E., Preiss, D.D., Valenzuela, S. & Jara, I. (2018). Teaching in a Digital
Environment (TIDE): Defining and measuring teachers' capacity to develop students' digital information and
communication skills. Computers & Education, 121(1), 162-174. Elsevier Ltd. Retrieved May 24, 2022
from https://www.learntechlib.org/p/201744/.
55) Germino, p. (2021). Assessment of computer and internet literacy of elementary teachers in the countryside area of the
Philippines. The Journal of Rare Ideas, 2(2), 32-45.
56) Adedokun, A. A. Teachers Perceptions and Demographics on Technology Integration in Ibadan Metropolis Secondary
Schools.
57) Li, Y., Garza, V., Keicher, A., & Popov, V. (2019). Predicting high school teacher use of technology: Pedagogical beliefs,
technological beliefs and attitudes, and teacher training. Technology, Knowledge and Learning, 24(3), 501-518.
58) Hamutoglu, N. B., & Basarmak, U. (2020). External and Internal Barriers in Technology Integration: A Structural
Regression Analysis. Journal of Information Technology Education, 19.
59) Atabek, O. (2020). Experienced educators’ suggestions for solutions to the challenges to technology
integration. Education and Information Technologies, 25(6), 5669-5685.
60) Manco-Chavez, J., Uribe-Hernandez, Y., Buendia-Aparcana, R., Vertiz-Osores, J.; Isla Alcoser, S. and Rengifo-Lozano, R.
(2020). Integration of ICTS and digital skills in times of the Pandemic COVID-19. International Journal of Higher
Education. Retrieved May 5, 2022 from https://files.eric.ed.gov/fulltext/EJ1281403.pdf

21st Century Digital Skills, Technology Integration in Instruction and Challenges Encountered by Senior High School Teachers in Muntinlupa National High School
IJMRA, Volume 5 Issue 05 May 2022 www.ijmra.in Page 1172
61) Limjuco, C (2019). The relationship between level of utilization of emerging technologies, level of digital skills, and level
of efficiency among professional accountants in Quezon province. University of Perpetual Help System Laguna.
62) Sillat, L. H., Tammets, K., & Laanpere, M. (2021). Digital Competence Assessment Methods in Higher Education: A
Systematic Literature Review. Education Sciences, 11(8), 402. https://doi.org/10.3390/educsci11080402
There is an Open Access article, distributed under the term of the Creative Commons Attribution – Non Commercial 4.0 International (CC BY-NC 4.0) (https://creativecommons.org/licenses/by-nc/4.0/), which permits remixing, adapting and building upon the work for non-commercial use, provided the original work is properly cited.

INTERNATIONAL JOURNAL OF MULTIDISCIPLINARY RESEARCH AND ANALYSIS
ISSN(print): 2643-9840, ISSN(online): 2643-9875
Volume 05 Issue 05 May 2022
DOI: 10.47191/ijmra/v5-i5-36, Impact Factor: 6.261
Page No. 1173-1179
IJMRA, Volume 5 Issue 05 May 2022 www.ijmra.in Page 1173
Linguistic Anxiety in Foreign Language Learning Process
Preuniversity Level Dominican Students
Santa Cabrera1, Teofilo Diaz2, Issa Morillo3 1Ministry of Education MINERD-IDEICE 2,3Universidad Autónoma de Santo Domingo, UASD
ABSTRACT: Learning a second language has become a necessity for human beings, because in daily life they face globalization,
which requires knowing or mastering other languages or languages apart from the native one. This has become a challenge for
the inhabitants of a country or nation, generating in them an anxious feeling that prevents them from learning easily. Linguistic
anxiety is the apprehension experienced in front of a situation that requires the use of a second foreign language with which the
individual does not have all his communicative potential […] which causes the propensity of individuals to react nervously when
they speak, listen, read or write in this other idiom For these reasons, through this study we will try to explain briefly and simply
about anxiety, its intervention in learning a foreign language, the causes that generate it and the role of the teacher when this
factor occurs.
KEYWORDS: Anxiety, types of anxiety, cognitive load, language learning.
INTRODUCTION
The study stems from personal experiences and observations of the various students who are studying in the various educational
institutions of the Dominican Republic, who present certain tensions, nervousness, worries, anguish, among others, when carrying
out activities related to the foreign language to be taught.
In today's world and through globalization, social, economic and political demands have been leading humanity to multilingualism
in all social strata.
In today's societies, dealing with two or more languages has become a differentiated and essential medium in training and job
opportunities for the youth population, whose main objective in the Dominican educational system is to promote comprehensive
education in young people at the national.
Despite the implementation of new educational methodologies within the context of language teaching in the Dominican nation,
there is still a latent deficit in the command of foreign languages by students and, at present, linguistic anxiety has become one of
the biggest obstacles to language learning.
These feelings can be present in all four language skills, being more common in the development of oral skills. For these reasons,
it is intended to know what anxiety consists of. Also, we will comment on the possible causes that generate it and how it affects
students.
Anxiety is an affective factor that positively or negatively influences the personality of students and their education. This kind of
feeling is called foreign language anxiety. Because, for some students, learning another language is complex, since they face the
formation of a grammar different from the one they have achieved innately.
This is one of the cases faced by the students of the Dominican nation, who have faced certain obstacles in learning a foreign
language, due to the coexistence of environments far from this type of language and by not having the necessary skills and
knowledge. Show behaviors of nervousness and apathy towards language.
Anxiety has made students fearful and nervous, generating poor linguistic skills, as it is related to the wisdom and memory of the
human being. In other words, they are the ones who are most often inferior to others, they are shy and easily embarrassed. On
the other hand, they suffer from various transformations such as: accelerated heart rate, abundant perspiration, and desire to go
to the bathroom, among others. To this situation is added the inability to order or structure the ideas well and therefore they
cannot give an answer to the questions that the teacher asks.

Linguistic Anxiety in Foreign Language Learning Process Preuniversity Level Dominican Students
IJMRA, Volume 5 Issue 05 May 2022 www.ijmra.in Page 1174
The problem of anxiety in students may have arisen from having been ridiculed by other people when making mistakes in the
response or activities in the classroom called "Archaic Anxiety", that is, repressed anguish from the past. Also, it is perceived due
to the scolding and negative thoughts that some teachers have created in them.
The study that is presented corresponds to the investigations that have been carried out in the different educational centers of
the Dominican Republic in which levels of linguistic anxiety in the students have been explored. The presence of this construct in
language classrooms shed light on this reality. A second language or language has received little research in the country.
On the other hand, language teachers are interested in delving into the knowledge in the process of learning a language and what
interferes with said learning, since the better the problem is understood, the better pedagogical orientations will emerge for the
teaching of languages. That they want to impart.
In other words, language anxiety is central to understanding how learners approach language learning, their expectations of
success or failure, and ultimately why they continue or stop studying.
ANXIETY IN THE ACQUISITION OF SECOND LANGUAGES
Conceptualization
Merino-Crespo (2019) defines anxiety as "an alert signal that warns of imminent danger and allows the person to take the
necessary measures to face a threat" (p.19). The detriment in student performance is associated with anxiety and stress problems,
causing long-term mental and physical health problems.
Cáceres-Caballero & Meza-Aranda (2021) argue that anxiety in learning a foreign language is a unique type of anxiety that has a
broad theoretical study not only addressed by theorists who expose results in fields of anxiety, but, as part of the reality
experienced by many foreign language learners. This type of anxiety accompanies the process of learning a new language, affecting
all productive skills (written and speaking skills) as well as receptive skills (reading and listening skills) typical of the language.
Also, "anxiety always occurs as a result of difficulties in adapting to the changes that are taking place in our lives." It is considered
as an emotional response or pattern (triple response system) encompassing cognitive, physiological and motor aspects. In
addition, it supports some of the repercussions associated with cognitive procedures: worry, fear, fear, insecurity, apprehension
or negative thoughts (Merino-Crespo, 2019:19).
Anxiety is defined in the learning of a foreign language "as a complex psychological phenomenon and typical of the language while
in a more specific way" (Cáceres-Caballero & Meza-Aranda, 2021:42). On the other hand, it is conceptualized as "that feeling of
tension and apprehension associated with learning contexts of a foreign language in relation to the development of a negative
feeling present when learning and using that target language orally or in writing" (p.42 ).
Anxiety in the context of learning a foreign language is one of the main impediments to the acquisition and future fluent
production of the new language. On the other hand, it is typified as that language anxiety related to negative feelings produced
within the context of learning a foreign language. Put another way, it is the apprehension experienced when a situation requires
the use of language or language in which the learner is not fully competent.
In other words, various researchers and authors recognize the distinction between anxiety in learning a foreign language and any
other type of anxiety based on the fact that the learning experience is a unique and specific process (Cáceres-Caballero & Meza-
Aranda, 2021:41-42).
ANXIETY CLASSIFICATION
There are two types of anxiety: the positive one experienced as a consequence of real dangers and the negative one, which
responds to the fears present in people's imagination. Others comment that it is a subjective feeling of tension, apprehension,
nervousness and worry, associated with an activation of the parasympathetic nervous system. In addition, two categories
associated with this concept are considered: state-anxiety and trait-anxiety.
To this is added a third, called situational anxiety. It is related to aspects of personality and may be a hereditary component,
anxiety as a state is temporary. That is to say, it details a momentary period and a resistance against specific situations. This third
category (situational anxiety) is considered a form of state-anxiety that appears in certain contexts and is characterized by a feeling
of incapacity on the part of the individual. (Merino-Crespo, 2019: 19)
Anxiety and Learning a Second Language – Foreign
España-Reyes (2019), comments that one of the factors that affects students in the learning process is anxiety in subjects that
they consider difficult, among which is learning other languages. For these reasons, various studies have been carried out focused
on the investigation of anxiety (p.7).

Linguistic Anxiety in Foreign Language Learning Process Preuniversity Level Dominican Students
IJMRA, Volume 5 Issue 05 May 2022 www.ijmra.in Page 1175
Anxiety is defined as "a threat to security and/or self-esteem perceived by students" (España-Reyes, 2019:8). In accordance with
this definition, it can be seen that this threat can be direct, such as a decrease in a grade in a test. Also, a degree of intense anxiety
can obstruct the ability to use specific skills necessary for learning the foreign language. For this reason, it has been identified as
one of the factors that affects the learning of foreign languages.
The degree of anxiety can interfere with the unavoidable skills for learning the foreign language. Also, it is related to interaction
with others, such as students who consider themselves disabled by their actions (when speaking in class) when they feel judged
by others or insecure (España-Reyes, 2019:8).
CAUSES OF ANXIETY
For España-Reyes (2019), anxiety about learning foreign languages is attributed to various factors: "oral expression, fear of being
negatively evaluated and anxiety before exams". Difficulty levels of foreign language classes, personal perception of language
aptitude, certain personality variables (for example, perfectionism and fear of public speaking), and stressful classroom
experiences are all possible causes of concern.
Six random sources of anxiety stemming from these aspects have been identified: the student, the teacher, and the instructional
practice. It is caused by personal and interpersonal issues, student statements about language learning, teacher opinions about
language teaching, teacher-student interaction, classroom methods, and exams (España-Reyes, 2019:9).
Other causes for which anxiety is generated
Fear of speaking: sometimes students speculate that they are going to make a mistake and feel fear, refraining from speaking,
perhaps because of the ridicule of their classmates and the teacher's call for attention, making them unable to express themselves
in another language. The student must risk talking regardless of the mistakes he may make when expressing himself, as this will
help him improve and meet his goal.
Low self-esteem: students who have limited success in learning a foreign language often have low self-esteem, considering
themselves incapable of carrying out activities that are related to the oral production of the language they are learning. Some
consider that they must speak fluently, with a good accent that language learning must be done in a short time (López, 2019).
ANXIETY AND ACADEMIC PERFORMANCE
One of the important causes of anxiety is the nervousness caused by grammatical errors, pronunciation and the inability to talk
spontaneously, to talk in front of others in the second language. For such purposes, it is suggested that the classroom environment
should be encouraging, motivating and that teachers should deal with anxiety-provoking situations.
Negative emotions continue to appear in the classroom that teaches foreign languages, because the act of writing in another
language is not attractive to students. Also, the situations that cause anxiety in students is not understanding what the teacher
transmits to them.
sor and when they make mistakes when expressing themselves in the foreign language (España-Reyes, 2019:11).
Anxiety and Learning
Regarding the relationship between anxiety and learning, the lack of desire to communicate and the anxiety of the students, since
most of them want to participate in interpersonal dialogues, because they do not like to risk talking in another language in the
classroom. On the other hand, students of both sexes were facing anxiety in learning foreign languages, however, the female
gender presents greater concerns than the male (España-Reyes, 2019:12).
Anxiety and Exams
España-Reyes (2019) argues that one of the important aspects in the growth of students is anxiety when facing exams, focusing
on three dimensions: concern, emotionality and facilitation. This type of deduction has identified the relationship between test
anxiety and the use of information acquisition, encoding and retrieval strategies in these students (p.12-13).
TYPES OF ANXIETY
Social anxiety: this includes shyness, embarrassment, a state of fear and apprehension in communication. They avoid social
settings where they have to participate for fear of ridicule and rejection by others.
Evaluative anxiety: it is perceived as part of social anxiety, especially in situations in which the student must communicate in the
language that she is learning. Therefore, when presenting this type of anxiety, he tends to be restless and worried about the
results of his expression (López, 2019).

Linguistic Anxiety in Foreign Language Learning Process Preuniversity Level Dominican Students
IJMRA, Volume 5 Issue 05 May 2022 www.ijmra.in Page 1176
Foreign Language Learning Anxiety
According to Merino-Crespo (2019), anxiety in the foreign language can be seen as an individual discernment or in any context in
which a second or foreign language is used. This varies according to environmental conditions, perceptions of the level of threat
in a given situation, and variations in the individual's level of stress. Three components were identified: apprehension in the act
of communication, test anxiety and fear of negative evaluation.
The apprehension in the act of communication is related to the concern presented by the students when they have to
communicate with others, being shy when speaking in public, experiencing difficulties when they have to speak in the foreign
language, since they are observed by the teacher and is not in control of the situation. These learners are often involved in
strategies to avoid the language learning process. In addition, the belief they have about the difficulty of understanding and being
understood by others when they use non-native language, experiencing a feeling of fear and becoming silent in certain situations.
Exam anxiety arises from the fear of failure, because students experience nervousness before obtaining an exam or evaluation
test, giving them a feeling of discomfort that leads them to make certain mistakes that would not occur in a more relaxed
environment.
The fear of negative evaluation is related to the fear of being evaluated, but in this case it goes beyond the context of the test or
exam, because the student generates a feeling of fear when being evaluated by others in any social situation, such as speak in
class using a language other than their mother tongue and tend to avoid such situations (Merino-Crespo, 2019:19-20).
On the other hand, there are six potential sources that produce anxiety in foreign language students, since they can be related to
the student, the teacher or the educational practice. The first is due to the personal and interpersonal anxieties associated with
the self-esteem of individuals and their concern about how others perceive them. Students have an incorrect concept of their
abilities.
The second source is related to students' beliefs about language learning. In this sense, students with unrealistic beliefs about
language learning are considered to experience anxiety when they are unable to meet expectations.
Third, it is supported that the misconceptions that teachers have about language teaching can be a source of linguistic anxiety in
students, thinking that they have to constantly correct all mistakes, creating a tense atmosphere in the classroom.
The fourth source is the interaction between the teacher and the student, as well as the correction techniques used. In this part
the corrective feedback is revealed, since the problem seems to be linked to the way of correcting the errors, not the correction
of errors.
The fifth source of anxiety arises when students have to deal with speaking or interacting using the foreign language, especially
frequently.
Talk to the teacher or the rest of the students.
Finally, the sixth and in relation to exams, it can cause anxiety. This is because students may worry when the teacher places too
much importance on grammatical correctness in exams or other assessment activities, with the result that students may not pass
exams even though they have good proficiency in the subject. Foreign language (Merino-Crespo, 2019: 21-22)
Histogram of language anxiety
Anxiety in Learning Foreign Languages
Adrianzén-Segovia (2021), comments that studies have been carried out in order to understand the levels of anxiety of developed

Linguistic Anxiety in Foreign Language Learning Process Preuniversity Level Dominican Students
IJMRA, Volume 5 Issue 05 May 2022 www.ijmra.in Page 1177
people in relation to learning a foreign language since it affects it effectively or inefficiently. This is a feeling of tension and
apprehension specifically associated with contexts that occur in the acquisition of second languages including oral production,
listening comprehension and learning (p.61).
Anxiety can have a number of effects: academically, cognitively, socially, and personally. At the academic level, where high levels
of anxiety are shown in learning the non-native language associated with low levels of performance in the language course.
Cognitive, occurs in three stages: input, processing and output of information. Finally, in the social aspect, it is about the availability
that students have to communicate during the class where this ability is usually compared between them.
As for the personal, each person faces anxiety since, for some, learning a foreign language can be an unpleasant experience.
Linguistic Anxiety
However, a scale is presented to measure the level of linguistic anxiety of students in the process of learning a foreign language,
using the components of anxiety in said learning, producing a negative effect on it:
Communicative apprehension: associated with the student's shyness in contexts where she has to communicate. That is, he is
frustrated by not understanding another person or when he cannot communicate efficiently. In this there are three situations:
speaking in public, with another person or in a group listening to a spoken message.
The fear of negative evaluation by peers: it depends on the appreciations that students have of their peers and these about them.
This component can negatively affect the student both cognitively and emotionally. In the first case by hindering your ability to
pay attention and understand new information. Second by generating feelings such as anxiety.
Exam anxiety: this is the expectations of students to get high grades and be successful in the foreign language class in which a
series of exams and evaluations are constantly carried out in order to check the progress of the students. This process can raise
stress and pressure levels in students who feel more anxious (Adrianzén-Segovia, 2021:61-62).
There are different studies focused on the relationship between anxiety and the skills that are developed as part of learning a
foreign language: written and oral comprehension (reading & listening); written and oral production (writing & speaking). The
perceptions of students in relation to anxiety have been investigated Influence of anxiety in learning English as a non-native
language in higher education students and when speaking during language class resulting in high levels of anxiety when
communicating with their peers. (Adrianzén-Segovia, 2021:62)
Cáceres-Caballero & Meza-Aranda (2021) believe that anxiety in learning a second language is a field that has been studied around
the 1970s. However, until 1990, when a formal theory calling this class of anxiety as a syndrome related to three other types of
anxiety: fear of negative evaluation, communicative apprehension, and evaluation anxiety.
Fear of negative evaluation: it manifests itself as excessive and disproportionate fear of self- and co-evaluation by the teacher or
peers of the apprentice where not only the development of the person during the task but also to what extent they develop are
objectively analyzed and valued. The various language skills. In other words, making mistakes in the process of learning a foreign
language is allowed and develops naturally. However, these errors make the student find himself in constant fear of making
mistakes, seeking to minimize any opportunity for participation to avoid any negative evaluation. (Cáceres-Caballero & Meza-
Aranda, 2021:40-41)
Communicative apprehension: it is defined as the uncomfortable feeling mode and negative that is present when having to express
thoughts, emotions or facts in public within a learning context. If the lack of command of this new language is added to this
situation, both factors contribute to the unconscious development of anxiety. That is, the lack of ability to understand and be
understood within this context causes frustration and the constant apprehension to communicate.

Linguistic Anxiety in Foreign Language Learning Process Preuniversity Level Dominican Students
IJMRA, Volume 5 Issue 05 May 2022 www.ijmra.in Page 1178
Anxiety before the evaluation: it is based on the fear and suspicion of failing or not demonstrating sufficient ability to master the
target language. This happens as a result of the unrealistic demands made by the learner where the only result that must be
achieved is perfection, because they see evaluation (exams) as the only intelligent tool that can cause them to make mistakes
(Cáceres- Caballero & Meza-Aranda, 2021:41-42).
Anxiety in learning situations and processes
Virtual Environments to reduce anxiety in foreign language students
Sánchez-Muñoz (2021), believes that the advantages of a second language is a theoretical construction to solve certain problems
regarding cognitive and affective factors in the teaching and learning of foreign languages. It has been possible to appreciate that
certain studies have found similarities between the learning of the non-native language and diversified aspects such as personality,
motivation, attitude or anxiety. The purpose of the research regarding anxiety in learning a foreign language can be controlled
with the implementation of virtual worlds (VM) for the teaching of a foreign language (p.1).
Anxiety in the foreign language plays an essential role in language teaching, where teachers must create environments that reduce
anxiety in students. Information and Communication Technologies (ICT) and technological instruments offer these possibilities,
since their purpose is to facilitate the learning and teaching of foreign languages.
Various investigations have been investigating how anxiety in the foreign language can be reduced through electronic teaching
environments, smartphones or mobile phones, communication environments measured by computers, among other means.
The studies carried out have been able to show that virtual worlds could reduce anxiety, due to the possibilities they offer in the
teaching of the foreign language. These studies analyzed the evolution of anxiety levels due to a foreign language.
Virtual worlds favor the reduction of anxiety levels for the foreign language in language students. In that same order, there are
certain methodological obstacles for the development of activities in the teaching of the second language (Sánchez-Muñoz,
2021:6).
The use of technological tools in virtual environments for the development of the foreign language
Mendoza-Navas & Martos-Eliche (2021) are of the opinion that Information and Communication Technologies (ICT) offer the
possibility of communicating in real time with any part of the world, as well as data access that increases every day. Knowledge of
a foreign language offers communicative possibilities using it, creating real and functional communicative content.
The use of ICT in the foreign language classroom is a methodology that motivates students, because it stimulates them to feel
attracted to them, which can be used in various ways. All teaching methods, the use of new technologies have advantages and
disadvantages. The use of ICT in the foreign language classroom is an effort of teachers, because they must be constantly updated,
receiving training for the use of these resources when teaching. Teaching methods are constantly changing and today the use of
new technologies is inevitable in teaching.
The use of technology in the teaching of foreign languages responds to the following reasons: it is motivating, the interactivity
offered by the linguistic exercises, the type of feedback offered by the interactive materials, which are perceived as useful by the
students. On the other hand, the use of technology in the classroom allows students to be more autonomous.
The discussion about the benefits of technology, including investigations of technological applications to a specific area of
language teaching and learning, considers that the role of technology is useful in differentiating linguistic abilities (reading,

Linguistic Anxiety in Foreign Language Learning Process Preuniversity Level Dominican Students
IJMRA, Volume 5 Issue 05 May 2022 www.ijmra.in Page 1179
listening, writing and speaking ), facilitating the practice of each of these skills such as the integration of skills and the incorporation
of authentic cultural contexts important for language learning (Mendoza-Navas & Martos-Eliche, 2021).
REFERENCES
1) Adrianzén-Segovia, C. (2021). Influence of anxiety in learning English as a foreign language in higher education students.
Magazine of the International University of Ecuador. Vol. 6, No. 3. 58-78.
2) Cáceres-Caballero, K. & Meza-Aranda, K. (2021). Learning anxiety and reading comprehension in English as a foreign
language in university students. Master's degree. Lima, Peru: Women's University of the Sacred Heart.
3) Chen, I-J & Cheng, C. (2017). Cognitive Load Theory: An Empirical Study on Anxiety and Performance on Language
Learning Tasks. Electronic Journal of Research in Educational Psychology. Vol. 7. No. 2. 729-746.
4) Corella-Benedict, A. (2018). Linguistic anxiety in learning German in elementary school and compulsory secondary school
students. Master Zaragoza, Spain: University of Zaragoza.
5) España-Reyes, D. (2020). Anxiety about learning English as a foreign language and perception of the English teacher's
attitudes in Salvadoran secondary school students. International Journal of Studies in Education (RIEE).
6) España-Reyes, D. (2019). Anxiety about learning English as a foreign language and attitude towards the English teacher
in high school students. Summary article of Master's Thesis. University of Montemorelos.
7) Garcia-Tirado, J. (2018). Anxiety in English learners at Montemorelos University and Asia-Pacific International University.
Memories Magazine. Vol. 15, No. 1, 44-51.
8) Goñi-Osácar, E. (2019). Linguistic anxiety in learning English in university teaching degrees. Strategies for achieving
emotionally safe classrooms. Case study in a Spanish university context. Doctoral Thesis. Zaragoza, Spain: University of
Zaragoza.
9) Jarie, L., Salavera, C., Teruel, M. & Salillas, M. (2017). Linguistic anxiety in learning French in Compulsory Secondary
Education students. Çédille, journal of French studies. Vol.13, 243-261.
10) Mantilla, M. & Guevara, S. (2019). The incidence of anxiety in the development of oral expression skills in the foreign
language class. Sarah magazine. No. 42. 29-42.
11) Marcela-Lopez, E. (2019). Anxiety in learning a second language. Footprints Magazine.
12) Mendoza-Navas, B. V. & Martos-Eliche, F. (2021). The use of technological tools in virtual environments for the
development of oral production in English in the Department of Languages of the National Autonomous University of
Honduras. MLS Educational Research Magazine. Vol. 5, No. 2. 105-119.
13) Merino-Crespo, C. (2019). Anxiety in learning English as a second language in two contexts: content and foreign language
integrated learning (Aicle) and formal teaching of English (EFI). Master's degree. Extremadura, Spain: University of
Extremadura.
14) Sánchez-Muñoz, G. (2021). Second Life: a virtual environment to reduce the anxiety of foreign language learners. Live
Academy. Communication Magazine. No. 154, 1-24.
15) Velázquez-Macías, L. (2018). Anxiety towards the productive skills of the English language. I will doce 07-10.
There is an Open Access article, distributed under the term of the Creative Commons Attribution – Non Commercial 4.0 International (CC BY-NC 4.0) (https://creativecommons.org/licenses/by-nc/4.0/), which permits remixing, adapting and building upon the work for non-commercial use, provided the original work is properly cited.

INTERNATIONAL JOURNAL OF MULTIDISCIPLINARY RESEARCH AND ANALYSIS
ISSN(print): 2643-9840, ISSN(online): 2643-9875
Volume 05 Issue 05 May 2022
DOI: 10.47191/ijmra/v5-i5-37, Impact Factor: 6.261
Page No. 1180-1187
IJMRA, Volume 5 Issue 05 May 2022 www.ijmra.in Page 1180
The Role of Customer-Based Brand Equity on Customer Loyalty in
Employees’ Social Security
Luki Dwi Setiyawan1, Ratna Roostika2 1, 2 Faculty of Business and Economics, Magister Management, Universitas Islam Indonesia
ABSTRACT: This study aims to analyze the role of customer-based brand equity (CBBE) in affecting customer loyalty in social
security for employees. The Social Security Implementer Agency (BPJS) for Employment at Yogyakarta Branch Office is observed
or this study. The research population is all participants of social security programs registered in Yogyakarta branch office. The
research sample was 251 respondents who are participants of the social security program from BPJS for Employment. The research
data were analyzed using the Structural Equation Model (AMOS v 23). The results of this research show that CBBE has a positive
and significant effect on customer satisfaction. In addition, CBBE has a positive but not significant effect on trust and customer
loyalty. Meanwhile, customer satisfaction has a positive and significant effect on trust. Furthermore, customer satisfaction has a
positive but not significant effect on customer loyalty. The results of this study also show that trust has a positive and significant
effect on customer loyalty.
KEYWORDS: CBBE, trust, satisfaction, customer loyalty, BPJS
INTRODUCTION
The Social Security Implementer Agency (BPJS) is a legal public entity arranged directly under the President of the Republic of
Indonesia. This agency is in charge of administering the implementation of Indonesia's Social Security. According to Law Number
40 of 2004 on the National Social Security System, five types of social security must be owned by every Indonesian resident,
including foreigners who work for a minimum of 6 (six) months in Indonesia. The five types of social security are health security,
old age security, work accident security, death security, and pension security. Through Law Number 24 of 2011 on the Social
Security Agency, two major operators of social security providers are appointed. They are BPJS for Health and BPJS for
Employment. Based on data from BPJS for Employment's financial statements in 2019 and 2020, the participant satisfaction index
decreased from 95.5% to 92.8%. Net Promoter Score (NPS) is the probability of a respondent recommending BPJS for
Employment's products to others. This reflects that the loyalty of BPJS Employment participants is still very low. In terms of
membership coverage, it can be seen that there is a slowdown growth of active participants of BPJS for Employment. Particularly,
the slowdown happens when it is compared to the projected data of BPJS for Employment participants issued by the National
Development Planning Agency.
Consumer Based Brand Equity (CBBE) is the differential effect of brand knowledge on customer responses to the brand’s marketing
(Raji, et al., 2019). The customer's perception of the features and brand of a product or service helps them recognize the
organization, known as brand equity (Kotler & Keller, 2016). A brand has a positive CBBE when customers are interested in the
brand. In addition, positive CBBE is shown when customers have a positive experience with a product and how to market it. On
the contrary, a brand has a negative CBBE when customers react less interestedly to the brand’s marketing under the same
circumstances
To find out whether the perceived quality provided is corresponding to the wishes and needs of the participants, BPJS for
Employment at Yogyakarta Branch Office needs to evaluate the quality of their existing services. By doing so, BPJS for Employment
can improve its services that suit the customer's wishes and needs. Thus, the service improvement is expected to increase
customer satisfaction and loyalty which become one of the factors to boost organizational profits in the future.
Previous research conducted by Thakur (2018) shows that customer satisfaction has a very large role. Specifically, customer
satisfaction can mediate the relationship between service quality and loyalty. Aside from this result, research conducted by
Neupane and Devkota (2017) shows that service quality has a significant effect on customer satisfaction at private hospitals in

The Role of Customer-Based Brand Equity on Customer Loyalty in Employees’ Social Security
IJMRA, Volume 5 Issue 05 May 2022 www.ijmra.in Page 1181
Nepal. Similarly, the study conducted by Yunan et al. (2017) states that service quality has a significant effect on customer loyalty.
The research conducted by Yilmaz, et al (2018) concludes that bank-inspired trust, the reliability of bank services, and the physical
appearance and accessibility of banks affect increasing customer satisfaction.
The results of Vironika and Pradana's (2020) research reveal that internal branding directly affects customer-based brand equity
without requiring organizational loyalty as a mediating variable. These results can help the retail store industry with empirical
evidence to apply internal branding in their organizations. It is done to create brand equity between stores and customers through
front-line employees.
Pratama, et al. (2019) examined the effect of equity and consumer-based brand satisfaction on loyalty. His study argues that there
are two unsupported hypotheses, namely (1) the relationship between ideal self-congruence and customer satisfaction and (2)
the relationship between brand identification and customer satisfaction. Internal branding that is successfully implemented can
improve employee compatibility with the work environment and increase employee brand knowledge (Boukis et al., 2017).
Utami's research (2015) explains that the success of Bank Mandiri's internal branding program is assessed through brand
performance, such as sales, brand recall, and brand equity, as well as indicators of satisfaction, understanding and commitment
among employees. In addition, organizations also have a role where employees accept or ignore brand messages that must be
conveyed (Boukis et al., 2017; Wang, et al., 2019). In Ebrahim's research (2020), It is stated that there is a very strong relationship
between brand loyalty in influencing brand equity. In addition, this study argues that the company must focus on brand loyalty to
increase brand equity.
THEORETICAL APPROACH AND LITERATURE REVIEW
Social Security Implementer Agency for Employment
The Social Security Implementer Agency (BPJS) for Employment is a transformation of PT. Jamsostek (Persero) or Worker’s Social
Security Program. BPJS for Employment is a government program that provides social security for every worker in Indonesia. BPJS
for Employment organizes 4 Social Security programs for employees. They include Work Accident Security, Death Security, Old
Age Security and Pension Security. In terms of BPJS for Employment membership, there are four types of participants as follows:
1. Wage Recipients (PU) are those who work by receiving salaries, wages, or other forms of remuneration from the employer.
2. Non-Wage Recipients (BPU) are people who work independently to carry out economic activities or businesses to earn
income from the results of their activities or business.
3. Construction service sector workers (JAKON) are workers in the planning, implementation, supervision, and consulting
services for construction work
4. Indonesian Migrant Worker (PMI) is every Indonesian citizen who will, is currently, or has done work by receiving wages
outside the territory of the Republic of Indonesia.
Customer-Based Brand Equity (CBBE}
Aaker (1996) defines brand equity as a set of brand assets and liabilities linked to a brand, its name and symbol, that add to or
subtract from the value provided by the product or service to a company and/or the company's customers. Perspectives on brand
equity can be viewed from a financial perspective, a consumer perspective, and an employee perspective (Baalbaki, 2012).
Consumer-based brand equity is a customer-based measure that is used to determine the relationship between brands and
customers that gives value to a company (Jeon & Yoo, 2021; Algharabat, et al., 2020; Zarantonello, et al., 2020). Aaker (1991);
Alexandra & Cerchia (2018); Mokhtar, et al., (2018); Sadek, et al., (2018) define CBBE as a commercial value that comes from
consumers' perceptions of certain brand name, products or services, not from the products or services themselves. They also note
that brand equity has five dimensions. They include brand loyalty, brand awareness, perceived quality, brand associations, and
other brands.
Customer Satisfaction
Satisfaction is an attitude shown as consumers' response to their experience and their assessment of an event (Roostika & Muafi,
2014). According to Kotler and Keller (2016); Danthanarayana & Arachchi (2020), satisfaction is defined as "a person's feelings of
pleasure or disappointment that result from comparing a product or service's perceived performance (or outcome) to
expectations” with the intention that consumers can experience one of these three general levels of satisfaction. First, if the
performance is below expectations, consumers will feel disappointed. Second, if the performance matches the expectations, the
customer will be satisfied. Third, if the performance exceeds expectations, the customer will feel very satisfied, happy or happy.
Regarding satisfaction, Rehman (2016) says that it is a “summary of psychological states that result when emotions towards
unconfirmed expectations are combined with previous feelings about the consumer's experience." This consumer satisfaction can

The Role of Customer-Based Brand Equity on Customer Loyalty in Employees’ Social Security
IJMRA, Volume 5 Issue 05 May 2022 www.ijmra.in Page 1182
be measured. Consequently, companies can see the level of satisfaction of their consumers and also develop strategies to create
consumer satisfaction. According to Kaihatu, et al. (2015), functional satisfaction is the satisfaction felt when the product matches
the expected function. Meanwhile, psychological satisfaction is felt when an attribute has no form or is intangible but can give a
feeling of satisfaction.
Customer Loyalty
Customer loyalty means customer commitment to brands, stores, and suppliers, and it is based on a very positive attitude from
customers and reflected in their positive buying behavior (Bismo, et al., 2018). Kotler and Keller (2016) define loyalty as a
customer's commitment to repurchase a particular product or service in the future, even if the circumstances and marketing
efforts of rivals have the potential to make the customer switch to another company. Loyalty is a customer behavior that will lead
to repeat purchases. This can be driven by price or a sense of belonging to a particular brand, perhaps through inferred exclusivity.
Furthermore, loyalty is a customer's commitment to deeply keep on re-subscribing or re-purchasing the selected product/service
consistently in the future, even though the influence of the situation and marketing efforts have the potential to cause behavior
change (Vidayanti, 2020). Sivapalan & Jebarajakirthy (2017) conclude that improving service quality will have a good impact on
increasing loyalty. According to Kim, et al. (2021), brand loyalty is one of the measurements of how a brand performs to
consumers.
Trust
Brand trust is the perception of reliability from the consumer's point of view based on experience, or rather on a sequence of
transactions or interactions characterized by the fulfillment of expectations for product performance and satisfaction (Rizan, 2012:
6). Trust is the expectation of each individual who will become a consumer that the company can be trusted and relied on in
providing satisfaction for consumers (Siagian & Cahyono, 2014). Trust doesn't come easily. Trust is built because of the expectation
that the other party will act according to the needs and desires of consumers. Trust is a consumer's belief in the attitude and
behavior of another party or service provider. Trust must be built from the beginning of the business establishment to the
implementation process of business activities. Trust itself functions as a catalyst in various transactions between sellers and buyers
so that consumer satisfaction can be fulfilled and as a result will have an impact on higher buying interest (Nababan, et al., 2021;
Chauhan & Hudaya, 2020). The theoretical framework is described as follows:
Figure 1. Conceptual Framework
RESEARCH METHOD
This research used a quantitative method. The population in this study were the participants of BPJS for Employment. The
technique of determining the sample of this research was purposive sampling. The samples in this study were characterized or
required to be the participants of BPJS for Employment at the Yogyakarta Branch Office who agreed to be the sample. So, the
respondents in this study were at least 38 X 5 = 190 respondents. The data collection method used a questionnaire/questionnaire.
DATA ANALYSIS METHOD
This study used SEM (Structural Equation Modeling) analysis from the AMOS statistical package. In addition, this research used a
validity test and reliability test. Validity is calculated by the product moment formula, between the item score (Xp) and the total
score (Xt). Regarding the reliability, the instrument can be declared reliable if it has a Cronbach Alpha Coefficient > 60%, or more
than 0.06.

The Role of Customer-Based Brand Equity on Customer Loyalty in Employees’ Social Security
IJMRA, Volume 5 Issue 05 May 2022 www.ijmra.in Page 1183
RESULTS AND DISCUSSION
Respondent Characteristics
The characteristics of the respondents in this study are described in terms of several criteria. They include sex, age, education,
monthly expenses, and occupation. The characteristics of the respondents are stated in Table 1.
Table 1. Respondent Characteristics
Sex Frequency %
Male 92 37%
Female 159 63%
Age
18-29 Years 51 20%
30-39 Years 104 41%
> 40 Years 96 38%
Education
Senior High/Equivalent 39 16%
Diploma/Bachelor 194 77%
Master Degree 17 7%
etc. 10 4%
Monthly Expenses
< 2 million 48 19%
2 million - 5 million 152 61%
5 million - 10 million 42 17%
> 10 million 9 4%
Occupation
Civil Servant/Army/Police 22 9%
Private Employees 204 81%
Entrepreneur 21 8%
Unemployed /Housewife 4 2%
Structural Equation Modeling Analysis
The development of the model in this research is based on the concept of data analysis. In general, this research model consists
of 1 exogenous variable and 3 endogenous variables. The exogenous variable in this study is CBBE. The endogenous variables in
this study are customer satisfaction (CS), trust (CT) and customer loyalty (CL). Furthermore, these variables will be analyzed using
the method of structural equation modeling through AMOS 24 software.
Confirmatory Analysis
Validity and Reliability Test
Confirmatory analysis was used to test the concept that is built using several measurable indicators. Based on confirmatory
analysis, validity and reliability become the first factor to look at. Validity can be known through the value of the factor loading of
each indicator. According to Hair et al. (2010), the minimum number of factor loading is 0.5 or ideally 0.7. As for the reliability test,
construct reliability is declared good if the CR (construct reliability) value > 0.7 and the VE (variance extracted) value > 0.5. The
results of the validity and reliability tests are shown in Table 2.
Table 2. Validity and Reliability Test
Variable Indicator Factor Loading CR VE
CBBE
CBBE2 0,823
0,9 0,8
CBBE1 0,658
CBBE3 0,954
CBBE4 0,967
CBBE5 0,95

The Role of Customer-Based Brand Equity on Customer Loyalty in Employees’ Social Security
IJMRA, Volume 5 Issue 05 May 2022 www.ijmra.in Page 1184
Customer Satisfaction
CS2 0,903
0,9 0,8 CS3 0,783
CS1 0,92
Customer Trust
CT2 0,914
0,9 0,8 CT1 0,889
CT3 0,904
CT4 0,913
Customer Loyalty
CL1 0,931
0,9 0,7
CL2 0,933
CL3 0,778
CL4 0,888
CL5 0,634
Table 2 shows that all indicators have a factor loading value of > 0.5. This value means that all indicators are valid. Likewise, the
CR value of each variable is > 0.7 and the VE value is > 0.5. Thus, all variables are reliable.
Goodness of Fit
Furthermore, the conformity test of the confirmatory model was tested using the Goodness of Fit Index (GOFI). In this study,
several criteria were taken from each type of GOFI. They include Chisquare, probability, RMSEA and GFI which represent absolute
fit indices. In addition, they include CFI and TLI which represent incremental fit indices. Lastly, these criteria also include PGFI and
PNFI which represent parsimony fit indices.
To increase the GOF value, it is necessary to modify the model that refers to the modification index table. Modifying the model
can be done by providing a covariance relationship or eliminating indicators that have a high MI (Modification Index) value. In the
model modification process, some indicators must be removed because they have a high MI (Modification Index) value. These
indicators are CBBE1, CBBE2, CT1 and CL3. The results of the confirmatory analysis can be seen in Table 3.
Table 3. Results of the Goodness of Fit Test
Fit Index Goodness of Fit Criteria Cut-off Value Information
Absolute Fit
Chi-square low 74,69 Fit
Probability ≥ 0.05 0,05 Fit
CMINDF ≤ 2,00 1,33 Fit
GFI ≥ 0.90 0,96 Fit
Incremental Fit CFI ≥ 0.90 1,00 Fit
TLI ≥ 0.90 0,99 Fit
Parsimony Fit PGFI ≥ 0.60 0,59 Marginal Fit
PNFI ≥ 0.60 0,70 Fit
Table 3 shows that the Goodness of Fit value has met all the criteria so that the model in this study can be declared Fit.
Hypothesis Testing
The next analysis is the full model Structural Equation Model (SEM) analysis. It is used to test the hypotheses developed in this
study. The results of the regression weight test in this study are shown in Figure 2 and Table 4.

The Role of Customer-Based Brand Equity on Customer Loyalty in Employees’ Social Security
IJMRA, Volume 5 Issue 05 May 2022 www.ijmra.in Page 1185
Figure 2. Flowchart
The results of hypothesis testing can be done by looking at the Critical Ratio (CR) value and the probability (P) value from the
results of data processing. The direction of the relationship between variables can be seen from the estimate value. If the estimate
value is positive, the relationship between the variables is positive. Meanwhile, if the estimate value is negative, the relationship
is negative. Furthermore, if the test results show the CR value above 1.96 and the probability value (P) below 0.05/5%, the
relationship between exogenous and endogenous variables is significant. The results of hypothesis testing are detailed in table 4.
Table 4. Results of Regression Weight Test
Estimate S.E. C.R. P Information
CS <--- CBBE ,820 ,037 22,266 ,000 Positive Significant
CT <--- CBBE ,050 ,134 ,373 ,709 Positive not Significant
CL <--- CBBE ,101 ,117 ,865 ,387 Positive not Significant
CT <--- CS ,904 ,161 5,616 ,000 Positive Significant
CL <--- CS ,236 ,176 1,340 ,180 Positive not Significant
CL <--- CT ,640 ,092 6,940 ,000 Positive Significant
There are 6 hypotheses in this study. Among the 6 hypotheses, 3 hypotheses are supported and 3 hypotheses are not supported.
The results of the analysis show that CBBE has a positive and significant effect on CS. These results indicate that H1 is supported.
Furthermore, it is found that CBBE has a positive but not significant effect on CT and CL so H2 and H3 were not supported. The
results of the analysis also found that there is a positive and significant effect of CS on CT so H4 is supported. Furthermore, it was
found that CS had a positive but not significant effect on CL so H5 is not supported. In addition, the effect of CT on CL is shown to
be positive and significant so H6 is supported.
DISCUSSION
CBBE has a positive and significant effect on customer satisfaction. The results of the research are supported by a study conducted
by Prasetyo & Rachmawati (2018) regarding customer-based brand equity on customer satisfaction. Meanwhile, CBBE has a
positive but not significant effect on trust. CBBE is the differential effect that brand knowledge has on customer responses to the
marketing of the brand (Goyena, 2019). The customer's perception of the features and brand of a product or service helps
customers recognize the organization, known as brand equity (Kotler and Keller, 2016).
CBBE has no significant positive effect on Customer Loyalty. Customer-based brand equity is one of the most dominant
conceptualizations in brand equity. It is known as the value that consumers get as the total number of values associated with the
brand in the minds of customers. These values include awareness, loyalty and recognition of the brand (Arora & Neha, 2016; Bauer
et al. al., 2005). Customer satisfaction has a positive and significant effect on trust. This is in line with the statement of Giovanis &

The Role of Customer-Based Brand Equity on Customer Loyalty in Employees’ Social Security
IJMRA, Volume 5 Issue 05 May 2022 www.ijmra.in Page 1186
Athanasopoulou (2017). They state when customers are satisfied with the use of a brand, the brand is considered to have fulfilled
its promise. Thus, it creates trust in the brand.
Customer satisfaction has a positive but not significant effect on customer loyalty. The higher the satisfaction felt by consumers,
the consumers will be more loyal to the brand. It is because they are able to get satisfaction. Consumers expect satisfaction when
they decide to buy a brand. Furthermore, a positive and significant effect on customer loyalty is determined by trust. A complete
understanding of brand loyalty cannot be obtained without an explanation of trust in a brand and how it relates to brand loyalty.
CONCLUSIONS
This study is conducted to determine whether the perceived quality provided by BPJS for Employment is corresponding with the
wishes and needs of its participants. To increase the service quality, BPJS for Employment at the Yogyakarta Branch office needs
to evaluate the quality of existing services. Based on the results of the research and data analysis, it can be concluded that CBBE
has a positive and significant effect on customer satisfaction. This result is shown by a positive estimate value of 0.820, a t-statistic
value above 1.96, which is 22.266 and a P-Value value below 0.05, which is 0.000. Thus, in this study, H1 is supported. Meanwhile,
this study concludes that CBBE has no significant positive effect on customer trust. This result is proved by a positive estimate
value of 0.50, a t-statistic value below 1.96, namely 0.373 and a P-Value value above 0.05, which is 0.709. So, H2 in this study is
not supported. CBBE has no significant positive effect on customer loyalty. This result is shown by a positive estimate value of
0.101, a t-statistic value below 1.96, namely 0.865 and a P-Value value above 0.05, which is 0.387. Thus, in this study, H3 is not
supported. Customer satisfaction has a positive and significant effect on trust. This result is proved by a positive estimate value of
0.904, a t-statistic value above 1.96, namely 5.616 and a P-Value value below 0.05, which is 0.000. So, H4 in this study is supported.
Customer satisfaction has a positive but not significant effect on customer loyalty. This result is shown by a positive estimate value
of 0.236, a t-statistic value below 1.96, namely 1.340 and a P-Value value above 0.05, namely 0.180. Thus, H5 in this study is not
supported. Furthermore, trust has a positive and significant effect on customer loyalty. This result is demonstrated by a positive
estimate value of 0.640, a t-statistic value above 1.96, namely 6.940 and a P-Value value below 0.05, which is 0.000. So, in this
study, H5 is supported.
REFERENCES
1) Aaker, D. A. (1991). Managing brand equity, capitalizing on the value of a brand name. New York: The Free Press.
2) Baalbaki, S., & Francisco, G. (2016). Consumer-based brand equity.
https://www.researchgate.net/publication/309478932_Consumer-based_brand_equity
3) Bismo, A., Sarjono, H., & Ferian, A. (2018). The effect of service quality and customer satisfaction on customer loyalty: A
study of grabcar services in Jakarta. Pertanika Journal of Social Sciences & Humanities, 26, 33-47.
4) Boukis, A., Gounaris, S. and Lings, I. (2017), "Internal market orientation determinants of employee brand enactment",
Journal of Services Marketing, Vol. 31 No. 7, pp. 690-703. https://doi.org/10.1108/JSM-07-2016-0272.
5) Chauhan, R., & Hudaya, A. (2020). Consumer trust model on travel agent online: analysis of perceived usefulness and
security on re-purchase interests (Case Study: TIKET. COM). Dinasti International Journal of Education Management And
Social Science, 1(4), 602-616. https://doi.org/10.31933/dijemss.v1i4.293
6) Danthanarayana, C. P., & Arachchi, R. S. S. W. (2020). Role of restaurant attributes and customer perceived value in shaping
customer satisfaction: a sem based analysis in beach restaurants in South Coast, Sri Lanka. Journal of Management and
Tourism Research (JMTR), 45.
7) Ebrahim, R. S. (2020). The role of trust in understanding the impact of social media marketing on brand equity and brand
loyalty. Journal of Relationship Marketing, 19(4), 287-308. DOI:10.1080/15332667.2019.1705742.
8) Giovanis, A., & Athanasopoulou, P. (2017). Gen Y-ers' Brand Loyalty Drivers In Emerging Devices. Marketing Intelligence &
Planning, 805-821.
9) Jeon, H. M., & Yoo, S. R. (2021). The relationship between brand experience and consumer-based brand equity in
grocerants. Service Business, 15(2), 369-389.
10) Kaihatu, T. S., Daengs, A., & Indrianto, A. T. (2015). Manajemen komplain. Yogyakarta: Penerbit Andi.
11) Kim, E. H., Yoo, D., & Doh, S. J. (2021). Self-construal on brand fan pages: the mediating effect of para-social interaction
and consumer engagement on brand loyalty. Journal of Brand Management, 28(3), 254-271. DOI:10.1057/s41262-020-
00211-9.
12) Kotler, P., & Keller, K. L. (2016). Marketing management, 15th edition. Pearson Education, Inc.

The Role of Customer-Based Brand Equity on Customer Loyalty in Employees’ Social Security
IJMRA, Volume 5 Issue 05 May 2022 www.ijmra.in Page 1187
13) Mokhtar, R., Othman, Z., Arsat, A., & Ariffin, H. F. (2018). Dimensions of brand equity in the food truck business.
International Journal of Academic Research in Business & Social Sciences, 8(17), 167-182. DOI: 10.6007/IJARBSS/v8-
i17/5223.
14) Nababan, T. S., Panjaitan, F., Panjaitan, R., Silaban, P., & Silaban, P. H. (2021). Analysis of consumer consideration factors
on moderated purchase decisions in online shopping by consumer trust (Study on Students of Master of Management
Study Program, Postgraduate at HKBP Nommensen University, Medan). Strategic: Journal of Management Sciences, 1(2),
80-93.
15) Neupane, R., & Devkota, M. (2017). Evaluation of the impacts of service quality dimensions on patient/customer
satisfaction: A study of private hospitals in Nepal. International Journal of Social Sciences and Management, 4(3), 165-176.
DOI:10.3126/ijssm.v4i3.17520.
16) Prasetyo, B. P., & Rachmawati, I. (2018). Pengaruh customer based brand equity terhadap kepuasan pelanggan pada
Smartphone Samsung Di Indonesia. eProceedings of Management, 5(1).
17) Pratama, M. A., Siregar, R. P. S., & Sihombing, S. O. (2019). The effect of consumer-based brand equity and satisfaction on
loyalty: an empirical study. Jurnal Economia, 15(2), 275-291. DOI:10.21831/economia.v15i2.27314.
18) Raji, R. A., Mohd Rashid, S., & Mohd Ishak, S. (2019). Consumer-based brand equity (CBBE) and the role of social media
communications: qualitative findings from the Malaysian automotive industry. Journal of Marketing Communications,
25(5), 511-534. DOI:10.1080/13527266.2018.1455066.
19) Roostika, R., and Muafi, 2014 The Role of Source Credibility and Place Attachment in Enhancing Visitors’ Satisfaction, Jurnal
ManajemenTeknologi, Vol 13 no 3, pp. 239-252. DOI:10.12695/jmt.2014.13.3.1.
20) Sadek, H., Elwy, S., & Eldallal, M. (2018). The impact of social media brand communication on consumer-based brand
equity dimensions through Facebook in fast moving consumer goods: The case of Egypt. Journal of Business and Retail
Management Research, 12(2). DOI:10.24052/JBRMR/V12IS02/TIOSMBCOCBBEDTFIFMCGTCOE.
21) Sivapalan, A., & Jebarajakirthy, C, (2017). An application of retailing service quality practices influencing customer loyalty
toward retailers. Marketing Intelligence & Planning, 35(7), 842-857.
22) Thakur, R. (2018). The role of self-efficacy and customer satisfaction in driving loyalty to the mobile shopping application.
International Journal of Retail & Distribution Management, 46(3). https://doi.org/10.1108/IJRDM-11-2016-0214
23) Vironika, V., & Pradana, M. R. (2020). Pengaruh internal branding pada customer based brand equity dengan mediasi
loyalitas organisasi. Jurnal Akuntansi, Ekonomi Dan Manajemen Bisnis, 8(1), 29-38. DOI:
https://doi.org/10.30871/jaemb.v8i1.1803
24) Wang, Y. C., Yang, J., & Yang, C. E. (2019). Hotel internal branding: A participatory action study with a case hotel. Journal
of Hospitality and Tourism Management, 40, 31-39. https://doi.org/10.1016/j.jhtm.2019.05.002
25) Yunan, Y. S. B. M., Well, C. A. C., Osman, L. H., Yazid, Z., & Ariffin, A. A. M. (2017). Post service quality as predictor for Halal
warehouse adopter satisfaction. International Journal of Academic Research in Business and Social Sciences, 7(4), 2222-
6990. DOI:10.6007/IJARBSS/v7-i4/2909.
26) Zarantonello, L., Grappi, S., Formisano, M., & Brakus, J. (2020). How consumer-based brand equity relates to market share
of global and local brands in developed and emerging countries. International Marketing Review. DOI 10.1108/IMR-05-
2018-0176
There is an Open Access article, distributed under the term of the Creative Commons Attribution – Non Commercial 4.0 International (CC BY-NC 4.0) (https://creativecommons.org/licenses/by-nc/4.0/), which permits remixing, adapting and building upon the work for non-commercial use, provided the original work is properly cited.

W W W . I J M R A . I N / I N D E X . P H P E M A I L : E D I T O R @ I J M R A . I N
WHY PUBLISH WITH IJMRA ?
1) WE PROVIDE FULL OPEN ACCESS.
2) DOI OF EACH PUBLISHED ARTICLE.
3) THE ARTICLE WILL BE UPLOADED AFTER PUBLICATION IN THE FOLLOWING
INDEXING SERVICES: GOOGLE SCHOLAR, INDEX COPERNICUS, DRJ I , CITE
FACTOR, IS I , EURO PUB, ACADEMIA, ZENODO, SCRIBD ETC. (MANY MORE)
4) FAST RESPONSE, PEER REVIEW, AND FAST PUBLICATION.
5) GLOBAL INTERNATIONAL KNOWLEDGE SHARING.
6) A DIGITALLY SIGNED E-CERTIF ICATE WILL BE PROVIDED TO THE AUTHOR FOR A
PUBLISHED ARTICLE.
7) YEARLY SUBSCRIPTION.
8) YOU CAN ALSO DOWNLOAD FULL MONTH ISSUE.
ISSN[ONLINE] : 2643-9875 ISSN[PRINT] : 2643-9840