) impact of business cycles on industry sectors: structural economic change in kenya,
TRANSCRIPT
International Journal of Research in Management ISSN 2249-5908
Available online on http://www.rspublication.com/ijrm/ijrm_index.htm Issue 3, Vol.5 (September2013)
R S. Publication, [email protected] Page 116
Impact Of Business Cycles On Industry Sectors: A Structural
Economic Change In Kenya
Tom Nyamache¹, Ruth Nyambura², & P. Y. Mishra³
1. Associate Professor, School of Business and Public Managemt, Mount Kenya
,University, Cell + 254723282500
2. Research Scholar, Egerton University, Cell: 0715133505
3. Assistant professor, Devi Ahilya University Indore (MP) India, Cell: +919827225858
__________________________________________________________________________
Abstract
Industry groups, investment managers and professional investors notwithstanding: are
conscious of differences among alternative industries and organize their analysis and
portfolio decisions according to industry groups. Industry analysis is progress towards
selecting specific firms and stocks for an investment portfolio. A macro analysis and
utilization of a stock market decides whether the expected rate of return from investing in
common stocks is equal to or greater than required rate of return. Hence, industrial groups
should decide whether to overweigh market weigh or underweight stocks. Analysis to
determine if the intrinsic value of an industry is equal to or greater than its market price is
determined. Based on this relationship, it is decided to weight the industry in a stock
portfolio. Discussions on results of several studies indicate the benefits and use of industry
analysis. Approaches of valuing industries are used. Impact of competitive environment
within industry, on potential industry return is considered. Conclusively, a discussion of
global industry analysis is given, because many industries transcend Kenyan borders and
compete worldwide. The findings are consistent with the trend of industry sectors in Kenya.
Keywords:
Industry, Analysis, Performance, Business Cycle, Rates, Returns
___________________________________________________________________________
1.0 INTRODUCTION
Business cycles are in place often in industrialized democracies. These cycles are as well
alive and well in the developing world, more so in the most vulnerable ones (Nouriel, 1997).
Business cycles in Africa and Kenya in particular are undergoing political and economic
reforms. This is evident from fiscal and monetary policy reforms. Efforts to restore industrial
sectors concentrate mainly on macro-economic reforms geared towards taming inflation,
reduction of unsustainable budget and liberalizing foreign exchange reforms and capital
markets (Block, 1999).
International Journal of Research in Management ISSN 2249-5908
Available online on http://www.rspublication.com/ijrm/ijrm_index.htm Issue 3, Vol.5 (September2013)
R S. Publication, [email protected] Page 117
2.0 FOCUS OF THE STUDY
2.1 Business Cycles and their impact on Industry Sectors
Economic trends can affect industry performance. By identifying and monitoring key
assumptions. An economy is monitored and gauged through economic outlook and industry
analysis. Economic trends take two basic forms. One, cyclical changes that arise from the ups
and downs of the business operations and two, structural changes that occur when the
economy is undergoing a major change in how it functions. When excess labor and capital
exist in some sectors; shortages of labor and capital exist elsewhere. When countries go
through transitions for example from socialist to market economies, and from a
manufacturing to a service economy; all these show dramatic structural changes. Industry
analysis must examine structural economic changes for the implications they hold for the
industry. Industry performance is related to the stage of the business cycle. Industry analysis
is challenging in that every business cycle is different and that determine future market
performance trends (Reilly & Brown 2007).
Rotation strategy takes place when switching from one industry group to another over the
course of a business cycle. Investors need to identify variables related to economic trends and
industry characteristics. During recession, financial stocks rise in value. Investors anticipate
that banks‟ earnings will rise as both the economy and loan demand recover. Stock
brokerages become attractive investments because their sales and earnings are expected to
rise: one, investor‟s trade securities, two, and businesses sell debt and equity, three; there is
an increase in mergers during the economic recovery. Industry selections assume that when
the recession ends there will be an increase in loan demand, housing construction, and
security offerings.
During recovery, consumables from firms which produce expensive consumer items become
attractive investments because a reviving economy will increase consumer confidence and
personal income. Businesses begin modernizing, renovating, and purchasing new equipment
to satisfy rising demand hence reducing costs. Capital goods industries become attractive.
Cyclical industries whose sales rise and fall along with general economic activity are
attractive investments during the early stages of an economic recovery which is attributed to
high degree of operating leverage. There is benefit from sales increases during an economic
expansion. Industries with high financial leverages likewise benefit from rising sales volume.
When the economy is at the peak, the rate of inflation increases as demands starts to outstrip
supply. Basic materials industries which transform raw materials into finished products
become investor favourites. However inflation has little influence on the cost of extracting
these products and they can increase prices. These industries experience in the long run
higher profit margins. Further during recession, some industries do better than others. For
example consumer, pharmaceuticals, food, and beverages, outperform other sectors during
this period. If a weak domestic economy causes a weak currency, industries with large export
components to growing economies may benefit because their goods become more cost
competitive internationally. Certain industries make attractive investments over the course of
the business cycle. Investors are advised not invest based upon the current economic
environment which is situational because the efficient market has already incorporated
current economic news into security prices. Rise investment is called for.
Higher inflation is negative for the stock market. It causes higher market interest rates. It
increases uncertainty about future prices and costs. It impedes firms that cannot pass through
International Journal of Research in Management ISSN 2249-5908
Available online on http://www.rspublication.com/ijrm/ijrm_index.htm Issue 3, Vol.5 (September2013)
R S. Publication, [email protected] Page 118
their costs increases. Some industries benefit from inflation. For example natural resource
industries benefit if their production costs do not rise with inflation. Their output will likely
sell at higher prices. Financial institutions, including commercial banks, are affected by
higher rates because they find it difficult to pass on these higher rates to customers. High
interest rates tamper with the housing and the construction industries. Further high interest
rates benefit retirees whose income is dependent on interest income.
Both domestic and overseas events may cause the value of the Kenyan Shilling to fluctuate.
A weaker Kenyan shilling helps Kenyan industries because their exports become
comparatively cheaper in overseas markets while the goods of foreign competitors become
more expensive in Kenya. A stronger Kenyan Shilling has an opposite effect. Economic
growth in world regions or specific countries benefits industries that have a large presence in
those areas. The creation of free trade zones, such as the East African Common Market
Protocol and the ECOWAS, assist industries that produce goods and services that previously
faced quotas or tariffs in partner countries. Consumption spending has a large impact on the
economy. Optimistic consumers are more willing to spend and borrow money for expensive
goods, such as houses, cars, new clothes and furniture. Therefore, the performance of
consumer cyclical industries will be affected by changes in consumer sentiment and by
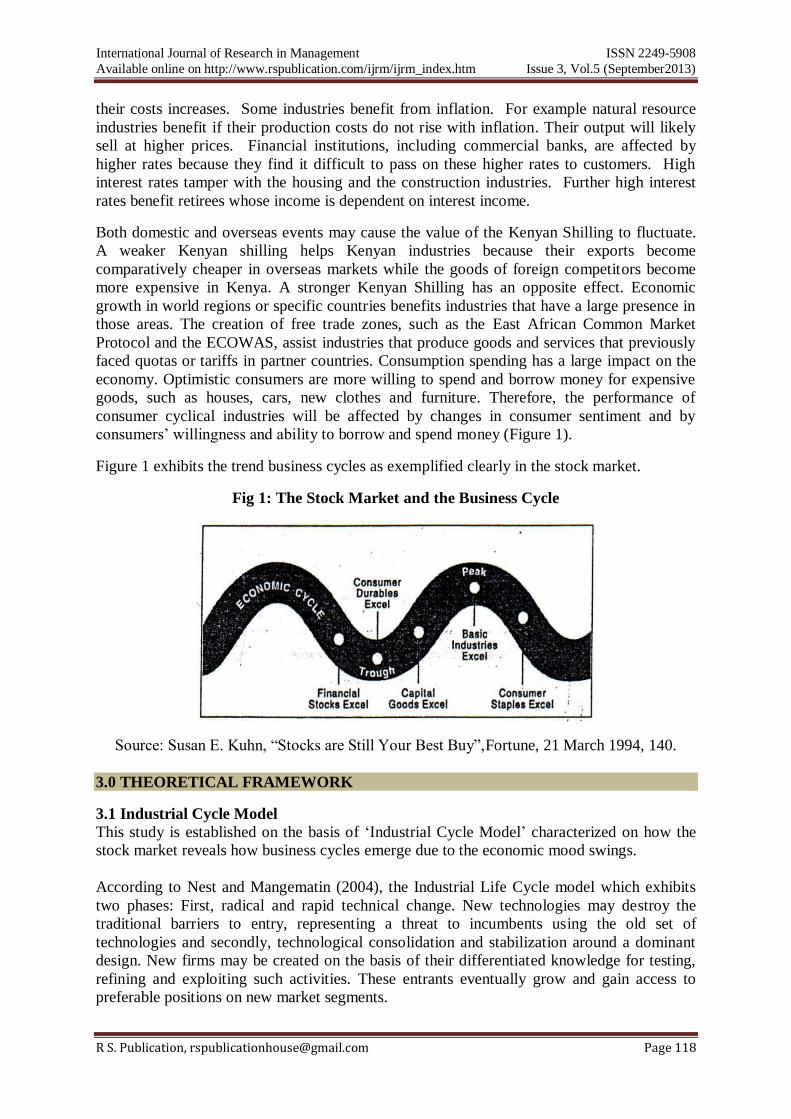
consumers‟ willingness and ability to borrow and spend money (Figure 1).
Figure 1 exhibits the trend business cycles as exemplified clearly in the stock market.
Fig 1: The Stock Market and the Business Cycle
Source: Susan E. Kuhn, “Stocks are Still Your Best Buy”,Fortune, 21 March 1994, 140.
3.0 THEORETICAL FRAMEWORK
3.1 Industrial Cycle Model
This study is established on the basis of „Industrial Cycle Model‟ characterized on how the
stock market reveals how business cycles emerge due to the economic mood swings.
According to Nest and Mangematin (2004), the Industrial Life Cycle model which exhibits
two phases: First, radical and rapid technical change. New technologies may destroy the
traditional barriers to entry, representing a threat to incumbents using the old set of
technologies and secondly, technological consolidation and stabilization around a dominant
design. New firms may be created on the basis of their differentiated knowledge for testing,
refining and exploiting such activities. These entrants eventually grow and gain access to
preferable positions on new market segments.
International Journal of Research in Management ISSN 2249-5908
Available online on http://www.rspublication.com/ijrm/ijrm_index.htm Issue 3, Vol.5 (September2013)
R S. Publication, [email protected] Page 119
New technologies pass through distinct stages of birth, growth, maturity and decline. One
introduced in the market, the new product accompanied by entry of new firms seeking to
exploit the market niche, followed by growth in demand. This growth trajectory is
characterized by turbulence, as declines in demand are succeeded by the leveling off in
demand as the market becomes saturated. Market entry is easy when the new technology is
introduced. At this stage it is faster, cheaper, more powerful technology is experienced. As
firms move towards maturity, they experience relatively stable growth and it is much easier
to survive since the available economies of scale have been exhausted and competition has
fallen. Marketing concerns dominate technology concerns. However, at maturity stage, where
technology is a commodity, user experience and marketing dominate. Younger firms have a
higher probability of failure than older ones. Further, younger firms may have higher growth
rates than older firms (Hallberg, 1999).
(Aduda and Kaane, 1999) opine that, this model is clearly applicable to Kenya. From a policy
perspective, the life cycle theory points to the need for systematic planning for the
replacement of technology as it evolves through birth, nurturing, consumption and
obsolescence. Similarly, it therefore can be used to explain why some local firms have
transited from small local firms into medium and large growth-oriented concerns. However,
the theory may be limited in explaining why the majority of subsistence/survivalist
enterprises have stagnated and failed to grow.
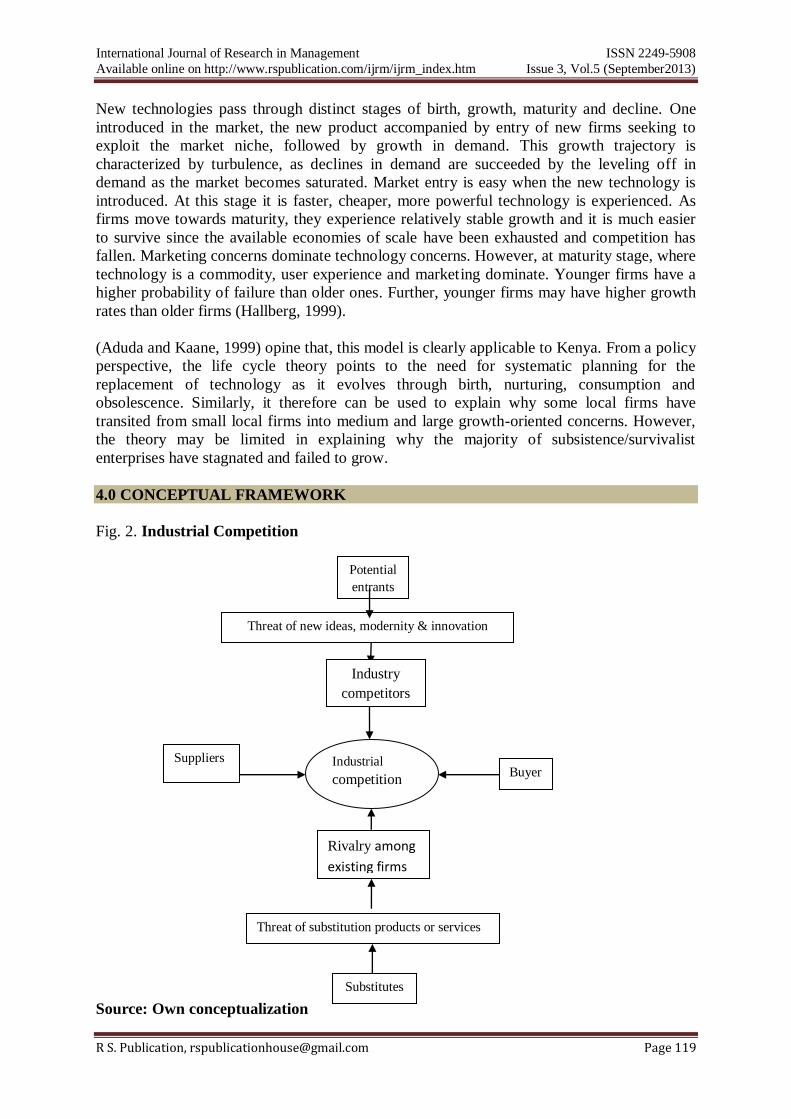
4.0 CONCEPTUAL FRAMEWORK
Fig. 2. Industrial Competition
Source: Own conceptualization
Potential
entrants
Suppliers
Buyer
s
Substitutes
Industrial
competition
Industry
competitors
Rivalry among
existing firms
Threat of new ideas, modernity & innovation
Threat of substitution products or services
International Journal of Research in Management ISSN 2249-5908
Available online on http://www.rspublication.com/ijrm/ijrm_index.htm Issue 3, Vol.5 (September2013)
R S. Publication, [email protected] Page 120
The above conceptual framework guides investors to analyse competitive forces among
industries in order for them to understand their returns. Each of these factors guide investors
determine a competitive environment .For industry structures change with time. Each factor
determines profit potential in a given industry.
5.0 RESEARCH METHODOLOGY
This research focuses on the impact of business cycles on industry sectors a structural
economic change in Kenya. This study covers Kenya‟s sectors in various industries. Kenya
has a special place in East, Central and Africa at large. The study adopts descriptive research
design which is suitable for document analysis.
6.0 DISCUSSIONS AND RESULTS
6.1 Structural Economic Changes and Alternative Industries
Influences other than the economy are part of the environment. Demographics, changes in
technology, and political and regulatory environments also can have a significant effect on
the cash flow and risk prospects of different industries.
6.1.1 Demographics
The study of demographics includes much more than population growths and age
distributions. Demographics also include the geographical distribution of people, the
changing ethnic mix in a society, and changes in income distribution. Demographic trends
attempt to project their effect on different industries and firms. The changing age profile of
people has implications for resource availability, a possible shortage of entry-level workers
leading to an increase in labor costs and difficulty in finding qualified persons to replace the
retiring ones. The aging population also affects saving patterns in the economy, as people in
the 40 to 60 age bracket usually save more than young people. This is good for the financial
services industry, which offers assistance to those who want to invest their savings.
Alternatively, fewer younger workers and more „saving seniors‟ may have a negative impact
on some industries such as the retailing industry. (Reilly & Brown, 2007)
The changing population and labor force have important impacts both on private investment
through changes in the expected marginal product of capital as well as on consumption and
saving decisions. The increase in the labor force in developing countries raises the marginal
product of capital and stimulates higher investment, with the investment to GDP ratio 4
percent higher by 2025 .(Bating et. Al, 2006)
6.1.2 Consumer Behaviours
Consumer behaviours are about Lifestyles on how people live, work, and form households,
consume, enjoy leisure and educate them. Consumer behaviour is affected by trends and fads.
The rise and fall of styles in clothes illustrate the sensitivity of some markets to changes in
consumer tastes. The increase in divorce rates, dual-career families, population shifts away
from cities, and computer-based education and entertainment have influenced numerous
industries, including housing, restaurants, automobiles, convenience and catalogue shopping,
services, and home entertainment. There is a perception in style that foreign goods have
higher quality than those produced locally. Sales in several industries have benefited from
this exercise of consumer choice overseas.
International Journal of Research in Management ISSN 2249-5908
Available online on http://www.rspublication.com/ijrm/ijrm_index.htm Issue 3, Vol.5 (September2013)
R S. Publication, [email protected] Page 121
According to Sessional paper,(2012) Kenya‟s high level of informality in Kenya‟s wholesale
and retail sectors which has the potential to result in several kinds of market distortions, that
tilt the economy from its gowth especially in taxation, labour employment and produce
marketing. This Informality leads to lower tax revenues to Government from a sector that
uses public services and facilities. Albeit the informal sector is the source of livelihood for
many people who cannot access the formal employment market, the sector, when
unregulated, it comes with other social and environmental costs, such as environmental
degradation, non-enforcement of health standards and infringement of copyright laws (e.g. in
music and film industries). All these costs are bound to have a negative impact on Kenya‟s
local and international competitiveness, which is a major goal of Vision 2030.
6.1.3 Information and Communications Technology
Trends in technology can affect numerous industry factors including the product or service
and how it is produced and delivered. There are literally dozens of examples of changes that
have taken or are taking place due to technological innovations. Changes in technology have
spurred capital spending in technological equipment as a way for firms to gain competitive
advantages. The future effect of the internet is phenomenal. The retailing industry is a user of
new technology. Some forecasters envision relationship merchandising, in which customer
databases will allow closer links between retail stores and customer needs. Rather than doing
market research to focus on aggregate consumer trends, specialized retailers can offer
products that particular consumer segments desire in preferred locations.
Reilly and Brown (2007), continue to argue that technology may allow retailers to become
more organizationally decentralized and geographically diversified. Major retailers use bar-
code scanning, which speeds the checkout process and allow the firm to track inventory and
consumer preferences. Use of customer credit cards allow firms to track customer purchases
and send customized sales announcements. Electronic funds transfer allows retailers to move
funds quickly and easily between local banks and headquarters.
6.1.4 Politics and Regulations
Because political change reflects social values, today‟s social trend may be tomorrow‟s law
regulation, or tax. The industry analyst needs to project and assess political changes relevant
to the industry under study. Some regulation and laws are based on economic reasoning. Due
utilities‟ position as natural monopolies, their rates must be reviewed and approved by a
regulatory body. Some regulation involves social ends. Regulatory changes have affected
numerous industries. Changing regulations and technology bring participants in the financial
service industry –banking, insurance, investment banking and investment services-together.
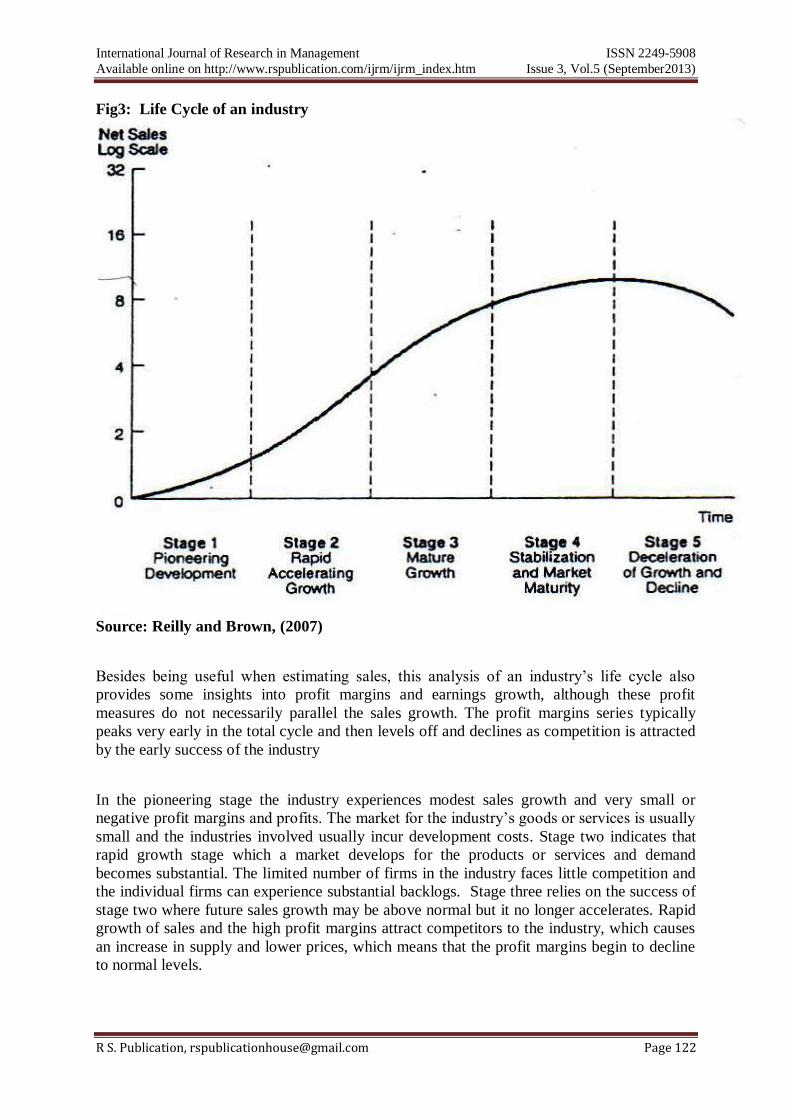
6.2 Industrial Life Cycle Analysis
When predicting industry sales in profitability is to view the industry over time and divide its
development into stages similar to those that human progress through birth adolescence,
adulthood middle age, and old age. A five-stage model would include: Pioneering
development, Rapid accelerating growth, mature growth, Stabilization and market maturity
and Deceleration of growth and decline. (Figure 3)
International Journal of Research in Management ISSN 2249-5908
Available online on http://www.rspublication.com/ijrm/ijrm_index.htm Issue 3, Vol.5 (September2013)
R S. Publication, [email protected] Page 122
Fig3: Life Cycle of an industry
Source: Reilly and Brown, (2007)
Besides being useful when estimating sales, this analysis of an industry‟s life cycle also
provides some insights into profit margins and earnings growth, although these profit
measures do not necessarily parallel the sales growth. The profit margins series typically
peaks very early in the total cycle and then levels off and declines as competition is attracted
by the early success of the industry
In the pioneering stage the industry experiences modest sales growth and very small or
negative profit margins and profits. The market for the industry‟s goods or services is usually
small and the industries involved usually incur development costs. Stage two indicates that
rapid growth stage which a market develops for the products or services and demand
becomes substantial. The limited number of firms in the industry faces little competition and
the individual firms can experience substantial backlogs. Stage three relies on the success of
stage two where future sales growth may be above normal but it no longer accelerates. Rapid
growth of sales and the high profit margins attract competitors to the industry, which causes
an increase in supply and lower prices, which means that the profit margins begin to decline
to normal levels.
International Journal of Research in Management ISSN 2249-5908
Available online on http://www.rspublication.com/ijrm/ijrm_index.htm Issue 3, Vol.5 (September2013)
R S. Publication, [email protected] Page 123
Stage four is the longest phase. The industry growth rate declines to the growth rate of the
aggregate economy. Investors can estimate growth easily because sales correlate with an
economic series. Profit growth varies by industry because the competitive structure varies by
industry and by individual firms within the industry because the ability to control costs differs
among companies. Finally at stage five, the industry‟s sales growth declines because of shifts
in demand or growth of substitutes. Profit margins continue to be squeezed. Some firms
experience low profits or even losses. Firms that remain profitable may show very low rates
of return on capital. In the end, investors begin thinking about alternative uses for the capital
tied up in this industry. Conclusively life cycle stages of an industry depict a comparison
between sales and earnings growth of an industry which is in tandem with the growth in an
economy.
6.3 Macro-Economic Evolution Trends vis-a-vis Structural Sector Changes in Kenya
since Independence
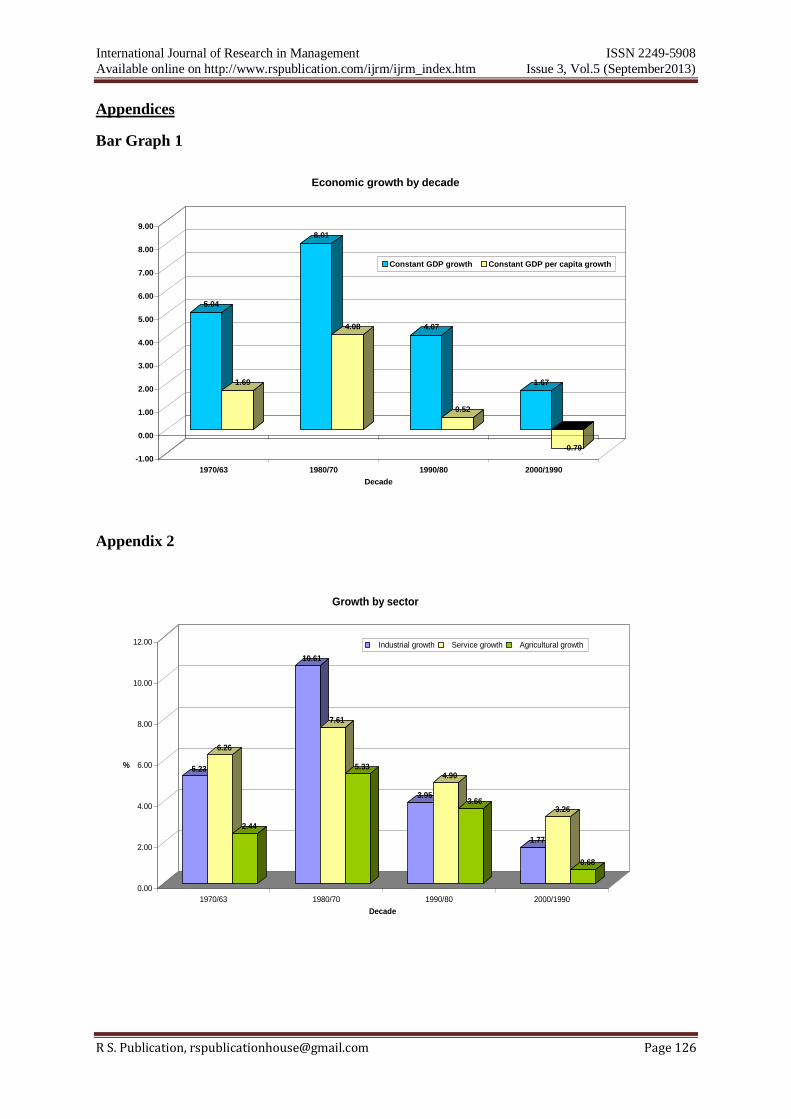
The first two decades after independence saw a very strong economic growth. The same
economy degenerated afterwards. The economy grew at an average of 5 percent between
1963 and 1970 but accelerated further to 8 percent by 1980 better than it were in 1963. This
transition had an impact on the economy cutting across all sectors. Really growth experienced
in the 1970s was a culmination of good market conditions conducive for farmers especially
rural farmers. Between 1974 to1982, rural economy grew by 5%. (Swammy, 1974). Industry
mutually benefited from good strategy by government based on import substitution which
enabled and encouraged exports rather than imports. This was a foundation for rent seeking
industrial sector.
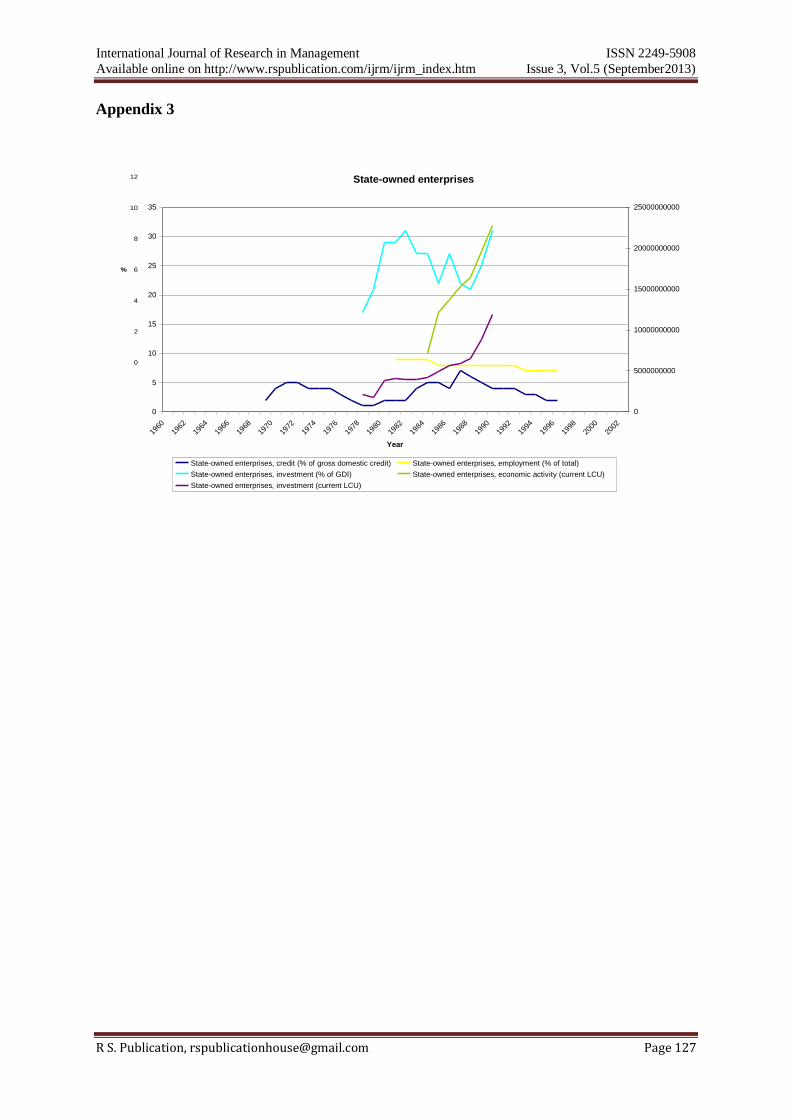
Structural changes in the economy were set off by rapid expansion of state owned enterprises
which involved many factoring, financial services, processing and marketing of agricultural
products. Low productivity experienced in the economy increased efficiencies and decreased
the economy‟s capacity to adjust to changing external conditions. This was also an indication
of poor and weak policy response. (Appendix 1)
With increasing trade deterioration in the 70s, balance of payments crisis was experienced in
1974-80. External balance followed suit, fell in the second oil shock which finally led to the
devaluation of the Kenyan shilling. The 1990s and early 2000 experienced poor economic
performance epitomized with high real interest rate, high transactional costs and high
business uncertainty which resulted in low employment. Weak macro-economic
management, slow progress in structural reforms, failure of governance, 1984,1997 – 2000
droughts, the 1998 elnino floods and the rising HIV/AIDS prevalence. These factors
contributed to the loss of livestock, crops and income, threatened family structure and
viability of social services. Even though there has been an introduction of market oriented
policies epitomized with financial, trade, and agricultural market liberalization, divestment of
state owned enterprises notwithstanding, they are yet to break the pattern of growth decline.
6.3.1 Public Sector Reforms
Public sector enterprises should have been a panacea to the ills that afflicted the economy.
By the 1980s, the government held interests in about 250 commercial enterprises and held
majority interest in at least half of them. They represented about a tenth of GDP but
contributed nothing to economic growth causing negative productivity.
International Journal of Research in Management ISSN 2249-5908
Available online on http://www.rspublication.com/ijrm/ijrm_index.htm Issue 3, Vol.5 (September2013)
R S. Publication, [email protected] Page 124
In 1991, the government announced its intention to rationalize the parastatal sector. At that
time the government held stake in 240 commercially oriented enterprises. Of these 33 were
deemed strategic and five of them earmarked for restructuring. The government would divest
from the remaining 207 enterprises. The medium term target was modest, with only 10 firms
set for privatization and only 5 actually privatized by 1995. But privatization continued
through the 1990s with a total of 165 enterprises being sold or liquidated. The economic
impact of divestment was small because, with the exception of Kenya Airways sold in 1996,
the remaining were small or medium enterprises. Furthermore, transactions lacked
transparency, political support was weak, strategy unclear and institutional and administrative
arrangements inadequate (IFC, 2000).
The Kenyan government announced a renewed privatization strategy in 2000, which took
into account previous experience and focused on increasing private sector participation in the
enterprises previously deemed strategic. It approved the privatization of telecommunications
(Telkom Kenya), energy (KPLC, the Kenya Pipeline Company, and Kengen), transports
(Mombasa Port and Kenya Railways), banking (Kenya Commercial Bank and Kenya
Reinsurance), sugar and water. This programme however stalled for example Telkom Kenya.
As part of a successful bidding process, the Mount Kenya consortium won a 49 percent stake
in Telkom Kenya with a 325 million dollar bid in 2001. But the process was derailed in mid-
course, when the government announced the breaking off of negotiations on the basis of
political reasons (Oxan 2001). This was a costly course of action. Kenya not only lost
international credibility and fiscal revenues but also missed a window of opportunity to repair
the poor state of telecommunications in the country. (Appendix 2&3)
7.0 CONCLUSIONS
This paper presented the impact business cycles have on industry sectors in Kenya. We
presented micro-economic evolution trends on structure sector changes in Kenya since
independence. Kenya‟s economic growth was very strong. We showed that Kenya‟s policy
trend did falter which paved way for the inefficiency of the economy. Inefficiency was
faltered in state owned institutions which caused low productivity and returns across the
board. Kenya suffered various economic shocks in the 1990s. The 2000 decade showed
market oriented policies. This is the time the government announced a renewed privatization
strategy. This process was derailed because of a turbulent political environment. Business
cycles presences in Kenyan economy are a testimony of structural changes within the
framework of existing sectors. Our focus therefore, encourage further theoretical
development innovatively to enable the improvement of Kenyan economy.
References
Aduda, A.K & Kaane, H. (1999), Technology Policies and Strategies in A. Mullei and C.
Bokea (Eds), Micro and Small Enterprises in Kenya: Agenda for Improving the Policy
Environment. International Centre for Economic Growth. Nairobi.
Alesina, Nouriel Roubini & Gerald Cohen (1997). Political Cycles and the Macro economy.
Cambri, MA ,MIT Press.
Batini, N et. al,(2006). The Global Impact of Demographic Change,IMF Working,JEL
Classifications Numbers, J11,F21,E 21,E 22.
Block, S.A (1999). Political Business Cycles, Democratization and Economic Reform: The
Case of Africa.
International Journal of Research in Management ISSN 2249-5908
Available online on http://www.rspublication.com/ijrm/ijrm_index.htm Issue 3, Vol.5 (September2013)
R S. Publication, [email protected] Page 125
Copeland et.al (2000), Measuring and Managing the value of companies, 3rd
ed. New York:
Wiley
GOK(2012). Sessional Paper No. 2012 on Vision 2030
Hallberg, K. (1999). A Market-Oriented Strategy for Small and Medium-Scale Enterprises.
Discussion Paper No. 40, International Finance Corporation, Washington, D.C.
Nesta,L & Mangematin,V (2004),"The Dynamics of Innovation Networks," SPRU. Working
paper series 114, SPRU - Science and Technology Policy Research, University of Sussex.
Palepu etc (2004). Business Analysis and Valuation, 3rd
ed. Cincinnath, Ott: South Western
Publishing, U.S.A.
Porter etc (1988). “How to conduct an Industry Analysis.” In the Financial Analysis
Handbook, 2nd
ed. Sumne N. Levine. Homewood, IL: Dow Jones – Irwin.
Rally, FK and Brown, C.K. (2007) Investment Analysis and Portfolio Management, 8th Ed.
Thomson, South – Western, U.S.A.
Stowe etc (2002). Analysis of Equity Investment: Valuation. Charlottesville, VA: AIMR
Swammy, G (1994), Adjustment in Africa: Lessons from Country, case study; Washington,
DC, the World Bank
International Journal of Research in Management ISSN 2249-5908
Available online on http://www.rspublication.com/ijrm/ijrm_index.htm Issue 3, Vol.5 (September2013)
R S. Publication, [email protected] Page 126
Appendices
Bar Graph 1
Appendix 2
5.04
1.69
8.01
4.08 4.07
0.52
1.67
-0.79
-1.00
0.00
1.00
2.00
3.00
4.00
5.00
6.00
7.00
8.00
9.00
1970/63 1980/70 1990/80 2000/1990
Decade
Economic growth by decade
Constant GDP growth Constant GDP per capita growth
5.23
6.26
2.44
10.61
7.61
5.33
3.95
4.90
3.66
1.77
3.26
0.68
0.00
2.00
4.00
6.00
8.00
10.00
12.00
%
1970/63 1980/70 1990/80 2000/1990
Decade
Growth by sector
Industrial growth Service growth Agricultural growth
International Journal of Research in Management ISSN 2249-5908
Available online on http://www.rspublication.com/ijrm/ijrm_index.htm Issue 3, Vol.5 (September2013)
R S. Publication, [email protected] Page 127
Appendix 3
5.23
6.26
2.44
10.61
7.61
5.33
3.95
4.90
3.66
1.77
3.26
0.68
0.00
2.00
4.00
6.00
8.00
10.00
12.00
%
1970/63 1980/70 1990/80 2000/1990
Decade
Growth by sector
Industrial growth Service growth Agricultural growth State-owned enterprises
0
5
10
15
20
25
30
35
1960
1962
1964
1966
1968
1970
1972
1974
1976
1978
1980
1982
1984
1986
1988
1990
1992
1994
1996
1998
2000
2002
Year
0
5000000000
10000000000
15000000000
20000000000
25000000000
State-owned enterprises, credit (% of gross domestic credit) State-owned enterprises, employment (% of total)
State-owned enterprises, investment (% of GDI) State-owned enterprises, economic activity (current LCU)
State-owned enterprises, investment (current LCU)