适用于 amr 的超低功耗水流测量参考设计 - 德州仪器
TRANSCRIPT
CC1312R
SCE
RadioBalun and RF
matching
COMP
DAC
Flow_output1
Flow_output2 PulseCounter
Flow_output1
VCC
Trigger1
Flow_output2
VCC
Trigger2 CSD23285F5
Trigger
Output
3.0 V or 3.6 V cell
TIDA-010050 Board
LAUNCHXL-CC1312R1
1ZHCU657–April 2019
TIDUEO3 — http://www-s.ti.com/sc/techlit/TIDUEO3版权 © 2019, Texas Instruments Incorporated
适用于 AMR 的超低功耗水流测量参考设计
设设计计指指南南::TIDA-010050适适用用于于 AMR 的的超超低低功功耗耗水水流流测测量量参参考考设设计计
说说明明
此参考设计经过全面测试,展示了一个通过机械流量计
对水流进行电子测量的低功耗解决方案,并提供了用于
水流测量和无线通信的单芯片平台。该设计非常适用于
水表自动抄表 (AMR) 模块,该模块可在现有机械流量计
上添加无线通信功能。射频子系统支持无线 M-Bus 等标
准协议或低于 1GHz ISM 频带的专有协议。此参考设计
可提供远距离精确读取机械旋转量的能力,并提供更高
的可靠性。超低的功耗可降低对电池的要求并延长产品
寿命。
资资源源
TIDA-010050 设计文件夹
CC1312R 产品文件夹
CSD23285F5 产品文件夹
SN74AUP2G00 产品文件夹
LAUNCHXL-CC1312R1 产品文件夹
Sensor Controller Studio 产品文件夹
咨询我们的 E2E™ 专家
特特性性
• 具有流量计计量和射频通信子系统的单芯片集成解
决方案
• 满足 ISO4064-1:2014-11(1 类)测量精度要求
• 采样频率为 16Hz 且电源电压为 3.3V 时,消耗
1.83µA 的电流
• 可在距离旋转光盘高达 5.8mm 处进行精确测量
• 经完整测试且具有固件、设计文件和测试报告的参
考设计
应应用用
• 电子 AMR 附加模块
– 水表
– 热量计
– 燃气表
该 TI 参考设计末尾的重要声明表述了授权使用、知识产权问题和其他重要的免责声明和信息。
System Description www.ti.com.cn
2 ZHCU657–April 2019
TIDUEO3 — http://www-s.ti.com/sc/techlit/TIDUEO3版权 © 2019, Texas Instruments Incorporated
适用于 AMR 的超低功耗水流测量参考设计
1 System Description
There is an increasing demand for the development of smart water meters from all over the world inreplace of traditional mechanical meters. Compared with a full replacement of an electronic meter, usingan electronic add-on module to integrate with the mechanical meters can be a less expensive solution.With the cost consideration and competitive performance, it can be placed in an increasingly strongposition in the market.
The TIDA-010050 uses TI's CC1312R SimpleLink™ ultra-low-power wireless MCU to implement a LC-sensing subsystem to detect disc rotation with minimal cost while achieving extremely low powerconsumption without compromising on performance. This single-ship solution introduces a novel approachfor flow measurement applications by integrating a true wireless AMR capability with low-cost LC sensorsto deliver a highly affordable and physically compact solution. This reference design can be implementedwith any CC13x2 and CC26x2 SimpleLink™ low-power RF wireless MCU, which integrates the samesensor controller engine.
The TIDA-010050 is a further development to the Low-power water flow measurement with inductivesensing reference design, which is based on the CC13x0 device. Because there are lots of improvementstuned toward ultra-low power in the CC13x2, including a 2-MHz clock, fast wake-up, and ultra-low powercounter, the power consumption of the TIDA-010050 is significantly lower. Several modifications inhardware and software have been validated to offer a better system performance of distance andaccuracy detection, including inductor cross-coupling effect suppression and calibration mechanism duringinitialization.
1.1 Key System Specifications
表表 1. Key System Specifications
PARAMETER SPECIFICATIONS DETAILSInput voltage 2~3.8 V (Lithium-ion primary cell: Li-SOCL2 or LiMnO2) 4.2 节
Sensor method Inductive (or LC sensing) 2.4 节
Average power consumption1.83 µA and 4.42 µA with 16-Hz and 64-HZ sampling rate at 3.3V, respectively (without interrupts to the system CPUapplication)
节 4.2.1
Motion sensing range (distance betweendisc and inductor) Maximum 5.8 mm with Gemphil inductor GT1302-0 节 4.2.2
CC1312R
SCE
RadioBalun and RF
matching
COMP
DAC
Flow_output1
Flow_output2 PulseCounter
Flow_output1
VCC
Trigger1
Flow_output2
VCC
Trigger2 CSD23285F5
Trigger
Output
3.0 V or 3.6 V cell
TIDA-010050 Board
LAUNCHXL-CC1312R1
www.ti.com.cn System Overview
3ZHCU657–April 2019
TIDUEO3 — http://www-s.ti.com/sc/techlit/TIDUEO3版权 © 2019, Texas Instruments Incorporated
适用于 AMR 的超低功耗水流测量参考设计
2 System Overview
2.1 Block Diagram
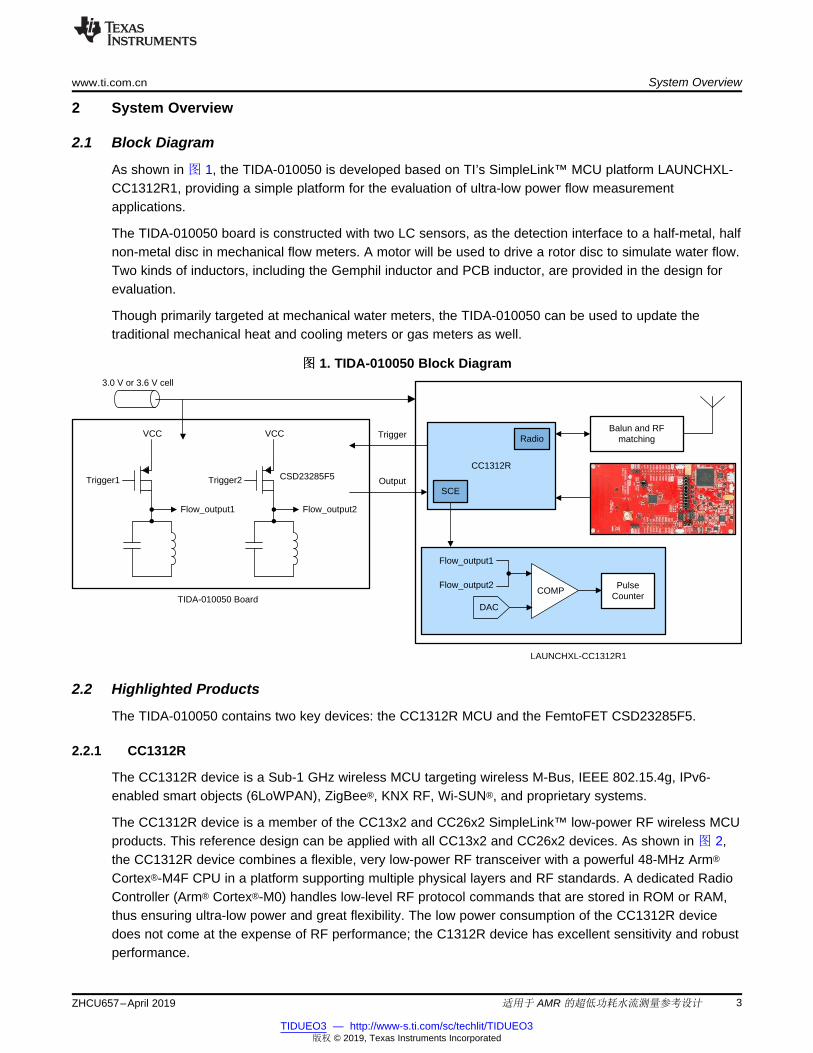
As shown in 图 1, the TIDA-010050 is developed based on TI’s SimpleLink™ MCU platform LAUNCHXL-CC1312R1, providing a simple platform for the evaluation of ultra-low power flow measurementapplications.
The TIDA-010050 board is constructed with two LC sensors, as the detection interface to a half-metal, halfnon-metal disc in mechanical flow meters. A motor will be used to drive a rotor disc to simulate water flow.Two kinds of inductors, including the Gemphil inductor and PCB inductor, are provided in the design forevaluation.
Though primarily targeted at mechanical water meters, the TIDA-010050 can be used to update thetraditional mechanical heat and cooling meters or gas meters as well.
图图 1. TIDA-010050 Block Diagram
2.2 Highlighted Products
The TIDA-010050 contains two key devices: the CC1312R MCU and the FemtoFET CSD23285F5.
2.2.1 CC1312R
The CC1312R device is a Sub-1 GHz wireless MCU targeting wireless M-Bus, IEEE 802.15.4g, IPv6-enabled smart objects (6LoWPAN), ZigBee®, KNX RF, Wi-SUN®, and proprietary systems.
The CC1312R device is a member of the CC13x2 and CC26x2 SimpleLink™ low-power RF wireless MCUproducts. This reference design can be applied with all CC13x2 and CC26x2 devices. As shown in 图 2,the CC1312R device combines a flexible, very low-power RF transceiver with a powerful 48-MHz Arm®
Cortex®-M4F CPU in a platform supporting multiple physical layers and RF standards. A dedicated RadioController (Arm® Cortex®-M0) handles low-level RF protocol commands that are stored in ROM or RAM,thus ensuring ultra-low power and great flexibility. The low power consumption of the CC1312R devicedoes not come at the expense of RF performance; the C1312R device has excellent sensitivity and robustperformance.

System Overview www.ti.com.cn
4 ZHCU657–April 2019
TIDUEO3 — http://www-s.ti.com/sc/techlit/TIDUEO3版权 © 2019, Texas Instruments Incorporated
适用于 AMR 的超低功耗水流测量参考设计
图图 2. CC1312R Architecture
2.2.2 LAUNCHXL-CC1312R1
The CC1312R LaunchPad™ is part of TI’s SimpleLink MCU platform, offering a single developmentenvironment that delivers flexible hardware, software, and tool options for customers developing wired andwireless applications. The TIDA-010050 must combine with the CC1312R LaunchPad and connect withthe LaunchPad kit’s I/O connectors, which saves time and production cost by quickly prototyping theinductive sensing sub-system. All software examples and hardware design files included in the SimpleLinkCC13x2 SDK support the CC1312R LaunchPad kit, making the development much easier.
www.ti.com.cn System Overview
5ZHCU657–April 2019
TIDUEO3 — http://www-s.ti.com/sc/techlit/TIDUEO3版权 © 2019, Texas Instruments Incorporated
适用于 AMR 的超低功耗水流测量参考设计
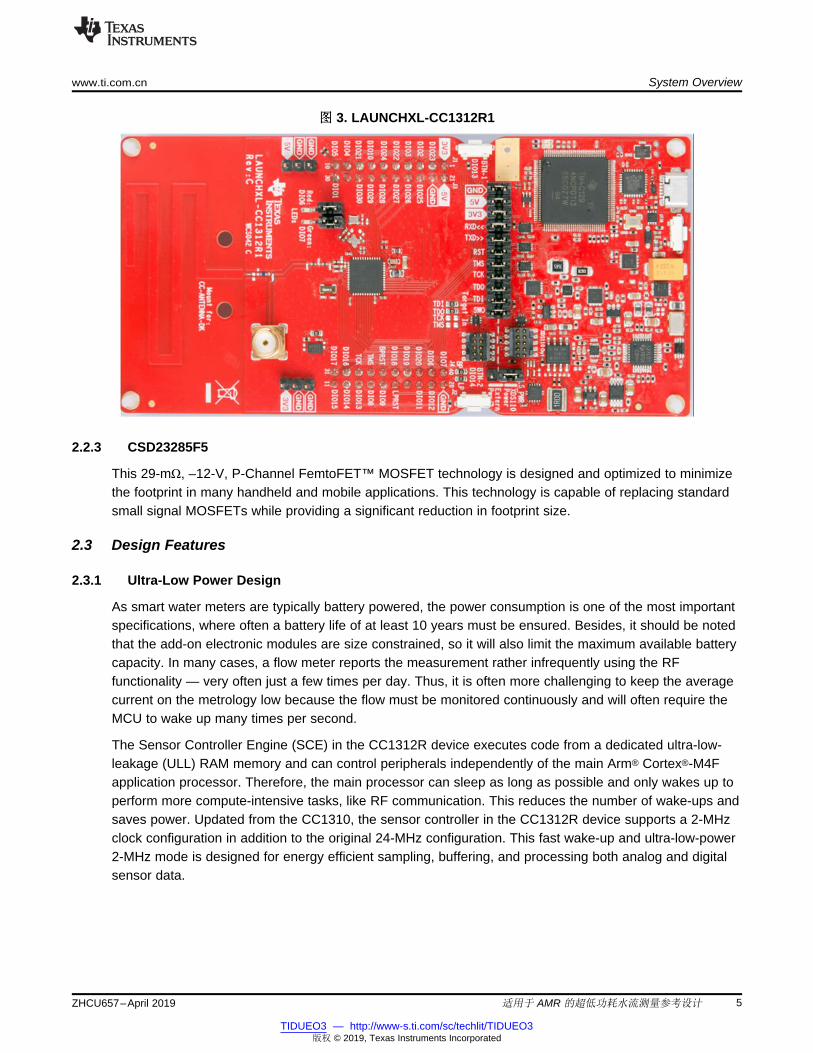
图图 3. LAUNCHXL-CC1312R1
2.2.3 CSD23285F5
This 29-mΩ, –12-V, P-Channel FemtoFET™ MOSFET technology is designed and optimized to minimizethe footprint in many handheld and mobile applications. This technology is capable of replacing standardsmall signal MOSFETs while providing a significant reduction in footprint size.
2.3 Design Features
2.3.1 Ultra-Low Power Design
As smart water meters are typically battery powered, the power consumption is one of the most importantspecifications, where often a battery life of at least 10 years must be ensured. Besides, it should be notedthat the add-on electronic modules are size constrained, so it will also limit the maximum available batterycapacity. In many cases, a flow meter reports the measurement rather infrequently using the RFfunctionality — very often just a few times per day. Thus, it is often more challenging to keep the averagecurrent on the metrology low because the flow must be monitored continuously and will often require theMCU to wake up many times per second.
The Sensor Controller Engine (SCE) in the CC1312R device executes code from a dedicated ultra-low-leakage (ULL) RAM memory and can control peripherals independently of the main Arm® Cortex®-M4Fapplication processor. Therefore, the main processor can sleep as long as possible and only wakes up toperform more compute-intensive tasks, like RF communication. This reduces the number of wake-ups andsaves power. Updated from the CC1310, the sensor controller in the CC1312R device supports a 2-MHzclock configuration in addition to the original 24-MHz configuration. This fast wake-up and ultra-low-power2-MHz mode is designed for energy efficient sampling, buffering, and processing both analog and digitalsensor data.
System Overview www.ti.com.cn
6 ZHCU657–April 2019
TIDUEO3 — http://www-s.ti.com/sc/techlit/TIDUEO3版权 © 2019, Texas Instruments Incorporated
适用于 AMR 的超低功耗水流测量参考设计
2.3.2 Single Chip Solution
The CC13x2 SimpleLink™ low-power RF wireless MCU products are designed toward low power in bothmetrology and RF communication, which means that it does not need an external RF device to implementwireless communication capability. TI offers the CC13x2 and CC26x2 wireless MCU platform with multiplewireless protocol stacks. The available stacks are both customer-modifiable and standard-basedprotocols, such as the Wireless M-Bus Protocol Software and the TI 15.4-Stack that is available in theSimpleLink™ CC13x2 Software Development Kit.
2.4 LC Sensing Theory
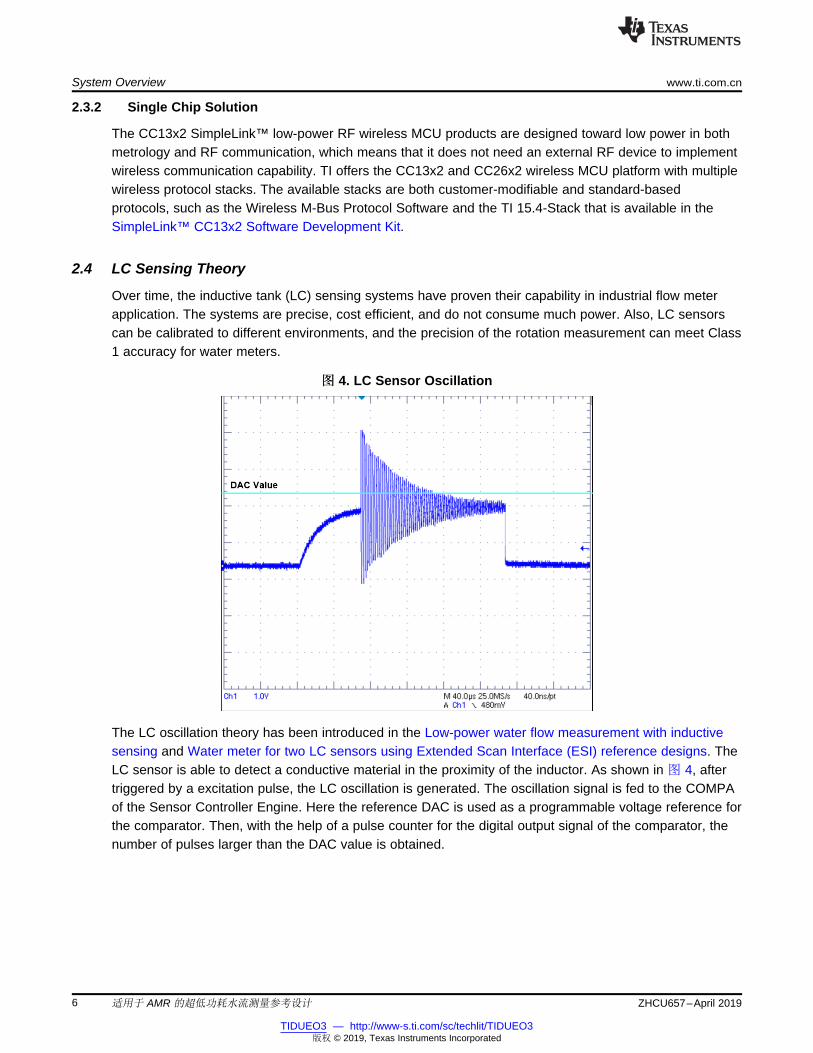
Over time, the inductive tank (LC) sensing systems have proven their capability in industrial flow meterapplication. The systems are precise, cost efficient, and do not consume much power. Also, LC sensorscan be calibrated to different environments, and the precision of the rotation measurement can meet Class1 accuracy for water meters.
图图 4. LC Sensor Oscillation
The LC oscillation theory has been introduced in the Low-power water flow measurement with inductivesensing and Water meter for two LC sensors using Extended Scan Interface (ESI) reference designs. TheLC sensor is able to detect a conductive material in the proximity of the inductor. As shown in 图 4, aftertriggered by a excitation pulse, the LC oscillation is generated. The oscillation signal is fed to the COMPAof the Sensor Controller Engine. Here the reference DAC is used as a programmable voltage reference forthe comparator. Then, with the help of a pulse counter for the digital output signal of the comparator, thenumber of pulses larger than the DAC value is obtained.
a)01 b)00 c)10 d)11 a)01 b)00
Sensor 2
Sensor 1
clockwise rotation
counter-clockwise rotation
www.ti.com.cn System Overview
7ZHCU657–April 2019
TIDUEO3 — http://www-s.ti.com/sc/techlit/TIDUEO3版权 © 2019, Texas Instruments Incorporated
适用于 AMR 的超低功耗水流测量参考设计
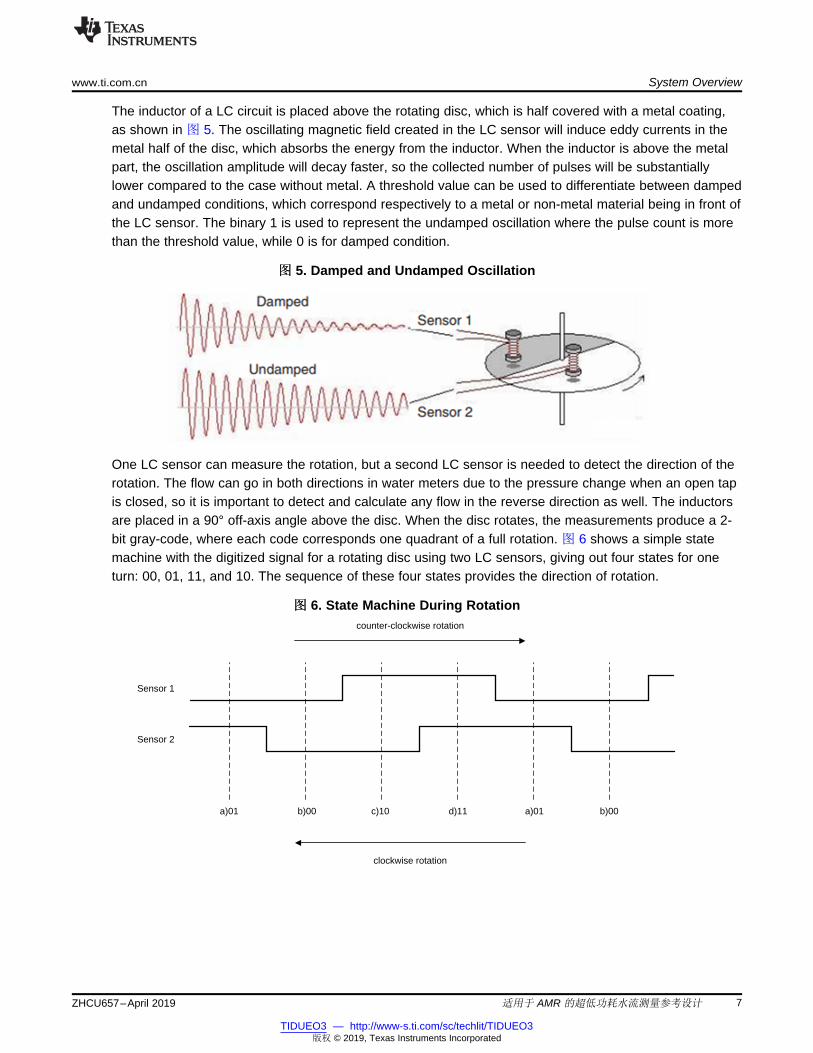
The inductor of a LC circuit is placed above the rotating disc, which is half covered with a metal coating,as shown in 图 5. The oscillating magnetic field created in the LC sensor will induce eddy currents in themetal half of the disc, which absorbs the energy from the inductor. When the inductor is above the metalpart, the oscillation amplitude will decay faster, so the collected number of pulses will be substantiallylower compared to the case without metal. A threshold value can be used to differentiate between dampedand undamped conditions, which correspond respectively to a metal or non-metal material being in front ofthe LC sensor. The binary 1 is used to represent the undamped oscillation where the pulse count is morethan the threshold value, while 0 is for damped condition.
图图 5. Damped and Undamped Oscillation
One LC sensor can measure the rotation, but a second LC sensor is needed to detect the direction of therotation. The flow can go in both directions in water meters due to the pressure change when an open tapis closed, so it is important to detect and calculate any flow in the reverse direction as well. The inductorsare placed in a 90° off-axis angle above the disc. When the disc rotates, the measurements produce a 2-bit gray-code, where each code corresponds one quadrant of a full rotation. 图 6 shows a simple statemachine with the digitized signal for a rotating disc using two LC sensors, giving out four states for oneturn: 00, 01, 11, and 10. The sequence of these four states provides the direction of rotation.
图图 6. State Machine During Rotation
Trigger Circuit
DC Bias Circuit
Optional PCB Inductor
3
1
2
Q1
CSD23285F5
1uF
C1
GND
150uH
L1
GND
GND
GND
FLOW_VDD
FLOW_TRIG1
FLOW_BIAS
FLOW_OUT1FORCE_LOW1
GND
7
1
2
U1A
SN74AUP2G00DQER
PCB_inductor1
50V
680pF
C3
100pF
C5
390pF
C7
100pF
C9
100pF
C11
47k
R1
1.0k
R3
470
R5
0
R11
0
R13DNP
330k
R7
330k
R9
Getting Started Hardware and Software www.ti.com.cn
8 ZHCU657–April 2019
TIDUEO3 — http://www-s.ti.com/sc/techlit/TIDUEO3版权 © 2019, Texas Instruments Incorporated
适用于 AMR 的超低功耗水流测量参考设计
3 Getting Started Hardware and Software
3.1 Hardware Design
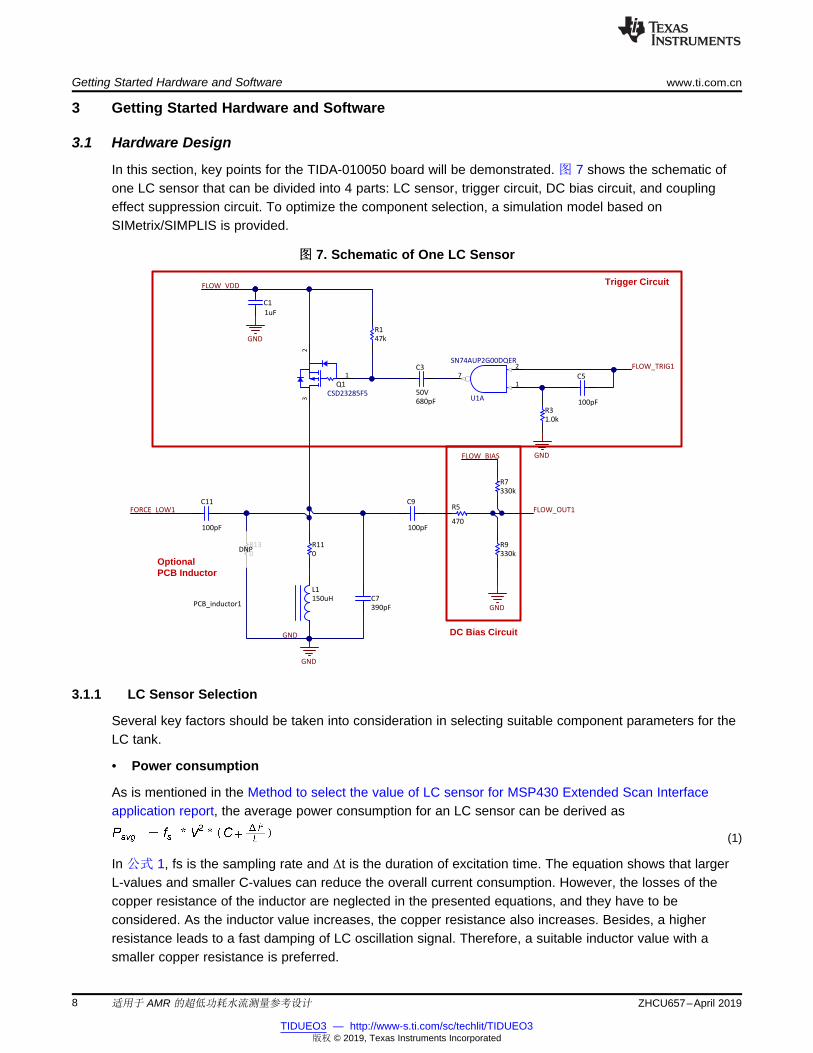
In this section, key points for the TIDA-010050 board will be demonstrated. 图 7 shows the schematic ofone LC sensor that can be divided into 4 parts: LC sensor, trigger circuit, DC bias circuit, and couplingeffect suppression circuit. To optimize the component selection, a simulation model based onSIMetrix/SIMPLIS is provided.
图图 7. Schematic of One LC Sensor
3.1.1 LC Sensor Selection
Several key factors should be taken into consideration in selecting suitable component parameters for theLC tank.
• Power consumption
As is mentioned in the Method to select the value of LC sensor for MSP430 Extended Scan Interfaceapplication report, the average power consumption for an LC sensor can be derived as
(1)
In 公式 1, fs is the sampling rate and Δt is the duration of excitation time. The equation shows that largerL-values and smaller C-values can reduce the overall current consumption. However, the losses of thecopper resistance of the inductor are neglected in the presented equations, and they have to beconsidered. As the inductor value increases, the copper resistance also increases. Besides, a higherresistance leads to a fast damping of LC oscillation signal. Therefore, a suitable inductor value with asmaller copper resistance is preferred.
www.ti.com.cn Getting Started Hardware and Software
9ZHCU657–April 2019
TIDUEO3 — http://www-s.ti.com/sc/techlit/TIDUEO3版权 © 2019, Texas Instruments Incorporated
适用于 AMR 的超低功耗水流测量参考设计
• Oscillation frequency
Because the COMPA performance is limited to 1 MHz, the oscillation frequency of the LC tank has to beless than that value. Alternatively, the slower the resonant frequency is, the longer the process ofmeasuring and evaluating the oscillation will be. This also affects the energy consumption because thesensor controller engine of the CC1312R device must be powered as long as the measurement isongoing.
• Size and form
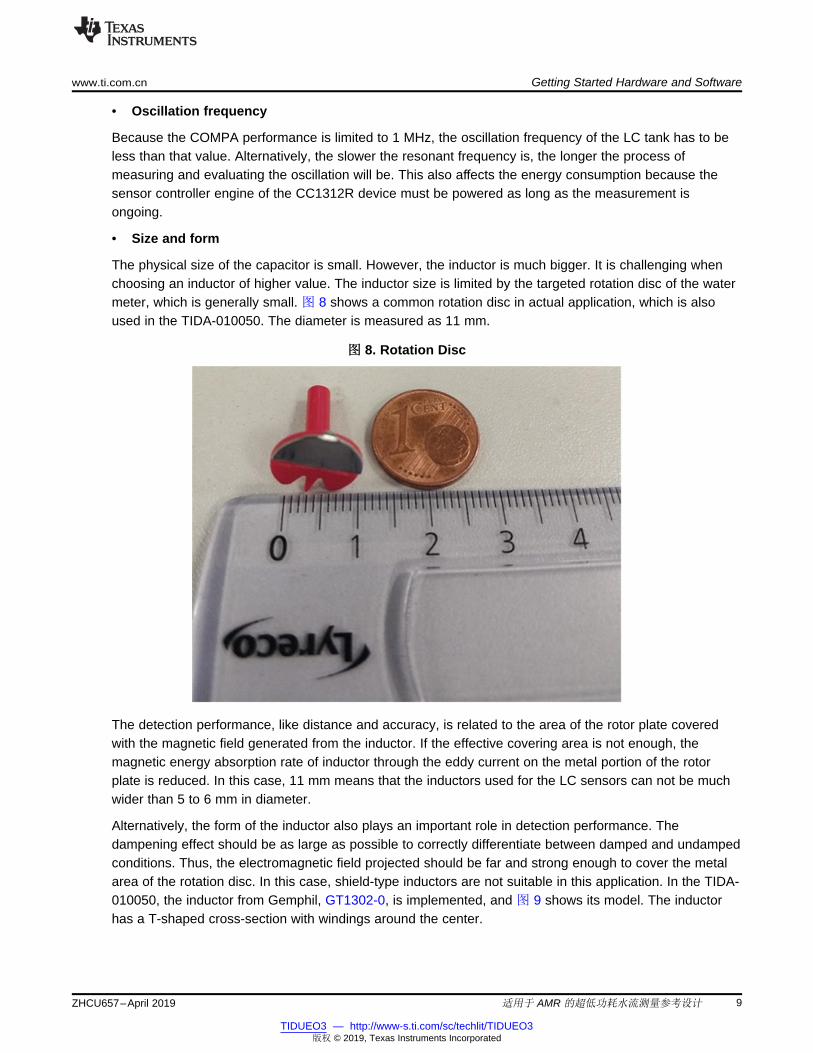
The physical size of the capacitor is small. However, the inductor is much bigger. It is challenging whenchoosing an inductor of higher value. The inductor size is limited by the targeted rotation disc of the watermeter, which is generally small. 图 8 shows a common rotation disc in actual application, which is alsoused in the TIDA-010050. The diameter is measured as 11 mm.
图图 8. Rotation Disc
The detection performance, like distance and accuracy, is related to the area of the rotor plate coveredwith the magnetic field generated from the inductor. If the effective covering area is not enough, themagnetic energy absorption rate of inductor through the eddy current on the metal portion of the rotorplate is reduced. In this case, 11 mm means that the inductors used for the LC sensors can not be muchwider than 5 to 6 mm in diameter.
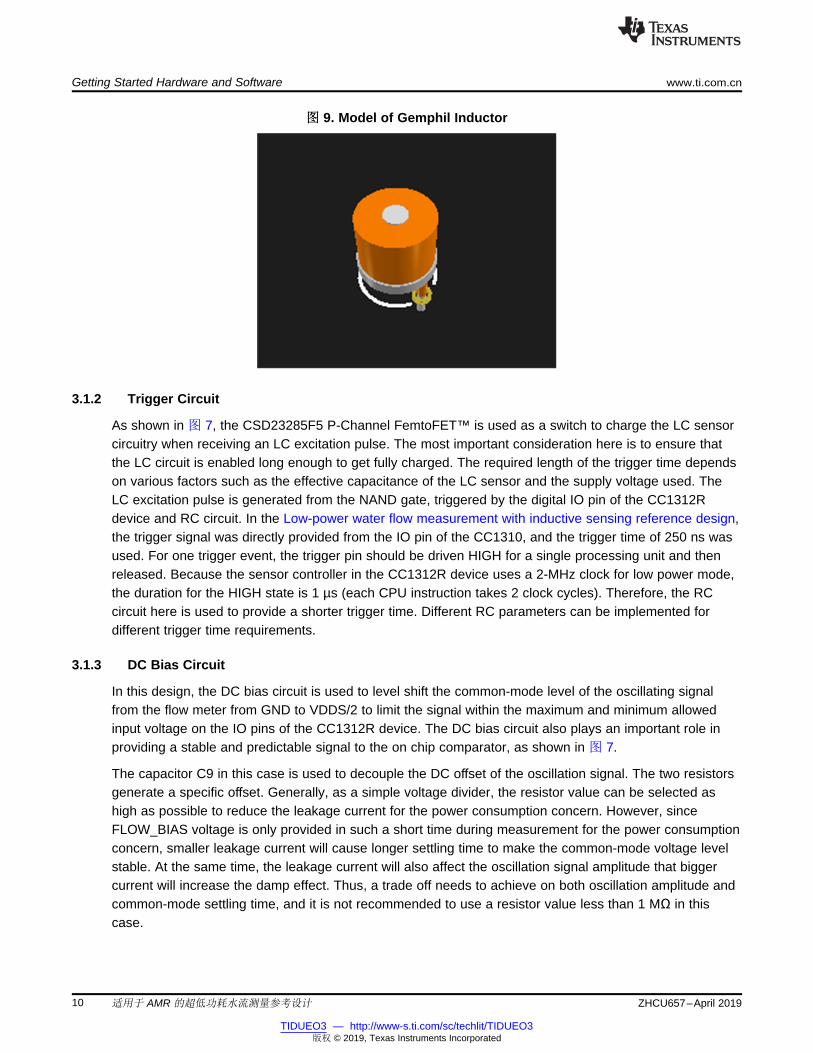
Alternatively, the form of the inductor also plays an important role in detection performance. Thedampening effect should be as large as possible to correctly differentiate between damped and undampedconditions. Thus, the electromagnetic field projected should be far and strong enough to cover the metalarea of the rotation disc. In this case, shield-type inductors are not suitable in this application. In the TIDA-010050, the inductor from Gemphil, GT1302-0, is implemented, and 图 9 shows its model. The inductorhas a T-shaped cross-section with windings around the center.
Getting Started Hardware and Software www.ti.com.cn
10 ZHCU657–April 2019
TIDUEO3 — http://www-s.ti.com/sc/techlit/TIDUEO3版权 © 2019, Texas Instruments Incorporated
适用于 AMR 的超低功耗水流测量参考设计
图图 9. Model of Gemphil Inductor
3.1.2 Trigger Circuit
As shown in 图 7, the CSD23285F5 P-Channel FemtoFET™ is used as a switch to charge the LC sensorcircuitry when receiving an LC excitation pulse. The most important consideration here is to ensure thatthe LC circuit is enabled long enough to get fully charged. The required length of the trigger time dependson various factors such as the effective capacitance of the LC sensor and the supply voltage used. TheLC excitation pulse is generated from the NAND gate, triggered by the digital IO pin of the CC1312Rdevice and RC circuit. In the Low-power water flow measurement with inductive sensing reference design,the trigger signal was directly provided from the IO pin of the CC1310, and the trigger time of 250 ns wasused. For one trigger event, the trigger pin should be driven HIGH for a single processing unit and thenreleased. Because the sensor controller in the CC1312R device uses a 2-MHz clock for low power mode,the duration for the HIGH state is 1 µs (each CPU instruction takes 2 clock cycles). Therefore, the RCcircuit here is used to provide a shorter trigger time. Different RC parameters can be implemented fordifferent trigger time requirements.
3.1.3 DC Bias Circuit
In this design, the DC bias circuit is used to level shift the common-mode level of the oscillating signalfrom the flow meter from GND to VDDS/2 to limit the signal within the maximum and minimum allowedinput voltage on the IO pins of the CC1312R device. The DC bias circuit also plays an important role inproviding a stable and predictable signal to the on chip comparator, as shown in 图 7.
The capacitor C9 in this case is used to decouple the DC offset of the oscillation signal. The two resistorsgenerate a specific offset. Generally, as a simple voltage divider, the resistor value can be selected ashigh as possible to reduce the leakage current for the power consumption concern. However, sinceFLOW_BIAS voltage is only provided in such a short time during measurement for the power consumptionconcern, smaller leakage current will cause longer settling time to make the common-mode voltage levelstable. At the same time, the leakage current will also affect the oscillation signal amplitude that biggercurrent will increase the damp effect. Thus, a trade off needs to achieve on both oscillation amplitude andcommon-mode settling time, and it is not recommended to use a resistor value less than 1 MΩ in thiscase.
www.ti.com.cn Getting Started Hardware and Software
11ZHCU657–April 2019
TIDUEO3 — http://www-s.ti.com/sc/techlit/TIDUEO3版权 © 2019, Texas Instruments Incorporated
适用于 AMR 的超低功耗水流测量参考设计
3.1.4 Coupling Effect Suppression Circuit
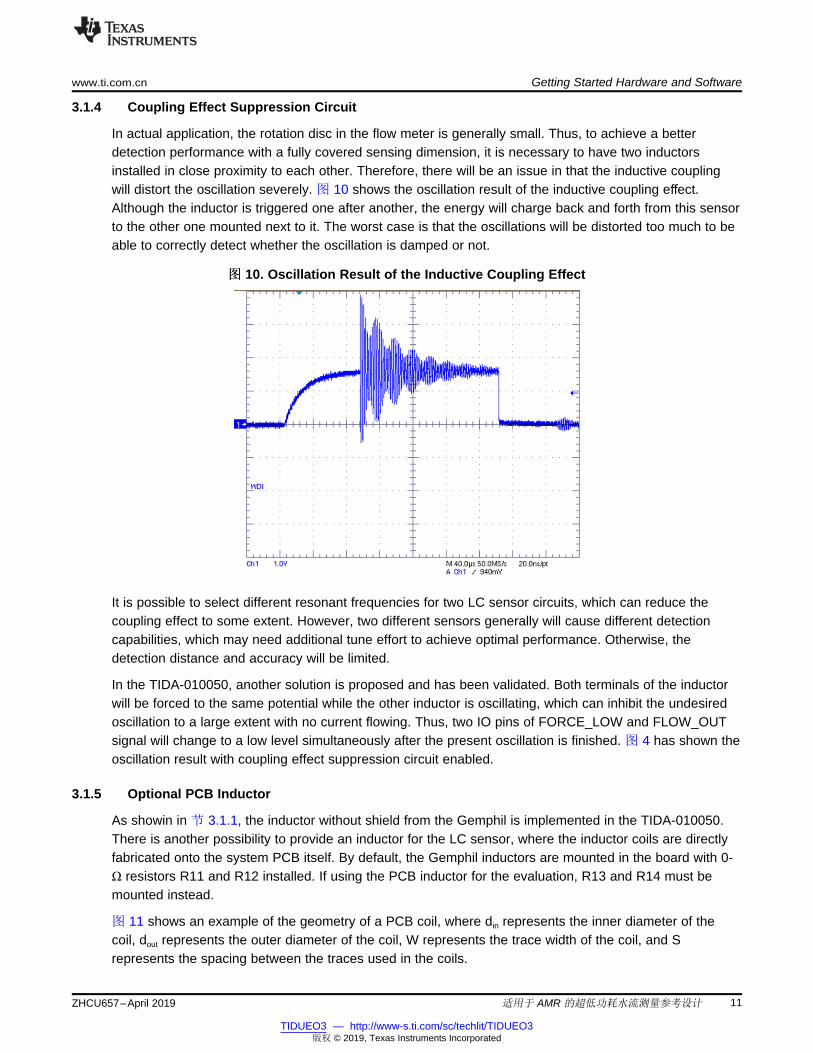
In actual application, the rotation disc in the flow meter is generally small. Thus, to achieve a betterdetection performance with a fully covered sensing dimension, it is necessary to have two inductorsinstalled in close proximity to each other. Therefore, there will be an issue in that the inductive couplingwill distort the oscillation severely. 图 10 shows the oscillation result of the inductive coupling effect.Although the inductor is triggered one after another, the energy will charge back and forth from this sensorto the other one mounted next to it. The worst case is that the oscillations will be distorted too much to beable to correctly detect whether the oscillation is damped or not.
图图 10. Oscillation Result of the Inductive Coupling Effect
It is possible to select different resonant frequencies for two LC sensor circuits, which can reduce thecoupling effect to some extent. However, two different sensors generally will cause different detectioncapabilities, which may need additional tune effort to achieve optimal performance. Otherwise, thedetection distance and accuracy will be limited.
In the TIDA-010050, another solution is proposed and has been validated. Both terminals of the inductorwill be forced to the same potential while the other inductor is oscillating, which can inhibit the undesiredoscillation to a large extent with no current flowing. Thus, two IO pins of FORCE_LOW and FLOW_OUTsignal will change to a low level simultaneously after the present oscillation is finished. 图 4 has shown theoscillation result with coupling effect suppression circuit enabled.
3.1.5 Optional PCB Inductor
As showin in 节 3.1.1, the inductor without shield from the Gemphil is implemented in the TIDA-010050.There is another possibility to provide an inductor for the LC sensor, where the inductor coils are directlyfabricated onto the system PCB itself. By default, the Gemphil inductors are mounted in the board with 0-Ω resistors R11 and R12 installed. If using the PCB inductor for the evaluation, R13 and R14 must bemounted instead.
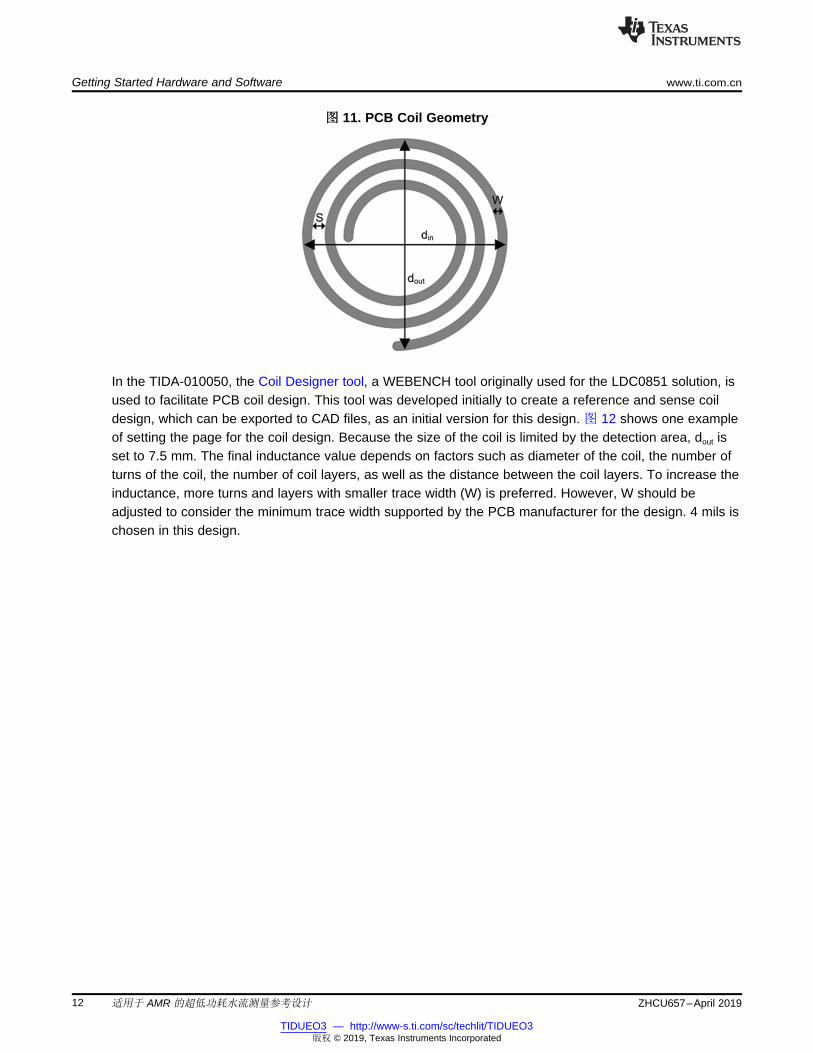
图 11 shows an example of the geometry of a PCB coil, where din represents the inner diameter of thecoil, dout represents the outer diameter of the coil, W represents the trace width of the coil, and Srepresents the spacing between the traces used in the coils.
Getting Started Hardware and Software www.ti.com.cn
12 ZHCU657–April 2019
TIDUEO3 — http://www-s.ti.com/sc/techlit/TIDUEO3版权 © 2019, Texas Instruments Incorporated
适用于 AMR 的超低功耗水流测量参考设计
图图 11. PCB Coil Geometry
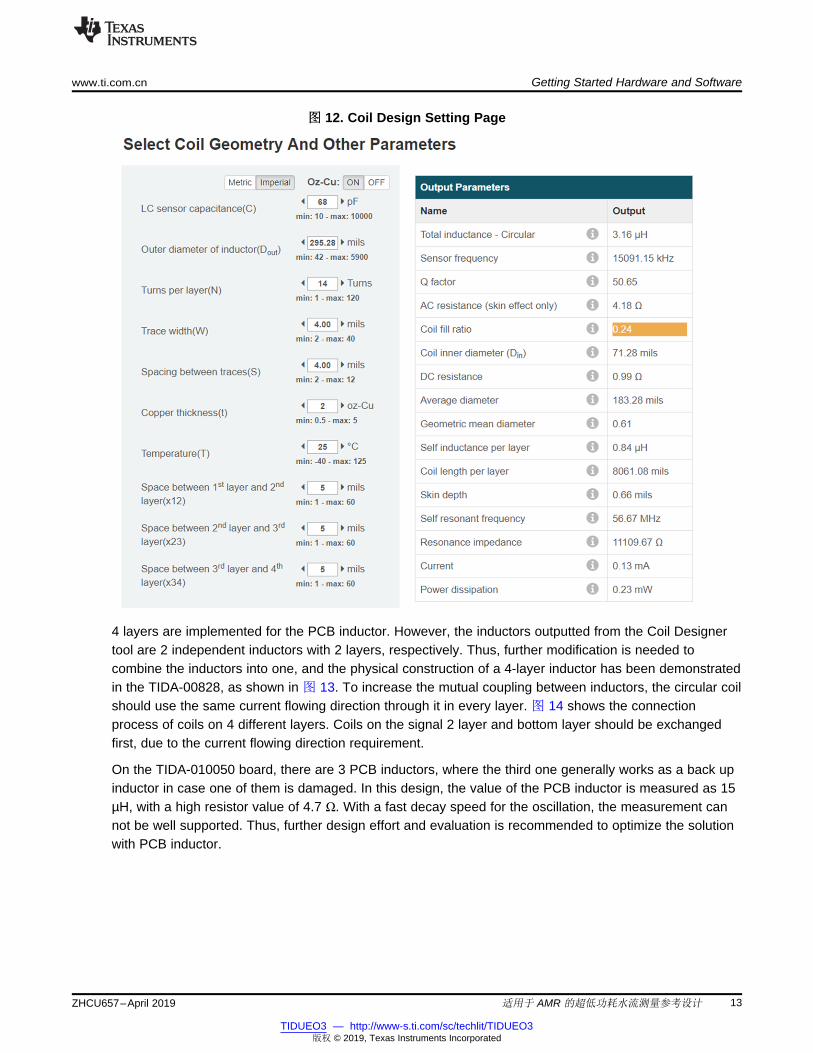
In the TIDA-010050, the Coil Designer tool, a WEBENCH tool originally used for the LDC0851 solution, isused to facilitate PCB coil design. This tool was developed initially to create a reference and sense coildesign, which can be exported to CAD files, as an initial version for this design. 图 12 shows one exampleof setting the page for the coil design. Because the size of the coil is limited by the detection area, dout isset to 7.5 mm. The final inductance value depends on factors such as diameter of the coil, the number ofturns of the coil, the number of coil layers, as well as the distance between the coil layers. To increase theinductance, more turns and layers with smaller trace width (W) is preferred. However, W should beadjusted to consider the minimum trace width supported by the PCB manufacturer for the design. 4 mils ischosen in this design.
www.ti.com.cn Getting Started Hardware and Software
13ZHCU657–April 2019
TIDUEO3 — http://www-s.ti.com/sc/techlit/TIDUEO3版权 © 2019, Texas Instruments Incorporated
适用于 AMR 的超低功耗水流测量参考设计
图图 12. Coil Design Setting Page
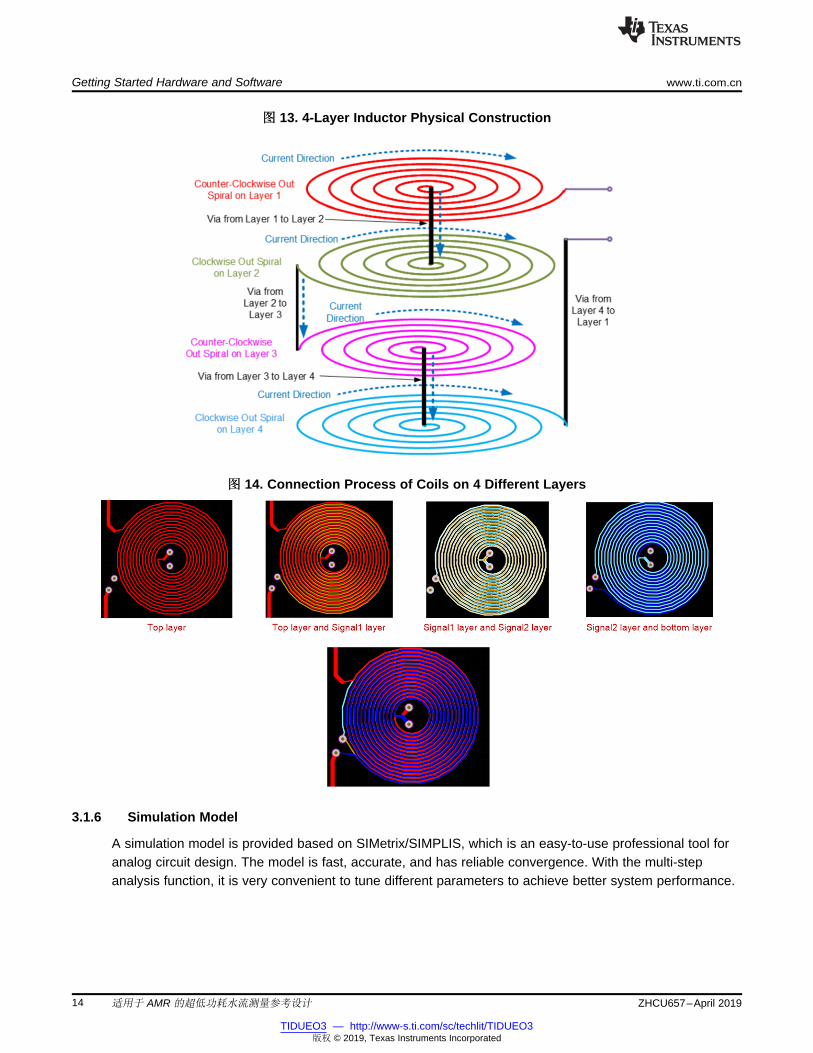
4 layers are implemented for the PCB inductor. However, the inductors outputted from the Coil Designertool are 2 independent inductors with 2 layers, respectively. Thus, further modification is needed tocombine the inductors into one, and the physical construction of a 4-layer inductor has been demonstratedin the TIDA-00828, as shown in 图 13. To increase the mutual coupling between inductors, the circular coilshould use the same current flowing direction through it in every layer. 图 14 shows the connectionprocess of coils on 4 different layers. Coils on the signal 2 layer and bottom layer should be exchangedfirst, due to the current flowing direction requirement.
On the TIDA-010050 board, there are 3 PCB inductors, where the third one generally works as a back upinductor in case one of them is damaged. In this design, the value of the PCB inductor is measured as 15µH, with a high resistor value of 4.7 Ω. With a fast decay speed for the oscillation, the measurement cannot be well supported. Thus, further design effort and evaluation is recommended to optimize the solutionwith PCB inductor.
Getting Started Hardware and Software www.ti.com.cn
14 ZHCU657–April 2019
TIDUEO3 — http://www-s.ti.com/sc/techlit/TIDUEO3版权 © 2019, Texas Instruments Incorporated
适用于 AMR 的超低功耗水流测量参考设计
图图 13. 4-Layer Inductor Physical Construction
图图 14. Connection Process of Coils on 4 Different Layers
3.1.6 Simulation Model
A simulation model is provided based on SIMetrix/SIMPLIS, which is an easy-to-use professional tool foranalog circuit design. The model is fast, accurate, and has reliable convergence. With the multi-stepanalysis function, it is very convenient to tune different parameters to achieve better system performance.
www.ti.com.cn Getting Started Hardware and Software
15ZHCU657–April 2019
TIDUEO3 — http://www-s.ti.com/sc/techlit/TIDUEO3版权 © 2019, Texas Instruments Incorporated
适用于 AMR 的超低功耗水流测量参考设计
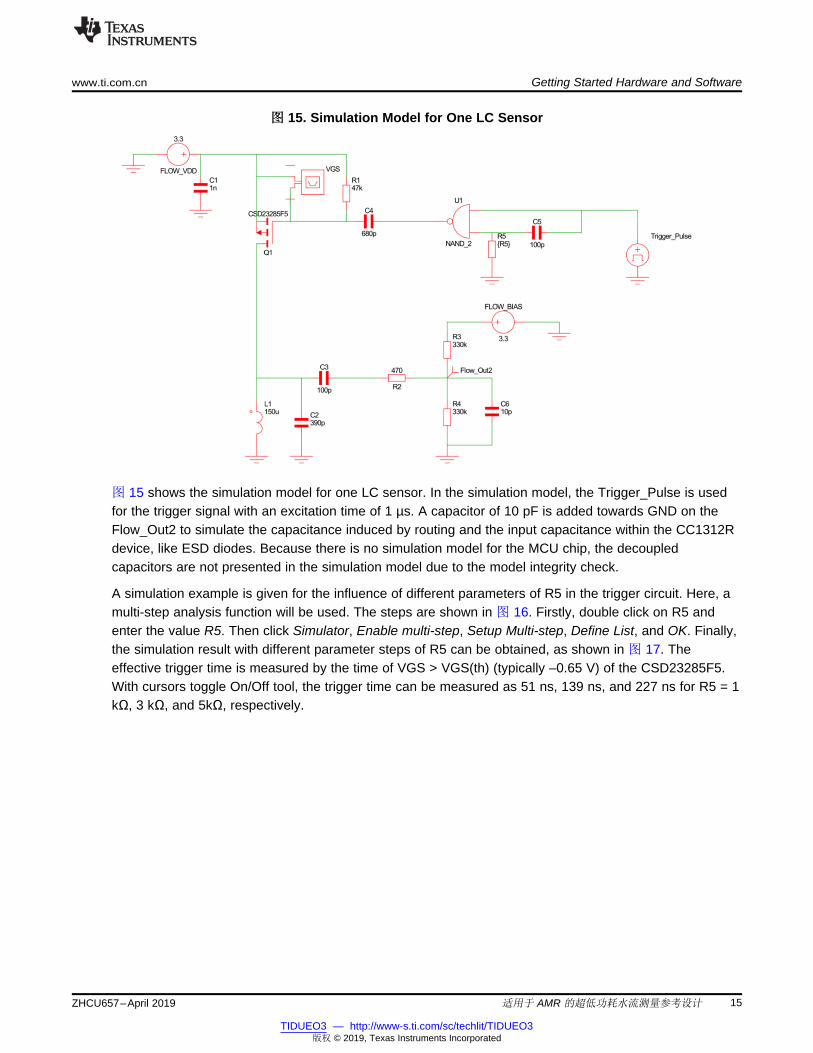
图图 15. Simulation Model for One LC Sensor
图 15 shows the simulation model for one LC sensor. In the simulation model, the Trigger_Pulse is usedfor the trigger signal with an excitation time of 1 µs. A capacitor of 10 pF is added towards GND on theFlow_Out2 to simulate the capacitance induced by routing and the input capacitance within the CC1312Rdevice, like ESD diodes. Because there is no simulation model for the MCU chip, the decoupledcapacitors are not presented in the simulation model due to the model integrity check.
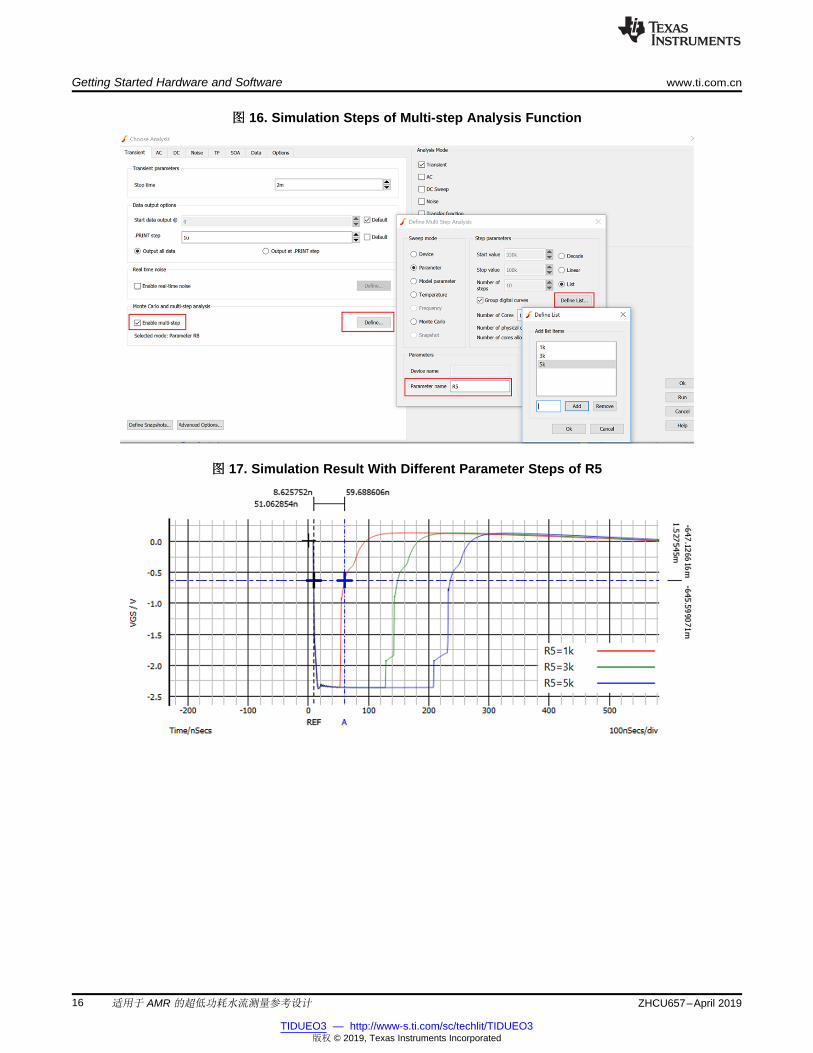
A simulation example is given for the influence of different parameters of R5 in the trigger circuit. Here, amulti-step analysis function will be used. The steps are shown in 图 16. Firstly, double click on R5 andenter the value R5. Then click Simulator, Enable multi-step, Setup Multi-step, Define List, and OK. Finally,the simulation result with different parameter steps of R5 can be obtained, as shown in 图 17. Theeffective trigger time is measured by the time of VGS > VGS(th) (typically –0.65 V) of the CSD23285F5.With cursors toggle On/Off tool, the trigger time can be measured as 51 ns, 139 ns, and 227 ns for R5 = 1kΩ, 3 kΩ, and 5kΩ, respectively.
Getting Started Hardware and Software www.ti.com.cn
16 ZHCU657–April 2019
TIDUEO3 — http://www-s.ti.com/sc/techlit/TIDUEO3版权 © 2019, Texas Instruments Incorporated
适用于 AMR 的超低功耗水流测量参考设计
图图 16. Simulation Steps of Multi-step Analysis Function
图图 17. Simulation Result With Different Parameter Steps of R5

www.ti.com.cn Getting Started Hardware and Software
17ZHCU657–April 2019
TIDUEO3 — http://www-s.ti.com/sc/techlit/TIDUEO3版权 © 2019, Texas Instruments Incorporated
适用于 AMR 的超低功耗水流测量参考设计
3.2 Software
The released software projects for the TIDA-010050 include two parts. The first is a Sensor ControllerStudio (SCS) code for controlling the two LC sensors. The second is a complete CCS source code, whichbuilds upon TI-RTOS and incorporates the SCS code portion. The development tools of SCS version 2.4.0or later and Code Composer Studio (CCS) version 8.2.0 or later are available for free on product pages.Because the design is developed based on the SimpleLink platform, it is necessary to download andinstall SIMPLELINK-CC13X2-26X2-SDK as the source files for the previously mentioned softwareprojects.
Both firmware code projects for SCS and CCS are provided as a single-source code deliverable on theTIDA-010050 tool folder. The CCS source code project contains the SCE project, found in the install path/TIDA-010050_SW/sce/ and named LC_sensor.scp which handles the LC sensing part. Ensure that thesensor controller output project in SCS is saved to the CCS project folder in the Code Generator Panel.How to integrate a sensor controller project into an application can be found in the CC13x2 SimpleLinkAcademy training or SCS Getting Started Guide.
In SCS, it is possible to run the LC sensing project with run-time logging (debug mode), which provides ageneric, easy-to-use environment for evaluating and optimizing performance of tasks while these run atfull speed. After that, CCS code is needed to integrate the task into a fully standalone application andflashed into the chip.
In the TIDA-010050 CCS firmware, the system CPU will wake up for the alert from the sensor controllertask. Whenever the rotation count or error count changes, the CPU will be alerted to indicate the relatedinformation by blinking LEDs.
Initialization with calibration to get the reference DAC value
Enter periodical event
pCalState==0?
Obtain threshold pulse counts for each
channel
N
Generate a 2-bit gray-coded rotation state and
bvRotationUpdate
START
Trigger ALERT interrupt
bvRotationUpdate==0x1? rotationCount-1
Y
bvRotationUpdate==0x2?
N
rotationCount+1
bvRotationUpdate==0x4? errorCount+1
N
Y
Y
END
Y
N
Trigger 2 LC sensors successively and get the pulseCount1/2
pulseCount1/2<threshold orpulseCount1/2> threshold?
combCalState -=1
Y
Getting Started Hardware and Software www.ti.com.cn
18 ZHCU657–April 2019
TIDUEO3 — http://www-s.ti.com/sc/techlit/TIDUEO3版权 © 2019, Texas Instruments Incorporated
适用于 AMR 的超低功耗水流测量参考设计
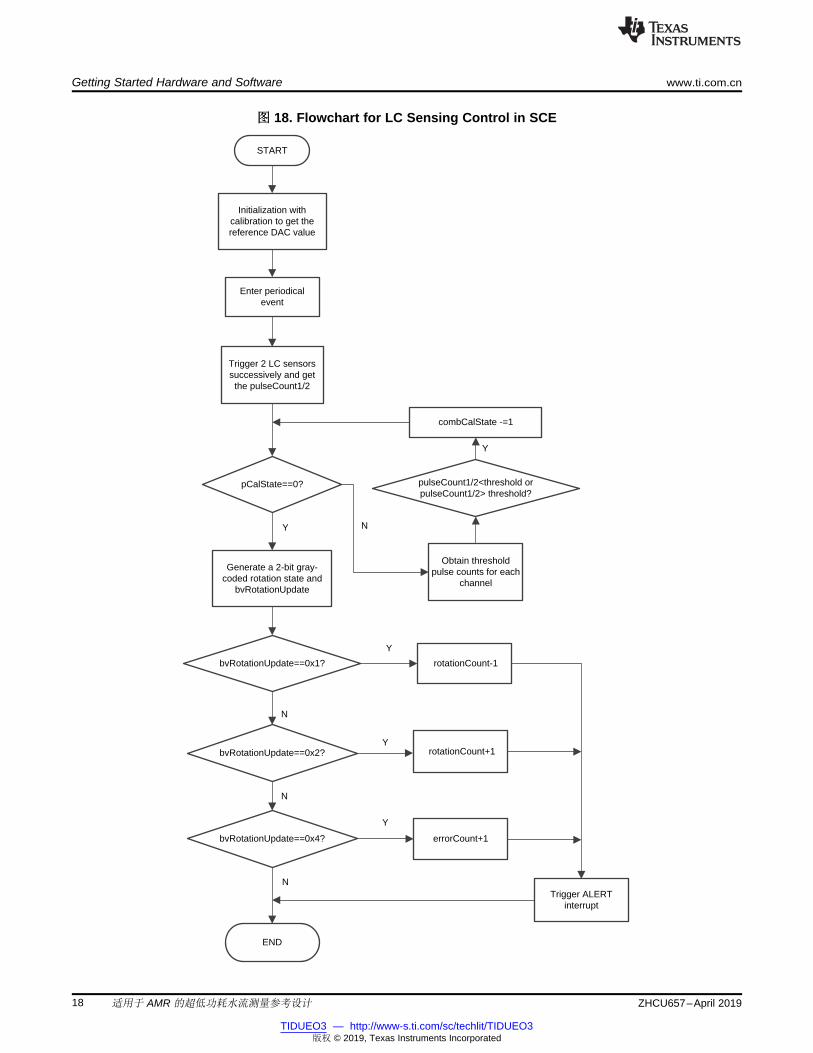
图图 18. Flowchart for LC Sensing Control in SCE
www.ti.com.cn Getting Started Hardware and Software
19ZHCU657–April 2019
TIDUEO3 — http://www-s.ti.com/sc/techlit/TIDUEO3版权 © 2019, Texas Instruments Incorporated
适用于 AMR 的超低功耗水流测量参考设计
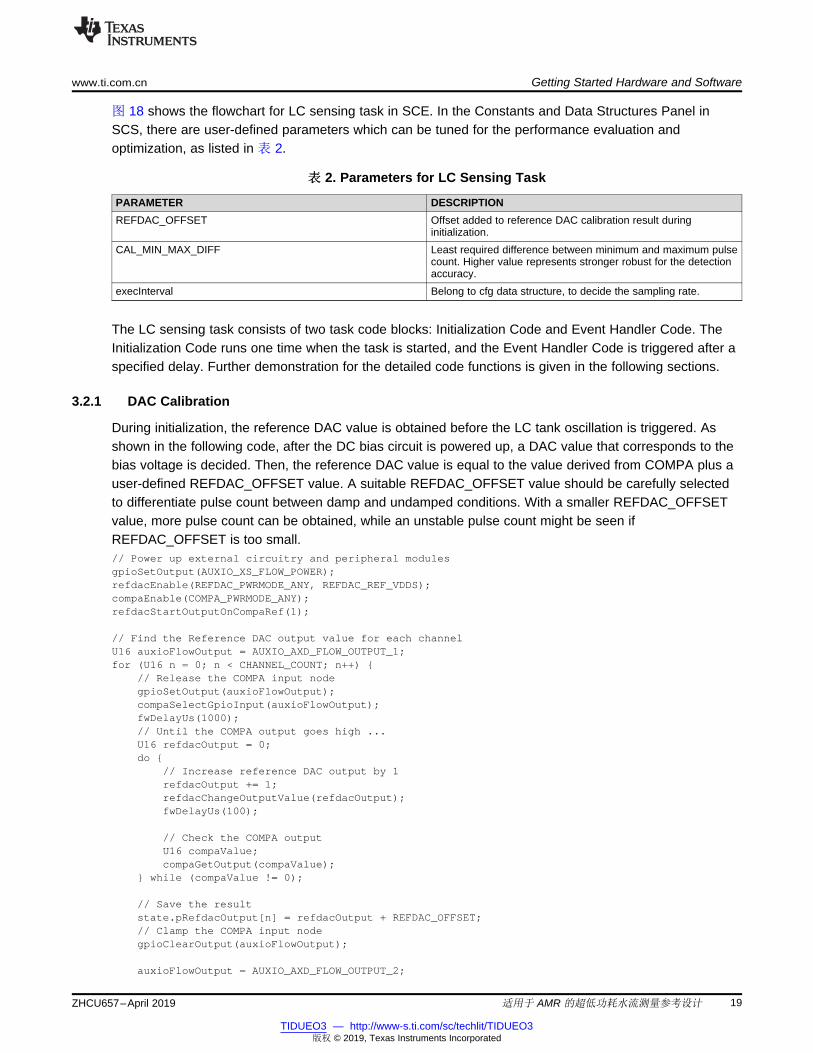
图 18 shows the flowchart for LC sensing task in SCE. In the Constants and Data Structures Panel inSCS, there are user-defined parameters which can be tuned for the performance evaluation andoptimization, as listed in 表 2.
表表 2. Parameters for LC Sensing Task
PARAMETER DESCRIPTIONREFDAC_OFFSET Offset added to reference DAC calibration result during
initialization.CAL_MIN_MAX_DIFF Least required difference between minimum and maximum pulse
count. Higher value represents stronger robust for the detectionaccuracy.
execInterval Belong to cfg data structure, to decide the sampling rate.
The LC sensing task consists of two task code blocks: Initialization Code and Event Handler Code. TheInitialization Code runs one time when the task is started, and the Event Handler Code is triggered after aspecified delay. Further demonstration for the detailed code functions is given in the following sections.
3.2.1 DAC Calibration
During initialization, the reference DAC value is obtained before the LC tank oscillation is triggered. Asshown in the following code, after the DC bias circuit is powered up, a DAC value that corresponds to thebias voltage is decided. Then, the reference DAC value is equal to the value derived from COMPA plus auser-defined REFDAC_OFFSET value. A suitable REFDAC_OFFSET value should be carefully selectedto differentiate pulse count between damp and undamped conditions. With a smaller REFDAC_OFFSETvalue, more pulse count can be obtained, while an unstable pulse count might be seen ifREFDAC_OFFSET is too small.// Power up external circuitry and peripheral modulesgpioSetOutput(AUXIO_XS_FLOW_POWER);refdacEnable(REFDAC_PWRMODE_ANY, REFDAC_REF_VDDS);compaEnable(COMPA_PWRMODE_ANY);refdacStartOutputOnCompaRef(1);
// Find the Reference DAC output value for each channelU16 auxioFlowOutput = AUXIO_AXD_FLOW_OUTPUT_1;for (U16 n = 0; n < CHANNEL_COUNT; n++)
// Release the COMPA input nodegpioSetOutput(auxioFlowOutput);compaSelectGpioInput(auxioFlowOutput);fwDelayUs(1000);// Until the COMPA output goes high ...U16 refdacOutput = 0;do
// Increase reference DAC output by 1refdacOutput += 1;refdacChangeOutputValue(refdacOutput);fwDelayUs(100);
// Check the COMPA outputU16 compaValue;compaGetOutput(compaValue);
while (compaValue != 0);
// Save the resultstate.pRefdacOutput[n] = refdacOutput + REFDAC_OFFSET;// Clamp the COMPA input nodegpioClearOutput(auxioFlowOutput);
auxioFlowOutput = AUXIO_AXD_FLOW_OUTPUT_2;
Getting Started Hardware and Software www.ti.com.cn
20 ZHCU657–April 2019
TIDUEO3 — http://www-s.ti.com/sc/techlit/TIDUEO3版权 © 2019, Texas Instruments Incorporated
适用于 AMR 的超低功耗水流测量参考设计
// Power down external circuitry and peripheral modulesgpioClearOutput(AUXIO_XS_FLOW_POWER);
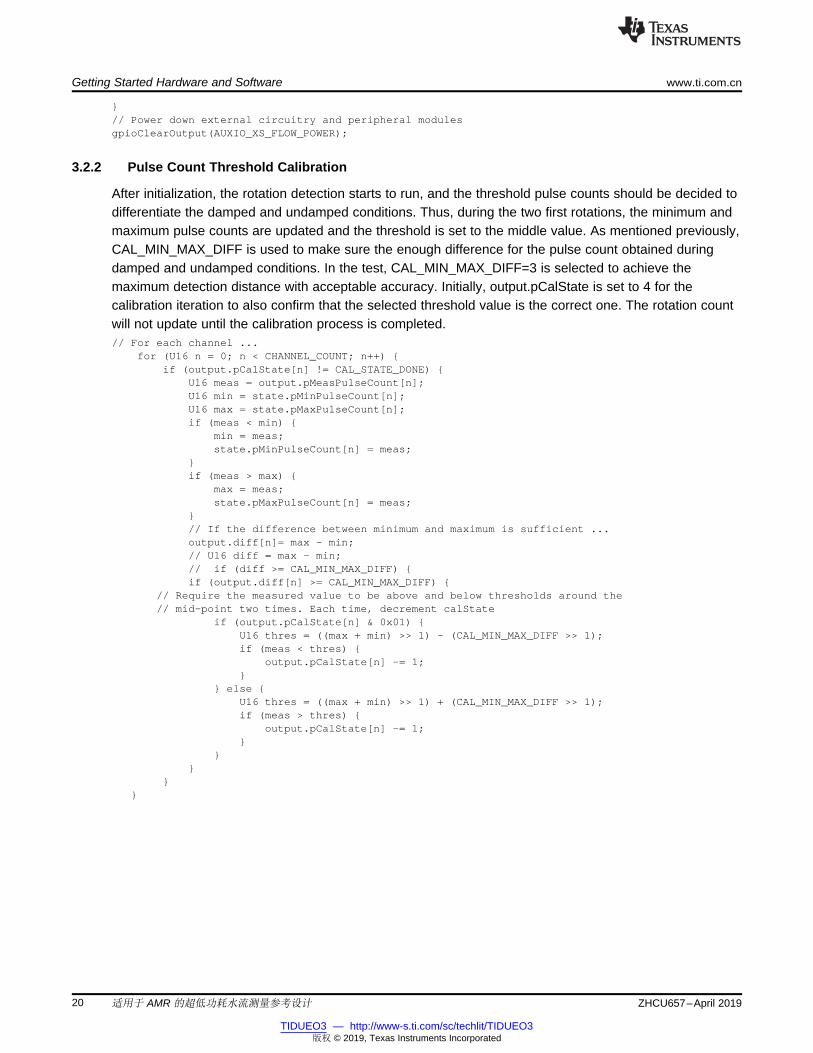
3.2.2 Pulse Count Threshold Calibration
After initialization, the rotation detection starts to run, and the threshold pulse counts should be decided todifferentiate the damped and undamped conditions. Thus, during the two first rotations, the minimum andmaximum pulse counts are updated and the threshold is set to the middle value. As mentioned previously,CAL_MIN_MAX_DIFF is used to make sure the enough difference for the pulse count obtained duringdamped and undamped conditions. In the test, CAL_MIN_MAX_DIFF=3 is selected to achieve themaximum detection distance with acceptable accuracy. Initially, output.pCalState is set to 4 for thecalibration iteration to also confirm that the selected threshold value is the correct one. The rotation countwill not update until the calibration process is completed.// For each channel ...
for (U16 n = 0; n < CHANNEL_COUNT; n++) if (output.pCalState[n] != CAL_STATE_DONE)
U16 meas = output.pMeasPulseCount[n];U16 min = state.pMinPulseCount[n];U16 max = state.pMaxPulseCount[n];if (meas < min)
min = meas;state.pMinPulseCount[n] = meas;
if (meas > max)
max = meas;state.pMaxPulseCount[n] = meas;
// If the difference between minimum and maximum is sufficient ...output.diff[n]= max - min;// U16 diff = max - min;// if (diff >= CAL_MIN_MAX_DIFF) if (output.diff[n] >= CAL_MIN_MAX_DIFF)
// Require the measured value to be above and below thresholds around the// mid-point two times. Each time, decrement calState
if (output.pCalState[n] & 0x01) U16 thres = ((max + min) >> 1) - (CAL_MIN_MAX_DIFF >> 1);if (meas < thres)
output.pCalState[n] -= 1;
else U16 thres = ((max + min) >> 1) + (CAL_MIN_MAX_DIFF >> 1);if (meas > thres)
output.pCalState[n] -= 1;
www.ti.com.cn Getting Started Hardware and Software
21ZHCU657–April 2019
TIDUEO3 — http://www-s.ti.com/sc/techlit/TIDUEO3版权 © 2019, Texas Instruments Incorporated
适用于 AMR 的超低功耗水流测量参考设计
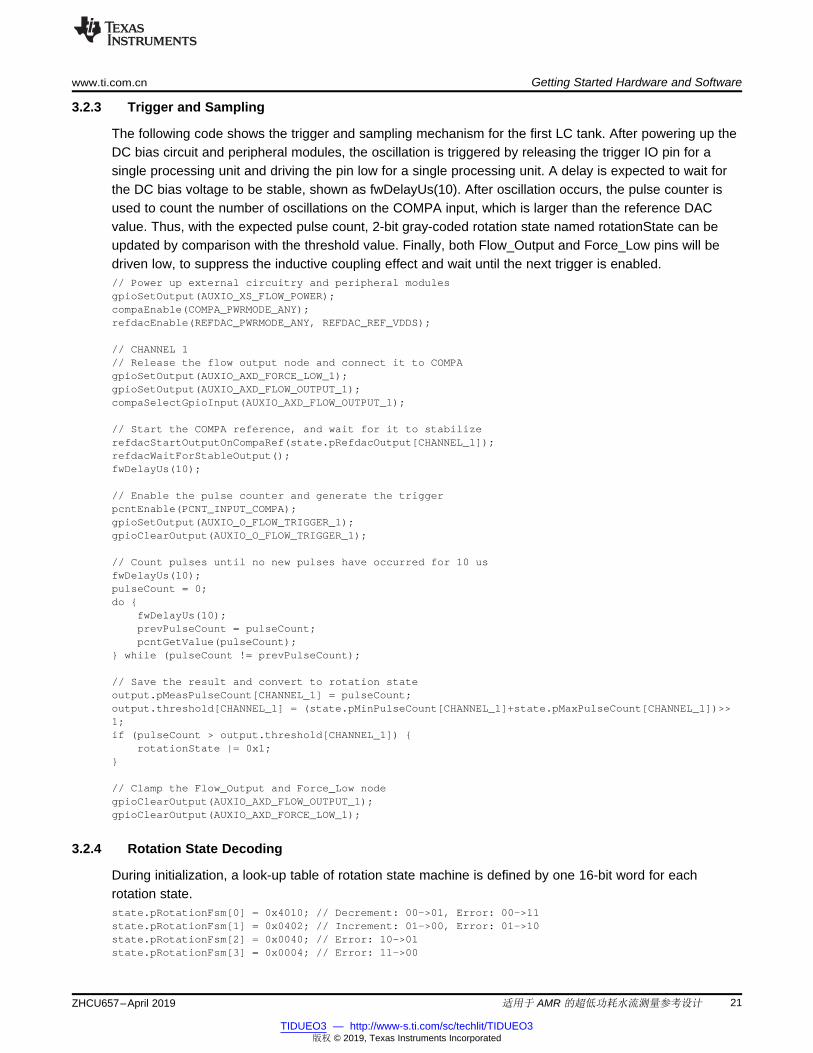
3.2.3 Trigger and Sampling
The following code shows the trigger and sampling mechanism for the first LC tank. After powering up theDC bias circuit and peripheral modules, the oscillation is triggered by releasing the trigger IO pin for asingle processing unit and driving the pin low for a single processing unit. A delay is expected to wait forthe DC bias voltage to be stable, shown as fwDelayUs(10). After oscillation occurs, the pulse counter isused to count the number of oscillations on the COMPA input, which is larger than the reference DACvalue. Thus, with the expected pulse count, 2-bit gray-coded rotation state named rotationState can beupdated by comparison with the threshold value. Finally, both Flow_Output and Force_Low pins will bedriven low, to suppress the inductive coupling effect and wait until the next trigger is enabled.// Power up external circuitry and peripheral modulesgpioSetOutput(AUXIO_XS_FLOW_POWER);compaEnable(COMPA_PWRMODE_ANY);refdacEnable(REFDAC_PWRMODE_ANY, REFDAC_REF_VDDS);
// CHANNEL 1// Release the flow output node and connect it to COMPAgpioSetOutput(AUXIO_AXD_FORCE_LOW_1);gpioSetOutput(AUXIO_AXD_FLOW_OUTPUT_1);compaSelectGpioInput(AUXIO_AXD_FLOW_OUTPUT_1);
// Start the COMPA reference, and wait for it to stabilizerefdacStartOutputOnCompaRef(state.pRefdacOutput[CHANNEL_1]);refdacWaitForStableOutput();fwDelayUs(10);
// Enable the pulse counter and generate the triggerpcntEnable(PCNT_INPUT_COMPA);gpioSetOutput(AUXIO_O_FLOW_TRIGGER_1);gpioClearOutput(AUXIO_O_FLOW_TRIGGER_1);
// Count pulses until no new pulses have occurred for 10 usfwDelayUs(10);pulseCount = 0;do
fwDelayUs(10);prevPulseCount = pulseCount;pcntGetValue(pulseCount);
while (pulseCount != prevPulseCount);
// Save the result and convert to rotation stateoutput.pMeasPulseCount[CHANNEL_1] = pulseCount;output.threshold[CHANNEL_1] = (state.pMinPulseCount[CHANNEL_1]+state.pMaxPulseCount[CHANNEL_1])>>1;if (pulseCount > output.threshold[CHANNEL_1])
rotationState |= 0x1;
// Clamp the Flow_Output and Force_Low nodegpioClearOutput(AUXIO_AXD_FLOW_OUTPUT_1);gpioClearOutput(AUXIO_AXD_FORCE_LOW_1);
3.2.4 Rotation State Decoding
During initialization, a look-up table of rotation state machine is defined by one 16-bit word for eachrotation state.state.pRotationFsm[0] = 0x4010; // Decrement: 00->01, Error: 00->11state.pRotationFsm[1] = 0x0402; // Increment: 01->00, Error: 01->10state.pRotationFsm[2] = 0x0040; // Error: 10->01state.pRotationFsm[3] = 0x0004; // Error: 11->00
Getting Started Hardware and Software www.ti.com.cn
22 ZHCU657–April 2019
TIDUEO3 — http://www-s.ti.com/sc/techlit/TIDUEO3版权 © 2019, Texas Instruments Incorporated
适用于 AMR 的超低功耗水流测量参考设计
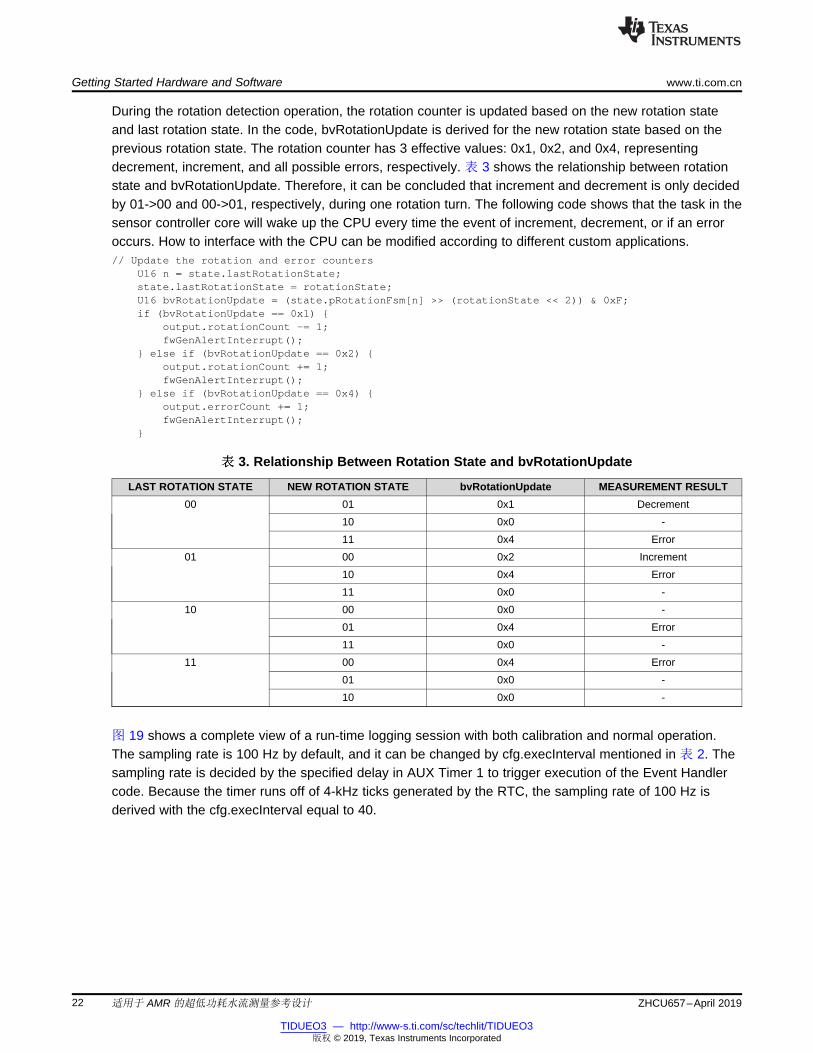
During the rotation detection operation, the rotation counter is updated based on the new rotation stateand last rotation state. In the code, bvRotationUpdate is derived for the new rotation state based on theprevious rotation state. The rotation counter has 3 effective values: 0x1, 0x2, and 0x4, representingdecrement, increment, and all possible errors, respectively. 表 3 shows the relationship between rotationstate and bvRotationUpdate. Therefore, it can be concluded that increment and decrement is only decidedby 01->00 and 00->01, respectively, during one rotation turn. The following code shows that the task in thesensor controller core will wake up the CPU every time the event of increment, decrement, or if an erroroccurs. How to interface with the CPU can be modified according to different custom applications.// Update the rotation and error counters
U16 n = state.lastRotationState;state.lastRotationState = rotationState;U16 bvRotationUpdate = (state.pRotationFsm[n] >> (rotationState << 2)) & 0xF;if (bvRotationUpdate == 0x1)
output.rotationCount -= 1;fwGenAlertInterrupt();
else if (bvRotationUpdate == 0x2) output.rotationCount += 1;fwGenAlertInterrupt();
else if (bvRotationUpdate == 0x4) output.errorCount += 1;fwGenAlertInterrupt();
表表 3. Relationship Between Rotation State and bvRotationUpdate
LAST ROTATION STATE NEW ROTATION STATE bvRotationUpdate MEASUREMENT RESULT00 01 0x1 Decrement
10 0x0 -11 0x4 Error
01 00 0x2 Increment10 0x4 Error11 0x0 -
10 00 0x0 -01 0x4 Error11 0x0 -
11 00 0x4 Error01 0x0 -10 0x0 -
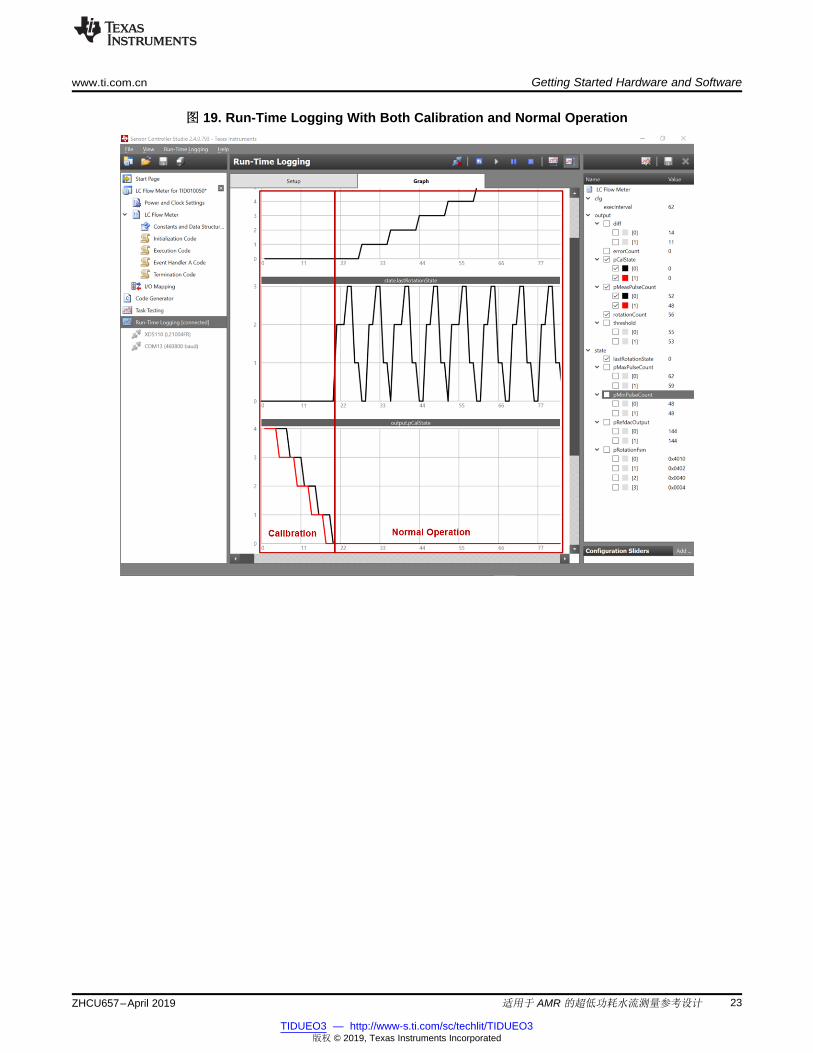
图 19 shows a complete view of a run-time logging session with both calibration and normal operation.The sampling rate is 100 Hz by default, and it can be changed by cfg.execInterval mentioned in 表 2. Thesampling rate is decided by the specified delay in AUX Timer 1 to trigger execution of the Event Handlercode. Because the timer runs off of 4-kHz ticks generated by the RTC, the sampling rate of 100 Hz isderived with the cfg.execInterval equal to 40.
www.ti.com.cn Getting Started Hardware and Software
23ZHCU657–April 2019
TIDUEO3 — http://www-s.ti.com/sc/techlit/TIDUEO3版权 © 2019, Texas Instruments Incorporated
适用于 AMR 的超低功耗水流测量参考设计
图图 19. Run-Time Logging With Both Calibration and Normal Operation
Testing and Results www.ti.com.cn
24 ZHCU657–April 2019
TIDUEO3 — http://www-s.ti.com/sc/techlit/TIDUEO3版权 © 2019, Texas Instruments Incorporated
适用于 AMR 的超低功耗水流测量参考设计
4 Testing and Results
4.1 Test Setup
4.1.1 Rotation Measurements Setup
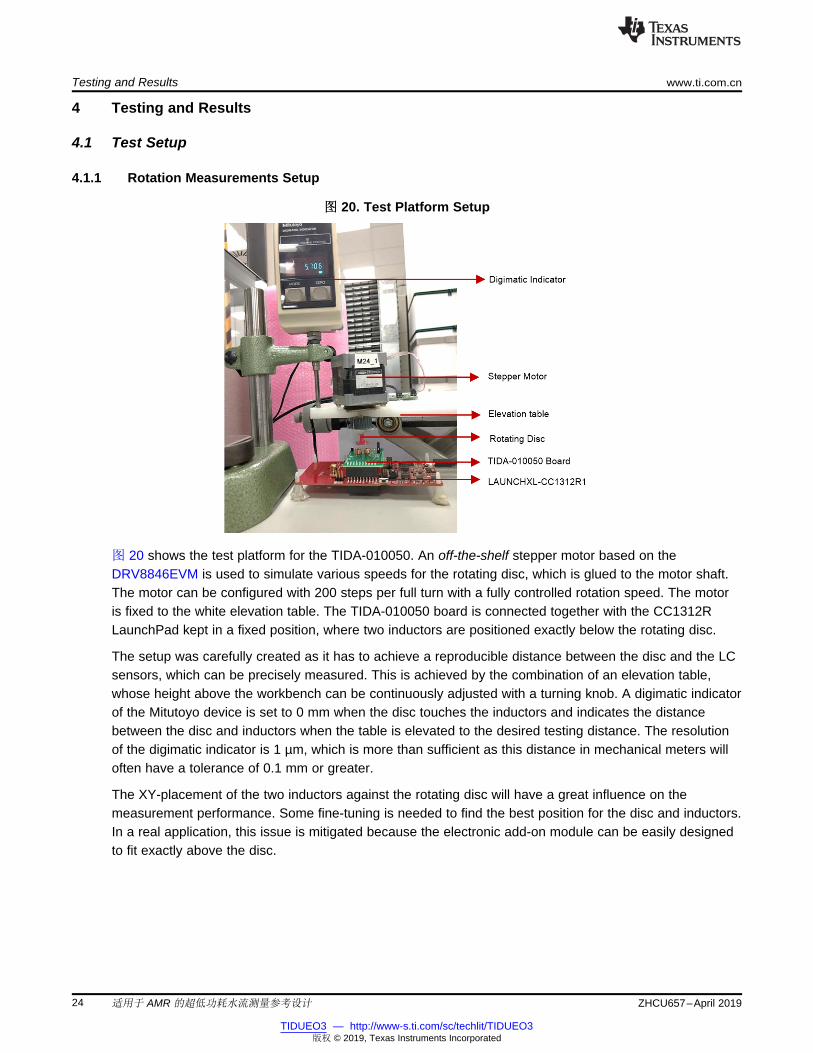
图图 20. Test Platform Setup
图 20 shows the test platform for the TIDA-010050. An off-the-shelf stepper motor based on theDRV8846EVM is used to simulate various speeds for the rotating disc, which is glued to the motor shaft.The motor can be configured with 200 steps per full turn with a fully controlled rotation speed. The motoris fixed to the white elevation table. The TIDA-010050 board is connected together with the CC1312RLaunchPad kept in a fixed position, where two inductors are positioned exactly below the rotating disc.
The setup was carefully created as it has to achieve a reproducible distance between the disc and the LCsensors, which can be precisely measured. This is achieved by the combination of an elevation table,whose height above the workbench can be continuously adjusted with a turning knob. A digimatic indicatorof the Mitutoyo device is set to 0 mm when the disc touches the inductors and indicates the distancebetween the disc and inductors when the table is elevated to the desired testing distance. The resolutionof the digimatic indicator is 1 µm, which is more than sufficient as this distance in mechanical meters willoften have a tolerance of 0.1 mm or greater.
The XY-placement of the two inductors against the rotating disc will have a great influence on themeasurement performance. Some fine-tuning is needed to find the best position for the disc and inductors.In a real application, this issue is mitigated because the electronic add-on module can be easily designedto fit exactly above the disc.
www.ti.com.cn Testing and Results
25ZHCU657–April 2019
TIDUEO3 — http://www-s.ti.com/sc/techlit/TIDUEO3版权 © 2019, Texas Instruments Incorporated
适用于 AMR 的超低功耗水流测量参考设计
4.1.2 Board Configuration
The recommended evaluation step is to run the example first in the run-time logging panel in SCS andcheck that it works as expected with the rotating disc. The rotation measurement accuracy can beevaluated. After that, the board can be tested without an on-board XDS debugger using a USB connector,with external power supply instead, to obtain the power consumption data accurately. Thus, there arethree different board configuration options during the test.
4.1.2.1 Test With Run-Time Logging Powered by USB
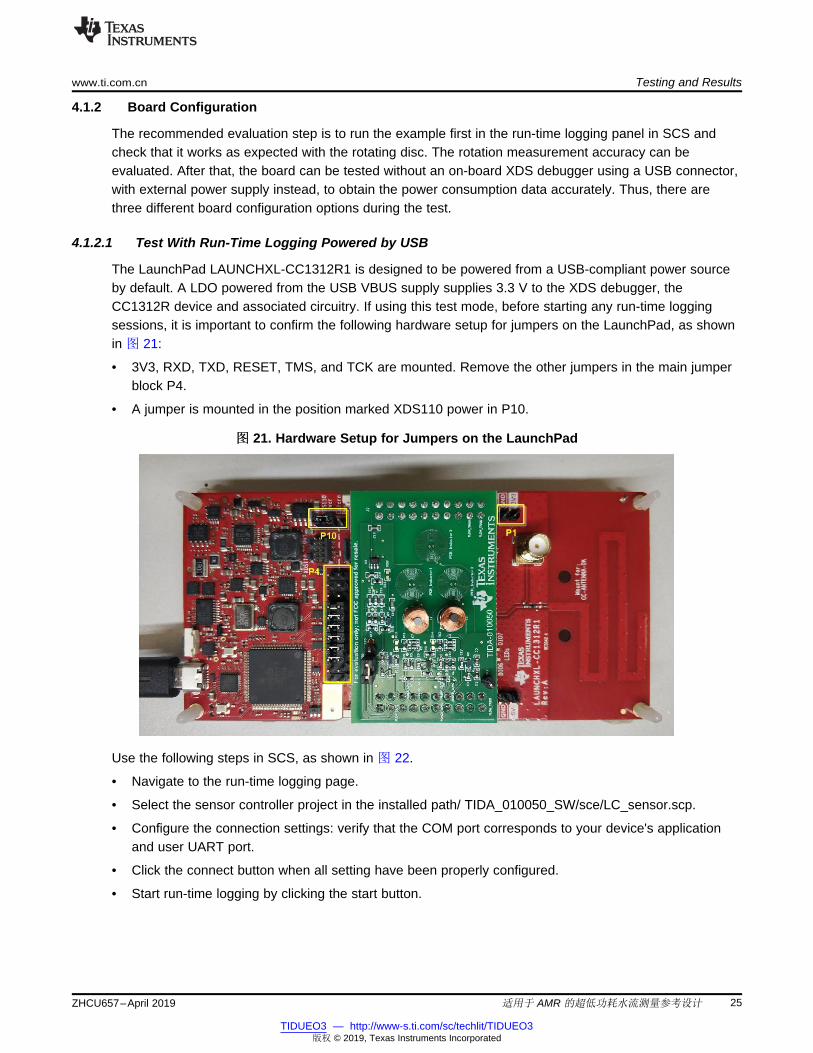
The LaunchPad LAUNCHXL-CC1312R1 is designed to be powered from a USB-compliant power sourceby default. A LDO powered from the USB VBUS supply supplies 3.3 V to the XDS debugger, theCC1312R device and associated circuitry. If using this test mode, before starting any run-time loggingsessions, it is important to confirm the following hardware setup for jumpers on the LaunchPad, as shownin 图 21:
• 3V3, RXD, TXD, RESET, TMS, and TCK are mounted. Remove the other jumpers in the main jumperblock P4.
• A jumper is mounted in the position marked XDS110 power in P10.
图图 21. Hardware Setup for Jumpers on the LaunchPad
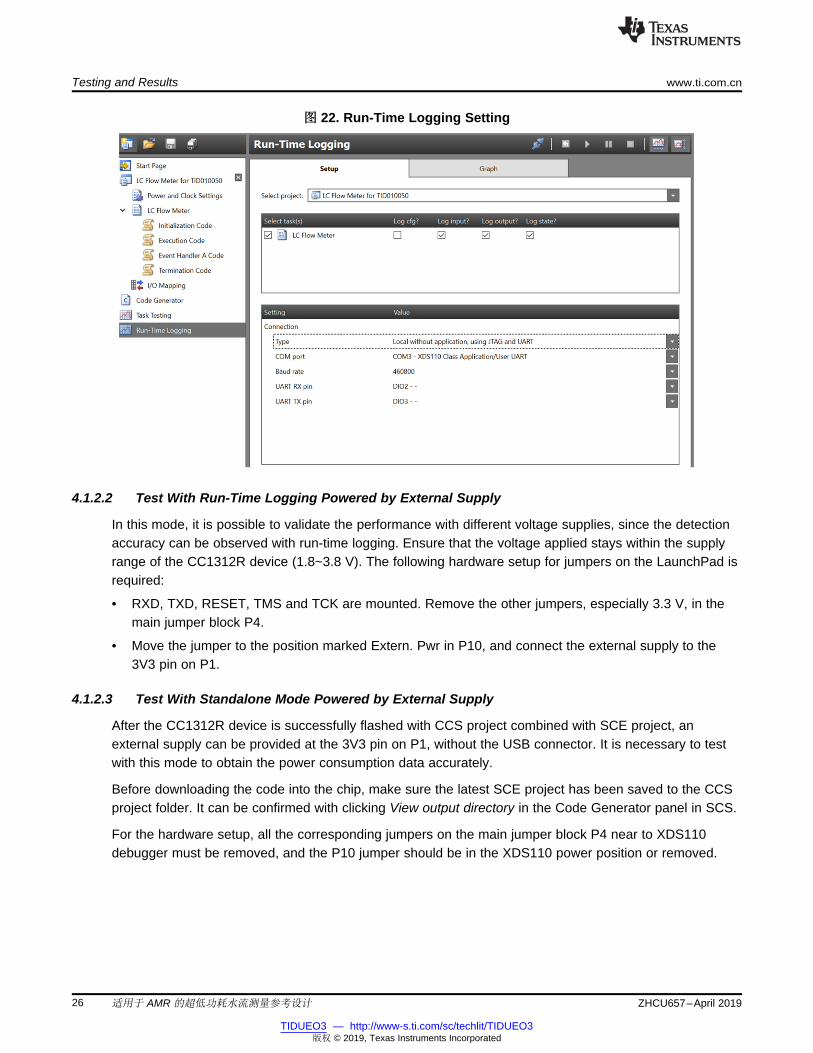
Use the following steps in SCS, as shown in 图 22.
• Navigate to the run-time logging page.
• Select the sensor controller project in the installed path/ TIDA_010050_SW/sce/LC_sensor.scp.
• Configure the connection settings: verify that the COM port corresponds to your device's applicationand user UART port.
• Click the connect button when all setting have been properly configured.
• Start run-time logging by clicking the start button.
Testing and Results www.ti.com.cn
26 ZHCU657–April 2019
TIDUEO3 — http://www-s.ti.com/sc/techlit/TIDUEO3版权 © 2019, Texas Instruments Incorporated
适用于 AMR 的超低功耗水流测量参考设计
图图 22. Run-Time Logging Setting
4.1.2.2 Test With Run-Time Logging Powered by External Supply
In this mode, it is possible to validate the performance with different voltage supplies, since the detectionaccuracy can be observed with run-time logging. Ensure that the voltage applied stays within the supplyrange of the CC1312R device (1.8~3.8 V). The following hardware setup for jumpers on the LaunchPad isrequired:
• RXD, TXD, RESET, TMS and TCK are mounted. Remove the other jumpers, especially 3.3 V, in themain jumper block P4.
• Move the jumper to the position marked Extern. Pwr in P10, and connect the external supply to the3V3 pin on P1.
4.1.2.3 Test With Standalone Mode Powered by External Supply
After the CC1312R device is successfully flashed with CCS project combined with SCE project, anexternal supply can be provided at the 3V3 pin on P1, without the USB connector. It is necessary to testwith this mode to obtain the power consumption data accurately.
Before downloading the code into the chip, make sure the latest SCE project has been saved to the CCSproject folder. It can be confirmed with clicking View output directory in the Code Generator panel in SCS.
For the hardware setup, all the corresponding jumpers on the main jumper block P4 near to XDS110debugger must be removed, and the P10 jumper should be in the XDS110 power position or removed.
www.ti.com.cn Testing and Results
27ZHCU657–April 2019
TIDUEO3 — http://www-s.ti.com/sc/techlit/TIDUEO3版权 © 2019, Texas Instruments Incorporated
适用于 AMR 的超低功耗水流测量参考设计
4.2 Test Results
4.2.1 Power Consumption Measurements
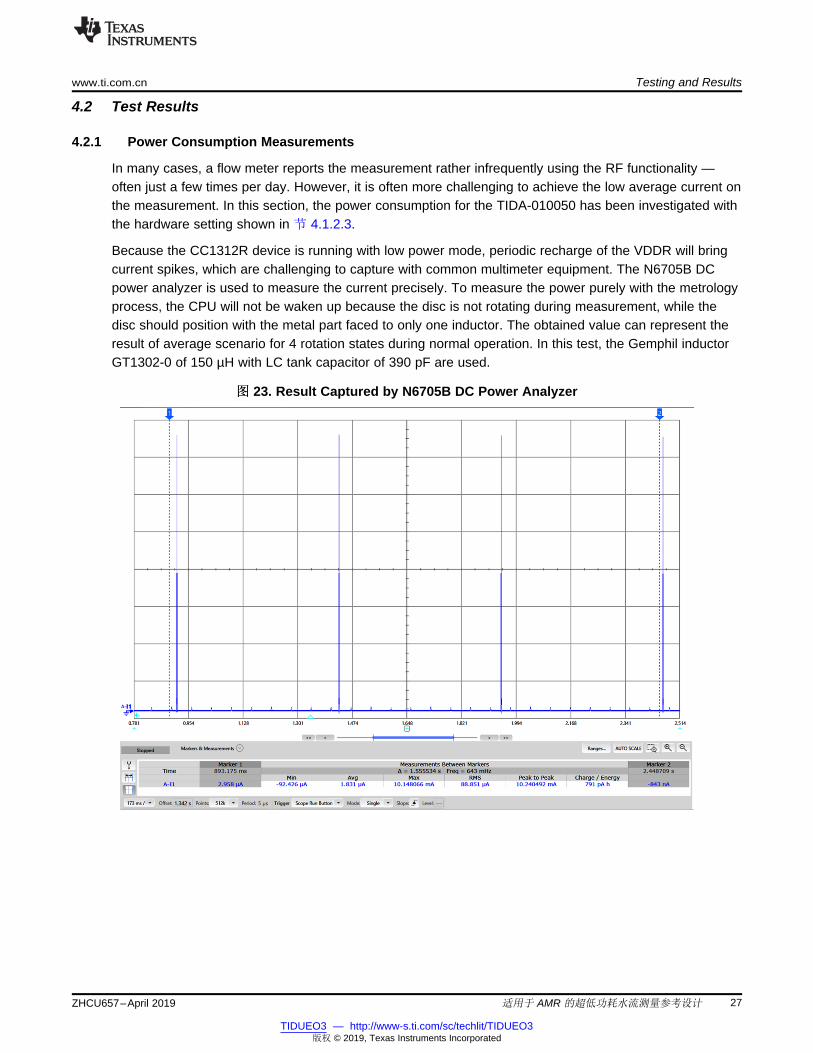
In many cases, a flow meter reports the measurement rather infrequently using the RF functionality —often just a few times per day. However, it is often more challenging to achieve the low average current onthe measurement. In this section, the power consumption for the TIDA-010050 has been investigated withthe hardware setting shown in 节 4.1.2.3.
Because the CC1312R device is running with low power mode, periodic recharge of the VDDR will bringcurrent spikes, which are challenging to capture with common multimeter equipment. The N6705B DCpower analyzer is used to measure the current precisely. To measure the power purely with the metrologyprocess, the CPU will not be waken up because the disc is not rotating during measurement, while thedisc should position with the metal part faced to only one inductor. The obtained value can represent theresult of average scenario for 4 rotation states during normal operation. In this test, the Gemphil inductorGT1302-0 of 150 µH with LC tank capacitor of 390 pF are used.
图图 23. Result Captured by N6705B DC Power Analyzer
Testing and Results www.ti.com.cn
28 ZHCU657–April 2019
TIDUEO3 — http://www-s.ti.com/sc/techlit/TIDUEO3版权 © 2019, Texas Instruments Incorporated
适用于 AMR 的超低功耗水流测量参考设计
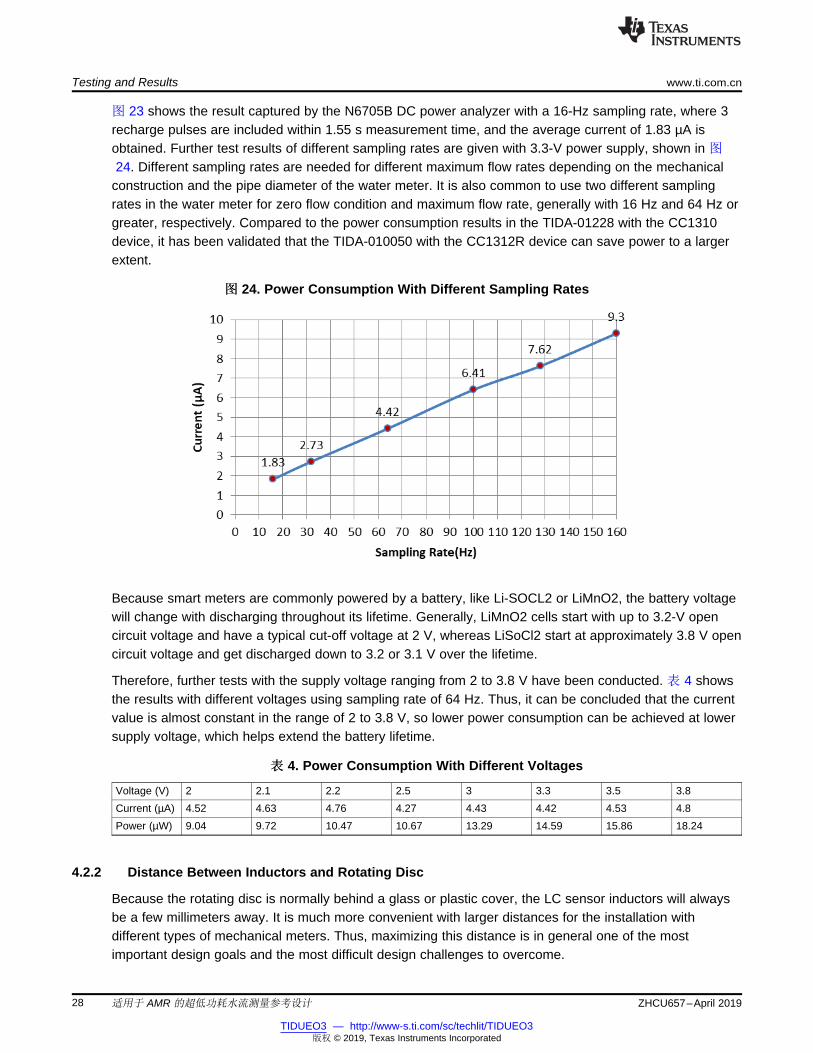
图 23 shows the result captured by the N6705B DC power analyzer with a 16-Hz sampling rate, where 3recharge pulses are included within 1.55 s measurement time, and the average current of 1.83 µA isobtained. Further test results of different sampling rates are given with 3.3-V power supply, shown in 图
24. Different sampling rates are needed for different maximum flow rates depending on the mechanicalconstruction and the pipe diameter of the water meter. It is also common to use two different samplingrates in the water meter for zero flow condition and maximum flow rate, generally with 16 Hz and 64 Hz orgreater, respectively. Compared to the power consumption results in the TIDA-01228 with the CC1310device, it has been validated that the TIDA-010050 with the CC1312R device can save power to a largerextent.
图图 24. Power Consumption With Different Sampling Rates
Because smart meters are commonly powered by a battery, like Li-SOCL2 or LiMnO2, the battery voltagewill change with discharging throughout its lifetime. Generally, LiMnO2 cells start with up to 3.2-V opencircuit voltage and have a typical cut-off voltage at 2 V, whereas LiSoCl2 start at approximately 3.8 V opencircuit voltage and get discharged down to 3.2 or 3.1 V over the lifetime.
Therefore, further tests with the supply voltage ranging from 2 to 3.8 V have been conducted. 表 4 showsthe results with different voltages using sampling rate of 64 Hz. Thus, it can be concluded that the currentvalue is almost constant in the range of 2 to 3.8 V, so lower power consumption can be achieved at lowersupply voltage, which helps extend the battery lifetime.
表表 4. Power Consumption With Different Voltages
Voltage (V) 2 2.1 2.2 2.5 3 3.3 3.5 3.8Current (µA) 4.52 4.63 4.76 4.27 4.43 4.42 4.53 4.8Power (µW) 9.04 9.72 10.47 10.67 13.29 14.59 15.86 18.24
4.2.2 Distance Between Inductors and Rotating Disc
Because the rotating disc is normally behind a glass or plastic cover, the LC sensor inductors will alwaysbe a few millimeters away. It is much more convenient with larger distances for the installation withdifferent types of mechanical meters. Thus, maximizing this distance is in general one of the mostimportant design goals and the most difficult design challenges to overcome.
www.ti.com.cn Testing and Results
29ZHCU657–April 2019
TIDUEO3 — http://www-s.ti.com/sc/techlit/TIDUEO3版权 © 2019, Texas Instruments Incorporated
适用于 AMR 的超低功耗水流测量参考设计
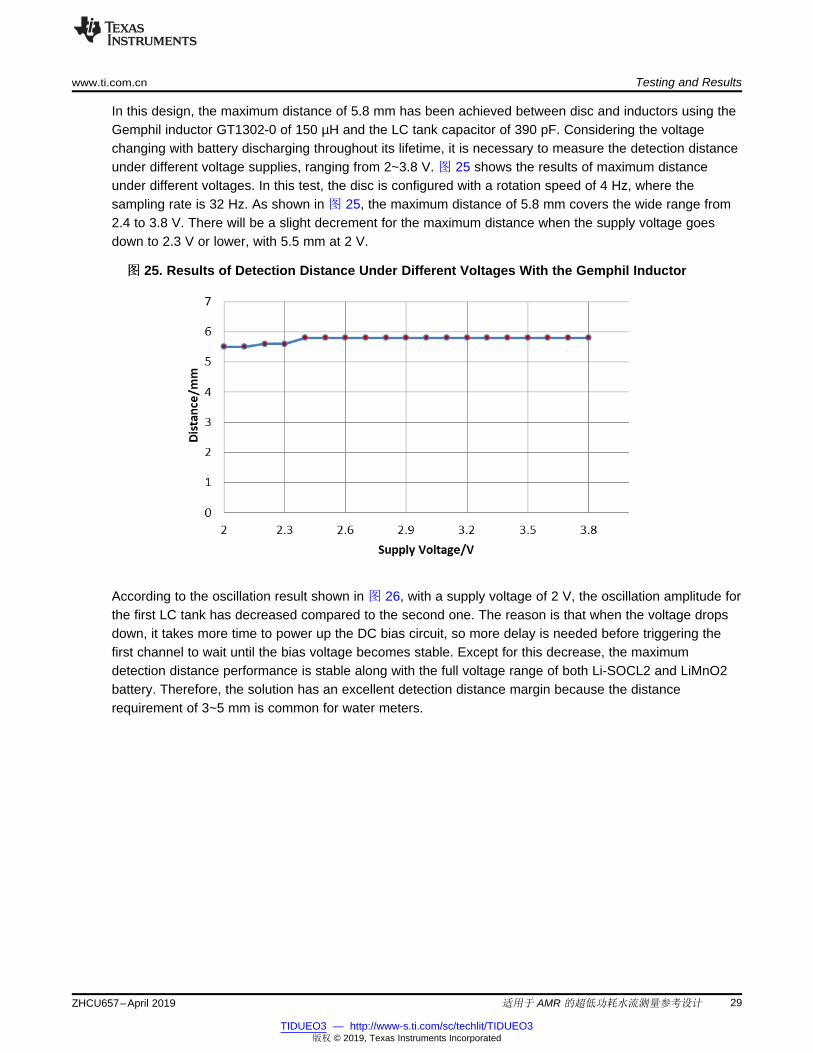
In this design, the maximum distance of 5.8 mm has been achieved between disc and inductors using theGemphil inductor GT1302-0 of 150 µH and the LC tank capacitor of 390 pF. Considering the voltagechanging with battery discharging throughout its lifetime, it is necessary to measure the detection distanceunder different voltage supplies, ranging from 2~3.8 V. 图 25 shows the results of maximum distanceunder different voltages. In this test, the disc is configured with a rotation speed of 4 Hz, where thesampling rate is 32 Hz. As shown in 图 25, the maximum distance of 5.8 mm covers the wide range from2.4 to 3.8 V. There will be a slight decrement for the maximum distance when the supply voltage goesdown to 2.3 V or lower, with 5.5 mm at 2 V.
图图 25. Results of Detection Distance Under Different Voltages With the Gemphil Inductor
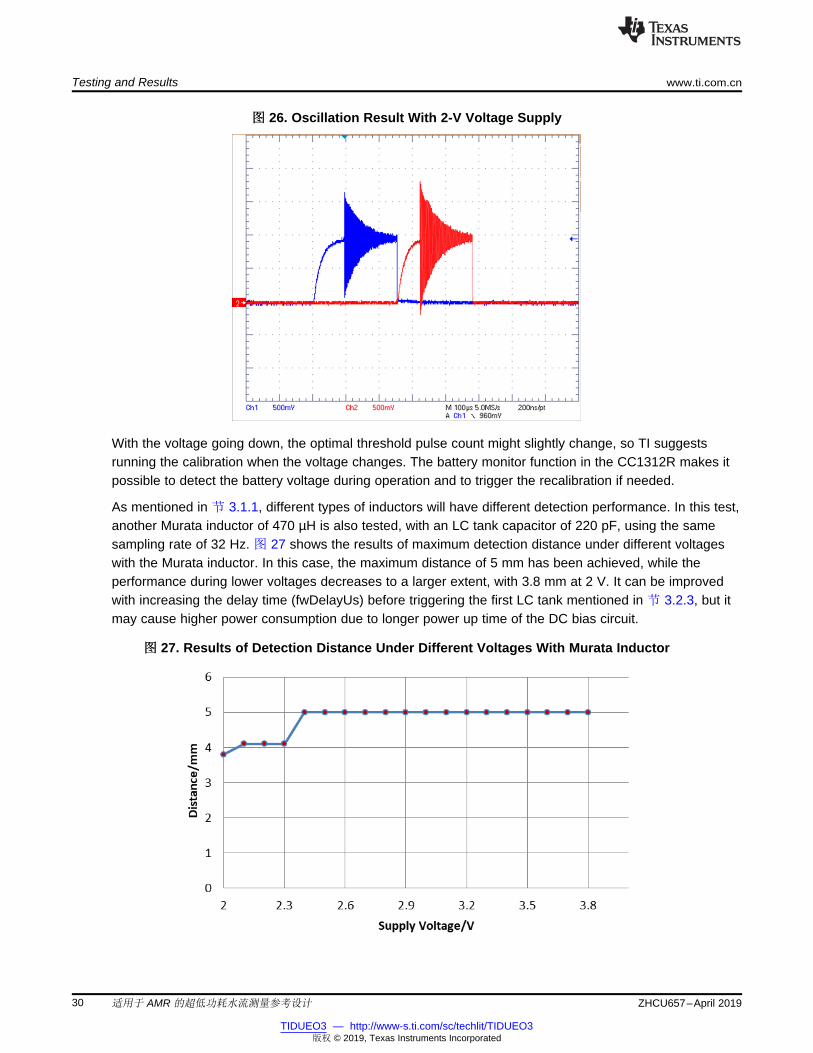
According to the oscillation result shown in 图 26, with a supply voltage of 2 V, the oscillation amplitude forthe first LC tank has decreased compared to the second one. The reason is that when the voltage dropsdown, it takes more time to power up the DC bias circuit, so more delay is needed before triggering thefirst channel to wait until the bias voltage becomes stable. Except for this decrease, the maximumdetection distance performance is stable along with the full voltage range of both Li-SOCL2 and LiMnO2battery. Therefore, the solution has an excellent detection distance margin because the distancerequirement of 3~5 mm is common for water meters.
Testing and Results www.ti.com.cn
30 ZHCU657–April 2019
TIDUEO3 — http://www-s.ti.com/sc/techlit/TIDUEO3版权 © 2019, Texas Instruments Incorporated
适用于 AMR 的超低功耗水流测量参考设计
图图 26. Oscillation Result With 2-V Voltage Supply
With the voltage going down, the optimal threshold pulse count might slightly change, so TI suggestsrunning the calibration when the voltage changes. The battery monitor function in the CC1312R makes itpossible to detect the battery voltage during operation and to trigger the recalibration if needed.
As mentioned in 节 3.1.1, different types of inductors will have different detection performance. In this test,another Murata inductor of 470 µH is also tested, with an LC tank capacitor of 220 pF, using the samesampling rate of 32 Hz. 图 27 shows the results of maximum detection distance under different voltageswith the Murata inductor. In this case, the maximum distance of 5 mm has been achieved, while theperformance during lower voltages decreases to a larger extent, with 3.8 mm at 2 V. It can be improvedwith increasing the delay time (fwDelayUs) before triggering the first LC tank mentioned in 节 3.2.3, but itmay cause higher power consumption due to longer power up time of the DC bias circuit.
图图 27. Results of Detection Distance Under Different Voltages With Murata Inductor
www.ti.com.cn Testing and Results
31ZHCU657–April 2019
TIDUEO3 — http://www-s.ti.com/sc/techlit/TIDUEO3版权 © 2019, Texas Instruments Incorporated
适用于 AMR 的超低功耗水流测量参考设计
4.2.3 Rotation Measurement Accuracy
Using the DRV8846EVM and a standard stepper motor with 200 steps per full rotation, it is possible to testdifferent turning speeds from 1 turn to 10 turns per second (1 Hz~10 Hz) to simulate the disc rotation offlow meters. To detect the rotation number under different rotational frequencies, the LC sensor shouldadjust the sampling rate accordingly. Meanwhile, as mentioned previously, an increasing sampling rate willcause higher power consumption, so a minimum sampling rate should be derived.
According to EN ISO 4064-1:2014-11 – 1/3, a water meter shall be designed with the ratio of highest andlowest flow rate, which is selected in the defined list, generally 40, 80, 100, and so forth. Thus, with theflow rate varies in different water usage conditions, the measurement accuracy should meet therequirement at highest flow rate with the required minimum sampling rate.
Use the following equation for the minimum sampling rate calculation of a system with two sensors and a180° covered plate:
(2)
In 公式 2, θ represents the angle between the two sensors (in this case, 90°). The parameter 2 representsoversample to guarantee the accuracy.
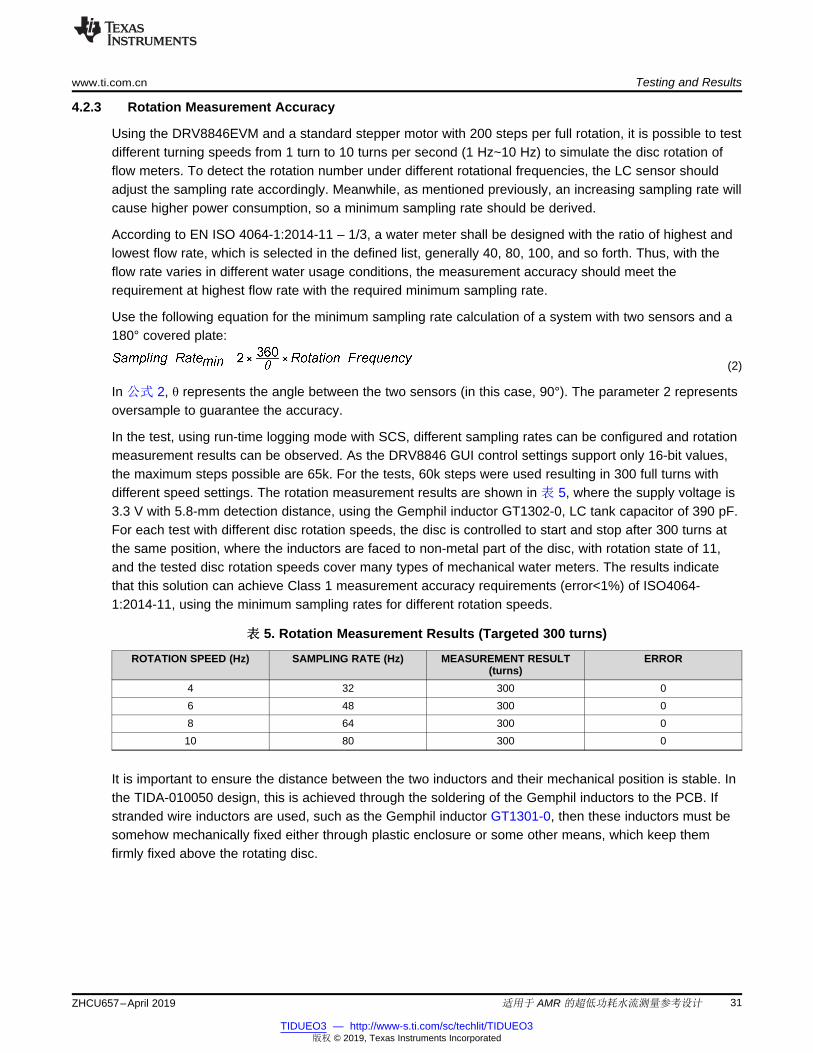
In the test, using run-time logging mode with SCS, different sampling rates can be configured and rotationmeasurement results can be observed. As the DRV8846 GUI control settings support only 16-bit values,the maximum steps possible are 65k. For the tests, 60k steps were used resulting in 300 full turns withdifferent speed settings. The rotation measurement results are shown in 表 5, where the supply voltage is3.3 V with 5.8-mm detection distance, using the Gemphil inductor GT1302-0, LC tank capacitor of 390 pF.For each test with different disc rotation speeds, the disc is controlled to start and stop after 300 turns atthe same position, where the inductors are faced to non-metal part of the disc, with rotation state of 11,and the tested disc rotation speeds cover many types of mechanical water meters. The results indicatethat this solution can achieve Class 1 measurement accuracy requirements (error<1%) of ISO4064-1:2014-11, using the minimum sampling rates for different rotation speeds.
表表 5. Rotation Measurement Results (Targeted 300 turns)
ROTATION SPEED (Hz) SAMPLING RATE (Hz) MEASUREMENT RESULT(turns)
ERROR
4 32 300 06 48 300 08 64 300 010 80 300 0
It is important to ensure the distance between the two inductors and their mechanical position is stable. Inthe TIDA-010050 design, this is achieved through the soldering of the Gemphil inductors to the PCB. Ifstranded wire inductors are used, such as the Gemphil inductor GT1301-0, then these inductors must besomehow mechanically fixed either through plastic enclosure or some other means, which keep themfirmly fixed above the rotating disc.
Testing and Results www.ti.com.cn
32 ZHCU657–April 2019
TIDUEO3 — http://www-s.ti.com/sc/techlit/TIDUEO3版权 © 2019, Texas Instruments Incorporated
适用于 AMR 的超低功耗水流测量参考设计
4.2.4 RF Functionality Demonstration
The LC-sensor metrology is implemented completely in the ultra-low-power Sensor Controller Engine ofthe CC1312R Wireless MCU, leaving both the RF-core and Cortex®-M4F core fully available for hostapplications and RF communications. Although the RF connectivity solution itself is not part of thisreference design, the CC1312R device can be used for adding RF protocol support in the Sub-1 GHz or2.4-GHz band or even both bands if either the CC1352R or CC1352P dual-band RF device is used.Multiple RF protocol stacks like wM-Bus, 6LoWPAN or BLE can be integrated to achieve a single-chipAMR module for mechanical flow meters. See the SimpleLink MCU Platform for more details.
www.ti.com.cn Design Files
33ZHCU657–April 2019
TIDUEO3 — http://www-s.ti.com/sc/techlit/TIDUEO3版权 © 2019, Texas Instruments Incorporated
适用于 AMR 的超低功耗水流测量参考设计
5 Design Files
5.1 Schematics
To download the schematics, see the design files at TIDA-010050.
5.2 Bill of Materials
To download the bill of materials (BOM), see the design files at TIDA-010050.
5.3 PCB Layout Recommendations
There are no strict layout requirements to be considered. To use for custom applications, both hardwaredesigns of TIDA-010050 and LAUNCHXL-CC1312R1 should be for reference. If using normal inductors forthe solution, the hardware part of PCB inductor can be ignored.
5.3.1 Layout Prints
To download the layer plots, see the design files at TIDA-010050.
5.4 Altium Project
To download the Altium Designer® project files, see the design files at TIDA-010050.
5.5 Gerber Files
To download the Gerber files, see the design files at TIDA-010050.
5.6 Assembly Drawings
To download the assembly drawings, see the design files at TIDA-010050.
5.7 Simulation Model
To download the assembly drawings, see the design files at TIDA-010050.
6 Software Files
To download the software files, see the design files at TIDA-010050.
7 Related Documentation1. Texas Instruments, Low-power water flow measurement with inductive sensing reference design2. Texas Instruments, Method to select the value of LC sensor for MSP430 extended scan interface (ESI)
application report3. Texas Instruments, SimpleLink™ CC1312R LaunchPad™ for 868 MHz/915 MHz bands LAUNCHXL-
CC1312R1 application report4. Texas Instruments, CC26xx, CC13xx sensor controller studio version 2.4 .0 getting started guide5. Gemphil Technologies, Inc., Inductor GT1302-0, GT1301-0
7.1 商商标标
E2E, SimpleLink, LaunchPad, FemtoFET are trademarks of Texas Instruments.Altium Designer is a registered trademark of Altium LLC or its affiliated companies.Arm, Cortex are registered trademarks of Arm Limited.Wi-SUN is a registered trademark of Wi-SUN Alliance, Inc.ZigBee is a registered trademark of ZigBee Alliance.
Related Documentation www.ti.com.cn
34 ZHCU657–April 2019
TIDUEO3 — http://www-s.ti.com/sc/techlit/TIDUEO3版权 © 2019, Texas Instruments Incorporated
适用于 AMR 的超低功耗水流测量参考设计
All other trademarks are the property of their respective owners.
7.2 Third-Party Products Disclaimer
TI'S PUBLICATION OF INFORMATION REGARDING THIRD-PARTY PRODUCTS OR SERVICES DOESNOT CONSTITUTE AN ENDORSEMENT REGARDING THE SUITABILITY OF SUCH PRODUCTS ORSERVICES OR A WARRANTY, REPRESENTATION OR ENDORSEMENT OF SUCH PRODUCTS ORSERVICES, EITHER ALONE OR IN COMBINATION WITH ANY TI PRODUCT OR SERVICE.
8 Terminology
Water meter — Mechanical water meters with impeller and a rotating disc in their dial, which can besensed to measure its rotation speed and direction (thus the water flow)
Inductive or LC sensing — Using an LC tank oscillation to detect a nearby metal plate (mounted on therotating disc) through dampened oscillations due to induced eddy currents
Rotating disc — Small circular disc, with a half-round metal plate, often used as 1 liter dialindicator, foundin many mechanical flow meters in the world
Class 1 or Class 2 — Precision categories for water meters defined in DIN EN ISO 4064-1:2014-11. InEurope, water meters are designed according to the EN ISO 4064 specifications, which are closely relatedto OIML R-49 documents, used in other regions of the world as well. The measurement error defines if theMeter is either Class 1 with ±1% maximum error or Class 2 with ±2% error from 0.1°C to 30°C. For thetemperatures above 30°C, the maximum permissible error is increased to ±2% or ±3% for Class 1 or 2respectively.
9 About the Author
AKI LI is a Field Application Engineer in China, who got his master degree of Electrical Engineering inZhejiang University. During the rotation program in TI's Grid Infrastructure team, he worked with Milen forthe development of this reference design.
MILEN STEFANOV (M.Sc.E.E) is a system engineer at TI, working in the Grid Infrastructure field and anexpert in RF communication technologies and metering applications. After graduating, he spent 5 years asa research assistant at the University of Chemnitz (TUC) and 3.5 years in the semiconductor industry inhigh-speed optical and wired communications as a system engineer. He joined TI in 2003 to become aWi-Fi ® expert and support TI’s Wi-Fi products at major OEMs. Since 2010, he has focused on meteringand Sub-1 GHz RF solutions for the European Grid Infrastructure market. Mr. Stefanov has publishedmultiple articles on wM-Bus technology in Europe and presented technical papers at the WirelessCongress and Smart Home & Metering summits in Munich.
重要声明和免责声明TI“按原样”提供技术和可靠性数据(包括数据表)、设计资源(包括参考设计)、应用或其他设计建议、网络工具、安全信息和其他资源,不保证没有瑕疵且不做出任何明示或暗示的担保,包括但不限于对适销性、某特定用途方面的适用性或不侵犯任何第三方知识产权的暗示担保。这些资源可供使用 TI 产品进行设计的熟练开发人员使用。您将自行承担以下全部责任:(1) 针对您的应用选择合适的 TI 产品,(2) 设计、验证并测试您的应用,(3) 确保您的应用满足相应标准以及任何其他功能安全、信息安全、监管或其他要求。这些资源如有变更,恕不另行通知。TI 授权您仅可将这些资源用于研发本资源所述的 TI 产品的应用。严禁对这些资源进行其他复制或展示。您无权使用任何其他 TI 知识产权或任何第三方知识产权。您应全额赔偿因在这些资源的使用中对 TI 及其代表造成的任何索赔、损害、成本、损失和债务,TI 对此概不负责。TI 提供的产品受 TI 的销售条款或 ti.com 上其他适用条款/TI 产品随附的其他适用条款的约束。TI 提供这些资源并不会扩展或以其他方式更改 TI 针对 TI 产品发布的适用的担保或担保免责声明。TI 反对并拒绝您可能提出的任何其他或不同的条款。IMPORTANT NOTICE
邮寄地址:Texas Instruments, Post Office Box 655303, Dallas, Texas 75265Copyright © 2022,德州仪器 (TI) 公司