document s1. supplemental experimental procedures, six tables
TRANSCRIPT
1
Cell, Volume 132
Supplemental Data
Direct Inhibition of the Longevity
Promoting Factor SKN-1 by
Insulin-like Signaling in C. elegans Jennifer M.A. Tullet, Maren Hertweck, Jae Hyung An, Joseph Baker, Ji Yun Hwang, Shu Liu, Riva P. Oliveira, Ralf Baumeister, T. Keith Blackwell Dauer studies We investigated whether skn-1 influences the propensity of daf-2(e1370) to enter dauer, using skn-1 RNAi for technical reasons. At 25oC, 100% of daf-2(e1370); skn-1(RNAi) animals formed dauer larvae (data not shown), sugessting that skn-1 is not required for differentiation into dauer. In addition, skn-1 RNAi did not suppress the dauer constitutive phenotype of akt-1(ok525);akt-2(ok393) double mutant animals (94% vs 93.5% at 25°C; not shown), further suggesting that SKN-1 may not be essential for the regulation of diapause. Supplemental Experimental Procedures Cloning The SKN-1B/C::GFP and gcs-1::GFP transgenes were described previously (An and Blackwell, 2003). To make the SKN-1op::GFP translational fusion a 9.23kb region upstream of SKN-1B/C was amplified by PCR from genomic DNA and subcloned into pUC18. This was then digested with SphI and cloned upstream of SKN-1B/C::GFP (An and Blackwell 2003). The GST-7::GFP translational fusion was created by amplifying and cloning a 1150bp gst-7 promoter region into GFP vector pPD95.67. The GST-7 genomic region was cloned directly behind the promoter in frame with GFP. A point mutation was created at a strong predicted SKN-1 binding site (-132 ATGACAAA into CCCGGGAA) within the promoter. All PCR was done using Pfu polymerase and muatagenesis using the Quick change method (Stratagene). All gene information is from http://www.wormbase.org Release WS184. RNAi clones were constructed by PCR amplification of full-length akt-1, akt-2, and sgk-1, 1.5 kb of daf-16, and the full coding region or first three exons of skn-1c. As this region of skn-1c also targets skn-1a, we refer to this RNAi construct as skn-1a/c. The sgk-1 clone used for SKN-1 sub-cellular localization and gcs-1::GFP induction experiments lacked the last 100 base pairs of coding sequence. cco-1 and cyc-1 RNAi clones were obtained from the Vidal Orfeome library (Rual et al., 2004).
2
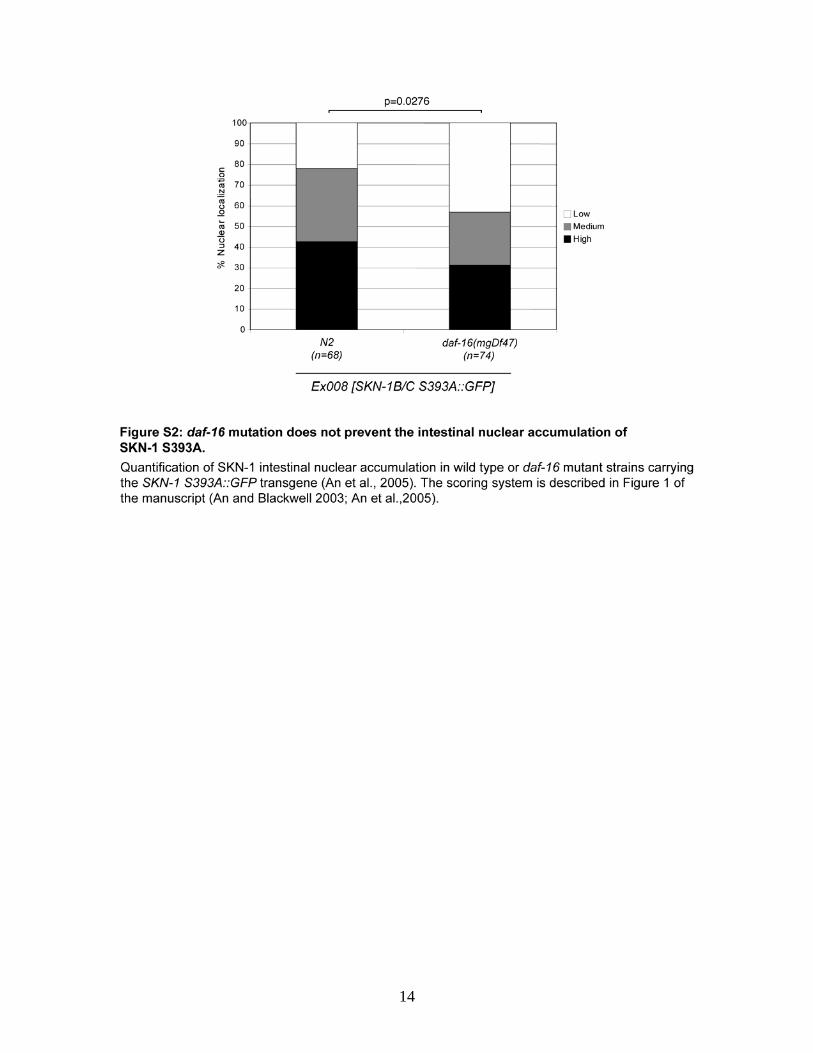
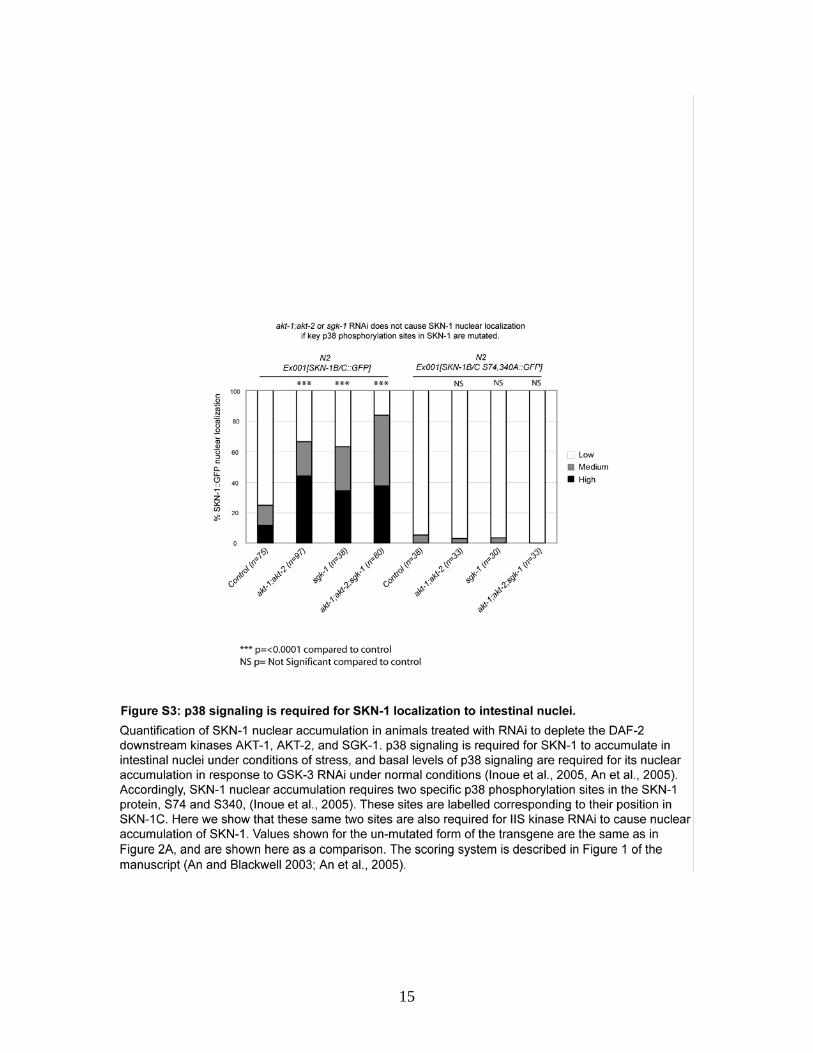
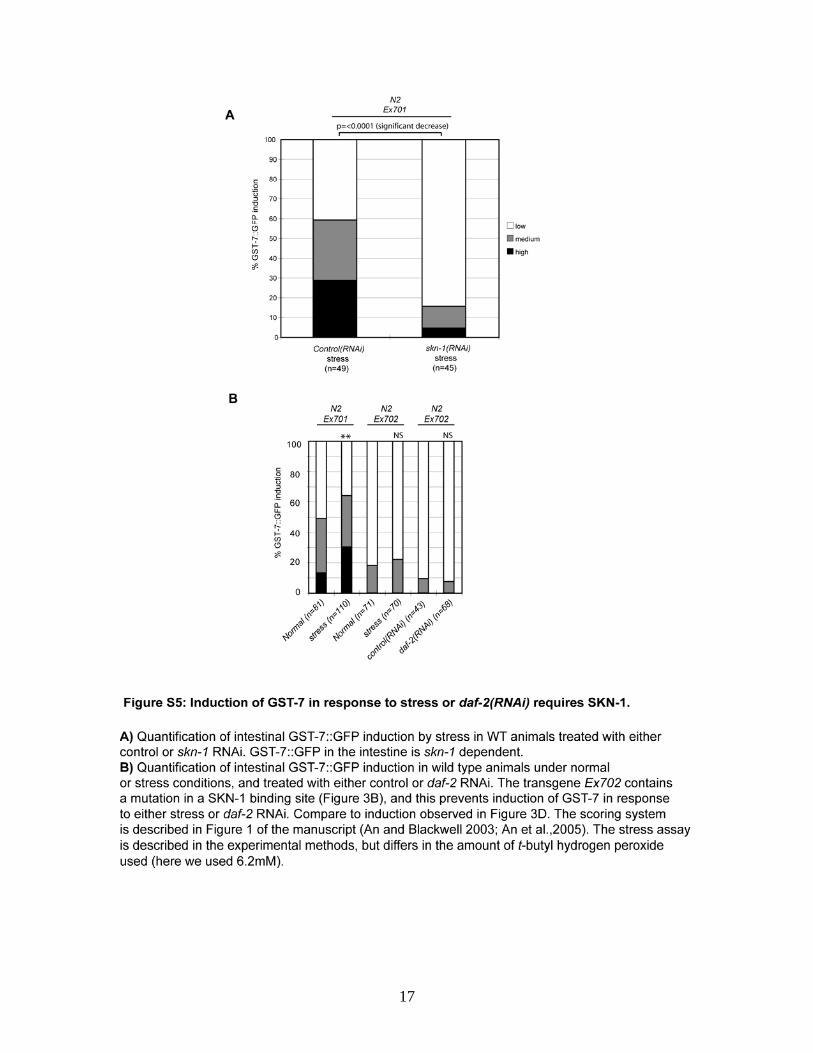
Strains Strain numbers and a summary of these details can be found in Table S2. daf-16(mgDf47) Ex009[SKN-1op::GFP], daf-16(mgDf47) Ex002[gcs-1::GFP], daf-2(e1370) Ex007[SKN-1B/C::GFP], daf-2(e1368) Ex001[SKN-1B/C::GFP] and daf-2(e1370) Ex010[SKN-1op::GFP] were made by mating male daf-16(mgDf47), daf-2(e1370) or daf-2(e1368) with transgenic hermaphrodites and isolating transgenic rol progeny, with the correct genotype as scored by PCR (daf-16(mgDf47)) or dauer formation (daf-2(e1370)). Double mutants daf-2(e1368);skn-1(zu67), daf-2(e1368);skn-1(zu129), daf-2(e1368);skn-1(zu135), daf-2(e1370);skn-1(zu67), daf-2(e1370);skn-1(zu129), daf-2(e1370);skn-1(zu135), rrf-3(pk1426); skn-1(zu67), rrf-3(pk1426); skn-1(zu129), rrf-3(pk1426); skn-1(zu135), were created by mating male daf-2 or rrf-3 homozygous nulls with skn-1/DnT1 heterozygous hermaphrodites that have an Unc phenotype. After transgenic males were successfully crossed twice with skn-1/DnT1 hermaphrodites F3 Unc progeny were selected for maintenance and the homozygous non-Unc progeny assessed for dauer formation at 25oC. The double mutant daf-16(mgDf50); rrf-3(pk1426) was constructed using rrf-3 males, and identified by PCR. All skn-1 mutations were confirmed by sequencing. RNAi Essentially as in (Kamath et al., 2001). RNAi clones were grown with 12.5µg/ml tetracycline and 100 µg/ml ampicillin. On the following day, cultures were diluted and grown to an OD600 of 1, and induced with 1-0.8 mM IPTG. This culture was used to seed plates containing tetracycline, ampicillin, and additional IPTG, and left to dry for 1-2 days at room temperature. For GFP-scoring experiments using akt-1;akt-2 or sgk-1 RNAi, L2 stage worms were placed on these plates and allowed to develop and lay eggs. F1 progeny were scored for either the nuclear localization of SKN-1::GFP or induction of gcs-1::GFP at the L4 stage (see below). As skn-1 is required for embryo development, animals used to study SKN-1C expression were transferred to skn-1a/c RNAi at the L1 stage and analyzed at L4. Images were acquired with a Zeiss AxioSKOP2 microscope and AxioCam digital camera. GFP Fusion protein scoring system SKN-1 accumulation in intestinal nuclei was scored as in (An and Blackwell, 2003; An et al., 2005). Briefly, high indicates that a strong SKN-1::GFP signal was present in all nuclei, as in Figure 1C (lower panel), and medium indicates that nuclear SKN-1::GFP was present at high levels anteriorly, posteriorly, or anteriorly and posteriorly but barely detectable midway through the intestine, or that a weak SKN-1::GFP signal was observed in all intestinal nuclei. The intestinal expression of gcs-1 has been described (An and Blackwell, 2003; An et al., 2005). High indicates that GCS-1::GFP was present at high levels anteriorly and was detectable throughout most of the intestine, while medium refers to animals in which GCS-1::GFP was present at high levels only anteriorly or posteriorly. GST-7::GFP expression in the intestine was scored in essentially the same manner as gcs-1::GFP. In each case p values were derived from a chi2 test.
3
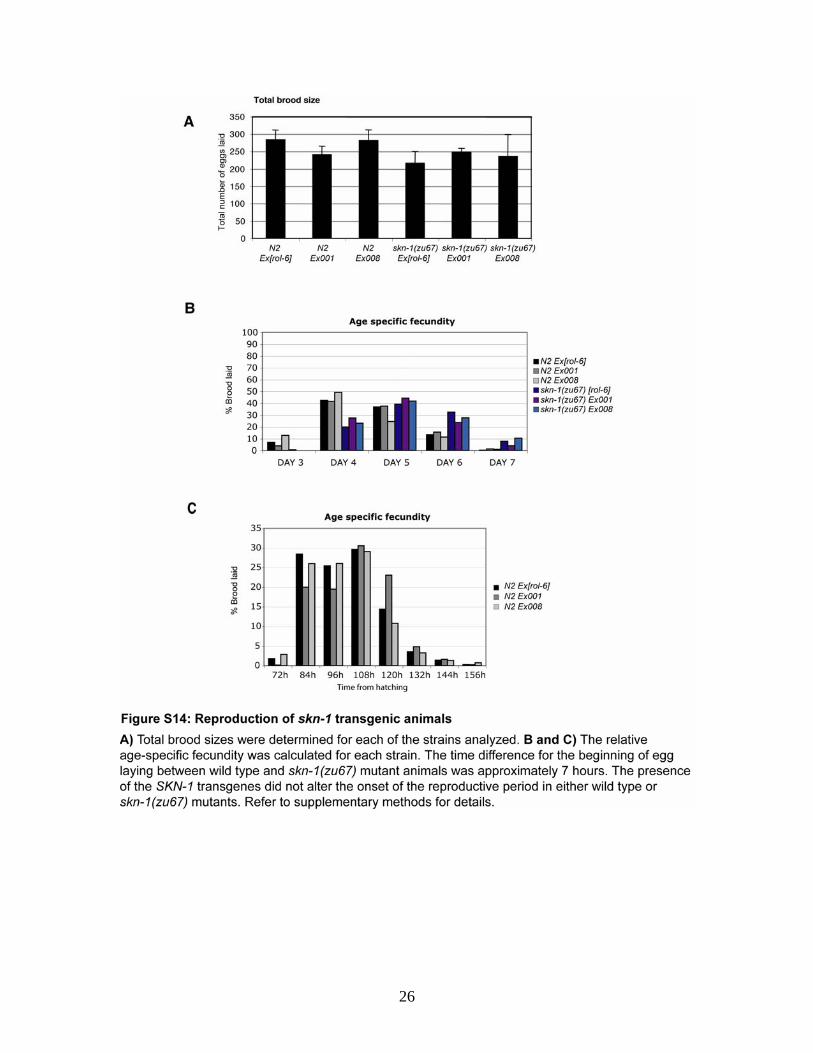
Lifespan Briefly, animals were synchronized by timed egg laying for 8 hours, and allowed to develop at 16oC (for experiments using skn-1;daf-2 double mutants, akt-1,-2 and sgk-1 RNAi strains), or were synchronized by timed egg laying overnight and allowed to develop at 20oC (for experiments with SKN-1 transgenic strains). When animals reached adulthood, they were transferred to plates containing 100 µg/ml FuDR, kept at 20oC, and were periodically scored as dead or alive. Animals that crawled off the plate, exploded, died as bags of worms or from Egl phenotypes were excluded from analysis at the time of death. Lifespans were measured from hatching except for a single analysis of skn-1;daf-2(e1368) (Table S5) and the experiments using akt-1;akt-2 and sgk-1 RNAi, which were measured from adulthood. For these Kinase RNAi experiments lifespans were carried out at 25oC, on plates without FuDR. Healthspan/movement assay We scored animals for their ability to move unaided by a protocol adapted from (Lehtinen et al., 2006). Movement assays were performed on 3cm NGM plates seeded with approximately 80µl of a 10-fold concentrated overnight OP50 culture. Plates contained 100ug/ml FudR, as in the longevity assay, to prevent progeny production. Worms were synchronized via an overnight timed egg laying, and placed on assay plates (1 animal/plate) on the first day of adulthood. Movement was encouraged by tapping plates, and animals were scored by counting the number of rotations occurring within a 20 second period. Worms that crawled away were moved back to the bacteria with a worm pick, and were scored last to minimize the effects of picking. To eliminate artificially low values caused by the tendency of worms not always to respond to tapping, each worm was scored six times with brief intervals separating each 20s period, and the top three scores were averaged. Movement is normalized relative to the number of rotations on day one of adulthood. ‘Rotations’ refers to the rotation of the worm’s body around an imaginary axis from head to tail that can be followed by observing the rotation of the intestine or alae. Start of reproductive period, brood size and age specific fecundity. Animals were synchronized with a 4 hour timed egg laying and individuals cloned at the L3 stage. Individuals were monitored every hour and it was noted when the first egg was laid. The average time was calculated for each group. Broods were counted at the same time each day or at 12-hour intervals. The average brood size and the percentage of this produced within each time period was calculated.
4
Supplemental References An, J. H., and Blackwell, T. K. (2003). SKN-1 links C. elegans mesendodermal specification to a conserved oxidative stress response. Genes Dev 17, 1882-1893.
An, J. H., Vranas, K., Lucke, M., Inoue, H., Hisamoto, N., Matsumoto, K., and Blackwell, T. K. (2005). Regulation of the Caenorhabditis elegans oxidative stress defense protein SKN-1 by glycogen synthase kinase-3. Proc Natl Acad Sci U S A 102, 16275-16280.
Berman, J. R., and Kenyon, C. (2006). Germ-cell loss extends C. elegans life span through regulation of DAF-16 by kri-1 and lipophilic-hormone signaling. Cell 124, 1055-1068.
Brunet, A., Park, J., Tran, H., Hu, L. S., Hemmings, B. A., and Greenberg, M. E. (2001). Protein kinase SGK mediates survival signals by phosphorylating the forkhead transcription factor FKHRL1 (FOXO3a). Mol Cell Biol 21, 952-965.
Kamath, R. S., Martinez-Campos, M., Zipperlen, P., Fraser, A. G., and Ahringer, J. (2001). Effectiveness of specific RNA-mediated interference through ingested double-stranded RNA in Caenorhabditis elegans. Genome Biol 2, RESEARCH0002.
Lehtinen, M. K., Yuan, Z., Boag, P. R., Yang, Y., Villen, J., Becker, E. B., DiBacco, S., de la Iglesia, N., Gygi, S., Blackwell, T. K., and Bonni, A. (2006). A conserved MST-FOXO signaling pathway mediates oxidative-stress responses and extends life span. Cell 125, 987-1001.
Melendez, A., Talloczy, Z., Seaman, M., Eskelinen, E. L., Hall, D. H., and Levine, B. (2003). Autophagy genes are essential for dauer development and life-span extension in C. elegans. Science 301, 1387-1391.
Obenauer, J. C., Cantley, L. C., and Yaffe, M. B. (2003). Scansite 2.0: Proteome-wide prediction of cell signaling interactions using short sequence motifs. Nucleic Acids Res 31, 3635-3641.
Rual, J. F., Ceron, J., Koreth, J., Hao, T., Nicot, A. S., Hirozane-Kishikawa, T., Vandenhaute, J., Orkin, S. H., Hill, D. E., van den Heuvel, S., and Vidal, M. (2004). Toward improving Caenorhabditis elegans phenome mapping with an ORFeome-based RNAi library. Genome Res 14, 2162-2168.
5
Supplemental Tables
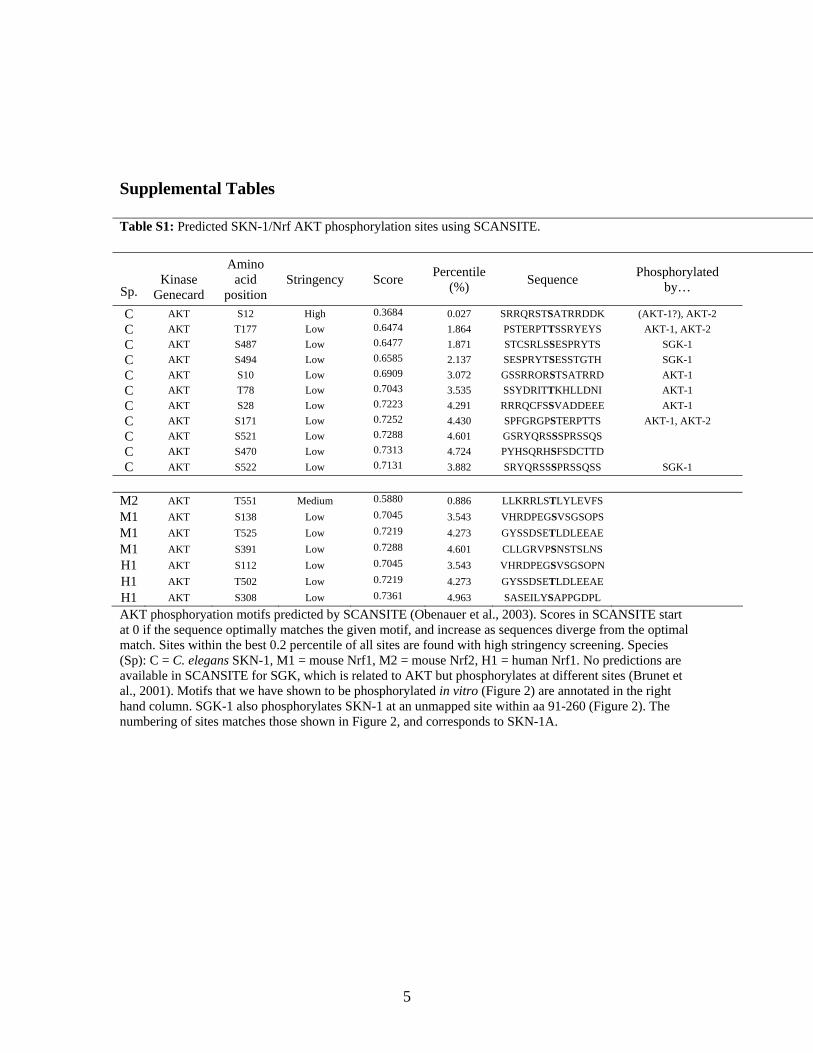
Table S1: Predicted SKN-1/Nrf AKT phosphorylation sites using SCANSITE.
Sp.
Kinase
Genecard
Amino acid
position Stringency Score Percentile
(%) Sequence Phosphorylated by…
C AKT S12 High 0.3684 0.027 SRRQRSTSATRRDDK (AKT-1?), AKT-2 C AKT T177 Low 0.6474 1.864 PSTERPTTSSRYEYS AKT-1, AKT-2 C AKT S487 Low 0.6477 1.871 STCSRLSSESPRYTS SGK-1 C AKT S494 Low 0.6585 2.137 SESPRYTSESSTGTH SGK-1 C AKT S10 Low 0.6909 3.072 GSSRRORSTSATRRD AKT-1 C AKT T78 Low 0.7043 3.535 SSYDRITTKHLLDNI AKT-1 C AKT S28 Low 0.7223 4.291 RRRQCFSSVADDEEE AKT-1 C AKT S171 Low 0.7252 4.430 SPFGRGPSTERPTTS AKT-1, AKT-2 C AKT S521 Low 0.7288 4.601 GSRYQRSSSPRSSQS C AKT S470 Low 0.7313 4.724 PYHSQRHSFSDCTTD C AKT S522 Low 0.7131 3.882 SRYQRSSSPRSSQSS SGK-1
M2 AKT T551 Medium 0.5880 0.886 LLKRRLSTLYLEVFS M1 AKT S138 Low 0.7045 3.543 VHRDPEGSVSGSOPS M1 AKT T525 Low 0.7219 4.273 GYSSDSETLDLEEAE M1 AKT S391 Low 0.7288 4.601 CLLGRVPSNSTSLNS H1 AKT S112 Low 0.7045 3.543 VHRDPEGSVSGSOPN H1 AKT T502 Low 0.7219 4.273 GYSSDSETLDLEEAE H1 AKT S308 Low 0.7361 4.963 SASEILYSAPPGDPL AKT phosphoryation motifs predicted by SCANSITE (Obenauer et al., 2003). Scores in SCANSITE start at 0 if the sequence optimally matches the given motif, and increase as sequences diverge from the optimal match. Sites within the best 0.2 percentile of all sites are found with high stringency screening. Species (Sp): C = C. elegans SKN-1, M1 = mouse Nrf1, M2 = mouse Nrf2, H1 = human Nrf1. No predictions are available in SCANSITE for SGK, which is related to AKT but phosphorylates at different sites (Brunet et al., 2001). Motifs that we have shown to be phosphorylated in vitro (Figure 2) are annotated in the right hand column. SGK-1 also phosphorylates SKN-1 at an unmapped site within aa 91-260 (Figure 2). The numbering of sites matches those shown in Figure 2, and corresponds to SKN-1A.
6
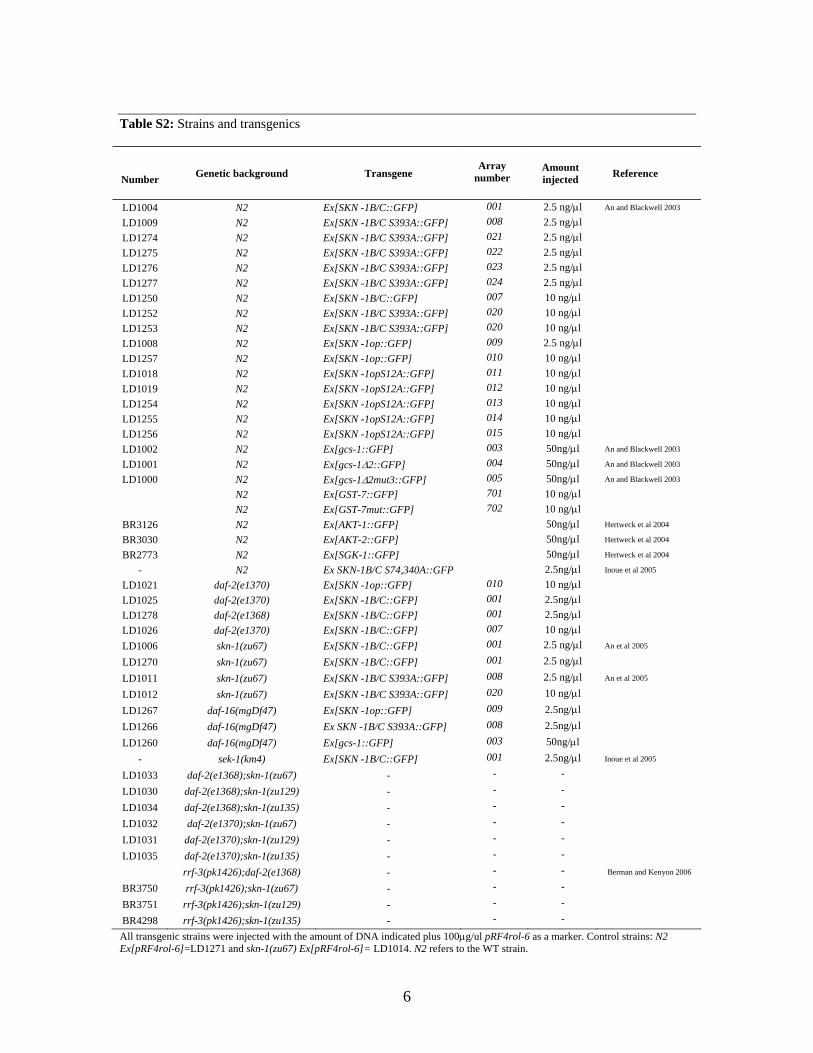
Table S2: Strains and transgenics
Number Genetic background Transgene
Array
number
Amount injected
Reference
LD1004 N2 Ex[SKN -1B/C::GFP] 001 2.5 ng/µl An and Blackwell 2003
LD1009 N2 Ex[SKN -1B/C S393A::GFP] 008 2.5 ng/µl
LD1274 N2 Ex[SKN -1B/C S393A::GFP] 021 2.5 ng/µl
LD1275 N2 Ex[SKN -1B/C S393A::GFP] 022 2.5 ng/µl
LD1276 N2 Ex[SKN -1B/C S393A::GFP] 023 2.5 ng/µl
LD1277 N2 Ex[SKN -1B/C S393A::GFP] 024 2.5 ng/µl
LD1250 N2 Ex[SKN -1B/C::GFP] 007 10 ng/µl
LD1252 N2 Ex[SKN -1B/C S393A::GFP] 020 10 ng/µl
LD1253 N2 Ex[SKN -1B/C S393A::GFP] 020 10 ng/µl
LD1008 N2 Ex[SKN -1op::GFP] 009 2.5 ng/µl
LD1257 N2 Ex[SKN -1op::GFP] 010 10 ng/µl
LD1018 N2 Ex[SKN -1opS12A::GFP] 011 10 ng/µl
LD1019 N2 Ex[SKN -1opS12A::GFP] 012 10 ng/µl
LD1254 N2 Ex[SKN -1opS12A::GFP] 013 10 ng/µl
LD1255 N2 Ex[SKN -1opS12A::GFP] 014 10 ng/µl
LD1256 N2 Ex[SKN -1opS12A::GFP] 015 10 ng/µl
LD1002 N2 Ex[gcs-1::GFP] 003 50ng/µl An and Blackwell 2003
LD1001 N2 Ex[gcs-1∆2::GFP] 004 50ng/µl An and Blackwell 2003
LD1000 N2 Ex[gcs-1∆2mut3::GFP] 005 50ng/µl An and Blackwell 2003
N2 Ex[GST-7::GFP] 701 10 ng/µl
N2 Ex[GST-7mut::GFP] 702 10 ng/µl
BR3126 N2 Ex[AKT-1::GFP] 50ng/µl Hertweck et al 2004
BR3030 N2 Ex[AKT-2::GFP] 50ng/µl Hertweck et al 2004
BR2773 N2 Ex[SGK-1::GFP] 50ng/µl Hertweck et al 2004
- N2 Ex SKN-1B/C S74,340A::GFP 2.5ng/µl Inoue et al 2005
LD1021 daf-2(e1370) Ex[SKN -1op::GFP] 010 10 ng/µl
LD1025 daf-2(e1370) Ex[SKN -1B/C::GFP] 001 2.5ng/µl
LD1278 daf-2(e1368) Ex[SKN -1B/C::GFP] 001 2.5ng/µl
LD1026 daf-2(e1370) Ex[SKN -1B/C::GFP] 007 10 ng/µl
LD1006 skn-1(zu67) Ex[SKN -1B/C::GFP] 001 2.5 ng/µl An et al 2005
LD1270 skn-1(zu67) Ex[SKN -1B/C::GFP] 001 2.5 ng/µl
LD1011 skn-1(zu67) Ex[SKN -1B/C S393A::GFP] 008 2.5 ng/µl An et al 2005
LD1012 skn-1(zu67) Ex[SKN -1B/C S393A::GFP] 020 10 ng/µl
LD1267 daf-16(mgDf47) Ex[SKN -1op::GFP] 009 2.5ng/µl
LD1266 daf-16(mgDf47) Ex SKN -1B/C S393A::GFP] 008 2.5ng/µl
LD1260 daf-16(mgDf47) Ex[gcs-1::GFP] 003 50ng/µl
- sek-1(km4) Ex[SKN -1B/C::GFP] 001 2.5ng/µl Inoue et al 2005
LD1033 daf-2(e1368);skn-1(zu67) - - - LD1030 daf-2(e1368);skn-1(zu129) - - - LD1034 daf-2(e1368);skn-1(zu135) - - - LD1032 daf-2(e1370);skn-1(zu67) - - - LD1031 daf-2(e1370);skn-1(zu129) - - - LD1035 daf-2(e1370);skn-1(zu135) - - -
rrf-3(pk1426);daf-2(e1368) - - - Berman and Kenyon 2006
BR3750 rrf-3(pk1426);skn-1(zu67) - - - BR3751 rrf-3(pk1426);skn-1(zu129) - - - BR4298 rrf-3(pk1426);skn-1(zu135) - - - All transgenic strains were injected with the amount of DNA indicated plus 100µg/ul pRF4rol-6 as a marker. Control strains: N2 Ex[pRF4rol-6]=LD1271 and skn-1(zu67) Ex[pRF4rol-6]= LD1014. N2 refers to the WT strain.
7
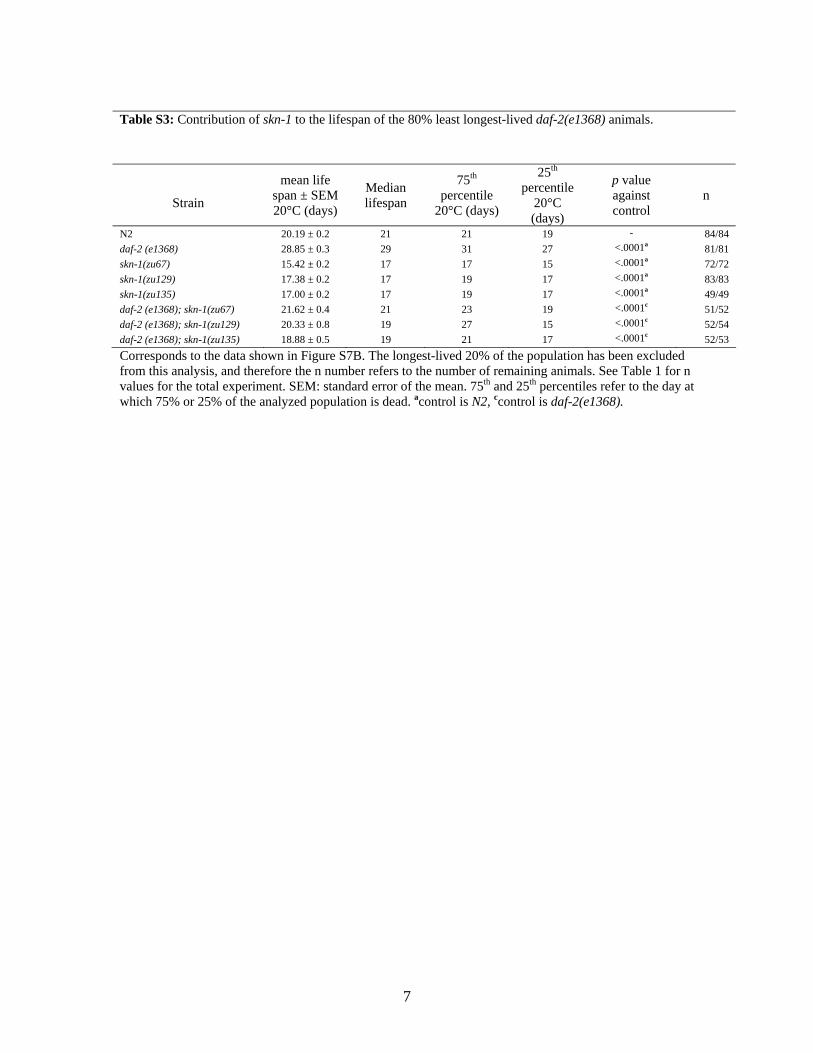
Table S3: Contribution of skn-1 to the lifespan of the 80% least longest-lived daf-2(e1368) animals.
Strain
mean life span ± SEM 20°C (days)
Median lifespan
75th percentile
20°C (days)
25th percentile
20°C (days)
p value against control
n
N2 20.19 ± 0.2 21 21 19 - 84/84 daf-2 (e1368) 28.85 ± 0.3 29 31 27 <.0001a 81/81 skn-1(zu67) 15.42 ± 0.2 17 17 15 <.0001a 72/72 skn-1(zu129) 17.38 ± 0.2 17 19 17 <.0001a 83/83 skn-1(zu135) 17.00 ± 0.2 17 19 17 <.0001a 49/49 daf-2 (e1368); skn-1(zu67) 21.62 ± 0.4 21 23 19 <.0001c 51/52 daf-2 (e1368); skn-1(zu129) 20.33 ± 0.8 19 27 15 <.0001c 52/54 daf-2 (e1368); skn-1(zu135) 18.88 ± 0.5 19 21 17 <.0001c 52/53 Corresponds to the data shown in Figure S7B. The longest-lived 20% of the population has been excluded from this analysis, and therefore the n number refers to the number of remaining animals. See Table 1 for n values for the total experiment. SEM: standard error of the mean. 75th and 25th percentiles refer to the day at which 75% or 25% of the analyzed population is dead. acontrol is N2, ccontrol is daf-2(e1368).
8
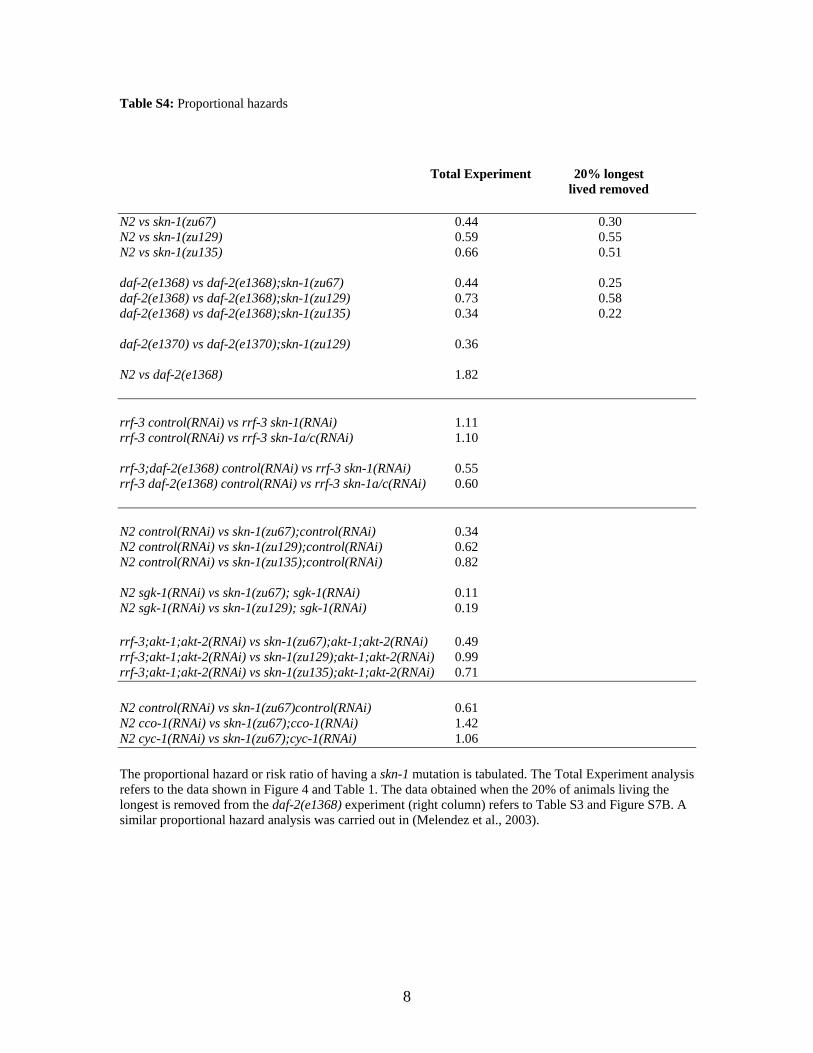
Table S4: Proportional hazards Total Experiment 20% longest lived removed N2 vs skn-1(zu67) 0.44 0.30 N2 vs skn-1(zu129) 0.59 0.55 N2 vs skn-1(zu135) 0.66 0.51 daf-2(e1368) vs daf-2(e1368);skn-1(zu67) 0.44 0.25 daf-2(e1368) vs daf-2(e1368);skn-1(zu129) 0.73 0.58 daf-2(e1368) vs daf-2(e1368);skn-1(zu135) 0.34 0.22 daf-2(e1370) vs daf-2(e1370);skn-1(zu129) 0.36 N2 vs daf-2(e1368) 1.82 rrf-3 control(RNAi) vs rrf-3 skn-1(RNAi) 1.11 rrf-3 control(RNAi) vs rrf-3 skn-1a/c(RNAi) 1.10 rrf-3;daf-2(e1368) control(RNAi) vs rrf-3 skn-1(RNAi) 0.55 rrf-3 daf-2(e1368) control(RNAi) vs rrf-3 skn-1a/c(RNAi) 0.60 N2 control(RNAi) vs skn-1(zu67);control(RNAi) 0.34 N2 control(RNAi) vs skn-1(zu129);control(RNAi) 0.62 N2 control(RNAi) vs skn-1(zu135);control(RNAi) 0.82 N2 sgk-1(RNAi) vs skn-1(zu67); sgk-1(RNAi) 0.11 N2 sgk-1(RNAi) vs skn-1(zu129); sgk-1(RNAi) 0.19 rrf-3;akt-1;akt-2(RNAi) vs skn-1(zu67);akt-1;akt-2(RNAi) 0.49 rrf-3;akt-1;akt-2(RNAi) vs skn-1(zu129);akt-1;akt-2(RNAi) 0.99 rrf-3;akt-1;akt-2(RNAi) vs skn-1(zu135);akt-1;akt-2(RNAi) 0.71 N2 control(RNAi) vs skn-1(zu67)control(RNAi) 0.61 N2 cco-1(RNAi) vs skn-1(zu67);cco-1(RNAi) 1.42 N2 cyc-1(RNAi) vs skn-1(zu67);cyc-1(RNAi) 1.06 The proportional hazard or risk ratio of having a skn-1 mutation is tabulated. The Total Experiment analysis refers to the data shown in Figure 4 and Table 1. The data obtained when the 20% of animals living the longest is removed from the daf-2(e1368) experiment (right column) refers to Table S3 and Figure S7B. A similar proportional hazard analysis was carried out in (Melendez et al., 2003).
9
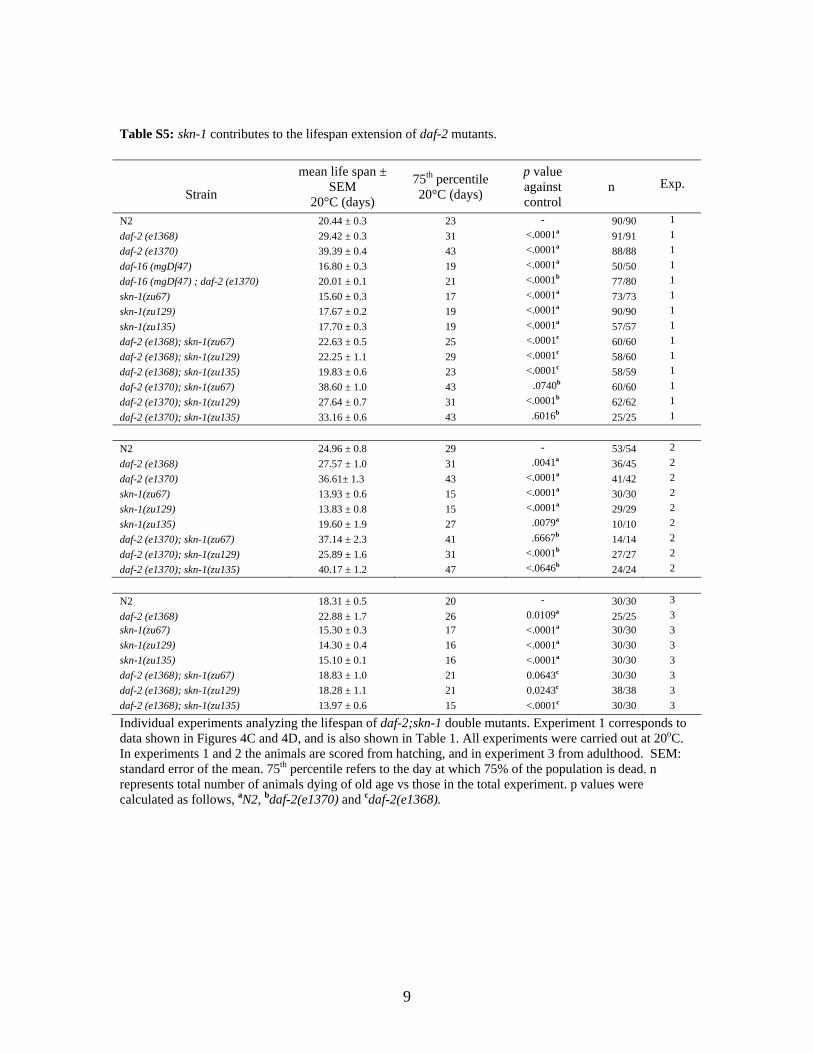
Table S5: skn-1 contributes to the lifespan extension of daf-2 mutants.
Strain
mean life span ± SEM
20°C (days)
75th percentile 20°C (days)
p value against control
n
Exp.
N2 20.44 ± 0.3 23 - 90/90 1 daf-2 (e1368) 29.42 ± 0.3 31 <.0001a 91/91 1 daf-2 (e1370) 39.39 ± 0.4 43 <.0001a 88/88 1 daf-16 (mgDf47) 16.80 ± 0.3 19 <.0001a 50/50 1 daf-16 (mgDf47) ; daf-2 (e1370) 20.01 ± 0.1 21 <.0001b 77/80 1 skn-1(zu67) 15.60 ± 0.3 17 <.0001a 73/73 1 skn-1(zu129) 17.67 ± 0.2 19 <.0001a 90/90 1 skn-1(zu135) 17.70 ± 0.3 19 <.0001a 57/57 1 daf-2 (e1368); skn-1(zu67) 22.63 ± 0.5 25 <.0001c 60/60 1 daf-2 (e1368); skn-1(zu129) 22.25 ± 1.1 29 <.0001c 58/60 1 daf-2 (e1368); skn-1(zu135) 19.83 ± 0.6 23 <.0001c 58/59 1 daf-2 (e1370); skn-1(zu67) 38.60 ± 1.0 43 .0740b 60/60 1 daf-2 (e1370); skn-1(zu129) 27.64 ± 0.7 31 <.0001b 62/62 1 daf-2 (e1370); skn-1(zu135) 33.16 ± 0.6 43 .6016b 25/25 1 N2 24.96 ± 0.8 29 - 53/54 2 daf-2 (e1368) 27.57 ± 1.0 31 .0041a 36/45 2 daf-2 (e1370) 36.61± 1.3 43 <.0001a 41/42 2 skn-1(zu67) 13.93 ± 0.6 15 <.0001a 30/30 2 skn-1(zu129) 13.83 ± 0.8 15 <.0001a 29/29 2 skn-1(zu135) 19.60 ± 1.9 27 .0079a 10/10 2 daf-2 (e1370); skn-1(zu67) 37.14 ± 2.3 41 .6667b 14/14 2 daf-2 (e1370); skn-1(zu129) 25.89 ± 1.6 31 <.0001b 27/27 2 daf-2 (e1370); skn-1(zu135) 40.17 ± 1.2 47 <.0646b 24/24 2
N2 18.31 ± 0.5 20 - 30/30 3 daf-2 (e1368) 22.88 ± 1.7 26 0.0109a 25/25 3 skn-1(zu67) 15.30 ± 0.3 17 <.0001a 30/30 3 skn-1(zu129) 14.30 ± 0.4 16 <.0001a 30/30 3 skn-1(zu135) 15.10 ± 0.1 16 <.0001a 30/30 3 daf-2 (e1368); skn-1(zu67) 18.83 ± 1.0 21 0.0643c 30/30 3 daf-2 (e1368); skn-1(zu129) 18.28 ± 1.1 21 0.0243c 38/38 3 daf-2 (e1368); skn-1(zu135) 13.97 ± 0.6 15 <.0001c 30/30 3
Individual experiments analyzing the lifespan of daf-2;skn-1 double mutants. Experiment 1 corresponds to data shown in Figures 4C and 4D, and is also shown in Table 1. All experiments were carried out at 20oC. In experiments 1 and 2 the animals are scored from hatching, and in experiment 3 from adulthood. SEM: standard error of the mean. 75th percentile refers to the day at which 75% of the population is dead. n represents total number of animals dying of old age vs those in the total experiment. p values were calculated as follows, aN2, bdaf-2(e1370) and cdaf-2(e1368).

10
Table S6: Transgenic expression of constitutively nuclear SKN-1 extends lifespan.
Strain mean life span ± SEM 20°C (days)
75th percentile
20°C (days)
p value against control
n
Exp. no.
N2 Ex[rol-6] 19.21 ± 0.2 20 - 89/90 1 N2 Ex008 [SKN-1 S393A:: GFP] 2.5ng/µl 23.24 ± 0.4 26 <.0001a 50/50 1 N2 Ex021 [SKN-1 S393A:: GFP] 2.5ng/µl 21.55 ± 0.3 24 <.0001a 73/78 1 N2 Ex022 [SKN-1 S393A:: GFP] 2.5ng/µl 20.69 ± 0.5 22 0.0024a 32/32 1 N2 Ex023 [SKN-1 S393A:: GFP] 2.5ng/µl 20.31 ± 0.4 22 0.0021a 51/51 1 N2 Ex024 [SKN-1 S393A:: GFP] 2.5ng/µl 20.00 ± 0.7 22 0.0441a 23/23 1
N2 Ex[rol-6] 20.30 ± 0.3 21 - 40/40 2 N2 Ex008 [SKN-1 S393A:: GFP] 2.5ng/µl 24.28 ± 0.4 25 <.0001a 28/28 2 N2 Ex021 [SKN-1 S393A:: GFP] 2.5ng/µl 22.32 ± 0.2 23 <.0001a 44/44 2 N2 Ex022 [SKN-1 S393A:: GFP] 2.5ng/µl 21.53 ± 0.5 23 0.0007a 30/30 2 N2 Ex023 [SKN-1 S393A:: GFP] 2.5ng/µl 21.53 ± 0.4 23 0.0010a 45/45 2 N2 Ex024 [SKN-1 S393A:: GFP] 2.5ng/µl 21.00 ± 0.4 23 0.0420a 40/40 2
The two experiments were combined in Figure 5A and Table 2. Tabulated as in Table 2. p values were calculated against aN2 Ex[rol-6].
Strain mean life span ± SEM 20°C (days)
75th percentile
20°C (days)
p value against control
n
Exp. no.
N2 Ex[rol-6] 20.09 ± 0.3 23 - 86/90 1 skn-1(zu67) Ex[rol-6] 15.62 ± 0.5 17 <.0001a 51/51 1 N2 Ex001[SKN -1B/C:: GFP] 2.5ng/µl 22.93 ± 0.3 25 <.0001b,c 91/91 1 skn-1(zu67) Ex001[SKN -1B/C:: GFP] 2.5ng/µl 23.45 ± 0.9 27 <.0001b,c 23/26 1 skn-1(zu67) Ex008[SKN -1B/C S393A:: GFP] 2.5ng/µl 25.67 ± 0.7 29 <.0001b,c 40/41 1 skn-1(zu67) Ex020[SKN -1B/C S393A:: GFP] 10ng/µl 27.16 ± 0.6 29 <.0001b,c 30/40 1
N2 Ex[rol-6] 19.23 ± 0.3 20 - 91/93 2 skn-1(zu67) Ex[rol-6] 15.40 ± 0.4 18 <.0001a 45/45 2 skn-1(zu67) Ex001[SKN -1B/C:: GFP] 2.5ng/µl 23.60 ± 0.7 26 <.0001b,c 25/25 2 skn-1(zu67) Ex008[SKN -1B/C S393A:: GFP] 2.5ng/µl 25.85 ± 0.6 28 <.0001b,c 27/29 2 N2 Ex[rol-6] 19.13 ± 0.2 21 - 59/60 3 N2 Ex001[SKN -1B/C:: GFP] 2.5ng/µl 21.00 ± 0.3 23 <.0001a 55/57 3
These three experiments have been combined in Figure 5B and Table 2. Tabulated as in Table 2. p values were calculated as follows, aN2 Ex[rol-6], bskn-1(zu67)[rol-6], and csignificantly enhanced compared to N2 [rol-6] (p=<0.0001 in each case).
11
Strain mean life
span ± SEM 20°C (days)
75th percentile
20°C (days)
p value against control
n
Exp. no.
N2 Ex[rol-6] 20.60± 0.5 23 - 50/50 1 daf-16(mgDf47) 15.87± 0.3 17 <.0001f 58/61 1 daf-16(mgDf47) Ex008[SKN-1 S393A:: GFP] 2.5ng/µl 18.88± 0.3 21 <.0001e 48/48 1 N2 Ex[rol-6] 19.52± 0.6 22 - 46/52 2 daf-16(mgDf47) 17.37± 0.5 20 0.0010 f 50/54 2 daf-16(mgDf47) Ex008[SKN-1 S393A:: GFP] 2.5ng/µl 18.19± 0.3 20 0.4859 e 52/53 2
N2 Ex[rol-6] 19.58± 0.3 21 - 46/50 3 daf-16(mgDf47) 17.31± 0.4 19 <.0001f 52/52 3 daf-16(mgDf47) Ex008[SKN-1 S393A:: GFP] 2.5ng/µl 19.60± 0.3 21 <.0001e 40/40 3
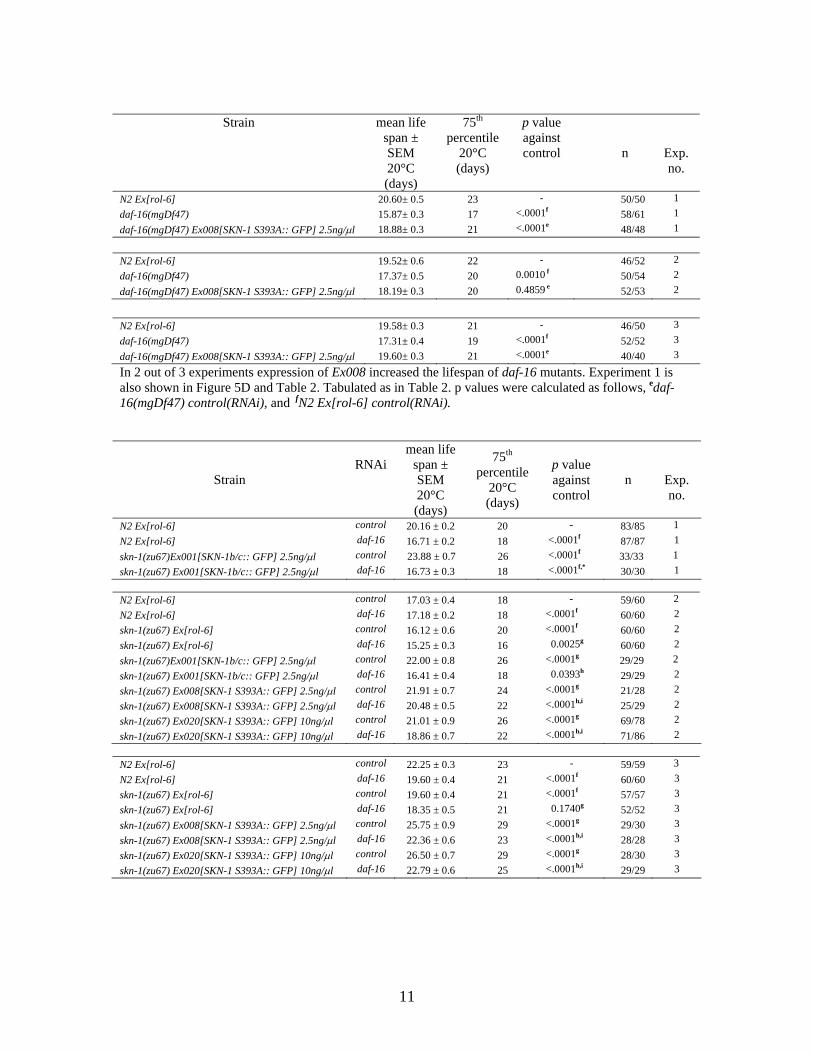
In 2 out of 3 experiments expression of Ex008 increased the lifespan of daf-16 mutants. Experiment 1 is also shown in Figure 5D and Table 2. Tabulated as in Table 2. p values were calculated as follows, edaf-16(mgDf47) control(RNAi), and fN2 Ex[rol-6] control(RNAi).
Strain
RNAi
mean life span ± SEM 20°C (days)
75th percentile
20°C (days)
p value against control
n
Exp. no.
N2 Ex[rol-6] control 20.16 ± 0.2 20 - 83/85 1 N2 Ex[rol-6] daf-16 16.71 ± 0.2 18 <.0001f 87/87 1 skn-1(zu67)Ex001[SKN-1b/c:: GFP] 2.5ng/µl control 23.88 ± 0.7 26 <.0001f 33/33 1 skn-1(zu67) Ex001[SKN-1b/c:: GFP] 2.5ng/µl daf-16 16.73 ± 0.3 18 <.0001f,* 30/30 1 N2 Ex[rol-6] control 17.03 ± 0.4 18 - 59/60 2 N2 Ex[rol-6] daf-16 17.18 ± 0.2 18 <.0001f 60/60 2 skn-1(zu67) Ex[rol-6] control 16.12 ± 0.6 20 <.0001f 60/60 2 skn-1(zu67) Ex[rol-6] daf-16 15.25 ± 0.3 16 0.0025g 60/60 2 skn-1(zu67)Ex001[SKN-1b/c:: GFP] 2.5ng/µl control 22.00 ± 0.8 26 <.0001g 29/29 2 skn-1(zu67) Ex001[SKN-1b/c:: GFP] 2.5ng/µl daf-16 16.41 ± 0.4 18 0.0393h 29/29 2 skn-1(zu67) Ex008[SKN-1 S393A:: GFP] 2.5ng/µl control 21.91 ± 0.7 24 <.0001g 21/28 2 skn-1(zu67) Ex008[SKN-1 S393A:: GFP] 2.5ng/µl daf-16 20.48 ± 0.5 22 <.0001h,i 25/29 2 skn-1(zu67) Ex020[SKN-1 S393A:: GFP] 10ng/µl control 21.01 ± 0.9 26 <.0001g 69/78 2 skn-1(zu67) Ex020[SKN-1 S393A:: GFP] 10ng/µl daf-16 18.86 ± 0.7 22 <.0001h,i 71/86 2 N2 Ex[rol-6] control 22.25 ± 0.3 23 - 59/59 3 N2 Ex[rol-6] daf-16 19.60 ± 0.4 21 <.0001f 60/60 3 skn-1(zu67) Ex[rol-6] control 19.60 ± 0.4 21 <.0001f 57/57 3 skn-1(zu67) Ex[rol-6] daf-16 18.35 ± 0.5 21 0.1740g 52/52 3 skn-1(zu67) Ex008[SKN-1 S393A:: GFP] 2.5ng/µl control 25.75 ± 0.9 29 <.0001g 29/30 3 skn-1(zu67) Ex008[SKN-1 S393A:: GFP] 2.5ng/µl daf-16 22.36 ± 0.6 23 <.0001h,i 28/28 3 skn-1(zu67) Ex020[SKN-1 S393A:: GFP] 10ng/µl control 26.50 ± 0.7 29 <.0001g 28/30 3 skn-1(zu67) Ex020[SKN-1 S393A:: GFP] 10ng/µl daf-16 22.79 ± 0.6 25 <.0001h,i 29/29 3
12
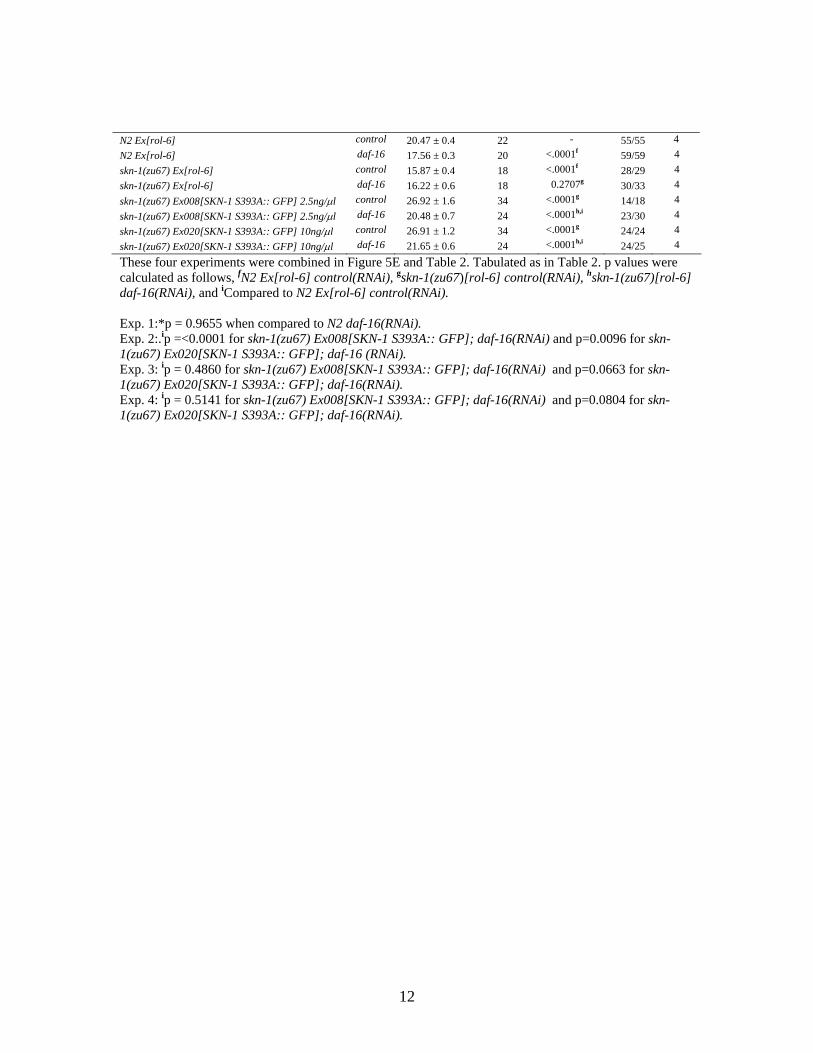
N2 Ex[rol-6] control 20.47 ± 0.4 22 - 55/55 4 N2 Ex[rol-6] daf-16 17.56 ± 0.3 20 <.0001f 59/59 4 skn-1(zu67) Ex[rol-6] control 15.87 ± 0.4 18 <.0001f 28/29 4 skn-1(zu67) Ex[rol-6] daf-16 16.22 ± 0.6 18 0.2707g 30/33 4 skn-1(zu67) Ex008[SKN-1 S393A:: GFP] 2.5ng/µl control 26.92 ± 1.6 34 <.0001g 14/18 4 skn-1(zu67) Ex008[SKN-1 S393A:: GFP] 2.5ng/µl daf-16 20.48 ± 0.7 24 <.0001h,i 23/30 4 skn-1(zu67) Ex020[SKN-1 S393A:: GFP] 10ng/µl control 26.91 ± 1.2 34 <.0001g 24/24 4 skn-1(zu67) Ex020[SKN-1 S393A:: GFP] 10ng/µl daf-16 21.65 ± 0.6 24 <.0001h,i 24/25 4
These four experiments were combined in Figure 5E and Table 2. Tabulated as in Table 2. p values were calculated as follows, fN2 Ex[rol-6] control(RNAi), gskn-1(zu67)[rol-6] control(RNAi), hskn-1(zu67)[rol-6] daf-16(RNAi), and iCompared to N2 Ex[rol-6] control(RNAi). Exp. 1:*p = 0.9655 when compared to N2 daf-16(RNAi). Exp. 2:.ip =<0.0001 for skn-1(zu67) Ex008[SKN-1 S393A:: GFP]; daf-16(RNAi) and p=0.0096 for skn-1(zu67) Ex020[SKN-1 S393A:: GFP]; daf-16 (RNAi). Exp. 3: ip = 0.4860 for skn-1(zu67) Ex008[SKN-1 S393A:: GFP]; daf-16(RNAi) and p=0.0663 for skn-1(zu67) Ex020[SKN-1 S393A:: GFP]; daf-16(RNAi). Exp. 4: ip = 0.5141 for skn-1(zu67) Ex008[SKN-1 S393A:: GFP]; daf-16(RNAi) and p=0.0804 for skn-1(zu67) Ex020[SKN-1 S393A:: GFP]; daf-16(RNAi).
13
14
15
16
17
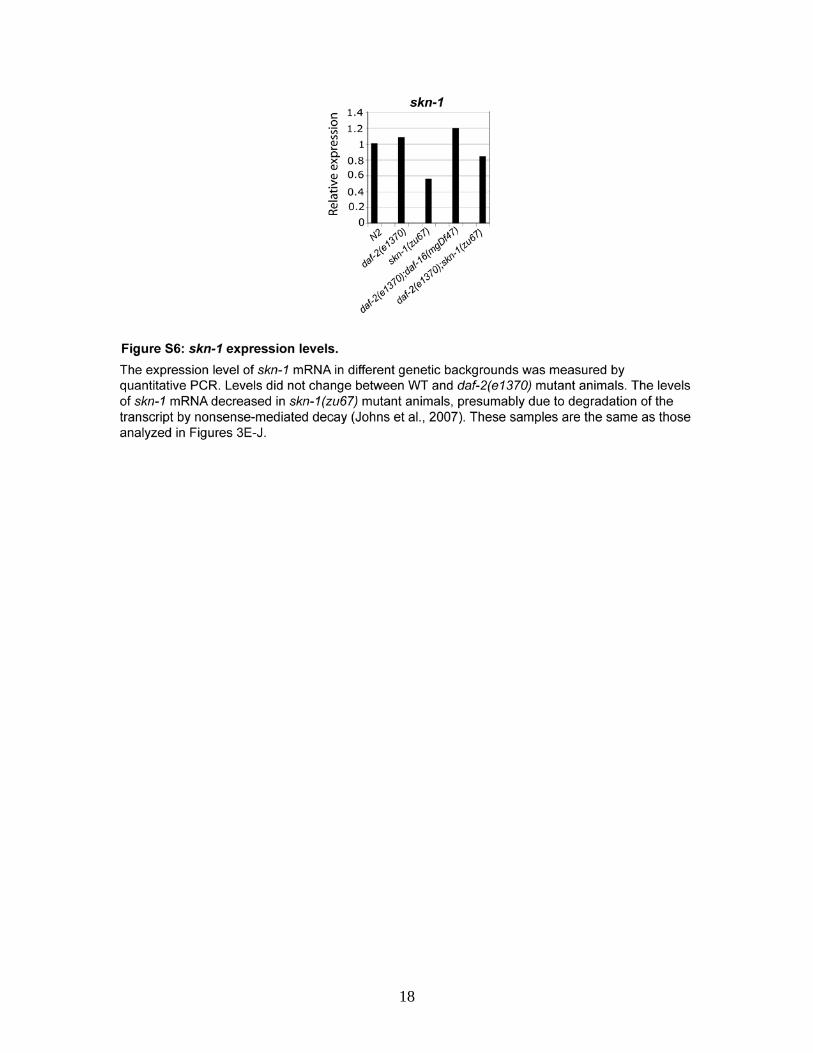
18
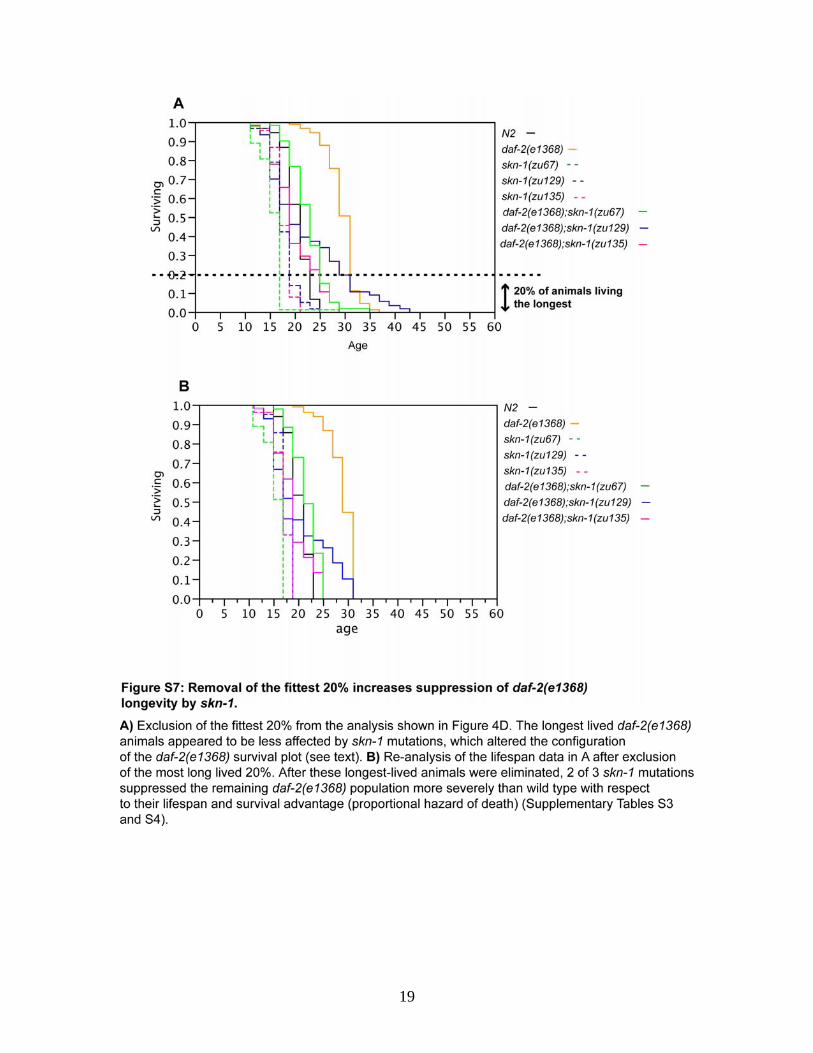
19
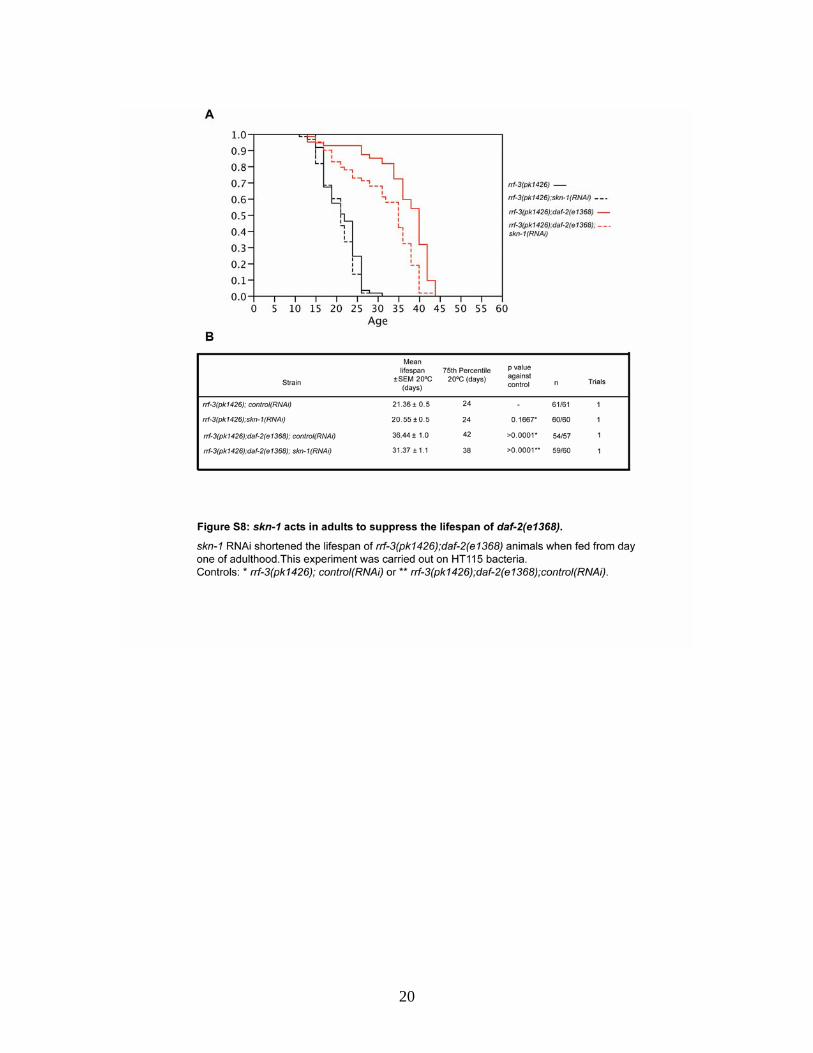
20
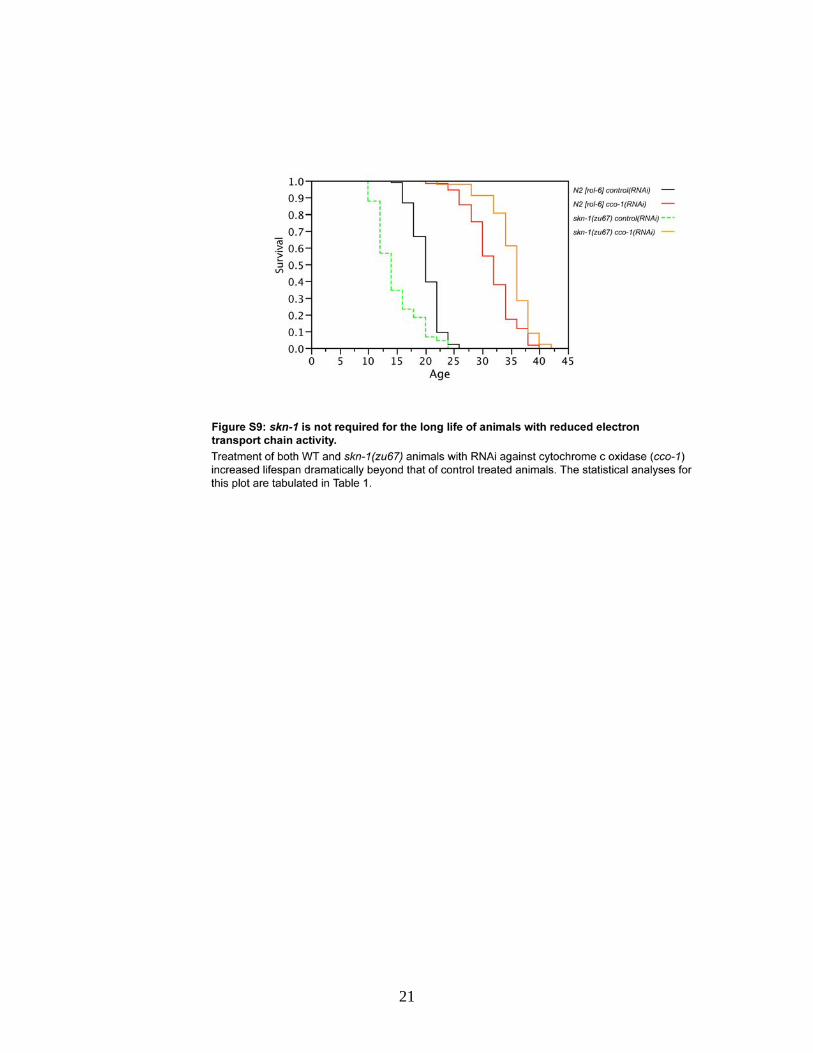
21
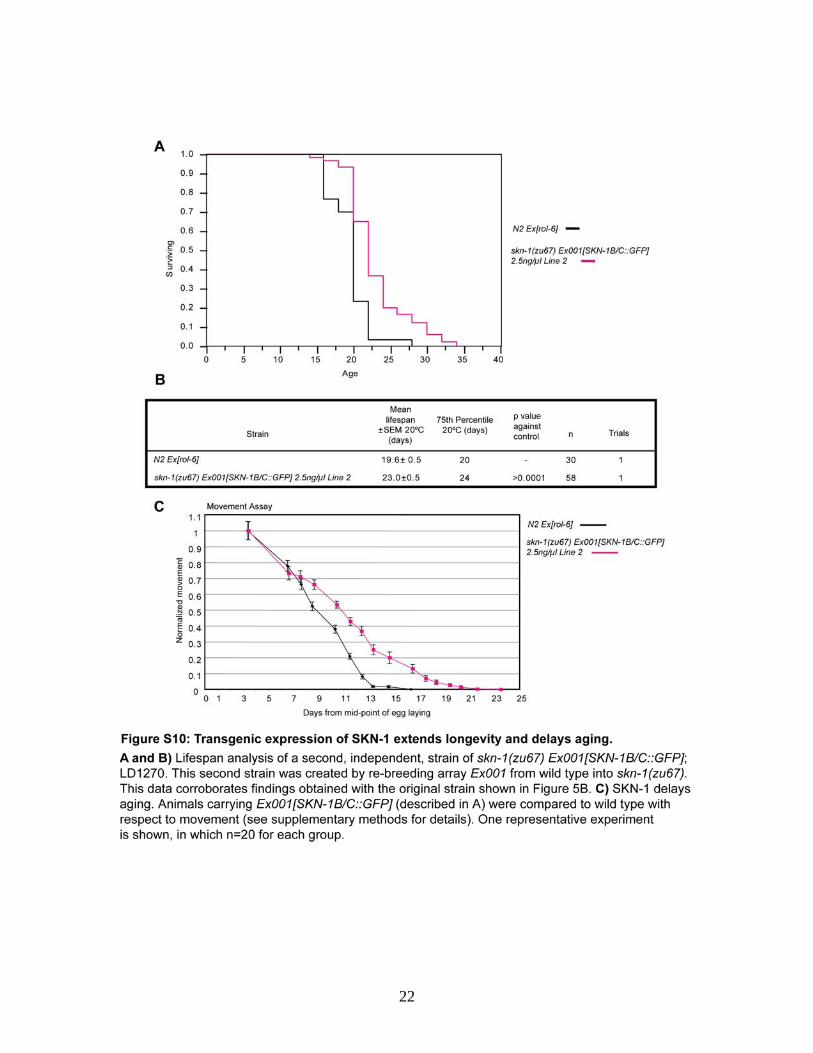
22
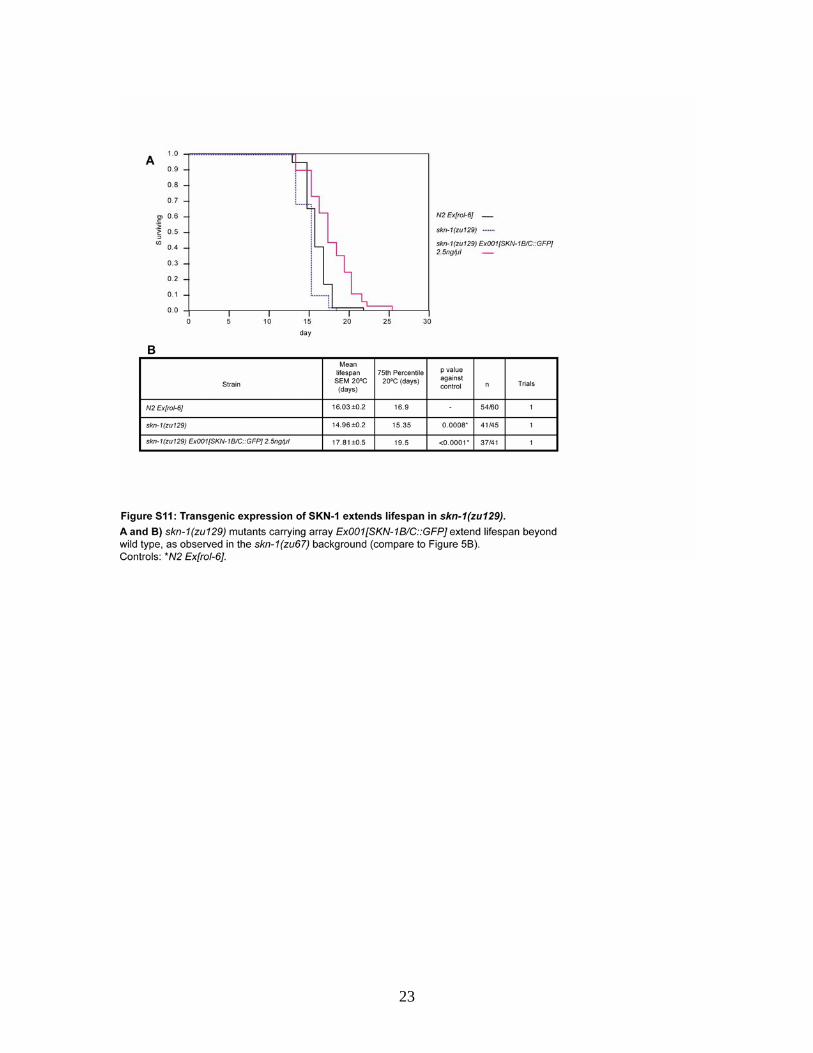
23
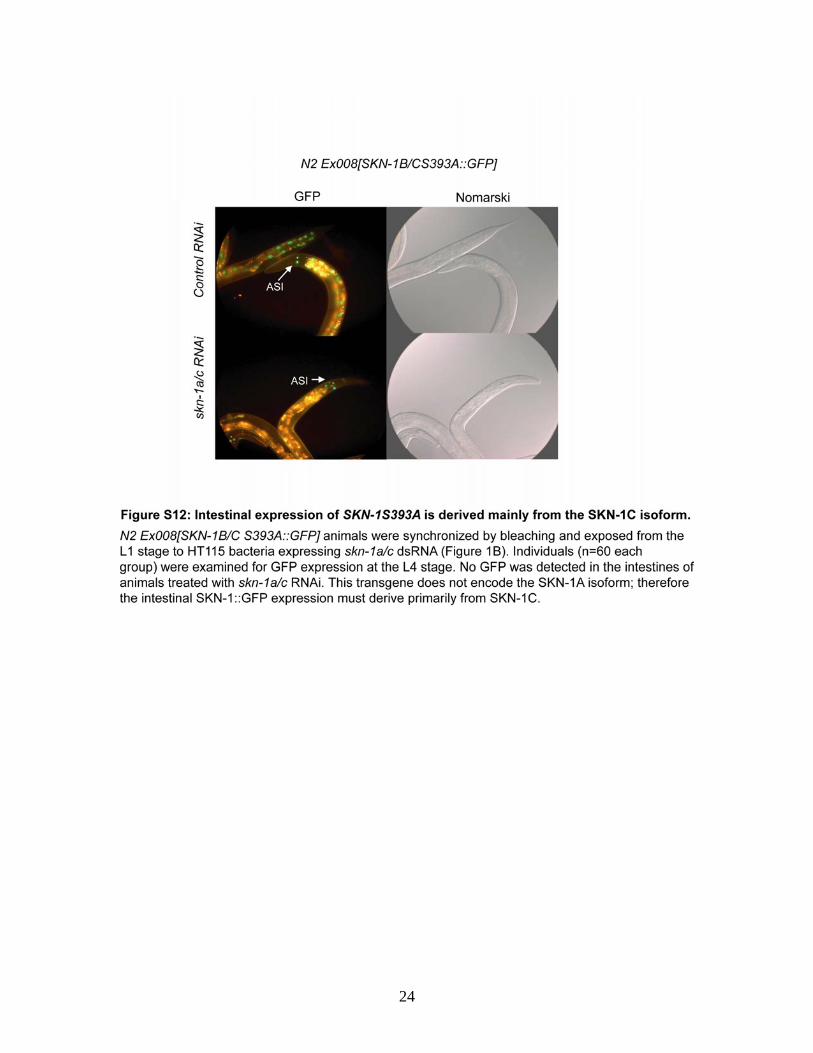
24
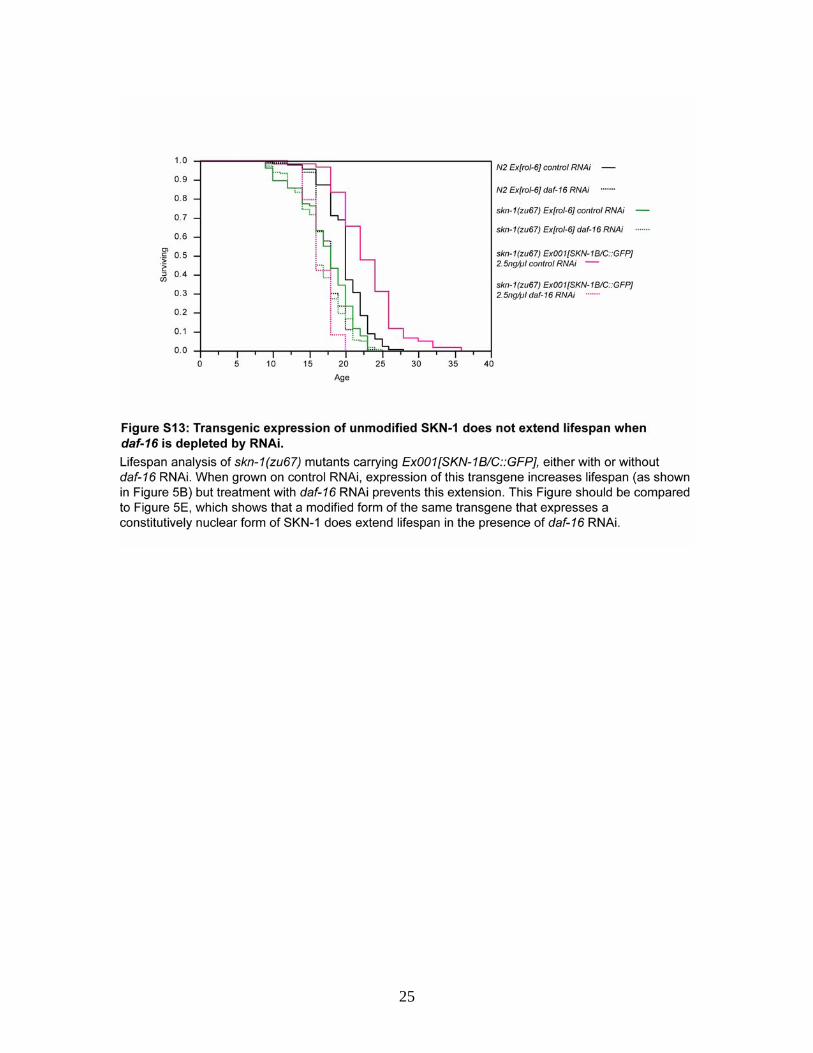
25
26