document resume ed 355 297 ud 029 056 … · nancy marie lopez professional golfer, ladies pga tour...
TRANSCRIPT

DOCUMENT RESUME
ED 355 297 UD 029 056
AUTHOR Florez, John; And OthersTITLE A Progress Report to the Secretary of Education from
the President's Advisory Commission on EducationalExcellence for Hispanic Americans. White HouseInitiative on Educational Excellence for HispanicAmericans.
INSTITUTION President's Advisory Commission on EducationalExcellence for Hispanic Americans (ED), Washington,DC.
PUB DATE 12 Oct 92NOTE 71p.
PUB TYPE Reports Descriptive (141)
EDRS PRICE MFO1 /PC03 Plus Postage.DESCRIPTORS Access to Education; *Advisory Committees; Agency
Role; Demography; Early Childhood Education;Educational Objectives; Elementary SecondaryEducation; Equal Education; *Excellence in Education;Federal Programs; Futures (of Society); GovernmentRole; *Hispanic Americans; Postsecondary Education
IDENTIFIERS America 2000; Hispanic American Achievement;*Hispanic American Education; Hispanic AmericanStudents; National Education Goals 1990; ProgressReporting
ABSTRACT
The President's Advisory Commission or. EducationalExcellence for Hispanic Americans was established by the 1990Executive Order 12729 to advise the Secretary of Education on how topromote quality education for Hispanic Americans. The Commission isalso responsible for providing advice to the Secretary on theprogress of Hispanic Americans toward the achievement of the NationalEducation Goals; assisting in establishing linkages among public andprivate educational institutions, government, the private sector, andHispanic communities for improving education; and providing advice onways to increase private sector and community involvement inimproving education. Using available measures and indicators theCommission found chat Hispanic Americar.s are failinE, to meet theNational Education Goals and are progressing more slowly than othergroups. The sources of information reviewed by the Commissionincluded: data on major issues and citizen concerns; information on
the participation of Hispanic Americans in nearly 600 education andeducation-related federal programs, special initiatives directedtoward advancing educational excellence for Hispanic Americans; anddemographic, socio-economic, and health profiles. The progress reportcovers the following topics: (1) a snapshot of the status ofHispanics in relation to the National Education Goals; (2) theCommission's ongoing efforts to assemble and examine relevantinformation and expert opinion; (3) an analysis of the challeng:faced by the nation in providing Hispanics with a quality education;(4) a statement of the Commission's vision for the majoreducation-related themes it is addressing, including greater parentalinvolvement and educational partnerships; and (5) finally, theCommission's proposed next steps for carrying out itsresponsibilities in support of educational excellence for HispanicAmericans and for increasing accountability in both governmental andthe educational community to ensure that appropriate progress ismade. An appendix contains two exhibits: an inventory of educationand education-related federal programs with Hispanic Americanparticipation; and demographic, socio-economic, and health profilesof Hispanic Americans. (AA)
U.S. DEPARTMENT OF EDUCATIONOft. of Er/wane:west Rematch and /repro...mom
EDUCATIONAL RESOURCES INFORMATIONCENTER (ERIC,
0 This document has bean reproduced isreColld from th INIesOn or orpanttationongtnahno et
0 Remo+ chance,a have boon made to 3mfa'OrentogoductIon Quality
Points of of OtersonS Mated in this docu-ment 60 not necemenly represent officialOERI position or coltCy
A Progress Report
to the
Secretary of Education
from the
President's Advisory Commission on
Educational Excellence for Hispanic Americans
la

4
The President's Advisory Commission on Educational Excellence
for Hispanic Americans
Commission Members
Andres Bande (Chair)President, AmeritechInternational, Inc.(Illinois)
Peter H. CoorsPresident, Coors BrewingCompany (Colorado)
Yvette Del PradoVice President for Education andPublic Affairs, TandemComputers, Inc. (California)
Jose R. c.-enzalezPresident, Int,sr AmericanUniversity of Puerto Rico(Puerto Rico)
Jacinto Pablo JuarezVice President for Instruction,Laredo Junior College (Texas)
Peter George MehasSuperintendent, Fresno County(California)
Diana S. NatalicioPresident, University of Texas atEl Paso (Texas)
Tania R. SealeAmerican History Instructor,Miami Senior t ligh School(Florida)
Raul H. YzaguirrePresident and CEO, NationalCouncil of La Raza (Texas)
Guadalupe C. Quintanilla (Vice Chair)Assistant Vice President,University of Houston(Texas)
Rose del Castillo GuibaultEditorial and Public Affairs Director,KGO-TV (California)
Ernest H. DrewPresident and CEO, Hoechst Celanese(New Jersey)
Donald R. GreenePresident, Coca-(..ola Foundation(Georgia)
Nancy Marie LopezProfessional Golfer, ladies PGA Tour(Georgia)
Robert J. MirandaPresident and CEO, Miranda, StrabalaAssociates (California)
Gloria Gonzales RoemerVice President, Roemer Oil Company(Colorado)
Carol Pendas WhittenExecutive Director, National Ccinmissionon Migrant Education(Maryland)
Lyn W. ZiegenbeinExecutive Director, Peter Kiewit Foundation
(Nebraska)
A Progress Report
to the
Secretary of Education
from the
President's Advisory Commission onEducational Excellence for Hispanic Americans
October 12, 1992
White House Initiative on Educational Excellence for Hispanic Americans
United States Department of Education
400 Maryland Avenue, S.W.
Washington, DC 20202
4
Table of Contents
TOPIC Page
Commission Members inside front cover
AcknowledgmentsLetter of Transmittal to the Secretary of Education vii.
Executive Order 12729 of September 24, 1990 ix
EXECUTIVE SUMMARY xiii
TOPIC 1 The Commission and Its Mandate 1-1
The President's Executive OrderThe Commission's Mandate
TOPIC 2 Hispanic Progress Toward the National Education Goals 2-1
National Education GoalsAMERICA 2000 Strategy
Hispanics and the National Education GoalsGoal 1
Goal 2Goal 3/Goal 4Goal 5
Goal 6Hispanic Progress through the American Educational System
TOPIC 3 Sources of Information for the Commission 3-1
Commission MeetingsPublic Forums on Hispanic EducationThe Commssion's Inventory of Education and Education-Related Federal
ProgramsHighlights of Special Initiatives in Hispanic Education
TOPIC 4 THE COMMISSION'S VISION 4-1
I ligher Expectations
J iii
Language, Cultural Awareness, and EmpowermentParental Involvement and Early Childhood EducationAccountability and Measurement ValidityEducational PartnershipsCommunity and Political EmpowermentPostsecondary EducationLifelong Learning
TOPIC 5 A Strategic View of the Challenges Ahead 5-1
Hispanic PotentialAn Untapped ResourceObstacles to Hispanic ContributionsWhy Americans Should Care
Leadership and Institutional Renewal
TOPIC 6 Next Steps 6-1
APPENDIX
EXHIBIT I inventory of Education and Education-Related Federal Programs
with Hispanic Participation 1-1
EXHIBIT II Demographic, Socio-economic, and Health Profiles of HispanicAmericans 11-1
0
iv

Commission Staff and Acknowledgements
Principal staff work for the Commission and the preparation of this progressreport were done by the following individuals:
John Florez, Executive DirectorChristopher V. Ruggles, Chief of StaffMarsha Harper, Secretary
Blanca Rodriguez, Grants Analysis Branch ChiefAnalysis and Forecasting DivisionOffice of Student Financial AidOffice of Postsecondary Education
Susan Hill, Senior Statistician National Science FoundationLaura Castellanos, Staff Attorney
Among others who provided research and counsel, reviewed drafts, andcontributed to this effort, the following deserve special thanks:
Synectics for Management Decisions, Inc.
Wray Smith, D.Sc., Project Director and Senior Research AssociateRobert Parke, Senior ConsultantGooloo S. Wunderlich, Senior ConsultantSameena M. Salvucci, Senior StatisticianHeidi Gerken, Graphics Specialist
Daniel Dower, Editor anatonsultantGlenda Zahller, Assistant Editorial Consultant
We are grateful for the assistance provided by the following officials, employees,and consultants at the U.S. Department of Education:
Assistant Secretary Lanny GriffithAssistant Secretary John D. MacDonaldAssistant Secretary Bruno MannoAssistant Secretary Carolyn Reid-WallaceDeputy Assistant Secretary Daniel Bonner
7V

George AmericaAnne BaileyJoyce CallowayRebecca CampoverdeStephen DanzanskyWade DykePatricia HallShirley HawkinsJohn Hill
Julie LaurelJames ManningCarlyle MawJohn MorriberronGail NidenhofferRon PetraccaMark Weston
Special thanks to the Department and Agency Liaisons who assisted in thegathering of the data for the Federal Program Inventory used in this report:
Roxanna ChahinSylvia Chavez-LongAlicia CoroEugene Cota-RoblesAna Maria FariasWilliam D. FrittsLorna GladstoneJames Guru leGuisila HarkinsLucy Higgins
John E. Lee, Jr.Roena MarkleyShirley MartinezRudy MunisSusan PradoCharlotte ReadRichard E. StephensPeter SuazoMillicent Woods
vi

ak,
THE WHITE HOUSEINITIATIVE ON EDUCATIONAL EXCELLENCE
FOR HISPANIC AMERICANS
Honorable Lamar AlexanderSecretary of EducationU.S. Department of EducationWashington, D. C. 20202
Dear Mr. Secretary:
October 12, 1992
On September 24, 1990 President Bush signed Executive Order 12729: EducationalExcellence for Hispanic Americans. It established within the Department of Education thePresident's Advisory Commission on Educational Excellence for Hispanic Americans.
It has been my privilege to chair this endeavor and on behalf of the members of the
Commission it is my pleasure to transmit this document, A Progress Report to theSecretary of Education from the President's Advisory Commission on EducationalExcellence for Hispanic Americans.
In this Progress Report the Commission describes the status of education for HispanicAmericans in the United States towards achieving the National Education Goals. Input wasobtained from citizens at public forums. Presentations were made at Commissionmeetings by representatives of national Hispanic organizations. Each made it clear that
serious problems exist in education for Hispanic Americans.
The Commission deeply believes educational reform for Hispanic Americans is essentialto the well being of the Nation. The challenge ahead requires bold leadership and awillingness to move toward a vision of the issues and promising directions that areneeded to achieve educational excellence for Hispanic Americans.
Each member of the Commission appreciates your support and assistance in thepreparation of this progress report. We look forward to continued collaboration with youand the Department of Education as we move towards providing advice in a final report.
The other Commissioners and I sincerely appreciate the opportunity to serve our countryas members of the President's Advisory Commission on Educational Excellence forHispanic Americans, and on their behalf I remain,
Res ctfully,
ndres Bande'hairman,
400 MARYLAND AVE . S.W. WASHINGTON. D C. 20202
rsg
Executive Order 12729 of September 24, 1990
Educational Excellence for Hispanic Americans
By the authority vested in me as President by the Constitution and the laws ofthe United States of America, and in order to advance the development of humanpotential, to strengthen the capacity to provide quality education, and to increaseopportunities for Hispanic Americans to participate in and benefit from Federalprograms, it is hereby ordered as follows:
Section 1. There shall be established, in the Department of Education, thePresident's Advisory Commission on Educational Excellence for HispanicAmericans. The members of the Commission shall be appointed by the Presidentand shall report to the Secretary o Education. The Commission shallcompriserepresentatives of educational, business, professional, and civic organizationsthat are committed to improving education, including organizations representingHispanic Americans, as well as other persons deemed appropriate by the
President.
Sec. 2. The Commission shall provide advice to the Secretary of Education on the
progress of Hispanic Americans toward achievement of national education goalsand on such other aspects of the educational status of Hispanic Americans as it
considers appropriate.
Sec. 3. The Secretary of Education shall establish the White House Initiative("Initiative") on Educational Excellence for Hispanic Americans. The Initiativeshall be housed in, staffed, and supported by the Department of Education. TheInitiative shall assist the Commission and the Secretary of Education in theiractivities to establish linkage between the Department of Education, HispanicAmericans, and the education and business community. The Initiative shall alsoassist the Secretary of Education in carrying out the Secretary's responsibilities
under this order.
Sec. 4. To the extent permitted by law, the Commission shall provide advice tothe Secretary of Education as the Secretary develops and monitors Federal efforts
to promote quality education for Hispanic Americans. Particular emphasis shall

be given to: enhancing parental involvement; promoting early childhoodeducation; removing barriers to success in education and work, particularlylimited proficiency in the English language; and, helping students to achievetheir potential at all educational levels. The Commission will also provide adviceon ways to increase private sector and community involvement in improvingeducation.
Sec. 5. The Secretary of Education shall periodically report to the President onthe progress achieved by Hispanic American students toward national educationgoals. The reports shalt identify efforts of executive departments and agencies toimprove the qualify of education for Hispanic Americans and shall include dataavailable on the participation of Hispanic Americans in Federal educationprograms. The reports shall also include any advice of the Commission andappropriate recommendations for improving Federal education programs.
Sec. 6. To the extent permitted by law, executive departments and agencies shallbe actively involved in helping advance educational opportunities for HispanicAmericans, including working with individuals and educational, business, andcommunity groups serving Hispanic Americans. Executive departments andagencies, to the extent feasible, shall cooperate with the Secretary of Education inthe preparation of the reports. The White House Office of National Service shallhighlight and encourage the efforts of volunteer:: and the private sector toimprove the quality of education for Hispanic Americans.
Sec. 7. The Secretary of Education is directed to establish an AdvisoryCommission entitled the President's Advisory Commission on EducationalExcellence for Hispanic Americans. As provided in Section 1 of this order, themembers of the Commission shall be appointed by the President.Notwithstanding any other executive order, the functions of the President underthe Federal Advisory Committee Act, as amended (5 U.S.C. App.), except that ofreporting to the Congress, which are applicable to the Advisory Commission tobe established by this order, shall be performed by the Secretary of Education, inaccordance with the guidelines and procedures established by the Administratorof General Services.
George Bush
THE WHITE HOUSE,September 24, 1990

f
Executive Summary
12

EXECUTIVE SUMMARY
The Commission and Its Mandate
In 1989, President Bush asked his Domestic Policy Council to conduct a thoroughreview of the apparent crisis in Hispanic education. The Council concluded thatthe nation faced a challenge. At a time when Hispanic Americans are becomingone of the fastest growing minority groups in the United States, they areexperiencing declines in educational attainment. Acting on the Council'srecommendations, President Bush signed Executive Order 12729: EducationalExcellence for Hispanic Americans, on September 24, 1990.
The President's Advisory Commission on Educational Excellence for HispanicAmericans was established by Executive Order 12729 to advise the Secretary ofEducation on how to promote quality education for Hispanic Americans. Underthe executive order, the Commission is responsible for providing advice to theSecretary of Education on the progress of Hispanic Americans towardachievement of the National Education Goals; advising the Secretary on thedevelopment and monitoring of Federal efforts to promote quality education forHispanic Americans; assisting in establishing linkages among public and privateeducational institutions, government, the private sector, and Hispaniccommunities for improving education; and providing advice on ways to increaseprivate sector and community involvement in improving education.
A Profile of the Hispanic American Population
At the time of the 1990 Census there were approximately 22.4 million persons ofHispanic origin in the United States (who may be of any race), comprising 9percent of the total U.S. population. (These figures do not include the residentsof Puerto Rico.) During the decade 1981 to 1990 the Hispanic populationincreased by 53 percent, from 14.6 million in 1980. This compares with a growthrate of 9.8 percent in the total resident population of the United States. From1990 to 2010 the Hispanic population is expected to increase from the current 9percent to 14 percent of the total U.S. population, comprising the largest minoritygroup in the United States.'
The Hispanic population of the United States is not a homogenous entity, itrepresents some of the earliest and some of the most recent migrants to thiscountry. According to the March 1991 Current Population Survey,approximately three-fifths (63 percent) of Hispanic Americans were Mexican in
/1
origin, representing the largest and probably the most highly concentratedsegment of the Hispanic population; about 11 percent were from Puerto Rico; 5percent were from Cuba; about 14 percent were from Central and SouthAmerica; and over 7 percent were from other Hispanic regions.
IHispanic Progress and the National Education Goals
In 1989, the President and the nation's Governors adopted six NationalEducation Goals. The Goals identify levels to be achieved by the year 2000 inreadiness for schooling, high school completion, competence in specific subjects,adult literacy, and establishment of an environment conducive to learning.
The President's Advisory Commission is dedicated to strengthening America'scapacity to provide quality education for Hispanic Americans and therebyachieving the National Education Goals. The Commission's work is assisted bythe White House Initiative on Educational Excellence for Hispanic Americans,which was established by the Secretary of Education pursuant to the executiveorder.
A comparison of the educational status of Hispanics against the NationalEducation Goals together with an analysis of apparent trends, whether favorableor unfavorable, is helpful in achieving an understanding of just how muchprogress the nation needs to make during the next eight years. Availablemeasures and indicators show that Hispanic Americans are failing to meet theNational Education Goals and are progressing more slowly than other groups.
ISources of information for the Commission
Following its first organizing meeting in November 1991, the Commission metfour times and has received testimony from a wide variety of sources. With theassistance of the White House Initiative staff, the Commission has reviewed:
Data on major issues and citizen concerns, including those raised atregional Public Forums on Hispanic Education conducted by theDepartment of Education prior to the establishment of the Commission;
Information on the participation of Hispanic Americans in nearly 600education and education- related Federal programs, obtained in responseto a request from the Secretary of Education initiated by the Commission;
xiv

Special initiatives directed toward advancing educational excellence forHispanic Americans that are under way throughout the United States (inkeeping with its mandate, the Commission has begun to highlightinitiatives undertaken by national Hispanic organizations);
Demographic, socio-economic, and health profiles of the U.S. Hispanicpopulation and its subgroups, providing an overview of the characteristicsof Americans of Hispanic origin that are judged to have an impact oneducational and economic achievement.
The Commission, in addition to examining indicators of Hispanic progressthrough pre-primary, elementary, and secondary education, has also focused onpostsecondary education. The Commission noted evidence of Hispanic progress(there has been an increased college enrollment and number of degrees earnedby Hispanics), but is concerned with the fact that a smaller fraction of Hispanichigh school graduates (18 to 24 years old) are enrolled in college than are Whiteand Black graduates, and that fewer Hispanics are pursuing graduate andprofessional programs.
Tracking Hispanic progress toward the National Education Goals requires anunderstanding of the "educational pipeline" through which Hispanic studentsand other students progress in the American educational system. ManyHispanics fall behind at every level of their movement through the educational
system:
There are fewer Hispanics in preschool education;
There are fewer keeping up with their age groups;
There are more dropping out and dropping out earlier;
There are fewer completing high school;
There are fewer enrolled in college, with more dropping out of college.
The analysis of education and related programs needs to include an examinationof the goals and conceptual models on which the Commission's efforts are based.
IThe Commission's Vision
Since the Commission's first meeting in November 1991, several educationalthemes have regularly been 4rought to its attention by members of the Hispanic
xv

community, educators, other experts, and individual Commission members.These include:
Higher expectations for Hispanic children;
Language achievement, cultural awareness, and empowerment;
Greater parental involvement and early childhood education;
Accountability and measurement validity;
Educational partnerships;
Community and political empowerment in Hispanic communities;
Postsecondary education;
Lifelong learning.
These themes provide a foundation for the vision that guides the Commissionand its work. Through an articulation of its vision, the Commission is providinga direction for Hispanics and other Americans to identify the critical issues andsearch out answers to the challenges ahead.
A Strategic View of the Challenges Ahead
As the United States positions itself to meet the social and economic challenges ofa rapidly changing economy and world order, the emergence of the HispanicAmerican population as a major socio-economic force must be recognized as anasset. The Commission's "Strategic View of the Challenges Ahead"acknowledges the Hispanic culture's strong work ethic, family consciousness,community-mindedness, and patriotism. Full participation by Hispanics in thenation's economy and society, therefore, will mean that America can lookforward to a population that seeks access to opportunities to work and pay taxes,while contributing to the social well-being of local communities and the nation.
Unfortunately, while the potential for Hispanic contributions to the nation'swell-being in these and other areas is great, there are many obstacles, includinghigh rates of school dropout, relatively low educational attainment, languagebarriers, low expectations, and overcrowded schools.
xvi

INext Steps
In this progress report the Commission provides an overview of the currentstatus of Hispanics in achieving the National Education Goals, describes thesources to which it has turned for input, and offers a strategic view of thechallenges ahead. In the Next Steps section of this report the Commission thensets forth how it proposes to carry out its mandate. The Commission's efforts aredirected toward:
Encouraging the establishment and development of a national Hispaniceducation council;
Completing the inventory of education-related Federal programs;
Examining the prospects for including data collection activities forHispanic education in ongoing statistical improvement programs;
Developing a recommended position for the Secretary of Educationregarding the implications of national assessments for Hispanic students;
Examining other areas that may lead to Commission recommendatioi is tothe Secretary of Education, including promoting early childhoodeducation; removing barriers to success in education and work,particularly limited proficiency in the English language; and helpingstudents to achieve their potential at all educational levels.
This progress report aims to establish a framework for systematically analyzingpublic policy problems and recommending innovative solutions.
_rxvii

Topic 1_L)

TOPIC 1 The Commission and Its Mandate
The President's Executive Order: In 1989, President Bush, recognizing that theNational Education Goals would not be achieved for Hispanic Americanswithout special initiatives, asked his Domestic Policy Council to conduct athorough review of education for Hispanic Americans. As a result, theDepartment of Education held six regional public forums on Hispanic education.The citizens who spoke at the public forums made it clear that a serious problemexists in education for Hispanics. After receiving recommendations from theDomestic Policy Council, President Bush then signed Executive Order 12729:
Educational Excellence for Hispanic Americans on September 24, 1990.
The Commission's Mandate: Executive Order 12729 established the President'sAdvisory Commission on Educational Excellence for Hispanic Americans. TheCommission is to advise the Secretary of Education on how to promote qualityeducation for Hispanic Americans. The Commission is primarily charged with:
Providing advice to the Secretary of Education on the progress of HispanicAmericans toward achievement of the National Education Goals;
Advising the Secretary of Education on Federal efforts to promote qualityeducation for Hispanic Americans;
Establishing linkages among public and private educational institutions,government, the private sector, and Hispanic communities in improving
education;
Providing advice on ways to increase private sector and communityinvolvement in improving education.
What follows is the progress report of the Commission, organized into topicscovering: (1) a snapshot of the status of Hispanics in relation to the NationalEducation Goals; (2) the Commission's ongoing efforts to assemble and examinerelevant information and expert opinion; (3) an analysis of the challenge faced by
the nation in providing Hispanics with a quality education; (4) a statement of the
Commission's vision for the major education-related themes it is addressing,
including greater parental involvement and educational partnerships; and (5)
fin-11y, the Commission's proposed next steps for carrying out its responsibilities
in support of educational excellence for Hispanic Americans and for increasingaccountability in both government and the educational community to ensure that
appropriate progress is made.
1-1

The exhibits in the appendix contain additional documentation, includinginformation from the Commission-sponsored inventory of Hispanic participationin education and education-related Federal programs and demographic,socio-economic, and health profile of Hispanic Americans.
2;f
1-2

Topic 2

TOPIC 2 Hispanic Progress Toward the National Education Goals
National Education Goals: In 1989, the President and the nation's Governorssounded an organizing theme for reform in education by adopting six Nati analEducation Goals to be achieved by the year 2000.
GOAL 1 All children in America will start school ready to learn.
GOAL 2 The high school graduation rate will increase to 90 percent.
GOAL 3 American students will leave grades four, eight, and twelve havingdemonstrated competency in challenging subject matter includingEnglish, mathematics, science, history, and geography; and everyschool in America will ensure that all students learn to use theirminds well, so that they may be prepared for responsible citizenship,further learning, and productive employment in a modern economy.
GOAL 4 U.S. students vill be first in the world in science and mathematicsachievement.
GOAL 5 Every adult American will be literate and will possess the knowledgeand skills necessary to compete in a global economy and exercise therights and responsibilities of citizenship.
GOAL 6 Every school in America will be free of drugs and violence and willoffer a disciplined environment conducive to learning.
AMERICA 2000 Strategy: AMERICA 2000 is a long-term education strategyproposed by President Bush to help all Americans reach the National EducationGoals by the year 2000. Involvement in the strategy, at both the national and thecommunity level, can bring about change and improvement in education forHispanic Americans and close the skills gap between Hispanics and otherAmericans. Pursuing the AMERICA 2000 strategy will also further the objectivesof Executive Order 12729. Specific ways that the Hispanic American communitywill benefit include: better accountability, including the development ofperformance standards and benchmarks to measure success in achieving theNational Education Goals for Hispanic Americans; innovation, including theestablishment in Hispanic communities of New American Schools that meet theirspecial needs; lifelong learning, including public and private partnerships tosupport continuing education in life and job skills training where I lispanic
2 2 -1

Americans can receive assessment and referral services, family literacyprograms, job skills and English as a Second Language (ESL) programs.
IHispanics and the National Education Goals
A comparison of the educational status of Hispanics today with the NationalEducation Goals for the year 2000 makes dear the progress that must be madewithin the next eight years to achieve educational excellence for this growinggroup of Americans. In this section of the progress report the Commissionfocuses on each of the National Education Goals and presents indicators for theHispanic population in relation to each goal. For some goals, no direct measuresare available, either for the population in general or for Hispanics in particular, inthese cases, the closest indirect indicator is used.
111,1\111k 1.1,k.k.1 u1 1.110 d,11,1 plt,kllick1 III (HP, I1T4,1 t t1,1101%,
11,i):11)1 Ork. 111(1,l' I1,, tIlln,C1\ p\'1,01) \ .11), I'LIC110( 1111,M, ( \nlrrl, othc,h.r,ink \
1 ht. LI,11,1 ,,11 1 1 111.1\
\ 11; 111111 I I H-1,11,
1.111.1kt tillIk'111Ck1
11\
1Hk Int 11F,1(,I11 \ 111,1011 1,11,1 ri'l,t,11, n1 I'llt'11t
2-2BEST Uiri;
yF

,
The pie chart below shows graphically the proportions of the Hispanic Americanpopulation contributed by each of the population subgroups (See Figure 2.1).
Mexican 63%
Puerto Rican 11%Central & S. American
SOURCE: Bureau of the Census
Figure 2.1 Hispanic Americans by Origin: 1991
GOAL 1
National Education Goal 1 states that by the year 2000, all children in Americawill start school ready to learn.
Pre-Kindergarten Education: Only 20 percent of Hispanic children 3 to 4 yearsold are enrolled in pre-kindergarten, compared with 40 percent of Whitechildren. The Hispanic children least likely to be enrolled in pre-kindergartenare those from low-income families in which the mother has not completed highschool 2 (See Figure 2.2).
2
2-3
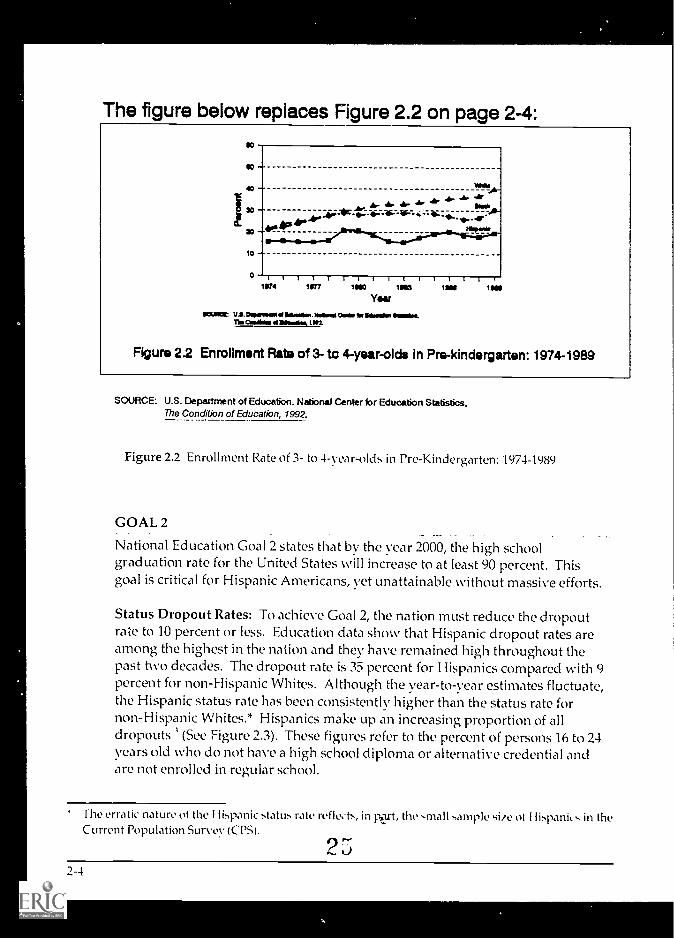
The figure below replaces Figure 2.2 on page 2-4:
I
10
MO
40 VIM*
10 .40.:ar.ts
....410
10
0111111111111111.1074 1077 INC INC 1844 1800
Year=PIM U.S.DaisMosit . Mira Omar
The Callon dbitssaiwa, 11112
Figure 22 Enrollment Rate of 3- to 4-year -olds in Pre-kindergarten: 1974-1989
SOURCE: U.S. Department of Education. National Center for Education Statistics,The Condition of Education, 1992.
Figure 2.2 Enrollment Rate of 3- to 4-year-olds in Pre-Kindergarten: 1974-1989
GOAL 2
National Education Goal 2 states that by the year 2000, the high schoolgraduation rate for the United States will increase to at least 90 percent. Thisgoal is critical for Hispanic Americans, yet unattainable without massive efforts.
Status Dropout Rates: To achieve Goal 2, the nation must reduce the dropoutrate to 10 percent or less. Education data show that Hispanic dropout rates areamong the highest in the nation and they have remained high throughout thepast two decades. The dropout rate is 35 percent for Hispanics compared with 9percent for non-Hispanic Whites. Although the year-to-year estimates fluctuate,the Hispanic status rate has been consistently higher than the status rate fornon-Hispanic Whites.* Hispanics make up an increasing proportion of alldropouts (See Figure 2.3). These figures refer to the percent of persons 16 to 24years old who do not have a high school diploma or alternative credential andare not enrolled in regular school.
Cote erratic nature of the I likpanic StatthN rate refles-ts, in part, the small sample siie of I iispanks in theCurrent Population Survey (CPS.
2-4

40
30
10
0
a Black, non-Hispanic11.- -**
Total.m.*......m It al *. .10 0
A-- A- A. -A -A --AA-- A. A, & * 'M n.
White, non-Hispanic
111 111I111111111I11172 73 74 75 76 77 78 79 80 81 82 83 84 85 86 87 88 89 90 91
Year
SOURCE: U.S. Department of Commerce, Current Population Survey,October, unpublished data.
Figure 2.3 Status Dropout Rates for Persons Ages 16-24, by Race and Ethnicity: 1972 1991
Status Dropout Rates for Hispanic Subgroups: In November 1989, the dropout
rates for all Hispanics, for Mexican-Americans, and for Puerto Ricans were threetimes the rate for non-Hispanics. The rate for Cuban Americans was about thesame as the non-Hispanic rate (See Table I).
2 C
2-5

Table IRate and Number of Status Dropouts, Ages 16-24, by Hispanic Subgroup: Fall 1989
Hispanic subgroup Status dropout rate Number of dropouts(in thousands)
Total 31.0 1,055
Cuban 9.2 10
Mexican 35.8 783
Puerto Rican 32.1 123
Other 19.0 139
NOTE: Percentages may not sum to 100 due to rounding.'11:Migration and Dropping Out: Forty-five percent of the Hispanic populationages 16 to 24 was born outside the U.S. mainland, and their dropout rate is veryhigh, 43 percent (See Figure 2.4).
The figure below replaces Figure 2.4 on page 2-6:
44.7%
Hispanic
27.4%
213.0%01.2%
Non-Hispanic
Born outside 50 stem and D.C.First generation
o Sawa! generation or more
SO I= boor WM Owe., 0~4 Pepuldim bomb INS.
Figure 2.4 Recency of Migration Among 18-to-24-year-olds by Ethnicity: 1989
SOU:ICE: Bureau cl 1, Census. Current Popo:410w Survey. 1900.
Figure 2.4 Recency of Migration Among 16-to-24-ear-olds by Ethnicity: 1989
Recency of Migration and Dropping Out: For each of the threegroups listed inTable 11, the rate for Hispanic young adults is much higher than Cie rates fornon-Hispanics in the same age group (Sec Table II).
2 -6
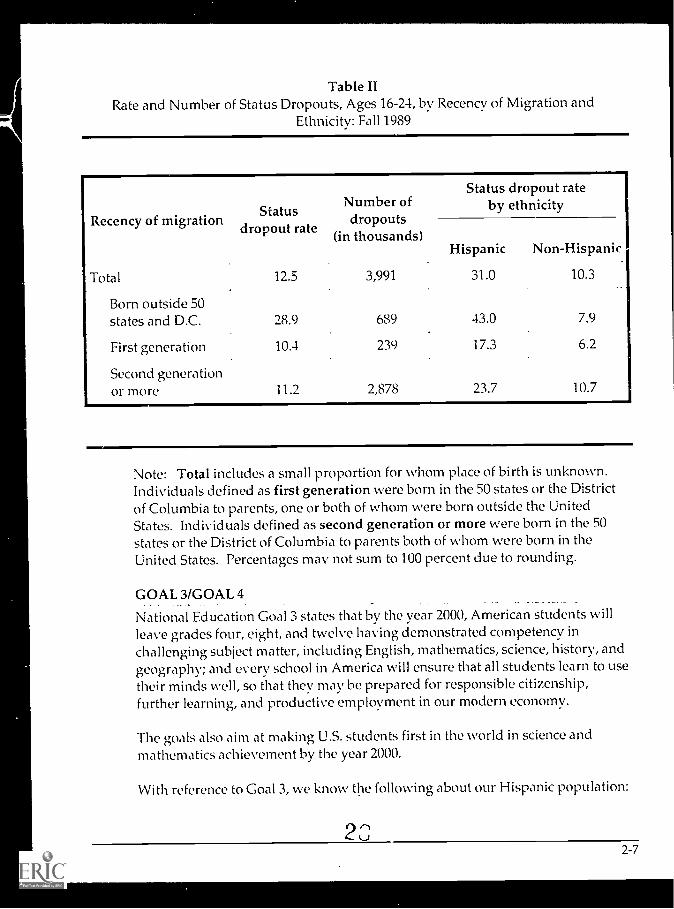
Table IlRate and Number of Status Dropouts, Ages 16-24, by Recency of Migration and
Ethnicity: Fall 1989
Recency of migration
Total
Born outside 50states and D.C.
First generation
Second generationor more
Statusdropout rate
12.5
28.9
10.4
11.2
Number ofdropouts
(in thousands)
3,991
689
239
2,878
Status dropout rateby ethnicity
Hispanic
31.0
43.0
17.3
23.7
Non-Hispanic
10.3
7.9
6.2
10.7
Note: Total includes a small proportion for whom place of birth is unknown.Individuals defined as first generation were born in the 50 states or the Districtof Columbia to parents, one or both of whom were born outside the UnitedStates. Individuals defined as second generation or more were born in the 50states or the District of Columbia to parents both of whom were born in theUnited States. Percentages may not sum to 100 percent due to rounding.
GOAL 3/GOAL 4
National Education Goal 3 states that by the year 2000, American students willleave grades four, eight, and twelve having demonstrated competency inchallenging subject matter, including English, mathematics, science, history, andgeography; and every school in America will ensure that all students learn to usetheir minds well, so that they may be prepared for responsible citizenship,further learning, and productive employment in our modern economy.
The goals also aim at making U.S. students first in the world in science andmathematics achievement by the year 2000.
With reference to Goal 3, we know the following about our Hispanic population:
22-7

English: Hispanics at ages 9 and 13 were reading at about the same level in 1990as in 1975, while 17-year-old Hispanics were doing significantly better in 1990than they were in 1975. Writing proficiency among Hispanics of all three agegroups did not improve between 1984 and 1990, with average scores remainingat minimal proficiency levels.'
Mathematics: The average math proficiency of Hispanic youths ages 9 and 13increased from 1973 to 1990, while that of 17-vear-olds did not change. The gapbetween Hispanics and Whites at all three age levels has remained the same since1982.' Twelve percent of Hispanics, compared with six percent of Whites, weretaking remedial math or no math at all in grade eight."
Science: The average science performance of 9- and 13-year-old Hispanics in1990 showed improvement over scores from 1977, while those of 17-year-oldsdid not improve over the same period. Still, Hispanics had lower scores thanWhites at all three ages, although the gap narrowed among 13-year-olds. At age17, Hispanics on average had science proficiency skills comparable to White13-year olds.'
Postsecondary Education for Hispanic Americans:* Hispanics have the lowestenrollment rate of any group in higher education. Approximately 29 percent ofHispanic high school graduates were enrolled in college compared with 39percent for Whites and 31 percent for Blacks. Moreover, Hispanics who enroll incollege are more likely to enroll in a two-year college than White or Blackstudents. In 1990, 55 percent of Hispanic college students were enrolled intwo-year community colleges compared with 37 percent of non-Hispanic Whiteand 42 percent of non-Hispanic Black students: Hispanics are also least likely tocomplete four or more Years of college. In 1990 their college completion rate was9 percent compared with 21 percent for non-Hispanic Whites 25 years and older.Furthermore, a very small number of Hispanic students who complete bachelor'sdegrees pursue graduate and professional programs:
GOAL 5
Goal 5 states that by the year 2000, every adult in America will be literate andwill possess the knowledge and skills necessary to compete in a global economyand exercise the rights and responsibilities of citizenship.
One way to estimate the lack of literacy is to count those persons who havecompleted less than five years of schooling. In 1991, 12.5 percent of Hispanic
Vocational 4education is an important part of postsecondary education for minority students.However, the Commission has not vet identified any comprehensive indicators or data fromvocational and adult education programs.
2-8
2)

adults 25 years and older had not completed the fifth grade, compared with 2.4percent in the total population.`'
GOAL 6
National Education Goal 6 states that by the year 2000, every school in Americawill be free of drugs and violence and will offer a disciplined environmentconducive to learning.
Drugs: A Department of Health and Human Services survey found that thepercentage of Hispanic high school seniors who had used drugs was lower thanthe rate reported among White high school seniors for the years 1985 through1989.'1'
Violence in School: Another survey found that the types of violenceexperienced by Hispanic students ages 12 to 19 in school were generally similarto violence reported by White students. However, Hispanic students were threetimes more likely to report the presence of street gangs in their schools.'"
Hispanic Progress Through the American Educational System: TrackingHispanic progress toward the National Education Goals requires anunderstanding of the ways in which Hispanic students and non-Hispanicstudents progress through the American educational system, eventually leavingas either graduates or dropouts.
The Educational Pipeline for Hispanic .linericans: Fewer Start, Fewer Firrislr, leirerkeep the
li,111 ct nl,llt,l p)int th,.,iii-11,,11.11i,tr,11,), I li,r,111!,. i.4111:,1 NA 1,1,-
\ ' '1' ''' I h-i' "''' It t `It `-1 k I I .11
\ Ho, I 1,1,1 1 11-1` .1 I',
I. , I I. ,
I..11.11.. ,11,111,1' I 1,
I11.111 ,-t II11111
\ 1\\ t'l rt,rtI'1011," t lill Ilt,i1:1.
011111111111t 11'iil I
2-9

Topic 3

TOPIC 3 Sources of Information for the Commission
The Commission has secured input from a number of experts who spoke atCommission meetings has studied the views of the Hispanic communityexpressed at public forums conducted around the U.S. by the Secretary ofEducation. In addition, the Commission gathered information by: (1) conductinga preliminary study of Hispanic participation in education-related Federalprograms; (2) looking at what is being done to advance education excellence for
Hispanic Americans by national Hispanic organizations; and (3) examiningdemographic, socio-economic, and health statistics on the Hispanic population.Further documentation of the Commission's information-gathering efforts isprovided in the appendix.
Commission Meetings: Following their swearing-in and first meeting inNovember 1991, members of the Commission met in January, April, June, andAugust 1992 to frame the issues, plan the Commission's work, hear from invitedexperts, and draft this progress report.
Public Forums on Hispanic Education: To secure the grassroots views of theHispanic community, public forums for Hispanic education were conductedduring 1989 by the Department of Education at various locations around thenation. Forum participants included: state and local officials, Hispanicorganizations, teachers at the precollegiate and college levels, and workingparents of Hispanic students. All expressed their concerns about the quality ofeducation being offered to Hispanic students, and voiced their concerns for thefuture of those students at risk of dropping out and about the fate of dropoutsnot being served at all.
The Commission's Inventory of Education and Education-Related FederalPrograms: In early 1992, the Commission asked the Secretary of Education torequest information from each Federal department and agency receiving asignificant amount of funding for education and related programs. Specifically,the Commission sought data on the participation of Hispanics in these programs,including information on the program's legislative intent, the relation of theprogram to the National Education Goals, the eligible population and actualparticipation by race/ethnicity, and financial information. Participation datawere also requested by Hispanic subgroup and by state, if available. EachFederal department and agency designated a liaison official (appointed by thehead of the department or agency) who distributed an inventory form to themanagers of these education and related programs. The data collection wascarried out from April to July 1992. Almost 600 programs provided responses to
3-1
the Commission's inventory. Because of time constraints in completing theinventory, extended instrument-development activities were not possible, norwere formal post-survey follow-up interviews conducted. The informationgathered in this first round of data collection, therefore, is regarded aspreliminary. (The principal results are presented in Exhibit I of the Appendix.)
Highlights of Special Initiatives in Hispanic Education: The Commission haslooked at many efforts to advance excellence in the education of HispanicAmericans. Initiatives are being conducted in many settings with both local andnational leadership. The following initiatives are sponsored by national Hispanicorganizations, whose leadership efforts can assist in the implementation of theAMERICA 2000 strategies within the Hispanic community.
The ASPIRA Model: The ASPIRA Association has been devoted toimproving education for Puerto Ricans and other Latinos for 30 years. Itswork is founded on a process, "the ASPIRA Model," that featuresawareness of community problems, analysis of their causes and possiblesolutions, and action to initiate programs and advocate change. ASPIRA'sservices are offered through clubs in high schools and middle schools insix major U.S. cities and Puerto Rico. Participating students, "aspirants,"are given opportunities to develop leadership and academic skills. Inworkshops, seminars, and discussion groups they learn to work together,provide peer support for one another, and strive for group rather thanindividual goals.
LULAC National Education Service Centers, Inc.: LULAC is the largestmembership and oldest Hispanic organization in the United States. It hasmore than 400 chanters, many of which have active scholarshipfundraising drives. LULAC operates 15 service centers aimed at helpingprovide timely information to help youth complete school.
Project EXCEL: NCLR's Project EXCEL (EXcellence in CommunityEducational Leadership) has worked to improve educational opportunitiesfor Hispanic students. EXCEL's six innovative community-basededucation models have served more than 5,000 Hispanic in-school childrenand youth, dropouts, parents, and teachers in more than 40 communities,and have been adopted by public, parochial, and alternative schools andby university-based precollegiate programs. NCLR provides models,innovative curriculum, training, technical assistance, seed grants, andmonitoring and evaluation to assist local groups in implementing themodels. Nearly 400 Hispanic community-based organizationrepresentatives have received training.
3-2

SER Family Learning Centers: Intergenerational learning in whichgrandparents and parents join with children as a way of helping themlearn is the focus of the SER Family Learning Centers operated at 52 sitesaround the United States by SER Jobs for Progress. SER Jobs for Progressis a nonprofit Hispanic service corporation founded in 1964 by the twooldest and largest U.S. Hispanic volunteer organizations, the American GIForum and the League of United Latin American Citizens (LULAC), withfunding from the U.S. Department of Labor and the Office of EconomicOpportunity (Poverty Program). SER-Jobs for Progress receivesleadership and support from a council, Amigos de SER, consisting ofexecutives of major corporations.
In addition to these initiatives under local and national Hispanic organizations,there are many other promising local and national efforts within the business,religious, and nonprofit sectors.
3-3

Topic 435

TOPIC 4 -- THE COMMISSION'S VISION
Since the Commission's first meeting in November 1991, members of theHispanic community, educators, other experts, and individual Commissionmembers have helped the Commission move toward a vision of the issues,problems, and promising directions that are needed to achieve educationalexcellence for Hispanic Americans. Principal themes have included:
Higher expectations;
Language, cultural awareness, and empowerment;
Parental involvement and early childhood education;
Accountability and measurement validity;
Educational partnerships;
Community and political empowerment;
Postsecondary education;
Lifelong learning.
These themes have formed the vision that guides the Commission and its work.Through an articulation of this vision, the Commission is laying the foundationfor Hispanics and other Americans to identify the critical issues and search outsolutions to the problems facing Hispanic Americans.
THE VISION
Higher Expectations
All children will be expected to learn ifgiven the attention and the expectationthat they can succeed.
THE CHALLENGE
Some educators often have lowexpectations for Hispanic students,which become a self-fulfilling prophecy,affecting their achievement andhindering their placement intohigh-quality picgrams.
4-1

Lk
Language, Cultural Awareness, andEmpowerment
Recognizing that it is an asset to be ableto speak more than one language,Hispanic Americans will be empoweredto participate fully in the opportunitiesof our society, with English languageskills to augment their Spanishlanguage and culture.
Parental Involvement and Ear!yChildhood Education
The parent is the child's first teacherand efforts will focus on helping theparent and the family unit in carryingout that role.
Accountability and MeasurementValidity
Educational institutions at all levelsmust be accountable and will measuresuccess by outcomes rather than byprocess.
Educational Partnerships
A partnership among education, theprivate sector, and the Hispaniccommunity will be essential forHispanics to achieve success ineducation and for our country toeffectively tap the resource of Hispanictalent.
All too often, education professionalsare not aware of the cultural barriersfacing Hispanics in mastering Englishlanguage skills.
Programs often bypass the parents,failing to provide practical resources forcarrying out their parentalresponsibilities.
There is minimal accountability ineducation, at every level, for measuringoutcomes based on programeffectiveness and for reporting theresults to citizens. In particular, thereare reasonable concerns that currenttesting practices do not properlyaccount for Hispanic studentachievements.
Often education is seen as aresponsibility that belongs to thegovernment rather than as aninvestment needing the support of allelements of our society.
:4 7
4-2
THE VISION
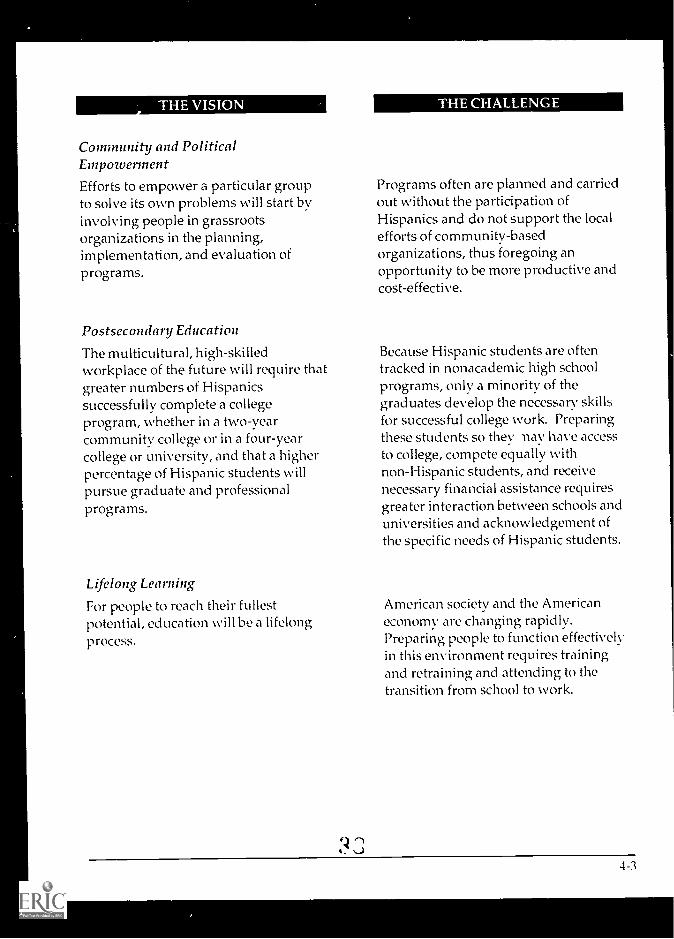
Community and PoliticalEmpowermentEfforts to empower a particular groupto solve its own problems will start byinvolving people in grassrootsorganizations in the planning,implementation, and evaluation ofprograms.
Postsecondary Education
The multicultural, high-skilledworkplace of the future will require thatgreater numbers of Hispanicssuccessfully complete a collegeprogram, whether in a two-yearcommunity college or in a four-yearcollege or university, and that a higherpercentage of Hispanic students willpursue graduate and professionalprograms.
Lifelong Learning
For people to reach their fullestpotential, education will be a lifelongprocess.
21
THE CHALLENGE
Programs often are planned and carriedout without the participation ofHispanics and do not support the localefforts of community-basedorganizations, thus foregoing anopportunity to be more productive andcost-effective.
Because Hispanic students are oftentracked in nonacademic high schoolprograms, only a minority of thegraduates develop the necessary skillsfor successful college work. Preparingthese students so they nay have accessto college, compete equally withnon-Hispanic students, and receivenecessary financial assistance requiresgreater interaction between schools anduniversities and acknowledgement ofthe specific needs of Hispanic students.
American society and the Americaneconomy are changing rapidly.Preparing people to function effectivelyin this environment requires trainingand retraining and attending to thetransition from school to work.
4-3

Topic 53:)

TOPIC 5 A Strategic View of the Challenges Ahead
Hispanic Potential: The potential for Hispanic contributions to a vigorousAmerican economy and society are well demonstrated. For example, the medianincome of Hispanic households in 1990 was approximately 13 percent higher inconstant dollars than in 1982. Major Hispanic population centers such asChicago, Los Angeles, Houston, Miami, and New York, as well as the nation as awhole, have been and continue to be greatly enriched by the contributions ofHispanic Americans in the arts, medicine, science, sports, and more. Hispanicsare a young, family-oriented group who will continue to bring new consumerpower and social growth and stability to the nation's communities well into thenext century.
As the United States positions itself to meet the social and economic challenges ofa rapidly changing economy and world order, the emergence of the HispanicAmerican population as a major socio-economic force must be recognized as anasset. The Commission's strategic view of the challenges ahead acknowledgesthe Hispanic culture's strong work ethic, family consciousness, community-mindedness, and a patriotism which is attested to by more Congressional Medalof Honor winners than in any other minority group." Full participation byHispanics in the nation's economy and society, therefore, will mean that Americacan look forward to a population that seeks access to opportunities to work andpay taxes, while contributing to the social well-being of local communities andthe nation.
An Untapped Resource: At a time when the nation's economy is calling for amore educated and resilient workforce, the United States finds itself with ashrinking, aging and less skilled pool of workers. If America's productivity is toimprove, the nation must add workers to its labor force in a way that will meetthe economy's special and pressing needs. The challenge is to strengthen rapidlythe country's workforce for the benefit of all.
A solution can be found in America's Hispanic population. Hispanic Americansare the youngest and second-largest minority in the United States. In the firstdecade of the twenty-first century Hispanics will represent the greatest increasein America's workforce, one-third of the net gain.''
Strategic to improving the nation's ability to reinvigorate its workforce so it cancompete successfully in the world market is the challenge of better educatingHispanic Americans. Although they currently constitute one of the leasteducated pools of workers in the country, Hispanics provide great potential for
4 ;)5-1

contributing to the American economy. This population must be recognized as arich, untapped resource for raising the productivity of the nation's workforceand enhancing the lives of all Americans.
Obstacles to Hispanic Contributions: The realization of the economic potentialof Hispanics is impeded by severe educational, health, employment andlanguage obstacles (see Appendix, Exhibit II) . For example, in urban areas,schools are often large, overcrowded, underfunded, and fraught with the socialproblems that are endemic to many inner cities. In these circumstances teachersare less likely to have the time or resources to provide the individual attentionand special programs many Hispanic students may need. As a result, theeducational disadvantages of Hispanics are often characterized by a high degreeof isolation, low socio-economic status, poverty, and low test scores. Moreover,the impediments to education are not limited to urban areas. Data on children ofHisr nic migrant workers who attend school in rural areas show these highsc.], .)01 students at greater risk than urban students of dropping out due to druguse, pregnancy, or child abuse."
The need fc,r better education structures is further demonstrated by thecorrel;-tIon stween lower education and earning levels among Hispanic
is (s below).
LoWei urili Elinzings
I()%% tutu 1111`..1.,i1.111111,( It)) rti% 11114
/114.{11111t1i:13111.11 :1 111:2,11 rt.1. (Iltd,..2,C itt I.1111111C, ;Ind 111 rk,\ Lit \
011 II I'1"11 111,1) mm IIt,n,I t In ,,ki It. th,,,,,1)1,1, tlith 1`,.-it)11) 1,I") I 11,--,111w uk. li)1 11-1,,Int Inicn Ititilli
it11 1;1,), I, r,It n `- I ), ni ,.1
,I1,; ,ti
I I I 1,t,tc,1 i,lt,tt 11)'..: 11111111'cl t1 1'11111 1 11111111.n tint r111[11, ...1.11111
1'1,1 \\ 41111 1'1-111,1,ithi mittttt,t t 1,1,,,,t, Itt1,1, It II), HR
S1111'111111 Mt t iti111, .1111t1 It, 1I11. Is '.1 1111 .111 t 1Ht1., 11 11'1 t t.
1-t111.1 101 111,p1.1111, 111111.1n.111 to,c 1i-, tilt 10 1,(, rit kI Iii1,11t1) 11
1)cp..111111ent t,11Ir1Hrk t' HI !CHI
ho,
Another significant obstacle to Hispanic contributions is the extremely lowpercentage of Hispanic elementary and secondary school teachers only 3percent." To provide role models as well as people that understand their cultureand language requirements, Hispanic teachers are needed in all educational
5-2 4:

levels and specializations, especially in areas such as bilingual education,vocational education, special education, science, and matIlematics.
While better education is neither the sole nor the entire solution to any of theseproblems, it is part of the answer to each of them. Constructive steps towardquality education and workforce training for Hispanic Americans, therefore, areneeded to address the wide range of barriers and disadvantages that Hispanics
experience.
Why Americans Should Care: International and domestic events combine tomake this an opportune time for the United States to recognize and take fulladvantage of the potential offered by its Hispanic population. Today, newgrounds for Hispanic pride derive from the resurgence of interest in LatinAmerican historical roots focused on the 500th anniversary of Columbus' firstvoyage to this Hemisphere; the collaboration of the Americans in the Free TradeZone; the economic interdependence of North, Central, and South America; andrecognition of bilingualism and cultural diversity as an asset. If we as a nation leteducation and training deteriorate, new poverty pools will emerge across ourland. The strategic view of the challenges ahead requires an increasedinvestment in human resources to ensure that the American labor force has acompetitive edge in global and domestic markets.
Investment in Human Resources: With the end of the Cold War, theUnited States is in a position to redefine the basis of its national strength.In doing so, the nation needs to take a closer looL: at assets such as itsHispanic population; many are young, under-educated, under-employed,and eager to work, but are not yet able to realize their full potential.
Global Competition: The globalization of the economy imposescompetitive pressures that put a premium on the effective use of ourhuman resources. It obliges the United States to pay closer attention to therelatively small group of those who are entering the work force each year,to their education and training, and to the ideas and techniques that areavailable to them.
Domestic Growth: Domestically, we are entering a period of slow laborforce growth, having passed the peak that resulted from the maturing ofthe baby boom. In fact, early in the next century the United States willneed to finance the retirement of the baby boom generation. By the year2030, there will be 1.2 elderly Americans (over age 65) for every 10- to
24-yea r-old .
4 2
5-3

Leadership and Institutional Renewal: Executive Order 12729 starts with theassumption that improving education for Hispanic Americans will require thecommitment of the entire nation. The renewal of educational institutions, notonly for Hispanics, but for all Americans, begins with the realization that theproblems do not belong to government alone, but to each and every citizen. Theanalysis of education and related programs must include, therefore, anexamination of the goals and conceptual models on which our efforts are based.We must also ask whether current programs need to be restructured to betteraddress today's and tomorrow's challenges.
5-4


TOPIC 6 Next Steps
In this progress report, the Commission has provided an overview of the statusof Hispanics in the early 1990s, described the sources to which it has turned forinput, and offered a strategic view of the challenges ahead. Based on thisinformation, the Commission proposes to carry out its responsibilities as follows.
1. In keeping with the intent of Executive Order 12729, section 4,. which states:The Commission will also provide advice on ways to increase private sectorand community involvement in improving education, the Commissionproposes:
The establishment and development of a non-governmental national Hispaniceducation council. The purpose of this national council would be to improvethe educational attainment rate for Hispanic Americans at all levels bydeveloping and promoting innovative policy options and programs andbringing about public awareness to achieve that end. Major objectives of thisproposed national council would be:
To conduct a public awareness program informing employers, policymakers, educators and the Hispanic community of the untapped talentwhich can be realized by improving the education of Hispanic Americans;
To establish a resource center for Hispanic students and parents onscholarships, financial assistance programs, and other informationrelating to postsecondary education;
To gather and synthesize the educational knowledge that existsthroughout this country and Latin America among Hispanics which canproduce timely research analysis and develop innovative solutions;
To provide a source and linkage where all individuals and organizationsinterested in improving the education of Hispanics can turn for policyoptions, data, and identifying successful programs which may be used intheir efforts.
2. To improve its ability to advise the Secretary of Education on the progresslispanic Americans are making in achieving the National Education Goals,
the Commission proposes to:
4 it
6-1
Improve its model of the flow of Hispanic students through theAmerican educational system. A model of the Hispanic "educationalpipeline" provides a means for using cohort data to help Commissionmembers follow and project the progress of Hispanic education. This canbe a useful tool for analysis.
Improve its inventory of participation in Federal programs byHispanics. The Commission observed differences in the way educationand education-related Federal programs collected information regardingparticipation data. Further analysis of the reasons for these differences isneeded.
3. To solicit advice for and formulate recommendations to the Secretary ofEducation for enhancements to the data collection activities of Federalefforts related to quality improvements in education for HispanicAmericans. In particular, the Commission proposes:
To obtain information on whether Hispanics are receiving services onan equitable basis. The Commission seeks to examine and analyze dataon Hispanic participation in education and education-related Federalprograms.
To examine the prospects for enhancing ongoing data collectionactivities. Statistical improvement efforts such as the currentmulti-Departmental initiative to improve the national economic statisticsand the new National Cooperative Education Statistics System sponsoredby the Department of Education appear to hold promise as vehicles forimproving the flow of information on Hispanic education. If theseinitiatives can provide a feasible vehicle for tracking Hispanic progress,better data may become available without large added costs for new datacollection.
4. To develop a recommended position for the Secretary of Educationregarding the implications of national assessments for Hispanic students.Proposals for national testing of educational achievement have variousimplications for the financial support of schools, decisions made about theeducational careers of students, and the expectations school personnel haveof I lispanic students. The Commission wishes to examine these issues as abasis for advice to the Secretary regarding national assessments of I lispanicstudents.
5. To examine other areas that may lead to Commission recommendations tothe Secretary of Education. This would include further review of outside
6-1

advice and proposals received by the Commission regarding possible stepsfor improving Hispanic education, including:
Preschool intervention, early childhood education, and parentalinvolvement;
Promotion of service delivery through community-based organizations;
Promotion of cultural awareness and sensitivity among educationprofessionals;
Identification and removal of barriers to full Hispanic participation inAmerican education.
6-3

4 G
Endnotes

ENDNOTES
1. U.S. Department of Commerce, Bureau of the Census, Current PopulationReports, Series P-25, No. 1018 (Series 18), and Series P-25, No. 995 (Series 9).
2. U. S. Department of Commerce, Bureau of the Census, School EnrollmentSocialand Economic Characteristics of Students: October 1990, Series P-20, No. 460,April 1992.
3. U.S. Department of Education, National Center for Education Statistics,Dropout Rates in the United States: 1991, September 1992.
4. U.S. Department of Education, National Center for Education Statistics, IssueBrief, "Are Hispanic Dropout Rates Related to Migration?" August 1992.
5. U.S. Department of Education, National Center for Education Statistics, Trendsin Academic Progress, September 1991.
6. U.S. Department of Education, National Center for Education Statistics,National Education Longitudinal Study of 1988 (NELS:88).
7. U.S. Department of Education, National Center for Education Statistics,Enrollment in Higher Education, 1990.
8. U.S. Department of Commerce, Bureau of the Census, Minority EconomicProfiles, 1990 CPH-L-92 tables released July 14, 1992.
9. U.S. Department of Commerce, Bureau of the Census, The Hispanic Populationin the United States: March 1991.
10. U.S. Department of Education, National Center for Education Statistics, TheCondition of Education: 1992.
11. National Council of La Raza, State of Hispanic America 1991: An Overview,February 1992.
12. U.S. Department of Labor, Bureau of Labor Statistics, Monthly Labor Review,November 1989 and unpublished data.
13. National Commission on Migrant Education, "Briefing Book," Bethesda, MD,1992.
14. U.S. Department of Education, National Center for Education Statistics, 1987-88Schools and Staffing Survey, 1991.
4j


EXHIBIT I Inventory of Education and Education-Related FederalPrograms with Hispanic Participation
Iintroduction
This exhibit briefly describes the influence of the Federal government onAmerican education and presents an inventory of reported data on educationand education-related Federal programs which provide service to HispanicAmericans.
Role of the Federal Government in Education
The Federal government contributes only 7 percent of the total nationalexpenditure on education. State and local communities provide the remainder ofthe funds. Nonetheless, the Federal government plays an important role ineducation in the United States by:
Providing statistics and other information to describe the performance ofstudents, schools, and states;
Exercising leadership at the national, state, and local levels in pursuit ofthe National Education Goals;
Supporting equal educational opportunities for all Americans;
Supporting programs for students and teachers with special needs (forexample, bilingual education) as well as programs addressing a nationalconcern (for example, mathematics and science) and by providing funds toresearch and replicate successful programs.
The National Education Goals Panel monitors the progress made towards theNational Education Goals and publishes a report each September. The NationalEducation Goals Report,1992 includes financial resources and participation datafor Federal programs. In fiscal year 1991, the Federal government spent anestimated $59 billion for services and activities related to the National EducationGoals. Programs that targeted the preschool years accounted for 25 percent ofthese Federal funds, programs that targeted the post-high school years accountedfor 42 percent, and programs that targeted postsecondary education accountedfor about 33 percent.
1-1
Overview of the Commission's Inventory
The Commission asked the Secretary of Education to gather statistical data fromeach Federal department and agency with a significant amount of funding foreducation and education-related programs. Specifically, the Commission soughtdata on the participation of Hispanics in each of these Federal programs,including information on legislative intent, the relation of the programs to theNational Education Goals, the eligible population and actual participation byrace/ethnicity, and financial information. The Commission requested data, ifavailable, on program participation by Hispanic subgroup and by state.
Data gathered from almost 600 education and education-related Federalprograms are included in the Commission's inventory. Because of timeconstraints, no pretest of the inventory form was possible, nor were formalfollow-up interviews conducted. The inventory information presented in thisreport, therefore, should be regarded as preliminary.
1 -2
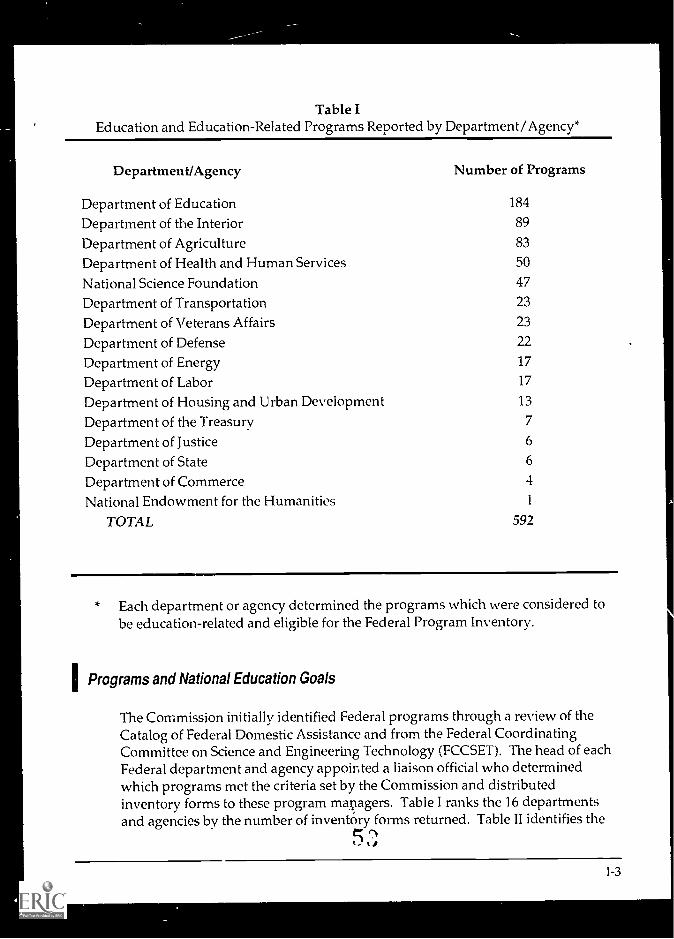
Table IEducation and Education-Related Programs Reported by Department/Agency*
Department/Agency Number of Programs
Department of Education 184
Department of the Interior 89
Department of Agriculture 83
Department of Health and Human Services 50
National Science Foundation 47
Department of Transportation 23
Department of Veterans Affairs 23
Department of Defense 22
Department of Energy 17
Department of Labor 17
Department of Housing and Urban Development 13
Department of the Treasury 7
Department of Justice 6
Department of State 6
Department of Commerce 4
National Endowment for the Humanities 1
TOTAL 592
* Each department or agency determined the programs which were considered tobe education-related and eligible for the Federal Program Inventory.
IPrograms and National Education Goals
The Commission initially identified Federal programs through a review of theCatalog of Federal Domestic Assistance and from the Federal CoordinatingCommittee on Science and Engineering Technology (FCCSET). The head of eachFederal department and agency appointed a liaison official who determinedwhich programs met the criteria set by the Commission and distributedinventory forms to these program managers. Table I ranks the 16 departmentsand agencies by the number of inventory forms returned. Table II identifies the
1-3

number of programs associated with each National Education Goal and shouldbe viewed in the context of indicators presented under Topic 2.
Table IINumber of Federal Programs Addressing National Education Goals
Department/Agency National Education Goals1 2 3 4 5 6
Department of Education 56 60 80 59 90 36Department of the Interior 8 28 60 45 30 17
Department of Agriculture 7 14 22 21 10 1
Department of Health and Human Services 1 2 14 19 12 2National Science Foundation 1 1 11 31 3 0
Department of Transportation 1 3 5 4 2 3
Department of Veterans Affairs 0 1 9 7 7 0
Department of Defense 4 3 2 6 3 2
Department of Energy 1 6 11 11 2 0
Department of Labor 0 4 3 0 5 3
Department of Housing and Urban Development 4 4 3 0 3 3
D lrtment of the Treasury 1 0 2 0 1 0Department of Justice 0 1 1 1 2 4Department of State 0 0 0 0 0 0
Department of Commerce 1 2 1 1 2 2
National Endowment for the Humanities 0 0 1 0 1 0
TOTAL 85 129 225 205 173 73
NOTE: Each program manager could indicate one, several, or all of the NationalEducation Goals as goals on which that program had an impact; therefore, aprogram could be counted under more than one of the National Education Goals.Some programs were also counted under "Other Goals," a category not shown onthis table.
1-4
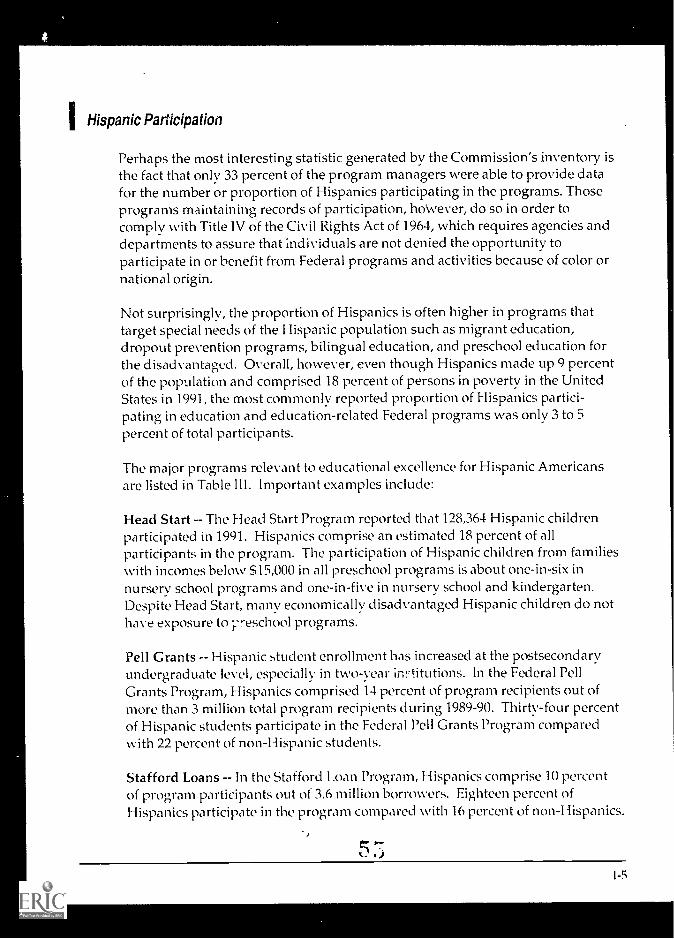
IHispanic Participation
Perhaps the most interesting statistic generated by the Commission's inventory isthe fact that only 33 percent of the program managers were able to provide datafor the number or proportion of Hispanics participating in the programs. Thoseprograms maintaining records of participation, however, do so in order tocomply with Title IV of the Civil Rights Act of 1964, which requires agencies anddepartments to assure that individuals are not denied the opportunity toparticipate in or benefit from Federal programs and activities because of color ornational origin.
Not surprisingly, the proportion of Hispanics is often higher in programs thattarget special needs of the Hispanic population such as migrant education,dropout prevention programs, bilingual education, and preschool education forthe disadvantaged. Overall, however, even though Hispanics made up 9 percentof the population and comprised 18 percent of persons in poverty in the UnitedStates in 1991, the most commonly reported proportion of Hispanics partici-pating in education and education-related Federal programs was only 3 to 5percent of total participants.
The major programs relevant to educational excellence for Hispanic Americansare listed in Table III. Important examples include:
Head Start The Head Start Program reported that 128,364 Hispanic childrenparticipated in 1991. Hispanics comprise an estimated 18 percent of allparticipants in the program. The participation of Hispanic children from familieswith incomes below S15,000 in all preschool programs is about one-in-six innursery school programs and one-in-five in nursery school and kindergarten.Despite Head Start, many economically disadvantaged Hispanic children do nothave exposure to preschool programs.
Pell Grants -- Hispanic student enrollment has increased at the postsecondaryundergraduate level, especially in two-vear inl'titutions. In the Federal PellGrants Program, Hispanics comprised 14 percent of program recipients out ofmore than 3 million total program recipients during 1989-90. Thirty -four percentof Hispanic students participate in the Federal Pell Grants Program comparedwith 22 percent of non-Hispanic students.
Stafford Loans -- In the Stafford Loan Program, Hispanics comprise 10 percentof program participants out of 3.6 million borrowers. Eighteen percent ofHispanics participate in the program compared with 16 percent of non-Hispanics.
1-5

Table IIIParticipation of Hispanics in Major Education-Related Federal Programs That Report Data
HispanicProportionof ProgramParticipants
TotalNumber of
ProgramParticipants Year Total Budget
PRESCHOOL
Special Supplemental Food 23". 4,880,262 1991 (April) $2.4 millionProgram for Women, Infants,and Children (WIC)
Food Stamps 14". 9,064,770 1991 (July)
Head Start 22 583,471 1991 (est.) S2 billion
ELEMENTARY/SECONDARY
Chapter I 26". 5,225,881 1989-1990 $5.6 billion
Bilingual Education' 72". 209,918 1991
Dropout Prevention 39" 68,700 1991 (est.)
TRANSITION TOPOSTSECONDARY
Upward Bound 16". 38,150 1990
Student Support Services 16". 1988
Talent Search 22" 1986
Educational OpportunityCenters 13". 1986
POSTSECONDARY/UNDERGRADUATE
Federal Pell Grants 13". 3,322,000 1989-1990 55.4 billion
Federal SupplementalEducational OpportunityGrants (FSEOG) 9 728,000 1989-1990 $521 million
Federal Work Study (FWS) 677,000 1989-1990
Stafford Loan Program 10". 3,619,00(1 1989-1990 $12.4 billion
ADULT LEARNING
JTPA, 1 itle II A 11". 849,455 1990
JTPS, Title II B 20",, 719,010 1990
1-6L.)

' Local education agencies and concentration grants.
Title VII Bilingual Education Programs, Transitional Bilingual Education (P.L.100-297; April 28, 1988).
'Data in this section are from a National Postsecondary Student Aid Study(1989-90), as program data were unavailable.
National Postsecondary Student Aid Study, U.S. Department of Education,National Center for Education Statistics, unpublished tabulations, 1992.
SOURCE: White House Initiative on Educational Excellence for HispanicAmericans, data provided by program managers for the Commission's Inventory.
NOTE: Hispanics are approximately 9 percent of the undergraduate population.
IDescription of Major Programs
Special Supplemental Food Program for Women, Infants, and Children(WIC)--Agriculture--Provides nutrition assistance and education to at-riskpregnant women and young children from birth to five years.
Food Stamps Agriculture Improves diets of low-income households byincreasing their food purchasing ability.
Head Start--Health and Human Services--An early childhood developmentprogram for disadvantaged and disabled children ages 3 to 5 that combineseducation, health care and nutrition, and active parental development to helpchildren be healthy and ready for school.
Chapter I--Education--Provides financial assistance to school districts to meet thespecial needs of educationally disadvantaged children who live in areas withhigh concentrations of children from low-income families.
Bilingual Education -- Education -- Grants to assist school districts and othereligible grantees in the development and support of instructional programs forstudents with limited English proficiency.
Dropout Prevention--Education--Provides financial assistance to localeducational agencies, educational partnerships, and community based
1-7
5 7
organizations to establish and demonstrate effective dropout prevention andreentry programs.
Upward Bound Education -Helps students develop skills and motivationnecessary for success in education beyond high school among low-income andpotential first-generation college students and veterans.
Student Support Services--Education--Provides supportive services todisadvantaged college students to enhance their potential for successfullycompleting the postsecondary education program in which they are enrolled.
Talent Search--Education--Identifies disadvantaged youths with potential forpostsecondary education; encourages them in continuing in and graduating fromhigh school.
Educational Opportunity renters EducationProvides information on financialand academic assistance available for qualified adults desiring to pursue aprogram of postsecondary education.
Pell Grants Education Federal student aid program that provides grant awardsto low-income qualified students to defray the cost of postsecondary education.
Supplemental Educational Opportunity Grants (SEOG) Education Program tohelp financially needy undergraduate students meet the cost of their educationby providing supplementary grants assistance through participatingpostsecondary institutions.
Federal Work-Study (FWS) Education Provides part-time employment toeligible postsecondary students to help meet educational expenses.
Stafford Loan Program Education Provides support for low-int:::-est loans tostudents through commercial lenders to help pay for the cost of a postsecondaryeducation.
1-8

EXHIBIT II Demographic, Socio-economic, and Health Profiles ofHispanic Americans
This exhibit presents brief profiles of the demographic, socio-economic, andhealth characteristics of Americans of Hispanic origin which contribute to thegroup's educational attainment and economic achievement. The data presentedare extracted, for the most part, from published national data sets maintained bythe Federal government and from analysis of these data by individualresearchers. The statistical indicators in this exhibit can serve as a baselineagainst which to measure the future advances in educational attainment andeconomic achievement of Hispanic Americans from which the nation as a wholewill benefit.
Demographic Profile
The United States is experiencing major changes in the race and ethniccomposition of its population. These changes will accelerate in the years tocome. Over the past decade, the growth of the non-White populations as a wholehas been substantially greater than that of the White population. The non-Whitepopulations are projected to continue to outpace the White population. TheHispanic American population is one of the fastest growing groups in the UnitedStates. Although most of the following data are for Hispanic Americans as agroup, it is important not to lose sight of the significant diversity among theorigin groups that are included in the Hispanic American population.
IComponents of Growth
Immigration, age composition, and high fertility rates have contributed to thegrowth of the Hispanic population.
Immigration: In recent decades, immigration from Latin America, primarilyMexico, has accelerated the growth of the Hispanic population in the UnitedStates. During the 1980s, about 40 percent of all immigrants to the United Statescame from Latin America.
5
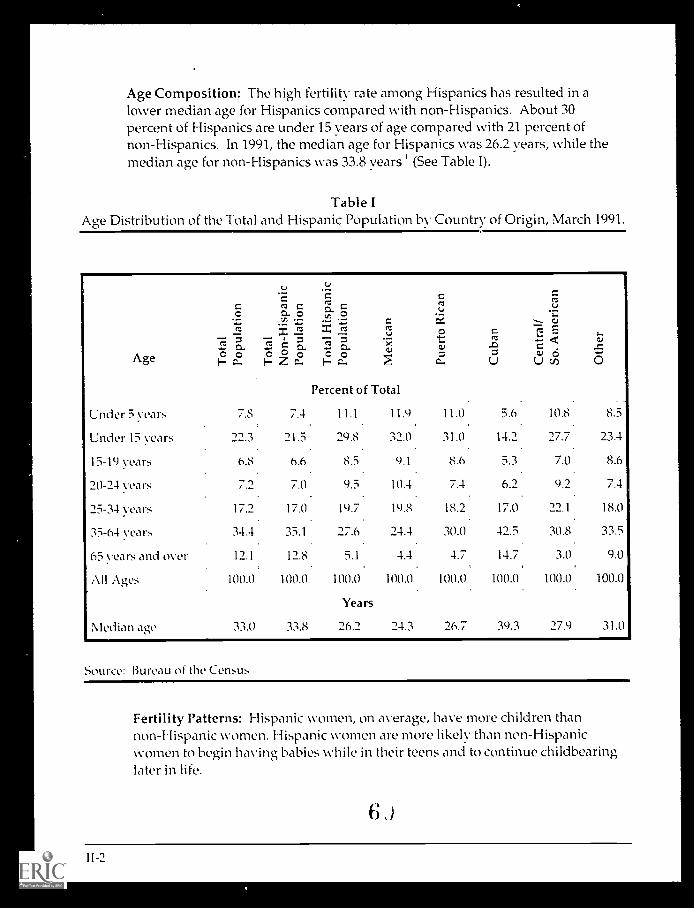
Age Composition: The high fertility rate among Hispanics has resulted in alower median age for Hispanics compared with non-Hispanics. About 30percent of Hispanics are under 15 years of age compared with 21 percent ofnon-Hispanics. In 1991, the median age for Hispanics was 26.2 years, while themedian age for non-Hispanics was 33.8 years' (See Table I).
Table IAge Distribution of the Total and Hispanic Population by Country of Origin, March 1991.
Age
co-c act
O sa. 0 ,.a L
`...: ±"' 73 = r'S (3.-v74 g. 74 g. 7.: 0:-",- . x
a.,o o 000F- tz- E-. Z
o'r.c-. 2. 2
Percent of Total
Fs,..,
,---. cu
a es Ees
..<
..
U U v)
s.,..0 C= CU o
O
Under 5 years 7.8 7.4 11.1 11.9 11.0 5.6 10.8 8.5
Under 15 years 22.3 21.5 29.8 32.0 31.0 14.2 27.7 23.4
15-19 years 6.8 6.6 8.5 9.1 8.6 5.3 7.0 8.6
20-24 years 7.2 7.0 9.5.
10.4.
7.4.
6.2.
9.1 7.4
25-34 years 17.2 17.0 19.7 19.8 18.2 17.0 22.1 18.0
35-64 years 34.4 35.1 27.6.
24.4 30.0 42.5 30.8.
33.5
65 years and over 12.1 12.8 5.1 4.4 4.7 14.7 3.0 9.0
All Ages 100.0 100.0 100.0 100.0 100.0 100.0 100.0 100.0
Years
Median age 33.0 33.8 26.2 24.3 26.7 39.3 27.9 31.0
Source: Bureau of the Census
Fertility Patterns: Hispanic women, on average, have more children thannon-Hispanic women. Hispanic women are more likely than non-Hispanicwomen to begin haying babies while in their teens and to continue childbearinglater in life.
b.)
11-2
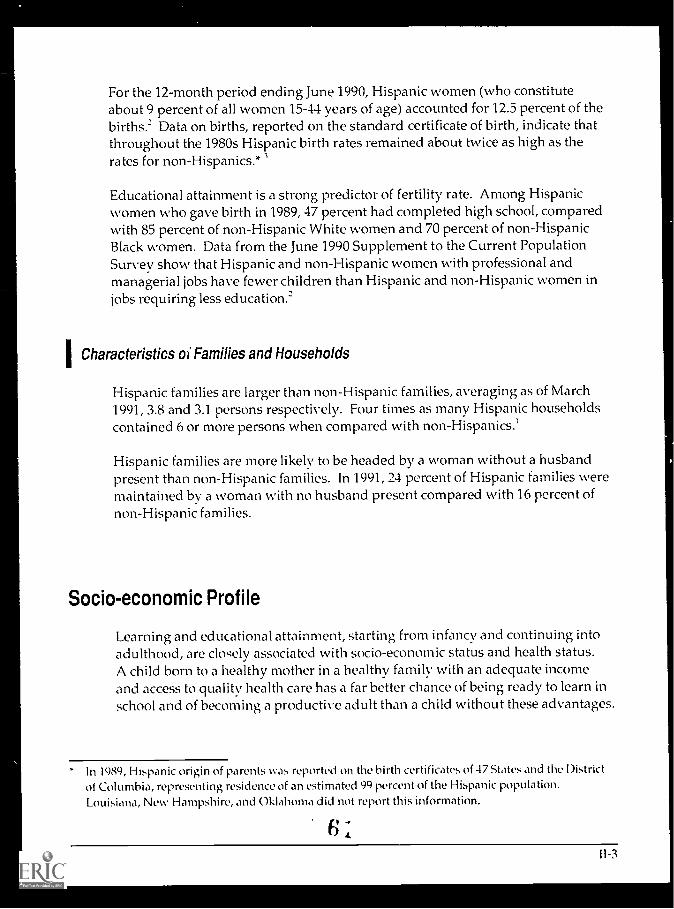
For the 12-month period ending June 1990, Hispanic women (who constituteabout 9 percent of all women 15-44 years of age) accounted for 12.5 percent of thebirths.' Data on births, reported on the standard certificate of birth, indicate thatthroughout the 1980s Hispanic birth rates remained about twice as high as therates for non-Hispanics.* 1
Educational attainment is a strong predictor of fertility rate. Among Hispanicwomen who gave birth in 1989, 47 percent had completed high school, comparedwith 85 percent of non-Hispanic White women and 70 percent of non-HispanicBlack women. Data from the June 1990 Supplement to the Current PopulationSurvey show that Hispanic and non-Hispanic women with professional andmanagerial jobs have fewer children than Hispanic and non-Hispanic women injobs requiring less education.'
ICharacteristics of Families and Households
Hispanic families are larger than non-Hispanic families, averaging as of March1991, 3.8 and 3.1 persons respectively. Four times as many Hispanic householdscontained 6 or more persons when compared with non-Hispanics.'
Hispanic families are more likely to be headed by a woman without a husbandpresent than non-Hispanic families. In 1991, 24 percent of Hispanic families weremaintained by a woman with no husband present compared with 16 percent ofnon-Hispanic families.
Socio-economic Profile
Learning and educational attainment, starting from infancy and continuing intoadulthood, are closely associated with socio-economic status and health status.A child born to a healthy mother in a healthy family with an adequate incomeand access to quality health care has a far better chance of being ready to learn inschool and of becoming a productive adult than a child without these advantages.
In 1989, Hispanic origin of parents was reported on the birth certificates of 47 States and the Districtof Columbia, representing residence of an estimated 99 percent of the Hispanic population.Louisiana, New Hampshire, and Oklahoma did not report this information.
6 .e.
11-3

Employment and Earnings
Although Hispanics have made significant economic progress in the past decade,they continue to be more likely than non-Hispanics to remain in poverty. Theyounger age of the Hispanic population, combined with a lack of education, mayaccount, at least in part, for the preponderance of Hispanics in lower-payingjobs.' Hispanics as a group have both a higher labor force participation rate anda higher unemployment rate than the non-Hispanic population.* In March 1991,the unemployment rate for Hispanics 16 years and older was 10 percentcompared with 7 percent for non-Hispanics.
Hispanic men have a higher labor force participation rate than non-Hispanic men(78 percent compared with 74 percent) and a higher unemployment rate thannon-Hispanic men (10.6 percent compared with 7.8 percent). Hispanic womenhave a lower labor force participation rate than non-Hispanic women (51 percentcompared with 57 percent) and a higher unemployment rate than non-Hispanicwomen (9.2 percent compared with 5.9 percent) (See Table II). The aggregatestatistics conceal wide variations in the level of joblessness according to nationalorigin, nativity, and gender. The median earnings of Hispanic men in 1990 were$14,100. Hispanic men earned 64 percent of the median for non-Hispanic men($22,000). The median earnings for Hispanic women in 1990 were $10,000.Hispanic women earned 81 percent of the median for non-Hispanic women($12,400) (See Table II).
* Labor force participants are individuals 16 years and older who are actively employed, plus thosewho are looking for work, that is, the unemployed.
11-4

Table IILabor Force Status of Hispanic Persons, United States, 1983 and 1991
Labor Force Status 1991 Estimate 1983 Estimate Percent Change
Total, 16 years and over (thousands) 14,688 10,734 36.8
In civilian labor force (thousands) 9,505 6,764 41.1
Percent in civilian labor force....
64.7 62.7 3.2
Percent unemployed 10.0 16.5 -39.4
Males, 16 years and over (thousands) 7,310 5,283 38.4
In civilian labor force (thousands) 5,715 4,156 37.5
Percent in civilian labor force 78.2 78.7 -0.6
Percent unemployed 10.6 16.6 -36.1
Females, 16 years and over (thousands) 7,378 5,451 35.4
In civilian labor force (thousands) 3,791 2,578 47.1
Percent in civilian labor force 51.4 47.3 8.7
Percent unemployed 9.2 16.3 -43.611161111101.
Source: Bureau of the Census.
IIncome
After adjusting to 1990 dollars, the proportion of Hispanic households withincomes of $50,000 or more increased from 10.6 percent in 1982 to 13.4 percent in1990. The proportion of Hispanic households with incomes less than $10,000dropped from 24 percent in 1982 to 21 percent in 1990. Although some Hispanichouseholds have gained economically, Hispanics continue to have lower incomesthan non-Hispanics.
The income disparity between Hispanics and non-Hispanic Whites persists ineach of the family types. Median income is lower for families headed by awoman than for married couple families. As noted above, the percentage offamilies headed by a woman is higher among Hispanics than amongnon-Hispanics.
11-5
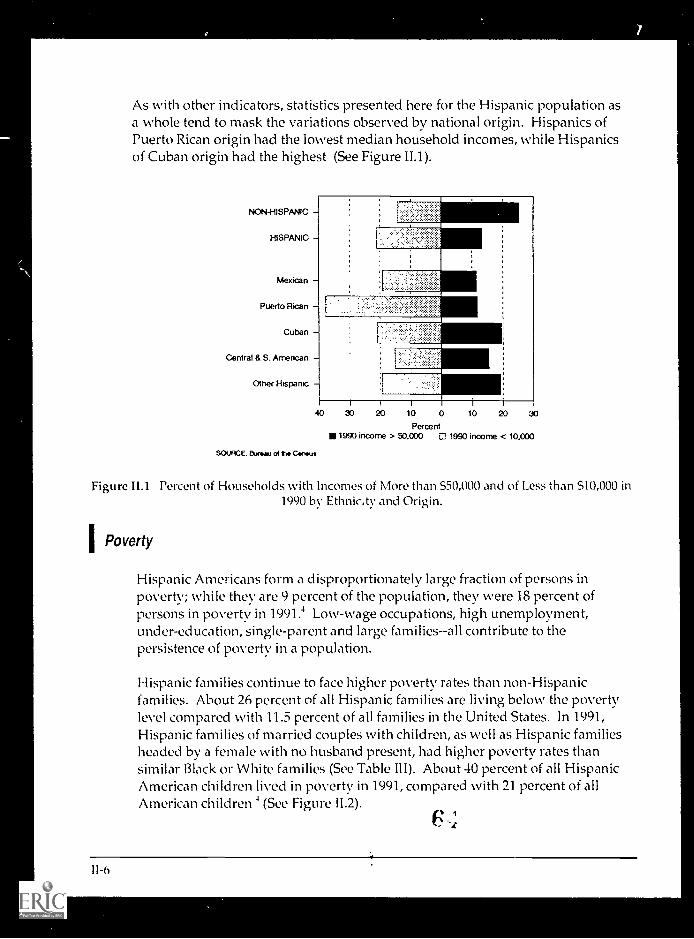
As with other indicators, statistics presented here for the Hispanic population asa whole tend to mask the variations observed by national origin. Hispanics ofPuerto Rican origin had the lowest median household incomes, while Hispanicsof Cuban origin had the highest (See Figure II.1).
NON-HISPANIC
HISPANIC
Mexican
Puerto Rican
Cuban
Central & S. American
Other Hispanic
40 30 20 10 0
Percent1990 income > 50.000 0 1990 income < 10,000
SOURCE. Bureau el to Census
10 20 30
Figure I1.1 Percent of Households with Incomes of More than 550,000 and of Less than 510,000 in1990 by Ethnic,tv and Origin.
Poverty
Hispanic Americans form a disproportionately large fraction of persons inpoverty; while they are 9 percent of the population, they were 18 percent ofpersons in poverty in 1991.4 Low-wage occupations, high unemployment,under-education, single-parent and large families - -all contribute to thepersistence of poverty in a population.
Hispanic families continue to face higher poverty rates than non-Hispanicfamilies. About 26 percent of all Hispanic families are living below the povertylevel compared with 11.5 percent of all families in the United States. In 1991,Hispanic families of married couples with children, as well as Hispanic familiesheaded by a female with no husband present, had higher poverty rates thansimilar Black or White families (See Table 111). About 40 percent of all HispanicAmerican children lived in poverty in 1991, compared with 21 percent of allAmerican children (See Figure 11.2).
11-6
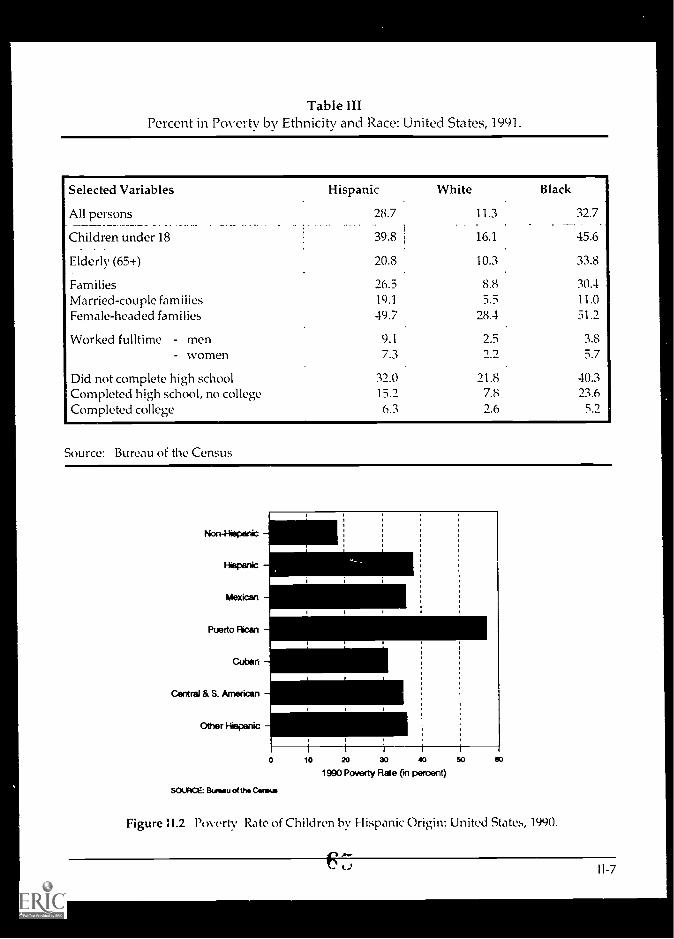
Table IIIPercent in Poverty by Ethnicity and Race: United States, 1991.
Selected Variables Hispanic White Black
All persons 28.7 11.3 32.7_ .Children under 18 39.8 16.1 45.6
Elderly (65+) 20.8 10.3 33.8
Families 26.5 8.8 30.4Married-couple families 19.1 5.5 11.0
Female-headed families 49.7 28.4 51.2
Worked fulltime men 9.1 2.5 3.8- women 7.3 2.2 5.7
Did not complete high school 32.0 21.8 40.3Completed high school, no college 15.2 7.8 23.6Completed college 6.3 2.6 5.1
Source: Bureau of the Census
Non4isepanc
HiePanc 11111111110.Mexican
Puerto Rican
Cuban
Central & S. American
Other Hispanic
0 10 20 30 10 50 eo
1990 Poverty Rate (in percent)
SOURCE: Bureau °I the Carious
Figure 11.2 Poverty Rate of Children by Hispanic Origin: United States, 1990.
11-7

Health Profile
Lack of health insurance, lack of information about services available and aboutthe benefits of good health practices, and limited access to preventive services allincrease health risks for Hispanics. Poor health keeps Hispanics out of schooland out of the work force, perpetuating the vicious cycles of poverty andhopelessness.
IAccess to Health Care
Factors such as the availability of health insurance, whether a regular place ofcare and regular healtlicare provider are available, and the type of health carefacility available all contribute to the quality of health care. Socio-economicstatus, acculturation, family structure, education, and familiarity with theEnglish language also influence access to health care.
Compared with the non-Hispanic White population, Hispanics tend to have lessaccess to routine health care and to use preventive health services less often, thusincreasing the likelihood that diagnosis and treatment will occur at a later stageof an illness and decreasing the chances of a quick recovery for the patient. Datacollected by the Bureau of the Census in the Survey of Income and ProgramParticipation indicate that over 50 percent of Hispanics (compared with 26percent of Whites and 38 percent of Blacks) did not have continuous healthinsurance coverage for the entire 28-month period studied. Among thoseemployed full time, Hispanics were less likely than non-Hispanics to have healthinsurance during the 28-month study period (73 percent and 87 percentrespectively had insurance during the entire period)' (See Table IV).
Data from the National Health Interview Survey conducted by the NationalCenter for Health Statistics show that insurance coverage varied by nationalorigin of Hispanic persons.
1 1-8
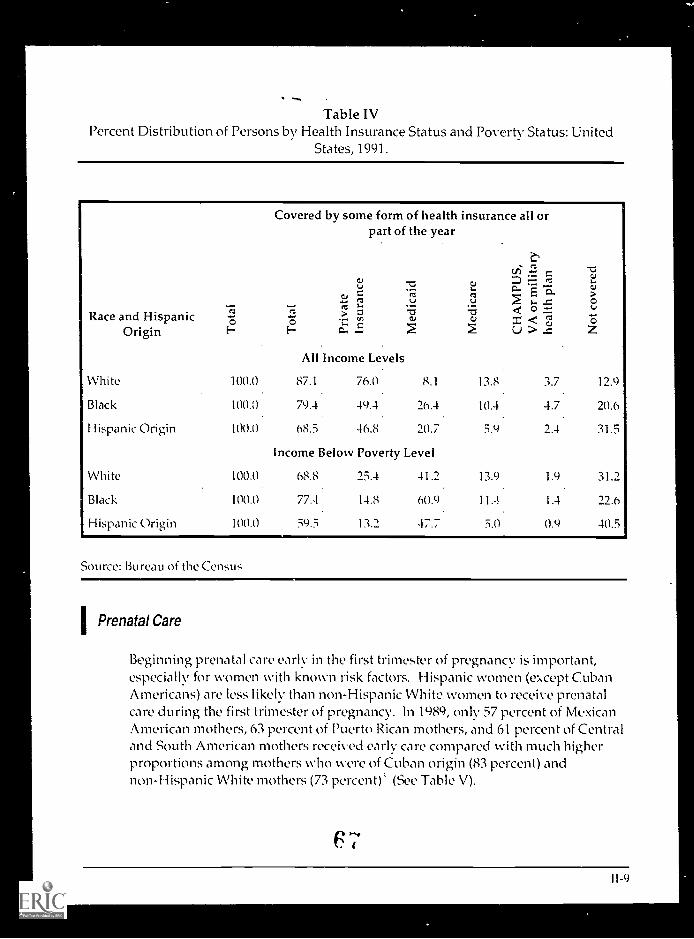
Table IVPercent Distribution of Persons by Health Insurance Status and Poverty Status: United
States, 1991.
Covered by some form of health insurance all orpart of the year
vi 13to = F,u -o a,
0) = ra ,3"ra u u ,, ,.. ..a
<7... .tea 1-
C s.,tc o
Race and Hispanic .5 "8 .,c> v9a a,2
0.,
2 = < 7",d,U > ..aOrigin 1-, 1-- .- --,
White
Black
Hispanic Origin
White
1
Black
Hispanic Origin
All Income Levels
100.0 87.1 76.0 8.1 13.8 3.7
100.0 79.4 49.4 26.4 1(1.4 4.7
100.0 68.3 46.8 20.7 5.9 2.4
Income Below Poverty Level
100.0 68.8 25.4 41.2 13.9 1.9
100.0 77.4 14.8 60.9 11.4 1.4
100.0 59.3 13.2 47.7 5.0 0.9
12.9
20.6
31.5
31.2
22.6
40.5
Source: Bureau of the Census
Prenatal Care
Beginning prenatal care early in the first trimester of pregnancy is important,especially for women with known risk factors. Hispanic women (except CubanAmericans) are less likely than non-Hispanic White women to receive prenatalcare during the first trimester of pregnancy. In 1989, only 57 percent of MexicanAmerican mothers, 63 percent of Puerto Rican mothers, and 61 percent of Centraland South American mothers received early care compared with much higherproportions among mothers who were of Cuban origin (83 percent) andnon-Hispanic White mothers (73 percent)' (See Table V).
11-9
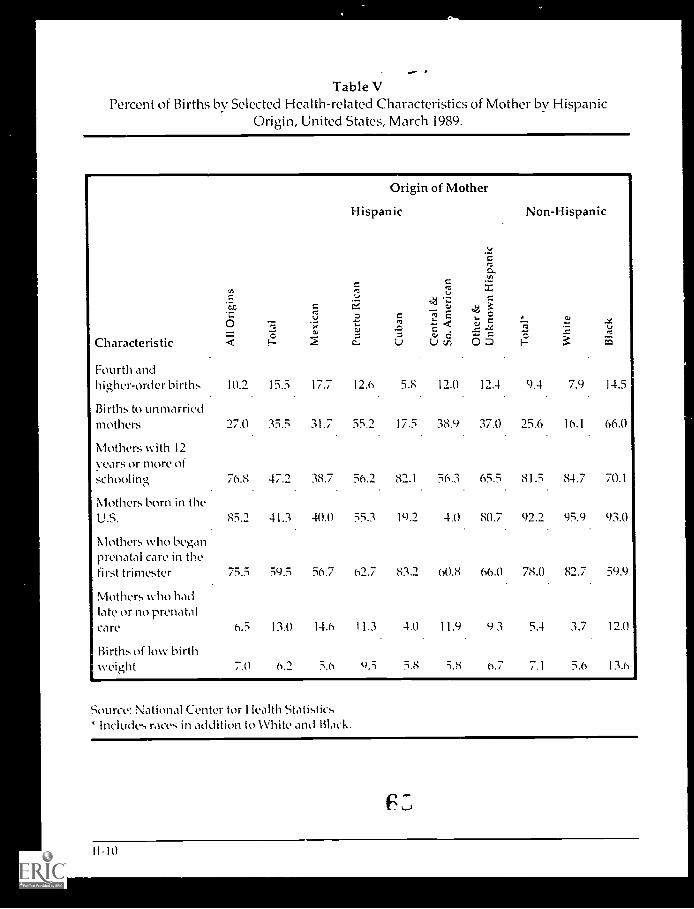
Table VPercent of Births by Selected Health-related Characteristics of Mother by Hispanic
Origin, United States, March 1989.
Characteristic
Fourth andhigher-order births
Births to unmarriedmothers
Mothers with 12V ears or more ofschooling
Mothers born in the
Mothers who beganprenatal care in thefirst trimester
Mothers who hadlate or no prenatalcare
Births of low birthIweight
CC
Origin of Mother
Hispanic Non-Hispanic
V....=r:Cl1.11C....
n't a:Ca
4 'r-; =
= 7' Ers... , * c.,a., ...x
-= < ..c .. "2 ,..:a ,..., t..,
Uu O' c?, 5 s is
10.2 15.5 17.7 12.6 5.8 12.0 12.4 9.4 7.9 14.5
27.0 15.5 31.7 55.1 17.5 38.9 37.0 25.6 16.1 66.0
76.8 47.2 38.7 56.2 82.1 56.3 65.5 81.5 84.7 70.1
85.2 41.3 40.0 55.3 19.2 4.0 80.7 92.2 95.9 93.0
75.5 59.5 56.7 62.7 83.1 60.8 66.0 78.0 82.7 59.9
6.5 13.0 14.6 11.3 4.0 11.9 93 5.4 3.7 12.0
7.0 6.2 5.6 t-).5 5.8 5.8 6.7 7.1 5.6 13.6
Source: National Center for I lealth StatisticsIncludes races in addition to White and Black.
I1 -10

In 1989, 93 percent of mothers with college degrees began prenatal care in thefirst trimester, compared with 51 percent with only a grade school education. Ineach education category, non-Hispanic White mothers were more likely thanBlack or Hispanic mothers to get early prenatal care.
IHealth Care for Children
Data from the National Health Interview Survey indicate that, in 1988, 83 percentof children under 18 years of age were covered by a health insurance plan, eitherprivate pay plan or Medicaid. Only 70 percent of Hispanic children (comparedwith 85 percent of non-Hispanic children) were covered by health insurance.Within every age group, the proportion of Hispanic children covered by healthinsurance was significantly lower than the proportion of non-Hispanic children.Hispanic children 5 years and older were less likely than non-Hispanic childrento have a regular source of medical care. Of those Hispanic children who had aregular source of care, 24 percent received health care at a public clinic ratherthan through private care, compared with 14 percent of non-Hispanic children."
Summary
Income and occupation, family characteristics, fertility rates, early and premaritalpregnancies, access to health care, prenatal care, nutrition, and other healthconditions are all associated <<h educational attainment. These factors areinterrelated. A change in one factor influences the others and ultimately affectsthe chances an individual or a group has of achieving educational excellence andeconomic advancement.
60

IEndnotes
1. U.S. Department of Commerce, Bureau of the Census. The Hispanic Population ofthe United States, March 1991. Current Population Reports; Series P-20, No. 455.October 1991.
2. U.S. Department of Commerce, Bureau of the Census. Fertility of American Women:lune 1990. Current Population Reports; Series P-20, No. 454. 1991.
3. U.S. Department of Health and Humai- Services, National Center for HealthStatistics, Monthly Vital Statistics Report. Advance Report of Final NatalityStatistics, 1989. Final data from the National Center for Health Statistics.
4. U.S. Department of Commerce, Bureau of the Census. Poverty in the United States:1991, Current Population Reports; Series P-60, No. 181. 1992.
5. C.S. Department of Commerce, Bureau of the Census. Health Insurance Coverage.Statistical Brief. September 1991.
6. Bloom, B., Health Insurance and Medical Care: Health of Our Nation's Children, UnitedStates, 1988. Advance Data from Vital and Health Statistics from the NationalCenter for Health Statistics, No. 188. U.S. Department of Health and HumanServices. October 1990.
IAdditional Sources
Bean, F.D. and Tienda, M., The Hispanic Population of the United States. RussellSage Foundation, 1990.
Smith, J.P., The Emerging Hispanic Underclass. The RAND Corporation, 1989.
Valdivieso, R. and Davis, C., U.S. Hispanics: Challenging Issues for the 1990s.Population Trends and Public Policy, No. 17. Population Reference Bureau, 1988.
U.S. Department of Commerce, Bureau of the Census. Population Profile of theUnited States, 1991. Current Population Reports; Special Studies, Series P-23, No.173. 1991.
11-12
tWhite House Initiative on Educational Excellence for Hispanic Americans
Un!ted States Department of Education
400 Maryland Avenue. S.W
Wastylgton. DC 20202