do political news affect financial market returns ... · (selic over and di) which ranged from...
TRANSCRIPT

International Journal of Management, Accounting and Economics
Vol. 3, No. 10, October, 2016
ISSN 2383-2126 (Online)
© Authors, All Rights Reserved www.ijmae.com
545
Do Political News Affect Financial Market
Returns? Evidences from Brazil
Thales Batiston Marques Economia e Relações Internacionais, Universidade Federal do Rio Grande do
Sul, Porto Alegre, Brazil
Nelson Seixas dos Santos1 Economia e Relações Internacionais, Universidade Federal do Rio Grande do
Sul, Porto Alegre, Brazil
Abstract
This paper investigates the relation between political news and market
returns. To do so we applied a Garch filter to a sample of the main Brazilian
stock market index returns (Ibovespa Index) and of short-term interest rates
(Selic Over and DI) which ranged from 01/02/2014 to 04/29/2016. Then we
looked for periods of abnormal volatility which might be associated with
political events using a parametric and a nonparametric method.
Notwithstanding there were news like important politician been arrested and
even speculation about the beginning of an impeachment process, we found
relation between abnormal volatilities and political news only in Ibovespa
returns during Presidential Elections.
Keywords: Political Events, Financial Markets, Information, GARCH.
Cite this article: Marques, T. B., & dos Santos, N. S. (2016). Do Political News Affect Financial Market Returns? Evidences from Brazil. International Journal of Management,
Accounting and Economics, 3(10), 545-571.
Introduction
The recent political events in Brazil has been grabbing the media’s attention. It is
normal to find these vehicles associating the political events with financial markets
oscillation. Nevertheless, this common sense approach to market prices runs into efficient
market hypothesis as posed by Fama (1970).
1 Corresponding author’s email: [email protected]

International Journal of Management, Accounting and Economics
Vol. 3, No. 10, October, 2016
ISSN 2383-2126 (Online)
© Authors, All Rights Reserved www.ijmae.com
546
Actually, the impact of political events on financial markets is a widespread issue.
Smales (2015) measured the role of political uncertainty on implied volatility with
macroeconomics variables in the regression model and Australian Financial Market data.
Jovanovic & Zimmermann (2008) tested whether U.S. Federal Reserve (FED) reacts to
market’s uncertainty. They concluded that FED decreases the interest rates in periods of
abnormal volatility in the stock market and raise them in the opposite case,
notwithstanding with inflation rates. In South Africa’s Financial Markets, Naraidoo &
Raputsoane (2015) found interest rates are guided by inflation uncertainty.
In this paper, we analyzed whether fixed income and the stock market volatility
movements matches political news. To do so we used a GARCH model to filter volatility
and then we compared timing of political events and abnormal volatility to find out
correlations between them using two different approaches: a parametric and a
nonparametric method to distinguish abnormal volatilities from normal ones.
This paper is organized as follows. Section 2 is a quick introduction to Brazilian
Political Institutions and to the Financial System, which has some singularities compared
to countries like United States, France and England. The Section 0is a literature review.
The Section 4 has the Empirical Strategy, the subsections are: Data, Methods, Alternative
1 – Parametric and Alternative 2 – Non-parametric. Section 5 has the Results and
Discussion. Section 6 has Concluding Remarks and the Section 7 is the Bibliography.
Brazilian Political Institutions and Financial System
Brazil is a federative republic with a presidential system, where the legislative,
executive and judiciary branches of government are independents from each other. The
president is elected for a four-year administration and can be reelected for only one
subsequent term (Brazil, Constituição da República Federativa do Brasil: 49ª edição,
1988). The president chooses his ministers and the president of Central Bank of Brazil.
The last one needs to be approved by the senate and he can be fired at any moment, in
other words, the Central Bank is not independent
The
Table 1 shows the composition of the Brazilian Financial System.

International Journal of Management, Accounting and Economics
Vol. 3, No. 10, October, 2016
ISSN 2383-2126 (Online)
© Authors, All Rights Reserved www.ijmae.com
547
Table 1 – Brazilian Financial System
Regulating entities Supervision Entities Operators
National
Monetary Council
(CMN)
Central Bank of
Brazil (BCB)
Financial
institutions
taking
demand
deposits
Other
financial
institutions
Other financial
intermediaries and
entities administering
financial assets of third
parties
Foreign
exchange
banks
Securities and
Exchange
Commission
(CVM)
Commodities
and futures
exchanges
Stock
exchanges
National Council
for Private
Insurance (CNSP)
Private Insurance
Superintendence
(SUSEP)
Reinsurance
Companies
Insurance
companies
Capitalization
companies
Entities
operating
private
open
pension
funds
National Council
for
Complementary
Pension (CNPC)
National
Complementary
Pension
Superintendency
(PREVIC)
Entities operating private closed pension funds
Source: Central Bank of Brazil
Financial system is built upon Law 4595/1964 (1964), which establishes National
Monetary Council (CMN) as the major normative institution of Brazilian Financial
System. (Brazil, 1964). The institution is composed by the Minister of Finance, Minister
of Planning and President of Central Bank of Brazil. The objectives of CMN are defining
monetary and exchange rate policies and establishing rules for the financial system.

International Journal of Management, Accounting and Economics
Vol. 3, No. 10, October, 2016
ISSN 2383-2126 (Online)
© Authors, All Rights Reserved www.ijmae.com
548
The Central Bank of Brazil, according to the Constitution (1988), has the monopoly of
notes issuance, is the government’s banker and also the banker’s bank, along with this,
the Central Bank is the supervisor of the financial system, the executor of monetary and
exchange rate policies.
In June, 1999, Brazil adopted the inflation targeting regime, where de CMN defines
the inflation target and the Central Bank pursues this target using monetary policy,
although there is a tolerance level for that target. Actually, Monetary Policy Committee
(Copom) is Central Bank decision making body on monetary policy responsible for
setting the target of short-term interest rate (Selic). There is Copom’s meetings each forty-
five days and an official note is released informing the directions of the Selic rate target.
In fact, Brazil has only one stock exchange, the BM&FBovespa, which is a company
that manages the organized securities, commodities and derivatives markets. According
to the BM&FBovespa (2016) “The Bovespa Index (Ibovespa) is compiled as a weighted
average of a theoretical portfolio of stocks pursuant to criteria set forth in this
methodology”. Only shares and units listed on BM&FBovespa that are within the
inclusion criteria can compose the index.
The Clearing House for the Custody and Financial Settlement of Securities (CETIP)
is a” depositary” of mainly private fixed income, state and city public securities and some
securities representing National Treasury debts” (Central Bank of Brazil, 2016).
Political Uncertainty and Financial Markets Informational Efficiency
Fama (1970) defined market efficiency in terms of information organized three
information subsets to efficient markets: the weak form, where the information set
includes only the history of prices; the semi-strong form, where the information set is the
publicly available information; and the strong form, where the information set includes
all the information, including the private information. In the strong form the existence of
abnormal returns is not possible, because the information is repassed so rapidly to the
prices that makes impossible to achieve gains.
There is massive literature of empirical analysis of efficient markets hypothesis
(EMH). This paper focused to review the literature about these markets on emerging
countries. Kamal (2014) studied the Egyptian Exchange (EGX) before and after the 25th
January Revolution when the stock market was closed and, for both cases, rejected the
weak-form efficiency hypothesis.
Dong, Bowers, & Latham (2013) studied the relationship of the markets around the
world and if they are efficient. The authors realized that, to the market be at least efficient,
it can’t exist any global or regional leader on the market, but they founded evidences of
this existence, these conclusion violates the EMH.
Recently, in Brazil, Gabriel, Ribeiro, & de Sousa Ribeiro (2013) studied the behavior
of stock prices of companies that belong to segment of “white line” household appliances,
furniture, papers and cellulose during the period of the announcement by Brazilian
government of reduction of Industrial Products Tax (IPI) in March of 2012. Using the
International Journal of Management, Accounting and Economics
Vol. 3, No. 10, October, 2016
ISSN 2383-2126 (Online)
© Authors, All Rights Reserved www.ijmae.com
549
event study, the results leaded to the conclusion that the market wasn’t showed the
behavior of EMH, especially the semi-strong form.
Baker, Bloom and Davis (2012), though, realized that, before 2008 crises, the stock
market usually moved in response to economic news, however this changed after the
subprime crisis, the actions of policy-makers and their statements are impacting directly
the stock market. The authors created an index to measure the policy uncertainty where
they combine three types of information:
“(…) frequency of newspaper articles that reference economic uncertainty and the
role of policy; the number of federal tax code provisions that are set to expire in coming
years; the extent of disagreement among economic forecasters about future inflation and
future government spending on goods and services” (Baker, Bloom, & Davis, 2012).
At the same time, they created another index to measure the policy uncertainty
searching for news on Google News using keywords as ‘uncertain’ or ‘uncertainty’ with
‘economic’ or ‘economy’.
According to Jovanic & Zimmermann (2008), the FED of United States reacts to
uncertainty reducing the interest rates when there is high volatility in the stock market
and raises in the opposite case, ignoring the inflation control of the last 15 years before
the study. Laakkonen (2015) studies the fixed income of United States from investors’
viewpoint and how they react to uncertainty. The author uses the volatility of Ten Years
US Treasury Note futures and concluded that investors reacts stronger when news are
associated with low uncertainty, raising the volatility and the trade volume of those future
contracts. The paper uses three types of uncertainties: the macroeconomic, discordance
between professional forecasters about the macroeconomic scenario, the financial
uncertainty, which is measure through the VIX and the political uncertainty, which is
measure by the policy uncertainty index by Baker etl al. (2012). The conclusion was that
investor react to news significantly stronger when uncertainty is low and they are more
sensitive to uncertainty in the financial market.
Smales (2015) analyzed the Australian electoral cycle and the uncertainty from the
real economy and financial markets. He found the implied volatility of equity and bond
options increases with the election uncertainty, that is, there exists a relationship between
financial market uncertainty and political uncertainty
On the other side, in South Africa, which has a monetary policy institutional
framework similar to Brazil’s, Naraidoo & Raputsoane (2015) found interest rates are
guided by inflation uncertainty, output gap and financial conditions. The author defined
financial conditions with the financial condition index, which is made up by the average
price of all houses, the real stock prices, the real effective exchange rate, the credit spread,
and the future spread.
Empirical Strategy
Data
International Journal of Management, Accounting and Economics
Vol. 3, No. 10, October, 2016
ISSN 2383-2126 (Online)
© Authors, All Rights Reserved www.ijmae.com
550
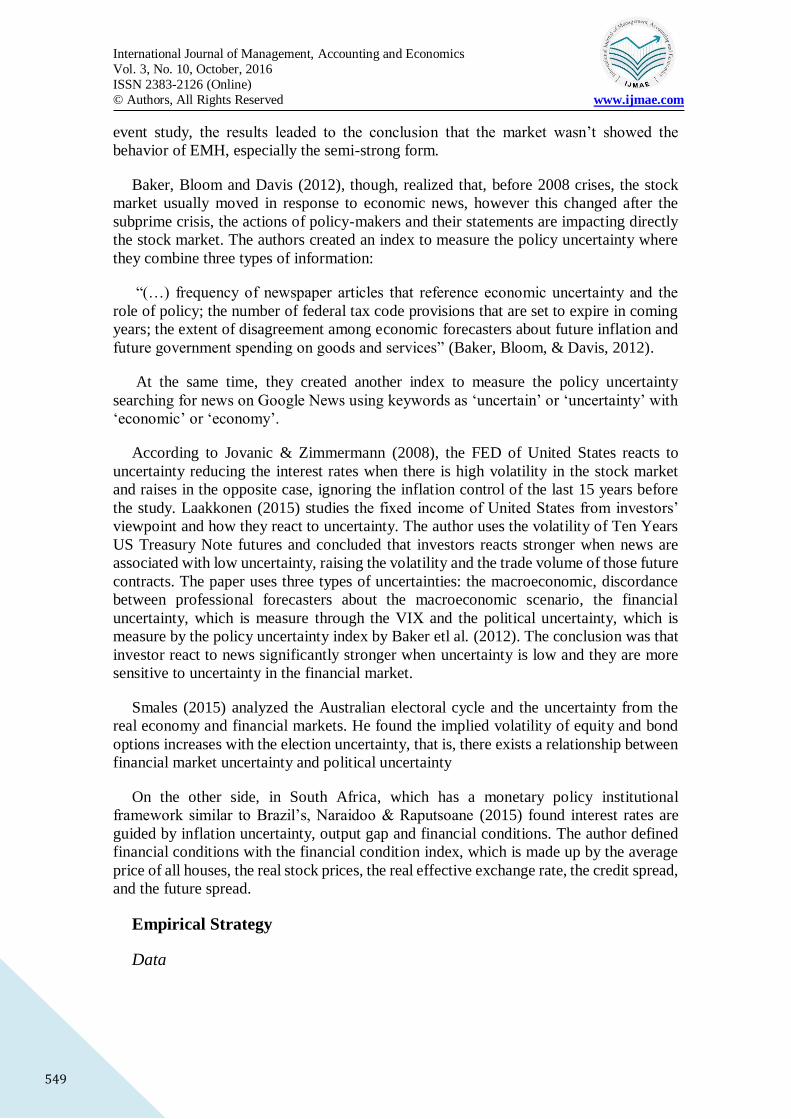
We collect a sample of Bovespa Index, DI and SELIC, because those prices are the
most used one to evaluate conditions of capital and private and public bond markets in
Brazil, respectively. T he first one was collected from the Brazil’s Central Bank Time
Series Management System (Central Bank of Brazil, 2016) at 05/11/2016 in the CSV
format. The code of Bovespa Index is 7. The series started at 01/02/2014 and ended at
04/29/2016 and was daily separated. The Figure 1 shows the series through the time.
Figure 1 Bovespa Index 2014-2016
A crisis started to surround the Brazilian economy in 2014, which was the year of
presidential elections where Ms. Rousseff was reelected to other 4-years mandate. The
year of 2015 was marked by the explosion of the crisis, the fall of the Ms. Rousseff’s
popularity reflected on the popular manifestations demanding the impeachment of her,
the failed attempt of government to recover credibility by nominating an orthodox
economist to lead the Ministry of Finance and was also marked by the evolution of
investigations of corrupt practices with the Brazilian state-controlled oil company,
Petrobras. At last, in 2016 the president impeachment happened, where Mr. Temer, a
center-right politician and also vice-president, assumed the presidency.
We calculated the returns of Ibovespa in the Equation (1)
𝐼𝑏𝑜𝑣𝑒𝑠𝑝𝑎𝑅𝑒𝑡𝑢𝑟𝑛𝑠𝑡 = 𝑙𝑛(𝐼𝑏𝑜𝑣𝑒𝑠𝑝𝑎𝑡𝐼𝑏𝑜𝑣𝑒𝑠𝑝𝑎𝑡−1
) (1)
International Journal of Management, Accounting and Economics
Vol. 3, No. 10, October, 2016
ISSN 2383-2126 (Online)
© Authors, All Rights Reserved www.ijmae.com
551
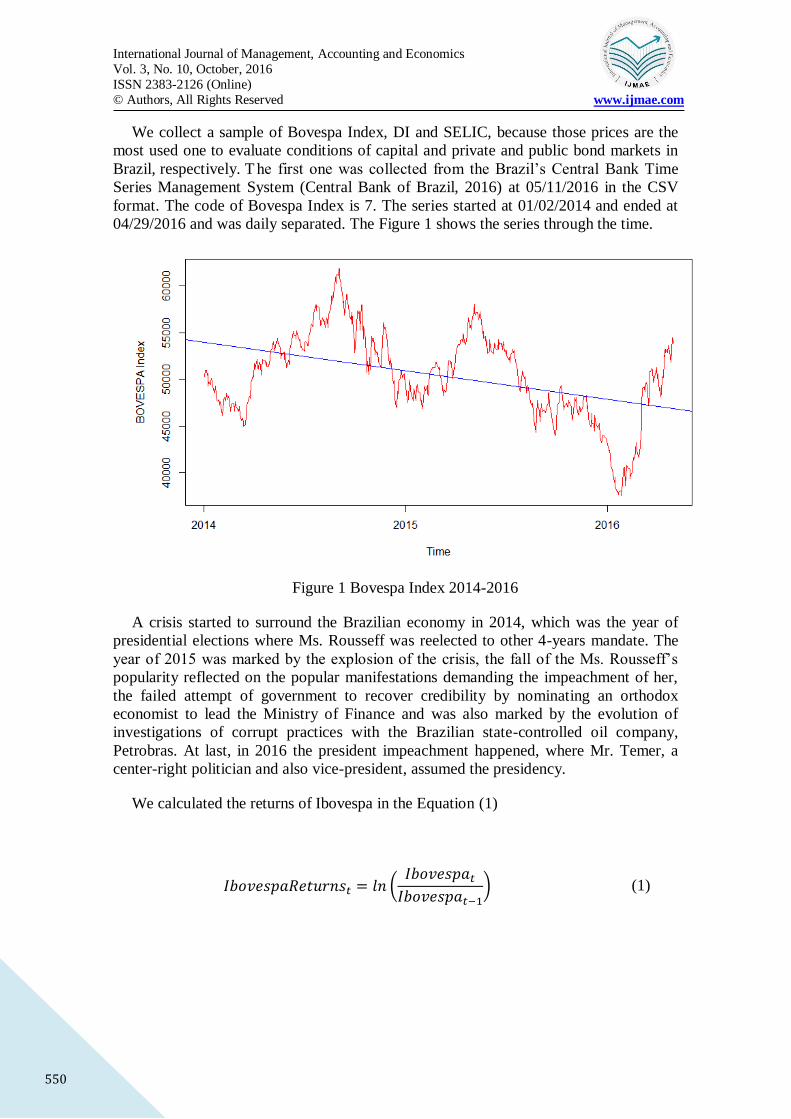
Figure 2 Bovespa Index Returns 2014-2016
We tested the Ibovespa Returns (IR) to observe if the series has unit root and if the
series is stationary by using the Augmented Dickey-Fuller (ADF) test (1979) and the
Kwiatkowski–Phillips–Schmidt–Shin (KPSS) test (1992), respectively. Visually, the
Figure 2 shows a stationarity form, to confirm this hypothesis, the Table 2 and
Table 3 returns the results obtained.
Table 2 ADF Test (IR)
Estimate Std. Error t value Pr(>|t|)
z.lag.1 -0.992446 0.058360 -17.005 <2e-16 ***
z.diff.lag 0.004417 0.041436 0.107 0.915
Table 3 KPSS Test (IR)
test-statistic Significance level 5%
KPSS 0.0919 0.463
The ADF Test rejected the Null Hypothesis of unit root’s existence and the KPSS Test
accepted the Null Hypothesis of stationarity.
To study the fixed income of private market, we chose the Interbank Deposit, which
is calculated by CETIP. We extracted the data from the CETIP webpage (2016) at
05/11/2016 in the XLS format. The series starts at 01/02/2014 and ends at 04/29/2016.
To measure the Interbank Deposit rate (DI), it’s necessary to adjust the through the
International Journal of Management, Accounting and Economics
Vol. 3, No. 10, October, 2016
ISSN 2383-2126 (Online)
© Authors, All Rights Reserved www.ijmae.com
552
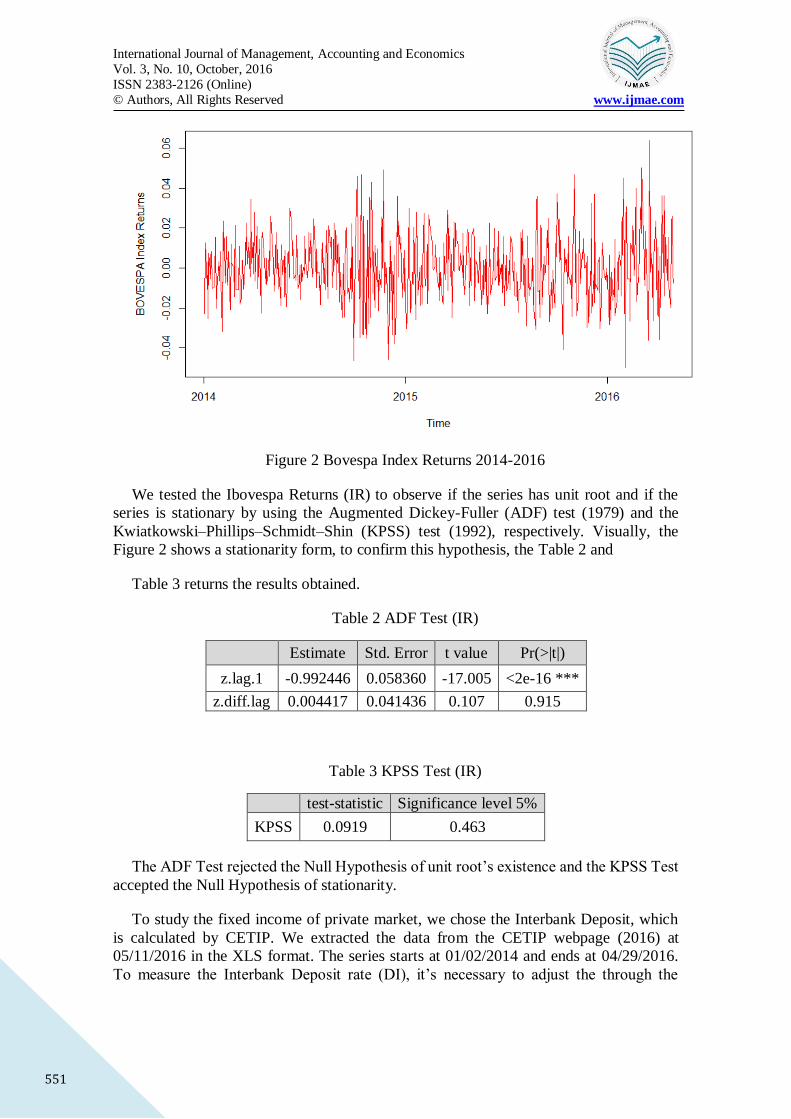
Equation (2). The file is only available in Portuguese, daily factor is fator diário in the
XLS file.
𝑋𝑡 = 𝐹𝑎𝑡𝑜𝑟𝑑𝑖á𝑟𝑖𝑜 − 1 (2)
Figure 3 DI
The Figure 3 shows a deterministic trend. The Hypothesis of unit root of ADF Test
was accepted and the Null Hypothesis of stationarity of KPSS Test was rejected, implying
in non-stationarity. The Error! Reference source not found. and Table 5 returns the
results obtained from the tests.
Table 4 ADF Test (DI)
Estimate Std. Error t value Pr(>|t|)
(Intercept) 3.013e-06 2.154e-06 1.399 0.162
z.lag.1 -6.997e-03 5.779e-03 -1.211 0.226
Tt 1.643e-09 1.849e-09 0.888 0.375
z.diff.lag 9.374e-03 4.170e-02 0.225 0.822
Table 5 KPSS Test (DI)
test-statistic significance level 5%
KPSS 0.3567 0.146
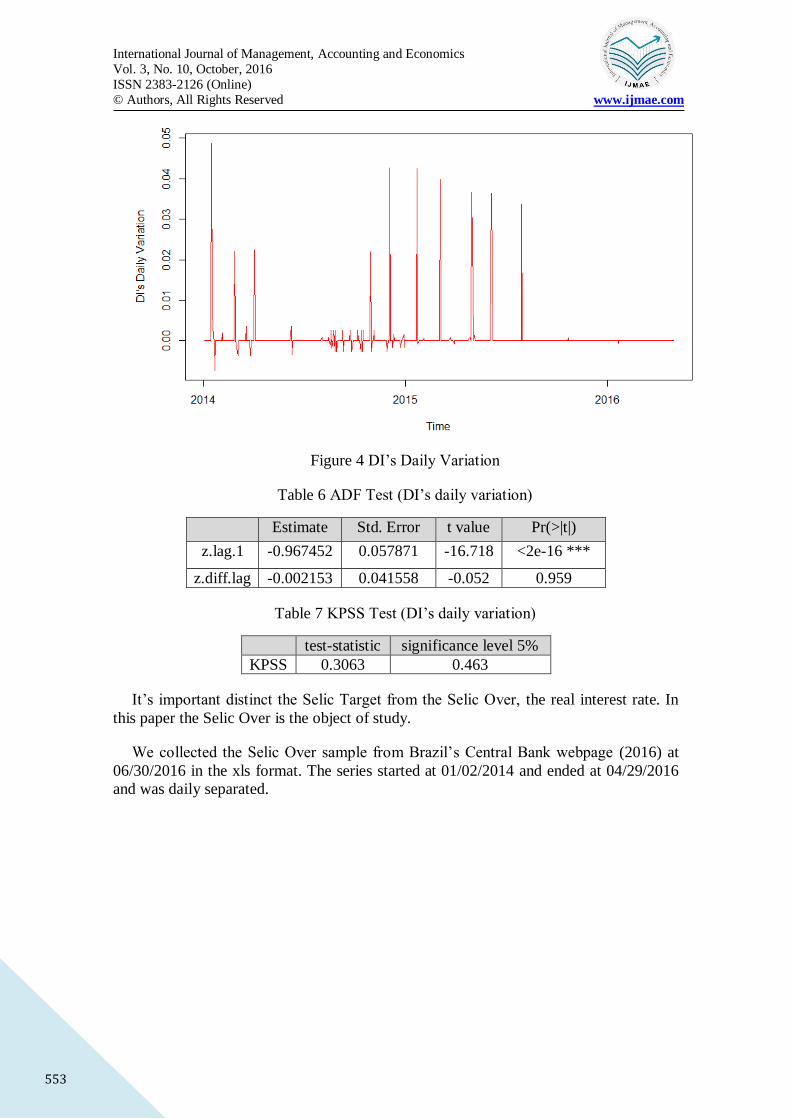
We solved the unit root problem, as showed at Table 6 and Table 7, using the daily
variation of the DI. The Figure 4 shows the behavior of the data.
International Journal of Management, Accounting and Economics
Vol. 3, No. 10, October, 2016
ISSN 2383-2126 (Online)
© Authors, All Rights Reserved www.ijmae.com
553
Figure 4 DI’s Daily Variation
Table 6 ADF Test (DI’s daily variation)
Estimate Std. Error t value Pr(>|t|)
z.lag.1 -0.967452 0.057871 -16.718 <2e-16 ***
z.diff.lag -0.002153 0.041558 -0.052 0.959
Table 7 KPSS Test (DI’s daily variation)
test-statistic significance level 5%
KPSS 0.3063 0.463
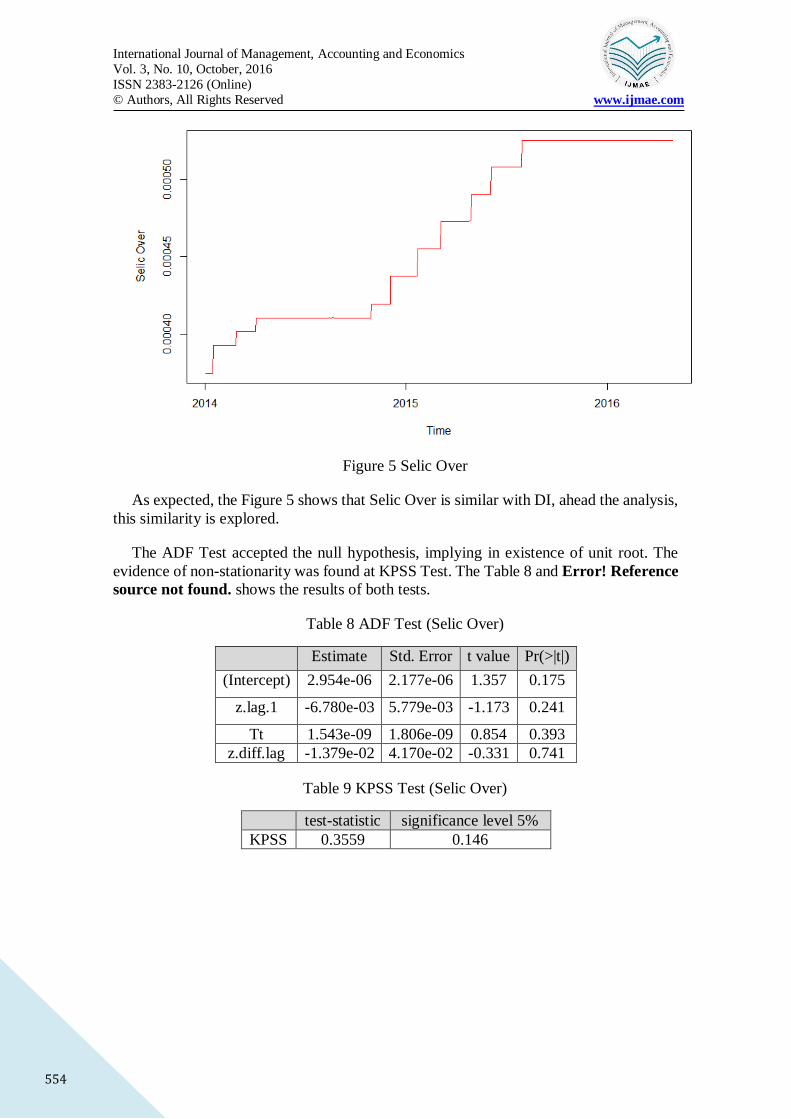
It’s important distinct the Selic Target from the Selic Over, the real interest rate. In
this paper the Selic Over is the object of study.
We collected the Selic Over sample from Brazil’s Central Bank webpage (2016) at
06/30/2016 in the xls format. The series started at 01/02/2014 and ended at 04/29/2016
and was daily separated.
International Journal of Management, Accounting and Economics
Vol. 3, No. 10, October, 2016
ISSN 2383-2126 (Online)
© Authors, All Rights Reserved www.ijmae.com
554
Figure 5 Selic Over
As expected, the Figure 5 shows that Selic Over is similar with DI, ahead the analysis,
this similarity is explored.
The ADF Test accepted the null hypothesis, implying in existence of unit root. The
evidence of non-stationarity was found at KPSS Test. The Table 8 and Error! Reference
source not found. shows the results of both tests.
Table 8 ADF Test (Selic Over)
Estimate Std. Error t value Pr(>|t|)
(Intercept) 2.954e-06 2.177e-06 1.357 0.175
z.lag.1 -6.780e-03 5.779e-03 -1.173 0.241
Tt 1.543e-09 1.806e-09 0.854 0.393
z.diff.lag -1.379e-02 4.170e-02 -0.331 0.741
Table 9 KPSS Test (Selic Over)
test-statistic significance level 5%
KPSS 0.3559 0.146
International Journal of Management, Accounting and Economics
Vol. 3, No. 10, October, 2016
ISSN 2383-2126 (Online)
© Authors, All Rights Reserved www.ijmae.com
555
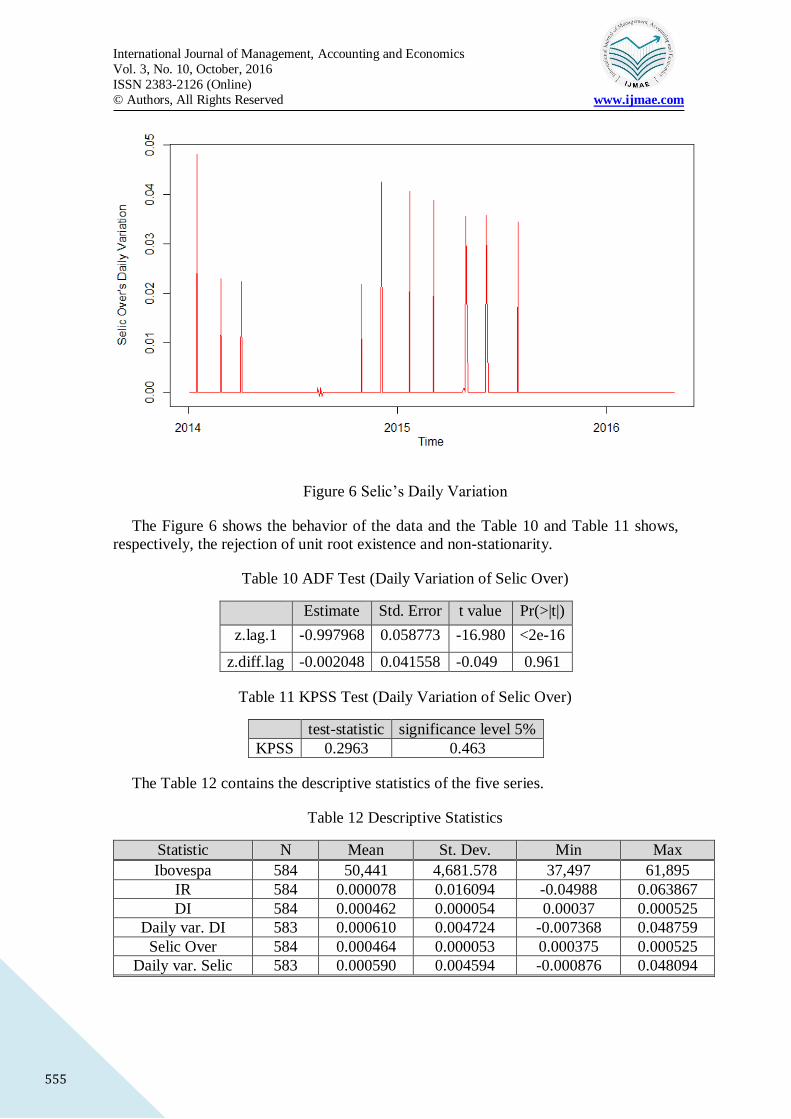
Along with the DI, we solved the Selic unit root using the daily variation of the series.
Figure 6 Selic’s Daily Variation
The Figure 6 shows the behavior of the data and the Table 10 and Table 11 shows,
respectively, the rejection of unit root existence and non-stationarity.
Table 10 ADF Test (Daily Variation of Selic Over)
Estimate Std. Error t value Pr(>|t|)
z.lag.1 -0.997968 0.058773 -16.980 <2e-16
z.diff.lag -0.002048 0.041558 -0.049 0.961
Table 11 KPSS Test (Daily Variation of Selic Over)
test-statistic significance level 5%
KPSS 0.2963 0.463
The Table 12 contains the descriptive statistics of the five series.
Table 12 Descriptive Statistics
Statistic N Mean St. Dev. Min Max
Ibovespa 584 50,441 4,681.578 37,497 61,895
IR 584 0.000078 0.016094 -0.04988 0.063867
DI 584 0.000462 0.000054 0.00037 0.000525
Daily var. DI 583 0.000610 0.004724 -0.007368 0.048759
Selic Over 584 0.000464 0.000053 0.000375 0.000525
Daily var. Selic 583 0.000590 0.004594 -0.000876 0.048094

International Journal of Management, Accounting and Economics
Vol. 3, No. 10, October, 2016
ISSN 2383-2126 (Online)
© Authors, All Rights Reserved www.ijmae.com
556
Methods
The study, mainly, is divided in two parts: Filtering the normal and abnormal volatility
with GARCH (Bollerslev, 1986) considering everything above (under) the mean plus
(minus) two standard deviations of the Conditional Standard Deviation (CSD) series
obtained to each series as abnormal volatility. The second part is to look for political
events on the days where abnormal volatility was found.
For the parametric analysis, the authors defined abnormal volatility in the Equation (3)
and Equation (4).
𝐴𝑏𝑛𝑜𝑟𝑚𝑎𝑙𝑉𝑜𝑙𝑎𝑡𝑖𝑙𝑖𝑡𝑦 > 𝑚𝑒𝑎𝑛 + 2(𝑠𝑡𝑎𝑛𝑑𝑎𝑟𝑑𝑑𝑒𝑣𝑖𝑎𝑡𝑖𝑜𝑛) (3)
𝐴𝑏𝑛𝑜𝑟𝑚𝑎𝑙𝑉𝑜𝑙𝑎𝑡𝑖𝑙𝑖𝑡𝑦 < 𝑚𝑒𝑎𝑛 − 2(𝑠𝑡𝑎𝑛𝑑𝑎𝑟𝑑𝑑𝑒𝑣𝑖𝑎𝑡𝑖𝑜𝑛) (4)
A non-parametric alternative where, instead of using Equation (3) and Equation (4)
as the determinants of abnormal volatility, every point between the 5th and 95th percentile
was considered normal volatility.
Alternative 1 – Parametric
We applied GARCH on the returns of Ibovespa, the daily variation of DI and the daily
variation of Selic. The filter procedure occurs by analyzing the Conditional Standard
Deviation series extracted from GARCH.
To examine if the model is suitable, it’s necessary to analyze if the residuals behave
like white noise. The Ljung-Box test (Box & Pierce, 1970) and (Ljung & Box, 1978),
where the Null Hypothesis is that the data are independently distributed, was used. The
results of the three series are the acceptance of the Null Hypothesis, evidencing the
characteristics of white noise as showed at Table 13.
Table 13 Ljung-Box Test
Data P-value
IR Residuals from Garch 0.8099
DI’s Daily Variation Residuals from Garch 0.7304
Selic Over Residuals from Garch 0.6884
To test the normality of the residuals obtained from GARCH, we used the Shapiro-
Wilk test (Shapiro & Wilk, 1965). As showed at
Table 14, the Null Hypothesis of normality was reject in all series.
Table 14 Shapiro-Wilk Test
Data P-value
IR Residuals from Garc 0.0009223
DI’s Daily Variation Residuals from Garch < 2.2e-16
Selic Over Residuals from Garch < 2.2e-16
International Journal of Management, Accounting and Economics
Vol. 3, No. 10, October, 2016
ISSN 2383-2126 (Online)
© Authors, All Rights Reserved www.ijmae.com
557
As showed in Table 15, there is 27 periods of abnormal volatility in the returns of
Ibovespa series, on contrary, there isn’t periods of abnormal volat ility in the daily
variation of DI and daily variation of Selic.
Table 15 Conditional Standard Deviation
Data CSD’s
Mean
CSD’s
Standard
Deviation
Lower
Limit
Upper
Limit
Nº of Periods of
abnormal
volatility
CSD of IR 0.01585 0.00321 0.00944 0.022 26 27
CSD of DI’s
Daily
Variation
0.004177 0.00030 0.00358 0.00478 0
CSD of Selic
Over 0.004085 0.00028 0.00352 0.00465 0
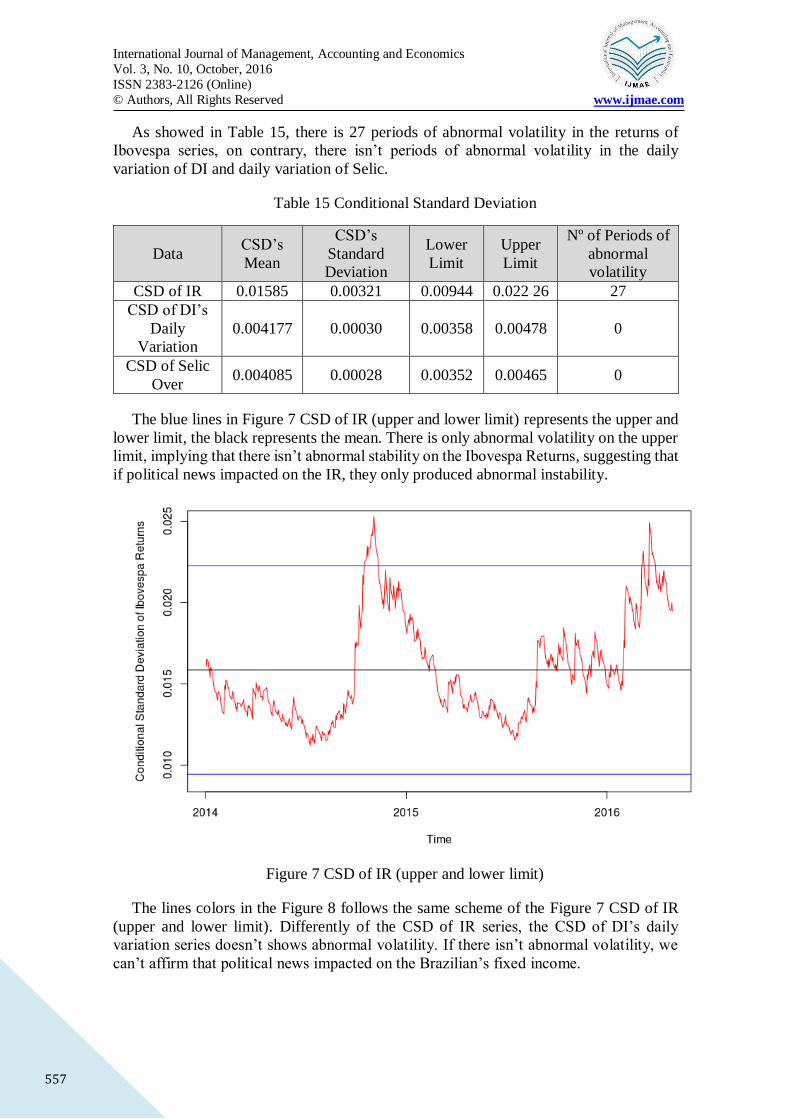
The blue lines in Figure 7 CSD of IR (upper and lower limit) represents the upper and
lower limit, the black represents the mean. There is only abnormal volatility on the upper
limit, implying that there isn’t abnormal stability on the Ibovespa Returns, suggesting that
if political news impacted on the IR, they only produced abnormal instability.
Figure 7 CSD of IR (upper and lower limit)
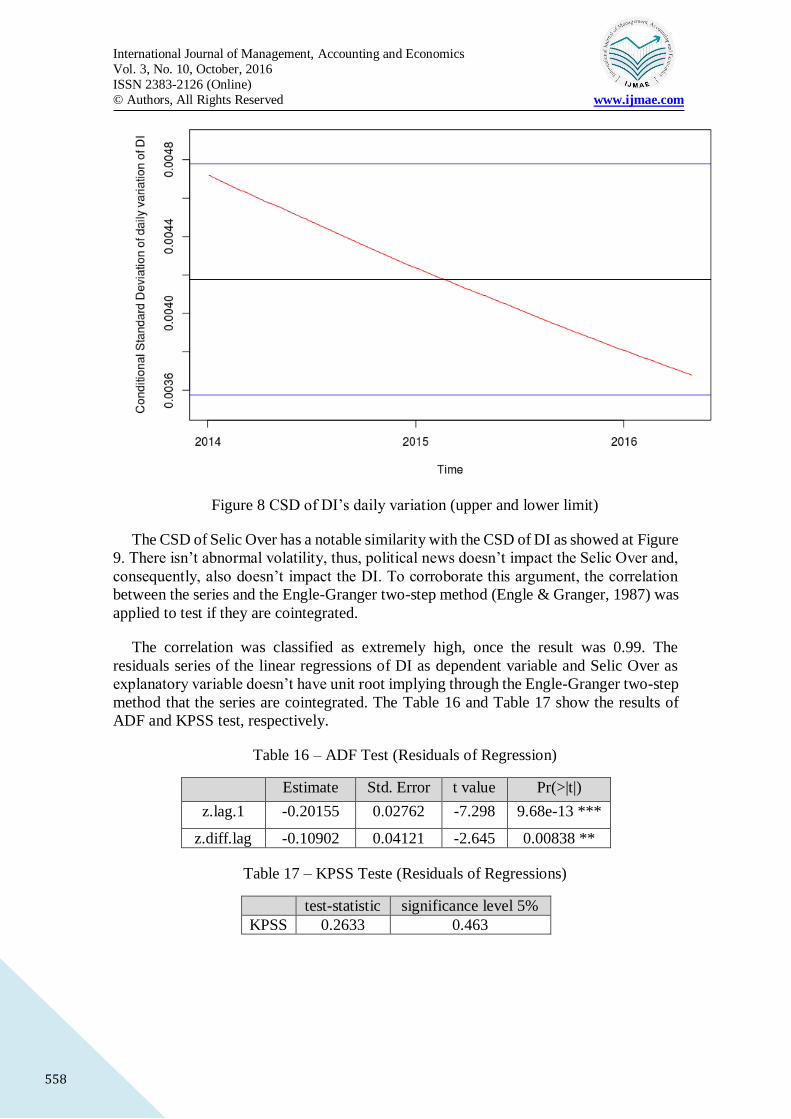
The lines colors in the Figure 8 follows the same scheme of the Figure 7 CSD of IR
(upper and lower limit). Differently of the CSD of IR series, the CSD of DI’s daily
variation series doesn’t shows abnormal volatility. If there isn’t abnormal volatility, we
can’t affirm that political news impacted on the Brazilian’s fixed income.
International Journal of Management, Accounting and Economics
Vol. 3, No. 10, October, 2016
ISSN 2383-2126 (Online)
© Authors, All Rights Reserved www.ijmae.com
558
Figure 8 CSD of DI’s daily variation (upper and lower limit)
The CSD of Selic Over has a notable similarity with the CSD of DI as showed at Figure
9. There isn’t abnormal volatility, thus, political news doesn’t impact the Selic Over and,
consequently, also doesn’t impact the DI. To corroborate this argument, the correlation
between the series and the Engle-Granger two-step method (Engle & Granger, 1987) was
applied to test if they are cointegrated.
The correlation was classified as extremely high, once the result was 0.99. The
residuals series of the linear regressions of DI as dependent variable and Selic Over as
explanatory variable doesn’t have unit root implying through the Engle-Granger two-step
method that the series are cointegrated. The Table 16 and Table 17 show the results of
ADF and KPSS test, respectively.
Table 16 – ADF Test (Residuals of Regression)
Estimate Std. Error t value Pr(>|t|)
z.lag.1 -0.20155 0.02762 -7.298 9.68e-13 ***
z.diff.lag -0.10902 0.04121 -2.645 0.00838 **
Table 17 – KPSS Teste (Residuals of Regressions)
test-statistic significance level 5%
KPSS 0.2633 0.463

International Journal of Management, Accounting and Economics
Vol. 3, No. 10, October, 2016
ISSN 2383-2126 (Online)
© Authors, All Rights Reserved www.ijmae.com
559
Figure 9 CSD of Selic’s daily variation (upper and lower limit)
Alternative 2 – Non-parametric
A non-parametric technique is to work with de critical points of the conditional
standard deviation of the series. Examining the percentiles of the series, it is possible to
points with normal and abnormal volatility. In this study, was decided to use the 5th and
the 95th percentiles of the three series to consider everything bellow the 5th percentile and
everything above the 95th percentile an abnormal volatility. The Table 18 shows the
values of the percentiles mentioned on this paragraph. The abnormal volatility of DI and
Selic happened on the same days, the Ibovespa returns have a different behavior.
Table 18 – Percentiles of Conditional Standard Deviation
Data 5% 95% Nº of periods with abnormal volatility
garch_ret_csd 0.01194074 0.02194739 60
garch_di_csd 0.003724591 0.004659724 60
garch_seli_csd 0.003662363 0.004659724 60
Differently of the Alternative 1, in this case abnormal volatility was found on the upper
and lower limits, indicating that, even though instability found previously, exists
abnormal stability on IR too. The Figure 10 shows the CSD of IR and their limits. The
black line represents the mean of the series and the blue lines represents the upper (95th
percentile) and lower (5th percentile) limits.

International Journal of Management, Accounting and Economics
Vol. 3, No. 10, October, 2016
ISSN 2383-2126 (Online)
© Authors, All Rights Reserved www.ijmae.com
560
Figure 10 CSD of IR (5th and 9th percentile limit)
The CSD of DI’s Daily Variation, using the percentile method, returns periods of high
and low volatility. The Figure 11 shows this behavior.
Figure 11 CSD of DI’s Daily Variation (5th and 9th percentile limit)

International Journal of Management, Accounting and Economics
Vol. 3, No. 10, October, 2016
ISSN 2383-2126 (Online)
© Authors, All Rights Reserved www.ijmae.com
561
The periods of abnormal volatility of the Selic series using the percentile method are
the same of the DI. The Figure 12 evidences this similarity.
Figure 12 CSD of Selic’s Daily Variation (5th and 9th percentile limit)
The Figure 13 shows the histogram of CSD of IR
Figure 13 Histogram of CSD of IR
The Figure 14 shows the histogram of CSD of DI’s Daily Variation

International Journal of Management, Accounting and Economics
Vol. 3, No. 10, October, 2016
ISSN 2383-2126 (Online)
© Authors, All Rights Reserved www.ijmae.com
562
Figure 14 Histogram of CSD of DI’s Daily Variation
The Figure 15 shows the histogram of CSD of Selic’s daily variation.
Figure 15 Histogram of CSD of Selic’s Daily Variation
Results and Discussion
The results obtained using the parametric approach leaded to similar conclusions of
Smales (2015), that is, when agents don’t know who is going to win the elections, the
market volatility increases. The political events we founded were crossed with the 27
periods of abnormal volatility. As we can see in Table 19, results showed evidences the

International Journal of Management, Accounting and Economics
Vol. 3, No. 10, October, 2016
ISSN 2383-2126 (Online)
© Authors, All Rights Reserved www.ijmae.com
563
uncertainty of the presidential elections occurred simultaneously with the abnormal
volatility observed on the Ibovespa Returns.
Table 19 – IR’s abnormal returns associated with political events – Parametric
Approach
Period Week Day Event
10/17/2014 – 10/24/2014 - Week before the elections
10/26/2014 Monday Ms. Rousseff's Reelection
10/27/2014 – 10/31/2014 Tuesday Week after the elections
The conclusions of Baker, Bloom and Davis (2012) are also aligned with the results of
this study. The actions of policy-makers took and their statements are impacting directly
on the stock market. Accordingly, it seems Ms. Rousseff’s statements during campaign
have caused the uncertainty we saw at the end of her first term.
Different from United States, where the Federal Reserve reacts to abnormal volatility
on the stock market reducing the interest rates and ignoring the inflation (Jovanovic &
Zimmermann, 2008), in Brazil inflation targeting system focus only on inflation rate and,
therefore, doesn’t allow to react to financial market events.
There is no evidence of abnormal volatility on the Selic Over series. That is extremely
reasonable because government uses short-term federal bond markets to aim Selic target
as a result of inflation targeting monetary policy adopted. Consequently, the possibility
of reacting to political events should not be observed.
The DI series had the same results of the Selic Over, that is also expected because they
cointegrate. Political events also cannot impact on this series for the same reasons that
they cannot on the Selic Over series.
The non-parametric approach also leaded to similar results. The number of abnormal
periods obtained to IR is 60 and the presidential election matched with the abnormal
volatility periods. Now, one more political event was noticed, that is the death of Mr.
Campos, a presidential candidate, one of the three candidates with more voting intentions.
The results are showed at Table 20.
Table 20 – IR’s abnormal returns associated with political events – Non-parametric
Approach
Period Week Day Event
8/13/2014 Wednesday Brazil presidential candidate Campos dies in
air crash
10/17/2014 - 10/24/2014 - Week before presidential election
10/26/2014 Sunday Ms. Rousseff's Reelection
10/27/2014 - 10/31/2014 - Week after the presidential election
International Journal of Management, Accounting and Economics
Vol. 3, No. 10, October, 2016
ISSN 2383-2126 (Online)
© Authors, All Rights Reserved www.ijmae.com
564
Since as we had already noticed Selic wasn’t managed taking into account political
events, it is expected to see the abnormal points obtained from the non-parametric
approach on the extremes of our sample doesn’t mean anything at all.
As showed at Table 19 and Table 20, the parametric and non-parametric methods,
respectively, returned periods which only can be associated with the presidential
elections, bringing conclusions that only an event with this proportion can cause abnormal
stress on the market. Events like politicians being arrested, corruptions scandals and
things like that, although it might seem important, don’t actually impact on the returns.
Therefore, our results point to the acceptance of the semi-strong efficient market
hypothesis.
Concluding Remarks
This paper has the objective of associate the political events to the financial market
through the Ibovespa Returns, the DI rate and the Selic Over Rate. Two methods are used:
the parametric, which uses Garch to extract the volatility of the series, identifying the
abnormal periods using the Equation (3) and the Equation (4). After this, the abnormal
volatility was associated with political events that happened at the same days of stress.
The non-parametric approach also used Garch to extract the volatility of the series, but
used the 5th and 95th percentile to determine what is abnormal. Everything below the 5th
and everything above the 95th was considered abnormal. After this selection, the political
events were associated with the same rational of the parametric approach.
Both approaches concluded that only the events related with the presidential elections
were relevant and could cause stress to the Ibovespa Returns. The Selic Over and DI were
not impacted with political events, that could be explained with the caution of the Central
Bank of Brazil in preserving the control of inflation.
Anyway, to be more confident about the result we presented we intend to make further
studies collecting an wider sample of political news using web scraping technique and
measuring the impact of the political news associated with abnormal volatilities through
the Event Studies approach.
References
Abdullah D. F., &. S. (2012). The Relationship between Intellectual Capital and
Corporate Performance. Social and Behavioral Sciences, 40, 537-541.
Akers, M. D., Giacomino, D. E., & Bellovary, J. L. (2014, January 14). Earnings
Management and Its Implications: Educating the Accounting Profession. The CPA
Journal.
Amat, O., Elvira, O., & Platikanova, P. (2008). Earnings Management and Audit
Adjustments: An Empirical Study of IBEX 35 Constituents. Working papers, Department
of Economics and Business, Universitat Pompeu Fabra ; 1129 .
International Journal of Management, Accounting and Economics
Vol. 3, No. 10, October, 2016
ISSN 2383-2126 (Online)
© Authors, All Rights Reserved www.ijmae.com
565
Arslan, M. &. (2015). Intellectual Capital and Its Impact on Financial Performance: A
Study of Oil and Gas Sector of Pakistan. International Letters of Social and Humanistic
Sciences, 2(2), 125-140.
Attar, P. H., & Adibi, A. (2015). People Supervision on Sovereignty from the
Perspective of Islam and Iranian Laws. International Journal of Management, Accounting
and Economics, 2(2), 156-166.
Aziz, S., Ghani, U., & Niazi, A. (2013). Impact of Celebrity Credibility on Advertising
Effectiveness. Pakistan Journal of Commerce & Social Sciences, 7(1), 107-127.
Baker, S. R., Bloom, N., & Davis, S. J. (2012, #Feb#). Policy uncertainty: a new
indicator. CentrePiece - The Magazine for Economic Performance, Centre for Economic
Performance, LSE. Retrieved from https://ideas.repec.org/p/cep/cepcnp/362.html
Beattie, V., Brown, S., Ewers, D., John, B., Manson, S., D., T., & Turner, M. (2002).
Extraordinary Items and Income Smoothing: A Positive Accounting Approach. Journal
of Business Finance and Accounting, 21(6), 791-811.
Beneish, M. D. (1997). Detecting GAAP violation: Implications for assessing earnings
management among firms with extreme financial performance. Journal of Accounting
and Public Policy, 16(3), 271-309.
Beneish, M. D. (1999). Incentives and Penalties Related to Earnings Overstatements
that Violate GAAP. The Accounting Review(4), 425-457.
Beneish, M. D., Vargus, M. E., & Press, E. G. (2012). Insider Trading and Earnings
Management in Distressed Firms. Contemporary Accounting Research, 191-220.
Bhatt, N., Jayswal, R. M., & Patel, J. D. (2013). Impact of Celebrity Endorser's Source
Credibility on Attitude Towards Advertisements and Brands. South Asian Journal of
Management, 20(4), 74-95.
BM&FBovespa. (2016, June 12). Bovespa Index (Ibovespa). Retrieved from
BM&FBovespa: http://www.bmfbovespa.com.br/en_us/products/indices/broad-indices/
bovespa-index-ibovespa-1.htm
Bollerslev, T. (1986). Generalized autoregressive conditional heteroskedasticity.
Journal of econometrics, 31(3), 307-327.
Bontis, N. (1998). Intellectual Capital: An Exploratory Study That Develops Measures
and Models. Management Decision, 3(1), 63-76.
Bontis, N. (2001). Assessing knowledge assets: A review of the models used to measure
intellectual capital. International Journal of Management Review, 3(1), 41-60.
Bower, A. B. (2001). Highly Attractive Models in Advertising and the Women Who
Loathe Them: The Implications of Negative Affect for Spokesperson Effectiveness.
Journal of Advertising, 30(3), 51-63.
International Journal of Management, Accounting and Economics
Vol. 3, No. 10, October, 2016
ISSN 2383-2126 (Online)
© Authors, All Rights Reserved www.ijmae.com
566
Box, G. E., & Pierce, D. A. (1970). Distribution of residual autocorrelations in
autoregressive-integrated moving average time series models. Journal of the American
statistical Association, 65(332), 1509-1526.
Brazil. (1964, December 31). Lei 4595/1964. Law. Brazil: Diário Oficial da União.
doi:4595/1964
Brazil. (1964, Dezembro). Lei No. 4595 de 31 de Dezembro de 1964. Di\'ario Oficial
da Uni\~ao, 5425.
Brazil. (1988). Constituição da República Federativa do Brasil: 49ª edição. Edições
Câmara, 2016. Retrieved from https://books.google.com.br/books?id=jeEhCQAAQBAJ
Brazil, C. B. (2016). Dados Diários. {Dados Diários}.
Brooking, A. (1996). In Intellectual capital, core asset for the third Millennium
enterprise (p. 21). London: International Thomson Business Press.
Burroughs, J. W., & Feinberg, R. A. (1987). Using Response Latency to Assess
Spokesperson Effectiveness. Journal of Consumer Research, 14(2), 295-299.
Central Bank of Brazil. (2015). Frequently Asked Questions. Retrieved from Central
Bank of Brazil: http://www4.bcb.gov.br/pec/gci/ingl/focus/FAQ%
Central Bank of Brazil. (2016). CETIP S.A. - Mercados Organizados. Retrieved from
Central Bank of Brazil: http://www.bcb.gov.br/Pom/Spb/Ing/SecuritiesDerivatives
Foreign/CetipIngles.asp?idpai=FMISYSTEMS
Central Bank of Brazil. (2016, 06 30). Dados Diários. Retrieved from Banco Central
do Brasil: http://www.bcb.gov.br/htms/selic/selicdiarios.asp
Central Bank of Brazil. (2016, June 12). Time Series Management System - v2.1.
Retrieved from Banco Central do Brasil: https://www3.bcb.gov.br/sgspub/localizarseries/
localizarSeries.do?method=prepararTelaLocalizarSeries
CETIP. (12 de June de 2016). Estatísticas. Fonte: CETIP:
http://estatisticas.cetip.com.br/astec/series_v05/paginas/web_v05_template_informacoe
s_di.asp?str_Modulo=completo&int_Idioma=1&int_Titulo=6&int_NivelBD=2
Chang, S. L. (2007). In Valuing intellectual capital and firms’ performance: Modifying
value added intellectual coefficient in Taiwan IT industry (Ph. D. Dissertation). Ageno
School of Business, University of Golden Gate, USA. (p. 96).
Chen Goh, P. (2005). Intellectual capital performance of commercial banks in
Malaysia. Journal of Intellectual Capital, 6(3), 385-396.
Dechow, P. M., & Skinner, D. J. (2000). Earnings Management: Reconciling the
Views of Accounting Academics, Practitioners, and Regulators. Accounting Horizons,
14(2), 235-250.

International Journal of Management, Accounting and Economics
Vol. 3, No. 10, October, 2016
ISSN 2383-2126 (Online)
© Authors, All Rights Reserved www.ijmae.com
567
Dechow, P., Sloan, R., & Sweeney, A. (1996). Causes and Consequences of Earnings
Manipulation: An Analysis of Firms Subject to Enforcement Actions by the SEC.
Contemporary Accounting Research, 13(2), 1-47.
Defond, M., & Jiambalvo, J. (1994). Debt Covenant Violation and Manipulation of
Accruals. Journal of Accounting and Economics, 17, 145-176.
Dickey, D. A., & Fuller, W. A. (1979). Distribution of the estimators for autoregressive
time series with a unit root. Journal of the American statistical association, 74(366a),
427-431.
Dong, H., Bowers, H., & Latham, W. R. (2013). Evidence on the Efficient Market
Hypothesis from 44 Global Financial Market Indexes. Working Papers, University of
Delaware, Department of Economics. Retrieved from https://ideas.repec.org/p/dlw/
wpaper/13-07..html
Edvinsson, L., & Malone, M.S. (1997). Developing a model of managing intellectual
capital. European management journal, 4(3), 356-364.
Eilifsen, A., Knivsfla IV, K. H., & Saettem, F. (1999). Earnings manipulation: cost of
capital versus tax. European Accounting Review, 8(3), 481-491.
Engle, R. F., & Granger, C. W. (1987). Co-integration and error correction:
representation, estimation, and testing. Econometrica: journal of the Econometric
Society, 251-276.
Erfgen, C., Zenker, S., & Sattler, H. (2015). The vampire effect: When do celebrity
endorsers harm brand recall? International Journal of Research in Marketing, 32(2), 155-
163. doi:10.1016/j.ijresmar.2014.12.002
Fama, E. F. (1970). Efficient capital markets: A review of theory and empirical work.
The journal of Finance, 25(2), 383-417.
Financial reports of banks. (2015). Retrieved July 27, 2015, from Comprehensive
system to inform publishers ”Codal”: http://www.codal.ir/
Financial reports of banks. (2015). Retrieved July 27, 2015, from Tehran Stock
Exchange: http://new.tse.ir/en/
Financial reports of banks. (2015). Retrieved July 27, 2015, from The Securities and
Exchange (Research, development and Islamic Studies): http://rdis.ir/CompaniesReports
.asp
Freiden, J. B. (1982). An Evaluation of Spokesperson and Vehicle Source Effects in
Advertising. Journal of Advertising Research, 5(1), 77-87.
Freiden, J. B. (1984). Advertising Spokesperson Effects: An Examination of Endorser
Type and Gender on Two Audiences. Journal of Advertising Research, 24(5), 33-41.

International Journal of Management, Accounting and Economics
Vol. 3, No. 10, October, 2016
ISSN 2383-2126 (Online)
© Authors, All Rights Reserved www.ijmae.com
568
Friebel, G., & Guriev, S. (2005). Earnings Manipulation and Incentives in Firms.
Centre for Economic Policy Research, Discussion Paper:DP4861.
Gabriel, F. S., Ribeiro, R. B., & de Sousa Ribeiro, K. C. (2013). Hip\'oteses de mercado
eficiente: um estudo de eventos a partir da redu\cc\~ao do IPI. Revista de Gest{\~a}o,
Finan{\c{c}}as e Contabilidade, 3(1), 36.
Hair, Ringle, & Sarstedt. (2011). PLS-SEM: Indeed a Silver Bullet. Journal of
Marketing Theory and Practice, 139-151.
Hair, Sarstedt, Ringle, & Mena. (2012). An assessment of the use of partial least
squares structural equation modeling in marketing research. J. of the Acad. Mark. Sci.,
414-433.
Healy, P. M. (1985). The Effect of Bonus Schemes on Accounting Decisions. Journal
of Accounting and Economics, 7, 85-107.
Healy, P., & Wahlen, J. (1999). A Review of the Earnings Management Literature and
its Implications for Standard Setting. Accounting Horizons, 13(4), 365-383.
Henseler, J. R. (2014). A new criterion for assessing discriminant validity in variance-
based structural equation modeling. J. of the Acad. Mark. Sci., 115-135.
Hsu, P.-F. (2009). Evaluation of Advertising Spokespersons via the ANP-GRA
Selection Model. Journal of Grey System, 21(1), 35-48.
ISA, T. (2011). Impacts and Losses Caused By the Fraudulent and Manipulated
Financial Information on Economic Decisions. Review of International Comparative
Management, 12(5), 929.
Jones, J. (1991). Earning Management during Import Relief Investigation. Journal of
Accounting Research, 29, 193-228.
Jovanovic, M., & Zimmermann, T. (2008, #Nov#). Stock Market Uncertainty and
Monetary Policy Reaction Functions of the Federal Reserve Bank. Ruhr Economic
Papers, Rheinisch-Westfälisches Institut für Wirtschaftsforschung, Ruhr-Universität
Bochum, Universität Dortmund, Universität Duisburg-Essen. Retrieved from
https://ideas.repec.org/p/rwi/repape/0077.html
Kamal, M. (2014, #Mar#). Studying the Validity of the Efficient Market Hypothesis
(EMH) in the Egyptian Exchange (EGX) after the 25th of January Revolution. MPRA
Paper, University Library of Munich, Germany. Retrieved from
https://ideas.repec.org/p/pra/mprapa/54708.html
Kamins, M. A. (1989). Celebrity and Noncelebrity Advertising in a Two-Sided
Context. Journal of Advertising Research, 29(3), 34-42.
Kamins, M. A., & Gupta, K. (1994). Congruence between Spokesperson and Product
type: A Matchup Hypothesis Perspective. Psychology & Marketing, 11(6), 569-586.

International Journal of Management, Accounting and Economics
Vol. 3, No. 10, October, 2016
ISSN 2383-2126 (Online)
© Authors, All Rights Reserved www.ijmae.com
569
Kang, M., & Goodman, R. J. (2010). Effects Of Spokesperson And Message Type On
Cosmetic Surgery Advertising Among Korean Women. American Academy of
Advertising Conference Proceedings, (p. 59).
Kellogg, I., & B., K. L. (1991). Fraud, Window Dressing, and Negligence in Financial
Statements. Commercial Law Series, McGraw-Hill.
Kramer, J., & Chen, J. (2010). Title of the Article. Journal Name, 110-313.
Kuvita, T., & Karlíček, M. (2014). The risk of vampire effect in advertisements using
celebrity endorsement. Central European Business Review, 3(3), 16-22.
Kwiatkowski, D., Phillips, P. C., Schmidt, P., & Shin, Y. (1992). Testing the null
hypothesis of stationarity against the alternative of a unit root: How sure are we that
economic time series have a unit root? Journal of econometrics, 54(1-3), 159-178.
Laakkonen, H. (2015, #Mar#). Relevance of uncertainty on the volatility and trading
volume in the US Treasury bond futures market. Research Discussion Papers, Bank of
Finland. Retrieved from https://ideas.repec.org/p/hhs/bofrdp/2015_004.html
Lev, B. (1989). On the Usefulness of earnings and Earnings Research: Lessons and
Directions from Two Decades of Empirical Research. Journal of Accounting Research,
27 Supplement, 153-201.
Ljung, G. M., & Box, G. E. (1978). On a measure of lack of fit in time series models.
Biometrika, 65(2), 297-303.
Machlup. (1962). In The production and distribution of knowledge in the United
States. Prienceton, NJ: Prienceton University (p. 436).
Marr, B. G. (2003). Why do firm measure their intellectual capital. Journal of
Intellectual Capital, 4, 441-464.
Mitchel Williams, S. (2000). Is Company’s Intellectual Capital Performance and
Intellectual Capital Disclosure Practices Related Evidence from Publicly Listed
Companies from the FTSE 1000. Working Paper (Presented at McMasters Intellectual
Capital Conference, Hamilton Ontario).
Mulford, C. W., & Comiskey, E. E. (2002). 'The Financial Numbers Game' Detecting
Creative Accounting Practices. JOHN WILEY & SONS, INC.
Nabsiah, A. W., & Methaq, A. (2011). The Effect of Attitude toward Advertisement
on Yemeni Female Consumers' Attitude toward Brand and Purchase Intention. Global
Business & Management Research, 3(1), 21-29.
Naraidoo, R., & Raputsoane, L. (2015, August). Financial markets and the response of
monetary policy to uncertainty in South Africa. Empirical Economics, 49(1), 255-278.
Retrieved from https://ideas.repec.org/a/spr/empeco/v49y2015i1p255-278.html
International Journal of Management, Accounting and Economics
Vol. 3, No. 10, October, 2016
ISSN 2383-2126 (Online)
© Authors, All Rights Reserved www.ijmae.com
570
Narayan, P. K., Liu, R., & Westerlund, J. (2016). A GARCH model for testing market
efficiency. Journal of International Financial Markets, Institutions and Money, 41(C),
121-138. Retrieved from https://ideas.repec.org/a/eee/intfin/v41y2016icp121-138.html
Nelson, M. E. (2002). Evidence from Auditors about Managers' and Auditors' Earnings
Management Decisions. Accounting Review, 77, 175-202.
Ohanian, R. (1991). The Impact of Celebrity Spokespersons’ Perceived Image on
Consumers’ Intention to Purchase. Journal of Advertising Research, 31(1), 46-54.
Oprean, C. (2012, Decembre). Testing the financial market informational efficiency in
emerging states. Review of Applied Socio-Economic Research, 4(2), 181-190. Retrieved
from https://ideas.repec.org/a/rse/wpaper/v4y2012i2p181-190.html
Pablos, P. (2004). Measuring and reporting structural capital, journal of intellectual
capital, 5(4), 629-647.
Pai, F.-Y. (2013). Ceos and spokesperson-product fit. Review of Global Management
and Services Science, 3, 1-6.
Payne, J., & Robb., S. (1997). Earnings Management: The Effect of Ex-ante Earnings
Expectations. Working Paper, University of Oklahoma, Norman.
Petter, Straub, & Rai. (2007). Specifying Formative Constructs in Information
Systems Research . MIS Quarterly, 623-656.
Priester, J. R., & Petty, R. E. (2003). The Influence of Spokesperson Trustworthiness
on Message Elaboration, Attitude Strength, and Advertising Effectiveness. Journal of
Consumer Psychology, 13(4), 408-421.
Pulic, A. (2000). In MVA and VAICTM Analysis of Randomly Selected Companies
from FTSE 250, Graz-London: Austrian Intellectual Capital Research Center (p. 26).
Rangan, S. (1998). Earnings management and the performance of seasoned equity
offerings. Journal of Financial Economics, 50, 101-122.
Richardson, S. A., Tuna, A. I., & Wu, M. (2002). Predicting Earnings Management:
The Case of Earnings Restatements. Social Science Research Network, working paper
series, October.
Ringle, Wende, & Becker. (2014).
Rossiter, J. R., & Smidts, A. (2012). Print advertising: Celebrity presenters. Journal of
Business Research, 65(6), 874-879.
Rostami, A. (2005). In Assessment and evaluation of the relationship between
intellectual capital and intellectual capital Tehran Stock Exchange market value of
company stock, accounting investigations and audits (Vol. 39, p. 50).

International Journal of Management, Accounting and Economics
Vol. 3, No. 10, October, 2016
ISSN 2383-2126 (Online)
© Authors, All Rights Reserved www.ijmae.com
571
Schipper, K. (1989). Commentary on Earnings Management. Accounting Horizons,
91–102.
Shapiro, S. S., & Wilk, M. B. (1965). An analysis of variance test for normality
(complete samples). Biometrika, 52(3/4), 591-611.
Smales, L. A. (2015). Better the devil you know: The influence of political
incumbency on Australian financial market uncertainty. Research in International
Business and Finance, 33(C), 59-74. Retrieved from
https://ideas.repec.org/a/eee/riibaf/v33y2015icp59-74.html
Stafford, M. R., Stafford, T. F., & Day, E. (2002). A Contingency Approach: The
Effects of Spokesperson Type and Service Type on Service Advertising Perceptions.
Journal of Advertising, 31(2), 17-35.
Stephens, N., & Faranda, W. T. (1993). Using Employees as Advertising
Spokespersons. Journal of Services Marketing, 7(2), 26-46.
Stewart, T. (1997). In Intellectual Capital: The Wealth of Organizations, Currency
Doubleday, . New York.
Sweeny, A. (1994). Debt Covenant Violations and Managers' Accounting Responses.
Journal of Accounting and Economics, 17, 281-308.
Tan, H. P. (2002). Intellectual capital and financial returns of companies. Journal of
Intellectual Capital, 8(1), 251-267.
Tayles, M. a. (2001). Dealing with the Management of Intellectual Capital: The
Potential Role of Strategic Management Accounting. Accounting, Auditing &
Accountability Journal, 15(2), 251-267.
Teoh, S. H., Welch, I., & Wong, T. J. (1998). Earnings management and the
underperformance of seasoned equity offerings. Journal of Financial Economics, 50, 63-
99.
Thompson, G. W. (1992). Consumer PR Techniques in the High Tech Arena. Public
Relations Quarterly, 37(4), 21-23.
Watson, J., Taylor, A., Haffman, T., Jorge, A., Sulivan, B., Chung, D., & Mahmood,
A. (2009). Title of the Book. New York: Publisher.
Zeghal, D. &. (2010). Analyzing value added as an indicator of intellectual capital and
its consequences on company performance. Journal of Intellectual Capital, 11(1), 39-60.
Zia, A., & Shahzad, F. (2015). Role of Advertising on Sale’s Performance: a Case
Study of Bata & Service Shoes (Okara). International Journal of Management,
Accounting and Economics, 2(1), 37-45.