do mergers increase product variety? evidence from … profit-maximizing decision for the monopolist...
TRANSCRIPT
Oxford University Press is collaborating with JSTOR to digitize, preserve and extend access to The Quarterly Journal of
Economics.
http://www.jstor.org
Do Mergers Increase Product Variety? Evidence from Radio Broadcasting
Author(s): Steven T. Berry and Joel Waldfogel
Source: The Quarterly Journal of Economics, Vol. 116, No. 3 (Aug., 2001), pp. 1009-1025
Published by: Oxford University Press
Stable URL: http://www.jstor.org/stable/2696424
Accessed: 30-09-2015 14:20 UTC
Your use of the JSTOR archive indicates your acceptance of the Terms & Conditions of Use, available at http://www.jstor.org/page/ info/about/policies/terms.jsp
JSTOR is a not-for-profit service that helps scholars, researchers, and students discover, use, and build upon a wide range of content in a trusted digital archive. We use information technology and tools to increase productivity and facilitate new forms of scholarship. For more information about JSTOR, please contact [email protected].
This content downloaded from 152.3.102.242 on Wed, 30 Sep 2015 14:20:20 UTCAll use subject to JSTOR Terms and Conditions

DO MERGERS INCREASE PRODUCT VARIETY? EVIDENCE FROM RADIO BROADCASTING*
STEVEN T. BERRY AND JOEL WALDFOGEL
Mergers can reduce costs and alter incentives about how to position products, so that theory alone cannot predict whether mergers will increase product variety. We document the effect of mergers on variety by exploiting the natural experi- ment provided by the 1996 Telecommunications Act. We find that consolidation reduced station entry and increased the number of formats available relative to the number of stations. We find some evidence that increased concentration increases variety absolutely. Based on the programming overlap of jointly owned stations, we can infer that the effects operate through product crowding that is consistent with spatial preemption.
Do mergers increase product variety? Because multiproduct firms do not want their products to compete with each other, mergers can lead firms to spread similar products apart, to with- draw duplicative products, or to crowd products together to pre- empt entry, with ambiguous overall effects on variety. Further- more, cost reductions brought about by consolidation can allow firms to offer additional products, which tends to increase variety. The effect of mergers on variety is an empirical question.
Free entry into differentiated product markets with decreas- ing average costs can result in too many products and too few varieties.1 Hence, it is important-and potentially useful-to un- derstand how concentration, which is regulated by antitrust pol- icy, affects these outcomes. In this paper we consider empirical evidence on how the number of products (stations) and varieties (programming formats) in local radio markets are affected by changes in market structure wrought by the 1996 Telecommuni- cations Act.2
While the effect of concentration on product variety is an
* We thank Yun-Sug Baik and Yu Li for assistance in assembling the data set used in the study and Lisa George for comments. Seminar participants at the 1998 American Economic Association meetings in Chicago, the Carnegie Mellon Uni- versity/University of Pittsburgh joint applied economics seminar, and the Vhar- ton Applied Economics Seminar at the University of Pennsylvania provided help- ful comments on an earlier draft. We are responsible for any errors.
1. See Spence [1976], Dixit and Stiglitz [1977], Lancaster [1979], and Man- kiw and Whinston [1984] for general discussions. Steiner [1952] discusses ineffi- cient product variety in radio broadcasting. Recent empirical evidence [Berry and Waldfogel 1999a] shows that free entry produces far more firms than would optimally produce advertising (i.e., ignoring the important benefits to listeners).
2. Also worthy of study is the effect of increased concentration on advertising prices. For lack of data we put aside this question in the present study.
? 2001 by the President and Fellows of Harvard College and the Massachusetts Institute of Technology. The Quarterly Journal of Economics, August 2001
1009
This content downloaded from 152.3.102.242 on Wed, 30 Sep 2015 14:20:20 UTCAll use subject to JSTOR Terms and Conditions

1010 QUARTERLY JOURNAL OF ECONOMICS
empirical question, because market structure is the endogenous outcome of a competitive process, it is in general difficult to measure.3 However, recent changes in local radio station owner- ship rules have given rise to large exogenous increases in concen- tration. The Telecommunications Act of 1996 substantially re- laxed local radio ownership restrictions prompting a major wave of consolidation in the industry. Between 1993 and 1997 the average Herfindahl index across 243 major media markets in- creased from 1272 to 2096, or by almost 65 percent.4 This increase in concentration was substantial and was largely driven by exoge- nous changes in the regulatory environment. Importantly, the amount of change allowed by the rule varied in the cross section of radio markets. Effectively, concentration was allowed to in- crease by a greater amount in larger markets (specifically, in markets with a larger initial number of stations). Thus, we can look not only at simple differences in concentration over time, but we can also exploit cross-sectional differences in the change in concentration in large versus small markets as an instrumental variables strategy for measuring the effect of concentration on variety.5
The paper proceeds in five sections. Section I presents theo- retical examples illustrating the ambiguous effect of mergers on variety and the possible product positioning effects of mergers. Section II describes our data. Section III presents our empirical strategy based on the changed local ownership rules in radio broadcasting. Section IV presents basic regression results and robustness checks. Using a panel data set on 243 U. S. radio broadcast markets in 1993 and 1997 (and 158 markets in 1989, 1993, and 1997), we find that concentration reduces station entry and, holding the number of stations constant, increases product variety. In some specifications we find that concentration in- creases variety absolutely. Section IV also documents that merg- ers lead to potential preemptive product positioning. Jointly owned stations broadcasting from the same market are more
3. One study attempting to do so is Alexander [1997], who documents the relationship between a measure of product variety and ownership concentration in the music recording industry.
4. The FCC approved transfers of almost 4000 radio stations in 1996 and some proposed mergers would create nationwide joint ownership of up to 463 stations (compared with the previous limit of 20 AM and 20 FM). See Ness [1997] and Myerson [1998].
5. Further, using 1989 data on 158 of our basic 243 markets, we can perform similar exercises on data twice-differenced to remove preexisting trends.
This content downloaded from 152.3.102.242 on Wed, 30 Sep 2015 14:20:20 UTCAll use subject to JSTOR Terms and Conditions

DO MERGERS INCREASE PRODUCT VARIETY? 1011
likely than unrelated stations (and more likely than jointly owned stations in different markets) to broadcast in similar formats. A brief conclusion follows.
I. THEORETICAL EXAMPLES: Do MERGERS INCREASE VARIETY?
Jointly owned stations have an incentive not to compete with each other. This can lead newly merged stations to move away from each other, increasing product variety.6 However, a firm owning multiple stations can also prevent excessive with- in-firm competition by simply closing some stations. If this can be done in a way that does not attract entry, then variety is reduced. In this section we illustrate these two contrasting possibilities via simple theoretical examples based on Hotelling- style models of competition.7
Consider a model in which possible programming formats fall on the line segment [0,1] and listeners' preferred programs are distributed uniformly. A listener pays a psychological "transpor- tation cost" to "travel" from her location v to her closest station x* (v). She listens to that station for a fraction of her day equal to 1 - tlv - x*(v)I, where t parameterizes the transportation cost.8 Stations "sell listeners" to advertisers at a fixed price (normalized to one), so profits equal the listening share minus a fixed cost, F.
For example, with parameters t = 1 and fixed cost F = 0.3, there is a duopoly equilibrium with both stations located at 1/2 and both earning profits of 0.075. If those two stations are allowed to merge, they could move to the joint profit-maximizing locations of (1/4, 3/4). Per-station profits rise by more than 80 percent after the merger, and consumers are offered more variety.9
For different parameters, mergers can decrease variety. Con-
6. If station mergers generate operating efficiencies, then the number of viable stations might increase; this could be a second source of increased product variety.
7. Our examples are in the spirit of Bonanno [1987], who also considers Hotelling-style examples of multiproduct firms (under the assumption of price competition between the firms-of course radio stations cannot use prices to compete for listeners).
8. A station j, located at x;, with neighboring stations j - 1 and j + 1 (i.e., with xj < xj <x+1) gets the listening share:
fb (1 - tlxj - vl)dv, where a = 0.5(xj + xj+,) and b = 0.5(xj + xj-,). 9. In this example with low transport costs, there are often no equilibria
when the number of stations increases beyond two. The next example, with higher transportation costs, can handle an endogenous number of entering stations.
This content downloaded from 152.3.102.242 on Wed, 30 Sep 2015 14:20:20 UTCAll use subject to JSTOR Terms and Conditions

1012 QUARTERLY JOURNAL OF ECONOMICS
sider now an example with higher transportation costs, t = 4, but lower fixed costs, F 0 0.2. If each owner is allowed only one station, there is a three-firm equilibrium with locations (1/5, 1/2, 4/5). The profit-maximizing decision for the monopolist is to shut one station down and locate the remaining stations at (1/4, 3/4). The best entry opportunity against these locations is to enter in the middle of the market at 1/2, but the operating profits cannot quite cover fixed costs, and so entry will not occur.10 The number of available varieties has strictly declined in this example after the merger-the middle station has been shuttered, and the two stations at the edge have moved toward the center.
As a last example, keep t = 4 as in the second example, but set fixed costs 15 percent lower at F = 0.17. Now entry at 1/2 is profitable against the monopolist's two-station profit-maximiz- ing locations of (1/4, 3/4). However, if the monopolist can credibly commit to locations, then it can reduce the profitability of entry by moving his locations toward the center of the line. For example, if the monopolist can commit to the locations (0.29, 0.71), then the entrant's profit falls below zero again."1
These examples show three possible effects of mergers on variety. First, mergers can cause a monopolist to increase variety, because the monopolist does not want to compete with its own nearby stations. Second, mergers can decrease variety via the mechanism of the monopolist profitably shutting down stations. Third, considerations of deterring entry can lead the owners to multiple stations to crowd them together so as to not open "holes" in the product space for new entrants to exploit. Roughly speak- ing, the third incentive, together with the first incentive to dif- ferentiate products, may lead jointly owned products to be "dif- ferentiated, but not by too much."
These arguments lead us in the empirical work to examine the effects of consolidation on three possible market-level de-
10. Note that unlike Judd [1985], we do not model a fierce Bertrand-like postentry price war if the entrant were to land exactly on top of an existing station. Indeed, we do not model prices as falling at all. A richer model would let the price paid by advertisers respond to entry decisions (as in Berry and Waldfogel [1999a]), but a Bertrand-like assumption of fierce postentry price competition seems quite unreasonable in this market.
11. If the monopolist tries to squeeze toward the center any more, then the optimal entry location shifts to the outside part of the line. Note that our spatial preemption example on the line contrasts a bit with Schmalensee's [1978] model of spatial preemption on a circle. On the line, the center plays the role of "mainstream" ("middle of the road") programming. A slight extension of the model could place a higher density of consumers near the center, without changing the qualitative results of the examples.
This content downloaded from 152.3.102.242 on Wed, 30 Sep 2015 14:20:20 UTCAll use subject to JSTOR Terms and Conditions

DO MERGERS INCREASE PRODUCT VARIETY? 1013
pendent variables: the number of stations, the ratio of the number of formats to the number of stations, and the total number of formats. We also look inside the firms to see whether programming strategies pursued by multistation firms differ from those pursued by independent stations. In particular, we ask whether jointly owned stations cluster their stations in a market in a way that might preempt entry (i.e., differentiated, but not by too much). Further, we ask whether this clustering is more intense in larger markets, where entry might be easier. Since this is a first look at a theoretically complicated question, we adopt a "reduced-form" empirical approach throughout this study.12
II. DATA AND VARIETY MEASURES
The data used in this study cover commercial stations in 243 U. S. markets in 1993 and 1997.'3 We observe each station's audi- ence, owner identity, and programming format. Our measure of listening is average quarter hour (AQH) listening, the number of persons listening for at least five minutes during an average quarter hour period. We use the listening data to calculate some measures of concentration as well as station and format equivalents. The data for this study are drawn from two sources, James Duncan's Ameri- can Radio Spring issues for 1989, 1993, and 1997 (including the Small Market Editions for 1993 and 1997), as well as Arbitron's Radio USA, Spring 1989, Spring 1993, and Spring 1997. The un- derlying data set covers 3587 commercial stations in 1989, 5111 in
12. A formal model of product choice in the radio industry would need to include owners' choices about how many stations to operate, as well as the programming formats at each of their stations. With, say, 40 distinct program- ming formats in a market where a firm can operate up to eight stations, the number of options in the choice set is the combinatoric, "40 choose 8," a very-large dimensional choice problem which then must be embedded in a market equilib- rium. Probably for this reason, the theoretical literature on multiproduct firms facing an entry threat is not very rich. Sutton [1991] reminds us that in such models there may be no pure-strategy equilibrium and in other cases there are a large number of plausible equilibria. Mazzeo [1998] provides examples of product choice where, even with single-product firms, there is no unique equilibrium. Our approach in this paper is to obtain qualitative empirical results that may guide more detailed subsequent modeling.
13. Noncommercial stations account for a very small fraction of radio listen- ing. See Berry and Waldfogel [1999b].
We also have data on 158 of these 243 markets in 1989, which we refer to at points below. The 1989 Duncan's American Radio Small Market Edition does not systematically report format information. The 158 markets included in the data for 1989 are the largest of the 243 overall markets.
This content downloaded from 152.3.102.242 on Wed, 30 Sep 2015 14:20:20 UTCAll use subject to JSTOR Terms and Conditions
1014 QUARTERLY JOURNAL OF ECONOMICS
1993, and 5869 in 1997.'4 We compute measures of ownership concentration, available programming variety, and the number of available stations at the market level for much of the analysis.
Our measure of programming variety is the number of dif- ferent programming formats broadcast in a market. Duncan clas- sifies stations into 46 programming formats in 1997. These for- mats include such designations as "country," "top 40," and "classical." Because we measure variety using the number of formats available in a market, it is important to know how much programming variety each format adds. Data on the top 30 songs aired in each format show that some formats add more variety than others. For example, 14 of the "Rock" top 30 also appear in the "Alternative" top 30, while none of the country or jazz top 30 appear in any other formats' top 30. Still, no two formats have more than 20 songs overlapping their top 30s. We also use the overlap information at Section IV to evaluate whether jointly owned stations air similar programming. See Berry and Waldfo- gel [1999c] for additional information about formats and pro- gramming overlap across formats.15
By far, the most common format in both 1993 and 1997 is country music, which accounts for about 14 percent of stations in both years. Between 1993 and 1997 subtler distinctions emerge among formats. For example, 8.51 percent of stations are classi- fied as adult contemporary (AC) in 1993, while in 1993 only a handful of stations are jointly classified as adult contemporary and something else, such as "adult contemporary/contemporary hit radio" (AC/CHR). In 1997, by contrast, the share of pure AC stations has declined to 6.61 percent, while the share of AC/CHR stations has risen from 0.18 percent to 2.01 percent. Similar forces are at work with hybrids of album-oriented rock (AOR), CHR, and black-targeted formats. The appearance of hybrid for- mats reflects growth in variety; a major question below is
14. Note that because each station may be received in more than one market, a "station" is actually a market-station pair. For example, WCBS-AM, based in New York City, is also received in Bridgeport, CT and numerous other markets.
15. We have top-30 playlist data, by format, for a particular week (February 27, 1998), according to airplay. Detailed playlist data that we have obtained for one format (alternative rock, also known as "album oriented rock/new rock," or AOR/NR) indicate that the top 30 songs in that format account for 60.0 percent of songs played during the week. This suggests that top 30 information reflects the majority of music aired. The playlist data are from Radioairplay: the Net's Alter- native Trade (http://www.radioairplay.com/). These data show how often the top 30 songs on one format are also frequently aired on stations in other formats. The top 30 data are reported by Radio & Records magazine, at their website. See http://www.rronline.com.
This content downloaded from 152.3.102.242 on Wed, 30 Sep 2015 14:20:20 UTCAll use subject to JSTOR Terms and Conditions

DO MERGERS INCREASE PRODUCT VARIETY? 1015
whether the growth is stronger in markets with greater consolidation.
III. EMPIRICAL STRATEGY
The Telecommunications Act of 1996 relaxed ownership re- strictions to different extents in different-sized markets, effec- tively running different "experiments" in markets of different sizes. Prior to the 1996 Act, the FCC's "radio contour overlap rule" defined the limits of local commercial radio ownership. This rule limited the number of jointly owned stations in a local market to no more than three or four stations, depending on the size of the market.16 The key to our empirical strategy is that the Telecom- munications Act (Section 202(b)(1)) of 1996 allowed concentration to increase to different levels in different markets, as shown by the following table.
1996 Telecommunications Act Restrictions on Local Joint Ownership of Radio Stations
Size of market Max # of jointly Limit on # in same service (# of stations) owned stations (AM or FM)
45+ 8 5 30-44 7 4 15-29 6 4 0-1417 5 3
Further, nationwide limits on the total number of stations that could be jointly owned were entirely eliminated (the previous limit was 20 AM and 20 FM).'8
There are two basic ways we can instrument for the change
16. According to FCC Public Notice 96-60, "[The FCC] permits ownership of up to three commercial radio stations, no more than two of which may be in the same service, in radio markets with fourteen or fewer stations, provided that the owned stations, if other than a single AM and FM station combination, represent less than 50 percent of the stations in the market; in markets with fifteen or more commercial radio stations, ownership of up to two AM and two FM commercial radio stations is generally permitted if the combined audience share of the commonly owned stations does not exceed 25 percent in the market." This is also the source of the rule in the next paragraph.
17. In any case, no one may own more than 50 percent of the stations. 18. The Department of Justice can still review cases and has recently op-
posed some (otherwise legal) mergers on the grounds that they would potentially raise prices to advertisers. See Klein [19971. However, it is not clear that the DOJ can oppose mergers on the grounds of product variety; after all there is no "price" paid by the listeners in any case.
This content downloaded from 152.3.102.242 on Wed, 30 Sep 2015 14:20:20 UTCAll use subject to JSTOR Terms and Conditions

1016 QUARTERLY JOURNAL OF ECONOMICS
in concentration allowed under the Act. First, and most simply, we can classify markets into "policy bands" according to the number of stations in 1993. We then use dummies for the policy bands as instruments for the change in ownership concentration. This approach has the virtue of taking advantage of the structure of the Act's "experiment." There are two difficulties with this approach, one practical and one theoretical.
The practical difficulty in implementing this approach is that the number of stations in a market, for antitrust purposes, is difficult to ascertain.19 We implement the policy band dummy approach using the total number of stations received in the mar- ket in 1993. The number of stations received in the market will overstate the number of stations for the purposes of the Act, to the extent that, say, two stations are both received in a metro area but are far enough apart not to be in each others' markets.20
A second, more basic, difficulty with the policy band approach is that the number of stations in the market is an endogenous variable that depends on the tastes for radio listening. An alter- native IV approach is use of population terms as measures of market size. While the population approach fails to exploit the kinks in the nonlinear structure of the 1996 Act, the population approach skirts the two difficulties of the policy band approach. First, we do not need to classify markets into policy-relevant bands. Second, population is certainly exogenous. Below we focus mainly on the policy band approach, but we also report robust- ness checks based on the population IV approach.
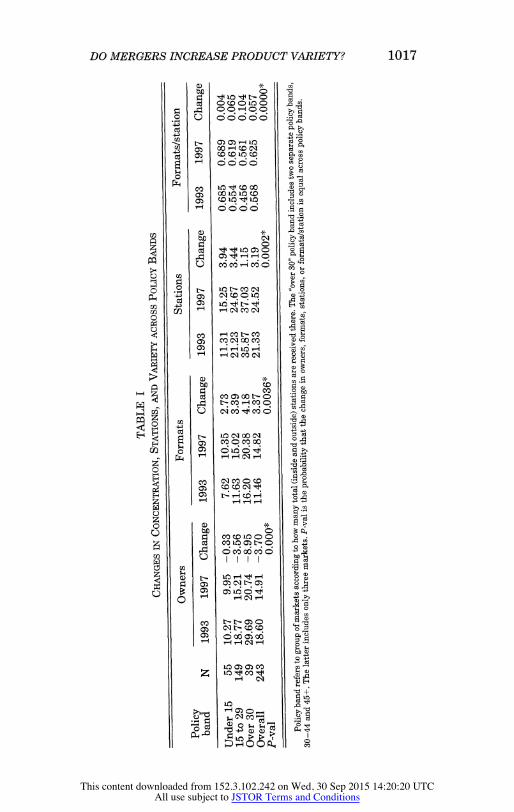
This first set of columns of Table I shows the change in concentration (measured by the number of owners operating lo- cally), variety (measured by the number of formats aired locally), stations, and formats/station between 1993 and 1997, both over- all and by policy bands. Not only was there an "experiment" overall-the average number of owners per market declined from 18.6 to 14.9-the "experiment" was systematically larger in
19. The FCC maintains no list of markets in each ownership restriction category. According to FCC staffer Alan Aronowitz, a market, for broadcast purposes, "is defined by the signal contours of the station(s) involved." To deter- mine the number of stations in a subject station's market, one "basically counts the number of signals that overlap with the subject station to determine the number of signals in that station's market" (email communication with author, February 24, 1998).
20. Consequently, we also employed policy band dummies based on the number of stations broadcasting from inside the metropolitan area in 1993, which is likely to understate the number of stations in the market for the purpose of the 1996 Act. This IV strategy yields similar results.
This content downloaded from 152.3.102.242 on Wed, 30 Sep 2015 14:20:20 UTCAll use subject to JSTOR Terms and Conditions
DO MERGERS INCREASE PRODUCT VARIETY? 1017
4, 00?,00 00 6666 Cl L
a))~~~~~~~~~~IR a Ot; OQe O P.1
3~ 0) o o o o o
0 0t 00 ' O C. 4 1 10 C.
0 O 6 0 o ~~~~~~~~~~~~~~)~C ,
? bce ~nc w
0 ?O C d%
Zq O
Co 0) 0~~~~~ 0 a)ai~~~~~~ 0 aa.0C)V
-4 m ud vs4 - N
Cy r- O1 >- CO 0)
CO'CO a)"
0) ,-4r-ILC),--4~~~~~~~~~~;-
00
Cd CO m0)C t0 --C -' C
Cd~~~~~~) t o 1Ci0'C0 N C
0) CO)9CCYJ 00
0 '-a)~~~~~~~ CO C"ICO0C to
0~~~~~t O ~~~~~~~~)
c *I C
0~~~~~~~~~~~~~~~~~~0
0) 0~~~~~0
0 a)-~~~~~
40~~~~" z
a)- i)-C C"'
This content downloaded from 152.3.102.242 on Wed, 30 Sep 2015 14:20:20 UTCAll use subject to JSTOR Terms and Conditions

1018 QUARTERLY JOURNAL OF ECONOMICS
larger markets, where greater changes in concentration were permitted. One clearly rejects the hypothesis of equal-sized changes in the different policy bands.2'
The numbers of formats and stations both increased overall. However, the growth in formats was systematically higher, and the growth in stations systematically lower, in larger markets. Consequently-as the last set of columns in Table I show-for- mats/station grew more in larger markets. All of these growth differences are significant at the 95 percent level. Trends in table I foreshadow many of the results in the paper. Larger markets, with greater increases in concentration, experience smaller sta- tion growth, larger format growth, and greater growth in the number of formats per station. That is, increases in concentration appear to reduce the incentive to add stations and to increase variety, both absolutely and conditional on the number of sta- tions. We now turn to documenting the effects of increased con- centration more systematically.
IV. RESULTS
This section has three parts. First, we present basic results on the relationship between concentration and variety. Second, we present robustness checks. Last, we present evidence on the product crowding mechanism.
1. Basic Results First, does concentration affect the number of stations oper-
ating?22 We test this by regressing the change in the number of stations operating per market on the changes in owners and population. Table II reports results of these regressions. The first column reports an OLS regression, which shows a positive and significant relationship between owners and stations. Column (2) reports an IV regression using the policy band approach. The IV specification also shows a positive and significant effect, indicat- ing that consolidation (which reduces the number of owners)
21. One obtains similar results using the four-firm concentration ratio as the concentration measure. The significant difference in the changes across policy bands also survives double differencing using data from 158 markets from which 1989 data are also available.
22. Note that, given multistation firms, the number of stations is not the number of firms. Rather, it is the number of products. We use the term "station entry" to refer to the launch of additional stations, as opposed to firm entry into a market.
This content downloaded from 152.3.102.242 on Wed, 30 Sep 2015 14:20:20 UTCAll use subject to JSTOR Terms and Conditions

DO MERGERS INCREASE PRODUCT VARIETY? 1019
TABLE II REGRESSION RESULTS
AStations AFormats/Stations AFormats
OLS IV OLS IV OLS IV (1) (2) (3) (4) (5) (6)
Constant 5.126* 4.446* 0.014 0.014 3.285* 2.731* (0.226) (0.280) (0.010) (0.012) (0.192) (0.223)
AOwners 0.525* 0.318* -0.011* -0.011* 0.018 -0.151* (0.045) (0.085) (0.001) (0.002) (0.030) (0.050)
APopulation 0.230 -3.643 0.1569 0.1574 6.518 3.361 (mil.) (5.80) (6.986) (0.123) (0.1294) (3.767) (4.265)
R2 0.4181 0.3547 0.1829 0.1829 0.0159 0.0486 N 243 243 243 243 243 243
Asterisk indicates 95 percent level of significance. First-stage regression for IV specification is
AOwners =-0.319 - 3.218*policyband 2 - 8.521*policyband 3 - 9.290*policyband 4 - 0.0011APOP93-97. (0.469) (0.555) (0.770) (2.071) (0.0057)
reduces the growth in station entry. We are concerned that li- cense scarcity (i.e., that station entry may be possible in small but not in large) markets may affect this result. To check this, we also ran the regressions in columns (1) and (2) omitting the top 25 and top 50 markets. The results hold in all of the specifications. See below for other robustness checks.
That concentration dampens station entry is especially inter- esting given the possibility of excess station entry into radio broadcasting. Berry and Waldfogel [1999a] estimate that, from the standpoint of maximizing the joint surplus of the buyers and sellers of advertising (that is, ignoring the value of programming to listeners), free entry of stations generated three times too many stations in the top 135 U. S. markets in 1993. It is impor- tant to emphasize, however, that those estimates ignore the value of programming to listeners. Consequently, the reduction in the number of stations associated with increased concentration may have negative welfare consequences.
Second, does the increased concentration occurring under the 1996 Telecom Act affect programming variety? Existing research shows a positive relationship across markets between the amount of radio programming variety and the share of population listen- ing to radio (see Rogers and Woodbury [1996] and Berry and Waldfogel [1999b]). This indicates that listeners value variety. We know (from Table I) that both the average numbers of stations
This content downloaded from 152.3.102.242 on Wed, 30 Sep 2015 14:20:20 UTCAll use subject to JSTOR Terms and Conditions

1020 QUARTERLY JOURNAL OF ECONOMICS
and formats available, as well as formats per station, in each market rise substantially between 1993 and 1997. The question we address here is whether the growth in formats is larger in markets with greater growth in concentration (reduction in the number of owners).
There are actually two separate questions of interest here. We have already documented that concentration reduces station entry, which will mechanically reduce variety. The question of theoretical interest is how much variety a more concentrated market brings forth from the number of stations that operate. A separate question of practical interest is the overall effect of concentration on variety. We examine these in turn.
Columns (3) and (4) of Table II present regressions of the change in formats/station on changes in owners and population. In both OLS and IV specifications concentration increases the number of formats relative to the number of stations operating. This suggests that increased concentration causes owners to space their stations differently. Columns (5) and (6) document the overall effect of concentration on variety (not adjusting for effects on the number of stations). While OLS gives insignificant results, the IV results show a positive overall effect of concentration on variety. Not only does consolidation increase variety per station, the IV results indicate that consolidation raises variety overall.
2. Robustness Table III reports results of seven types of alternative specifica-
tions for each of the three basic dependent variables. In row 1 we report second-stage IV results using 1993 population and its square, rather than policy bands, as instruments.23 Results for all three dependent variables are substantively similar; the format result is not significant. Rows 2-4 report OLS and two TV specifications that employ the four-firm concentration ratio, rather than the number of owners, as the basic measure of concentration. Note that with this variable the signs are reversed. OLS gives results consistent with the basic results for stations and formats/station. In sign, both sets of TV results are consistent with basic results; the formats IV result using population terms as instruments is insignificant. Rows 5-7
23. The first-stage regression is
AOwnersi - -1.98 - 3.1 *Pop93i + 0.18 *Pop93i, (0.30) (0.37) (0.036)
where robust standard errors are in parentheses, and the R2 is 0.25.
This content downloaded from 152.3.102.242 on Wed, 30 Sep 2015 14:20:20 UTCAll use subject to JSTOR Terms and Conditions

DO MERGERS INCREASE PRODUCT VARIETY? 1021
TABLE III ROBUSTNESS OF CONCENTRATION EFFECTS
AFormats/ Description of regression: AFormats AStations station
1. Population terms, rather than -0.083 0.572* -0.011* policy bands, as Instruments (0.062) (0.084) (0.002)
2. Four-firm concentration ratio -1.154 -7.473* 0.115* (FFCR) as concentration (1.050) (1.710) (0.056) measure (OLS)
3. FFCR by V (policy bands) 10.959* -16.316* 0.916* (5.325) (7.350) (0.311)
4. FFCR by IV (population 4.683 -29.323* 0.581* terms) (3.452) (6.869) (0.197)
5. Double differenced OLS (158 0.157* 0.760* -0.12* observations) (0.044) (0.041) (0.002)
6. Double differenced IV (using -0.002 0.693* -0.018* policy bands) (0.080) (0.097) (0.004)
7. Double differenced IV (using 0.001 0.855* -0.015* population terms as (0.117) (0.133) (0.004) instruments)
Each entry in the table is the coefficient on an ownership measure in a format, station, for formats/station regression. Standard errors are in parentheses. Asterisk indicates 95 percent significance level.
report results based on twice-differenced data for the 158 markets with data for 1989.24 The stations and formats/station results all survive double differencing with their significance intact. The dou- ble differenced OLS formats result is significant with the opposite sign of the basic result. The two double differenced TV formats results are insignificant.
Tables II and III together indicate that the basic results for stations and formats/station are quite robust. Results for formats are weaker. However, either IV formats results indicate that consolidation increases variety, or they are insignificant. None of our IV specifications show a significant negative impact of con- solidation on variety.
3. Product Crowding Mechanism How can we rationalize the result that concentration de-
creases station entry without decreasing variety? One possibility
24. Thus, for example, the formats regression includes the 1993-to-1997 change in formats less the 1989-to-1993 change as the dependent variable and similar twice-differenced variables on the right-hand side.
This content downloaded from 152.3.102.242 on Wed, 30 Sep 2015 14:20:20 UTCAll use subject to JSTOR Terms and Conditions

1022 QUARTERLY JOURNAL OF ECONOMICS
suggested by our theoretical examples is that multistation firms populate product space with stations offering similar but not identical programming. To examine this, we ask whether jointly owned local stations are more likely than random pairs to operate in similar formats. A firm might operate stations in nearby for- mats for two broad reasons. First, a firm might enjoy format- specific expertise giving rise to economies associated with oper- ating stations in similar formats. Second, firms might operate stations in nearby formats to preempt competitor entry, as in our third theoretical example above. Because stations compete for listeners only locally, the tendency for firms to operate adjacent stations across markets reflects production cost economies. An additional tendency for a firm's locally owned stations to operate in adjacent formats, by contrast, reflects a combination of strate- gic considerations and local economies.25
Table IV presents the probability that pairs of stations broad- cast programming in similar formats according to whether the two stations are jointly owned ("siblings") and, if jointly owned, whether the two stations broadcast from the same, or different, markets. We measure similarity of programming using the top 30 overlap information discussed above (and addressed in greater detail in Berry and Waldfogel [1999c]).
While only 17.62 percent of randomly selected pairs of sta- tions broadcast in similar formats, 27.68 percent of local sibling pairs broadcast in similar formats. Part of this elevated tendency for local siblings to broadcast in nearby formats reflects scale economies: 22.02 percent of nonlocal sibling pairs broadcast in similar formats. Yet, the degree of overlap is statistically signifi- cantly higher for local than for nonlocal siblings, suggesting stra- tegic product positioning motives.26
We can construct another test for preemptive product position- ing that may distinguish spatial preemption from other explana- tions of heightened format adjacency among local siblings. If firms
25. While intuitive, our test does not rule out all other reasons why jointly owned local stations might be more likely than unrelated stations to program in similar formats. For example, economies in the sale of advertising could encour- age programming in adjacent formats. To the extent that advertising is sold locally, this would lead to overlap among local, but not necessarily among national jointly owned stations.
26. Regardless of whether the elevated format similarity among local, as opposed to nonlocal siblings arises because of strategic, or intentionally preemp- tive, behavior, it can still be preemptive in effect. While it would be interesting to know why firms locate their stations where they do, our argument that product positioning is preemptive does not require firms to have strategic intentions.
This content downloaded from 152.3.102.242 on Wed, 30 Sep 2015 14:20:20 UTCAll use subject to JSTOR Terms and Conditions

DO MERGERS INCREASE PRODUCT VARIETY? 1023
TABLE IV JOINT STATION LOCATION AND LoCAL AND NATIONAL JOINT OWNERSHIP
Percent in Percent in very or extremely extremely Percent in
similar similar similar (but not (but not (but not
Number Percent same) same) same) of station in same format format format
pairs format (>10) (>5) (>0)
1. All pairs 180,234a 5.87 4.01 7.24 17.62 2. Unrelated pairs 178,667a 5.84 4.00 7.22 17.58 3. Stations owned
by same firm, broadcasting in different market 1,508a 8.42 4.77 9.62 22.02
Difference between 2.58* 0.77 2.40* 4.44* 2 and 3 (0.61) (0.51) (0.67) (0.98)
4. Stations owned by same firm and broadcasting from the same market 4,433b 4.99 7.60 12.79 27.68
Difference between -3.44* 2.83* 3.17* 5.66* 3 and 4 (0.79) (0.68) (0.91) (1.26)
Calculations of quantities 1, 2, and 3 from all possible station pairs created from a 10 percent sample of stations in the database (these samples are denoted by superscript "a"). Calculation 4 based on the fulll population of same-city jointly owned station pairs (denoted by superscript "b"). Standard errors are in parentheses.
crowd products to preempt entry, then they will need to crowd them more closely together in larger markets, where a smaller "hole" is vulnerable to competitor entry. Table V presents regressions of the average amount of overlap among local siblings on measures of market size, and the coefficients on population (or its log) are uni- formly positive and significant. To check whether our result is an artifact of "product congestion" that increases in market size regard- less of whether pairs are jointly owned, we include some specifica- tions with the average level of overlap among nonsiblings in the market. The positive relationship between local sibling overlap, and market size survives intact. This result is consistent with spatial preemption and is difficult to explain using scale economies.27
27. This result provides systematic evidence of what broadcast trade jour- nalists have termed the "Wall of Women," Chancellor Media's cluster of New York City stations targeting female listeners. See Schifrin [1998].
This content downloaded from 152.3.102.242 on Wed, 30 Sep 2015 14:20:20 UTCAll use subject to JSTOR Terms and Conditions

1024 QUARTERLY JOURNAL OF ECONOMICS
TABLE V AvERAGE OVERLAP AMONG LOCAL SIBLINGS AND MARKET SIZE
Dependent variable: Average local overlap among siblings
Constant 3.34 4.34 -0.330 0.568 (0.20) (0.63) (0.97) (1.39)
1997 Population (000) 0.390 0.34 (0.13) (0.13)
1997 Log population 0.672 0.612 (0.16) (0.18)
Average local overlap -0.288 -0.163 among unrelated stations (0.17) (0.18)
Number of obs. 237 237 237 237
Standard errors are in parentheses.
CONCLUSION
Theory gives ambiguous predictions for the effect of consolida- tion on product variety, but measurement of the relationship is typically dogged by endogeneity problems. Using instruments justi- fied by the change in local ownership rules under the 1996 Telecom- munications Act, we find evidence that the increased concentration reduced station entry without reducing variety. Consolidation in- creases the amount of programming variety relative to the number of stations. We find some evidence that consolidation increases the amount of programming variety absolutely. We argue that the ef- fects that we document can be explained as a result of firms locating jointly owned stations in ways that preempt entry. Pairs of jointly owned local stations are substantially more likely than jointly owned nonlocal station pairs to program in different, albeit nearby, formats. Furthermore, the proximity of joint owners' stations is greater in larger markets.
Because a full welfare analysis requires information on the effects on advertising prices, as well as the effects on entry and variety, we cannot provide an overall evaluation of the Act. At the same time, our results suggest that the increased concentration has reduced potentially excessive resource use on station entry without hurting listeners. Antitrust authorities considering radio mergers might want to take such effects into account when they try to anticipate the effect of mergers on overall welfare.
YALE UNIVERSITY AND NBER THE WHARTON SCHOOL, UNIVERSITY OF PENNSYLvANiA AND NBER
This content downloaded from 152.3.102.242 on Wed, 30 Sep 2015 14:20:20 UTCAll use subject to JSTOR Terms and Conditions

DO MERGERS INCREASE PRODUCT VARIETY? 1025
REFERENCES Alexander, Peter, "Product Variety and Market Structure," Journal of Economic
Behavior & Organization, XXXII (1997), 207-214. The Arbitron Company, Radio Metro Market Guide, 1993-1994 (New York: NY:
The Arbitron Company, 1994). ,Radio USA, Spring 1989, 1993, 1997 (New York, NY: The Arbitron Com- pany, 1989, 1993, 1997).
Berry, Steven, and Joel Waldfogel, "Free Entry and Social Inefficiency in Radio Broadcasting," RAND Journal of Economics, XXX (1999a), 397-420.
Berry, Steven, and Joel Waldfogel, "Public Radio in the United States: Does it Correct Market Failure or Cannibalize Commercial Stations?" Journal of Public Economics, LXXI (1999b), 189-211.
Berry, Steven, and Joel Waldfogel, "Mergers, Station Entry, and Programming Variety in Radio Broadcasting," National Bureau of Economic Research Working Paper No. 7080, April 1999c.
Bonanno, Giacomo, "Location Choice, Product Proliferation and Entry Deter- rence," Review of Economic Studies, LIV (1987), 37-45.
Dixit, Avinash, and Joseph E. Stiglitz, "Monopolistic Competition and Optimum Product Diversity," American Economic Review, LXVII (1977), 297-308.
Duncan, James H., Duncan's American Radio, Spring 1989, 1993 (Indianapolis, IN: Duncan's American Radio, 1989, 1993).
Duncan, James H., and Thom Moon, Duncan's American Radio, Spring 1997 (Cincinnati, OH: Duncan's American Radio, 1997).
Judd, Kenneth, "Credible Spatial Preemption," Rand Journal of Economics, XVI (1985), 153-166.
Klein, Joel, "DOJ Analysis of Radio Mergers." Address Presented at ANA Hotel, Washington, DC, February 19, 1997.
Lancaster, Kelvin, Variety, Equity, and Efficiency (New York, NY: Columbia University Press, 1979).
Mankiw, N. Gregory, and Michael D. Whinston, "Free Entry and Social Ineffi- ciency," Rand Journal of Economics, XVII (Spring 1986), 48-58.
Mazzeo, Michael, "Product Choice and Oligopoly Market Structure," Kellogg School of Management Working Paper, 1998.
Myerson, Allen R., "Riding Radio Merger Wave, Chancellor Will Buy Capstar," New York Times (August 28, 1998), p. D4.
Ness, Susan, "Remarks of Commissioner Susan Ness before the Michigan Asso- ciation of Broadcasters," Washington, DC: FCC, February 25, 1997.
Rogers, Robert, and John Woodbury, "Market Structure, Program Diversity, and Radio Audience Size," Contemporary Economic Policy, XIV (1996), 81-91.
Schifrin, Matthew, "Radio-active Men," Forbes, CLXI (June 1, 1998), 130-135. Schmalensee, Richard, "Entry Deterrence in the Ready-to-Eat Breakfast Cereal
Industry," Bell Journal of Economics, IX (1978), 305-327. Spence, Michael, "Product Selection, Fixed Costs, and Monopolistic Competition,"
Review of Economic Studies, XLIII (1976), 217-236. Steiner, Peter, "Program Patterns and the Workability of Competition in Radio
Broadcasting," Quarterly Journal of Economics, LXVI (May 1952), 194-223. Sutton, John, Sunk Costs and Market Structure (Cambridge, MA: MIT Press,
1991).
This content downloaded from 152.3.102.242 on Wed, 30 Sep 2015 14:20:20 UTCAll use subject to JSTOR Terms and Conditions