do employment quotas explain the occupationalftp.iza.org/dp5894.pdf · do employment quotas explain...
TRANSCRIPT

DI
SC
US
SI
ON
P
AP
ER
S
ER
IE
S
Forschungsinstitut zur Zukunft der ArbeitInstitute for the Study of Labor
Do Employment Quotas Explain the Occupational Choices of Disadvantaged Minorities in India?
IZA DP No. 5894
July 2011
Larry L. HowardNishith Prakash

Do Employment Quotas Explain the
Occupational Choices of Disadvantaged Minorities in India?
Larry L. Howard California State University
Nishith Prakash University of Connecticut
and IZA
Discussion Paper No. 5894 July 2011
IZA
P.O. Box 7240 53072 Bonn
Germany
Phone: +49-228-3894-0 Fax: +49-228-3894-180
E-mail: [email protected]
Any opinions expressed here are those of the author(s) and not those of IZA. Research published in this series may include views on policy, but the institute itself takes no institutional policy positions. The Institute for the Study of Labor (IZA) in Bonn is a local and virtual international research center and a place of communication between science, politics and business. IZA is an independent nonprofit organization supported by Deutsche Post Foundation. The center is associated with the University of Bonn and offers a stimulating research environment through its international network, workshops and conferences, data service, project support, research visits and doctoral program. IZA engages in (i) original and internationally competitive research in all fields of labor economics, (ii) development of policy concepts, and (iii) dissemination of research results and concepts to the interested public. IZA Discussion Papers often represent preliminary work and are circulated to encourage discussion. Citation of such a paper should account for its provisional character. A revised version may be available directly from the author.

IZA Discussion Paper No. 5894 July 2011
ABSTRACT
Do Employment Quotas Explain the Occupational Choices of Disadvantaged Minorities in India?*
This article investigates the effects of a large-scale public sector employment quota policy for disadvantaged minorities (Scheduled Castes and Scheduled Tribes) in India on their occupational choices, as defined by skill level, during the 1980s and 1990s. We find that, first, the employment quota policy significantly affects the occupational structure of both disadvantaged minority populations. In response to the employment quotas, individuals belonging to the Scheduled Caste group are more likely to choose high-skill occupations and less likely to choose low- and middle-skill occupations, while individuals belonging to the Scheduled Tribe group are less likely to choose high-skill occupations and more likely to choose low- and middle-skill occupations. Second, the impact of the employment quotas is significantly related with an individual’s years of schooling. Overall, the results indicate that the employment quota policy changes the occupational choices of individuals within the targeted populations and contributes to their improved socio-economic standing. JEL Classification: J62, J61, J24, O10, O2 Keywords: affirmative action, employment quota, occupational choice, skill, caste, India Corresponding author: Nishith Prakash Department of Economics and Human Rights Institute University of Connecticut 341 Mansfield Rd. Storrs, CT 06269 USA E-mail: [email protected]
* We thank officials at the Government of India Ministry of Social Justice and Empowerment, and Scheduled Caste and Scheduled Tribe Commissioner’s office in New Delhi, India for data provision and discussion, and two anonymous referees for helpful comments and suggestions on an earlier draft. The earlier version of the paper was titled “Does Employment Quota Explain Occupational Choice Among Disadvantaged Groups? A Natural Experiment from India”.
1 Introduction
Policymakers around the globe often attempt to improve the economic status of disad-
vantaged populations by making use of direct employment incentives commonly referred to
as affirmative action policies. This research takes a first step in assessing the extent to
which India’s federal policy requiring states to designate a percentage of all public sector
job vacancies for historically disadvantaged minorities has changed the occupational struc-
ture of the targeted populations during the 1980s and 1990s. Economists have long been
concerned with the study of occupational choice due to its strong potential to affect the
socio-economic status of an individual.1 While quantifying the effects of occupational choice
on economic prosperity is important, there is also considerable interest in understanding the
factors influencing an individual’s choice. For instance, Driver (1962) and more recently
Tsukahara (2007) identify the effects of family background characteristics on the subsequent
occupational choices of children, Soopramanien and Johnes (2001) estimate the effects of
gender on labor market participation decisions and occupational choices among individuals
in the United States, Iannelli (2002) study differences in the extent to which social origin
affects young people’s educational and occupational outcomes in European Union countries,
and Constant and Zimmermann (2003) analyze the contrast in the occupational choices of
native and non-native Germans. Further, Amin (2004) estimates the impact of government
affirmative action policies in Malaysia on the employment patterns of married women for
three ethnic groups (the Malays, Chinese, and Indians) and finds that the policies have
significantly different effects across the three groups.
In this article we provide the first estimates of the role that India’s public sector employ-
ment quotas have in shaping the occupational choices, as defined by skill level, of individuals
belonging to the two largest disadvantaged minority populations, the Scheduled Castes and
1See Becker (1962) and Driver (1962) for early studies.
1
the Scheduled Tribes.2 The policy of setting employment quotas is, in general, used by the
government and other institutions to help historically disadvantaged sections of society. A
primary objective of this type of policy is to compensate individuals belonging to the disad-
vantaged group for past discrimination and subsequently increase their economic prosperity.
Some economists have even suggested that“the occupational attainment of an individual will
be a major determinant of their level of consumption, self-esteem, and their general status
in society” (Harper and Haq, 1997). Given the importance of an individual’s occupational
choice in shaping their future socio-economic standing, it is of great interest to analyze the
effects of a large-scale public sector employment quota policy on the occupational choices of
the individuals around which the policy is designed.
Identifying the effects of affirmative action policies can be difficult because how the poli-
cies are determined and enacted is likely to be endogenous to the local environment. For
instance, one can easily imagine a scenario where the institutions or locations that have
affirmative action policies in place for minorities are likely to favor them in other ways too,
which potentially confounds the interpretation of estimated coefficients for a regression of
occupational outcomes on policy characteristics.3 In the case of India, the manner in which
the public sector employment quotas are implemented facilitates the identification of its ef-
fects. According to the Constitution of India, the percentage of employment quota in each
state for the Scheduled Castes and the Scheduled Tribes – the two principal historically dis-
advantaged populations in India – must be equal to their respective shares of a state’s total
population in the most recently tabulated census of the population (Prakash (2010)). This
policy rule generates exogenous variation in public sector employment quota at the state
level, and permits the identification of their effects on occupational choices. We are able to
2India’s employment based affirmative action policy is arguably the world’s largest in both its nature andcoverage.
3For a detailed discussion on the issue of identification in the context of India see Prakash (2010) and(Chin and Prakash, 2010).
2
account for intercensal fluctuations in minority population shares across states in order to
avoid confounding the effects of the policy with other state-level changes that are likely to be
correlated with employment opportunities. It is erroneous to expect a minority population’s
share to only affect occupational choices through the public sector employment quotas. In-
stead, our empirical strategy takes advantage of the fact that the quota levels set for the
two minority groups can only change with a time lag with respect to their corresponding
census and current population shares. The lag generated by the policy rule allows us to
separately identify the effects of the quotas from the effects of contemporaneous changes in
the respective population levels of the Scheduled Castes and the Scheduled Tribes.
We analyze the occupational structure of minorities in India using multinomial logit
models that include measures of gender, educational attainment, and age as individual-level
explanatory variables (Schmidt and Strauss, 1975), as well as a number of relevant character-
istics of the state environments in which minorities reside and are employed. To estimate the
models, we use detailed individual-level data from multiple rounds of the National Sample
Survey (NSS) of India for the years 1983, 1988, 1994, and 1999, respectively.4 Our models do
not require us to make an assumption about an appropriate reference point (such as average
educational attainment). Instead, one of the the key advantages is that we can use indi-
vidual level observations for the econometric analysis as opposed to aggregate percentages.
Additionally, multinomial logit models are practical to apply in this context because they are
consistent with notions of random utility maximization, easy to specify and straightforward
to estimate using standard maximum likelihood procedures.5
Our main findings indicate that the occupational choices of individuals within the targeted
4The National Sample Survey Organization (NSSO), a permanent survey organization, set up in theDepartment of Statistics of the Government of India in 1950, collects data on various facets of the Indianeconomy through nationwide large-scale sample surveys to assist in socio-economic planning and policymaking. We use data from the Employment and Unemployment rounds (also called Schedule 10.0) of thissurvey in 1983-1984 (38th round), 1987-1988 (43rd round), 1993-1994 (50th round), and 1999 (55th round).
5(Boskin, 1974); (Brown et al., 2008); (Connolly et al., 1992); (Constant and Zimmermann, 2003); (Filer,1986); (Harper and Haq, 1997); (Hill, 1983); (McFadden and Tye, 1981); (McFadden, 1973).
3
populations are responsive to the public sector employment quota policy. Estimation of the
effects of employment quotas on the occupational structure for minorities in India should
be of interest for a number of reasons. First, we are not aware of any previous study which
rigorously quantifies the role of the quotas in shaping an individual’s choice of occupation,
as defined by skill level. Yet, this is the largest affirmative action policy in the world,
and has existed for over a half century. Second, this article contributes to the literature
concerned with understanding factors that have an affect on individual occupational choice
in developing countries. Finally, in the context of economic development, we show that the
optimal design and implementation of employment quota policies are likely to be complex
as the economic incentives created by such policies are related with individual’s years of
schooling.
The remainder of this article proceeds as follows. Section 2 provides background infor-
mation on disadvantaged minorities and the employment quota policy in India. Section 3
presents the theoretical framework and estimation strategy, while Section 4 describes the data
used in our analysis. We report the main results of our study in Section 5, and conclude
with a discussion of our findings in Section 6.
2 Background
2.1 Caste System and Disadvantaged Minorities in India
There are various theories behind the origin of the caste system in India, ranging from
a theory of traditions to a theory of occupation. The caste system is a system of social
stratification in which classes are defined by endogamous hereditary groups, often termed
jatis or castes.6 The caste system is believed to be as old as 3000 years, and consists
6The word caste or ‘jati’ is derived from the word ‘jan’, ‘to be born,’ and indeed the jatis are endogamous:one is born in the caste one’s parents belong to; they are organized in a hierarchical way due to their status,given in terms of ritual purity, according to a continuum ranging from Brahmins (upper castes) to the
4
of the following broad divisions (or varnas): Brahmins (Priests), Kshatriyas (Warriors),
Vaisyas (Merchant), Sudras (Servants), and Scheduled Castes (outcasts, lowest menial jobs,
also referred as dalits or untouchables). Another important and historically disadvantaged
group, which is outside the Hindu religion and the caste system, is the Scheduled Tribes (also
referred as Adivasis). Post Independence, other backward castes (OBC) is also added as a
new category. The OBC category consists of castes that are just above the Scheduled Castes
and largely belong to the upper sections of the Shudra category, with a few lower ranking
Kshatriyas jatis being included. Each of the five caste groups are distinguished based upon
their own customs and rules which define an individual’s status, behavior, rituals, occupation,
food, and marriage among other characteristics.7
The Indian constitution explicitly recognizes Scheduled Castes (SCs)8 and Scheduled
Tribes (STs)9 as the two principal historically disadvantaged minority groups in India, pre-
viously known as the depressed classes.10 They together account for 24.4 percent of the total
population according to the 2001 census. The SCs, who make up 16.2 percent of the total
population, are comprised of groups isolated and disadvantaged by their “untouchability”
status.11 The word “untouchability” refers to their low status in the traditional Hindu caste
Untouchables (scheduled castes).7Brahmins, Kshatriya, and Vaishya are considered higher in status than Shudras because adolescent males
from these varnas undergo a thread ceremony making them ‘twice born’, a privilege not available to Shudras.Brahmins are conceptualized as being at the top of the stratification system, superseding the the Kshatriyasin spite of the latter’s worldly power and wealth as the ruling caste.
8Selection criteria for Scheduled Castes: 1. Cannot be served by clean Brahmans; 2. Cannot be served bybarbers, water-carriers, tailors, etc who serve the caste Hindu; 3. Pollutes a high-caste Hindu by contact orby proximity; 4. Is one from whose hands a caste Hindu cannot take water; 5. Is debarred from using publicamenities, such as roads, ferries, wells or schools; 6. Is debarred from the use of Temples (place of worship);7. Will not be treated as an equal by high-caste men of the same educational qualification in ordinary socialintercourse; 8. Is merely depressed on account of its own ignorance, illiteracy or poverty and, but for that,would be subject to no social disability; 9. Is depressed on account of the occupation followed and whether,but for that, occupation it would be subject to no social disability.
9Selection criteria for Scheduled Tribes: 1. Tribal origin; 2. Primitive way of life and habitation in remoteand less accessible areas; 3. General backwardness in all respects.
10The criteria for the selection of “Scheduled Castes” and “Scheduled Tribes” groups as stated in Consti-tutional orders of 1950.
11The Indian Constitution prohibits the use of the word untouchability.
5

hierarchy, which exposed them to invidious treatment, severe disabilities, and deprivation of
economic, social, cultural, and political opportunities (Galanter, 1984). The STs, who make
up 8.2 percent of the total population, are distinguished by “tribal characteristics” and by
their spatial and cultural isolation from rest of the population. In addition to the aforemen-
tioned characteristics, the identity of SCs and STs is historically determined. An individual
is born as a member of the SC group or ST group and cannot change his/her caste over their
lifetime.
The SCs and STs in India do much worse off as compared to the non-minorities. Their
poverty rate as measured by a headcount ratio is twice as high as the non-minorities. Specif-
ically, the percentage of people below the poverty line in 1987-1988 was 55.2 in rural India
and 47.1 in urban India for the SCs and 59.9 in rural India and 44.7 in urban India for the
STs. Similarly, the percentage of people below the poverty line in 1999-2000 was 45.9 in
rural India and 38.3 in urban India for the SCs and 36.2 in rural India and 35.6 in urban
India for the STs, respectively.12 The infant mortality rate (per 1000) for the SC and ST
group is 109 while for the non-SC/ST group it is 54.13 This systematic deprivation across all
spheres has been the impetus for many government policies aimed at helping the SCs and
STs. Among these policies is the public sector employment quota policy.
2.2 The Public Sector Employment Quota Policy in India
The early traces of this employment quota policy for disadvantaged minorities in public
sector jobs go back to the early 1930s, under the British rule. Under the same spirit and
concern, this policy found a place when the Constitution of India was being drafted after its
independence in 1947 and its transition to a sovereign republic in 1950. Specifically, Articles
12Source: National Sample Survey 43rd and 55th round.13Source: National Family Health Survey Subject Report, 1998.
6

16(4)14, 320(4) and 335 of the Indian Constitution provide safeguards for SCs and STs in
services and posts under the state with a view to ensuring their adequate representation in
public sector jobs. The percentage of the employment quota in services/posts under the state
government varies from one state to another and is fixed on the basis of the percentage of the
SC and ST population relative to the total population in the respective state.15 This policy
of official discrimination in favor of the worst-off sections of the population is unique in the
world, both in the range of benefits involved and in the magnitude of the group members
eligible for the benefits.
The National Scheduled Caste and Scheduled Tribe Commission handles the administra-
tion of the public sector employment quota policy in India. The National Commission on SC
and ST has a vigorous statutory mandate and the powers of a civil court.16 This Commission
co-ordinates between state governments and the federal government once the recent census
population estimates by social group arrive. Before implementing the recommendation by
the Commission approval from several bodies is required. After the new estimates arrive,
the Commission revises the percentage of jobs reserved for SCs and STs according to the
new census population estimates. Next, the Commission sends the recommendation to the
President of India. Then, the Ministry of Social Justice and Empowerment places the recom-
mendation before both houses of the Parliament, which give the final approval. Only after
this set of administrative steps, the percentage of jobs reserved is revised to reflect the new
census population estimates. The jumps and time lag generated by the public sector employ-
ment quota policy in India enables us to identify its effects on the occupational structure of
14Nothing in this article shall prevent the State from making any provision for the reservation of appoint-ments or posts in favor of any backward class of citizens which in the opinion of the State, is not adequatelyrepresented in the services under the State.
15Annual Scheduled Caste and Scheduled Tribe Commissioners Report.16Under Article 338 of the Constitution, the President of India appoints a special officer known as the
commissioner for SC and ST to investigate all matters relating to the safeguards provided for the SC andST under the various provisions of the Constitution. In 1990, through the sixty-fifth amendment of theConstitution (Article 338) the special officer was replaced by a National Commission for SC and ST withpowers of a civil court to summon persons, files, etc. for securing evidence on oath.
7
both disadvantaged minority populations.
3 Theoretical Framework and Estimation Strategy
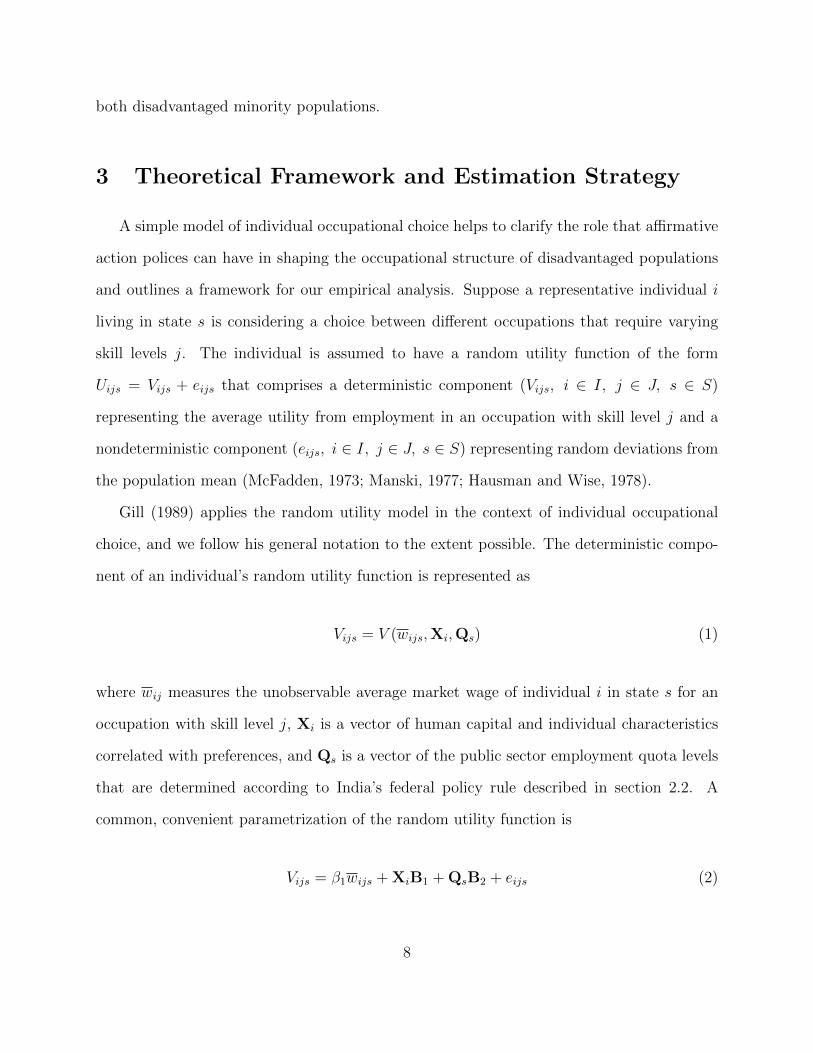
A simple model of individual occupational choice helps to clarify the role that affirmative
action polices can have in shaping the occupational structure of disadvantaged populations
and outlines a framework for our empirical analysis. Suppose a representative individual i
living in state s is considering a choice between different occupations that require varying
skill levels j. The individual is assumed to have a random utility function of the form
Uijs = Vijs + eijs that comprises a deterministic component (Vijs, i ∈ I, j ∈ J, s ∈ S)
representing the average utility from employment in an occupation with skill level j and a
nondeterministic component (eijs, i ∈ I, j ∈ J, s ∈ S) representing random deviations from
the population mean (McFadden, 1973; Manski, 1977; Hausman and Wise, 1978).
Gill (1989) applies the random utility model in the context of individual occupational
choice, and we follow his general notation to the extent possible. The deterministic compo-
nent of an individual’s random utility function is represented as
Vijs = V (wijs,Xi,Qs) (1)
where wij measures the unobservable average market wage of individual i in state s for an
occupation with skill level j, Xi is a vector of human capital and individual characteristics
correlated with preferences, and Qs is a vector of the public sector employment quota levels
that are determined according to India’s federal policy rule described in section 2.2. A
common, convenient parametrization of the random utility function is
Vijs = β1wijs + XiB1 + QsB2 + eijs (2)
8
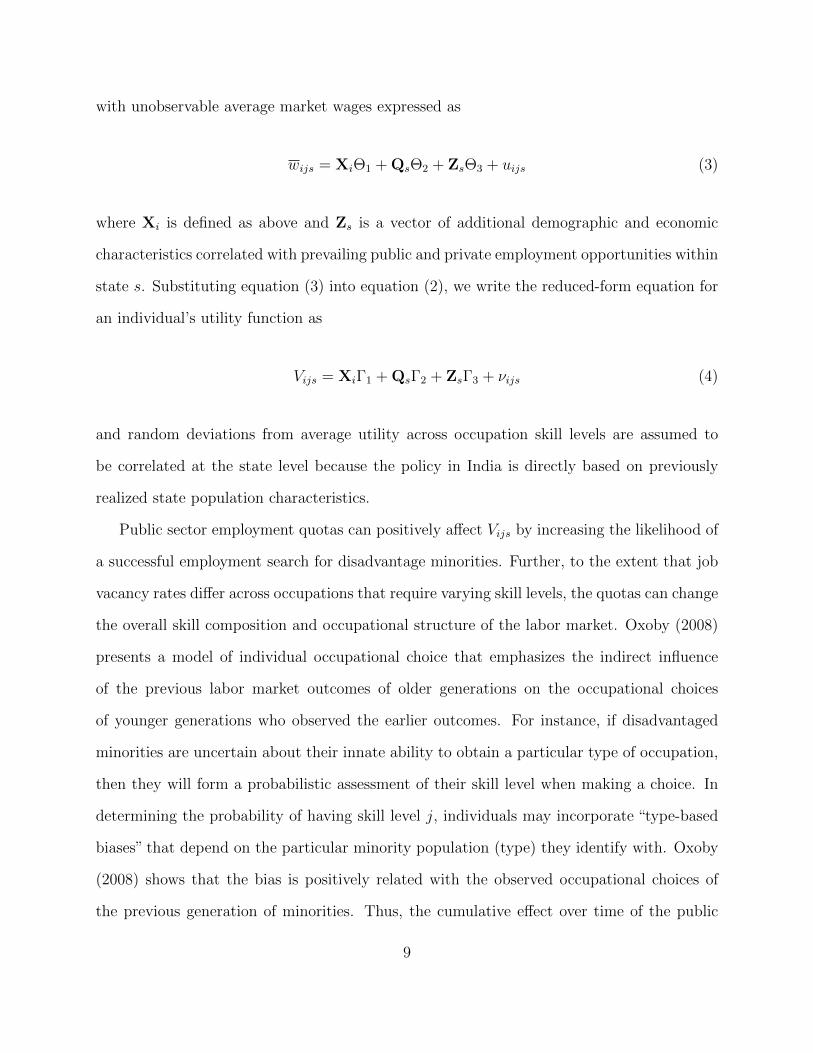
with unobservable average market wages expressed as
wijs = XiΘ1 + QsΘ2 + ZsΘ3 + uijs (3)
where Xi is defined as above and Zs is a vector of additional demographic and economic
characteristics correlated with prevailing public and private employment opportunities within
state s. Substituting equation (3) into equation (2), we write the reduced-form equation for
an individual’s utility function as
Vijs = XiΓ1 + QsΓ2 + ZsΓ3 + νijs (4)
and random deviations from average utility across occupation skill levels are assumed to
be correlated at the state level because the policy in India is directly based on previously
realized state population characteristics.
Public sector employment quotas can positively affect Vijs by increasing the likelihood of
a successful employment search for disadvantage minorities. Further, to the extent that job
vacancy rates differ across occupations that require varying skill levels, the quotas can change
the overall skill composition and occupational structure of the labor market. Oxoby (2008)
presents a model of individual occupational choice that emphasizes the indirect influence
of the previous labor market outcomes of older generations on the occupational choices
of younger generations who observed the earlier outcomes. For instance, if disadvantaged
minorities are uncertain about their innate ability to obtain a particular type of occupation,
then they will form a probabilistic assessment of their skill level when making a choice. In
determining the probability of having skill level j, individuals may incorporate “type-based
biases” that depend on the particular minority population (type) they identify with. Oxoby
(2008) shows that the bias is positively related with the observed occupational choices of
the previous generation of minorities. Thus, the cumulative effect over time of the public
9

sector employment quotas in India can provide incentives for minorities to disproportionately
choose occupations that are similar to those chosen by the majority of minorities in previous
generations. It is an empirical question as to whether the employment quota policy in India
has an unequal affect on the individual choices between occupations that require varying
levels of skill.
3.1 Estimation Strategy
To investigate the effects of India’s public sector employment quota policy on individual
occupational choices we consider a choice set that comprises low-, middle-, and high-skill
occupations (j = 1, 2, 3). Assuming individuals choose an occupation that is associated with
the highest level of utility, the probability (Pij) of an individual i choosing an occupation
with skill level j is expressed as
Pij = Prob(Vij ≥ Vik) ∀j, k ∈ J, j 6= k (5)
We utilize the standard multinomial logit model (MNL) specified as
Pij =e(XiΓ1j+QsΓ2j+ZsΓ3j)∑3
k=1 e(XiΓ1k+QsΓ2k+ZsΓ3k)j = 1, 2, 3 (6)
where i indexes each individual belonging to a minority population and j indexes the realized
choice between low, middle, and high-skill occupations, respectively. Identification of the
parameters in the model requires a normalization of the coefficients and intercept to zero
for one choice of occupation (Borooah, 2001), and we normalize relative to the middle-skill
alternative. The validity of the strategy depends on the assumption that individuals are
choosing between a low-skill and middle-skill occupation or a high-skill and middle-skill
occupation, respectively; and that individuals are not choosing between low-skill and high-
10
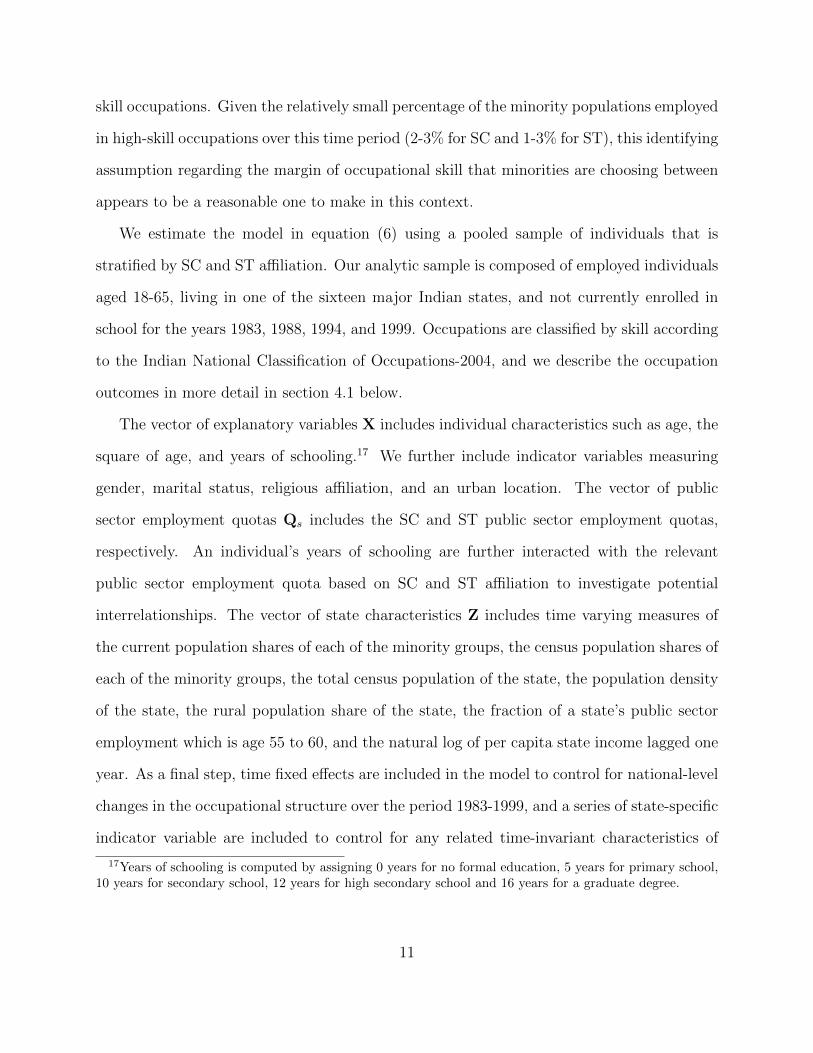
skill occupations. Given the relatively small percentage of the minority populations employed
in high-skill occupations over this time period (2-3% for SC and 1-3% for ST), this identifying
assumption regarding the margin of occupational skill that minorities are choosing between
appears to be a reasonable one to make in this context.
We estimate the model in equation (6) using a pooled sample of individuals that is
stratified by SC and ST affiliation. Our analytic sample is composed of employed individuals
aged 18-65, living in one of the sixteen major Indian states, and not currently enrolled in
school for the years 1983, 1988, 1994, and 1999. Occupations are classified by skill according
to the Indian National Classification of Occupations-2004, and we describe the occupation
outcomes in more detail in section 4.1 below.
The vector of explanatory variables X includes individual characteristics such as age, the
square of age, and years of schooling.17 We further include indicator variables measuring
gender, marital status, religious affiliation, and an urban location. The vector of public
sector employment quotas Qs includes the SC and ST public sector employment quotas,
respectively. An individual’s years of schooling are further interacted with the relevant
public sector employment quota based on SC and ST affiliation to investigate potential
interrelationships. The vector of state characteristics Z includes time varying measures of
the current population shares of each of the minority groups, the census population shares of
each of the minority groups, the total census population of the state, the population density
of the state, the rural population share of the state, the fraction of a state’s public sector
employment which is age 55 to 60, and the natural log of per capita state income lagged one
year. As a final step, time fixed effects are included in the model to control for national-level
changes in the occupational structure over the period 1983-1999, and a series of state-specific
indicator variable are included to control for any related time-invariant characteristics of
17Years of schooling is computed by assigning 0 years for no formal education, 5 years for primary school,10 years for secondary school, 12 years for high secondary school and 16 years for a graduate degree.
11
states during this time.
4 The Data
Our empirical analysis builds on a variety of data sources that we describe in this sec-
tion. The unit of analysis is an individual living in one of the sixteen major Indian states
spanning the period 1983-1999, and these states account for approximately 95% of the total
Indian population.18 The primary source of data is the National Sample Survey (NSS) as
it provides a large, nationally representative sample of households in India. We use data
from the Employment and Unemployment rounds (also called Schedule 10.0) of this survey
in 1983-1984 (38th round), 1987-1988 (43rd round), 1993-1994 (50th round), and 1999 (55th
round). Our analytic sample focuses on employed individuals aged 18-65, living in one of
the sixteen major Indian states, and not currently enrolled in school. The Employment
and Unemployment round of NSS is the only survey that collects information on individu-
als’ earnings and labor market characteristics for the entire country. Each survey collects
information on approximately 120,000 households and over half a million individuals.
4.1 Outcome Variables
Our occupation outcomes are constructed using the NSS Employment and Unemployment
rounds. We classify occupations into the following three skill categories using the Indian
National Classification of Occupations-2004 (NCO-2004) system:
Low Skill : This outcome variable is constructed for occupations with skill level I in the
NCO-2004. The low skilled category consist of elementary occupations such as street vendors,
shoe cleaners, domestic helpers, launderers, building caretakers, window cleaners, messen-
18The sixteen states are Andhra Pradesh, Assam, Bihar, Gujarat, Haryana, Jammu-Kashmir, Karnataka,Kerala, Madhya Pradesh, Maharashtra, Orissa, Punjab, Rajasthan, Tamil Nadu, Uttar Pradesh and WestBengal.
12
gers, porters, door keepers, garbage collectors, agricultural fishery labourers, mining and
construction labourers, manufacturing labourers, transport labourers and freight handlers.
Middle Skill : This outcome variable is constructed for occupations with skill level II
in the NCO-2004. The middle skilled category consist of occupations such as secretaries,
office clerks, cashiers, travel attendants and guides, house keeping and restaurant services
workers, protective services workers, shop salespersons, stall and market salespersons, market
gardeners, crop growers, animal producers, forestry and fishery workers, hunters, trappers,
miners, stone cutters and carvers, building finishers, painters, welders, sheet metal workers,
blacksmiths, tool makers, machinery mechanics and fitters, plant and machine operators,
locomotive engine drivers, motor vehicle drivers, and ships’ deck crews.
High Skill : This outcome variable is constructed for occupations with skill level III
and IV in the NCO-2004. The high skilled category consist of occupations such as physi-
cists, chemists, mathematicians, statisticians, computing professionals, architects, engineers,
health and nursing professionals, secondary education teaching professionals, legal profession-
als, archivists, librarians, computer associate professionals, optical and electronic equipment
operators, ship and aircraft controllers and technicians, health and nursing associate pro-
fessionals, middle and primary education teaching associate professionals, finance and sales
associate professionals, and police inspectors and detectives.
4.2 Policy and Control Variables
This article uses the Scheduled Caste and Scheduled Tribe Annual Commissioner’s Report
(1951-2000) to obtain the public sector employment quota measures for SCs and STs. The
institutional details for the employment quota policy also comes from this report. This is a
state level database available for the period 1951-2000. The variables are referred to as the
“SC public sector employment quota” and the “ST public sector employment quota,” and
measure the public sector employment quota for the SCs (STs) in a state in any given year.
13

The NSS described previously is an individual-level database while the policy variables we
focus on are at the state-time level. These policy variables, and additional control variables
for the state environment, are merged with the NSS individual-level data by state and year.
The state population data come from the Census of India, Registrar General data from
1981-2001. We use “SC (ST) current population share” which is the SC (ST) population
share from the census as measured in the current year and “SC (ST) census population
share” which is the SC (ST) population share from the last tabulated census. Population
density is computed as the ratio of the total population from the census as measured when
reservation was determined in the state to the total land area of the state, as reported in the
Census Atlas, India. This variable is also updated according to the two conditions described
above.
The individual level control variables are extracted from the NSS. They include an indi-
vidual’s age, gender, caste, and marital status. Years of school is computed by assigning 0
years for no formal education, 5 years for primary school, 10 years for secondary school, 12
years for high secondary school and 16 years for a graduate degree. We also form the variable
“Fraction of elderly people in public sector employment”. This variable is constructed using
the NSS as the total number of people between age 55-60 in the public sector employment
divided by total public sector employment times 100, and captures state variation in share
of elderly people in a public sector job over time. If there is a higher share of such people
then this could have a direct effect on potential job vacancies in the public sector. Lastly, for
the state income measure we use the logarithm of real per capita net state domestic product
in the previous year. These data come from the Domestic Product of States of India from
1983 to 2000 prepared by Economic and Political Weekly Research Foundation.
14

5 Results
5.1 The Effects of Public Sector Employment Quotas on the Oc-
cupational Choices of the SC population
Table 1 presents the predicted average marginal effects of the public sector employment
quota policy and characteristics of individuals and states on the probability of low-, middle-
and high-skill occupational employment for the Scheduled Castes.19 We find that the SC
public sector employment quota does not affect the likelihood of an SC member choosing to
be in a low- or middle-skill occupation, on average, as the reported marginal effects are not
significant at conventional levels. Although we do not find a statistically significant effect of
SC employment quota on the choice of low- and middle-skill occupations, the sign is positive
(0.0072) for the middle-skill category and negative for the low-skill category (-0.0099). One
potential explanation of the results is that members of the SC group are well represented in
these occupations already and we fail to detect any precise effect at the margin. Nonetheless,
it does not mean that the policy is having no or a negative impact on probability of low-
and middle-skill occupational employment for SCs. Another possible explanation behind the
results can be derived from a spatial mismatch story. This is especially true for low-skill
occupational employment. The marginal effect for the urban sector dummy is negative and
significant and reflects the fact that a large share of low-skill jobs in India are located in
rural areas, while the SCs are typically located in urban areas.
For high-skill occupations, we find that the SC public sector employment quota positively
changes the likelihood of an SC member choosing an occupation in this category. The
19The marginal effects reported in Table 1 are based on coefficient estimates from the multinomial logitmodel specified in equation 6, and these results are reported in Appendix Table A3. While it is possiblefor the iterative fitting procedure used to estimate multinomial logit models not to converge in some cases,our particular application of the model for the SCs converged after five iterations using the Stata mlogitprocedure (version 11; StataCorp LP; College Station, TX, USA); non-convergence was unlikely to occur inthis case given our large sample size of 202,945 observations.
15

reported marginal effect (0.0027) is statistically significant. This is an important result as
the SC public sector employment quota policy is motivating one of the most disadvantaged
minority populations to choose high-skill jobs. This will likely have a far reaching impact
on their short- and long-run socio-economic standing. A potential explanation for why we
detect a positive and significant effect can be drawn from the reported marginal effect for
the urban sector dummy; this effect is positive and significant and suggests that SC group
members are able to obtain high skill jobs because such jobs are more likely to be available
in urban areas.
Table 2 reports the predicted average marginal effects of the SC public sector employment
quota on the probability of low-, middle-, and high-skill occupational employment by years of
schooling. The results suggest that having completed more years of schooling magnifies the
impact of the employment quota on high-skill occupational employment. It is comforting to
find that the magnitude of the marginal effect increases with additional years of schooling.
There are two possible explanations for this relationship. First, more years of schooling
reflects higher ability. Second, the share of SC members who complete more than 10 years
of schooling is very low (the mean is 2.6 in 1999) and hence our estimated effects could
reflect less competition among the elite SC members.20 Overall, the percentage of individual
occupational choices predicted by our model that were in fact correct is high at 63% for the
SCs.
5.2 The Effects of Public Sector Employment Quotas on the Oc-
cupational Choices of the ST population
Table 3 presents the predicted average marginal effects of the public sector employment
quota policy and characteristics of individuals and states on the probability of low-, middle-
20However, to estimate this precise effect is beyond the scope of the current study.
16
and high-skill occupational employment for the Scheduled Tribes.21 We find that the ST
public sector employment quota does not change the likelihood of an ST member choosing
to be in a low- or middle-skill occupation, on average, as the reported marginal effects are not
significant at conventional levels. Although we do not find a statistically significant effect of
ST employment quota on the choice of low- and middle-skill occupations, the sign is negative
(-0.0044) for the middle-skill category and positive for the low-skill category (0.0078). There
are a few potential explanations behind this interesting result. First, ST members are a tribal
population who reside in geographically isolated areas, and these areas are the not typically
where the majority of the employment opportunities are. This is especially true for middle-
and high-skilled occupations. However, low-skill occupations include street vendors, shoe
cleaners, domestic helpers etc. and such jobs remain available in rural and geographically
isolated locations, albeit at a lower absolute level relative to urban areas.22 So it is intuitive
to expect the sign of the effect to be positive for the STs. Second, this result is supported
by the findings of Prakash (2010), who estimates the impact of the same employment quota
policy on general labor market outcomes. His results suggest that there was no impact of
the policy on ST’s labor market outcomes, especially employment outcomes. So it is not
surprising that we do not detect any significant effect for low- and middle-skill occupational
employment, on average.
For high-skill occupations, we find that the ST public sector employment quota nega-
tively changes the likelihood of an ST member choosing an occupation in this category. The
reported marginal effect (-0.0034) is statistically significant. This effect is a counter intu-
itive result, but considering that the share of ST members who have obtained the required
21The marginal effects reported in Table 3 are based on coefficient estimates from the multinomial logitmodel specified in equation 6, and these results are reported in Appendix Table A4. While it is possiblefor the iterative fitting procedure used to estimate multinomial logit models not to converge in some cases,our particular application of the model for the STs converged after seven iterations using the Stata mlogitprocedure (version 11; StataCorp LP; College Station, TX, USA); non-convergence was unlikely to occur inthis case given our large sample size of 110,295 observations.
22Section 4 describes the occupational outcome variables and the jobs included in each category in detail.
17
educational qualification to compete for high-skill occupational employment together with
the mixed empirical evidence of labor market discrimination in India, this is perhaps to be
expected.23 However, we need to keep in mind that our definition of high-skill occupational
employment mainly includes public sector jobs and not private sector jobs.
Table 4 reports the predicted average marginal effects of the ST public sector employment
quota on the probability of low-, middle-, and high-skill occupational employment by years
of schooling. The results suggest that having completed more years of schooling magnifies
the impact of the employment quota on high-skill occupational employment. This result is
consistent because a small number of STs complete more than 10 years of school, and once
they meet the educational qualification there is less competition among STs for low- and
middle-skill occupations. Additionally, evidence of labor market discrimination is detected
in the white collared jobs (i.e. high-skill occupational employment). For high-skill occupa-
tions, the estimated effects suggest that having completed more years of schooling increases
the negative impact of the employment quota. This relationship is possible because, as
we discussed above, there is evidence of labor market discrimination in private sector jobs
(Banerjee et al., 2009; Siddique, 2011). It is especially true for ST members with more years
of schooling completed (the majority of private sector jobs require a minimum of 12 years of
schooling completed). Overall, the percentage of individual occupational choices predicted
23Siddique (2011) uses an audit study to determine the extent of caste-based discrimination in the Indianprivate sector. On average low-caste applicants need to send 20 percent more resumes than high-casteapplicants to get the same callback. Differences in callback which favor high-caste applicants are particularlylarge when hiring is done by male recruiters or by Hindu recruiters. This finding provides evidence thatdifferences in callback between high and low-caste applicants are not entirely due to statistical discrimination.High-caste applicants are also differentially favored by firms with a smaller scale of operations, while low-casteapplicants are favored by firms with a larger scale of operations. However, in contrast, Banerjee et al. (2009)study the role of caste and religion in India’s new economy sectors-software and call-centers-by sending 3160fictitious resumes in response to 371 job openings in and around Delhi (India) that were advertised in majorcity papers and online job sites. They randomly allocate caste-linked surnames across resumes in orderto isolate the effect of caste on applicants’ job-search outcomes. They find no evidence of discriminationagainst non-upper-caste (i.e. Scheduled Castes, Scheduled Tribes, and Other Backward Caste) applicantsfor software jobs. They do find large and significant differences between callback rates for upper-castes andOther Backward Castes (and to a lesser extent Scheduled Castes) in the case of call-center jobs.
18
by our model that were in fact correct is high at 62% for the STs.
6 Discussion
In this study, we provide the first estimates of how India’s federal affirmative action policy
requiring states to designate a percentage of all public sector job vacancies for the Scheduled
Castes and Scheduled Tribes has changed the occupational structure, as defined by skill
level, of the targeted minority populations during the 1980s and 1990s. The fundamental as-
sumption underlying our empirical strategy is that individuals choosing between occupations
which require high- or middle-skill levels do not respond to occupational attributes specific
to alternative low-skill occupations. Similarly, those choosing between occupations which
require low- or middle-skill levels are not responsive to attributes of alternative high-skill
occupations. Given the relatively small percentage of minorities employed in high-skill occu-
pations over this time period (2-3% for SCs and 1-3% for STs), this identifying assumption
regarding the margin of occupational skill that minorities are choosing between appears to be
a reasonable one to make in this context. Overall, the results indicate that the employment
quota policy significantly affects the occupational choices of individuals within the targeted
populations.
On average, we find that the employment quotas have unequal effects on the overall
occupational structure of each minority population. The SCs are more likely to choose high-
skill occupations, and the STs are less likely to choose high-skill occupations. While the
results are consistent with the fact that STs tend to live in geographically isolated areas
where high-skill employment opportunities are scarce, we find additional evidence that the
employment quotas targeting the SC population also decrease the probability of STs choosing
such occupations. This estimated cross-effect suggests a degree of competition between the
two populations for high-skill employment opportunities, and that STs are possibly subject
19

to greater labor market discrimination for these occupations. Policymakers do not typically
address the potential for negative externalities in the design of affirmative action policies
that target multiple minority populations, and the findings here indicate that improvements
in occupational attainment for one minority population may come at the expense of another.
Furthermore, we uncover evidence that the impact of the employment quotas is signifi-
cantly related with an individual’s years of schooling. In general, the marginal effects become
larger in magnitude as an individual acquires additional education, and a simple evaluation
of the effects at the sample mean fails to reveal changes in the overall occupational structure
of the minority populations. For instance, while the employment quotas targeting the SC
population increase the probability of SCs choosing high-skill occupations at all education
levels, we find that they also significantly decrease the probability of SCs choosing both
low- and middle-skill occupations for those with 12 or more years of schooling. Similarly,
while the employment quotas targeting the ST population decrease the probability of STs
choosing high-skill occupations at all education levels, we find that they also significantly
increase the probability of STs choosing both low- and middle-skill occupations for those
with 16 years of schooling. In the context of economic development, the findings indicate
that the optimal design and implementation of employment quota policies are complex as
the economic incentives created by such policies are likely to depend on a combination of
individual and environmental characteristics, particularly educational attainment and the
geographical location of employment opportunities.
From a policy perspective, our findings are particularly important if we believe that
occupational choice is correlated with socio-economic standing in society. Here, we see that
schooling levels are a strong predictor of occupational choice; however, we also see that
individuals with more schooling are more responsive to the policy. So to one extent we can
attribute part of the improved socio-economic condition of the minority populations to the
employment quotas. However, some caution is required in considering the effectiveness of
20

such policies from a development standpoint. Our results suggest that policymakers need
to incorporate the spatial distribution of employment opportunities relative to the locations
of minorities within states if they intend to change the magnitude of the effects of this
particular type of affirmative action policy. More research along these lines would likely
prove informative for understanding how employment quotas change the economic incentives
for minority populations.
21
References
Amin, S., 2004. Ethnic differences and married women’s employment in malaysia: do gov-
ernment policies matter? Journal of Socio-Economics 33 (3), 291–306.
Banerjee, A., Bertrand, M., Datta, S., Mullainathan, S., 2009. Labor market discrimination
in delhi: Evidence from a field experiment. Journal of Comparative Economics 37 (1),
14–27.
Becker, G. S., 1962. Discrimination and the occupational progress of negroes: a comment.
The Review of Economics and Statistics 44 (2), 214–215.
Borooah, V., 2001. Logit and probit: Ordered and multinomial models. Sage University
Papers Series on Quantitative Applications in the Social Sciences, 07-138, Thousand
Oaks, CA.
Boskin, M. J., Part I, M 1974. A conditional logit model of occupational choice. Journal of
Political Economy 82 (2), 389–98.
Brown, S., Fry, T. R., Harris, M. N., May 2008. Untangling supply and demand in occupa-
tional choice. Economics Letters 99 (2), 414–417.
Chin, A., Prakash, N., 2010. The redistributive effects of political reservation for minorities:
Evidence from india. forthcoming in Journal of Development Economics.
Connolly, S., Micklewright, J., Nickell, S., July 1992. The occupational success of young men
who left school at sixteen. Oxford Economic Papers 44 (3), 460–79.
Constant, A., Zimmermann, K. F., 2003. Occupational choice across generations. SSRN
eLibrary.
22

Driver, E. D., 1962. Caste and occupational structure in central india. Social Forces 41 (1),
26–31.
Filer, R. K., April 1986. The role of personality and tastes in determining occupational
structure. Industrial and Labor Relations Review 39 (3), 412–424.
Galanter, M., 1984. Competing equalities: Law and the Backward Classes in India. University
of California Press, Berkeley, CA.
Gill, A. M., 1989. The role of discrimination in determining occupational structure. Industrial
and Labor Relations Review 42 (4), 610–623.
Harper, B., Haq, M., 1997. Occupational attainment of men in britain. Oxford Economic
Papers 49, 638–650.
Hausman, J. A., Wise, D. A., 1978. A conditional probit model for qualitative choice: Dis-
crete decisions recognizing interdependence and heterogeneous preferences. Economet-
rica 46 (2), 403–426.
Hill, A., 1983. Female labor force participation in developing and developed countries– con-
sideration of the informal sector. Review of Economics and Statistics 65 (3), 459–468.
Iannelli, C., Jul 2002. Parental education and young people’s educational and labour market
outcomes: A comparison across europe. MZES Working Papers 45, MZES.
Manski, C. F., 1977. The structure of random utility models. Theory and Decision 8 (3),
229–254.
McFadden, D., 1973. Conditional logit analysis of quantitative choice behavior. Frontiers of
econometrics, New York: Academic Press, 105–142.
23

McFadden, D, T. K., Tye, W., 1981. An application of diagnostic tests for the independence
from irrelevant alternative property of the multinomial logit model. Transportation Re-
search Record 637, 39–46.
Oxoby, R. J., 2008. Skill uncertainty and social inference. Labour Economics 15 (3), 400–405.
Prakash, N., 2010. The impact of employment quotas on the economic lives of disadvantaged
minorities in india. Cornell University mimeo.
Schmidt, P., Strauss, R. P., 1975. The prediction of occupation using multiple logit models.
International Economic Review 16 (2), 471–486.
Siddique, Z., 2011. Evidence on caste-based discrimination. forthcoming in Labour Eco-
nomics.
Soopramanien, D., Johnes, G., 2001. A new look at gender effects in participation and
occupation choice. LABOUR 15 (3), 415–443.
Tsukahara, I., 2007. The effect of family background on occupational choice. LABOUR
21 (4-5), 871–890.
24

Table 1: The predicted average marginal effects of public sector employment quotas and
characteristics of Scheduled Caste individuals and states on the probability of low-, middle-, and
high-skill occupational employment a
Probability of Scheduled Castes occupational skill level
Low Middle High
Explanatory variable dy/dx SE dy/dx SE dy/dx SE
SC public sector employment quota -0.0099 0.0067 0.0072 0.0060 0.0027** 0.0011 Years of schooling -0.0295** 0.0012 0.0232** 0.0012 0.0063** 0.0001 Age -0.0025** 0.0004 0.0020** 0.0004 0.0006** 0.0000 Male -0.0684** 0.0127 0.0796** 0.0135 -0.0111** 0.0022 Married 0.0380** 0.0127 -0.0336** 0.0118 -0.0044** 0.0018 Muslim religion b -0.1223** 0.0303 0.1058** 0.0321 0.0165** 0.0057 Other religion b 0.0155 0.0215 -0.0191 0.0199 0.0036 0.0027 Urban sector -0.0991** 0.0273 0.0894** 0.0271 0.0097** 0.0013 SC current year population share 0.0001 0.0066 0.0024 0.0065 -0.0025** 0.0009 SC census population share 0.0053 0.0103 -0.0082 0.0099 0.0029* 0.0015 ST public sector employment quota -0.0017 0.0058 0.0002 0.0050 0.0015 0.0010 ST current year population share 0.0382 0.0237 -0.0345 0.0222 -0.0037 0.0034 ST census population share -0.0044 0.0288 -0.0005 0.0270 0.0049 0.0051 Total census population 0.0000** 0.0000 -0.0000** 0.0000 -0.0000 0.0000 Population density 0.0001 0.0002 -0.0001 0.0002 0.0000 0.0000 Rural population share -0.0088** 0.0037 0.0073** 0.0034 0.0015** 0.0007 Public sector employees age 55-60 -0.0047** 0.0021 0.0049** 0.0021 -0.0002 0.0004 Ln(state income per capita in previous year) -0.0305** 0.0092 0.0276** 0.0086 0.0029 0.0020
Notes: Marginal effects (dy/dx) of the explanatory variables on the probability of choosing high-, middle-, and low-skill occupations and standard errors are reported. The marginal effects are based on coefficient estimates from multinomial logit model, which are reported in Appendix Table A3, and the standard errors were adjusted for within state correlation across the four survey rounds. The total number of observations in the Scheduled Castes sample is 202,945. Occupational skill is classified according to the 2004 National Classification of Occupations (NCO-2004); high-skilled occupations include professionals and associate professionals; middle-skill occupations include clerks, service workers, shop and market sale workers, agricultural and fishery workers, craft and related trades workers, and plant and machine operators and assemblers; low-skilled occupations include elementary occupations. See section 4.1 for more information on the specific occupations included in each skill category. ** Significant at 5-percent level; * Significant at 10-percent level. a SC and ST indicate the populations of the Scheduled Castes and Scheduled Tribes, respectively.
b Hinduism is the reference category for religious affiliation.
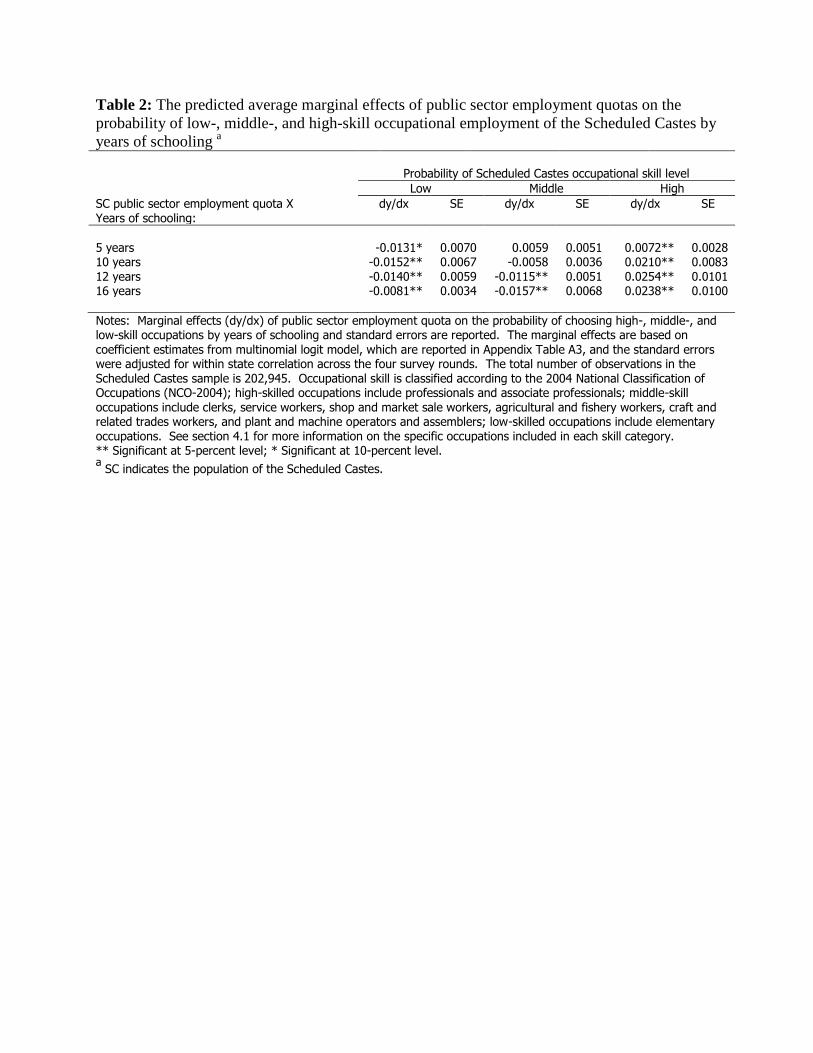
Table 2: The predicted average marginal effects of public sector employment quotas on the
probability of low-, middle-, and high-skill occupational employment of the Scheduled Castes by
years of schooling a
Probability of Scheduled Castes occupational skill level
Low Middle High
SC public sector employment quota X Years of schooling:
dy/dx SE dy/dx SE dy/dx SE
5 years -0.0131* 0.0070 0.0059 0.0051 0.0072** 0.0028 10 years -0.0152** 0.0067 -0.0058 0.0036 0.0210** 0.0083 12 years -0.0140** 0.0059 -0.0115** 0.0051 0.0254** 0.0101 16 years -0.0081** 0.0034 -0.0157** 0.0068 0.0238** 0.0100
Notes: Marginal effects (dy/dx) of public sector employment quota on the probability of choosing high-, middle-, and low-skill occupations by years of schooling and standard errors are reported. The marginal effects are based on
coefficient estimates from multinomial logit model, which are reported in Appendix Table A3, and the standard errors were adjusted for within state correlation across the four survey rounds. The total number of observations in the Scheduled Castes sample is 202,945. Occupational skill is classified according to the 2004 National Classification of Occupations (NCO-2004); high-skilled occupations include professionals and associate professionals; middle-skill occupations include clerks, service workers, shop and market sale workers, agricultural and fishery workers, craft and related trades workers, and plant and machine operators and assemblers; low-skilled occupations include elementary occupations. See section 4.1 for more information on the specific occupations included in each skill category. ** Significant at 5-percent level; * Significant at 10-percent level. a SC indicates the population of the Scheduled Castes.

Table 3: The predicted average marginal effects of public sector employment quotas and
characteristics of Scheduled Tribe individuals and states on the probability of low-, middle-, and
high-skill occupational employment a
Probability of Scheduled Tribes occupational skill level
Low Middle High
Explanatory variable dy/dx SE dy/dx SE dy/dx SE
ST public sector employment quota 0.0078 0.0190 -0.0044 0.0187 -0.0034** 0.0008 Years of schooling -0.0263** 0.0018 0.0207** 0.0018 0.0056** 0.0001 Age -0.0028** 0.0003 0.0023** 0.0003 0.0005** 0.0001 Male -0.0244 0.0178 0.0321* 0.0185 -0.0076** 0.0017 Married 0.0001 0.0118 0.0054 0.0113 -0.0055** 0.0013 Muslim religion b -0.0431 0.0451 0.0367 0.0456 0.0064 0.0057 Other religion b -0.1093** 0.0171 0.1034** 0.0156 0.0059** 0.0028 Urban sector 0.0071 0.0521 -0.0177 0.0511 0.0106** 0.0025 ST current year population share 0.0234 0.0242 -0.0267 0.0241 0.0033* 0.0019 ST census population share 0.0116 0.0364 -0.0019 0.0351 -0.0097** 0.0019 SC public sector employment quota -0.0231 0.0336 0.0291 0.0331 -0.0061** 0.0014 SC current year population share -0.0315** 0.0095 0.0310** 0.0093 0.0005 0.0009 SC previous Census date population share 0.0199 0.0156 -0.0176 0.0150 -0.0023** 0.0011 Total census population -0.0000 0.0000 0.0000 0.0000 -0.0000 0.0000 Population density 0.0009** 0.0003 -0.0008** 0.0003 -0.0001** 0.0000 Rural population share -0.0069 0.0108 0.0040 0.0108 0.0029** 0.0010 Public sector employees age 55-60 -0.0091* 0.0053 0.0089* 0.0052 0.0002 0.0003 Ln(state income per capita in previous year) 0.0027 0.0408 -0.0103 0.0403 0.0076** 0.0026
Notes: Marginal effects (dy/dx) of the explanatory variables on the probability of choosing high-, middle-, and low-skill occupations and standard errors are reported. The marginal effects are based on coefficient estimates from multinomial logit model, which are reported in Appendix Table A4, and the standard errors were adjusted for within state correlation across the four survey rounds. The total number of observations in the Scheduled Tribes sample is 110,295. Occupational skill is classified according to the 2004 National Classification of Occupations (NCO-2004); high-skilled occupations include professionals and associate professionals; middle-skill occupations include clerks, service workers, shop and market sale workers, agricultural and fishery workers, craft and related trades workers, and plant and machine operators and assemblers; low-skilled occupations include elementary occupations. See section 4.1 for more information on the specific occupations included in each skill category. ** Significant at 5-percent level; * Significant at 10-percent level. a SC and ST indicate the populations of the Scheduled Castes and Scheduled Tribes, respectively.
b Hinduism is the reference category for religious affiliation.

Table 4: The predicted average marginal effects of public sector employment quotas on the
probability of low-, middle-, and high-skill occupational employment of the Scheduled Tribes by
years of schooling a
Probability of Scheduled Tribes occupational skill level
Low Middle High
ST public sector employment quota X Years of schooling:
dy/dx SE dy/dx SE dy/dx SE
5 years 0.0106 0.0174 -0.0010 0.0166 -0.0096** 0.0021 10 years 0.0134 0.0118 0.0195* 0.0115 -0.0329** 0.0073 12 years 0.0129 0.0089 0.0291** 0.0103 -0.0420** 0.0094 16 years 0.0076** 0.0038 0.0317** 0.0087 -0.0394** 0.0098
Notes: Marginal effects (dy/dx) of public employment quota on the probability of choosing high-, middle-, and low-skill occupations by years of schooling and standard errors are reported. The marginal effects are based on
coefficient estimates from multinomial logit model, which are reported in Appendix Table A4, and the standard errors were adjusted for within state correlation across the four survey rounds. The total number of observations in the Scheduled Tribes sample is 110,295. Occupational skill is classified according to the 2004 National Classification of Occupations (NCO-2004); high-skilled occupations include professionals and associate professionals; middle-skill occupations include clerks, service workers, shop and market sale workers, agricultural and fishery workers, craft and related trades workers, and plant and machine operators and assemblers; low-skilled occupations include elementary occupations. See section 4.1 for more information on the specific occupations included in each skill category. ** Significant at 5-percent level; * Significant at 10-percent level. a ST indicates the population of the Scheduled Tribes.

Appendix Table - A1: Descriptive statistics of the Scheduled Castes population employed in high, middle, and low-skill occupations
and the state environment in India by year a
Year
1983 1988 1994 1999
Individual-level variables Mean SD Mean SD Mean SD Mean SD
Low-skill occupation (0-1) 0.60 0.57 0.59 0.55 Middle-skill occupation (0-1) 0.38 0.41 0.39 0.42 High-skill occupation (0-1) 0.02 0.02 0.02 0.03 Years of schooling (years) 0.26 1.36 0.40 1.69 2.05 3.60 2.55 4.19 Age (years) 35.76 12.15 35.67 12.25 36.05 12.06 36.46 12.09
Male (0-1) 0.71 0.84 0.73 0.72 Married (0-1) 0.90 0.88 0.88 0.87 Muslim religion (0-1) 0.01 0.01 0.01 0.01 Other religion (0-1) 0.05 0.06 0.04 0.08 Urban sector (0-1) 0.22 0.29 0.25 0.27 State-level variables SC public sector employment quota (%) 16.56 4.77 16.54 4.86 17.41 5.09 17.32 5.07 SC current year population share (%) 16.76 5.15 17.16 5.28 17.89 4.86 18.37 4.87 SC census population share (%) 16.60 5.17 16.59 5.35 17.60 4.88 17.49 4.95 ST public sector employment quota (%) 7.25 5.94 7.35 5.96 8.22 7.00 8.19 6.91 ST current year population share (%) 6.90 7.06 6.85 7.30 7.31 7.48 7.39 7.47 ST census population share (%) 6.90 7.04 6.82 7.23 7.29 7.44 7.35 7.37 Total census population (millions) 57.95 29.83 63.93 34.75 74.00 37.94 82.55 44.00 Population density (n) 316.83 162.32 311.81 159.91 390.18 190.92 379.26 185.09 Rural population share (%) 76.51 7.01 75.59 7.19 74.45 7.91 73.28 8.96 Public sector employees age 55-60 (%) 81.11 2.98 78.19 3.17 77.03 3.70 78.64 3.48 Income per capita in previous year (Rupees) 1,059.37 293.04 1,230.01 346.99 53,905.13 25,094.27 72,730.40 36,160.63 Number of observations 66,092 52,599 57,958 26,296
Notes: Sample means and standard deviations are reported. Fraction of the population employed in high, middle, and low-skill occupations may not sum to one due to rounding. Occupational skill is classified according to the 2004 National Classification of Occupations (NCO-2004); high-skilled occupations include professionals and associate professionals; middle-skill occupations include clerks, service workers, shop and market sale workers, agricultural and fishery workers, craft and related trades workers, and plant and machine operators and assemblers; low-skilled occupations include elementary occupations. See section 4.1 for more information on the specific occupations included in each skill category. State income adjusted for inflation using the CPI-Industrial Worker in 2001 rupees.
The states represented in our sample are Andhra Pradesh, Assam, Bihar, Gujarat, Haryana, Jammu-Kashmir, Karnataka, Kerala, Madhya Pradesh, Maharashtra, Orissa, Punjab, Rajasthan, Tamil Nadu, Uttar Pradesh and West Bengal. Sources: National Sample Survey round 38, 43, 50, and 55 for the year 1983, 1987-1988, 1993-1994, and 1999-2000, respectively. Employment quota data are obtained from the Scheduled Caste and Scheduled Tribe Annual Commissioner's Report (1951-2000); current population share and population density data are from the Census of India, Registrar General; state per capita income data are based on the domestic product of states of India prepared by the Economic and Political Weekly Research Foundation. a SC and ST indicate the populations of the Scheduled Castes and Scheduled Tribes, respectively.

Appendix Table – A2: Descriptive statistics of the Scheduled Tribes population employed in high, middle, and low-skill occupations
and the state environment in India by year a
Year
1983 1988 1994 1999
Individual-level variables Mean SD Mean SD Mean SD Mean SD
Low-skill occupation (0-1) 0.42 0.40 0.43 0.43 Middle-skill occupation (0-1) 0.57 0.58 0.55 0.54 High-skill occupation (0-1) 0.01 0.02 0.02 0.03 Years of schooling (years) 0.19 1.22 0.38 1.66 1.67 3.33 2.04 3.80 Age (years) 34.92 11.89 35.15 12.04 35.53 11.94 35.84 11.83
Male (0-1) 0.64 0.80 0.66 0.63 Married (0-1) 0.90 0.89 0.90 0.88 Muslim religion (0-1) 0.01 0.02 0.01 0.01 Other religion (0-1) 0.05 0.06 0.04 0.08 Urban sector (0-1) 0.11 0.16 0.11 0.13 State-level variables SC public sector employment quota (%) 14.26 4.02 14.24 3.94 14.02 4.19 13.85 4.14 SC current year population share (%) 13.33 4.32 13.92 4.09 14.68 3.99 15.23 4.00 SC census population share (%) 13.13 4.39 13.26 4.33 14.30 4.02 14.10 3.99 ST public sector employment quota (%) 12.43 6.36 12.53 6.25 14.45 7.31 13.69 7.19 ST current year population share (%) 14.03 7.39 13.96 7.58 14.59 7.43 14.00 7.34 ST census population share (%) 14.00 7.37 13.85 7.51 14.52 7.40 13.81 7.25 Total census population (millions) 50.94 18.12 57.49 22.41 61.14 23.06 67.82 26.65 Population density (n) 221.01 135.53 226.53 136.74 260.62 157.25 265.23 154.16 Rural population share (%) 77.63 8.05 77.40 8.32 75.63 8.70 74.50 9.51 Public sector employees age 55-60 (%) 81.05 3.64 78.05 3.62 76.00 5.12 76.83 4.59 Income per capita in previous year (Rupees) 1,008.14 251.93 1,135.16 274.31 46,953.38 27,578.13 65,145.13 41,649.48 Number of observations 36,873 28,707 30,024 14,691
Notes: Sample means and standard deviations are reported. Fraction of the population employed in high, middle, and low-skill occupations may not sum to one due to rounding. Occupational skill is classified according to the 2004 National Classification of Occupations (NCO-2004); high-skilled occupations include professionals and associate professionals; middle-skill occupations include clerks, service workers, shop and market sale workers, agricultural and fishery workers, craft and related trades workers, and plant and machine operators and assemblers; low-skilled occupations include elementary occupations. See section 4.1 for more information on the specific occupations included in each skill category. State income adjusted for inflation using the CPI-Industrial Worker in 2001 rupees.
The states represented in our sample are Andhra Pradesh, Assam, Bihar, Gujarat, Haryana, Jammu-Kashmir, Karnataka, Kerala, Madhya Pradesh, Maharashtra, Orissa, Punjab, Rajasthan, Tamil Nadu, Uttar Pradesh and West Bengal. Sources: National Sample Survey round 38, 43, 50, and 55 for the year 1983, 1987-1988, 1993-1994, and 1999-2000, respectively. Employment quota data are obtained from the Scheduled Caste and Scheduled Tribe Annual Commissioner's Report (1951-2000); current population share and population density data are from the Census of India, Registrar General; state per capita income data are based on the domestic product of states of India prepared by the Economic and Political Weekly Research Foundation. a SC and ST indicate the populations of the Scheduled Castes and Scheduled Tribes, respectively.

Appendix Table – A3: Multinomial logit estimates of the probability the Scheduled Castes
choosing low- and high-skill level occupations relative to the probability of choosing middle-
skill level occupations a,b
Dependent variable
Log(PLow/PMiddle) Log(PHigh/PMiddle)
Explanatory variable Coefficient SE Coefficient SE
SC public sector employment quota -0.0399 0.0304 0.1477** 0.0612 SC public sector employment quota X Years of schooling -0.0009 0.0015 -0.0026 0.0025 Years of schooling -0.1101** 0.0220 0.3476** 0.0426 Age 0.0153* 0.0089 0.1539** 0.0207 Age-squared -0.0004** 0.0001 -0.0017** 0.0003 Male -0.3429** 0.0628 -0.7815** 0.1339
Married 0.1688** 0.0587 -0.1781** 0.0894 Muslim religion c -0.5388** 0.1479 0.7060** 0.3497 Other religion c 0.0800 0.0972 0.2406* 0.1333 Urban sector -0.4440** 0.1314 0.3554** 0.0889 SC current year population share -0.0047 0.0307 -0.1417** 0.0498 SC census population share 0.0308 0.0471 0.1773** 0.0841 ST public sector employment quota -0.0048 0.0254 0.0851* 0.0465 ST current year population share 0.1713 0.1073 -0.1333 0.1748 ST census population share -0.0107 0.1307 0.2727 0.2752 Total census population 0.0000** 0.0000 -0.0000 0.0000 Population density 0.0004 0.0009 0.0024 0.0016 Rural population share -0.0382** 0.0166 0.0671* 0.0391 Public sector employees age 55-60 -0.0222** 0.0096 -0.0203 0.0216 Ln(state income per capita in previous year) -0.1369** 0.0419 0.1080 0.1085 Constant 5.2252** 1.8649 -14.0247** 4.1481 Maximized log-likelihood function -139666.61 State fixed effects Yes Time fixed effects Yes Number of observations 202,945
Notes: Coefficients and standard errors are reported. The standard errors were adjusted for within state correlation across the four survey rounds. Occupational skill is classified according to the 2004 National Classification of Occupations (NCO-2004); high-skilled occupations include professionals and associate professionals; middle-skill occupations include clerks, service workers, shop and market sale workers, agricultural and fishery workers, craft and related trades workers, and plant and machine operators and assemblers; low-skilled occupations include elementary occupations. See section 4.1 for more information on the specific occupations included in each skill category. ** Significant at 5-percent level; * Significant at 10-percent level. a SC and ST indicate the populations of the Scheduled Castes and Scheduled Tribes, respectively.
b The probability of choosing low-, middle, and high-skill level occupations is denoted by PLow PMiddle and PHigh
respectively. c Hinduism is the reference category for religious affiliation

Appendix Table – A4: Multinomial logit estimates of the probability the Scheduled Tribes
choosing low- and high-skill level occupations relative to the probability of choosing middle-
skill level occupations a,b
Dependent variable
Log(PLow/PMiddle) Log(PHigh/PMiddle)
Explanatory variable Coefficient SE Coefficient SE
ST public sector employment quota 0.0291 0.0853 -0.2338** 0.0517 ST public sector employment quota X Years of schooling 0.0020 0.0013 0.0030** 0.0015 Years of schooling -0.1375** 0.0199 0.3019** 0.0217 Age 0.0312** 0.0063 0.1499** 0.0212 Age-squared -0.0006** 0.0001 -0.0017** 0.0002 Male -0.1207 0.0811 -0.5476** 0.1302
Married -0.0072 0.0526 -0.3667** 0.0855 Muslim religion c -0.1857 0.2039 0.3695 0.3897 Other religion c -0.4849** 0.0749 0.2445 0.1769 Urban sector 0.0468 0.2339 0.7197** 0.1566 ST current year population share 0.1102 0.1090 0.2530** 0.1262 ST census population share 0.0389 0.1626 -0.6374** 0.0926 SC public sector employment quota -0.1126 0.1508 -0.4386** 0.0823 SC current year population share -0.1415** 0.0425 -0.0094 0.0562 SC census population share 0.0868 0.0698 -0.1271* 0.0659 Total census population -0.0000 0.0000 -0.0000 0.0000 Population density 0.0040** 0.0015 -0.0051** 0.0020 Rural population share -0.0272 0.0487 0.1868** 0.0704 Public sector employees age 55-60 -0.0408* 0.0239 0.0011 0.0192 Ln(state income per capita in previous year) 0.0229 0.1833 0.5138** 0.1717 Constant 5.8166 5.9063 -11.4080* 6.2336 Maximized log-likelihood function -76719.97 State fixed effects Yes Time fixed effects Yes Number of observations 110,295
Notes: Coefficients and standard errors are reported. The standard errors were adjusted for within state correlation across the four survey rounds. Occupational skill is classified according to the 2004 National Classification of Occupations (NCO-2004); high-skilled occupations include professionals and associate professionals; middle-skill occupations include clerks, service workers, shop and market sale workers, agricultural and fishery workers, craft and related trades workers, and plant and machine operators and assemblers; low-skilled occupations include elementary occupations. See section 4.1 for more information on the specific occupations included in each skill category. ** Significant at 5-percent level; * Significant at 10-percent level. a SC and ST indicate the populations of the Scheduled Castes and Scheduled Tribes, respectively.
b The probability of choosing low-, middle, and high-skill level occupations is denoted by PLow PMiddle and PHigh
respectively. c Hinduism is the reference category for religious affiliation.