dlp-based projected fringe measuring technology
TRANSCRIPT

Quality Digest Magazine 1 of 10
http://qualitydigest.com/IQedit/CMSCarticle_news.lasso?articleid=12760 5/27/08 10:58 PM
DLP-Based Projected Fringe Measuring TechnologyThis technology eases the burden of optical 3-D digitization and coordinate measurement of parts.
by M. Kaestner, G. Frankowski, J. Seewig, B. Crowell, J. Chambers, and B. Ervin
Coordinate measuring machines (CMMs) are a basic requirement for any industrialmanufacturing facility conforming to the specifications of drawings and standards. Accuracy needs to be observed, verified, and certified with respect to a comprehensiveset of standardization rules. Highly precise CMMs have costly requirements such asvibration isolation, environmental temperature stabilization, and a long measurementtime. An ideal CMM would function without these drawbacks so that the samemeasuring performance could be taken directly to the production line and used bymanufacturing personnel. These shortcomings don’t have any foreseeable solutions inthe near future. However, there's economic motivation to demand an easy-to-use CMMwithout the requirements of environment control and long measurement times for theacquisition of accurate 3-D data. CAD-based manufacturing takes its measures andtolerances from CAD data. A 3-D measuring device that could, within a few minutes,provide several million measuring points and compare that data to CAD data as anominal/actual value comparison by manufacturing personnel on site would meet thedemands of industry.
Fringe projection technology, with its precision and flexibility in applications, can meetthe idealized requirements of industrial manufacturing. This technology has establisheditself as fast industrial 3-D measurement method in recent years. Advanced 3-Dmeasurement software is capable of comparing CAD data to measurement data as well
as fast nominal/actual data comparison in 3-D space. These 3-D measurement comparisons clearly indicate deviations between nominaland actual measurements.
Fringe projection as an optical 3-D measurement technique Fringe projection as an optical measurement technique combines the advantages of triangulation techniques and the real-timeinterferometry. With these two techniques, large objects with rough surfaces can be quickly and accurately measured. This is possiblebecause the fringe projection works by projecting a sequence of equidistant fringe projection patterns with a nearly cos²-shaped intensitydistribution on the scanned surface as compared to the triangulation technique, which projects a single point of light or a light-section. Twocameras, angled to the direction of the projection, observe these fringe projection patterns. Figure 1 shows the functional basics of such afringe projection measurement setup. The 3-D measurements result from the deflection of the projected parallel fringe pattern on the curvedsurface as inspected by the two cameras due to triangulation. The projected fringe patterns are, as mentioned before, nearly cos²-shaped,and thus they can be perceived as interferograms; they can be evaluated by algorithms for phase analysis, just as they are used forreal-time interferometry techniques. This phase measuring fringe projection technique enables a much higher resolution of the profile andaccuracy of the measurement. Fringe projection also allows 3-D measurements without moving the target object or the sensor, asconventional triangulation measurement techniques would require.

Quality Digest Magazine 2 of 10
http://qualitydigest.com/IQedit/CMSCarticle_news.lasso?articleid=12760 5/27/08 10:58 PM
Figure 1: Principle of a fringe projection setup including two cameras and a projector
A fast projection of the fringe pattern is essential for a precise measurement and a good use of the fringe projection, which requires anintensity distribution as much like the distribution of wave-optically generated interferograms as possible. Both of these requirements aresupported by the use of micro-mirror displays, as developed using DLP technology by Texas Instruments, and globally used for lightprojection in diverse applications³. Texas Instrument’s micro-mirror projectors facilitate high contrast and strong light, and they featureseparately and digitally controlled mirrors with a maximum size of 1024 x 768 pixels. This makes it possible to measure black as well aspartially reflective surfaces such as tools of precision forged gearwheels, as shown in the following examples of use.
The subject of evaluation when employing the fringe projection technique is the registration and evaluation of the fringe patterns and theirdistribution, which result from the position of the cameras and the intersection of the fringes, projected in parallels, and the curved surface.These fringe patterns represent a direct 3-D image of the surface, and the degree of deflection and the density of the fringe distributionrespectively allow for a qualitative evaluation of the surface shape of the measurement object.
Fringe projection-based coordinate measurement technique CMMs in the industrial production are an indispensable tool for quality assurance of the produced parts, which conforms to the givenstandards. Tactile CMMs are now common and are mainly used in special measuring laboratories. Optical and tactile systems arecombined to form so called multisensor CMMs. They're either equipped with point- and/or line-based laser scanning systems or autofocussensors.
Within a few seconds, fringe projection CMMs supply plane 3-D datasets with up to several million single-measurement points. The part tobe measured can be scanned from several directions, with each scan resulting in a so-called single view. These single views are mergedusing software to obtain a complete 3-D dataset of the measured part. This 3-D dataset can be used for a 3-D measurement as well as aCAD-based nominal/actual value comparison using the appropriate measuring and evaluation software.
Optical 3-D coordinate measurement machine An optical measurement machine is a fringe projection-based CMM, which, as seen in figure 1, has a projector and two sideward-orientedCCD cameras. The photograph at the top of this article shows the design of the TopoCAM measurement machine. The standard version ofthis measurement machine carries at least three CNC linear axes, which can move the 3-D sensor and/or the measured part in the x, y, andz directions. If required, it's possible to install a measuring panning or rotation axis in addition to the linear axis. The part to be measured isplaced in a simple and normally universal adapter. At the push of a button a specific measurement program starts, which controls themeasurement, the necessary movements of the axis, and the assembly of the single scatter plots or single views to form a complete 3-Dscatter plot. The result of the measurement will include a 3-D dataset and a complete solid of the measured part respectively, and if need beit will directly, without manual intervention, conduct a comparison with the related CAD model.
The time requirement for the measurement of more than two million measurement points and the output of the measurement and the testresult based on the mentioned nominal/actual value comparison adds up to less than one minute. Due to the robustness of themeasurement system and its simple handling, these measurements can be conducted on site during the production process and directly bythe production personnel. There's no need for special knowledge about measurement techniques, in particular regarding the handling ofoptical 3-D measurement systems. The required accuracy of the measurement can be adjusted according to the current constructivenecessities. Basically the relation of the accuracy of the optical measurement system and the component tolerance at hand is 1/10.

Quality Digest Magazine 3 of 10
http://qualitydigest.com/IQedit/CMSCarticle_news.lasso?articleid=12760 5/27/08 10:58 PM
SoftwareIn many cases, and especially when dealing with dimension controls in industrial production, a nominal/actual value comparison of the 3-Ddataset, or the solid and the related CAD dataset, or a master dataset, might be sufficient for a “good/bad” evaluation of a produced part.Figure 2 gives an example of such a contour control of a turbine vane, showing a so-called differential image of the measured turbine vaneand its CAD model. The colors indicate the extent of the form deviation, which can also be numerically displayed in a table.
Figure 2: CAD-based nominal/actual value comparison of a turbine vane
On the one hand, the comparison of the CAD dataset and the optically measured 3-D dataset as shown in figure 2 isn’t sufficient for acomplex 3-D coordinate measurement as usually conducted when using common CMMs. On the other hand, the currently available softwarepackages, for example, the Calypso package which is distributed by Carl Zeiss, aren't designed for the need of optical 3-D measurementtechniques and aren't able to cope with the efficient evaluation of 3-D datasets containing several millions of single measurement points.
The numerical evaluation of scanned contours or surfaces is basically limited to regular geometric characteristics such as cylinders, planes,straight lines, spheres, and circles. However, modern production techniques more and more support creative design, which is no longerbound to regular shapes.
To process 3-D datasets containing several millions of measurement points for the purpose of the 3-D coordinate measurement technique,the GFM developed the software package TopoXenios, which supports the recording of the measurement as well as the extensiveevaluation, including:
The determination of the alignment of the measurement datasets using standard geometriesThe generation of measurement and combination strategies using color code and text visualizationThe registration of all measurement features in a tree structureThe calculation and combination of all standardized and free geometries as well as contour, position, and alignment of the toolSetting defined 2-D traces in local coordinates of the measurement dataset and interactive dimensioningGenerating graphical and numerical measurement protocols as well as protocols containing all testing characteristics, labels,tolerances, and deviations.
At the same time, TopoXenios enables the automation of the complete measurement routine, from the measurement data acquisition tothe evaluation and, if necessary, a CAD-based actual/nominal value comparison; this is of high importance for the use in production and inproduction-related areas, respectively.
Calibration and accuracy of measurement

Quality Digest Magazine 4 of 10
http://qualitydigest.com/IQedit/CMSCarticle_news.lasso?articleid=12760 5/27/08 10:58 PM
When calibrating the measurement volume of a fringe projection CMM, a specially designed calibration strategy and specifically certifiedcalibration probes for the x and y planes, as well as for the z direction are used. In addition to the calibration of the measurement volume,it's necessary to adjust to existing deviations of the optical projection and recording equipment and to state these corrections of theevaluation program in a so-called correction matrix5.
The certification of a proper calibration state of the fringe projection CMM is conducted in accordance with the VDI/VDE guideline 2634,which was developed especially for planar optical CMMs¹. Afterwards, as shown in figure 3, a barbell-formed specimen is placed on definedmeasurement positions of the sensor’s measurement volume and each distance to the sphere of the barbell is determined. The size of thebarbell respective of the diameter of the sphere depends on the underlying measurement volume of the sensor and is defined in the citedguideline.
Figure 3: Control of the calibration state of a planar optical CMMaccording to VDI/VDE 26341
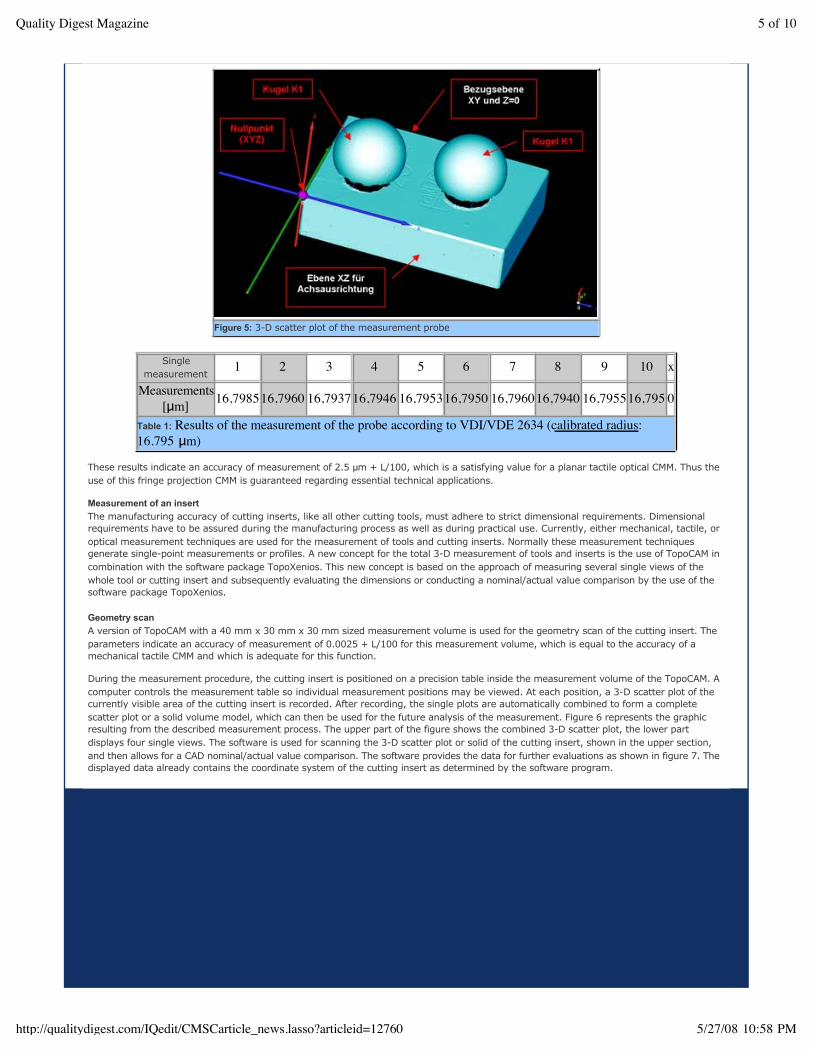
Figure 4 shows the barbell according to VDI/VDE 2634 for the TopoCAM measurement volume of the size 40 mm x 30 mm x 30 mm, as it'sused for certifying the proper calibration state for this kind of measurement machine. Figure 5 displays a barbell composed from six singleviews. Table 1 summarizes the results of ten single measurements of the barbell on the measurement volume.
Figure 4: Measurement probe according to the standard VDI/VDE-26341
Quality Digest Magazine 5 of 10
http://qualitydigest.com/IQedit/CMSCarticle_news.lasso?articleid=12760 5/27/08 10:58 PM
Figure 5: 3-D scatter plot of the measurement probe
Singlemeasurement
1 2 3 4 5 6 7 8 9 10 x
Measurements[μm] 16,798516,7960 16,793716,7946 16,795316,7950 16,796016,7940 16,795516,795 0
Table 1: Results of the measurement of the probe according to VDI/VDE 2634 (calibrated radius:16.795 μm)
These results indicate an accuracy of measurement of 2.5 μm + L/100, which is a satisfying value for a planar tactile optical CMM. Thus theuse of this fringe projection CMM is guaranteed regarding essential technical applications.
Measurement of an insert The manufacturing accuracy of cutting inserts, like all other cutting tools, must adhere to strict dimensional requirements. Dimensionalrequirements have to be assured during the manufacturing process as well as during practical use. Currently, either mechanical, tactile, oroptical measurement techniques are used for the measurement of tools and cutting inserts. Normally these measurement techniquesgenerate single-point measurements or profiles. A new concept for the total 3-D measurement of tools and inserts is the use of TopoCAM incombination with the software package TopoXenios. This new concept is based on the approach of measuring several single views of thewhole tool or cutting insert and subsequently evaluating the dimensions or conducting a nominal/actual value comparison by the use of thesoftware package TopoXenios. Geometry scanA version of TopoCAM with a 40 mm x 30 mm x 30 mm sized measurement volume is used for the geometry scan of the cutting insert. Theparameters indicate an accuracy of measurement of 0.0025 + L/100 for this measurement volume, which is equal to the accuracy of amechanical tactile CMM and which is adequate for this function.
During the measurement procedure, the cutting insert is positioned on a precision table inside the measurement volume of the TopoCAM. Acomputer controls the measurement table so individual measurement positions may be viewed. At each position, a 3-D scatter plot of thecurrently visible area of the cutting insert is recorded. After recording, the single plots are automatically combined to form a completescatter plot or a solid volume model, which can then be used for the future analysis of the measurement. Figure 6 represents the graphicresulting from the described measurement process. The upper part of the figure shows the combined 3-D scatter plot, the lower partdisplays four single views. The software is used for scanning the 3-D scatter plot or solid of the cutting insert, shown in the upper section,and then allows for a CAD nominal/actual value comparison. The software provides the data for further evaluations as shown in figure 7. Thedisplayed data already contains the coordinate system of the cutting insert as determined by the software program.

Quality Digest Magazine 6 of 10
http://qualitydigest.com/IQedit/CMSCarticle_news.lasso?articleid=12760 5/27/08 10:58 PM
Figure 6: 3-D measurement data scan (3D-Messdatenaufnahme) of a cutting insert using TopoCAM
Figure 7: Optically measured 3-D data of an insert
EvaluationThe metrological evaluation of the measured cutting insert, as seen in figure 7, can be supported by several tools of the TopoXenios softwarepackage. These tools either assist in the measurement, allow the direct dimensioning of the 3-D scatter plot, or the dimensioning of definedsection planes, which can then be extracted in form of graph lines and can be used for measuring the graph. This procedure is displayed infigure 8 and figure 9. The section plane, as seen in figure 8, refers to a given plane. The section plane is then redisplayed as a single planewith dimensions, which are generated using the dimensioning tool, as seen in figure 9. In this way, the dimensions of measured 3-D profilesof a tool or a cutting insert can be determined and numerous single planar sketches can be generated.

Quality Digest Magazine 7 of 10
http://qualitydigest.com/IQedit/CMSCarticle_news.lasso?articleid=12760 5/27/08 10:58 PM
Figure 8: Selection of section planes for dimensioning
Figure 9: Dimensioning the extracted section
As the optical 3-D measurement machine generates a complete 3-D scatter plot or a solid of the cutting insert, it lends itself to directlymeasure the 3-D scatter plot and thus conduct a 3-D evaluation. Figure 10 represents this new possibility for a 3-D evaluation on themeasured cutting insert as it's made possible by the software. Compared to the common 3-D coordinate measurement techniques, whichsupport this evaluation method in a similar way, the fringe projection optical 3-D coordinate measurement technique makes it possible torecord several hundred measurement points and several million measurement points. Thus, the measurement accuracy as well as themeasurement possibilities significantly increase and at the same time make the measurement easier to handle.

Quality Digest Magazine 8 of 10
http://qualitydigest.com/IQedit/CMSCarticle_news.lasso?articleid=12760 5/27/08 10:58 PM
Figure 10: 3-D dimensioning of the measured solid of an insert
Gearwheel measurements For a fast and areal acquisition of the whole geometry of the gearing of precision-forged gear-wheels, comprehensive measurement andevaluation strategies where developed on the basis of the fringe projection technique. As a result of the optical and areal measurements, ananalysis of the whole gearwheel geometry is made possible for the first time. In addition, the measuring time is reduced dramatically,compared to conventional tactile gearwheel measurements.
To reliably control a process chain for the manufacturing of precision-forged high-performance gearwheels, a production-related inspection ofthe intermediates before the hard finishing is essential. The analysis of the geometric data provides information about the characteristics ofthe deviations and supplies the actual data for process control. In this way, it’s possible to detect wear of the forming die or geometricerrors caused by the heat treatment. To eliminate the cause of these systematic deviations, adapted process parameters can be passed onto the corresponding subprocesses.
Data acquisitionDue to the geometric properties of the gearing and the use of preferably small measuring fields5, the acquisition of the work piece geometryis carried out with respect to the pitch angle. A number of datasets were acquired, according to the number of teeth, where the gearwheelis rotated about the pitch angle between two acquisitions. By this approach many parts of the geometry are recorded redundantly6. Hence, areas with high slope, which cause large measuring inaccuracies, can be eliminated from the single measurements, because theneighboring images contain these areas under better optical conditions. Through this technique, it's possible to optimize the amount of dataand the measuring time.
The recombination of the complete geometry is carried out only by means of geometric transformations of the measuring points. Neithercomplex matching operations nor registration processes are accomplished. This approach demands a most accurate determination of therotating axis, which lies outside of the measuring volume. The rotating axis is determined by measurements on a reference cylinder, whosediameter equals the pitch circle diameter of the measured gearwheel7. The rotating axis is used as the preliminary gearing axis.
Figure 11 demonstrates the recombination of the complete geometry. After the processing of the raw data, the number of measuring pointsis reduced to approximately 2.1 x 10⁵ per single measurement. The complete geometry of the gearing (approx. 8 x 10⁶ points) is recombined through rotation and translation of the single datasets, with respect to a preliminary work piece coordinate system, which isoriented on the rotating axis.

Quality Digest Magazine 9 of 10
http://qualitydigest.com/IQedit/CMSCarticle_news.lasso?articleid=12760 5/27/08 10:58 PM
Figure 11: Recombination of the complete geometry from single measurements
Evaluation of the gearing deviationsOf particular interest in the testing of the precision forged gearwheels is a quick visual assessment of the functional surfaces. First, thefunctional surfaces are extracted from the measuring datasets and fitted on a reference involute. Then, the deviations of the measuringpoints are calculated orthogonally to the reference. The color-coded results of the optical measurements can be presented very clearly on a3-D model of the tested gearwheel, which can be freely moved and turned in all dimensions.
This kind of illustration allows for a first qualitative evaluation of the gearing deviations. In addition, it's possible to acquire informationabout the tooth width and pitch deviations indirectly by evaluation of the absolute deviations.
Figure 12: Illustration of the deviations on the tooth flanks on a geometric model of the tested gearwheel
A quantitative analysis of the geometric errors, aiming at an objective evaluation, a determination of tolerances and the analysis ofmanufacturing errors, can be carried out by means of areal parameters, which are partially based on conventional line based gearwheel
parameters7. As an example, figure 13 shows the definition of the areal parameter FΣ, the total deviation at the gearwheel flank. Thecharacterization of the geometric data using areal parameters supplies information about the characteristics of the deviations and suppliesthe actual data for process control.

Quality Digest Magazine 10 of 10
http://qualitydigest.com/IQedit/CMSCarticle_news.lasso?articleid=12760 5/27/08 10:58 PM
Figure 13: Definition of the areal parameter FΣ, the total deviation at the gearwheel flank.
SummaryThis article introduces the basics and the metrological application of a novel method for optical 3-D measurements. The method is based onthe phase measuring digital fringe projection technique. As previously shown, it is possible to construct measurement machines thatimplement the fringe projection measurement technique. These optical 3-D CMMs, when equipped with the appropriate measurementvolume, provide a measurement accuracy comparable to conventional mechanical tactile measurement machines. This novel type ofmeasuring machine offers the specific advantage of measuring several million measurement points on a tool, component, or cutting insertwithin a very short time period. The large amount of measurement points allows excellent detection of details on the profile of the part.Furthermore, it was shown that the use of the software package TopoXenios enables the processing of these measured 3-D datasets thatcontain several million single measurement points. Thus, it's possible to extract standardized geometries from the measured 3-D datasetbased on form, dimension, and position. CAD-based nominal/actual value comparisons of the measured tool or component can be conductedas well. The given examples of use, measuring and evaluating a cutting insert and a precision forged gearwheel demonstrate just two of themany applications of this innovative measurement technique. References1VDI/VDE-Guideline: “Optical 3-D measuring systems—Optical systems based on area scanning,” VDI/VDE-2634, 2003.
2Frankowski, G., “Optische 3-D-Messtechnik für Forschung und Produktion mit digitaler Mikro-Mikrospiegelspiegel-Streifenprojektion,”Internationales Kooperationssymposium “Qualitätssicherung durch Meßtechnik und Bildverarbeitung,” Steyr/Österreich, September 28 and29, 1999.
3Hornbeck, L.J., “Digital Light Processing and MEMS: Timely Convergence for Bright Future,” Micromachining and Micro Fabrication ´95,Austin, Texas, 1995.
4Frankowski, G.; et al., “Real-time 3-D Shape Measurement with Digital Stripe Projection by Texas Instruments Micro mirror DevicesDMD,” SPIE-Proc., 3958, pp. 90-105, 2000.
5Koch, A.; Ruprecht, M.; Toedtler, O., and Haeusler, G., “Optische Messtechnik an technischen Oberflächen,” Expert Verlag, 1998.
6Kaestner, M.; Meeß, K.; Seewig, J.; Reithmeier, E., “Optische Geometrieerfassung von Zahnrädern,” Verzahnungsmesstechnik,Stuttgart, June 14 and 15, 2005.
7Meeß, K., “Flächenhafte Messung optisch kooperativer Stirnräder am Beispiel präzisionsgeschmiedeter Verzahnungen,” Dissertation,Universität Hannover, 2005.
Return to CMSC WORLD newsletter
Go to CMSC.ORG