diversity and abundance of neustonic zooplankton in the
TRANSCRIPT

NOAA Technical Memorandum NMFS-AFSC-70
U.S. DEPARTMENT OF COMMERCENational Oceanic and Atmospheric Administration
National Marine Fisheries ServiceAlaska Fisheries Science Center
February 1997
Diversity and Abundance ofNeustonic Zooplankton in theNorth Pacific Subarctic Frontal Zone
byB. D. Ebberts and B. L. Wing
NOAA Technical Memorandum NMFS
The National Marine Fisheries Service's Alaska Fisheries Science Centeruses the NOAA Technical Memorandum series to issue informal scientific andtechnical publications when complete formal review and editorial processingare not appropriate or feasible. Documents within this series reflect soundprofessional work and may be referenced in the formal scientific and technicalliterature.
The NMFS-AFSC Technical Memorandum series of the Alaska FisheriesScience Center continues the NMFS-F/NWC series established in 1970 by theNorthwest Fisheries Center. The new NMFS-NWFSC series will be used bythe Northwest Fisheries Science Center.
This document should be cited as follows:
Ebberts, B. D., and B. L. Wing. 1997. Diversity and abundance of neustonic zooplankton in the North Pacific Subarctic Frontal Zone. U.S. Dep. Commer., NOAA Tech. Memo. NMFS-AFSC-70, 34 p.
Reference in this document to trade names does not imply endorsement bythe National Marine Fisheries Service, NOAA.
February 1997
NOAA Technical Memorandum NMFS-AFSC-70
Diversity and Abundance ofNeustonic Zooplankton in the
North Pacific Subarctic Frontal Zone
U.S. DEPARTMENT OF COMMERCEWilliam M. Daley, Secretary
National Oceanic and Atmospheric AdministrationD. James Baker, Under Secretary and Administrator
National Marine Fisheries ServiceRolland A. Schmitten, Assistant Administrator for Fisheries
byB. D. Ebberts and B. L. Wing
U.S. Army Corps of EngineersCENPP-PE-RRF
333 S.W. First AvenuePortland, OR 97208
Auke Bay LaboratoryAlaska Fisheries Science Center
11305 Glacier HighwayJuneau AK 99801-8626
21
1
2
This document is available to the public through:
National Technical Information ServiceU.S. Department of Commerce5285 Port Royal RoadSpringfield, VA 22161

Notice to Users of this Document
This document is being made available in .PDF format for the convenience of users; however, the accuracy and correctness of the document can only be certified as was presented in the original hard copy format.

i i i
ABSTRACT
Neustonic zooplankton were collected at 42 stations between latitude 31°N and
47°N during research on the biogeography of the North Pacific Subarctic Frontal Zone.
Sea surface temperatures at the stations during the 4 October-9 November 1989 research
period ranged from 9.7 at the northernmost station to 24.1°C at the southernmost station.
Distribution of nine phyla (134 taxa) was characterized by low abundance and high species
diversity in the southerly latitudes (warm waters), and high abundance with low species
diversity in the northerly latitudes (cool waters). Highest abundance was about 1 degree
north of the area separating subarctic and subtropical waters (43°30'N) in the North Pacific
Subarctic Frontal Zone. Arthropods (77 taxa) were the most abundant and most frequently
collected zooplankton group. Molluscs (19 taxa) were the second most frequently
collected group. This study indicates that because zooplankton distribution and abundance
may be affected by frontal zones, neuston distribution and diversity may be used as
indicators of various North Pacific Ocean water masses.

V
CONTENTS
INTRODUCTION . . . . . . . . . . . . . . . . . . . . . . . . . . . . . . . . . . . . . . . . . . . 1
METHODS . . . . . . . . . . . . . . . . . 2
RESULTS AND DISCUSSION . . . . . . . . . . . . . . . . . . . . . . . . . . . . . . . . . . . . . 4Diversity and Abundance . . . . . . . . . . . . . . . . . . . . . . . . . . . . . . . . . . . . . . 5
Zooplankton Diversity . . . . . . . . . . . . . . . . . . . . . . . . . . . . . . . . . . 6Zooplankton Abundance . . . . . . . . . . . . . . . . . . . . . . . . . . . . . . . . 8
SYNOPSIS. . . . . . . . . . . . . . . . . . . . . . . . . . . . . . . . . . . . . . . . . . . . . . . . 11
ACKNOWLEDGMENTS . . . . . . . . . . . . . . . . . . . . . . . . . . . . . . . . . . . . . . 12
CITATIONS . . . . . . . . . . . . . . . . . . . . . . . . . . . . . . . . . . . . . . . . . . . . . . . . . . . 13
TABLES . . . . . . . . . . . . . . . . . . . . . . . . . . . . . . . . . . . . . . . . . . . . . . . . . . . . . 19
FIGURES . . . . . . . . . . . . . . . . . . . . . . . . . . . . . . . . . . . . . . . . . . . . . . . . . . . . 29

I N T R O D U C T I O N
The Driftnet Impact Monitoring, Assessment, and Control Act of 1987 required the
U.S. Government to negotiate with foreign governments conducting North Pacific driftnet
fisheries to assess the number of commercial and non-commercial fisheries resources
impacted by the driftnet fisheries. Although a primary target of these fisheries was the
flying squid, Ommastrephes bartrami, driftnets also captured non-target species including
salmonids, sharks, other fish, seabirds, and mammals (INPFC 1990). Much of this fishery
was concentrated in the North Pacific Transition Region or Subarctic Frontal Zone.
Because of the large ‘area covered by the driftnet fisheries in the North Pacific Ocean, the
impact on non-target species was believed to be substantial (Wetherall 1991). This
potential impact prompted U.S. scientists to examine the biological and physical aspects of
the North Pacific Subarctic Frontal Zone (NPSFZ) to better understand factors influencing
the distribution and co-occurrence of target and non-target species.
Oceanic neuston were sampled during a multidisciplinary study of the
biogeography of the NPSFZ conducted during fall 1989 by elements of the National
Marine Fisheries Service (Auke Bay Laboratory, Alaska Fisheries Science Center [AFSC];
Honolulu Laboratory, Southwest Fisheries Science Center; and National Marine Mammal
Laboratory, AFSC) and the U.S. Fish and Wildlife Service. The neuston layer is a unique
habitat with obligate and facultative residents (Zaitsev 1970; Hempel and Weikert 1972;
Cheng 1975; Peres 1982). Some components of this assemblage may indicate changes in
the physical oceanography of a region (Soule and Kleppel 1988). Assemblages may also
reflect changes in biological and physical factors that influence the distribution of marine
resources (Russell 1939; Aron 1962; Fager and McGowan 1963). Neuston are important

2
food for seabirds, juvenile salmonids, and other fishes (Peterson et al. 1982; Turner 1984;
Prince and Morgan 1987; Schreiber and Clapp 1987; Brodeur 1989), and prey availability
is a major factor influencing the distribution of marine resources. Thus, changes in the
neustonic zone provide an important “first look” into the physical and biological factors
that affect marine fish, seabirds, and mammals.
This report presents the results of neuston sampling from the NOAA ship Miller
Freeman during the 1989 survey. The primary objective was to evaluate changes in
neuston relative to physical oceanographic variables and marine resources (birds, fish, and
mammals) within the NPSFZ. Our report complements other results of the survey,
including subsurface zooplankton, nekton, hydroacoustic backscattering, seabirds,
mammals, and physical oceanographic data. Results of those studies will be published
separately.
METHODS
Neuston samples were collected at 42 stations from 4 October to 9 November
1989. All but two stations were between lat. 37°N and 47°N and along five north-south
transects: long. 155°W, 158°W, 161°W, 168°W, and 171°W (Fig. 1). Samples were
collected using a rectangular 50 cm x 30 cm Sameoto neuston net (Sameoto and
Jaroszynski 1969), mesh size 0.505 mm, towed for 10 minutes at 7.4 km/h (weather
dependent). After retrieval, the net was thoroughly washed down to collect specimens;
catches were preserved in a 4% formaldehyde-seawater solution buffered with sodium
tetraborate and were later processed at the Auke Bay Laboratory.
3
Processing of samples consisted of scanning, subsampling if necessary, and
identifying taxa present. Samples were scanned using a binocular dissecting microscope,
and large organisms such as fish larvae and squid larvae were removed. Large samples
were split using a Cushing subsampler (Cushing 1961) to facilitate processing. Animals
were identified to the lowest taxon possible and enumerated; mean lengths were
determined from subsamples. Additionally, animals that were observed in the original
sample but were not present in the split portion, or were observed as pieces (e.g.,
Siphonophora), were listed as “present,” as were the larger gelatinous animals (e.g.,
Thaliacea). Displacement volume of each sample was measured to + 0.1 ml in graduated
cylinders. The area sampled during each tow (distance x net width) was calculated using
ship’s speed, and catches were standardized to number of animals per 100 m2 [(number of
animals/area sampled) x 100]. Because the neuston net lacked a flow meter, and tow
depth varied with wave conditions, we assumed that the net was, on average, half
submerged.
Most neuston samples were collected between sunset and sunrise in conjunction
with other sampling. Sampling at sunset consisted of a conductivity-temperature-depth
(CTD) profile to 1,000 m, a macrozooplankton trawl to 150 m, a neuston tow, and a mid-
water diamond trawl (175-250 m) for nekton. A midnight CTD cast was taken after the
mid-water nekton trawl was completed. Sampling at sunrise consisted of a CTD cast,
mid-water nekton trawl, macrozooplankton trawl, and neuston tow. In some cases, the
sunset and sunrise stations were as close as 0.6 km. Morning neuston tows were
completed after sunrise.

4
Frequency of occurrence and mean abundance of all taxa were calculated for sea
surface temperature (SST) intervals representing the oceanographic regimes encountered
during the cruise. Tables of zooplankton abundance and frequency of occurrence were
formatted numerically in ascending order using the National Oceanographic Data Center
(NODC) taxonomic codes (NODC 1984). Abundance was defined as the number of
animals per area sampled. Taxonomic nomenclature and groupings follow Brusca and
Brusca (1990).
RESULTS AND DISCUSSION
The NPSFZ is a complex oceanographic area to which a confusing descriptive
terminology has been applied by physical and biological oceanographers. In this report,
we follow the terminology of Roden (1991) and Pearcy (1991), which is based on the
physical and chemical characteristics of the water column, rather than that of McGowan
(1971, 1974) based on recorded distribution of midwater organisms. Three different
oceanographic regimes encountered during this study: 1) the Subarctic Domain (SD),
characterized by a cool, low-salinity surface layer; 2) a Subtropical Domain, characterized
by a warm, saline surface layer, and 3) the Subarctic-Subtropical Transition Region
(SSTR), which shares thermohaline characteristics of the Subarctic and Subtropical
Domains (Garcia 1990). The SSTR may be subdivided into the Transitional Domain and
the Transition Zone (Pearcy 1991). The Transition Domain is narrow in the western
Pacific Ocean and broad in the eastern Pacific Ocean, where it expands into the California
Current and Alaska Current systems (Pearcy 1991). The northern edge of the Transition
Domain is variously defined as surfacing of the 33%0 isohaline, the intersection of the 7°C
5
isotherm and the upper halocline, or the intersection of the 4°C isotherm at 100 m. The
southern edge of the Transitional Domain is defined as the subarctic front distinguished by
a vertical 34%0 isohaline (Pearcy 1991). The Transition Zone extends from the subarctic
front to the subtropical front approximated by the 35%0 surface isohaline. Within the
Transition Region, temperature, salinity, and density fronts seldom coincide or penetrate to
the same depths (Garcia 1990; Roden 1991); thus, it is difficult to distinguish precisely the
Transition Domain and Transition Zone in a single quasisynoptic survey. Although these
water masses are usually defined by surface salinity and subsurface water properties, the
SSTs generally reflect latitudinal differences between these masses. We selected four SST
intervals to represent these regimes: 9.0°-12.O°C for the SD, 12.1°-15.O°C for the
Transition Domain, 15.l°-18.O°C for the northern portion of the Transition Zone, and
18.1°-25.O°C for the southern portion of the Transition Zone.
Die1 vertical migrations of certain zooplankton stages and types (Cushing 1951;
Vinogradov 1968) and time of collection differences could alter apparent species
abundance and distribution. We found no statistically significant day-night differences in
species richness, total counts, or displacement volumes for 14 pairs of adjacent stations
(Table 1). Although some species were caught only at night (e.g., Myctophidae), day-
night differences were not considered further for this report.
Diversity and Abundance
Nine phyla, represented by 134 taxa, were collected during this study. Forty-five
taxa were identified to species level, 57 to genus, 14 to family, and 18 to order, class, or

6
phylum. Frequency of occurrence and mean abundance for all taxa are given for each
temperature interval (Table 2).
Zooplankton Diversity
Species richness was highest south of the NPSFZ, and lowest north of it (Fig. 2).
Number of species did not differ significantly between adjacent temperature intervals
because some taxa were found in two or more intervals; however, richness increased
significantly (F3.38 4.18, P < 0.01) from cool to warm waters. Only 31 taxa were found in
the coolest interval, whereas 75 taxa were collected in the warmest interval. Sixty-six taxa
were collected in the northern and 78 in the southern intervals of the NPSFZ (Table 2).
Although more taxa were collected in the southern NPSFZ than in the warmest interval,
the mean number of species per sample was slightly greater in the warmest interval (Fig.
2). Species richness is generally greater in tropical latitudes than in higher latitudes
(Omori and Ikeda 1984). Holdway and Maddock’s (1983a) survey of neuston from Fiji to
the Bay of Biscay found the same species diversity trends as other studies: only 3 of their
47 taxa were most common in boreal waters. Although Aron (1962) found that the
number of mid-water species in the eastern North Pacific Ocean increased markedly from
subarctic to warmer intermediate waters, these generalities are altered in frontal zones.
The circulation features of the NPSFZ may concentrate specific organisms at localized
areas of convergence (Olson 1986) and may also concentrate different taxa from both
southern and northern waters within the frontal zone.

Arthropods were the most abundant neuston group collected; 77 (57%) of the total
134 taxa collected were crustaceans. Amphipods and copepods were the most diverse
groups, represented by 52 (39%) taxa. The two most abundant species, Themisto pacifica
and Calanus pacificus, were also the most widely distributed and frequently collected
species, occurring in 64.3% and 69.1% of the samples, respectively, and in all temperature
intervals (Table 2). Their frequency of occurrence declined from north to south.
Crustacean diversity was greatest (46 taxa) within the warmest interval. Thirty-four and
45 crustacean taxa were collected in the southern and northern regions of the NPSFZ,
respectively, and 57 in the combined intervals. Eighteen crustacean taxa were collected in
the SD (Table 2):
Molluscs were second to arthropods in frequency of occurrence. Pteropods were
the most diverse group and squid larvae the most frequent group of molluscs encountered.
Twelve taxa of pteropods were collected, two or more taxa in each temperature interval.
Pteropod species richness did not follow the general trend of “simple” community
structure in temperate latitudes and more “complex” community structure in subtropical
latitudes. Pteropod species richness was greatest in the 12.l°-15.O°C interval, where all
genera were represented and all but three species were collected (Table 2). Five of the
pteropod species were. included in Fager and McGowan’s (1963) analysis of zooplankton
co-occurrence in the North Pacific Ocean. They grouped Limacina helicina, three
euphausiids, and one chaetognath as subarctic species. This agrees with our finding of
100% occurrence at the six stations in the coolest interval, 7% in the 12. lo-15.O°C
interval, and 0% in the two warmest intervals (Table 2). Fager and McGowan (1963)

8
grouped Clio pyramidata and two other pteropods as “subtropical” species. We found,
however, that the frequency of C. pyramidata increased from warmer to cooler waters
(Table 2) and was most abundant in the 12.1°-15.O°C waters, corresponding to its frequent
occurrence in the Gulf of Alaska (Wing1).
Fishes representing 10 taxa were collected; species richness increased from cool to
warmer intervals. Pacific saury, Cololabis saira, was the most frequently caught species
(Table 2). Ahlstrom and Stevens (1976) similarly noted that in eastern Pacific neuston,
saury were the most frequently collected fish. Of the nine remaining fish taxa (excluding
fish eggs and unidentified fish larvae), only the myctophids Symbolophorus sp. and
TarZetonbeania sp. were collected in more than one temperature interval (Table 2). This
low ichthyoplankton diversity may be an artifact of 1) sampling after dawn, 2) sampling in
rough waters, 3) sampling in the fall, after most species have grown beyond a size
vulnerable’ to capture by a neuston net, or 4) the small area (low volume) sampled (Clarke
1991).
Zooplankton Abundance
Of the 134 taxa collected, only 22 had an abundance greater than 10 animals/l00
m2 at any station. At almost 25% of the stations sampled, no taxon had an abundance
greater than 10 animals/l00 m2. On the 63 occasions when abundance of a taxon
exceeded 10 animals/l00 m2, 30 occasions were due to the three most abundant taxa:
Themisto pacifica, Calanus pacificus, and Euphausia pacifica.
‘Wing, B. L. (unpubl. data). Auke Bay Lab, Alaska Fish. Sci. Cent., 11305 Glacier Hwy., Juneau, AK 99801-8626. Clio pyromidata occur more frequently in 9.0°-12.°C waters than in warmer waters.

9
Some taxa were more abundant locally or in particular temperature intervals. Mean
abundance of the copepod Scolecithricella minor was 57 animals/l00 m2 in the
9.0°-12.O°C interval, but less than 1 animal/l00 m2 in the 12.1°-15.O°C interval; they
were not collected in the two warmer intervals (Table 2). In contrast, pontellid copepods,
although not abundant, were collected only in the warmest interval (Table 2). Mean
abundance of the siphonophore Sulculeolaria sp. was 12.0 animals/l00 m2 in the
12.1°-15.O°C interval (Table 2); however, this value was influenced by one sample that
contained over 1,000 animals.
Although not statistically significant, neuston abundance (F3,381 .95, P = 0.14) and
biomass (F,,,,O.57, P = 0.64) generally appeared highest in the NPSFZ (Figs. 3, 4). The
greatest numerical abundance (1,591 animals/100 m*) was at 43”50’N, in the northern
portion of the NPSFZ as defined by Garcia (1990). Based on displacement volume,
average biomass (Fig. 4) was greatest in the 15. lo-18.O”C interval (southern NPSFZ) as a
result of one large catch of Velella. Although knowledge of the processes that regulate
productivity in the NPSFZ is limited (Pearcy 1991), frontal dynamics and mesoscale
circulation of that region may concentrate organisms at localized areas of convergence,
thereby causing localized high densities of zooplankton (Olson 1986).
The most abundant neuston group was made up of arthropods; Themisto pad&a
and Calanus pacificus were the most abundant species (81.6 and 48.7 animals/l00 m*,
respectively) for all temperature intervals (Table 2). The third most abundant species was
Euphausia paciJica, with 16.4 animals/100 m2 for all temperature intervals sampled (Table
2). The general trend for these three species was increased abundance in the two middle

10
temperature intervals, representing the northern and southern portions of the NPSFZ
(Table 2).
Generally, planktonic amphipods are dominated by the Hyperiidae and rank third in
numerical abundance behind copepods and euphausiids (Bowman 1960). They are often
very abundant in high latitude regions, where they are important in the diets of seabirds,
fish, and mammals (Wing 1976; Ogi et al. 1980; Ogi and Hamanaka 1982). The shallow-
dwelling Themisto pacifica is the most abundant northeastern Pacific hyperiid, with a wide
geographic distribution and broad thermal tolerance. It frequently swarms near the
surface, which may account for its high abundance and dominance in our samples.
The copepod Culunus pacificus, a widely distributed and abundant species in the
eastern North Pacific Ocean, occupies extensions of the NPSFZ in the Gulf of Alaska to
Prince William Sound and of the California Current south to northern Mexico (Gardner
and Szabo 1982). This species is a facultative neustonic species; its high abundance in our
samples indicates its generally high abundance throughout the upper water column and in
most of the transition and subarctic regions. The pontellid copepods, however, are often
neustonic, and many neustonic ones are restricted to tropical and subtropical waters;
pontellids were collected at only our two southernmost stations.
Fishes, 10 taxa including unidentified fish larvae and eggs, were generally scarce.
No fish had a mean abundance greater than 10 animals/100 m2 for any temperature
interval. Abundance of Cololabis saira, the only fish larvae with more than 1 anima1/100
m* for any station, increased from cooler to warmer waters (Table 2). The only other

11
locally abundant Osteichthyes were unidentified fish eggs: 65 were collected at one
station within the NPSFZ.
Although amphipods were our most abundant zooplankton, most studies in the
North Pacific Ocean and other oceans have found calanoid copepods to be the most
abundant group. Holdway and Maddock (1983b), in a broad survey of neuston between
Fiji and the Bay of Biscay, found copepods to be the dominant taxon in every area
sampled, comprising over 50% of the neuston in all but one area. In the northeastern
subtropical Atlantic Ocean, crustaceans constituted 94% of the invertebrate neuston; 50%
of these crustaceans were copepods, dominated by calanoids (Hempel and Weikert 1972).
LeBrasseur (1965), using both surface and vertical tows, found that two groups of
zooplankton predominate in the northeastern Pacific Ocean: copepods in April-June and
amphipods in July-September.
SYNOPSIS
These results should be viewed with the caveat that many factors can influence
species distribution, frequency of occurrence, and abundance. Such factors include
biological and physical parameters and sampling techniques (Zaitsev 1970; Hempel and
Weikert 1972; Holdway and Maddock 1983a,b; Kendall and Dunn 1985). We found that
“normal” patterns (high species richness and low abundance in warmer waters, and low
species richness and high abundance in cooler waters) appear to be altered within frontal
zones. Time of day and season dramatically affect zooplankton composition and
abundance (Zaitsev 1970; Hempel and Weikert 1972; Ahlstrom arid Stevens 1976;
Holdway and Maddock 1983b).
12
We did not attempt a comprehensive analysis of all 134 taxa collected. Although
most taxa were infrequent, scarce, or both, they are not necessarily unimportant
components of their particular habitats (Soule 1988).
Nevertheless, we believe that the neustonic animals are indicators of oceanic
changes in the North Pacific Ocean, and that the marked geographic variation of their
distribution and abundance is associated with water mass types and boundaries. Our
findings correspond to those of previous investigators, who also considered zooplankton to
be indicators of oceanic changes (e.g., Russell 1939; Aron 1962; Fager and McGowan
1963; Soule and Kleppel 1988). Notably, species densities (biomass) were not greatest in
the SD, as is usually assumed, but within the NPSFZ, near the subarctic boundary.
Species richness, generally greater in warm than in cool waters, was only slightly less in
the NPSFZ. than in the warmest interval. Clearly, our study indicates that neuston
distribution and diversity can indicate water masses in the central North Pacific Ocean.
The sampling gear‘is inexpensive and can be fished in most weather and at speeds up to
20 km/h (Sameoto and Jaroszynski 1969), making neuston samples practical for
monitoring fishery and oceanic conditions over large areas.
ACKNOWLEDGMENTS
We thank Shannon Fitzgerald, Bryan Herczeg, the crew and officers of the NOAA
ship Miller Freeman, and scientists who assisted in the field collections. We thank
Thomas Shirley, Richard Brodeur, Earl Krygier, Evan Haynes, Kenneth Krieger, Richard
Carlson, Bryon Morris, and Michael Mullin for their thorough reviews of this manuscript.

13
CITATIONS
Ahlstrom, E. H., and E. Stevens. 1976. Report of neuston (surface) collections made on
an extended CalCOFI cruise during May 1972. Calif. Coop. Oceanic Fish. Invest.
Rep. 18: 167-180.
Aron, W. 1962. The distribution of animals in the eastern North Pacific and its
relationship to physical and chemical conditions. J. Fish. Res. Board Can. 19:
271-314.
Bowman, T. E. 1960. The pelagic amphipod genus Parathemisto (Hyperiidea:
Hyperiidae) in the North Pacific and adjacent Arctic Ocean. Smithsonian Inst.,
Washington, DC. Proceedings of the U.S. National Museum 112(3439): 343-392.
Brodeur, R. D. 1989. Neustonic feeding by juvenile salmonids in coastal waters of the
northeast Pacific. Can. J. Zool. 67: 1995-2007.
Brusca, R. C., and G. J. Brusca. 1990. Invertebrates. Sinauer Associates, Sunderland,
MA, 922 p.
Cheng, L,. 1975. Marine pleuston-animals at the sea-air interface. Oceanogr. Mar. Biol.
Ann. Rev. 13: 181-212.
Clarke, T. A. 1991. Larvae of nearshore fishes in oceanic waters near Oahu, Hawaii.
U.S. Dep. Commer., NOAA Tech. Rep. NMFS 101, 19 p.
Cushing, C. E., Jr. 1961. A plankton sub-sampler. Limnol. Oceanog. 6: 489-490.
Cushing, D. H. 195 1. The vertical migration of ,planktonic Crustacea. Biol. Rev. 26(6):
158-192.

Fager, E. W., and J. A. McGowan. 1963. Zooplankton species groups in the North
Pacific. Science 140: 453-460.
Garcia, H. E. 1990. Mesoscale thermohaline characteristics of the subarctic-subtropic
transition zone in the northeastern Pacific Ocean during winter 1989. Report
submitted to National Marine Fisheries Service, Auke Bay Laboratory, Juneau, AK
99801-8626.
Gardner, G. A., and I. Szabo. 1982. British Columbia pelagic marine copepoda: An
identification manual and annotated bibliography. Can. Spec. Publ. Fish. Aquat.
Sci. 62, 536 p.
Hempel, G., and H. Weikert. 1972. -The neuston of the subtropical and boreal north-
’ eastern Atlantic Ocean. A review. Mar. Biol. 13: 70-88.
Holdway, P., and L. Maddock. 1983a. Neustonic distributions. Mar. Biol. 77: 207-214.
Holdway, I?, and L. Maddock. 1983b. A comparative survey of neuston: geographical
and temporal distribution patterns. Mar. Biol. 76: 263-270.
International North Pacific Fisheries Commission (INPFC). 1990. Final report of squid
and bycatch observations in the Japanese driftnet fishery for neon flying squid
(Ommastrephes bartrami), June - December, 1989 Observer Program. (INPFC
Dot.). Joint report by the National Sections of Canada,-Japan, and the United
States. (Available from: Driftnet Program Coordinator, Alaska Fisheries Science.._
Center, 7600 Sand Point Way N.E., Seattle, WA 98115-0070.)
Kendall, A. W., Jr., and J. R. Dunn. 1985. Ichthyoplankton of the continental shelf near
Kodiak Island, Alaska. U.S. Dep. Commer., NOAA Tech. Rep. NMFS 20, 89 p.

15
LeBrasseur, R. J. 1965. Seasonal and annual variations of net zooplankton at ocean
station P 1956-1964. Fish. Res. Board Can. Manuscript Rep. Ser. (Oceanographic
and Limnological) 202.
McGowan, J. A. 1971. Oceanic biogeography of the Pacific. In B. M. Funnel1 and W.
R. Riedel (editors), The micropalaeontology of oceans, p. 3-74. Cambridge Univ.
Press, London.
McGowan, J. A. 1974. The nature of oceanic ecosystems. In C. B. Miller (editor), The
biology of the oceanic Pacific, p. 9-28. Oregon State University Press, Corvallis,
OR.
National Oceanographic Data Center (NO’DC). 1984. Taxonomic code. Fourth edition,
two volumes. U.S. Dep. Commer., Natl. Oceanic Atmos. Admin., Natl. Environ.
Satellite, Data, and Information Serv. Key to Oceanographic Records
Documentation no. 15, Washington, DC.
Ogi, H., and T. Hamanaka. 1982. The feeding ecology of Uria lomvia in the
northwestern Bering Sea region. J. Yamashina Inst. Omith. 14: 27&280.
Ogi, H., T. Kubodera, and K. Nakamura. 1980. The pelagic feeding ecology of the short-
tailed shearwater Puffinus tenuirostris in the subarctic Pacific region. J. Yamashina
Inst. Omith. 12: 157-181.
Olson, D. B. 1986. Transition zones and fauna1 boundaries in relationship to physical
properties of the ocean. In A. C. Pierrot-Bults, S. van der Spoel, B. J. Zahuranec,
and R. K. Johnson (editors), Pelagic biogeography, p. 219-225. UNESCO Tech.
Paper in Marine Science 49.

16
Omori, M., and T. Ikeda. 1984. Methods in marine zooplankton ecology. John Wiley &
Sons, New York.
Pearcy, W. G. 1991. Biology of the transition region. In J. A. Wetherall (editor),
Biology, oceanography, and fisheries of the North Pacific transition zone and
subarctic frontal zone, p. 39-55. U.S. Dep. Commer., NOAA Tech. Rep. NMFS
105.
Peres, J. M. 1982. Specific pelagic assemblages. Mar. Ecol. 5(l): 3 13-372.
Peterson, W. T., R. D. Brodeur, and W. G. Pearcy. 1982. Food habits of juvenile salmon
in the Oregon coastal zone, June 1979. Fish. Bull.,.U.S. 80: 841-851.
Prince, I? A., and R. A. Morgan. 1987. Diet and feeding ecology of Procellariiformes.
In J. l? Croxall (editor), Seabirds: feeding ecology and role in marine ecosystems,
p. 135-l 71. Cambridge Univ. Press, London.
Roden, G. I. 1991. Subarctic-subtropical transition zone of the North Pacific: large-scale
aspects and mesoscale structure. In J. A. Wetherall (editor), Biology,
oceanography, and fisheries of the North Pacific transition zone and subarctic
frontal zone, p. l-38. U.S. Dep. Commer., NOAA Tech. Rep. NMFS 105.
Russell, F. S. 1939. Hydrographical and biological conditions in the North Sea as
indicated by plankton organisms. J. Conseil Explor. Mer 14(2): 171-192.
Sameoto, D. D., and L. 0. Jaroszynski. 1969. Otter surface sampler: a new neuston net.
J. Fish. Res. Board Can. 26: 2240-2244.

17
Schreiber, R. W., and R. B. Clapp. 1987. Pelecaniform feeding ecology. In J. l? Croxall
(editor), Seabirds: feeding ecology and role in marine ecosystems, p. 173-l 88.
Cambridge Univ. Press, London.
Soule, D. F. 1988. Marine organisms as indicators: Reality or wishful thinking? In D.
F. Soule and G. S. Kleppel (editors), Marine organisms as indicators, p. l-11.
Springer-Verlag, New York.
Soule, D. F., and G. S. Kleppel (editors). 1988. Marine organisms as indicators.
Springer-Verlag, New York, 342 p.
Turner, J. T. 1984. The feeding ecology of some zooplankters that are important prey
items of larval fish. U.S. Dep. Commer., NOAA Tech. Rep. NMFS 7, 28 p.
Vinogradov, M. E. 1968. Vertical distribution of the oceanic zooplankton. [Transl. from
Russ. by Israel Program for Scientific Transl., Jerusalem, 1970, 339 p,]
Wetherall, J. A. 1991. Preface. In J. A. Wetherall (editor), Biology, oceanography, and
fisheries of the North Pacific transition zone and subarctic frontal zone, p. iv. U.S.
Dep. Commer., NOAA Tech. Rep. NMFS 105.
Wing, B. L. 1976. Ecology of Parathemisto libellula and p pacifica (Amphipoda:
Hyperiidea) in Alaskan coastal waters. Ph.D. thesis, Univ. Rhode Island, Kingston,
RI, 266 p.
Zaitsev, Yu. P 1970. Marine neustonology. “Naukova Dun&a,” Kiev. [Transl. from
Russ. by Israel Program for Scientific Transl., Jerusalem, 1971, 264 p.]

TABLES

21
Table l.--Comparison of night and day neuston catches at,stations within each temperatureinterval. (Sta = Station, Spp = Number of taxa, Count = Total countstandardized to number per 100 m* rounded to the nearest whole number, andVolume = Displacement volume as ml per 100 m*.)
Temp°C
Night Day
Sta Spp Count Volume Sta Spp count Volume

Table 2. --Frequency of occurrence (FO) and mean abundance of all catches (No./100 m’) (MA) of taxa, grouped by sea surfacetemperature intervals; n = number of samples.

Table 2. --Continued.

Table 2. --Continued.
Species
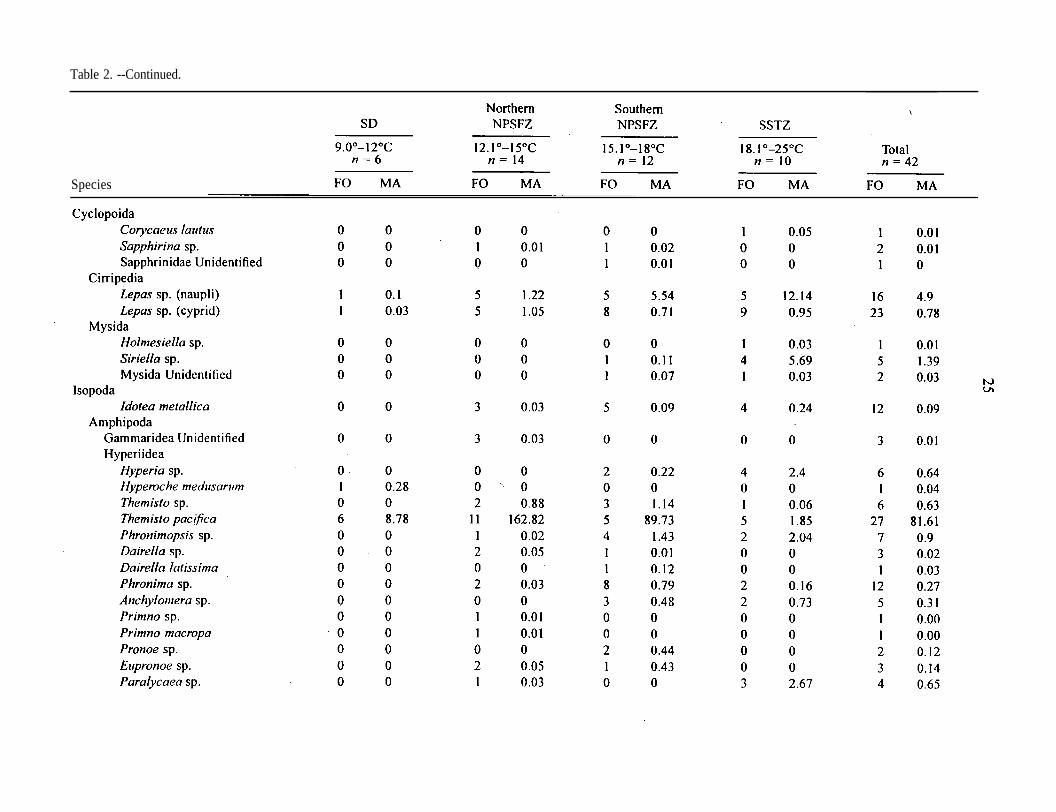
Table 2. --Continued.
Species
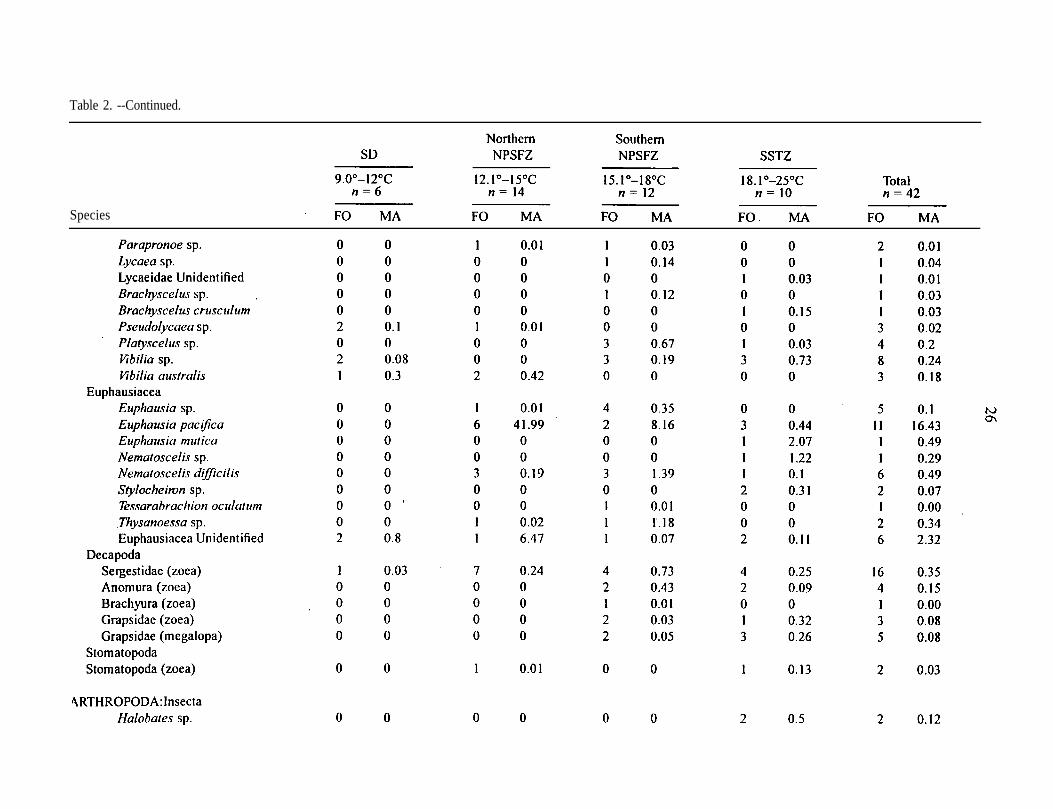
Table 2. --Continued.
Species

Table 2. --Continued.
Species

FIGURES
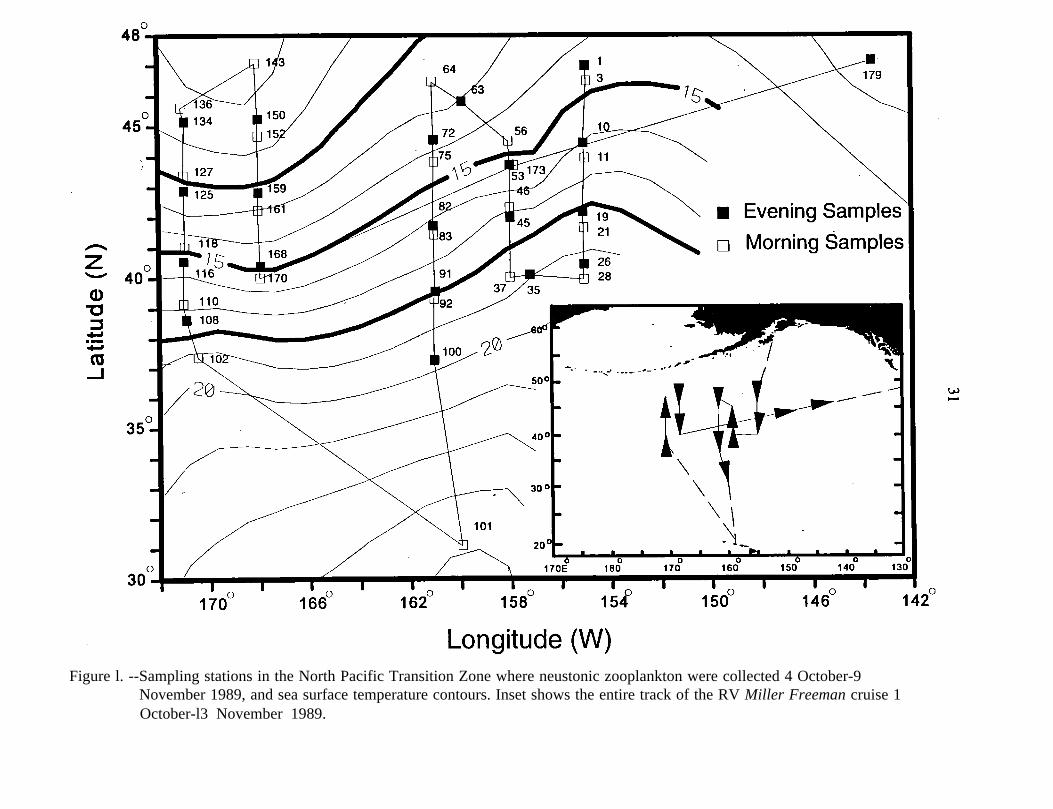
Figure l. --Sampling stations in the North Pacific Transition Zone where neustonic zooplankton were collected 4 October-9November 1989, and sea surface temperature contours. Inset shows the entire track of the RV Miller Freeman cruise 1October-l3 November 1989.

SEA SURFACE TEMPERATURE INTERVAL
Figure 2. --Number of taxa per station for each sea surface temperature interval.
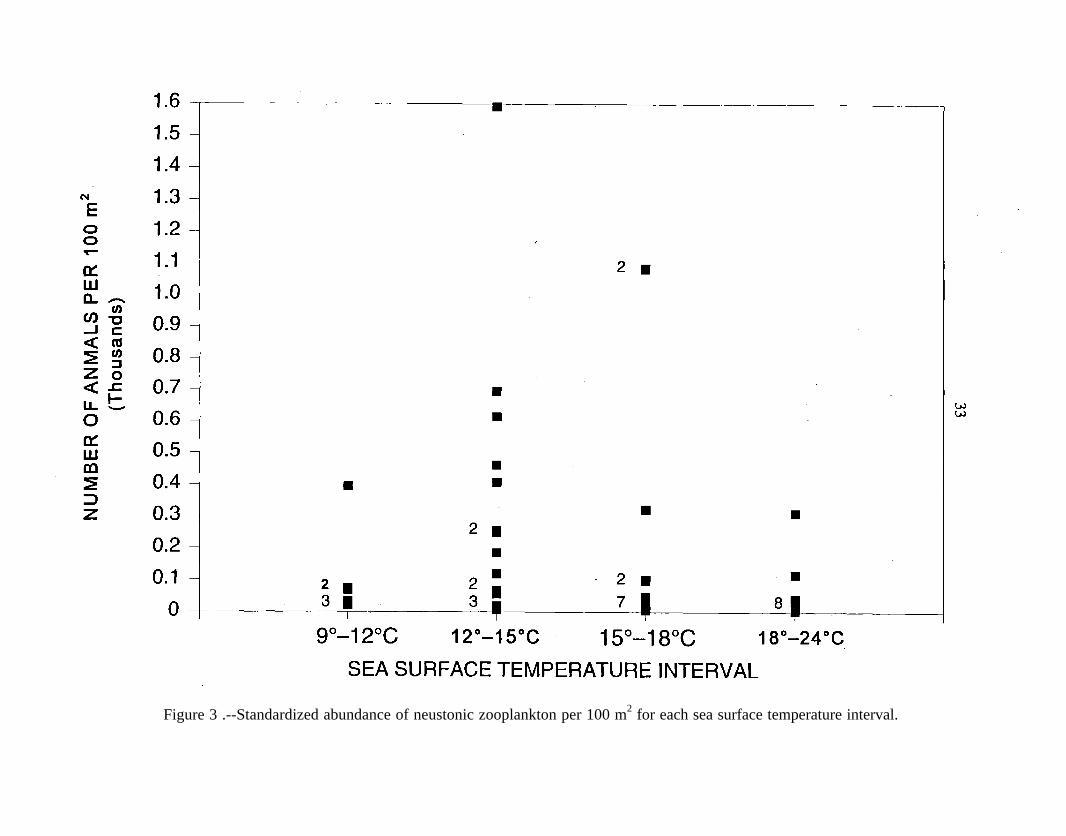
Figure 3 .--Standardized abundance of neustonic zooplankton per 100 m2 for each sea surface temperature interval.

SEA SURFACE TEMPERATURE INTERVAL
Figure 4. --Standardized displacement volume of neuston samples for each sea surface temperature interval.
RECENT TECHNICAL MEMORANDUMS
Copies of this and other NOAA Technical Memorandums are available from theNational Technical Information Service, 5285 Port Royal Road, Springfield, VA 22167(web site: www.ntis.gov). Paper and microfiche copies vary in price.
AFSC-
69 SINCLAIR, E.H. (editor). 1996. Fur seal investigations, 1994, 144 p. NTIS No. PB97-129456.
68 MERRICK, R. L., T. R. LOUGHLIN, and D. G. CALKINS. 1996. Hot branding: A technique for long-termmarking of pinnipeds, 21 p. NTIS No. PB97-124226.
67 LANG, G M., and P. A. LIVINGSTON. 1996. Food habits of key groundfish species in the eastern BeringSea slope region, 111 p. NTIS No. PB97-124010.
66 KINOSHITA, R. K., and J. M. TERRY. 1996. Oregon, Washington, and Alaska exports of edible fisheryproducts, 1995, 48 p. NTIS No. PB96-214663.
65 HONKALEHTO T., and N. WILLIAMSON. 1996. Echo integration-trawl survey of walleye pollock(Theragra chalcogramma) in the Southeastern Aleutian Basin during February and March 1995, 57 p. NTIS No. PB96-202726.
64 TYNAN, C. 1996. Characterization of oceanographic habitat of cetaceans in the Southern Indian Oceanbetween 82/ - 115/ E: Cruise report from World Ocean Circulation Experiment (WOCE) I8S and I9S, 53 p. NTIS No. PB96-192786.
63 KINOSHITA, R. K., and J. M. TERRY. 1996. Oregon, Washington, and Alaska exports of edible fisheryproducts, 1994, 49 p. NTIS No. PB96-183553.
62 KINOSHITA, R. K., A. GRIEG, and J. M. TERRY. 1996. Economic status of the groundfish fisheries offAlaska, 1994, 108 p. NTIS No. PB96-178595.
61 PELLA, J., M. MASUDA, and S. NELSON. 1996. Search algorithms for computing stock composition of
a mixture from traits of individuals by maximum likelihood, 68 p. NTIS No. PB96-154653.
60 YANG, M-S. 1996. Diets of the important groundfishes in the Aleutian Islands in summer 1991, 105 p.NTIS No. PB96-147582.
59 MARTIN, M. H., and D. M. CLAUSEN. 1995. Data report: 1993 Gulf of Alaska bottom trawl survey, 217 p. NTIS No. PB96-135561.
58 QUEIROLO, L. E., L. W. FRITZ, P. A. LIVINGSTON, M. R. LOEFFLAD, D. A. COLPO, and Y. L.DEREYNIER. 1995. Bycatch, utilization, and discards in the commercial groundfish fisheries of the Gulfof Alaska, eastern Bering Sea, and Aleutian Islands, 148 p. NTIS No. PB96-125547.
57 SMALL, R. J., and D. P. DEMASTER. 1995. Alaska marine mammal stock assessments 1995-57, 93p.NTIS No. PB95-274734.
56 DORN, M. W., S. M. FITZGERALD, M. A. GUTTORMSEN, and M. R. LOEFFLAD. 1995. An evaluationof North Pacific groundfish observer program methods of haul weight estimation, 31 p. NTIS No. PB95-271151.
55 PELLA, J., R. RUMBAUGH, and M. DAHLBERG. 1995. Incidental catches of salmonids in the 1991North Pacific squid driftnet fisheries, 33 p. NTIS No. PB95-252722.
54 KINOSHITA, R. K., A. GRIEG, and J. M. TERRY. 1995. Economic status of the groundfish fisheries offAlaska, 1993, 108 p. NTIS No. PB95-252714.