measuring the distribution, abundance, and biovolume …warren/ the distribution, abundance, and...
TRANSCRIPT
Measuring the distribution, abundance, and biovolume ofzooplankton in an oligotrophic freshwater lake with a 710 kHzscientific echosounder
Joseph D. Warren,1* Taylor H. Leach,2 Craig E. Williamson2
1School of Marine and Atmospheric Sciences, Stony Brook University, Southampton, New York2Department of Biology, Miami University, Oxford, Ohio
Abstract
Acoustic surveys of the distribution and abundance of freshwater zooplankton were conducted in Lake
Giles, an oligotrophic freshwater lake. Volume backscatter data from a 710 kHz scientific echosounder were
converted to high-resolution spatial and temporal numerical density estimates of small zooplankton. Vertical
net tows of a 153 lm mesh closing bongo net at multiple depth intervals provided both identification of the
types and sizes (0.5–1.5 mm length) of crustacean zooplankton present in the lake as well as an independent
measurement of zooplankton numerical density. Net and acoustic estimates of zooplankton abundance, bio-
volume, and distribution were very similar. The improved resolution of the high-frequency acoustic sampling
provides insight into several aspects of freshwater zooplankton ecology including: separation of migrating
and non-migrating zooplankton, high resolution measurements of in situ zooplankton biovolume, calcula-
tion of in situ vertical velocities of migrating zooplankton, and fine-scale (sub-meter) horizontal and vertical
zooplankton distribution during daytime, nighttime, and vertical migration events. These methods allow for
more detailed and accurate estimates of zooplankton distribution than traditional net sampling methods can
provide, including determining the total abundance of organisms within a specific habitat. They also provide
higher resolution data in both space and time of smaller zooplankton taxa than have been measured previ-
ously in freshwater ecosystems.
Pelagic zooplankton play a critical role in freshwater eco-
systems as important contributors to water quality and the
strength of trophic linkages and are therefore critical to
many ecosystem processes. They also provide an excellent
model system for understanding fundamental and applied
ecological dynamics (Lampert 2011) and genomics
(Colbourne et al. 2011). Zooplankton dynamics and their
subsequent role in ecosystems are highly dependent on their
horizontal and vertical distribution and abundance, as well
as environmental factors and processes that also vary spa-
tially and temporally. Conventional net and trap-based sam-
pling methods are typically used to characterize the
zooplankton populations in freshwater ecosystems, but are
limited in how well they capture these organisms and
resolve these processes. Sampling locations within a habitat
are often limited to few sites, or in many cases a single site,
which makes it difficult to measure the spatial and temporal
complexity of zooplankton aggregations and their dynamics.
These collection methods are also generally integrative in
either space or time making it difficult (or impossible) to
resolve fine-scale processes in either dimension. Previous
acoustic work with freshwater zooplankton has typically
used instruments that are not capable of resolving the
smaller species of zooplankton that can often comprise a
major portion of the zooplankton biomass.
Yet zooplankton are highly responsive to environmental
conditions and capable of habitat selection as a function of
ultraviolet and visible light (Leech et al. 2005; Fischer et al.
2006; Williamson et al. 2011), temperature (Kessler and
Lampert 2004), food quantity and location within the water
column (Kessler and Lampert 2004), vertebrate and inverte-
brate predation pressure (Dodson 1988; Neill 1990; Nesbitt
et al. 1996), individual health (Johnsen and Jakobsen 1987;
Van Gool and Ringelberg 1998), and genetic variability (de
Meester and Dumont 1989). The complexity of zooplankton
habitat selection, migration, and seasonal changes in these
behaviors occur on smaller temporal and spatial scales than
captured by conventional sampling methods. Real-time,
higher-resolution, and less labor-intensive methods are
needed to create new insights into the simultaneous vertical
and horizontal migration by zooplankton (Armengol et al.
2012) that influences their response to environmental*Correspondence: [email protected]
1
LIMNOLOGYand
OCEANOGRAPHY: METHODS Limnol. Oceanogr.: Methods 00, 2016, 00–00VC 2016 Association for the Sciences of Limnology and Oceanography
doi: 10.1002/lom3.10084

change as well as their role in ecosystem dynamics. These
include the ways zooplankton respond to climate change
that alters phenology and predator-prey dynamics (Winder
and Schindler 2004; Manca and DeMott 2009; Winder et al.
2009), lake thermal stratification (Jankowski et al. 2006;
Adrian et al. 2009; Wagner and Adrian 2011), as well as the
influence of diel vertical migration (DVM) on tradeoffs along
vertical habitat gradients (Winder et al. 2004), the interac-
tion of temperature and predation pressure on zooplankton
fitness (Pangle and Peacor 2010) and the effect of hypoxic
zones on DVM (Vanderploeg et al. 2009a,2009b).
Nets and other direct sampling methods such as Schindler
traps or Van Dorn bottles have been used for sampling zoo-
plankton in freshwater and marine habitats for many deca-
des (Hutchinson 1967; Wiebe and Benfield 2003). The
benefits of these methods are that physical specimens are
collected that allow detailed taxonomic identification, mea-
surement of phenotypic characteristics, and if organisms are
viable, further studies of their biology. However, there are
limitations with the use of nets as they are integrative sam-
plers, which make it difficult to know where in the net tow
path individual organisms were collected. Plankton traps
(Schindler 1969), pump sampling (Haney et al. 1990), and
continuous plankton samplers (Masson et al. 2001) have led
to improved horizontal and vertical resolution. But these sys-
tems are labor intensive, and highly limited in their ability
to resolve short-term dynamics of zooplankton, particularly
during diel vertical or horizontal migrations.
More advanced optical and acoustic techniques have also
been used to study freshwater zooplankton (Sprules et al.
1992; Schulze et al. 1995; Holbrook et al. 2006; Rahkola-
Sorsa et al. 2014). Optical techniques have the advantage of
providing relatively automated data, but they are also lim-
ited by their inability to provide high resolution data or any
detailed taxonomic identification as well as small sampling
volumes. The primary advantage of acoustic assessment of
plankton and nekton is that it provides high-resolution data
in both space and time compared with traditional trap, net,
or optical assessment methods. The downside is that acoustic
systems measure scattered energy from objects in the water
column and this acoustic measurement must be converted
into a biologically useful measure. In environments where a
few diverse types or sizes of organisms are present, this con-
version process is relatively straightforward. If the amount of
energy scattered by an individual scatterer (i.e., the target
strength) is known, then measured acoustic backscatter for a
volume of water can be converted to estimate the numerical
abundance of the scatterers for that volume (Foote and
Stanton 2000; Simmonds and MacLennan 2005). However,
this is often not the case in many ecosystems. If multiple
types or sizes of scatterers are present, then this conversion
of acoustic information to ecologically relevant measures is
more complex (Warren et al. 2003; Warren and Wiebe 2008;
Ressler et al. 2012).
Acoustic backscatter has been used to assess freshwater
zooplankton distribution for decades (Shiraishi 1960;
Northcote 1964; Teraguchi and Northcote 1966; McNaught
1969). Most freshwater studies to date used acoustic techni-
ques to study fish that could also detect dense aggregations
of crustacean zooplankton (copepods, Megard et al. 1997;
amphipods, Melnik et al. 1993) or organisms such as the
larval midge Chaoborus that possess gas vacuoles that make
them strong scatterers (Knudsen et al. 2006). In some cases,
scattering from zooplankton was strong enough to cause dif-
ficulty in measuring the backscatter from the resident fish in
the area (Kubecka et al. 2000). Scientists have used the
increased spatial and temporal resolution of these acoustic
systems to conduct studies that would be impossible using
traditional sampling methods including: the vertical migra-
tion of amphipods (Trevorrow and Tanaka 1997), spatial het-
erogeneity of Daphnia (Hembre and Megard 2003) or
zooplankton community horizontal habitat use (Holbrook
et al. 2006). Many studies used multiple frequency systems,
which allow some discrimination of the source of the back-
scatter (Knudsen et al. 2006).
Traditional echosounder systems operate at 18 kHz, 38
kHz, 120 kHz, and 200 kHz as these are useful frequencies to
measure bottom depths, monitor fish schools, and (in some
cases) discriminate between fish and other scatterers (Wat-
kins and Brierley 2002; Jurvelius et al. 2008). These systems
were designed to have detection ranges of hundreds (and
sometimes thousands) of meters, but to achieve these ranges,
these systems are limited to detecting only larger organisms
or high density aggregations of smaller scatterers. To detect
small (length<2 mm) scatterers, higher acoustic frequencies
are needed. High frequency systems (hundreds of kHz and
above) can be used to detect both small biological organisms
(Holliday and Pieper 1995) and, more commonly, suspended
sediments (Lynch et al. 1997) but they are limited to ranges
of tens of meters or less.
A variety of high frequency systems have been used to
study spatial distributions and dense aggregations (>103
organisms m23) of small (1–2 mm length) freshwater zoo-
plankton including a 430 kHz system to measure copepod
spatial distribution in Lake Superior (Holbrook et al. 2006)
and a 710 kHz system to detect copepod aggregations over a
range of 30 m in a shallow coastal bay (Parks et al. 2011).
While similar systems, including a 710 kHz echosounder and
a 614 kHz Acoustic Doppler Current Profiler (ADCP), have
also been used to detect vertical distributions and migrations
of zooplankton (Lorke et al. 2004; Knudsen et al. 2006;
Rahkola-Sorsa et al. 2014), these studies have focused on the
gas-bearing larval insects Chaoborus flavicans that are strong
backscatterers and large in size (2–10 mm length). To our
knowledge, only two previous studies (Roman et al. 2001;
Parks et al. 2011) have used acoustic systems to examine ver-
tical distributions or DVM of small (<2 mm) zooplankton.
Warren et al. Acoustic measurement of freshwater zooplankton
2
Recent work (Rahkola-Sorsa et al. 2014) did compare opti-
cal, net, and a 614 kHz ADCP measures of zooplankton bio-
mass and concluded that “in situ estimation of zooplankton
abundances on the basis of ADCP results is not reliable with-
out simultaneous net or optical sampling.” High-frequency
acoustic surveys in freshwater systems have rarely taken
advantage of the temporal resolution of these systems to
monitor changes in the distribution of small zooplankton in
real-time or the spatial resolution to fully characterize zoo-
plankton distribution over the entire habitat. Unlike ADCPs,
scientific echosounders are designed specifically to quantita-
tively measure the amount of acoustic energy scattered by
objects in the water column.
We used a calibrated 710 kHz scientific echosounder to
assess abundance, vertical distribution and DVM of small
zooplankton in an oligotrophic inland lake. Vertical profiles
of zooplankton numerical density were compared with tradi-
tional vertically stratified net tow sampling to assess the effi-
cacy of using acoustic backscatter to measure zooplankton
biomass and distribution. Acoustic survey transects were
conducted across the entire spatial extent of the lake to
describe the horizontal variations in zooplankton distribu-
tion and how that varied on a diel basis. Here we demon-
strate how a high resolution acoustic system can provide
novel insights into the dynamics of the zooplankton com-
munity in a small freshwater lake including: (1) the resolu-
tion of vertically migrating and non-migrating small
zooplankton using acoustic sampling, (2) the conversion of
acoustic backscatter into accurate estimates of zooplankton
biomass, (3) direct observations of upward migration events
of small zooplankton, (4) calculation of in situ vertical veloc-
ity of zooplankton, and (5) high resolution estimates of
the vertical and horizontal heterogeneity of zooplankton
densities.
Materials and procedures
The acoustic study was conducted on 17–18 June 2012
and 16 August 2012 in Lake Giles, a 48-hectare, oligotrophic
lake located in Northeastern Pennsylvania, USA (4182203400N
7580503300W) with maximum and mean depths of 24.8 m
and 10.1 m, respectively (Fig. 1). The zooplankton commu-
nity in Lake Giles is dominated by the cladoceran Daphnia
catawba and the calanoid copepod Leptodiaptomus minutus,
with low densities of the calanoid Aglaodiaptomus spatulocre-
natus and the cyclopoid copepod Cyclops scutifer.
Direct zooplankton samples were collected from the center
of the lake (where depth is maximum) using a 20 cm diameter,
153 lm mesh bongo-style closing plankton net and immedi-
ately preserved in ethanol. To compare zooplankton commu-
nity vertical distribution to acoustic backscatter, we collected
zooplankton at midday and midnight at 2 m intervals from
1 m above the lake bottom to the surface on 07 June 2012 and
14–16 August 2012 (inclement weather prevented day and
night sampling within 24 h in August). Net samples were also
collected concurrent with acoustic sampling on 17 June and
16 August at specific depth strata (ranging from 2 m to 5 m in
thickness) covering depths of 5–20 m of the water column. We
assume that net samples from the middle of the lake are repre-
sentative of the entire lake in terms of species present and their
sizes. Individuals were enumerated under a dissecting micro-
scope using a 10 mL Bogorov chamber; cladocerans were iden-
tified to genus and copepods to family.
Zooplankton body length and width measurements were
taken of a random sample of Daphnia, calanoid and cyclo-
poid copepodids (10 individuals of each species for each
sampling date and depth range) from replicate 3–8 m and
15–20 m samples collected on 17 June 2012 and 16 August
2012. These samples were chosen because the large number
of individuals collected would provide a reasonable represen-
tation of the community size distribution. Daphnia length
was measured from the anterior to posterior margin of the
carapace, excluding the spine and helmet, and copepod
length was measured from the anterior portion of the meta-
some to the metasome-urosome junction. Width measure-
ments for all zooplankton were taken at the broadest portion
of the metasome. The zooplankton size measurements were
used to convert acoustic backscatter to estimates of zoo-
plankton biovolume.
A 710 kHz EK 60 single-beam scientific echosounder
(Simrad-Kongsberg, Norway) was used to collect acoustic
backscatter data (volume backscatter strength, Sv) with the
transducer deployed at the aft of the survey vessel (3 m row
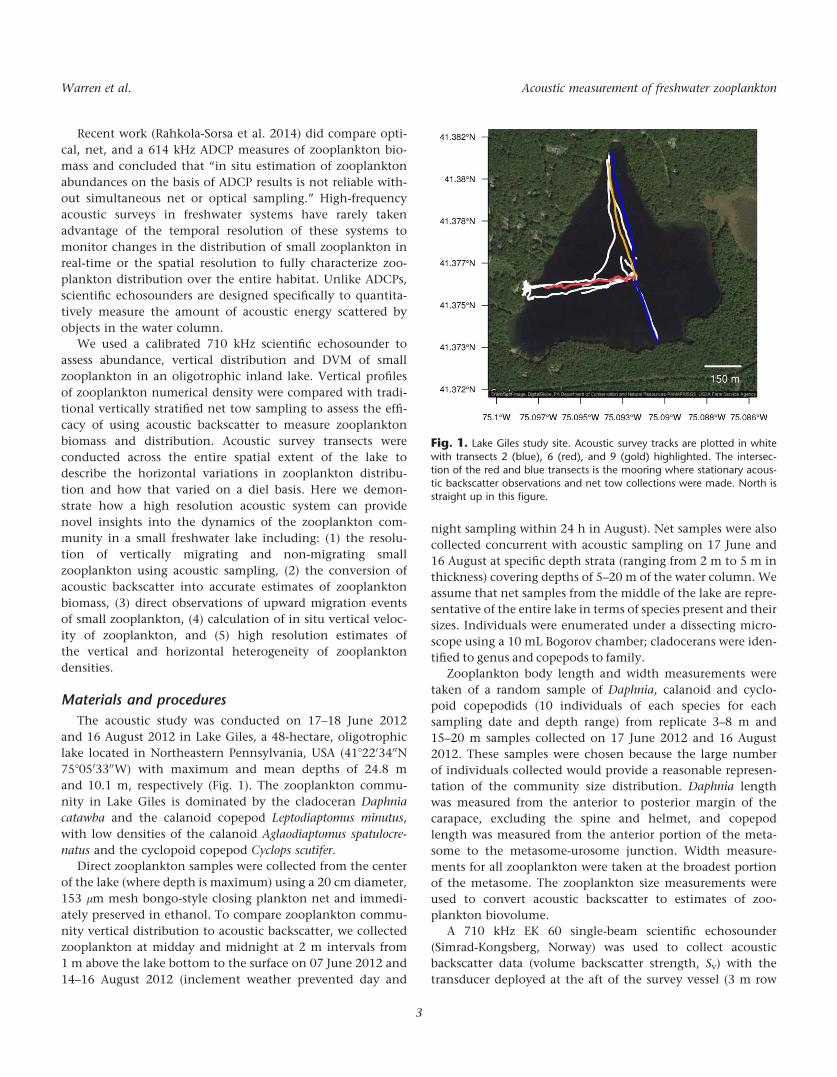
Fig. 1. Lake Giles study site. Acoustic survey tracks are plotted in white
with transects 2 (blue), 6 (red), and 9 (gold) highlighted. The intersec-tion of the red and blue transects is the mooring where stationary acous-tic backscatter observations and net tow collections were made. North is
straight up in this figure.
Warren et al. Acoustic measurement of freshwater zooplankton
3

boat) at a depth of approximately 15 cm. Due to the angle
of the transom of the vessel, the transducer was oriented at a
slight angle (measured from photographs as 78) toward the
bow from the vertical. This offset from the vertical was
accounted for in converting acoustic range to depth in the
water column. With this deployment geometry and discard-
ing data from the nearfield of the acoustic system (a region
where backscatter data are not accurately measured), acous-
tic data were collected from a depth of 0.5 m from the sur-
face to the lake bottom (maximum of 24.8 m) with a vertical
resolution of 5 cm. The transducer (710-30-E) had a beam-
width of 58. Acoustic data parameters were: 1 Hz ping rate,
256 ms pulse length (resulting in a vertical bin size of 5 cm),
and 100 W transmit power.
The echosounder electronics, data acquisition laptop, GPS
receiver, and 12 V battery power were enclosed in a custom-
ized waterproof case with a waterproof external mouse and
keyboard and a viewing port so that data acquisition could
be monitored and controlled without opening the case. The
acoustic system was calibrated (Foote et al. 1987) using a
standard target (38.1 mm Tungsten Carbide sphere) at a
depth ranging from 8 m to 12 m midway through the data
acquisition. Measured target strength values were within 0.3
dB of the theoretical target strength (239.6 dB re 1m2) of
the sphere and raw Sv data were corrected using this value.
Acoustic backscatter data had a time-varying gain applied to
the raw data as part of the instrument processing, but there
was no other processing done (i.e., no noise removal, no
spike removal) as the data acquisition system (e.g., rowboat,
battery-powered echosounder) were acoustically and electri-
cally quiet in terms of system noise. Temperature and salin-
ity profiles were collected from an vertically profiling buoy
in the middle of the lake and used to calculate density,
soundspeed, and absorption coefficient values which were
used in the analysis.
Acoustic surveys were conducted by rowing the vessel
along roughly parallel transects on 17–18 June 2012 and 16
August 2012. Sampling surveys were conducted during three
different time periods with different light levels (before dusk,
dusk, and nighttime) during each day; sunset occurred at
20:39 on June 18 and 20:00 on August 16. Data were col-
lected at a fixed location in the center of lake (with the ves-
sel tied to a moored buoy) during each time period as well
as during cross-lake transects such that vertical and horizon-
tal variability in zooplankton distributions could be assessed.
While it is possible that aliasing could occur during these
transects due to the movement of the zooplankton, we
believe this effect will not be significant given that zooplank-
ton horizontal movements are expected to be much slower
than the sampling platform over periods of tens of minutes
and that horizontal movements of small zooplankton occur
in a more random-walk pattern than the (attempted)
straight-line movement of the sampling platform.
Since only a single frequency system was used in this
study, multiple frequency discrimination of scatterer type
was not possible. Based on our observations of the echogram
as well as information about the constituent species of zoo-
plankton, fish, and other possible scatterers that were pres-
ent in the lake at this time of year, we assume that the
majority of the scatterers in the water column are small crus-
taceans (or can be modeled as small crustaceans). Fish,
which typically are strong acoustic scatterers, were rarely
observed on the echosounder. However, to ensure that their
scattering did not bias our results, we used a threshold on
the Sv data above the lake bottom, removing any values
greater than 260 dB re 1m2 (Rudstam et al. 2008) before
converting acoustic data to zooplankton numerical density.
We believe this method will prevent us from accidentally
including backscatter from fish targets and will not exclude
scattering from zooplankton as even very large aggregations
of zooplankton in the lake do not produce backscatter levels
that large (e.g., zooplankton densities greater than �107 ani-
mals m23 would be excluded by this threshold). Despite this
approach, our acoustic-based calculations of zooplankton
biovolume and numerical density will likely be overestimates
since we are assuming all scatterers in the water column are
zooplankton. The error in this approach for this study will
be addressed in the results and discussion sections.
A distorted wave Born approximation scattering model
(McGehee et al. 1998) was used to calculate the target
strength (TS) at 710 kHz of crustacean zooplankton based on
the sizes and shapes of organisms from net sampling. As sev-
eral scattering model parameter values are unknown for
freshwater organisms (specifically the density and sound
speed contrasts), values for marine organisms were used
(Stanton and Chu 2000). This assumption is another source
of possible error in our numerical density estimates as small
changes in these parameters can produce large changes in an
organism’s TS (Chu et al. 2000). Volume backscattering
strengths (Sv) were converted to numerical density (N, organ-
isms m23) estimates by assuming that only a single type of
scatterer was present (Smith et al. 2013):
Sv510 log10 Nð Þð Þ 1 TS (1)
Numerical density measurements were converted to
acoustically estimated biovolume (mL) using average length
and width values of the zooplankton collected during the
net tow sampling.
Assessment
Converting acoustic data to biological information
Accurate conversion of acoustic backscatter data to
numerical estimates of organisms is dependent on knowing
the size and shape of the scattering organism. Net tow data
showed that there were three dominant zooplankton taxa in
the lake during this study (Daphnia, calanoid and cyclopoid
Warren et al. Acoustic measurement of freshwater zooplankton
4
copeopds) that had different lengths and widths (Table 1).
The mean length-frequency weighted (Warren and Demer
2010) TS at 710 kHz was calculated for each type of scatterer
based on simulations of 1000 individuals (of each species)
with a random orientation relative to the acoustic wave-
front. The Daphnia were modeled as an oblate spheroid,
whereas the two copepod species were modeled using a
shape for a copepod from Chu and Stanton (2000). Addition-
ally, the biovolume of each individual that was modeled was
calculated.
Volume backscattering data (dB re 1 m21) were con-
verted to numerical densities of scatterers (# m23) using
Eq. 1. There were differences between the relative abundan-
ces of Daphnia and the two copepod species in the net
tows depending on the month, time period, and depth
strata, however the average (s.d.) relative abundance (aver-
aging over all net tow measurements, n 5 22) of the species
were: 2.9 (2.6) Daphnia L21, 6.9 (6.8) calanoid copepods
L21, and 2.6 (2.5) cyclopoid copepods L21. We used these
relative abundances to calculate (in the linear domain) the
total TS (2117.5 dB re 1m2) of a mixed aggregation (2.9
Daphnia, 6.9 calanoid copepods, 2.6 cyclopoid copepods)
of these organisms that was then used to determine the
total number of organisms in a scattering volume. The
total number of organisms was then re-apportioned (using
the relative abundances) to the number of Daphnia, cala-
noid copepods, and cyclopoid copepods per volume. These
data were then converted to estimates of zooplankton bio-
volume by multiplying by the mean volume of each scat-
terer type.
Biovolume was calculated using the organism’s shape as
defined in the acoustic modeling section (i.e., either a oblate
spheroid or a copepod-specific body shape) with the meas-
ured length and width as the major and minor axes. This
volume was used to determine the equivalent spherical
radius (ESR) of an scatterer with the same volume. Then the
ESR value and numerical densities from both net and acous-
tic methods were used to generate biovolume estimates.
While this approach may result in errors in estimates of
numerical densities given that the relative abundances of the
three types of zooplankton varied with depth and month.
One advantage of the acoustic estimation process is that esti-
mates of biovolume for a given level of scattering (Sv) are
less affected by errors in the specific species composition of
the zooplankton. For example, a given level of backscatter
could be the result of either few Daphnia (as these animals
are larger and have a higher TS) or many copepods (which
are smaller and have a lower TS). However, since numerical
density and volume of the animal are inversely related, the
estimates of biovolume from acoustic data will not vary as
much as the numerical densities (i.e., a few Daphnia or many
small copepods can produce the same Sv and biovolume
values).
Acoustic estimation of zooplankton biovolume
Concurrent net and acoustically derived measures of total
integrated water column biovolume from sampling during
August were similar for both day and night samples (Table
2). It is important to note that, particularly for night-time
sampling, the lack of acoustic data in the near-surface layer
will miss organisms located within the top 0.5 m of the
water column a region that can easily be sampled with nets.
Similarly, net tows often do not sample close to the bottom
(to avoid sediment contamination), which is not an issue for
acoustic sampling. To assess how much of the upper-water
column organisms may be missed, we compared acoustic
and net measurements for the near surface (0–4 m) in
August when both methods were used concurrently. The
acoustic estimates were based on data collected from the
near-surface (0.5 m depth) to 4 m and then extrapolated to
calculate the abundance over the entire depth range (0–4 m
depth). Acoustic estimates of biovolume in this region were
very similar (within a few percent) to net-derived biovo-
lumes (Table 2). Given that the differences in biovolume
between the two methods were much smaller than the dif-
ferences in biovolumes that occurred in both time and space,
we believe these data support the use of acoustically derived
zooplankton biovolume. We also note that the acoustic sys-
tem generally has a much greater sampling volume than the
vertical net hauls, with the exception of depths very near
the surface.
Direct observations of migrating and non-migrating
zooplankton layers
The June acoustic sampling observed vertical migration
occurring during the dusk to night transition (from 21:08 to
21:50 on 17 June, Fig. 2). Migration had already begun when
sampling commenced (e.g., diagonal streaks in Fig. 2). In
addition to the upward-migrating organisms, a surface layer
of scatterers (between 5 m depth and the surface) did not
appear to vertically migrate. The abundance of organisms in
this near-surface static layer may have decreased slightly
over the course of the sampling period, however it is difficult
to determine this since the vertically migrating organisms
began to occupy the same depth ranges as the static layer.
The direct observation of the migration event allowed us to
investigate the timing of the migration and observe organ-
isms that may have emerged from near or in the sediments
and are often missed with traditional net sampling.
Net samples collected at 21:34 and 22:04 on 18 June
show more than a doubling in the density of Daphnia and
calanoid copepods in the top meter of the water column
over that period (1.9–5.5 org L21 and 7.9–20.5 org L21,
respectively). The difference in distribution between the
Daphnia and calanoid copepods from net sampling suggest
that during the acoustic survey we observed Daphnia species
migrating from deeper in the water column to the surface
within approximately 30 min while the calanoid copepods
Warren et al. Acoustic measurement of freshwater zooplankton
5
were likely the static layer observed in the upper 5 m
(Fig. 2).
We examined the June 17 migration event more closely
by dividing our sampling observations into three 7–10 min
periods representing the early dusk (21:03–21:11), peak
migration (21:13–21:23), and late dusk (21:28–21:35) periods
(sunset was at 20:39). It is important to note that the acous-
tic measurements do not include the upper 0.5 m of the
water column because of the transducer depth and nearfield
range where no data are collected. As a result upward migrat-
ing organisms may be underestimated near the surface.
While differences in the vertical distribution of scatterers are
evident (Fig. 3), the total number of scatterers measured
acoustically over the water column was very consistent (�10
million organisms) varying by less than 10%. This suggests
that horizontal movement of these organisms during the
migration period is either not significant or isotropic (i.e.,
organisms exiting the acoustic beam are replaced by organ-
isms from outside the beam). However the vertical velocities
of these organisms are quite fast.
Calculation of in situ vertical velocity of zooplankton
The direct observation of upward migration gives us the
ability to calculate in situ vertical velocities of the zooplank-
ton scatterers. Vertical velocities were calculated from the
acoustic data by tracking the movement of scattering vol-
umes (most likely containing multiple zooplankton) as well
as calculating the change in mean scattering layer vs. time.
These methods produced similar values (0.8–1.0 cm s21 and
0.5 cm s21, respectively) of vertical (upward) velocity during
the DVM event observed (Figs. 2 and 3). If we assume a verti-
cal velocity of 0.5 cm s21 then an individual could migrate
nearly the entire depth of the water column (approx. 20 m)
in less than 70 min. We measured an upward shift in the
center of mass of the vertical zooplankton distribution,
which shoaled from 9.3 m (early dusk) to 9.1 m (peak migra-
tion) to 7.3 m (late dusk).
High resolution observations of the spatial heterogeneity
of zooplankton densities
Acoustic backscatter from the August survey also shows
thin layers of zooplankton at higher densities than the net
tow data suggests. While it is possible that these thin layers
represent aggregations of zooplankton moving in or out of
the beam pattern, the acoustic distributions in Fig. 4 repre-
sent average backscatter over a 10 min window so that is less
likely. Instead the observations of thin, high-density layers
demonstrate a limitation of the net sampling, which integra-
tes the organisms over the collection interval and obscures
fine-scale aggregations and depth selection.
Cross-lake transects taken at midday and at night with
the echosounder showed a high degree of spatial heterogene-
ity of backscatter and provide horizontal resolution that
would not be possible with traditional sampling methods. A
north to south transect was sampled both during the day
and at night. As expected, zooplankton were concentrated
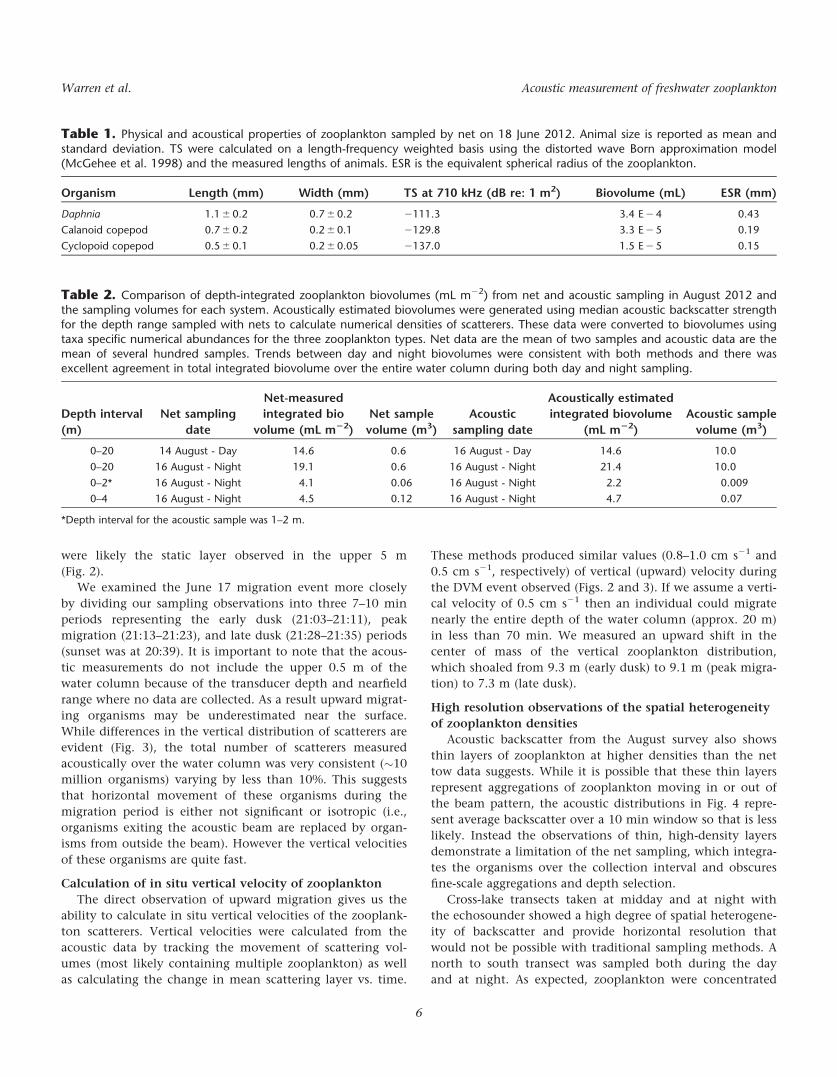
Table 1. Physical and acoustical properties of zooplankton sampled by net on 18 June 2012. Animal size is reported as mean andstandard deviation. TS were calculated on a length-frequency weighted basis using the distorted wave Born approximation model(McGehee et al. 1998) and the measured lengths of animals. ESR is the equivalent spherical radius of the zooplankton.
Organism Length (mm) Width (mm) TS at 710 kHz (dB re: 1 m2) Biovolume (mL) ESR (mm)
Daphnia 1.1 6 0.2 0.7 6 0.2 2111.3 3.4 E 2 4 0.43
Calanoid copepod 0.7 6 0.2 0.2 6 0.1 2129.8 3.3 E 2 5 0.19
Cyclopoid copepod 0.5 6 0.1 0.2 6 0.05 2137.0 1.5 E 2 5 0.15
Table 2. Comparison of depth-integrated zooplankton biovolumes (mL m22) from net and acoustic sampling in August 2012 andthe sampling volumes for each system. Acoustically estimated biovolumes were generated using median acoustic backscatter strengthfor the depth range sampled with nets to calculate numerical densities of scatterers. These data were converted to biovolumes usingtaxa specific numerical abundances for the three zooplankton types. Net data are the mean of two samples and acoustic data are themean of several hundred samples. Trends between day and night biovolumes were consistent with both methods and there wasexcellent agreement in total integrated biovolume over the entire water column during both day and night sampling.
Depth interval
(m)
Net sampling
date
Net-measured
integrated bio
volume (mL m22)
Net sample
volume (m3)
Acoustic
sampling date
Acoustically estimated
integrated biovolume
(mL m22)
Acoustic sample
volume (m3)
0–20 14 August - Day 14.6 0.6 16 August - Day 14.6 10.0
0–20 16 August - Night 19.1 0.6 16 August - Night 21.4 10.0
0–2* 16 August - Night 4.1 0.06 16 August - Night 2.2 0.009
0–4 16 August - Night 4.5 0.12 16 August - Night 4.7 0.07
*Depth interval for the acoustic sample was 1–2 m.
Warren et al. Acoustic measurement of freshwater zooplankton
6

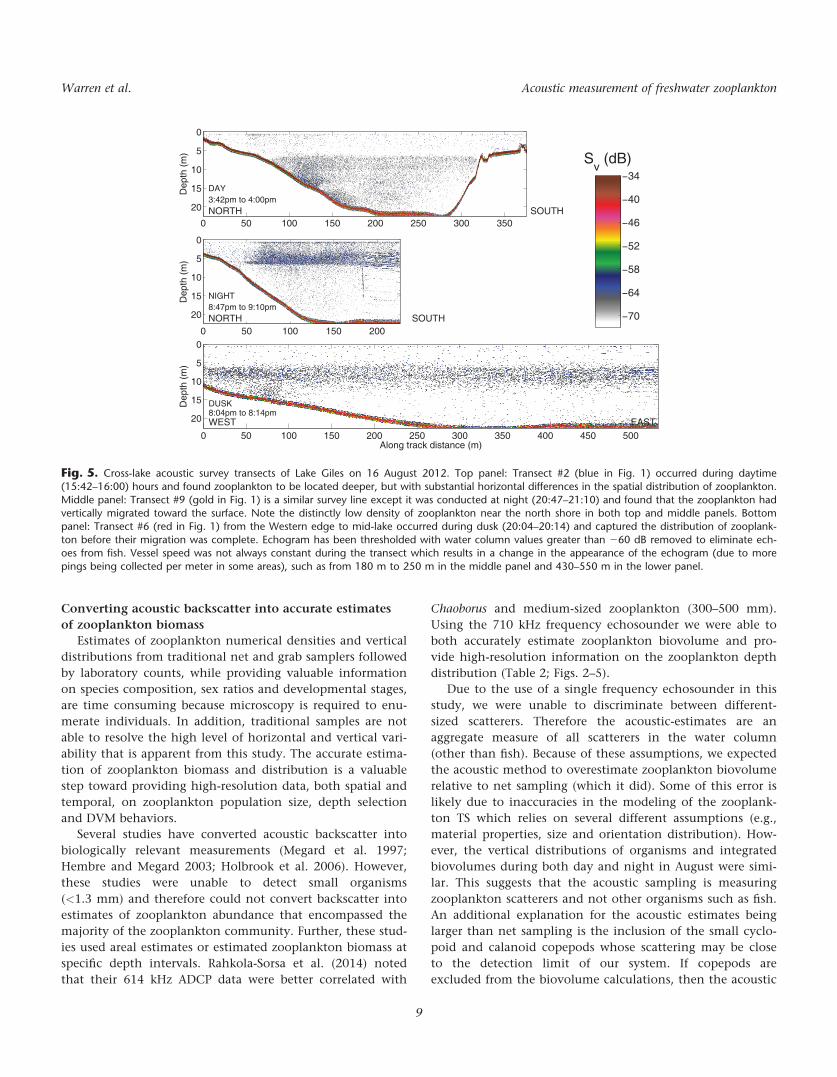
between depths greater than 7 m and a few meters above the
bottom during the day, although there were some zooplank-
ton that remained at or near the surface during these hours
(Fig. 5). There was also substantial variation in horizontal
distribution with more zooplankton found on the northern
side of the lake basin. At night, a portion of this transect was
resurveyed (Fig. 5) which found that the vertical distribution
of zooplankton had changed with most individuals now
being found concentrated in two layers: one between 4 m
and 7 m and another layer near the surface.
During both day and night sampling of this transect,
there was a marked decrease in zooplankton abundance near
the edges of the lake (when bottom depths were shallower
than approximately 7 m). This shore avoidance by pelagic
zooplankton has been well-documented (Siebeck 1969) and
is thought to be the result of predator avoidance near-shore
(Gliwicz and Rykowska 1992). Our data further suggest that
the observed shore-avoidance may also be the result of the
zooplankton movements being concentrated in the vertical
rather than the horizontal dimension. In order for zooplank-
ton to take advantage of a deep refuge from daytime visual
predation they must be positioned in portions of the lake
where depths exceed the attenuation of light, whether it be
low levels of visible light to avoid visual predators, or low
levels of UV radiation to avoid the negative effects of UV
damage. At night, upward migration would cause them to
remain concentrated in the deeper areas of the lake.
An additional cross-lake transect running east to west was
surveyed at dusk (Fig. 5). The spatial distribution of zoo-
plankton was similar to that of the north-south transect
with zooplankton being concentrated from 4 m to 7 m, as
well as in a thin layer near the surface. This transect ended
before water depths were as shallow as in the other night
time transect, but these data suggest that night-time distri-
butions, while influenced by bathymetry, are isotropic. This
is in contrast to the day-time transect data which showed a
latitudinal gradient in zooplankton distribution at depth.
Possible explanations for this gradient could be differences
in light penetration or water clarity, physical mixing proc-
esses, or spatially variable predation pressure.
These data show that high frequency acoustics allow for
three-dimensional synoptic sampling of zooplankton distri-
bution and abundances in small lakes. Vertical distributions
of zooplankton measured acoustically were very similar to
those collected by stratified net tows, although some of the
discrepancies in the two methods may be due to the higher
vertical resolution of the acoustic sampling. Vertically inte-
grated biovolume estimates for both day and night sampling
periods were very similar (within 10%) from the acoustic
and net tow samplings. Sampling coverage in this study was
limited by vessel speed (rowing), time required for net and
hydrographic sampling, and battery (and personnel)
Fig. 2. Acoustic backscatter data collected during the dusk to night
transition on 17 June. Rapid changes in the vertical distribution of organ-isms in the water column can easily be seen as deep organisms moveupward and darkness increases. Note the distinct layer of zooplankton in
the epilimnion (between 1 m and 5 m depth) that remained in thenear-surface waters throughout this period. The red in the echogram
represents the lake bottom, white represents very little (or no) backscat-ter, blues, greens, yellows, and red correspond to increasingly strongbackscatter. Echogram has been thresholded with water column values
greater than 260 dB removed to eliminate echoes from fish. The darkblue layer just above the red bottom could be scattering from a soft,
muddy bottom, or from a dense layer of zooplankton concentrated onthe bottom. The surface nearfield region where no valid acoustic dataare collected is shown in white.
0 0.5 1 1.5
0
5
10
15
20
Dep
th (m
)
Early Dusk
21:03 21:11
Total # of animals =
10.6 x 10 6 m 2
0 0.5 1 1.5
0
5
10
15
20
Zooplankton numerical density (# m 3 * 10 6)
Dep
th (m
)
Migration
21:13 21:23
Total # of animals =
9.9 x 10 6 m 2
0 0.5 1 1.5
0
5
10
15
20
Dep
th (m
)
Late Dusk
21:28 21:35
Total # of animals =
9.5 x 10 6 m 2
Fig. 3. Vertical distribution of acoustically measured zooplankton (com-bined Daphnia, calanoid copepods, and cyclopoid copepods) numericaldensities in the water column sampled on 17 June 2012 averaged over
three different local time periods: early dusk (21:03–21:11), peak migra-tion (21:13–21:23), and late night (21:28–21:35). Vertically integrated
zooplankton abundance totals for the water column for the three peri-ods are within 10% of each other, and the decrease in abundance withtime may be due to animals moving into the near-surface layer which is
not sampled acoustically.
Warren et al. Acoustic measurement of freshwater zooplankton
7

limitations. But it is certainly possible for a two-person team
to provide comprehensive descriptions of the zooplankton
distribution for a lake this size within a few hours, and to
repeat these surveys for daytime, nighttime, and transition
periods to investigate a variety of different ecosystem proc-
esses. Whether this is truly a synoptic measure will depend
on the movements of the animals (either vertically or hori-
zontally) during the sampling period. During day and night
conditions, lake-wide surveys would be synoptic (assuming
that horizontal movements of the zooplankton are much
smaller than that of the moving vessel), however the time
frame of diel vertical migration events (�1 h) are shorter
than the lake-wide survey duration so care must be taken
when sampling near dawn or dusk. If we assume zooplank-
ton vertical velocities during migration events (�20 m h21)
are similar to their potential horizontal movement, our sam-
pling vessel is moving several orders of magnitude faster
(�3000 m h21) suggesting that aliasing from the movement
of zooplankton themselves is not a large issue. However
under certain weather conditions, horizontal advective
movements of zooplankton may be much faster.
Discussion
Resolving small zooplankton using acoustic sampling
The acoustic survey data from the high frequency
(710 kHz) echosounder was able to measure the distribution
of small zooplankton including Daphnia (1 mm length) and
small copepods (0.5 mm length), which exhibited different
DVM behaviors and daytime depth selection. Previous acous-
tic work in freshwater lakes using frequencies from 192 kHz
to 200 kHz were unable to detect backscatterers smaller than
1.3 mm in length (Trevorrow and Tanaka 1997; Hembre and
Megard 2003; Knudsen et al. 2006). Using a 1.3 mm length
cutoff for the zooplankton community in our study system,
we would detect only 20% of the Daphnia and none of the
cyclopoid or calanoid copepod populations. Thus, a lower
frequency instrument would miss � 90% of the zooplankton
biomass in our study lake, or would only detect dense aggre-
gations of organisms, making distribution and biomass esti-
mates inaccurate. Lower frequency instruments (200 kHz or
lower) have been used to detect the movement of Chaoborus
(Haney et al. 1990; Knudsen et al. 2006), but these are larger
organisms (�1 cm) that possess air chambers that act as
strong scatterers and make them much easier to detect at
low frequencies.
In the past, marine biologists have used higher frequency
acoustics to resolve small zooplankton. Most notable is the
study of Roman et al. (2001) where the authors were able to
resolve small copepods (down to 0.225 mm in length) using
a six frequency system with 285 kHz, 420 kHz, 700 kHz,
1100 kHz, 1850 kHz, and 3000 kHz channels in the
Chesapeake Bay. This study provided accurate vertical distri-
bution of the zooplankton community including very small
zooplankton in relation to several biogeochemical and physi-
cal parameters. While this study had similar fine-scale resolu-
tion in the vertical dimension (cm-scale), the vertical
information is the result of vertical casts of the instrument
through the water column. Therefore the horizontal resolu-
tion of their data was quite coarse, consisting of 11 vertical
profiles over a range of 70 km. While the higher frequencies
of this system are better at detecting very small zooplankton,
these MHz (and greater) frequencies have limited range and
are not capable of collecting fine-scale horizontal data from
surveys of larger areas, as we were able to do in this study.
0 0.5 1 1.5 2 2.5 3 3.5 4
0
2
4
6
8
10
12
14
16
18
20
22
Dep
th (
m)
Acoustic Biovolume (ml/m 3) [16 August]
0 0.5 1 1.5 2 2.5 3 3.5 40
2
4
6
8
10
12
14
16
18
20
22
Dep
th (
m)
Net Biovolume (ml/m 3) [14 August]
Day
A
B
Fig. 4. Vertical distributions of zooplankton biovolume during day(left) and night (right) measured with stratified vertical net tows (red;
day samples were collected from 12:00 to 13:00 on 14 August andnight samples from 23:55 to 01:12 on 16–17 August) and acousticbackscatter (black; day; 16:51–16:54 and night; 21:42–21:52: 16
August). The higher resolution of the acoustic data is evident and sug-gests that high abundance layers of lake zooplankton can be very thin,a feature that is missed by the integrative vertical net tow sampling.
Warren et al. Acoustic measurement of freshwater zooplankton
8
Converting acoustic backscatter into accurate estimates
of zooplankton biomass
Estimates of zooplankton numerical densities and vertical
distributions from traditional net and grab samplers followed
by laboratory counts, while providing valuable information
on species composition, sex ratios and developmental stages,
are time consuming because microscopy is required to enu-
merate individuals. In addition, traditional samples are not
able to resolve the high level of horizontal and vertical vari-
ability that is apparent from this study. The accurate estima-
tion of zooplankton biomass and distribution is a valuable
step toward providing high-resolution data, both spatial and
temporal, on zooplankton population size, depth selection
and DVM behaviors.
Several studies have converted acoustic backscatter into
biologically relevant measurements (Megard et al. 1997;
Hembre and Megard 2003; Holbrook et al. 2006). However,
these studies were unable to detect small organisms
(<1.3 mm) and therefore could not convert backscatter into
estimates of zooplankton abundance that encompassed the
majority of the zooplankton community. Further, these stud-
ies used areal estimates or estimated zooplankton biomass at
specific depth intervals. Rahkola-Sorsa et al. (2014) noted
that their 614 kHz ADCP data were better correlated with
Chaoborus and medium-sized zooplankton (300–500 mm).
Using the 710 kHz frequency echosounder we were able to
both accurately estimate zooplankton biovolume and pro-
vide high-resolution information on the zooplankton depth
distribution (Table 2; Figs. 2–5).
Due to the use of a single frequency echosounder in this
study, we were unable to discriminate between different-
sized scatterers. Therefore the acoustic-estimates are an
aggregate measure of all scatterers in the water column
(other than fish). Because of these assumptions, we expected
the acoustic method to overestimate zooplankton biovolume
relative to net sampling (which it did). Some of this error is
likely due to inaccuracies in the modeling of the zooplank-
ton TS which relies on several different assumptions (e.g.,
material properties, size and orientation distribution). How-
ever, the vertical distributions of organisms and integrated
biovolumes during both day and night in August were simi-
lar. This suggests that the acoustic sampling is measuring
zooplankton scatterers and not other organisms such as fish.
An additional explanation for the acoustic estimates being
larger than net sampling is the inclusion of the small cyclo-
poid and calanoid copepods whose scattering may be close
to the detection limit of our system. If copepods are
excluded from the biovolume calculations, then the acoustic
Fig. 5. Cross-lake acoustic survey transects of Lake Giles on 16 August 2012. Top panel: Transect #2 (blue in Fig. 1) occurred during daytime(15:42–16:00) hours and found zooplankton to be located deeper, but with substantial horizontal differences in the spatial distribution of zooplankton.
Middle panel: Transect #9 (gold in Fig. 1) is a similar survey line except it was conducted at night (20:47–21:10) and found that the zooplankton hadvertically migrated toward the surface. Note the distinctly low density of zooplankton near the north shore in both top and middle panels. Bottompanel: Transect #6 (red in Fig. 1) from the Western edge to mid-lake occurred during dusk (20:04–20:14) and captured the distribution of zooplank-
ton before their migration was complete. Echogram has been thresholded with water column values greater than 260 dB removed to eliminate ech-oes from fish. Vessel speed was not always constant during the transect which results in a change in the appearance of the echogram (due to more
pings being collected per meter in some areas), such as from 180 m to 250 m in the middle panel and 430–550 m in the lower panel.
Warren et al. Acoustic measurement of freshwater zooplankton
9
estimates of biovolume will decrease by 1/4 to 1/3, making
them smaller than the net tow results. This suggests that we
are effectively sampling the small zooplankton (0.5–1.5 mm
in length) in this lake. Further work in determining the scat-
tering characteristics of these small copepods at 710 kHz is
needed.
Direct observations of upward migration events of small
zooplankton and calculation of in situ vertical velocity of
zooplankton
One distinct advantage of acoustic sampling is the signifi-
cant increase in the number of measurements made in a
given time period relative to stratified net tows. For instance,
the full water column net sampling that occurred in August
took roughly 75 min to collect two vertical profiles (one
from each bongo net) with 10 points per profile with a
depth resolution of 2 m over the 20 m sampling range. In
this same time period, the acoustic system collected 4500
replicate vertical profiles with 425 points per profile with a
depth resolution of 5 cm. This increased sampling allows
acoustic measurements to better characterize the environ-
ment, particularly for patchily-distributed organisms, or
dynamic processes or environments.
Swimming speeds for Daphnia have been measured from
0.5 cm s21 to 1.0 cm s21 (this study and O’Keefe et al. 1998,
respectively). Using a conservative swimming speed of
0.5 cm s21, we estimate that Daphnia could swim more than
the entire depth of the water column (over 22 m) during the
course of the 75-min sampling period required for the tradi-
tional net tows. Wong et al. (1986) measured average swim-
ming speeds of L. minutus in 18–208C water as 0.86 mm/s. At
these speeds L. minutus could migrate 3.8 m during the 75
min required to net sampling. While a much smaller dis-
tance than estimated for Daphnia, it is important to note
that L. minutus are generally found in the epilimnion of our
study lake, show smaller migration amplitudes, weaker
migration behavior and that this distance still exceeds the
resolution of most net sampling. Given the estimates of pos-
sible migration amplitudes we can conclude that any
attempt at real-time observation of vertical migration with
traditional net tows may be inaccurate or misleading.
High resolution observations of the vertical and
horizontal heterogeneity of zooplankton densities
Net or other integrative sampling methods can obscure
fine-scale variation in zooplankton depth selection as evi-
denced by the thin, high-density layers of scatterers observed
in this study (Fig. 3). We know that zooplankton are capable
of detecting and responding to subtle biotic and abiotic cues
including light (Smith and Macagno 1990; Storz and Paul
1998), temperature (Kessler and Lampert 2004) and fish kair-
omones (Dodson 1988; De Meester 1993) suggesting that
current sampling methods are still orders of magnitude
coarser than necessary to understand critical issues of the
spatial and temporal distribution. Increased resolution of the
vertical habitat selection of the zooplankton, coupled with
high resolution data of temperature, dissolved oxygen, light
or chlorophyll a concentrations will allow for in situ obser-
vation of these subtle responses on a scale that has not been
reported in other freshwater studies, but have been observed
in marine studies (Benoit-Bird et al. 2010; Moline et al.
2010).
Spatial heterogeneity of zooplankton is a commonly
reported phenomenon (De Stasio 1989; Tessier and Horwitz
1990) and patchiness or horizontal movement in response to
biotic cues such as vertebrate predation pressure or the pres-
ence of floating and submerged plants (Masson et al. 2001;
Castro et al. 2007) has been well documented. However, it is
difficult and labor-intensive to examine horizontal move-
ment or patchiness with traditional sampling methods at the
whole lake scale so few studies exist. Organisms can also
move substantial distances during the time required to sam-
ple horizontal distributions. For example, De Stasio (1989)
reported that horizontal sampling at four locations along
two offshore to nearshore transects took approximately 2 h
to complete. At the swimming velocities that we have esti-
mated here, that is more than enough time for zooplankton
to traverse the entire water column as well as move a similar
horizontal distance.
Differences in total zooplankton biomass between day
and night samples are commonly reported (Tessier 1983;
De Stasio 1993), however we observed similar biomass esti-
mates from day to night in August (Table 2; Fig. 3). This pat-
tern is consistent with a more in-depth analysis that we
have performed in Lakes Giles on these so-called diel deficits
as well as with both our net and acoustic data. Others have
suggested that these deficits may be caused by horizontal
migration that is driven by active predator avoidance, pas-
sive convection-driven movements or a combination of the
two (Masson et al. 2001; Armengol et al. 2012). The acoustic
technology provides the ability to examine horizontal distri-
bution and diel horizontal movement of zooplankton, which
is a potentially important ecological phenomena that has
not been examined in depth and is thus not well
understood.
Comments and recommendations
Fine-scale distribution and abundance of small zooplank-
ton were measured using a high frequency acoustic
echosounder. While the sampling platform (small rowboat)
used did not allow for full synoptic coverage of the lake,
information on rapid changes in the diel vertical migration
of zooplankton were observed while the vessel was stationary
and information about the horizontal distribution of the
organisms was collected during survey transects. Given that
the boat was human-powered, there is some difficulty in
resolving whether the differences observed spatially are a
function of temporal changes (as the survey occurred) or
Warren et al. Acoustic measurement of freshwater zooplankton
10
spatial changes. Weather conditions were favorable during
the sampling with a relatively flat-water surface, which sug-
gests that wind-driven circulation was unlikely to be advect-
ing the zooplankton within the lake. Studies which seek to
use acoustics to map spatial distributions of zooplankton may
need to be limited to time periods (mid-day and night) when
the vertical movement of the organisms is thought to be
small. During the DVM transition periods, it may be necessary
to collect acoustic data from a fixed location to properly sam-
ple the environment without the risk of aliasing errors. That
is, a mobile platform measuring organisms that are also mov-
ing runs the risk of multiple-counting or missing individuals
depending on the relative scales and directions of the move-
ments of the survey platform and organisms.
Using only a single frequency makes it very challenging
to differentiate between different types of zooplankton,
unless they are spatially or behaviorally segregated. It is
important to collect direct samples of the zooplankton dur-
ing acoustic studies in lakes, as these data are necessary to
accurately convert acoustic data into biological measures
(e.g., numerical densities or biovolume) and to provide a pri-
ori information in interpreting the acoustic data. In terms of
biovolume estimates, a 10% increase in the mean length of
the zooplankton produced a roughly 25% increase in the
integrated acoustically measured biovolume. Given that dra-
matic changes can occur in acoustically derived biovolume
estimates, careful consideration must be given to potential
sources of error when using acoustic data for quantitative or
absolute measures of zooplankton biovolume. Relative or
qualitative differences can be derived from the acoustic data
with much more confidence in their accuracy. So, if acoustic
data are to be used as a quantitative measure, then direct
sampling of taxa, size and shape, and material properties of
the organisms also need to be conducted. We used density
and sound speed contrasts in our scattering model from
studies of marine zooplankton. The validity of using these
measurements for freshwater organisms is a critical assump-
tion of this study that needs to be further tested by making
material property measurements on freshwater zooplankton.
Despite the above limitations, acoustic surveys in lake
ecosystems provide a unique tool to measure and observe
the ecology of zooplankton with a resolution in space and
time that no other technique can provide. The increased spa-
tial and temporal resolution can improve our understanding
of both biotic and abiotic factors that drive zooplankton
habitat use and thus important trophic interactions within
freshwater ecosystems. For example, near-shore to off-shore
gradients in young of the year fish and invertebrate preda-
tors may influence horizontal movements and distribution
of zooplankton at a whole lake scale, while short-term
changes in the underwater light environment caused by
cloud cover or turbidity pulses may influence vertical depth
distributions. Further, many recent advances in our under-
standing of freshwater environments have been driven by
the use of high-frequency and high-resolution sensors (e.g.,
Staehr et al. 2010; Jennings et al. 2012).
While we have learned a great deal from these studies it
has been challenging to link our fine-scale understanding of
physical processes or the ecology of producers to the ecology
of consumers, such as zooplankton, due to the limited reso-
lution and frequency of manual zooplankton sampling. The
high resolution (vertically, horizontally, and temporally) and
increased spatial area sampled by acoustic methods can pro-
vide this critical link and increase our understanding of the
effects of a broad range of environmental changes such as
eutrophication, invasive species, episodic events such as
wildfires or extreme precipitation events, or parasite epidem-
ics that may cause important but subtle or short-lived
changes in zooplankton habitat use or migration behavior.
References
Adrian, R., and others. 2009. Lakes as sentinels of climate
change. Limnol. Oceanogr. 54: 2283. doi:10.4319/
lo.2009.54.6_part_2.2283
Armengol, X., W. A. Wurtsbaugh, A. Camacho, and M. R.
Miracle. 2012. Pseudo-diel vertical migration in zooplank-
ton: A whole-lake 15N tracer experiment. J. Plankton Res.
34: 976–986. doi:10.1093/plankt/fbs058
Benoit-Bird, K. J., M. A. Moline, C. M. Waluk, and I. C.
Robbins. 2010. Integrated measurements of acoustical and
optical thin layers I: Vertical scales of association. Cont.
Shelf Res. 30: 17–28. doi:10.1016/j.csr.2009.08.001
Castro, B. B., S. M. Marques, and F. Goncalves. 2007. Habitat
selection and diel distribution of the crustacean zooplank-
ton from a shallow Mediterranean lake during the turbid
and clear water phases. Freshw. Biol. 52: 421–433. doi:
10.1111/j.1365-2427.2006.01717.x
Chu, D., P. H. Wiebe, and N. Copley. 2000. Inference of
material properties of zooplankton from acoustic and
resistivity measurements. ICES J. Mar. Sci. 57: 1128–1142.
doi:10.1006/jmsc.2000.0800
Colbourne, J. K., and others. 2011. The ecoresponsive
genome of Daphnia pulex. Science 331: 555–561. doi:
10.1126/science.1197761
de Meester, L., and H. J. Dumont. 1989. Phototaxis in Daph-
nia: Interaction of hunger and genotype. Limnol. Ocean-
ogr. 34: 1322–1325. doi:10.4319/lo.1989.34.7.1322
De Stasio, B. T. 1989. The seed bank of a freshwater crusta-
cean: Copepodology for the plant ecologist. Ecology. 70:
1377–1389. doi:10.2307/1938197
De Stasio, B. T. 1993. Diel vertical and horizontal migration
by zooplankton: Population budgets and the diurnal defi-
cit. Bull. Mar. Sci. 53: 44–44. doi:10.2307/1938197
Dodson, S. I. 1988. The ecological role of chemical stimuli
for the zooplankton: Predator-avoidance behavior in
Daphnia. Limnol. Oceanogr. 33: 1431–1439. doi:10.4319/
lo.1988.33.6_part_2.1431
Warren et al. Acoustic measurement of freshwater zooplankton
11
Fischer, J. M., J. L. Nicolia, C. E. Williamson, A. D. Persaud,
and R. S. Lockwood. 2006. Effects of ultraviolet radiation
on diel vertical migration of crustacean zooplankton: An
in situ mesocosm experiment. Hydrobiologia 563: 217–
224. doi:10.1007/s10750-005-0007-x
Foote, K. G., H. P. Knudsen, G. Vestnes, D. N. MacLennan,
and E. J. Sirnrnonds. 1987. Calibration of acoustic instru-
ments for fish density estimation: A practical guide. ICES
Coop. Res. Rep. 144, 69 pp.
Foote, K. F., and T. K. Stanton. 2000. Acoustical methods. In
R. P. Harris, P. H. Wiebe, J. Lenz, H. R. Skjodal and M.
Huntley [eds.], ICES zooplankton methodology manual.
Academic Press.
Gliwicz, Z. M., and A. Rykowska. 1992. “Shore avoidance” in
zooplankton: A predator-induced behavior or predator-
induced mortality? J. Plankton Res. 14: 1331–1342. doi:
10.1093/plankt/14.9.1331
Haney, J. F., A. Craggy, K. Kimball, and F. Weeks. 1990.
Light control of evening vertical migrations by Chaoborus
punctipennis larvae. Limnol. Oceanogr. 35: 1068–1078.
doi:10.4319/lo.1990.35.5.1068
Hembre, L. K., and R. O. Megard. 2003. Seasonal and diel patchi-
ness of a Daphnia population: An acoustic analysis. Limnol.
Oceanogr. 48: 2221–2233. doi:10.4319/lo.2003.48.6.2221
Holbrook, B. V., T. R. Hrabik, D. K. Branstrator, D. L. Yule, and J.
D. Stockwell. 2006. Hydroacoustic estimation of zooplankton
biomass at two shoal complexes in the Apostle Islands region
of Lake Superior. J. Great Lakes Res. 32: 680–696. doi:
10.3394/0380-1330(2006)32[680:HEOZBA]2.0.CO;2
Holliday, D. V., and R. E. Pieper. 1995. Bioacoustical
oceanography at high frequencies. ICES J. Mar. Sci. 52:
279–296. doi:10.1016/1054-3139(95)80044-1
Hutchinson, G. E. 1967. Introduction to lake biology and
the limnoplankton, 1115 p. In A treatise on limnology, v.
2. Wiley.
Jankowski, T., D. M. Livingstone, H. B€uhrer, R. Forster, and
P. Niederhauser. 2006. Consequences of the 2003 Euro-
pean heat wave for lake temperature profiles, thermal sta-
bility, and hypolimnetic oxygen depletion: Implications
for a warmer world. Limnol. Oceanogr. 51: 815–819. doi:
10.4319/lo.2006.51.2.0815
Jennings, E., and others. 2012. Effects of weather-related epi-
sodic events in lakes: An analysis based on high-
frequency data. Freshw. Biol. 57: 589–601. doi:10.1111/
j.1365-2427.2011.02729.x
Johnsen, G. H., and P. J. Jakobsen. 1987. The effects of food limi-
tation on the vertical migration of Daphnia longispina. Lim-
nol. Oceanogr. 32: 873–880. doi:10.4319/lo.1987.32.4.0873
Jurvelius, J., and others. 2008. Echo-sounding can discriminate
between fish and macroinvertebrates in fresh water. Freshw.
Biol. 53: 912–923. doi:10.1111/j.1365-2427.2007.01944.x
Kessler, K., and W. Lampert. 2004. Fitness optimization of
Daphnia in a trade-off between food and temperature.
Oecologia 140: 381–387. doi:10.1007/s00442-004-1592-5
Knudsen, F. R., P. Larsson, and P. J. Jakobsen. 2006. Acoustic
scattering from a larval insect (Chaoborus flavicans) at six
echosounder frequencies: Implication for acoustic esti-
mates of fish abundance. Fish. Res. 79: 84–89. doi:
10.1016/j.fishres.2005.11.024
Kubecka, J., J. Frouzov�a, M. Cech, J. Peterka, H. A. Ketelaars,
A. J. Wagenwoort, and M. Pap�acek. 2000. Hydroacoustic
assessment of pelagic stages of freshwater insects. Aquat.
Living Resour. 13: 361–366. doi:10.1016/S0990-
7440(00)01086-X
Lampert, W. 2011. Daphnia: Development of a model orga-
nism in ecology and evolution. In O. Kinne [ed.], Excel-
lence in ecology, Book 21. International Ecology Institute.
Leech, D. M., C. E. Williamson, R. E Moeller, and B. R.
Hargreaves. 2005. Effects of ultraviolet radiation on the
seasonal vertical distribution of zooplankton: A database
analysis. Arch. Hydrobiol. 162: 445–464. doi:10.1127/
0003-9136/2005/0162-0445
Lorke, A., D. F. McGinnis, P. Spaak, and A. Wueest. 2004.
Acoustic observations of zooplankton in lakes using a
Doppler current profiler. Freshw. Biol. 49: 1280–1292.
doi:10.1111/j.1365-2427.2004.01267.x
Lynch, J. F., J. D. Irish, T. F. Gross, P. L. Wiberg, A. E.
Newhall, P. A. Traykovski, and J. D. Warren. 1997. Acous-
tic measurements of the spatial and temporal structure of
the near-bottom boundary layer in the 1990-1991 STRESS
experiment. Cont. Shelf Res. 17: 1271–1295. doi:10.1016/
S0278-4343(97)00012-5
Manca, M., and W. R. DeMott. 2009. Response of the inver-
tebrate predator Bythotrephes to a climate-linked
increase in the duration of a refuge from fish predation.
Limnol. Oceanogr. 54: 2506–2512. doi:10.4319/
lo.2009.54.6_part_2.2506
Masson, S., N. Angeli, J. Guillard, and B. Pinel-Alloul. 2001.
Diel vertical and horizontal distribution of crustacean
zooplankton and young of the year fish in a sub-alpine
lake: An approach based on high frequency sampling. J.
Plankton Res. 23: 1041–1060. doi:10.1093/plankt/
23.10.1041
McGehee, D. E., R. L. O’Driscoll, and L. M. Traykovski. 1998.
Effects of orientation on acoustic scattering from Antarc-
tic krill at 120 kHz. Deep-Sea Res. Part II 45: 1273–1294.
doi:10.1016/S0967-0645(98)00036-8
McNaught, D. C. 1969. Developments in acoustic plankton
sampling, v. 1969, p. 61–68. In Proceedings of the 12th
Conference on Great Lakes Research.
Megard, R. O., M. M. Kuns, M. C. Whiteside, and J. A.
Downing. 1997. Spatial distribution of zooplankton dur-
ing coastal upwelling in Western Lake Superior. Limnol.
Oceanogr. 42: 827–840. doi:10.4319/lo.1997.42.5.0827
Melnik, N. G., O. A. Timoshkin, B. G. Sideleva, S. V.
Pushkin, and V. S. Mamylov. 1993. Hydroacoustic mea-
surement of the density of the Baikal macrozooplankter
Warren et al. Acoustic measurement of freshwater zooplankton
12
Macrohectopus branickii. Limnol. Oceanogr. 38: 425–434.
doi:10.4319/lo.1993.38.2.0425
Moline, M. A., K. J. Benoit-Bird, I. C. Robbins, M. Schroth-
Miller, C. M. Waluk, and B. Zelenke. 2010. Integrated
measurements of acoustical and optical thin layers II:
Horizontal length scales. Cont. Shelf Res. 30: 29–38. doi:
10.1016/j.csr.2009.08.004
Neill, W. E. 1990. Induced vertical migration in copepods as
a defence against invertebrate predation. Nature 345:
524–526. doi:10.1038/345524a0
Nesbitt, L. M., H. P. Riessen, and C. W. Ramcharan. 1996.
Opposing predation pressures and induced vertical migra-
tion responses in Daphnia. Limnol. Oceanogr. 41: 1306–
1311. doi:10.4319/lo.1996.41.6.1306
Northcote, T. G. 1964. Use of a high-frequency echo sounder
to record distribution and migration of Chaoborus larvae.
Limnol. Oceanogr. 9: 87–91. doi:10.4319/lo.1964.9.1.0087
O’Keefe, T. C., M. C. Brewer, and S. I. Dodson. 1998. Swim-
ming behavior of Daphnia: Its role in determining preda-
tion risk. J. Plankton Res. 20: 973–984. doi:10.1093/
plankt/20.5.973
Pangle, K. L., and S. D. Peacor. 2010. Temperature gradients,
not food resource gradients, affect growth rate of migrat-
ing Daphnia mendotae in Lake Michigan. J. Great Lakes
Res. 36: 345–350. doi:10.1016/j.jglr.2010.01.005
Parks, S. E., J. D. Warren, K. Stamieszkin, C. A. Mayo, and D.
Wiley. 2011. Dangerous dining: Surface foraging of North
Atlantic right whales increases risk of vessel collisions.
Biol. Lett. doi:10.1098/rsbl.2011.0578. Available from
http://rsbl.royalsocietypublishing.org/content/early/2011/
08/02/rsbl.2011.0578.short
Rahkola-Sorsa, M., A. Voutilainen, and M. Viljanen. 2014.
Intercalibration of an acoustic technique, two optical
ones, and a simple seston dry mass method for freshwater
zooplankton sampling. Limnol. Oceanogr.: Methods 12:
102–113. doi:10.4319/lom.2014.12.102
Ressler, P. H., A. DeRobertis, J. D. Warren, J. N. Smith, and S.
Kotwicki. 2012. Developing an acoustic survey of euphau-
siids to understand trophic interactions in the Bering Sea
ecosystem. Deep-Sea Res. II. 65–70: 184–195. doi:10.1016/
j.dsr2.2012.02.015
Roman, M. R., D. V. Holliday, and L. P. Sanford. 2001. Tem-
poral and spatial patterns of zooplankton in the Chesa-
peake Bay turbidity maximum. Mar. Ecol. Prog. Ser. 213:
215–227. doi:10.3354/meps213215
Rudstam, L. G., and others. 2008. Hydroacoustic measures of
Mysis relicta abundance and distribution in Lake Ontario.
Aquat. Ecosyst. Health Manag. 11: 355–367. doi:10.1080/
14634980802539708
Schindler, D. W. 1969. Two useful devices for vertical plank-
ton and water sampling. J. Fish. Board Can. 26: 1948–
1955. doi:10.1139/f69-181
Schulze, P. C., H. E. Zagarese, and C. E. Williamson. 1995.
Competition between crustacean zooplankton in continu-
ous cultures. Limnol. Oceanogr. 40: 33–45. doi:10.4319/
lo.1995.40.1.0033
Shiraishi, Y. 1960. The fisheries biology and population
dynamics of pond-smelt, Hypomesus olidus (Pallas) (In Jap-
anese with English synopsis). Bull. Freshw. Fish. Res. Lab.
10: 1–263.
Siebeck, O. 1969. Spatial orientation of planktonic crusta-
ceans 1. Swimming behavior in the horizontal plane.
Verh. Int. Ver. Limno. 17: 831–840.
Simmonds, E. J., and D. N. MacLennan. 2005. Fisheries
acoustics: Theory and practice, 2nd ed. Blackwell Science.
Smith, K. C., and E. R. Macagno. 1990. UV photoreceptors
in the compound eye of Daphnia magna (Crustacea, Bran-
chiopoda). A fourth spectral class in single ommatidia. J.
Comp. Physiol. A 166: 597–606. doi:10.1007/BF00240009
Smith, J. N., P. H. Ressler, and J. D. Warren. 2013. A dis-
torted wave Born approximation target strength model
for Bering Sea euphausiids. ICES J. Mar. Sci. Journal du
Conseil. 70: 204–214. doi:10.1093/icesjms/fss140
Sprules, W. G., B. Bergstrom, H. Cyr, B. R. Hargreaves, and S.
S. Kilham. 1992. Non-video optical instruments for study-
ing zooplankton distribution and abundance. Ergebnisse
der Limnologie ERLIA 6,36.
Staehr, P., K. Sand-Jensen, A. Raun, B. Nilsson, and J.
Kidmose. 2010. Drivers of metabolism and net heterotro-
phy in contrasting lakes. Limnol. Oceanogr. 55: 817–830.
doi:10.4319/lo.2009.55.2.0817
Stanton, T. K., and D. Chu. 2000 Review and recommenda-
tions for the modeling of acoustic scattering by fluid-like
elongated zooplankton: Euphausiids and copepods. ICES
J. Mar. Sci. 57: 793–807. doi:10.1006/jmsc.1999.0517
Storz, U. C., and R. J. Paul. 1998. Phototaxis in water fleas
(Daphnia magna) is differently influenced by visible and
UV light. J. Comp. Physiol. A 183: 709–717. doi:10.1007/
s003590050293
Teraguchi, M., and T. G. Northcote. 1966. Vertical distribu-
tion and migration of Chaoborus flavicans larvae in Cor-
bett Lake, British Columbia. Limnol. Oceanogr. 11: 164–
176. doi:10.4319/lo.1966.11.2.0164
Tessier, A. J. 1983. Coherence and horizontal movements of
patches of Holopedium gibberum (Cladocera). Oecologia
60: 71–75. doi:10.1007/BF00379322
Tessier, A. J., and R. J. Horwitz. 1990. Influence of water chem-
istry on size structure of zooplankton assemblages. Can. J.
Fish. Aquat. Sci. 47: 1937–1943. doi:10.1139/f90-218
Trevorrow, M. V., and Y. Tanaka. 1997. Acoustic and in situ
measurements of freshwater amphipods (Jesogammarus
annandalei) in Lake Biwa, Japan. Limnol. Oceanogr. 42:
121–132. doi:10.4319/lo.1997.42.1.0121
Van Gool, E., and J. Ringelberg. 1998. Light induced migration
behavior of Daphnia modified by food and predator kairomones.
Anim. Behav. 56: 741–747. doi:10.1006/anbe.1998.0821
Vanderploeg, H. A., and others. 2009a. Hypoxic zones as
habitat for zooplankton in Lake Erie: Refuges from
Warren et al. Acoustic measurement of freshwater zooplankton
13
predation or exclusion zones? J. Exp. Mar. Biol. Ecol. 381:
S108–S120. doi:10.1016/j.jembe.2009.07.015
Vanderploeg, H. A., and others. 2009b. Hypoxia affects spa-
tial distributions and overlap of pelagic fish, zooplankton,
and phytoplankton in Lake Erie. J. Exp. Mar. Biol. Ecol.
381: S92–S107. doi:10.1016/j.jembe.2009.07.027
Wagner, C., and R. Adrian. 2011. Consequences of changes in
thermal regime for plankton diversity and trait composition
in a polymictic lake: A matter of temporal scale. Freshw. Biol.
56: 1949–1961. doi:10.1111/j.1365-2427.2011.02623.x
Warren, J. D., T. K. Stanton, P. H. Wiebe, and H. E. Seim.
2003. Inference of biological and physical parameters in
an internal wave using multiple-frequency, acoustic-scat-
tering data. ICES J. Mar. Sci. 60: 1033–1046. doi:10.1016/
S1054-3139(03)00121-8
Warren, J. D., and P. H. Wiebe. 2008. Accounting for biologi-
cal and physical sources of acoustic backscatter improves
estimates of zooplankton biomass. Can. J. Fish. Aquat.
Sci. 65: 1321–1333. doi:10.1139/F08-047
Warren, J. D., and D. A. Demer. 2010. Abundance and distri-
bution of Antarctic krill (Euphausia superba) nearshore of
Cape Shirreff, Livingston Island, Antarctica, during six
austral summers between 2000 and 2007. Can. J. Fish.
Aquat. Sci. 67: 1159–1170. doi:10.1139/F10-042
Watkins, J. L., and A. S. Brierley. 2002. Verification of acoustic
techniques used to identify and size Antarctic krill. ICES J.
Mar. Sci. 59: 1326–1336. doi:10.1006/jmsc.2002.1309
Wiebe, P. H., and M. C. Benfield. 2003. From the Hensen net
toward four-dimensional biological oceanography. Prog.
Oceanogr. 56: 7–136. doi:10.1016/S0079-6611(02)00140-4
Williamson, C. E., J. M. Fischer, S. M. Bollens, E. P.
Overholt, and J. K. Breckenridge. 2011. Toward a more
comprehensive theory of zooplankton diel vertical migra-
tion: Integrating ultraviolet radiation and water transpar-
ency into the biotic paradigm. Limnol. Oceanogr. 56:
1603–1623. doi:10.4319/lo.2011.56.5.1603
Winder, M., and D. E. Schindler. 2004. Climate change
uncouples trophic interactions in an aquatic ecosystem.
Ecology 85: 2100–2106. doi:10.1890/04-0151
Winder, M., P. Spaak, and W. M. Mooij. 2004. Trade-offs in
Daphnia habitat selection. Ecology 85: 2027–2036. doi:
10.1890/04-0151
Winder, M., D. E. Schindler, T. E. Essington, and A. H. Litt. 2009.
Disrupted seasonal clockwork in the population dynamics of
a freshwater copepod by climate warming. Limnol. Ocean-
ogr. 54: 2493. doi:10.4319/lo.2009.54.6_part_2.2493
Wong, C. K., C. W. Ramcharan, and W. G. Sprules. 1986.
Behavioral responses of a herbivorous calanoid copepod
to the presence of other zooplankton. Can. J. Zool. 64:
1422–1425. doi:10.1139/z86-212
Acknowledgment
Funding for this project was provided by NSF DEB IGERT Grant
#0903560. Matthew Meeks, Robert Rossi, and Janet Fischer assisted withthe fieldwork.
Submitted 28 October 2015
Revised 7 December 2015
Accepted 7 December 2015
Associate editor: Paul Kemp
Warren et al. Acoustic measurement of freshwater zooplankton
14