distribution and abundance of zooplankton in the north pacific subarctic frontal zone and
TRANSCRIPT
NOAA Technical Memorandum NMFS-AFSC-93
U.S. DEPARTMENT OF COMMERCENational Oceanic and Atmospheric Administration
National Marine Fisheries ServiceAlaska Fisheries Science Center
August 1998
byJ. M. Murphy, N. E. Maloney, and B. L. Wing
Distribution and Abundance ofZooplankton in the North PacificSubarctic Frontal Zone andAdjacent Water Masses

NOAA Technical Memorandum NMFS
The National Marine Fisheries Service’s Alaska Fisheries Science Center usesthe NOAA Technical Memorandum series to issue informal scientific andtechnical publications when complete formal review and editorial processingare not appropriate or feasible. Documents within this series reflect soundprofessional work and may be referenced in the formal scientific and technicalliterature.
The NMFS-AFSC Technical Memorandum series of the Alaska FisheriesScience Center continues the NMFS-F/NWC series established in 1970 by theNorthwest Fisheries Center. The new NMFS-NWFSC series will be used bythe Northwest Fisheries Science Center.
This document should be cited as follows:
Murphy, J. M., N. E. Maloney, and B. W. Wing. 1998. Distribution andabundance of zooplankton in the North Pacific Subarctic Frontal Zoneand adjacent water masses. U. S. Dep. Commer., NOAA Tech. Memo.NMFS-AFSC-93,31 p.
Reference in this document to trade names does not imply endorsement bythe National Marine Fisheries Service, NOAA.
August 1998
NOAA Technical Memorandum NMFS-AFSC-93
byJ. M. Murphy, N. E. Maloney, and B. L. Wing
Distribution and Abundance ofZooplankton in the North Pacific
Subarctic Frontal Zone andAdjacent Water Masses
Auke Bay LaboratoryAlaska Fisheries Science Center
11305 Glacier HighwayJuneau, AK 99801-8626
U.S. DEPARTMENT OF COMMERCEWilliam M. Daley, Secretary
National Oceanic and Atmospheric AdministrationD. James Baker, Under Secretary and Administrator
National Marine Fisheries ServiceRolland A. Schmitten, Assistant Administrator for Fisheries

This document is available to the public through:
National Technical Information ServiceNational Technical Information ServiceU.S. Department of CommerceU.S. Department of Commerce5285 Port Royal Road5285 Port Royal RoadSpringfield, VA 22181Springfield, VA 22181
www.ntis.gov

Notice to Users of this Document
This document is being made available in .PDF format for the convenience of users; however, the accuracy and correctness of the document can only be certified as was presented in the original hard copy format.


111
ABSTRACT
Zooplankton was collected from two depth strata (0-75 m and 75-150 m) withoblique tows of a Tucker trawl at 40 stations across the Subarctic Frontal Zone of theNorth Pacific Ocean and adjacent water masses in October and November 1989. Thirteentaxonomic groups were identified, and their vertical and spatial distributions werecompared and summarized by three water-mass types: 1) Subarctic Domain (SD), 2)Subarctic Frontal Zone (SAFZ), and 3) Transition Zone (TZ). Chaetognaths and mysidswere the only taxa that were more abundant in the deeper stratum, primarily due to theoverlapping distributions of the two predominant chaetognath species, Sagitta elegans andEukrohnia hamata, and the abundant deeper-dwelling mysid Euchaetomeropsis merolepisin our samples. Abundances of the predominant taxa (gastropods, polychaetes, ostracods,copepods, amphipods, euphausiids, and chaetognaths) were highest in the SD. Cirripedelarvae, decapod shrimp larvae, fish eggs, and squid larvae were most abundant in theSAFZ. Fish larvae and mysids were most abundant in the TZ. Mysids were found onlyin the SAFZ and the TZ. Overall, the most significant change in the zooplanktoncommunity occurred between the SD and the SAFZ.


V
CONTENTS
INTRODUCTION . . . . . . . . . . . . . . . . . . . . . . . . . . . . . . . . . . . . . . . . . . . . . 1
METHODS . . . . . . . . . . . . . . . . . . . . . . . . . . . . . . . . . . . . . . . . . . . . . . . . . . . 1Zooplankton Collection and Sample Processing . . . . . . . . . . . . . . . . . . . . . . 1Statistical Methods . . . . . . . . . . . . . . . . . . . . . . . . . . . . . . . . . . . . . . . . . 2
RESULTS . . . . . . . . . . . . . . . . . . . . . . . . . . . . . . . . . . . . . . . . . . . . . . . . . . . . 3Oceanographic Regions . . . . . . . . . . . . . . . . . . . . . . . . . . . . . . . . . . . . . . 3Dawn and Evening Effects . . . . . . . . . . . . . . . . . . . . . . . . . . . . . . . . . . . . 3Vertical Distribution . . . . . . . . . . . . . . . . . . . . . . . . . . . . . . . . . . . . . . . . 3Distribution by Oceanographic Region . . . . . . . . . . . . . . . . . . . . . . . . . . . . 3Community Ordination . . . . . . . . . . . . . . . . . . . . . . . . . . . . . . . . . . . . . . 4
DISCUSSION . . . . . . . . . . . . . . . . . . . . . . . . . . . . . . . . . . . . . . . . . . . . . . . . . 5
Vertical Distribution . . . . . . . . . . . . . . . . . . . . . . . . . . . . . . . . . . . . . . . . 5Distribution by Oceanographic Region . . . . . . . . . . . . . . . . . . . . . . . . . . . . 6
ACKNOWLEDGMENTS . . . . . . . . . . . . . . . . . . . . . . . . . . . . . . . . . . . . . . . . . 7
CITATIONS . . . . . . . . . . . . . . . . . . . . . . . . . . . . . . . . . . . . . . . . . . . . . . . . . . . 8
TABLES . . . . . . . . . . . . . . . . . . . . . . . . . . . . . . . . . . . . . . . . . . . . . . . . . . . . . 11
FIGURES . . . . . . . . . . . . . . . . . . . . . . . . . . . . . . . . . . . . . . . . . . . . . . . . . . . . 15
APPENDICES . . . . . . . . . . . . . . . . . . . . . . . . . . . . . . . . . . . . . . . . . . . . . . . . . 23


INTRODUCTION
Zooplankton is an important food source in the pelagic ecosystem of the NorthPacific Ocean and is the basis for seasonal feeding migrations of many pelagic nektonspecies (Shimazaki 1986). Hence, those who interpret the zoogeography and migratorystrategies of predators at higher trophic levels need to understand the distribution andabundance patterns of zooplankton. Because distribution and abundance of zooplanktonare often linked to primary production and mixing dynamics associated with differentwater-mass types (McGowan and Williams 1973, Miller et al. 1991), zooplankton can bean important link between water-mass type and zoogeography of pelagic nekton.
The Subarctic Frontal Zone (SAFZ)-a large-scale, semipermanent frontal regionseparating the Subarctic Domain (SD) and the Transition Zone (TZ) (Fig. 1)-is theprimary zoogeographic feature of the subarctic North Pacific Ocean. The SD is identifiedby its permanent halocline, which forms as a result of precipitation exceeding evaporation.The SD is typically bounded by the 33.0 and 33.8 isohalines (Roden and Robinson 1988).The SAFZ delineates the southern limit of the subarctic water mass and is identified bythe surfacing of the permanent halocline (Roden and Robinson 1988).
In this paper we examine zooplankton community structure in the SAFZ andadjacent water masses and quantify differences in these zooplankton communities.
METHODS
Zooplankton Collection and Sample Processing
Zooplankton was collected from 40 stations with a 0.5-mm mesh, l-m2 messenger-tripped Tucker trawl (Davies and Barham 1969) aboard the NOAA ship Miller Freemanalong five meridional transects during October and November 1989 (Fig. 2). The Tuckertrawl was equipped with General Oceanics Model 2030 flowmeters and a Benthos Model1170-E bathykymograph. Before each trawl, salinity and temperature profiles were takento 1,000 m with a Seabird Model 19 SEACAT mini-CTD (Wing et al. 1993).
Line speeds were set at 45-50 m min-1 during deployment and 30-35 m min-1
during retrieval. Wire angles were monitored with an inclinometer, and vessel speed(approximately 1.5 knots) was adjusted to maintain a 45° wire angle during retrieval.
Trawl samples were collected during the twilight periods after sunset (between1930 and 2130 hours) and around sunrise (between 0500 and 0830 hours). Full-daylighthours were devoted to visual census of marine mammals and seabirds and to hydroacousticsurveys of the deep-scattering layer. Evening samples were collected as the acousticscattering layer was rising, but before it started to disperse. Morning samples werecollected as the scattering layer began its descent and before there was light enough for avisual census of birds and mammals.
Three zooplankton samples were collected during each trawl deployment. The firstsample was taken during the descent of the trawl to 150 m, the second during the upwardoblique tow between 150 m and 75 m, and the third during the upward oblique towbetween 75 m and the surface. Volumes filtered for the stratified samples ranged from200 to over 700 m3. We chose the 0-75 m (shallow) and 75-150 m (deep) strata to most

2
effectively sample acoustic scattering layers observed during the cruise. Appendix 1summarizes the station information.
Samples were preserved in 4% formaldehyde solution buffered with sodiumtetraborate and transferred to alcohol after shipment to the Auke Bay Laboratory nearJuneau, Alaska. All samples were scanned for large or rare specimens such as squidlarvae, fish eggs, and fish larvae. Small samples were counted in entirety, and largersamples were split with a Folsom plankton splitter (McEwen et al. 1954). The fractionexamined ranged from 0.12 to 1.0. All samples were processed, but only samples fromthe 0-75 m and 75-150 m strata were included in this analysis. Thirteen taxa wereidentified and counted: gastropods, squid larvae, polychaetes, ostracods, copepods,cirripede larvae, amphipods, mysids, euphausiids, decapod shrimp larvae, chaetognaths,fish eggs, and fish larvae (Appendix 2). Gelatinous zooplankton species (e.g., medusa,siphonophores, ctenophores, heteropods, doliolids, salps, larvaceans) were not counted, dueto their colonial nature and their tendency for fragmentation, but were included in themeasurements of displacement volume for each sample. Appendix 3 contains qualitativeabundance levels of gelatinous zooplankton species.
Statistical Methods
Wilcoxon rank sum tests (Lehmann 1975) were used to test for significantdifferences’ between dawn and evening abundance at each depth stratum, and pairedWilcoxon rank sum tests were used to test whether zooplankton abundances differedsignificantly between the shallow and deep samples.
Average abundances and coefficients of variation for the 13 taxa were computedfor each oceanographic region. To test for significant differences between oceanographicregions, a Kruskal-Wallis rank sum test (Lehmann 1975) was used. The Kruskal test wasselected because of its ability to test for significant differences between multiple groups ofdata.
We computed coordinates for both species and station ordinations of thezooplankton community using principal component analysis (PCA). In species ordination,a sample is placed into a hyperspace with a dimension for each species. This hyperspaceis then rotated to find projections (components) that result in the least amount of spread(variability) in the data. In PCA, this is accomplished by partitioning a resemblancematrix into a set of orthogonal linear axes (components) that explain the greatest amountof variability (Pielou 1984, Ludwig and Reynolds 1988). We refer to the direction andmagnitude each axis is rotated in species hyperspace as the loading of the species, and therotation of an axis in station hyperspace as the scale (Statistical Sciences 1995). Theprincipal components were computed using a correlation matrix, and all computations werecompleted in the S-plus statistical language (Statistical Sciences 1995).
1p < 0.05, throughout this paper.

3
RESULTS
Oceanographic Regions
An obvious subsurface horizontal front was present in all transects and formed asthe permanent halocline began to surface (Fig. 3); however, the latitude where thepermanent halocline reached the surface depended on the strength of the seasonal haloclineand mesoscale frontal dynamics of the mixed layer. Stations with a permanent haloclinewere clearly cooler and less saline at 75 m depth than stations lacking a permanenthalocline (Fig. 4). This temperature and salinity property was used to separate the SDstations from the SAFZ stations.
Unlike Lynn (1986), we did not find an obvious gradient in the physical propertiesassociated with the southern limit of the SAFZ. Lacking this gradient, we used the 33.8(Practical Salinity Scale) isohaline to separate the SAFZ stations from the TZ stations.
Dawn and Evening Effects
No taxon differed significantly in abundance between dawn and evening samples(Table 1A). Hence, we pooled the data from the two periods in the subsequent analysis.
Vertical Distribution
All zooplankton taxa except chaetognaths and mysids were more abundant in theshallow stratum (Table 1B). However, not all taxa differed significantly. Abundances ofpolychaetes (Polychaeta), ostracods (Ostracoda), decapod shrimp (Decapoda)larvae, fish(Osteichthys) eggs, fish larvae, and squid (Cephalopoda) larvae did not differ significantlybetween the two depth strata (Table 1B). When each oceanographic region wasconsidered separately, most taxa also had higher abundances in the shallow stratum.However, abundances were higher in the deep stratum for chaetognaths in all regions; fordecapods, fish eggs, and fish larvae in the SD; and for mysids and ostracods in the SAFZ(Table 2).
Distribution by Oceanographic Region
The abundance of most taxa in both depth strata declined from north to south(Table 2). Chaetognaths were most abundant in the SD and least abundant in the TZ, andtheir abundances differed significantly in both depth strata. The low p-values forchaetognaths (0.002 and <0.00l) were largely due to the abrupt decline in their abundancebetween the SD and SAFZ. Amphipods were also more abundant in the SD and least inthe TZ, but their abundances differed significantly only in the shallow stratum.

4
Euphausiids and gastropods had the same pattern, but their abundances did not differsignificantly in either depth stratum.
Copepods were the most abundant zooplankton taxon, and in both depth strata theywere more abundant in the SD and least in the SAFZ. Their coefficients of variation weresimilar in each oceanographic region, but were highest in the SAFZ, indicating thatcopepod abundance was more variable in the SAFZ.
Squid larvae, cirripede larvae, decapod shrimp larvae, and fish eggs were mostabundant in the SAFZ. However, the abundance of squid larvae did not differsignificantly in either depth stratum, and the abundance of decapod shrimp larvae and fisheggs differed significantly only in the shallow stratum. The abundance of cirripede larvaewas more than 10 times as great in the SAFZ as in the SD or TZ.
Mysids and fish larvae were most abundant in the TZ, and their abundancesdiffered significantly in both depth strata. The predominant mysid species in our sampleswere Euchaetomeropsis merolepis and a Siriella sp.; however, the E. merolepis occurredalmost exclusively in the deep samples of the SAFZ, whereas the Siriella sp. were in theshallow samples in the TZ. Fish larvae were predominantly myctophids. Stenobrachiusspp. were the most common myctophids, and Pacific viperfish, Chauliodus macouni, werethe most common nomnyctophid larvae.
Ostracods had the most uniform abundance levels across water-mass types anddepth strata, which reflects the cosmopolitan nature of Conchoecia spp., the commonostracods of the subarctic North Pacific Ocean (Angel 1972).
Displacement volumes were highest in the SD in both depth strata and were higherin the shallow stratum in all oceanographic regions. However, the difference indisplacement volume was greatest between the SD and the SAFZ.
Community Ordination
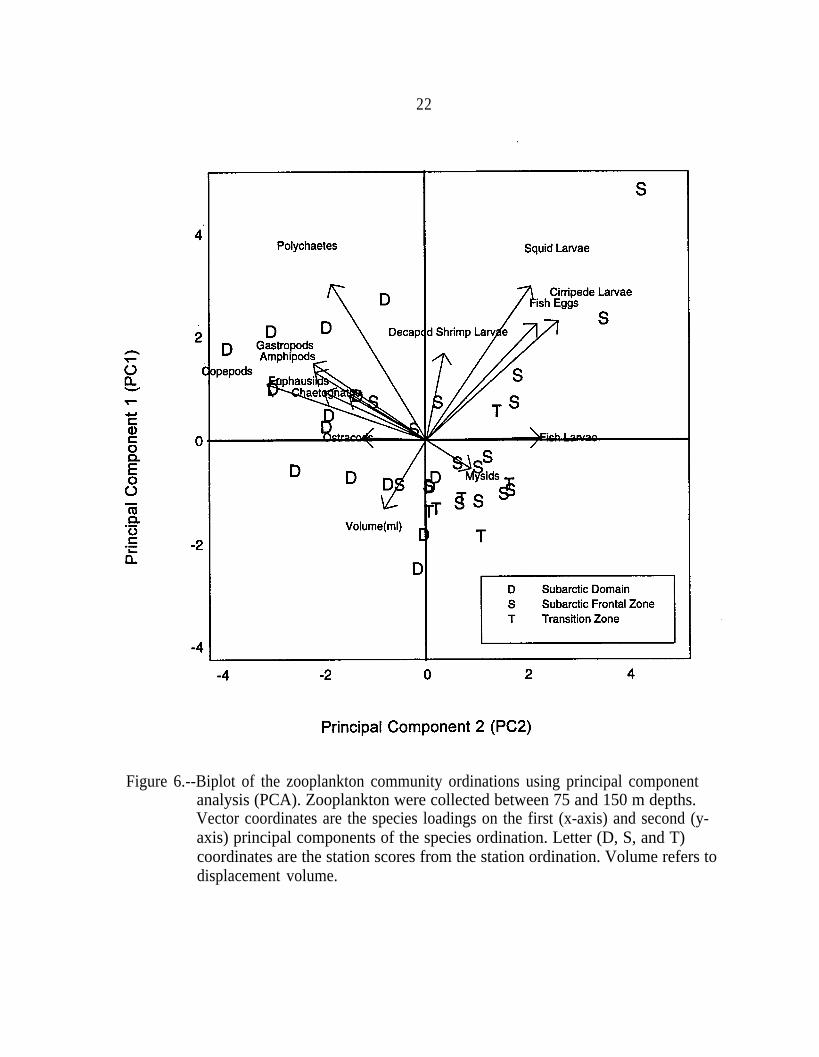
Taxa that reached their highest abundance in the subarctic water mass (gastropods,polychaetes, ostracods, copepods, amphipods, euphausiids, chaetognaths; Table 2) wereseparated from the other taxa by the sign of their loadings (Table 1C). The separation ofthe subarctic taxa (taxa more abundant in the subarctic water mass) was more apparent inthe shallow stratum than in the deep stratum. In the shallow stratum, these taxa wereseparated from other zooplankton taxa by the first principal component (PCl), whichaccounted for 21% of the variation in species composition. In the deep stratum, these taxawere separated by the second principal component (PC2), which accounted for only 16%of the variation in species composition. The loading for ostracods was considerably lowerthan for other taxa with negative loadings on PC1 and PC2, which reflects the moreuniform distribution of ostracods in our samples. The separation of subarctic taxa can alsobe seen in the biplots (Gabriel 1971) of species and station ordinations (Figs. 5 and 6).Station scores (Figs. 5 and 6) were consistent with abundance patterns found in Table 2and loadings in Table 1C. Scores of the SD and SAFZ stations were separated by PC1 inthe shallow stratum and by PC2 in the deep stratum. The scores of the three TZ stationsin the deep stratum overlapped both SD and SAFZ stations (Fig. 6).

5
The second principal component split the scores of the shallow stratum in both theSD and SAFZ. The shallow SD scores were split into a group with higher abundances ofgastropods, polychaetes, copepods, amphipods, euphausiids, and chaetognaths and a groupwith higher displacement volumes (Fig. 5). Due to the colonial nature of the gelatinouszooplankton in our samples (predominantly salps and doliolids), the variability indisplacement volume was determined primarily by their abundance. As a result, the twogroups could be defined as a gelatinous and a nongelatinous zooplankton assemblage.PC2 also separated the shallow SAFZ samples into a group with higher abundances ofsquid larvae, cirripede larvae, decapod shrimp larvae, and fish eggs and a group withhigher abundances of mysids and lower abundances of gastropods, polychaetes, copepods,amphipods, euphausiids, and chaetognaths. Squid larvae, cirripede larvae, decapod shrimplarvae, and fish eggs were also the taxa that reached their peak abundances in the SAFZ(Table 2). Decapod shrimp larvae abundances in the SAFZ and the SD were much moresimilar than those of cirripede larvae and fish eggs (Table 2), and this pattern is reflectedin the decapod shrimp larvae loadings (Fig. 5). The scores of the six TZ stations in theshallow stratum overlapped the scores of the SAFZ stations.
DISCUSSION
The Tucker trawl was designed to capture macroplankton (2-20 mm) andmicronekton (20-200 mm) (Davies and Barham 1969). The 1 -m2 net is an effectivesampler for macroplankton and smaller micronekton in the coastal water of the easternGulf of Alaska. Although the slow tow speed and relatively small mouth may allow somenet avoidance by the larger micronekton, we do not believe that net avoidance was asignificant factor contributing to the low abundance of macroplankton in many of oursamples. Our samples had few adult euphausiids, sergestid shrimp, myctophids, or othermicronekton over 20 mm compared with similar sampling in coastal areas of the easternGulf of Alaska.
Vertical Distribution
Most zooplankton taxa were more abundant in the shallow stratum; however,chaetognaths and mysids were significantly more abundant in the deeper stratum (Table1B). Overlapping distributions of the two predominate chaetognath species (Eukrohniahamata and Sagitta elegans) can explain the higher abundance of chaetognaths found inthe deep stratum. E. hamata reaches its maximum abundance near 150 m and is typicallyrare in surface samples (0-50 m), whereas S. elegans reaches its peak abundance at thesurface and is rare below 300 m (Kotori 1972). The higher abundance of mysids in thedeep stratum can be explained by the higher overall abundance of E. merolepis, whichoccurred almost exclusively in the deep stratum. The other predominate mysid, Siriellasp., was found only in the shallow stratum and in numbers significantly less than E.merolepis.

6
Distribution by Oceanographic Region
Abundances of predominate taxa (gastropods, polychaetes, ostracods, copepods,amphipods, euphausiids, and chaetognaths) were higher in the SD and lower in the SAFZand TZ, which is consistent with McGowan and Williams (1973) and Taniguchi (1981).The association of these taxa with the SD was also apparent in the principal componentanalysis. However, only polychaetes, copepods, and chaetognaths had significantly higherabundances in the SD. The decline in polychaete abundance to the south was probablydue to the absence of the common subarctic species Tomopteris septentrionalis in theSAFZ and TZ stations (Tebble 1962). The decline in abundance of amphipods to the southcan be explained by the absence of the common subarctic amphipod Themisto pacifica(Bowman 1960) in the SAFZ and TZ. The decline in the abundance of chaetognaths tothe south can be attributed to the absence of Sagitta elegans and submergence ofEukrohnia hamata-the predominate chaetognaths in the subarctic (Hida 1957, Alvarino1964).
Stations where gelatinous zooplankton were the most abundant (stations with thelargest displacement volumes) occurred most frequently in the SD, and based on principalcomponent scores, appeared to have a zooplankton community that differed from thenongelatinous community. At a species level, gelatinous zooplankton provide a habitatand a food base for a unique zooplankton community. Most hyperiid amphipod speciesand some copepods are directly associated with and feed on gelatinous zooplankton(Hamner et al. 1975, Lava1 1980). Several nekton species are also associated withgelatinous zooplankton (e.g., smalleye squaretail, Tetragonurus cuvieri, feed exclusively ongelatinous zooplankton [Hart 1973], and chum salmon, Oncorhynchus keta, feedextensively on gelatinous zooplankton [Pearcy et al. 1988, Welch et al. 19951). Gelatinouszooplankton may provide a basis for a unique pelagic community with trophodynamicsdistinctly different from that of the nongelatinous community.
The SAFZ appeared to support a zooplankton community of its own beyond asimple transition from a SD community to a TZ community. Taxa associated specificallywith the SAFZ included squid larvae, cirripede larvae, fish eggs, and, to a lesser extent,decapod shrimp. Stations with relatively high numbers of these taxa had principalcomponent scores that differed from scores at other SAFZ stations. Decapod shrimp weremost abundant in the SAFZ, but still were found in significant numbers in the SD. Thisdistribution was consistent with the known distribution of Sergestes similis, the commonsubarctic decapod shrimp (Omori et al. 1972, Krygier and Pearcy 1981) and thepredominant decapod shrimp in our samples. Although S. simdis occurs throughout thesubarctic North Pacific Ocean, it reaches its peak abundance and forms dense swarms inthe SAFZ (Omori et al. 1972).
Mysids were the only taxon not found in the SD. Their absence in the SD istypical of north Pacific meso- and epipelagic mysids, which are found primarily in thelower latitudes (Mauchline and Murano 1977). The coefficients of variation for mysidswere high, indicating that their spatial distribution was patchy and is consistent with thepatchy distribution found in neuston samples (Ebberts and Wing 1997).

7
Due to the loss of taxonomic resolution inherent in species aggregation, we werenot able to incorporate the true complexity of the zooplankton community; however, thetaxa identified in our analysis differed significantly by depth stratum and oceanographicregion. The most significant change in the zooplankton community appeared to occurbetween the SD and SAFZ, suggesting that the presence or absence of a permanenthalocline may be important in defining the distribution and abundance of zooplankton inthe subarctic.
ACKNOWLEDGMENTS
We wish to thank Shannon Fitzgerald and Bryan Herczeg of the National MarineMammal Laboratory for their assistance with oceanographic data collection during the firstleg of the cruise and for taking full responsibility for oceanographic data collection duringthe second leg of the cruise. We thank the crew and officers of the NOAA ship MillerFreeman for assistance and hospitality during the field operations, especially WilliamFloring and John Greenwalt, who assisted in all sampling activities. Also, we wish tothank Blaine Ebberts for his assistance in processing the zooplankton samples.
8
CITATIONS
Alvarino, A.1964. Bathymetric distribution of chaetognaths. Pac. Sci. 18: 64-82.
Angel, M. V.1972. Planktonic oceanic ostracods, past, present and future. Proc. R. Soc.
Edinburgh 73: 213-228.Bowman, T. E.
1960. The pelagic amphipod genus Parathemisto (Hyperiidea : Hyperiidae) in theNorth Pacific and adjacent Arctic Ocean. Proc. U.S. Natl. Mus. 112: 343-392.
Davies, I. E., and E. G. Barham.1969. The Tucker opening-closing micronekton net and its performance in a study of
the deep scattering layer. Mar. Biol. 2: 127-13 1.Ebberts, B. D., and B. L. Wing.
1997. Diversity and abundance of neustonic zooplankton in the North PacificSubarctic Frontal Zone. U.S. Dep. Commer., NOAA Tech. Memo. NMFS-AFSC-70, 34 p.
Gabriel, K. R.1971. The biplot graphic display of matrices with application to principal component
analysis. Biometrika 58: 453-467.Hamner, W. M., L. P. Madin, A. L. Alldredge, R. W. Gilmer, and P. P. Hamner.
1975. Underwater observations of gelatinous zooplankton: sampling problems,feeding biology, and behavior. Limnol. Oceanogr. 20: 907-917.
Hart, J. L.1973. Pacific fishes of Canada. Fish. Res. Board Can. Bull. 180, 741 p.
Hida, T. S.1957. Chaetognaths and pteropods as biological indicators in the North Pacific. U.S.
Fish Wildl. Serv., Spec. Sci. Rep.-Fish. 215, 13 p.Kotori, M.
1972. Vertical distribution of chaetognaths in the northern North Pacific Ocean andBering Sea. In A. Y Takenouti (editor), Biological oceanography of the northernNorth Pacific Ocean, p. 291-308. Idemitsu Shoten, Tokyo.
Krygier, E. E., and W. G. Pearcy.1981. Vertical distribution and biology of pelagic decapod crustaceans off Oregon. J.
Crust. Biol. l(1): 70-95.Laval, P.
1980. Hyperiid amphipods as crustacean parasitoids associated with gelatinouszooplankton. Oceanogr. Mar. Biol. Annu. Rev. 18: 11-56.
Lehmann, E. L.1975. Nonparametrics: statistical methods based on ranks. Holden-Day, San
Francisco. Cited in Statistical Sciences (1995).Ludwig, J. A., and J. F. Reynolds.
1988. Statistical ecology. John Wiley & Sons, New York, 337 p.

9
Lynn, R. J.1986. The subarctic and northern subtropical fronts in the eastern North Pacific
Ocean in spring. J. Phys. Oceanogr. 16: 209-222.Mauchline, J., and M. Murano.
1977. World list of the Mysidacea, Crustacea. J. Tok. Univ. Fish. 64(l): 39-88.McEwen, G. F., M. W. Johnson, and T. R. Folsom.
1954. A statistical analysis of the performance of the Folsom plankton samplesplitter, based upon test observations. Arch. Meteorol. Geophys. Bioklimatol. Ser.A 7: 502-527.
McGowan, J. A., and l? M. Williams.1973. Oceanic habitat differences in the North Pacific. J. Exper. Mar. Biol. Ecol. 12:
187-217.Miller, C. B., B. W. Frost, B. Booth, I? A. Wheeler, M. R. Landry, and N. Welschmeyer.
1991. Ecological dynamics in the oceanic Subarctic Pacific Ocean. Bull. Ocean Res.Inst. Univ. Tokyo 26(I): l-26.
Omori, M., A. Kawamura, Y. Aizawa.1972. Sergestes similis Hansen, its distribution and importance as food of fin and sei
whales in the North Pacific Ocean. In A. Y. Takenouti (editor), Biologicaloceanography of the northern North Pacific Ocean, p. 373-391. Idemitsu Shoten,Tokyo.
Pearcy, W. G.1991. Biology of the transition region. In A. J. Wetherall (editor), Biology,
oceanography, and fisheries of the North Pacific transition zone and subarcticfrontal zone, p. 39-55. U.S. Dep. Commer., NOAA Tech. Rep. NMFS 105.
Pearcy, W. G., R. D. Brodeur, J. M. Shenker, W. W. Smoker, and Y. Endo.1988. Food habits of Pacific salmon and steelhead trout, midwater trawl catches and
oceanographic conditions in the Gulf of Alaska, 1980-1985. Bull. Ocean Res.Instit. Univ. Tokyo 26(Pt. II.): 29-78. Cited in Pearcy (1991).
Pielou, E. C.1984. The interpretation of ecological data. J. Wiley and Sons, New York, 263 p.
Roden, G. I.1991. Subarctic-subtropical transition zone of the North Pacific: large-scale aspects
and mesoscale structure. In J. A. Wetherall (editor), Biology, oceanography, andfisheries of the North Pacific transition zone and subarctic frontal zone, p. l-38.U.S. Dep. Commer., NOAA Tech. Rep. NMFS 105.
Roden, G. I., and A. R. Robinson.1988. Subarctic frontal zone in the north-eastern Pacific: mesoscale structure and
synoptic description. Harv. Open Ocean Model Rep. Rep. Meteorol. Oceanogr.31. Harvard Univ., Cambridge, MA, 37 p. + 41 figs.
Shimazaki, K.1986. Distribution of the pelagic fish community around the subarctic boundary in
the North Pacific Ocean. In Symposium on biological interactions in the NorthPacific region and on factors affecting recruitment, distribution, and abundance ofnon-anadromous species, 247-264. Int. North Pac. Fish. Comm. Bull. 47.

10
Statistical Sciences.1995. S-PLUS guide to statistical and mathematical analysis, ver. 3.3. StatSci, a
division of MathSoft, Inc., Seattle, n.p.Taniguchi, A.
1981. Plankton productivities in the Pacific subarctic boundary zone: food conditionsof the migrating pelagic fishes. In S. Mishima (editor), Pelagic animals andenvironments around the subarctic boundary in North Pacific, p. 23-35. Res. Inst.North Pac. Fish. Hokkaido Univ. Spec. Vol.
Tebble, N.1962. The distribution of pelagic polychaetes across the North Pacific. Bull. Brit.
Mus. (Nat. Hist). 7(9): 371-492.Welch, D. W., A. I. Chigirinsky, and Y. Ishida.
1995. Upper thermal limits on the oceanic distribution of Pacific salmon(Oncorhynchus spp.) in the spring. Can. J. Fish. Aquat. Sci. 52: 489-503.
Wing, B. L., B. D. Ebberts, M. A. Masters, and H. E. Garcia.1993. Physical oceanographic observations in the northeastern Pacific transition zone,
October-November 1989. U.S. Dep. Commer., Proc. Rep. AFSC 93-09, 269 p.

TABLES

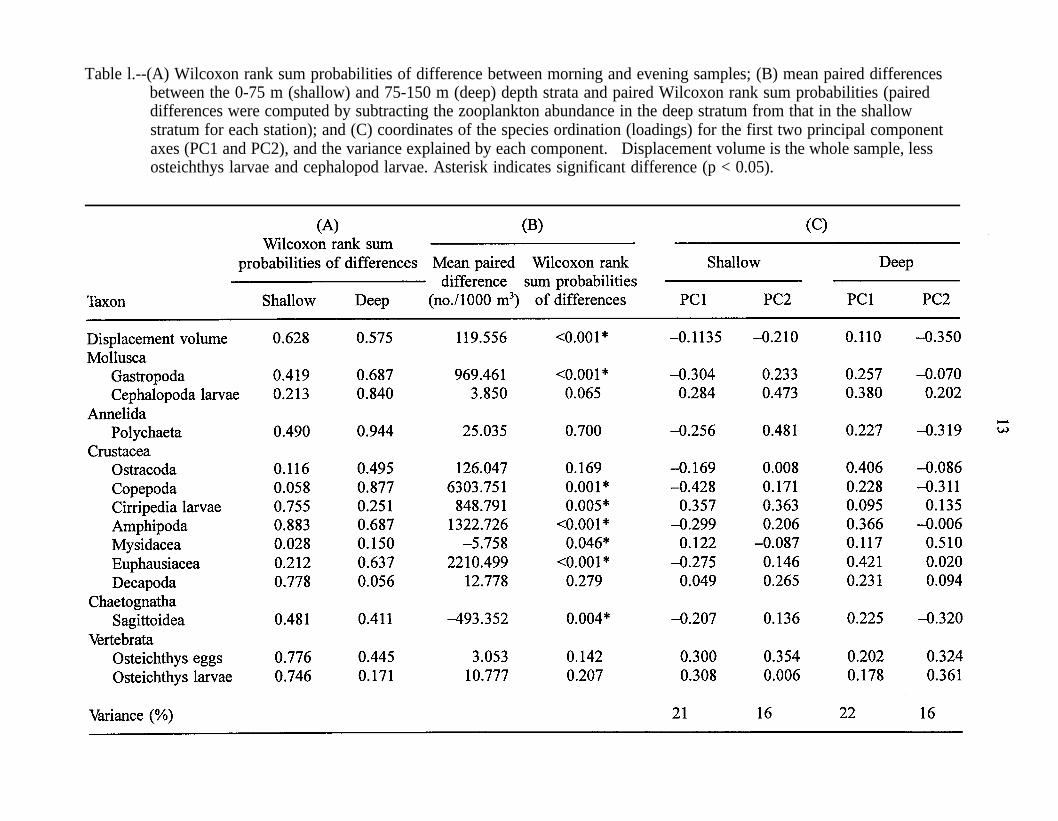
Table l.--(A) Wilcoxon rank sum probabilities of difference between morning and evening samples; (B) mean paired differencesbetween the 0-75 m (shallow) and 75-150 m (deep) depth strata and paired Wilcoxon rank sum probabilities (paireddifferences were computed by subtracting the zooplankton abundance in the deep stratum from that in the shallowstratum for each station); and (C) coordinates of the species ordination (loadings) for the first two principal componentaxes (PC1 and PC2), and the variance explained by each component. Displacement volume is the whole sample, lessosteichthys larvae and cephalopod larvae. Asterisk indicates significant difference (p < 0.05).

14
Table 2.--Comparisons of mean abundance and coefficients of variation (CV) betweenoceanographic regions with the Kruskal-Wallis test of significance. Shallow =0-75 m depth; deep = 75-150 m depth. Displacement volume is the wholesample less osteichthys larvae and cephalopod larvae. Asterisk indicatessignificant difference (p < 0.05).

FIGURES


17
Figure l.--Schematic diagram showing the locations of the Subarctic and SubtropicalDomains, the Transition Zone, and the associated Subarctic Frontal Zone(SAFZ) and Subtropical Frontal Zone (STFZ). Black arrows indicate boundarycurrent intrusions (from Roden 1991).

18
Figure 2.--Oceanographic regions and Tucker trawl sample locations and numbers, Octoberand November 1989.

19
Figure 3.--Salinity along 161°W in October 1989. Oceanographic domains are labeled ontop as TZ (Transition Zone), SAFZ (Subarctic Frontal Zone), and SD (SubarcticDomain). Dotted lines indicate station locations.

20
Figure 4.--Temperature and salinity at 75 m depth. Station numbers label each point.

21
Figure 5.--Biplot of the zooplankton community ordinations using principal componentanalysis (PCA). Zooplankton were collected between 0 and 75 m depths.Vector coordinates are the species loadings on the first (x-axis) and second (y-axis) principal components of the species ordination. Letter (D, S, and T)coordinates are the station scores from the station ordination. Volume refers todisplacement volume.
22
Figure 6.--Biplot of the zooplankton community ordinations using principal componentanalysis (PCA). Zooplankton were collected between 75 and 150 m depths.Vector coordinates are the species loadings on the first (x-axis) and second (y-axis) principal components of the species ordination. Letter (D, S, and T)coordinates are the station scores from the station ordination. Volume refers todisplacement volume.

APPENDICES


25
Appendix l.--Station information, including the station number, sample number, depth ofsample, time and location of sample, and volume of seawater filtered duringcollection. Times are Alaska Daylight Saving Time.

26
Appendix 1 .--Continued.

Appendix 2.--Zooplankton sample counts and displacement volumes. Counts are the number of individuals per sample.
CHAETOG-MOLLUSCA ANNELIDA CRUSTACEA NATHA VERTEBRATA
Depth Displace-Station stratum squid Cirripedia Decapoda Fish Fish merit
volumenumber (m) Gastropoda larvae Polychaeta Ostraccda Copepoda larvae Amphipoda Mysidacea Euphausiacea larvae Sagittoidea eggs larvae (ml)

Appendix 2.--Continued.
CHAETOG-MOLLUSCA ANNELIDA CRUSTACEA NATHA VERTEBRATA
Depth Displace-Station stratum Squid Cirripedia Decapoda Fish Fish ment
volumenumber ON Gastropoda larvae Polychaeta Ostracoda Copepoda larvae Amphipoda Mysidacea Euphausiacea larvae Sagittoidea eggs larvae (ml)

Appendix 2.--Continued.

30
Appendix 3.--Qualitative summary of the abundance of gelatinous zooplankton in theTucker trawl samples. The codes used are - = absent, 2 = few, 4 =some, 6 = many, 10 = >98% of sample.

31

RECENT TECHNICAL MEMORANDUMS
Copies of this and other NOAA Technical Memorandums are available from theNational Technical Information Service, 5285 Port Royal Road, Springfield, VA 22167(web site: www.ntis.gov). Paper and microfiche copies vary in price.
AFSC-
92 FRITZ, L. W., and S. A. LOWE. 1998. Seasonal distributions of Atka mackerel (Pleurogrammus monopterygius) in commercially-fished areas of the Aleutian Islands and Gulf of Alaska,29 p. NTIS No. PB98-153703.
91 WING, B. L., and J. J. PELLA. 1998. Time series analyses of climatological records from Auke Bay,Alaska, 90 p. NTIS No. PB98-149206.
90 PACUNSKI, R. E., P. A. LIVINGSTON, and B. S. MILLER. 1998. Food of flathead sole Hippoglossoides elassodon in the eastern Bering Sea, 27 p. NTIS No. PB98-148679.
89 WILKINS, M. E., M. ZIMMERMANN, and K. L. WEINBERG. 1998. The 1995 Pacific west coast bottomtrawl survey of groundfish resources: Estimates of distribution, abundance, and length and agecomposition, 138 p. plus Appendices. NTIS No. PB98-136252.
88 FRITZ, L. W., A. GREIG, and R. F. REUTER. 1998. Catch-per-unit-effort, length, and depth distributionsof major groundfish and bycatch species in the Bering Sea, Aleutian Islands, and Gulf of Alaska regionsbased on groundfish fishery observer data, 179 p. NTIS No. PB98-139298.
87 SINCLAIR, E. H. (editor) 1997. Fur seal investigations, 1996, 115 p. NTIS No. PB98-131790.
86 SINCLAIR, E.H. (editor). 1997. Fur seal investigations, 1995, 188 p. NTIS No. PB98-131808.
85 KINOSHITA, R. K., A. GREIG, and J. M. TERRY. 1998. Economic status of the groundfish fisheries offAlaska, 1996, 91 p. NTIS No. PB98-126170.
84 LAAKE, J., D. RUGH, and L. BARAFF. 1998. Observations of harbor porpoise in the vicinity of acousticalarms on a set gill net, 40 p. NTIS No. PB98-117641.
83 RUTECKI, T. L., M. F. SIGLER, and H. H. ZENGER JR. 1997. Data report: National Marine FisheriesService longline surveys, 1991-96, 64 p. NTIS No. PB98-108822.
82 MARTIN, M. H. 1997. Data report: 1996 Gulf of Alaska bottom trawl survey, 235 p. NTIS No. PB98-103930.
81 LAUTH, R. R. 1997. The 1996 Pacific West Coast upper continental slope trawl survey of groundfishresources off Washington and Oregon: Estimates of distribution, abundance, and length composition, 156 p. NTIS No. PB97-208912.
80 LAUTH, R. R. 1997. The 1995 Pacific West Coast upper continental slope trawl survey of groundfishresources off southern Oregon and northern California: Estimates of distribution, abundance, and lengthcomposition, 110 p. NTIS No. PB97-208920.
79 LAUTH, R. R., M. E. WILKINS, and P. A. RAYMORE JR. 1997. Results of trawl surveys of groundfishresources of the West Coast upper continental slope from 1989 to 1993, 342 p. NTIS No. PB97-208904.
78 HILL, P. S., D. P. DEMASTER, and R. J. SMALL. 1997. Alaska marine mammal stock assessments,1996, 150 p. NTIS No. PB97-203277.
77 CHUMBLEY, K., J. SEASE, M. STRICK, and R. TOWELL. 1997. Field studies of Steller sea lions(Eumetopias jubatus) at Marmot Island, Alaska, 1979 through 1994, 99 p. NTIS No. PB97-203376.