distribution statement a - approved for public release by
TRANSCRIPT

Distribution Statement A - Approved for public release by OSR on March 24, 2015. SR Case #15-S-1196 applies. Distribution is unlimited.


iii
Executive Summary Up-to-date cost metrics are crucial for ensuring that the Department of Defense uses the most cost-effective approach to resolving issues related to Diminishing Manufacturing Sources and Material Shortages (DMSMS). To update those metrics, the Defense Standardization Program Office undertook an analysis of responses to the 2014 DMSMS cost survey—Defense Industrial Base Assessment: Diminishing Manufacturing Sources and Material Shortages Cost Resolution Values Survey—conducted by the Department of Commerce’s Bureau of Industry and Security.1 The updated metrics will be incorporated into the latest version of SD-22, Diminishing Manufac-turing Sources and Material Shortages: A Guidebook of Best Practices for Implementing a Ro-bust DMSMS Management Program.
The following table presents the updated cost metrics for DMSMS resolutions. DMSMS Resolution Average Costs and Confidence Intervals
Solution 95% confidence
(left limit) Average cost
(mean) 95% confidence
(right limit)
Approved parts $900 $1,028 $1,100 Life-of-need buy $4,600 $5,234 $5,900 Simple substitute $11,900 $12,579 $13,200 Complex substitute $14,800 $25,410 $36,000 Extension of production or support $14,000 $25,472 $36,900 Repair, refurbishment, or reclamation $21,300 $65,015 $108,700 Development of a new item or source $437,600 $655,411 $873,200 Redesign–NHA $900,300 $1,092,856 $1,285,400 Redesign–complex/system replacement $7,142,100 $10,287,964 $13,433,800 The average costs take into account all reported instances across the complexity spectrum of part type, commodity, and environment. The confidence intervals indicate a 95 percent certainty that the true average cost lies within the interval between the left and right limits.
This report outlines the analytical steps used to calculate the new DMSMS resolution costs, along with cross-tabulations that lend additional insights into the nature and characteristics of DMSMS resolutions. In addition, the report presents comprehensive information on the DMSMS cost survey, such as response rate and data characteristics.
1 See http://www.bis.doc.gov/dib.

iv
This page intentionally left blank.

v
Table of Contents
1. Background, Objectives, and Report Structure 1
2. About the Survey 3
2.1. Respondents 3
2.2 Instrument 4
3. Data Characteristics 7
4. Analysis of Survey Data and Findings 9
4.1. Data Cleaning Process 9
4.2. Frequency of DMSMS Resolutions 10
4.3. Cost of DMSMS Resolutions 14
4.3.1. Computation Approach 14
4.3.2. Average Costs and Confidence Intervals 16
5. Interpretation of Results and Scope for Improvement 19
5.1. Representation 19
5.2. Data Collection 19
5.3. Granularity of Data 19
5.4. Cost Avoidance 20
Appendix A. Survey Instrument (Sample Extract) 21
Appendix B. Definitions of DMSMS Concepts 23
Appendix C. Abbreviations 27
Figures Figure 1. Broad Categorization of DMSMS Resolutions 10
Tables Table 1. Sections of the Survey Instrument 5
Table 2. Data Set Variables and Definitions 7
Table 3. Number of Issues Reported by Resolution Type 11
Table 4. Frequency of DMSMS Solutions by Part Type 11
Table 5. Frequency of DMSMS Solutions by Part Commodity 12
Table 6. Frequency of DMSMS Solutions by Operating Environment 13
Table 7. Composition of Total Solution Costs 14
Table 8. DMSMS Resolution Average Costs and Confidence Intervals 16
Table 9. Definitions of Solution Types 23

vi
Table 10. Definitions of Solution Characteristics 24
Table 11. Definitions and Examples of Solution Engineering and Design Cost Elements 25
Table 12. Definitions and Examples of Solution Implementation Cost Elements 26

1
1. Background, Objectives, and Report Structure Department of Defense (DoD) policy and obsolescence management guidance emphasize a cost-conscious approach to dealing with Diminishing Manufacturing Sources and Material Shortages (DMSMS) issues. Effective DMSMS management requires credible, up-to-date estimates of av-erage resolution costs. Those costs are published by the Defense Standardization Program Office (DSPO) in Diminishing Manufacturing Sources and Material Shortages: A Guidebook of Best Practices for Implementing a Robust DMSMS Management Program (SD-22).2 Program manag-ers and DMSMS management teams throughout the defense community use the cost data in SD-22 to meet cost avoidance and should-cost reporting needs.
The most recent cost metrics published in SD-22 were from September 20103 based on a 2009 survey.4 To update those metrics, the Department of Commerce’s Bureau of Industry and Securi-ty (BIS), in partnership with DSPO, conducted a cost survey of government and industry entities that support DMSMS resolutions within DoD programs and systems. The DMSMS cost sur-vey—Defense Industrial Base Assessment: Diminishing Manufacturing Sources and Material Shortages Cost Resolution Values Survey—was conducted in early 2014.
LMI cost and survey experts processed and analyzed the data collected through that survey and calculated revised resolution average cost values and confidence intervals for use in updating SD-22.5 A contemporary measure of DMSMS resolution costs is essential for programmatic budgeting and obsolescence management planning. Progressive emphasis on gaining detailed insights regarding engineering, design, and implementation costs needs to be sustained to better prepare the DMSMS practitioner community to mitigate adverse effects of DMSMS issues on material readiness and operational availability.
The remainder of this report is organized as follows:
• Section 2 provides information on cost survey administration, respondents, and specifics of the data collection instrument.
• Section 3 provides information on the characteristics of the data collected through the survey and the compiled data set.
• Section 4 presents the data analysis approach, specifics on the data cleaning process, and ana-lytical findings on average costs of DMSMS resolutions.
• Section 5 presents an interpretation of the results and scope for improvement.
The appendixes contain additional detail.
2 Defense Standardization Program Office, SD-22, Diminishing Manufacturing Sources and Material Shortag-
es: A Guidebook of Best Practices for Implementing a Robust DMSMS Management Program, August 2012, http://quicksearch.dla.mil/, Search Parameter (Document ID = SD-22).
3 Defense Standardization Program Office, DMSMS NRE Resolution Cost Metric Update, September 2010. 4 Department of Commerce, DMSMS Resolution Cost Survey, 2009 (http://www.bis.doc.gov/dib). 5 LMI provides contractual support to DSPO on DMSMS management.

2
This page intentionally left blank.

3
2. About the Survey The goal of the DMSMS cost survey was to collect data from government and industry entities involved in DMSMS resolutions to generate an accurate, reliable, and valid data set that can be analyzed to compute updated average DMSMS resolution costs.6
The resolution cost survey conducted in 2009 limited our ability to estimate costs for contempo-rary DMSMS resolutions. For the 2014 survey, BIS made several significant changes to increase the scope and quality of data. It used recently developed renewed resolution categories7 that vary in level and amount of research required to implement a resolution. The scope of the survey was changed to include commodity types other than just electronic components and systems. The survey requested solutions for mechanical components and assemblies, electrical components and assemblies, materials, and software. These additional commodity types are intended to cover the full range of DMSMS issues that both industry and government face. The quality of the sur-vey was enhanced by adding the operating environment of the hardware affected by the DMSMS problem. The survey team assessed that each operating environment would have a unique cost profile based on engineering requirements and qualification costs. The quality of the survey was also enhanced by requesting a breakdown of the solution costs into specific categories, which were roughly based on the engineering change proposal (ECP) form (DD 1692).
Through this survey, government and industry respondents were requested to provide detailed costs for DMSMS solutions that they implemented in the last 2 years. They were requested to define and offer detailed cost breakdowns involved in implementing DMSMS solutions in suffi-cient detail to allow DoD to do the following:
• Estimate costs of solutions to emerging DMSMS issues.
• Develop budgets and Program Objective Memorandum information for resolving DMSMS issues in the future.
• Provide a basis for evaluating quotes for resolving DMSMS issues.
• Allow programs to provide accurate estimates of DMSMS cost avoidance.
The overall objective of the survey analysis was to generate a comprehensive, standardized in-ventory of DMSMS solutions, and their associated costs, that can be used for the warfighting tools supported by the DoD DMSMS Working Group. The standardized inventory will provide both the government and product manufacturers a common understanding of costs. The cost fac-tors used by this survey were carefully selected to provide the detail needed for proper analysis. They are intended to include the total cost of the solution implemented.
2.1. Respondents
BIS, in cooperation with the DMSMS Working Group, solicited the participation in this survey of organizations involved in DMSMS resolutions. Organizations were identified as providing DMSMS-related support for DoD programs or systems and were contacted through a distribution
6 Department of Commerce, Defense Industrial Base Assessment: Diminishing Manufacturing Sources and Ma-
terial Shortages Cost Resolution Values Survey, 2014. 7 See Note 1, pp. 69–72.

4
letter explaining the survey data collection exercise, soliciting their participation, and assuring business confidentiality of the information furnished through the survey instrument.
The cost metrics survey was distributed in MS Excel format, along with instructions, to identi-fied respondents. BIS provided technical and content support, making its support staff members accessible through email and telephone. The survey was administered over a 4-month period be-tween March and June 2014. More than 50 organizations were contacted for participation in the survey, of which 35 furnished responses. A response rate of 70 percent is moderate for a manda-tory data collection exercise.8 Some timely responses were only partially complete due to the time intensity of calculating resolution costs, which resulted in a final set of 28 qualified re-sponses. The inability of some preidentified respondents to calculate resolution costs within the specified time period contributed to responses in “working” or “partially complete” status. In ad-dition, several entities were granted exemption from responding because either they did not deal with DMSMS issues in the recent past (within 2 years) or because they were primarily a research and development organization not directly involved in DMSMS resolutions. These two factors explain the moderate response rate. This iteration of the survey was a significant improvement in terms of planning, effective administration, and support provisions. Future iterations of the sur-vey may benefit from better identification of eligible respondents along with successive notifica-tions preceding the actual survey instrument. This may prove useful in generating interest and also allow for internal resource planning in respondent organizations, keeping in mind that DMSMS cost surveys have been perceived as time intensive.
2.2 Instrument
The survey instrument, complete with instructions and necessary definitions, was prepared col-laboratively with participation of subject matter experts from the DMSMS Working Group, sur-vey design experts from LMI, and the implementing/administering body, BIS. MS Excel format was chosen as the platform for the survey instrument given the complexity and large amount of data to be collected from each respondent organization. A secondary reason that informed the choice of this platform was the relative simplicity with which data, once collected, could be merged for analysis procedures.
Apart from definitions, instructions, and a table of contents, the survey instrument had 13 sec-tions:
• Section 1 featured questions related to basic characteristics of the organization, such as name, location, and points of contact.
• Section 2 listed each DMSMS resolution category and oriented respondents about solution characteristics, e.g., part type, part commodity, and operating environment; Section 2 also provided explicit information on how to respond to Tabs 3 through 13 that correspond to in-dividual resolution categories. A different solution tab needed to be filled out for each unique combination of solution type, solution characteristics (part type, part commodity, operating environment), and service. To allow for this reporting requirement, each tab had three work-sheets (3a, 3b, 3c; 4a, 4b, 4c; etc.). Multiple solutions could be reported on a single tab only when they had the same combination of solution type, solution characteristics, and service.
8 Under 50 U.S.C. App. § 2155, entities participating in the data collection exercise were required to complete
the survey within 30 calendar days of receipt of the distribution letter.

5
Furthermore, when reporting more than one solution per tab, for a set combination, respond-ents were required to report average costs.
• Sections 3–11 each contain three solution area tabs for each solution type.
• Section 12 was reserved for reporting certification type DMSMS resolutions.
• Section 13 was available for reporting additional DMSMS solutions.
Table 1 lists the sections of the survey instrument.
Table 1. Sections of the Survey Instrument
No. Title
1 Company/Organization Information 2 DMSMS Solutions 3 Approved Part 4 Life-of-Need Buy 5 Repair, Refurbishment, or Reclamation 6 Extension of Production or Support 7 Simple Substitute 8 Complex Substitute 9 Development of a New Item or Source 10 Redesign–NHA 11 Redesign–Complex/System Replacement 12 Certification 13 Additional DMSMS Solution
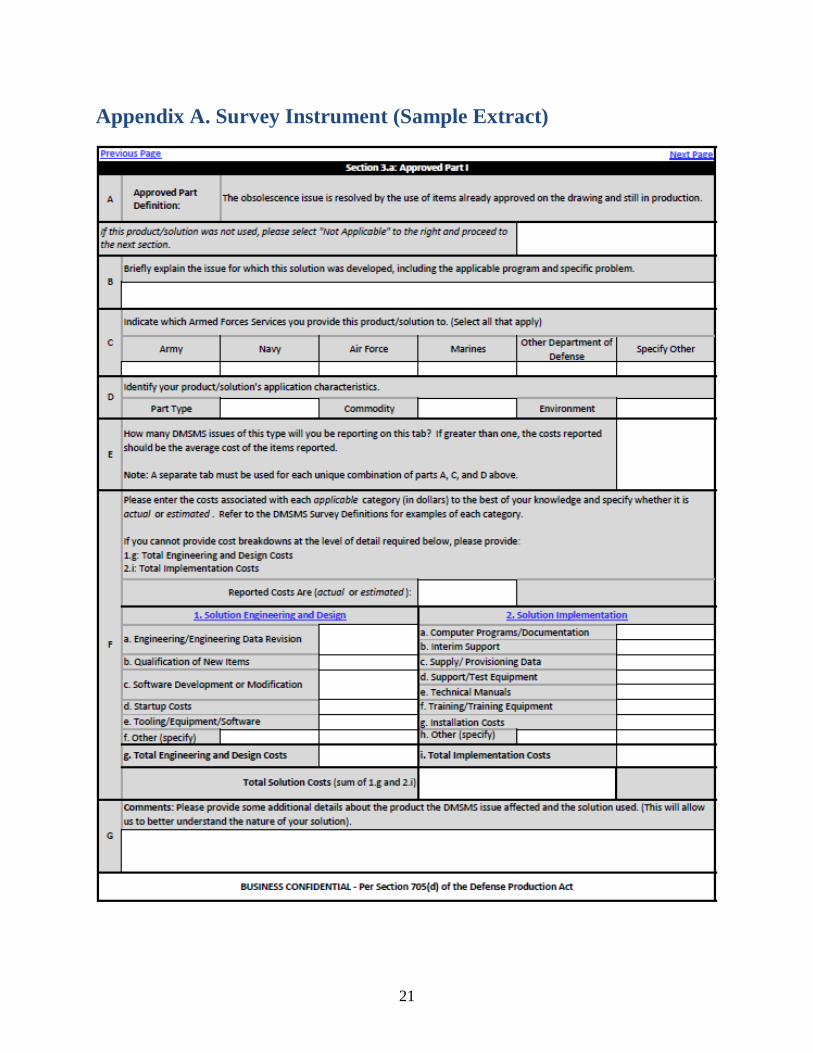
In Sections 3 through 13, respondents were first given a definition of the applicable resolution type to orient their responses. They were then asked to explain the issue for which the reported solution was developed, along with program and problem context, and to indicate the character-istics of products/services and the applicable service that were supported through the resolution. Finally, respondents were requested to provide detailed cost breakdown information in two broad categories: (1) total engineering and design costs and (2) total implementation costs. Each cate-gory was further broken down into several cost factors.
Appendix A contains a sample extract from the survey instrument.

6
This page intentionally left blank.

7
3. Data Characteristics The survey process yielded 34 MS Excel files from 28 organizations, covering both government and industry.9 The structure of the survey file allowed for data to be captured in separate work-sheets corresponding to separate resolution types. Data from all respondent organizations were merged into one consolidated file with the data variables shown in Table 2. Each row of data rep-resents a particular resolution instance within an organization uniquely identified using a combi-nation of resolution characteristics: part type, part commodity, and operating environment.
Table 2. Data Set Variables and Definitions
Variable Definition
Org Name Name of respondent organization. Clean Business Unit/Division
Name of business unit/division.
Org Type Type of organization: Department of Defense Program Office/Activity; Department of Defense Supply Activity; Prime Integrator; Second Tier/Lower Manufacturer; Other–Department of Defense Contractor; Other–Manufacturer/Supplier of Military Radios and Other Communications Equipment; Other–SDL, a University Affiliated Research Center.
Issue Tab Alphanumeric sequence of worksheet, where numeric part (3-13) indicates resolution type and alphabet part indicates first, second, third, or later instance (3a, 3b, 3c, 4a, 4b, 4c…).
DMSMS Issue Resolution type as indicated by the respondent organization: Approved Parts; Life-of-Need Buy; Repair, Refurbishment or Reclamation; Extension of Production or Support; Simple Substitute; Complex Substitute; Development of a New Item or Source; Rede-sign–NHA; Redesign–Complex/System Replacement.
Describe Brief description of the resolution instance with information on program and problem con-text.
Army Yes/No binary value indicating whether the DMSMS resolution supported Army. Navy Yes/No binary value indicating whether the DMSMS resolution supported Navy. Air Force Yes/No binary value indicating whether the DMSMS resolution supported Air Force. Marines Yes/No binary value indicating whether the DMSMS resolution supported Marine Corps. Other DOD Yes/No binary value indicating whether the DMSMS resolution supported other DoD. Other Specify Value indicating name if DMSMS resolution supported other non-DoD/armed forces
agency. Part Type Type of part DMSMS issue is concerned with: assembly; component; raw material; soft-
ware. Commodity Type of commodity DMSMS issue is concerned with: electrical; electronics; mechanical. Environment Operating environment in which DMSMS product/solution functions: aviation; ground;
shipboard; space; undersea. Number Reported Number of DMSMS issues of a certain type reported per worksheet. A type of DMSMS
issue is characterized by a combination of part type, part commodity, and operating envi-ronment.
9 In select instances, due to the inability of some respondents to report information in accordance with the re-
quired survey criteria, BIS received resolution cost data in non-survey Excel or PDF formatted documents.

8
Table 2. Data Set Variables and Definitions
Variable Definition
Actual Est Variable indicating whether cost value is estimate or actual. Cost Type Type of cost factor for which cost value is reported.a There are 17 values and other op-
tions: 1a Engineering/Engineering Data Revision; 1b Qualification of New Items; 1c Software Development/Modification; 1d Startup Costs; 1e Tooling/Equipment/Software; 1f Other; 1g Total Engineering/Design Cost; 2a Computer Programs/Documentation; 2b Interim Support; 2c Supply/Provisioning Data; 2d Support/Test Equipment; 2e Technical Manuals; 2f Training/Training Equipment; 2g Installation Costs; 2h Other; 2i Total Im-plementation Cost; Total Solution Costs.
Cost Value Value of cost factor reported in previous variable. If Number Reported was greater than one, costs reported were average values.
a Defense Standardization Program Office, SD-22, Diminishing Manufacturing Sources and Material Shortages: A Guidebook of Best Practices for Implementing a Robust DMSMS Management Program, August 2012, p. 72 (Table 6. Applicability of Cost Ele-ments to DMSMS Resolution Options).

9
4. Analysis of Survey Data and Findings
4.1. Data Cleaning Process
Systematic data cleaning steps were applied to the data set after merging responses from individ-ual organizations. The DMSMS Working Group, with support from LMI survey analysts, con-ducted a multistage review process to identify and correct data that were spurious, incomplete, or of low quality. In such instances, data elements were corrected or reclassified based on expert assessment; in some instances, incorrect or duplicate reporting data had to be deleted. At a high level, the following data cleaning protocol was used:
• The survey team evaluated the validity and plausibility of data elements, with particular fo-cus on reported DMSMS issues, descriptions of the problem being addressed, solution char-acteristics, and cost values. Cumulatively, 85 data issues were identified, and a list was drawn up for further discussion and appropriate course of action.
• Group discussions began with the evaluation note documented by the original team member who had identified the issue. This evaluation note was primarily an indication of how the is-sues could be addressed or an assessment of its unsuitability for use in cost metrics analysis.
• Group members formally either agreed or disagreed with the proposed evaluation note and prescribed a resolution approach. Data issues with mutual agreement on an approach were cleared for cleaning. Those issues where mutual agreement was not reached were discussed individually to resolve disagreements and find a practical approach to render the data usable for cost metrics analysis.
At the conclusion of this process, all instances of data issues were resolved. The following major types of resolutions were achieved:
• Updated DMSMS resolution type when the problem did not match the resolution type and reported cost value. Determination was based on the nature of the DMSMS problem ad-dressed.
• Updated number of issues reported (Number Reported) when the respondent had incorrectly entered a different value or unintentionally left this field blank. In some instances, this num-ber was not supported by the description of the issue and was updated to match issue descrip-tion.
• Updated part type, commodity type, and operating environment field values when the re-spondent had unintentionally left the field blank. In some instances, original solution charac-teristic values were based on expert assessment of the survey team (rarely used).
• Averaged costs if the respondent had unintentionally reported aggregate costs in place of av-erage costs.
• Removed costs reported in “Other” cost category when reported costs were related to pro-curement or other non-implementation activities that were outside the scope of DMSMS costs.
• Deleted instances of issues found to be unrelated to obsolescence or for which no resolutions were reported.

10
4.2. Frequency of DMSMS Resolutions
At the conclusion of the data cleaning process, the resulting data set had 264 rows of data with a wide variation in the number of DMSMS issues reported. A total of 4,562 issues were reported with the number of issues per row ranging from 1 to 702. In terms of notational representation, all resolution types had at least 1 percent issues attributed to them. However, there is wide varia-bility between resolution types, with about a third of all issues attributed to approved parts reso-lution (highest share) and about 1 percent each for two resolution types: repair, refurbishment, or reclamation and redesign of a complex/system replacement. This variability in attribution to res-olution types is an important finding, because at an aggregate level, it reveals resolution types that are most frequently addressed and most prevalent based on industry and government experi-ence over the past 2 years.
As shown in Figure 1, DMSMS resolutions fall into three broad categories: resolutions involving existing materials (logistics), resolutions involving substitutes (engineering), and resolutions in-volving redesign (engineering).
Figure 1. Broad Categorization of DMSMS Resolutions
The broad categories indicate the level and amount of research required to implement a resolu-tion. The amount of research and applicable cost elements required to implement a resolution also increase as the program progresses through resolution categories.10 Cumulative percentage totals indicate that about half of all reported DMSMS issues belong to the first broad category of existing materials (logistics). About 40 percent of reported DMSMS issues can be attributed to the second broad category of substitutes (engineering). Only about 7 percent of DMSMS issues belong to the third category of redesign (engineering). Most frequently engaged solutions were
10 See Note 1, p. 69.

11
found to be approved parts and simple substitutes, commanding about a third share each of all resolutions. Life-of-need buys (15 percent) and complex substitutes (9 percent) are other catego-ries that command sizable shares. Table 3 presents the number of DMSMS issues reported by resolution types, along with their respective percentages and cumulative percentage totals.
Table 3. Number of Issues Reported by Resolution Type
Solution Sample size Percent
(rounded) Cumulative percentage
Approved parts 1,539 34% 34% Life-of-need buy 666 15% 48% Simple substitute 1,500 33% 81% Complex substitute 410 9% 90% Extension of production or support 98 2% 92% Repair, refurbishment, or reclamation 40 1% 93% Development of a new item or source 127 3% 96% Redesign–NHA 138 3% 99% Redesign–complex/system replacement 44 1% 100%
Total 4,562 100% —
Resolution types are intrinsically varied in research and cost elements, and a significant driver of this variation in resource intensity can be attributed to the type of part used to implement a reso-lution. Four standard part types are used in DMSMS resolutions: assembly, component, raw ma-terial, and software. (Appendix B defines them.) To illustrate the relative extent of the use of DMSMS resolutions differentiated by part type, Table 4 presents the frequency of DMSMS reso-lution types (rows) cross-tabulated with part types (columns). Component parts—base unit parts that may be used as part of an assembly—are the most frequently used solution, accounting for nearly 90 percent of all DMSMS issues. Assembly parts—grouping of parts that result in a final unit that is considered a distinct item—are the next most frequent solution, accounting for about 13 percent of DMSMS issues. The remaining part types (raw material and software) are seldom used to resolve obsolescence issues and constitute only about 1 percent of all DMSMS issues. These frequencies are derived from sample survey data; further comparative tests may be re-quired to ascertain how well they represent population frequencies or distribution across part types.
Table 4. Frequency of DMSMS Solutions by Part Type
Solution Assembly Component Raw material Software Total
Approved parts 133 1,398 8 0 1,539 Life-of-need buy 90 576 0 0 666 Simple substitute 94 1,403 3 0 1,500 Complex substitute 69 320 21 0 410 Extension of production or support 36 56 6 0 98 Repair, refurbishment, or reclamation 14 26 0 0 40 Development of a new item or source 38 88 1 0 127

12
Table 4. Frequency of DMSMS Solutions by Part Type
Solution Assembly Component Raw material Software Total
Redesign–NHA 59 75 0 4 138 Redesign–complex/system replace-ment
35 9 0 0 44
Total 568 3,951 39 4 4,562 Percentage share 12.5% 86.6% 0.9% 0.1% 100%
Another driver of variation in resource intensity of obsolescence resolutions is the type of com-modity used to implement a solution. Three standard part commodities are used in DMSMS so-lutions: electrical, electronics, and mechanical. (Appendix B defines them.) To illustrate the rela-tive extent of use of DMSMS solutions differentiated by part commodity, Table 5 presents the frequency of DMSMS solution types (rows) cross-tabulated with part commodity (columns). Electronics commodities—components, assemblies, or equipment built using electronic compo-nents or circuit cards—are the most frequently used solution, accounting for close to two-thirds of all DMSMS issues. Electrical commodities—equipment that generates electricity, transfers or controls electricity, or uses electricity as its prime energy source (excluding electronics)—are the next most frequent solution, accounting for about one-third of DMSMS issues. Mechanical commodities—parts, assemblies, or equipment that is neither electrical nor electronic—constitute about one-tenth of all DMSMS issues. These frequencies are derived from sample sur-vey data; further comparative tests may be required to ascertain how well they represent popula-tion frequencies or distribution across part commodity.
Table 5. Frequency of DMSMS Solutions by Part Commodity
Solution Electrical Electronics Mechanical Total
Approved parts 987 316 236 1,539 Life-of-need buy 27 633 6 666 Simple substitute 190 1,233 77 1,500 Complex substitute 34 331 45 410 Extension of production or support 27 68 3 98 Repair, refurbishment, or reclamation 1 38 1 40 Development of a new item or source 14 103 10 127 Redesign–NHA 2 132 4 138 Redesign–complex/system replacement 12 31 1 44
Total 1,294 2,885 383 4,562 Percentage share 28.4% 63.2% 8.4% 100%
The characteristics of the operating environment in the context of obsolescence resolutions have a unique cost profile based on engineering requirements and qualification costs. DMSMS solu-tions classified by the operating environment are as follows: aviation, benign or non-tactical, ground, shipboard, space, and undersea. To illustrate the relative extent of use of DMSMS solu-tions differentiated by operating environment, Table 6 presents the frequency of DMSMS solu-

13
tion types (rows) cross-tabulated with operating environment (columns). Parts or equipment used in an aviation environment (in or on aircraft) are the most frequently used solution, accounting for close to 60 percent of all DMSMS issues. Parts or equipment used in a space environment are the next most frequent solution, accounting for about one-fifth of obsolescence issues. Parts or equipment used in ground or shipboard environments together constitute about 25 percent of DMSMS issues. The remaining operating environments (benign or non-tactical and undersea) are rarely served by obsolescence resolution and constitute less than 1 percent of all DMSMS issues. These frequencies are derived from sample survey data; further comparative tests may be re-quired to ascertain how well they represent population frequencies or distribution across opera-tional environments.
Table 6. Frequency of DMSMS Solutions by Operating Environment
Solution Aviation Benign or nontactical Ground Shipboard Space Undersea Total
Approved parts 442 0 349 38 710 0 1,539 Life-of-need buy 438 0 96 100 32 0 666 Simple substitute 1,160 0 184 58 97 1 1,500 Complex substitute 310 0 38 61 0 1 410 Extension of production or support 93 0 3 2 0 0 98
Repair, refurbishment, or reclamation 4 0 4 26 0 6 40
Development of a new item or source 97 0 27 3 0 0 127
Redesign–NHA 46 0 41 51 0 0 138 Redesign–complex/ system replacement 30 0 6 8 0 0 44
Total 2,620 0 748 347 839 8 4,562 Percentage share 57.4% 0.0% 16.4% 7.6% 18.4% 0.2% 100%
As mentioned earlier, the 2014 iteration of the DMSMS cost survey featured several enhance-ments in terms of capturing additional solution characteristics, including part type, part commod-ity, and operating environment. The new data have been useful in offering additional insights into the nature of obsolescence issues faced by the DMSMS community, industry and govern-ment agencies. The discussion and cross-tabulations above present a more nuanced picture of obsolescence experience in the recent past. There is evidence that the most prevalent DMSMS resolutions involve electronic component parts in an aviation environment. Of 4,562 reported issues, 2,264 (50 percent) fit this solution profile, and of those 2,264 issues, more than half (60 percent) rely on substitute type resolutions, followed by about one-third resolutions based on ex-isting materials (logistics). A broader cross-section of programs and organizations would likely produce different distributions across environments, commodities, and parts. Needless to say, the data can be sliced in several ways, and additional elements render this data set increasingly use-ful in understanding the landscape of contemporary DMSMS issues.

14
4.3. Cost of DMSMS Resolutions
The 2014 survey went a step forward in collecting detailed cost breakdowns (wherever available and feasible) for obsolescence resolutions. This builds upon previous efforts at increasing granu-larity in understanding solution costs.11 This work posits that total solutions costs are composed of two broad categories of costs: engineering and design costs and implementation costs.12 Ta-ble 7 lists the cost elements for the two cost categories.
Table 7. Composition of Total Solution Costs
Engineering and design costs Implementation costs
Engineering/engineering data revision Qualification of new items Software development/modification Startup costs Tooling/equipment/software Other
Computer programs/documentation Interim support Supply/provisioning data Support/test equipment Technical manuals Training/training equipment Installation costs Other
Applicability and importance of cost elements are influenced by solution characteristics such as part type, commodity, and operating environment. This is driven by variation in the extent of de-sign, degree of complexity, and resource intensity associated with resolution types. Operating environment, for instance, can impose burdens of testing and certification requirements for new parts.
Instructions in the survey requested respondents to enter costs associated with each applicable cost category in dollars to the best of their knowledge and to specify whether costs were actual or estimated. Definitions and examples of each cost category were also provided in the survey in-strument. Respondents were asked to provide aggregate cost details (total engineering and design costs, total implementation costs) in the event that cost breakdowns at the requested level of de-tail were not available. The resulting data set shows that while some respondents were able to provide only total solution costs, some were able to report aggregate cost data categorized into total engineering and design costs and total implementation costs. At the same time, a sizable share of DMSMS issues has been reported with detailed cost breakdowns. The DMSMS survey’s first attempt at increasing the granularity of cost data was partially successful. However, compu-tation of average solution costs and confidence intervals requires consistency at the level of re-porting costs. The following subsections elaborate on the computation method and present find-ings based on the survey data.
4.3.1. Computation Approach Data collected using the DMSMS cost survey represents a sample of DMSMS obsolescence res-olution issues within DoD programs and systems. The likelihood of results being representative increases with the share of the entire population that is represented by the sample. Respondents
11 See Note 1, p. 72, and DD 1692, Engineering Change Proposal (ECP). 12 Material costs for purchasing parts are not included in cost calculations.

15
for the survey were identified based on the survey team’s collaboration with the DMSMS Work-ing Group,13 which has information on organizational entities that are part of obsolescence man-agement in the DoD community. The data collection process itself was uniform in its extent of outreach and follow-on support offered by BIS. Given these factors about selection of respond-ents and assistance in soliciting responses, it is safe to assume that the resulting data set is repre-sentative of the universe of DMSMS obsolescence issues.
Assuming the data are representative, one can infer that the average costs and confidence inter-vals computed using the data represent the universe of DMSMS issues faced by DoD. Average (arithmetic mean) is a measure of central tendency of a set of numbers, in this case, the costs as-sociated with DMSMS resolutions. In this data set, respondents had the ability to report one or more DMSMS issues together for a set combination of DMSMS issues and solution characteris-tics. In those cases, the reported costs were averaged. Given this structure of data reporting, av-erage costs must be weighted by the number of DMSMS issues they represent. In other words, costs of DMSMS issues/incidents must be weighted. For example, in a data set of k reported rows of cost data, average costs can be denoted as
x̄j = [(n1 * $c1) + (n2 * $c2) … (nk * $ck)] ÷ [(n1 + n2 + … nk)]
where
ni = number of issues;
ci = average cost of issues within a unique combination of solution characteristics;
k = number of rows of cost, each with its own reported number of ni; and
x̄j = average cost based on samples of resolution types j.
This computation approach must be applied for each DMSMS resolution type to generate respec-tive average solution costs (x̄j). In addition to average costs for each resolution type, confidence intervals are important because they define the degree to which one can be certain the interval contains the true population mean. It specifies the confidence level that the population mean falls somewhere in the confidence interval.14 Confidence intervals for average DMSMS resolution costs were computed based on the normal distribution for all resolution types, unless the sample size was small (<40), in which case confidence intervals would have been computed based on the student t-distribution. These are slightly different measurement techniques, because there are im-plications of sample size for confidence intervals. As the sample size gets bigger, the size of the confidence interval shrinks and, conversely, for smaller sample sizes, confidence intervals are generally wider. Widening of confidence intervals is not a desired attribute because it compro-mises the accuracy of the sample mean as an estimate of the true population mean.
13 The DMSMS working group comprises voting members (Air Force, Army, Navy, Marine Corps, DLA,
OSD), advisory members, associate members, industry liaison, and members from the academic community. The establishing charter positioned the working group as the centralized focal point for DMSMS mitigation planning, policy, and guidance for DoD.
14 Confidence intervals do not mean that 95 percent of the sample data points (costs) lie between the interval range or that the population mean will fall in this interval 95 percent of the time.

16
The generalized step-by-step approach to computing confidence intervals around resolution av-erage costs is as follows:
• Compute frequency (ni = number of issues) and mean (x̄j = average cost based on samples of resolution types j) based on the weighting method outlined above.
• Compute margin of error using appropriate Z value, standard deviation, and sample size.
• Derive left and right confidence limits (confidence interval) by subtracting the margin of er-ror from average cost and adding the margin of error to average cost respectively.
Confidence intervals for DMSMS resolutions based on the survey data set can be represented in notational format as
x̄j ± Margin of Error or x̄j ± ( z * sj/√nj)
where
x̄j = average cost based on samples of resolution types (pronounced “x bar”),
Z = 1.96 at 95 percent confidence level,15
sj = standard deviation of samples of resolution types j,16 and
√nj = square root of sample size n for resolution type j.
4.3.2. Average Costs and Confidence Intervals Data represent wide differences in coverage of DMSMS resolutions, with sample sizes represent-ing more than a thousand solution instances for some categories and less than a hundred solution instances for others. As discussed earlier, sample size plays a major role in the width of confi-dence intervals, with tighter confidence bands being more useful for interpretation and planning.
Table 8 presents average costs (taking into account all instances across the complexity spectrum of part type, commodity, and environment) and confidence intervals for each resolution type. Confidence intervals are rounded to nearest $100 for simplicity. Values in the left and right con-fidence bounds indicate a 95 percent certainty that the true average cost lies within the interval. (Table 3 shows corresponding sample sizes.)
Table 8. DMSMS Resolution Average Costs and Confidence Intervals
Solution 95% confidence
(left limit) Average cost
(mean) 95% confidence
(right limit)
Approved parts $900 $1,028 $1,100 Life-of-need buy $4,600 $5,234 $5,900 Simple substitute $11,900 $12,579 $13,200 Complex substitute $14,800 $25,410 $36,000 Extension of production or support $14,000 $25,472 $36,900 Repair, refurbishment, or reclamation $21,300 $65,015 $108,700
15 Constant Z is number of standard deviations covered by the selected confidence level (95 percent) in a stand-
ard normal distribution. 16 Square root of variance and indicates variation or dispersion from the average.

17
Table 8. DMSMS Resolution Average Costs and Confidence Intervals
Solution 95% confidence
(left limit) Average cost
(mean) 95% confidence
(right limit)
Development of a new item or source $437,600 $655,411 $873,200 Redesign–NHA $900,300 $1,092,856 $1,285,400 Redesign–complex/system replacement $7,142,100 $10,287,964 $13,433,800

18
This page intentionally left blank.

19
5. Interpretation of Results and Scope for Improvement
5.1. Representation
As noted previously, survey respondents were identified based on DMSMS Working Group col-lective information on organizational entities that are part of obsolescence management in the DoD community. The collection process was uniform in its extent of outreach and follow-on support offered by BIS. Given these factors, we can reasonably assume that the resulting data set is representative of the universe of DMSMS obsolescence issues. The variability in reported res-olution instances (ranging from <50 to >1,000) is simply attributed to the prevalence of resolu-tion practices in the DMSMS universe. Considering this point, one can infer that the average costs and confidence intervals presented in Table 9 are statistically representative of obsoles-cence management and resolution practices. Data collected from a broader cross-section of pro-grams and organizations is likely to be more representative and evenly distributed across envi-ronments, commodities, and parts.
5.2. Data Collection
The survey exercise, with its emphasis on collecting accurate, systematic, and representative in-formation on obsolescence management practices, highlights the need for a basis of estimating cost information for future resolution budgeting and planning. Although conducting a survey with a periodicity of 3–5 years may attain this goal, the survey process is difficult to design and execute and expensive to analyze. Specific information regarding the cost of DMSMS solutions could be gathered regularly by developing a reporting program and requiring DoD programs and commercial suppliers of DoD weapon systems to report annually on the cost of DMSMS solu-tions. The reports could be collated by a central DoD office and the compilation of the data could be used to update the solution cost estimates, look for trends in solution types, and refine DMSMS processes. This approach to DMSMS data would benefit the DMSMS community by providing a much more comprehensive data set regularly and would obviate the need to deal with small sample sizes and weak estimation basis related to small samples. This approach would obviate the need for a large survey research and analysis exercise every few years and of-fer insights on resolution approaches and costs more comprehensively.
DMSMS solution categories themselves undergo revisions over time due to evolving obsoles-cence management practices and available technological alternatives. This requires constant at-tention to updating metrics and their definition. This should be undertaken by a joint committee on DMSMS management that includes stakeholders from government, industry, and the research community.
5.3. Granularity of Data
Future data collection efforts should not attempt to gather cost data at the same level that this survey attempted. The limited number of responses for the detailed cost elements in Section F of the survey instrument indicates that data are not collected and are not reportable at this level. Fu-ture data collection should limit the cost granularity to the summary level: engineering and de-sign costs and solution implementation costs. Time involved in resolutions is another major fac-

20
tor in life-cycle management of DoD systems. In addition to the focus on resolution costs, future data collection efforts can consider including average time measurements of resolutions.
5.4. Cost Avoidance
Analysis of the data resulted in a large gap in average costs between the solutions Repair, Refur-bishment, or Reclamation ($65,015) and below and the solutions Development of a New Item or Source ($655,411) and above. While this gap is supported by the data in this survey as well as the preceding one, it poses a problem when calculating cost avoidance using the method pre-scribed in SD-22. That method calculates cost avoidance, when the survey’s average values are used, by calculating the difference in cost between the solution used and the next more expensive viable or executable solution. When the solutions used for calculating cost avoidance span the referenced gap, the cost avoidance can be very large. The team recommends that the cost avoid-ance calculation method be evaluated to determine if another method would better serve the DMSMS community.
21
Appendix A. Survey Instrument (Sample Extract)

22
This page intentionally left blank.

23
Appendix B. Definitions of DMSMS Concepts This appendix presents, in Tables 9 through 12, definitions of DMSMS solution types, defini-tions of solution characteristics (part type, commodity type, operating environment), definitions and examples of solution engineering and design cost elements, and definitions and examples of solution implementation cost elements.
Table 9. Definitions of Solution Types
Solution type Definition
Approved parts The obsolescence issue is resolved by the use of items already approved on the draw-ing and still in production.
Life-of-need buy A sufficient quantity of the item is purchased to sustain the product until its next tech-nology refresh or the discontinuance of the host assembly. Because this solution uses an approved item, no testing or drawing changes are required. The source of supply can be residual stock from the original manufacturer, shelf stock from distributers, sponsor-owned material, etc. Costs for packaging, storage, and transportation should be considered in the business case analysis for selecting solutions.
Repair, refurbishment, or reclamation
The obsolescence issue is resolved by instituting a repair or refurbishment program for the existing item or assembly, whether a depot repair, a repair contract with the original manufacturer, or support from a third party.
Extension of production or support
The supplier is incentivized to continue providing the obsolete items. This may involve long-term agreements to procure specific quantities of parts. One-time costs may be associated with setting up this solution. Those costs should be included in any cost and cost avoidance calculations.
Simple substitute The item is replaced with an existing item that meets all requirements without modifica-tion to either the item or its NHA and requires only minimal qualification. Associated costs are largely administrative.
Complex substitute A replacement item that has different specifications, but requires no modification of the source product or the NHA, is researched and validated.
Development of a new item or source
A replacement product is developed that meets the requirements of the original prod-uct without affecting the NHA. Nonrecurring engineering (NRE) or other development-related activities will likely be required. The new product may be emulation, a reverse-engineered product, or a product developed as a replacement using a different manu-facturer but the original manufacturing designs and processes.
Redesign–NHA The affected item’s NHA must be modified. Only the NHA is affected, and the new de-sign will not affect anything at a higher level in the system.
Redesign–complex/ system replacement
A major assembly redesign affects assemblies beyond the obsolete item’s NHA and may require that higher-level assemblies, software, and interfaces be changed.

24
Table 10. Definitions of Solution Characteristics
Solution characteristics Definition
Part type Assembly Any grouping of parts that result in a final unit that is considered a distinct item. Examples: a network switch, a diesel engine, a starter.
Component A base unit part that may be used as part of an assembly. Examples: an inte-grated circuit, a piston, an electrical switch.
Raw material The substance or substances out of which a thing is or can be made. Exam-ples: steel, fiberglass, halon, etc.
Software The programs or other code used by computers of other electronic compo-nents or assemblies. Examples: an operating system, anti-virus software.
Commodity Electrical Equipment that generates electricity, transfers or controls electricity, or which uses electricity as its prime energy source (excluding electronics, see below). Electronic controllers used by this equipment are categorized in the Electron-ics commodity. Examples: motors, switchboard, transformers.
Electronics Components, assemblies, or equipment that are built using electronic compo-nents and/or circuit card. Examples: computers, radios, radars, control circuit-ry.
Mechanical Parts, assemblies, or equipment that is neither electrical nor electronic in na-ture. Electronic controllers used by this equipment are categorized in the Electronics commodity. Examples: diesel engines, hydraulics, winches, pumps.
Operating envi-ronment
Aviation The part or equipment is used in or on aircraft. Benign or non-tactical
Equipment not expected to be in a tactical environment, or equipment that is deployed in a tactical environment but not tactical in nature and not tested to the same standards as tactical equipment. Example: shipboard laundry equipment.
Ground The part or equipment is used in a tactical ground environment. Shipboard The part or equipment is used on surface ships, boats, etc. Space The part or equipment will be used in space. Undersea The part or equipment will be used in submarines or other submerged equip-
ment.

25
Table 11. Definitions and Examples of Solution Engineering and Design Cost Elements
Element Definition Example
Engineering/ engineering data revi-sion
The one-time costs of research, design, and engineering work related to the solu-tion selected (NRE). This could range from evaluation of a substitute to the de-velopment of a new design.
Research, design, prototype development, engineering/reverse engineering, white paper development, technical data, draw-ing changes, ECP development, ECP re-view, reliability and maintainability analysis
Qualification of new items
The one-time costs to determine if a new item is suitable for use in the application. These testing and associated costs could range from simple to complex depending on the solution selected, the type of equipment, and the operating environ-ment.
Development/modification of test proce-dures, development/modification of test equipment, functional testing, unit envi-ronmental testing
Software development or modification
The one-time costs for any and all NRE-type software development or modification related to the selected solution. This could range from firmware revisions on a circuit card to the procurement of services to develop customized software.
Software procurement, application design, application development, application inte-gration, beta test plan, software testing
Startup costs (aftermar-ket, etc.)
The one-time costs associated with get-ting production started or restarted.
Contract costs associated with production startup, costs to start an organic depot, procurement of production rights or intel-lectual property
Tooling, equipment, test equipment, or software
The one-time costs for equipment needed to design, test, evaluate, and qualify the new item for the solution. Items procured that are used both during evaluation and sustainment should be included in this category. Design, engineering, and devel-opment work to prepare this equipment for use are included in the engineering cost type.
Test equipment, prototyping tooling, soft-ware

26
Table 12. Definitions and Examples of Solution Implementation Cost Elements
Element Definition Example
Computer programs/ documentation
The costs for procuring and updating computer programs and documentation for use in the field/fleet. Does not include the costs for technical manuals and other nonsoftware documentation.
Software licenses, software media distri-bution, software documentation costs
Interim support The costs for short-term measures that need to take place prior to full implemen-tation of the solution. This could be con-tract maintenance or supply support until the solution is fully supported by organic systems. May include life-of-need (bridge buy) costs to extend product life until a redesign can be implemented.
Temporary contract support to sustain the item while a permanent depot is estab-lished, bridge buy to sustain item while the final solution is implemented
Supply/provisioning data
The costs associated with updating rec-ords and data with the new solution in-formation.
Level of repair analysis, provisioning, generation of procurement documenta-tion, supply support, development of a maintenance plan
Support/test equipment The costs for modifying and/or buying support and test equipment for the new solution. Does not include the cost of equipment purchased for both develop-ment and sustainment.
Test equipment used to sustain the solu-tion, handling equipment needed to sus-tain the solution
Technical manuals The cost for updating technical manuals to reflect the new solution.
Technical documentation development, technical documentation distribution
Training/training equipment
The costs for purchasing new or updating existing training devices, training materi-als, and training to accommodate the so-lution.
Development of updates to existing train-ing course, development/modification of training equipment
Installation cost The costs to deploy the new equipment to the field/fleet. Applicable only if the new solution must be retrofitted into the field/fleet as a direct result of the original obsolescence. Does not include replace-ment by attrition.
Software media distribution, gathering of data and schedule installations, cost of installation (contractor), cost of installation (government), installation travel cost

27
Appendix C. Abbreviations BIS Bureau of Industry and Security
DMSMS Diminishing Manufacturing Sources and Material Shortages
DoD Department of Defense
DSPO Defense Standardization Program Office
ECP Engineering Change Proposal
NHA Next Higher Assembly
NRE Nonrecurring Engineering

28
This page intentionally left blank.
