discriminant function analysis basics psy524 andrew ainsworth
TRANSCRIPT
Discriminant Function Analysis
Basics
Psy524
Andrew Ainsworth

Basics
• Used to predict group membership from a set of continuous predictors
• Think of it as MANOVA in reverse – in MANOVA we asked if groups are significantly different on a set of linearly combined DVs. If this is true, than those same “DVs” can be used to predict group membership.

Basics
• How can continuous variables be linearly combined to best classify a subject into a group?
Basics• MANOVA and disriminant function
analysis are mathematically identical but are different in terms of emphasis
– discrim is usually concerned with actually putting people into groups (classification) and testing how well (or how poorly) subjects are classified
– Essentially, discrim is interested in exactly how the groups are differentiated not just that they are significantly different (as in MANOVA)
Basics
• Predictors can be given higher priority in a hierarchical analysis giving essentially what would be a discriminate function analysis with covariates (a discrim version of MANCOVA)
Questions
• the primary goal is to find a dimension(s) that groups differ on and create classification functions
• Can group membership be accurately predicted by a set of predictors?
– Essentially the same question as MANOVA
Questions• Along how many dimensions do groups
differ reliably? – creates discriminate functions (like canonical
correlations) and each is assessed for significance.
– Usually the first one or two discriminate functions are worth while and the rest are garbage.
– Each discrim function is orthogonal to the previous and the number of dimensions (discriminant functions) is equal to either the g - 1 or p, which ever is smaller.
Questions
• Are the discriminate functions interpretable or meaningful?
– Does a discrim function differentiate between groups in some meaningful way or is it just jibberish?
– How do the discrim functions correlate with each predictor?

Questions
• Can we classify new (unclassified) subjects into groups?
– Given the classification functions how accurate are we? And when we are inaccurate is there some pattern to the misclassification?
• What is the strength of association between group membership and the predictors?
Questions
• Which predictors are most important in predicting group membership?
• Can we predict group membership after removing the effects of one or more covariates?
• Can we use discriminate function analysis to estimate population parameters?
Assumptions
• The interpretation of discrim results are always taken in the context of the research design. Once again, fancy statistics do not make up for poor design.
Assumptions
• Usually discrim is used with existing groups (e.g. diagnoses, etc.)
– if classification is your goal you don’t really care
• If random assignment and you predict if subjects came from the treatment or control group then causal inference can be made.
• Assumptions are the same as those for MANOVA
Assumptions
• Missing data, unequal samples, number of subjects and power
– Missing data needs to be handled in the usual ways
– Since discrim is typically a one-way design unequal samples are not really an issue
• When classifying subjects you need to decide if you are going to weight the classifications by the existing inequality
Assumptions
• You need more cases than predictors in the smallest group
– small sample may cause something called overfitting.
– If there are more DVs than cases in any cell the cell will become singular and cannot be inverted.
– If only a few cases more than DVs equality of covariance matrices is likely to be rejected.
Assumptions
• Plus, with a small cases/DV ratio power is likely to be very small
– you can use programs like GANOVA to calculate power in MANOVA designs or you can estimate it by picking the DV with the smallest effect expected and calculate power on that variable in a univariate method
Assumptions
• Multivariate normality – assumes that the means of the various DVs in each cell and all linear combinations of them are normally distributed.
– Difficult to show explicitly– In univariate tests robustness against
violation of the assumption is assured when the degrees of freedom for error is 20 or more and equal samples
Assumptions
– If there is at least 20 cases in the smallest cell the test is robust to violations of multivariate normality even when there is unequal n.
– If you have smaller unbalanced designs than the assumption is assessed on the basis of judgment; usually OK if violation is caused by skewness and not outliers.
• Absence of outliers – the test is very sensitive to outlying cases so univariate and multivariate outliers need to be assessed in every group

Assumptions
• Homogeneity of Covariance Matrices – – Assumes that the variance/covariance matrix
in each cell of the design is sampled from the same population so they can be reasonably pooled together to make an error term
– When inference is the goal discrim is robust to violations of this assumption
Assumptions– When classification is the goal than the analysis
is highly influenced by violations because subjects will tend to be classified into groups with the largest dispersion (variance)
– This can be assessed by plotting the discriminant function scores for at least the first two functions and comparing them to see if they are about the same size and spread.
– If violated you can transform the data, use separate matrices during classification, use quadratic discrim or use non-parametric approaches to classification.
Assumptions
• Linearity – Discrim assumes linear relationships between all predictors within each group. Violations tend to reduce power and not increase alpha.
• Absence of Multicollinearity/Singularity in each cell of the design. You do not want redundant predictors because they won’t give you anymore info on how to separate groups.
Equations
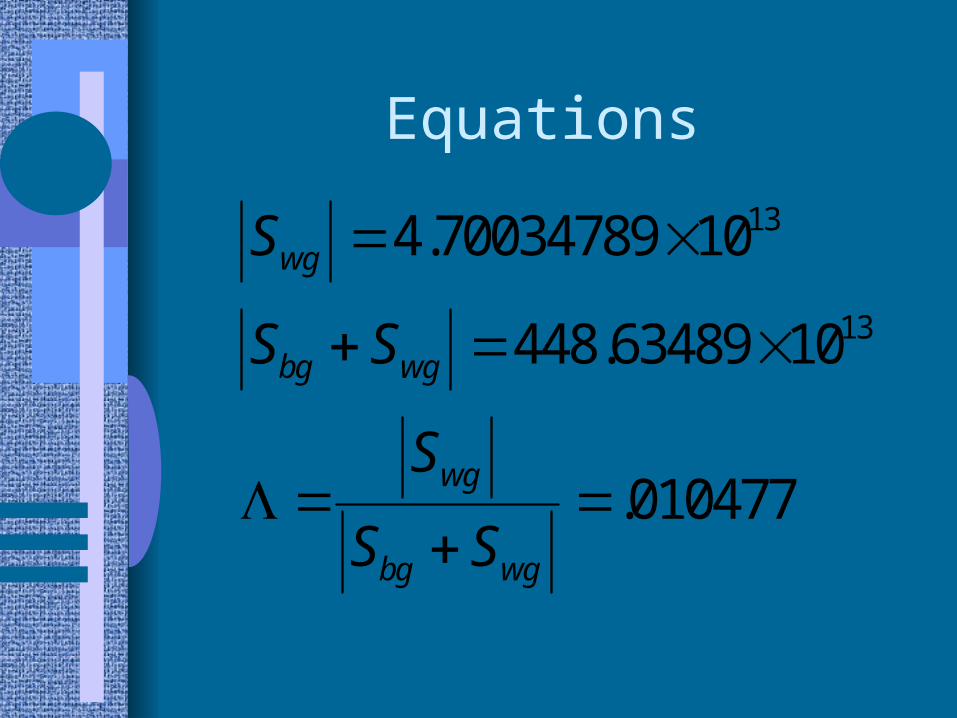
• Significance of the overall analysis; do the predictors separate the groups?
– The good news is the fundamental equations that test the significance of a set of discriminant functions are identical to MANOVA
Equations
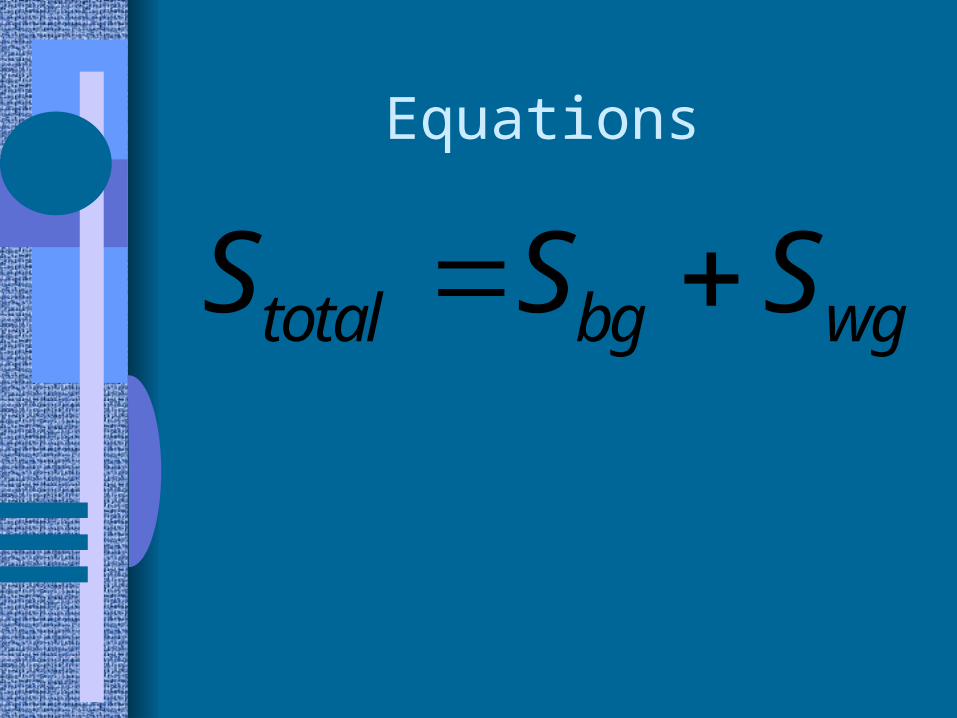
total bg wgS S S
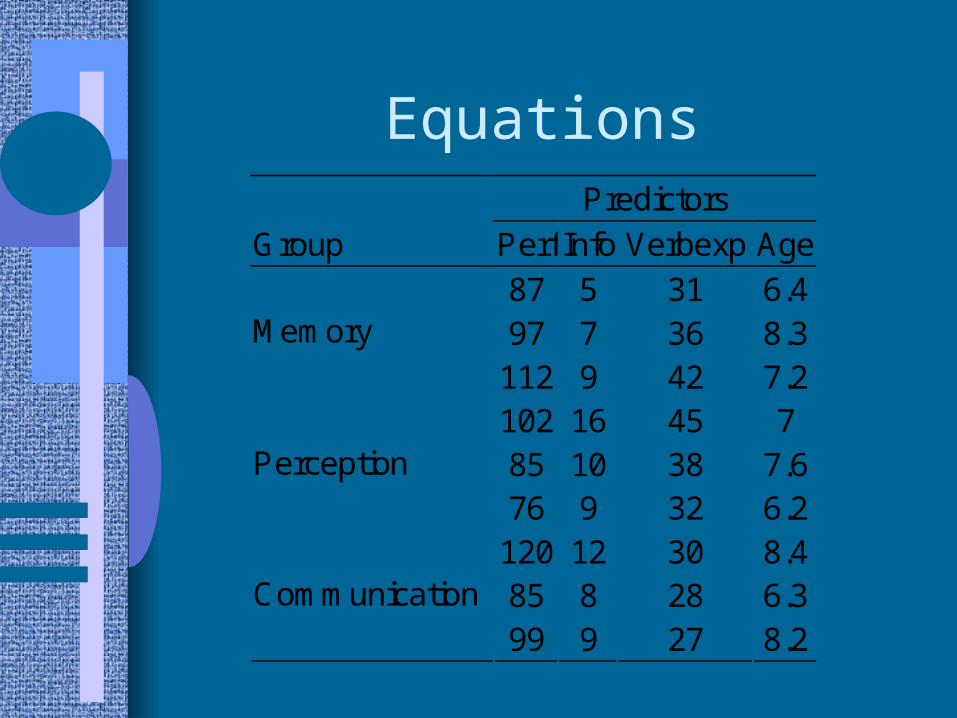
Equations Predictors
Group Perf Info Verbexp Age
87 5 31 6.4 97 7 36 8.3 Memory
112 9 42 7.2 102 16 45 7 85 10 38 7.6 Perception
76 9 32 6.2 120 12 30 8.4 85 8 28 6.3 Communication
99 9 27 8.2
Equations
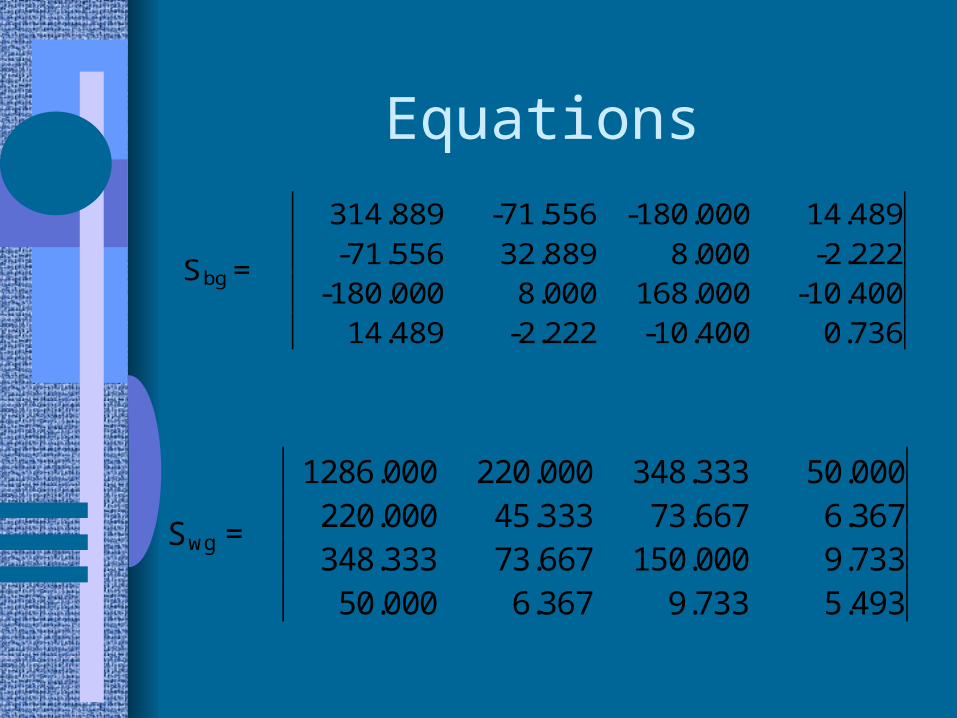
314.889 -71.556 -180.000 14.489 -71.556 32.889 8.000 -2.222 Sbg =
-180.000 8.000 168.000 -10.400 14.489 -2.222 -10.400 0.736
1286.000 220.000 348.333 50.000 220.000 45.333 73.667 6.367 Swg = 348.333 73.667 150.000 9.733
50.000 6.367 9.733 5.493
Equations
13
13
4.70034789 10
448.63489 10
.010477
wg
bg wg
wg
bg wg
S
S S
S
S S
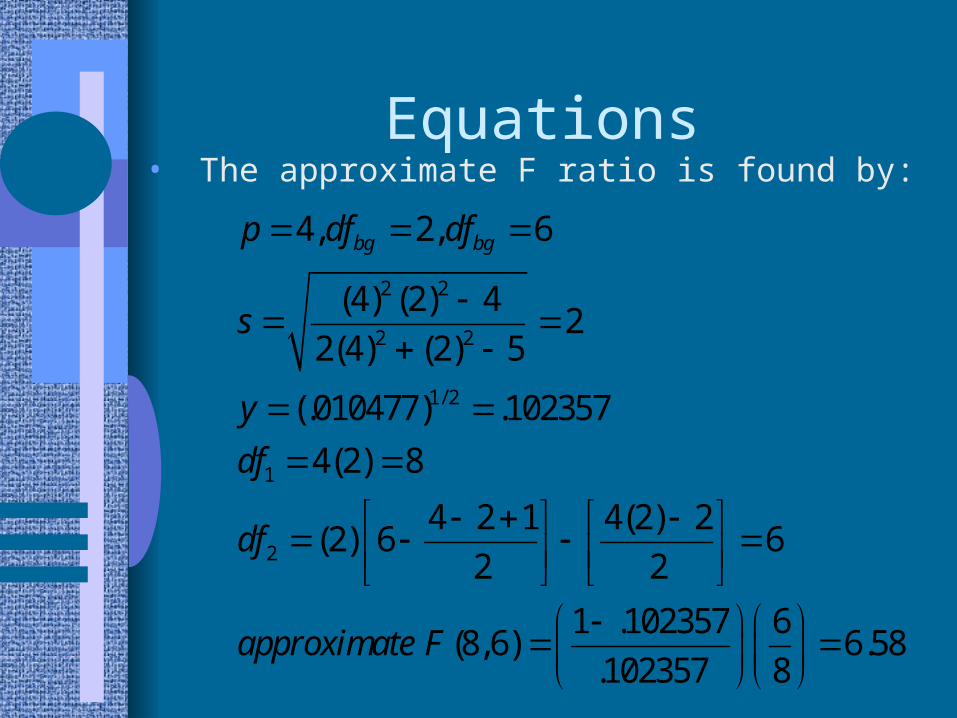
Equations• The approximate F ratio is found by:
2 2
2 2
1/ 2
1
2
4, 2, 6
(4) (2) 42
2(4) (2) 5
(.010477) .102357
4(2) 8
4 2 1 4(2) 2(2) 6 6
2 2
1 .102357 6 (8,6) 6.58
.102357 8
bg bgp df df
s
y
df
df
approximate F
Equations
• Assessing individual dimensions (discriminant functions)
– Discriminant functions are identical to canonical correlations between the groups on one side and the predictors on the other side.
– The maximum number of functions is equal to either the number of groups minus 1 or the number of predictors, which ever is smaller
Equations
– If the overall analysis is significant than most likely at least the first discrim function will be significant
– Once the discrim functions are calculated each subject is given a discriminant function score, these scores are than used to calculate correlations between the entries and the discriminant scores (loadings):

Equations
• a standardized discriminant function score
( ) equals the standardized scores times its standardized discriminant function coefficient ( ) where each is chosen to maximize the differences between groups. You can use a raw score formula as well.
1 1 2 2i i i ip pD d z d z d z
iD
idid

Equations
• Centroids are group means on
• A canonical correlation is computed for each discriminant function and it is tested for significance. Any significant discriminant function can then be interpreted using the loading matrix (later)
iD
Equations
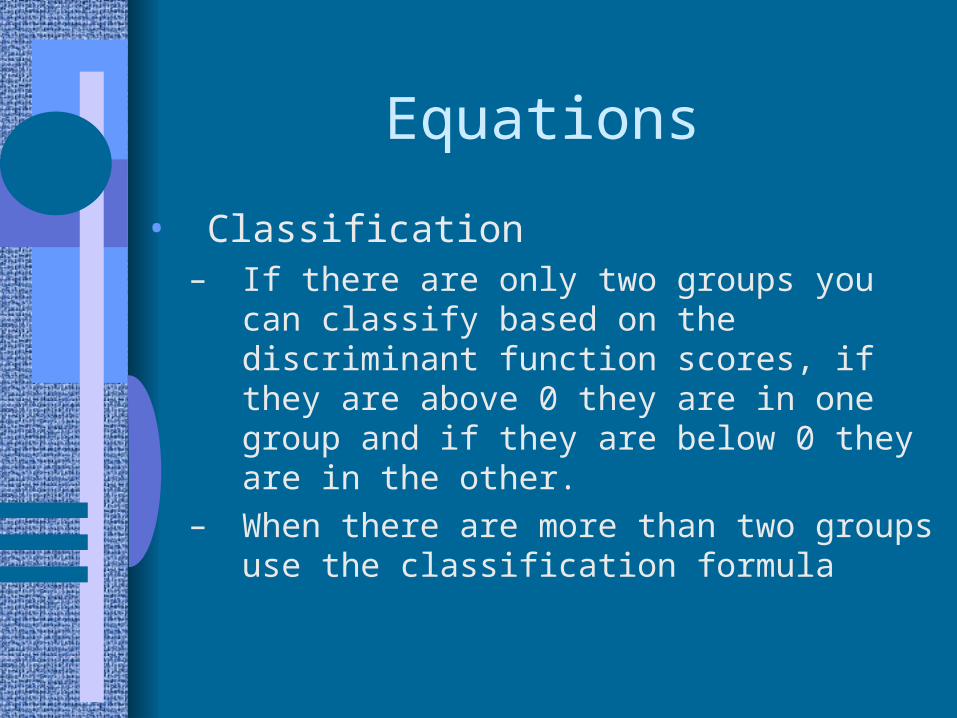
• Classification– If there are only two groups you can classify
based on the discriminant function scores, if they are above 0 they are in one group and if they are below 0 they are in the other.
– When there are more than two groups use the classification formula
Equations
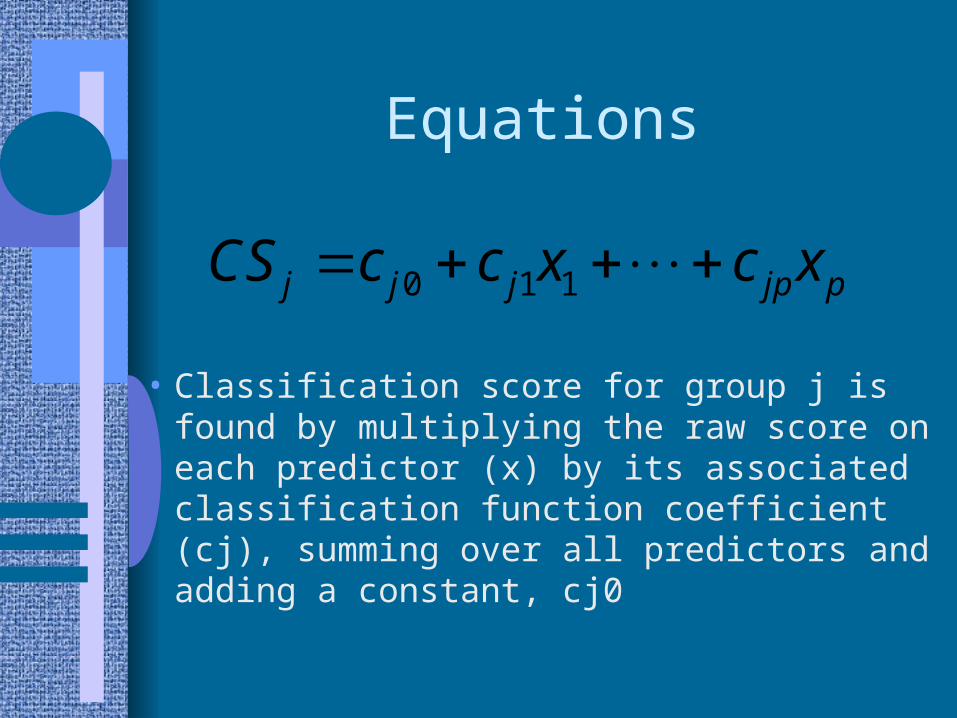
• Classification score for group j is found by multiplying the raw score on each predictor (x) by its associated classification function coefficient (cj), summing over all predictors and adding a constant, cj0
0 1 1j j j jp pCS c c x c x
Equations
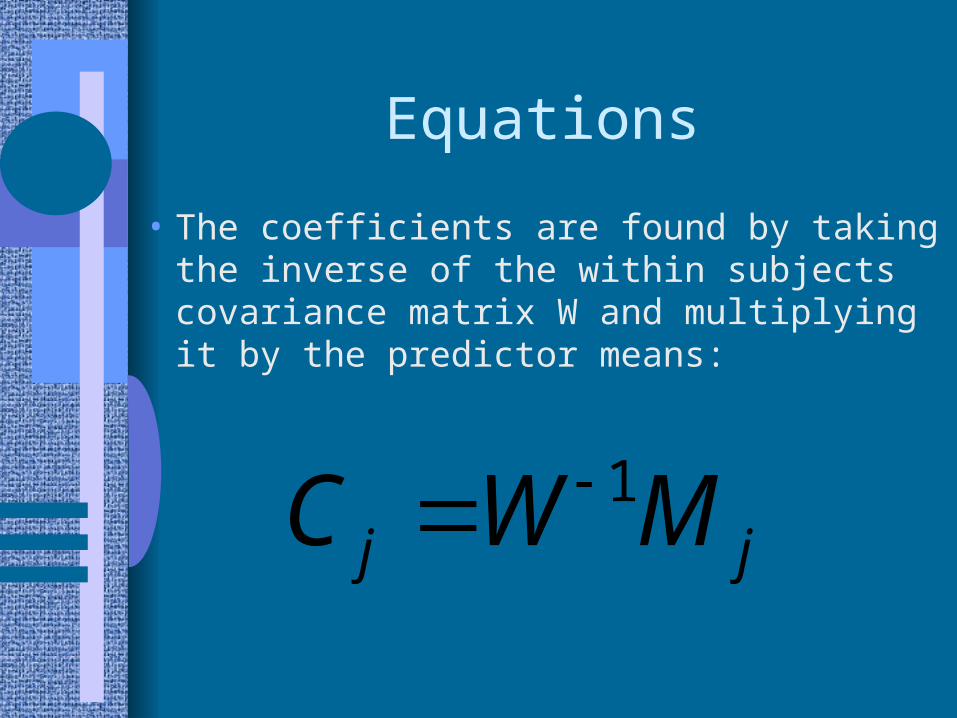
• The coefficients are found by taking the inverse of the within subjects covariance matrix W and multiplying it by the predictor means:
1j jC W M
Equations
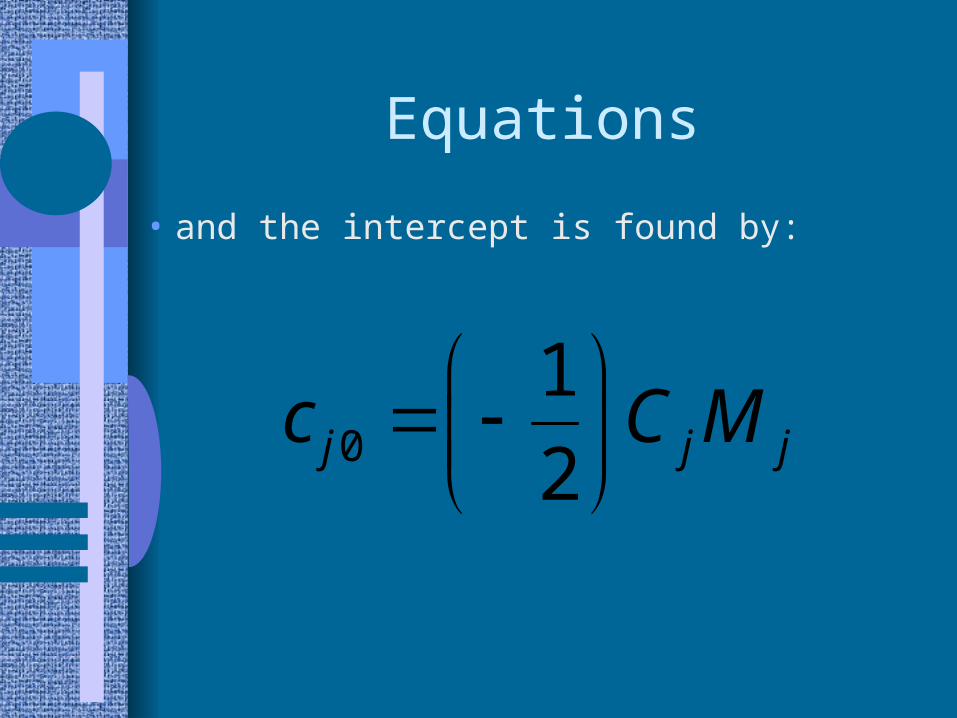
• and the intercept is found by:
0
1
2j j jc C M
Equations
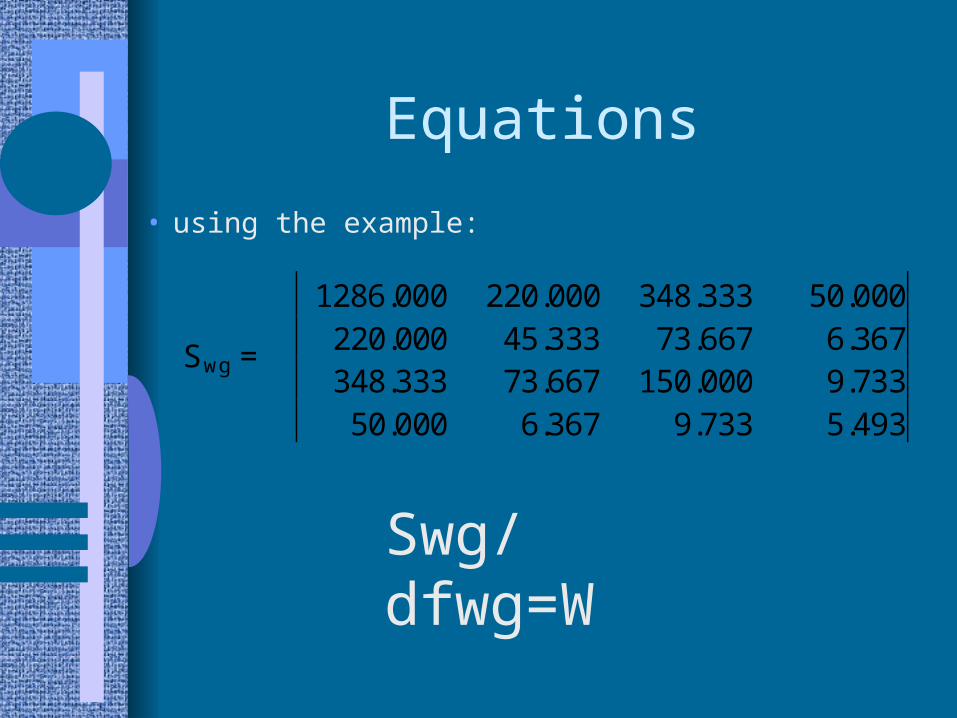
• using the example:
1286.000 220.000 348.333 50.000 220.000 45.333 73.667 6.367 Swg = 348.333 73.667 150.000 9.733
50.000 6.367 9.733 5.493
Swg/dfwg=W
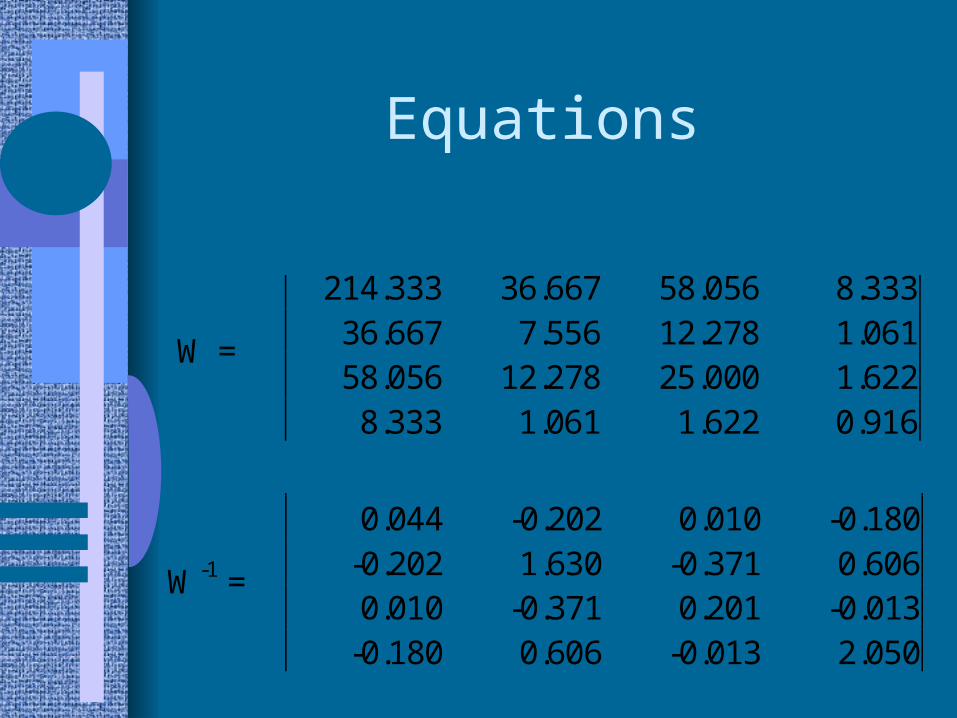
Equations
214.333 36.667 58.056 8.333 36.667 7.556 12.278 1.061 W = 58.056 12.278 25.000 1.622
8.333 1.061 1.622 0.916
0.044 -0.202 0.010 -0.180 -0.202 1.630 -0.371 0.606 W-1 = 0.010 -0.371 0.201 -0.013
-0.180 0.606 -0.013 2.050
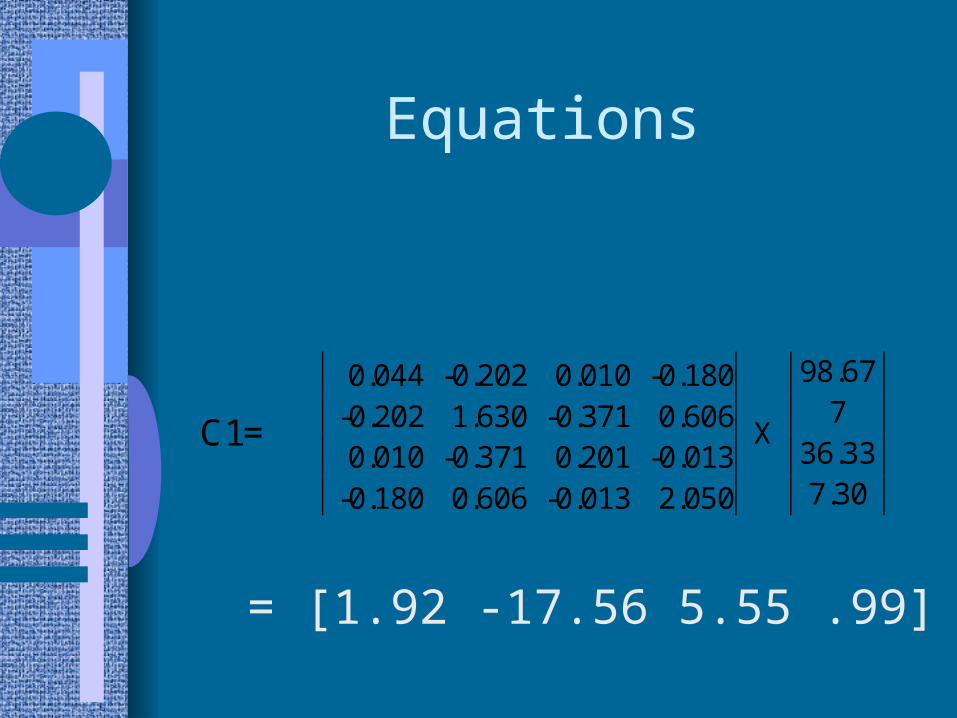
Equations
0.044 -0.202 0.010 -0.180 98.67
-0.202 1.630 -0.371 0.606 7 C1=
0.010 -0.371 0.201 -0.013 X
36.33 -0.180 0.606 -0.013 2.050 7.30
= [1.92 -17.56 5.55 .99]
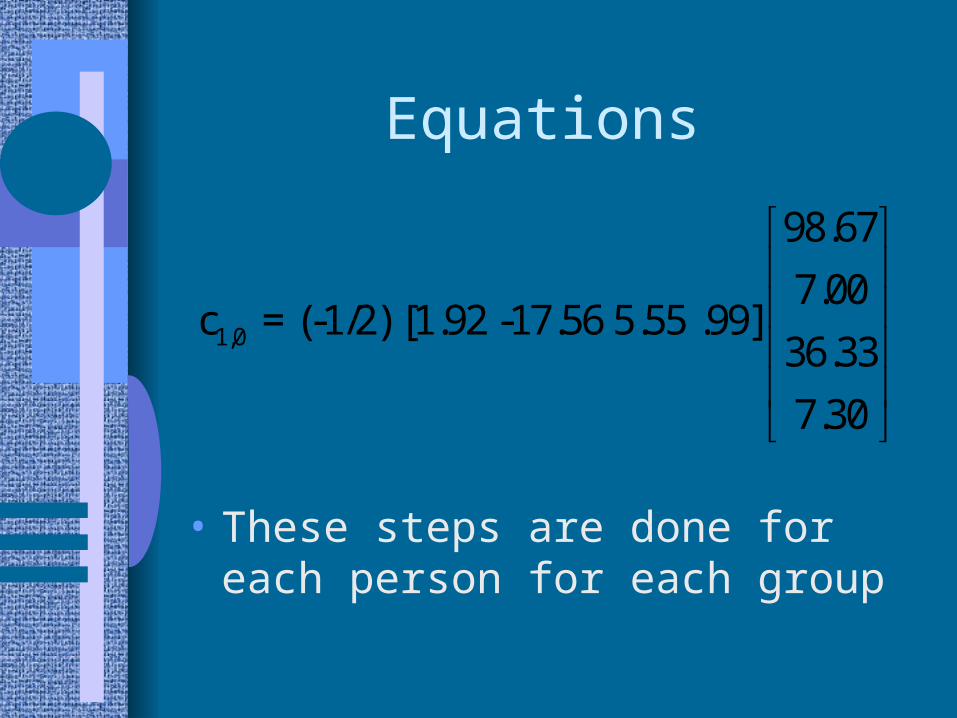
Equations
• These steps are done for each person for each group
1,0
98.67
7.00c = (-1/2) [1.92 -17.56 5.55 .99]
36.33
7.30
Equations
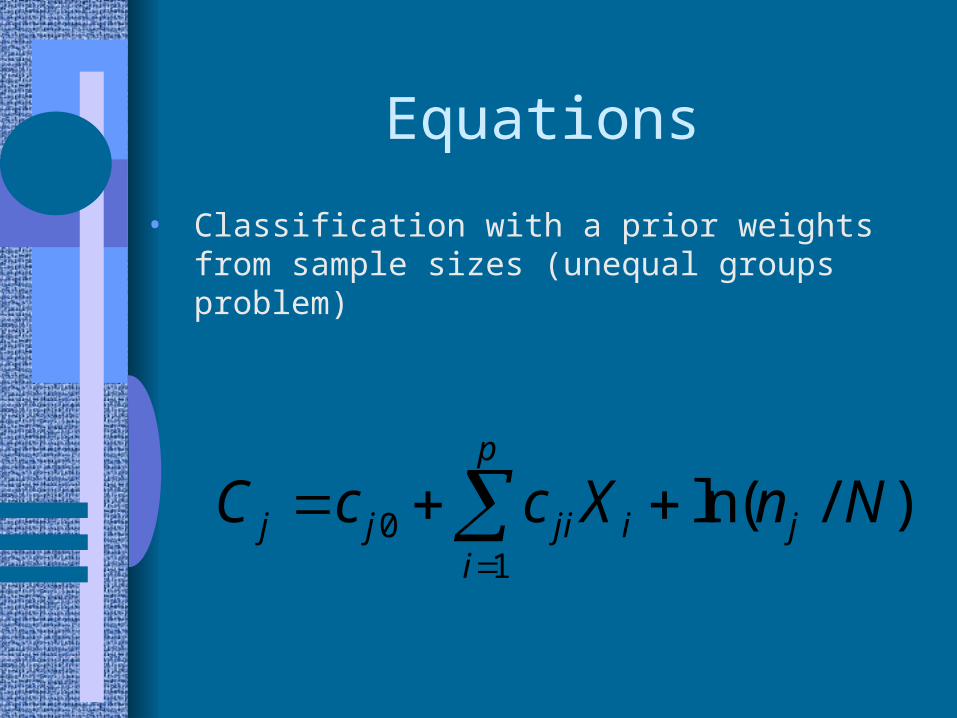
• Classification with a prior weights from sample sizes (unequal groups problem)
01
ln( / )p
j j ji i ji
C c c X n N