discrete-event simulation of an
TRANSCRIPT

DEPARTMENT OF TECHNOLOGY MANAGEMENT AND ECONOMICS DIVISION OF SUPPLY AND OPERATIONS MANAGEMENT
CHALMERS UNIVERSITY OF TECHNOLOGY Gothenburg, Sweden 2020 www.chalmers.seE2020:003
Discrete-Event Simulation of an Ear, Nose and Throat Emergency Flow Master’s thesis in Management and Economics of Innovation, and Quality and Operations Management
Sören Lambrecht Johan Skoglund
1

This page has intentionally been left blank.

Report No. E2020:003
Discrete-Event Simulation of an Ear, Nose andThroat Emergency Flow
Soren LambrechtJohan Skoglund
Department of Technology Management and EconomicsDivision of Supply and Operations Management
Chalmers University of TechnologyGothenburg, Sweden 2020

Discrete-Event Simulation of an Ear, Nose and Throat Emergency Flow
Auhors: Soren Lambrecht and Johan Skoglund
c• Soren Lambrecht, Johan Skoglund, 2020
Supervisors: Peter Almstrom and Per Medbo, Department of Technology Managementand Economics, Division of Supply and Operations Management
Examiner: Peter Almstrom, Department of Technology Management and Economics,Division of Supply and Operations Management
Report No. E2020:003Department of Technology Management and EconomicsDivision of Supply and Operations ManagementChalmers University of TechnologySE-412 96 GothenburgTelefon +46 (0)31 772 1000
Gothenburg, Sweden 2020

Abstract
The purpose of this thesis was to map and simulate the current state of the emergencyflow of the Ear, Nose and Throat (ENT) clinic at a regional hospital in the Swedish VastraGotaland region, further referred to as the Hospital, as well as suggest an alteration tothe flow with the aim of freeing up resources that could be scheduled for the vocationalcare flow.
To understand the current state of the system, theory on operations management andthe organisational aspects of healthcare was researched to understand the context of thesimulation study. In addition, theory on simulation as a method was studied to provide aroadmap for the simulation modelling phase, executed in the simulation software SIMUL8.
The method leveraged interviews and observations as sources of primary data. The in-terviews provided background knowledge about the system, assisted in the conceptualmapping and helped validate the system throughout the modelling and results collectionprocess. Observations provided process times and an understanding of the individualprocesses. Secondary data was also provided from the Hospital in the form of informa-tion about all patients admitted during the last three years. The data was analysed andaggregated manually and with the assistance of computer software, assigned to distri-bution functions and tested for goodness-of-fit. Due to the COVID-19 pandemic, thedata collection phase was interrupted early and access to the clinic restricted, leading tolimited statistical validation, and, therefore, extra validation of logical flows and processtimes.
By understanding, describing and modelling the physical state of the emergency flow,it was understood that di�erent resources a�ect the throughput time of the systemdi�erently. Physicians and nurses working directly with physicians are essential to thesystem and can not be relocated or reduced. However, nurses that are not workingdirectly with physicians are not highly utilised, and thus able to be rescheduled in orderto increase resource availability in the vocational care flow.
A desired future state model is presented in this thesis and allows for task sharing betweentwo of the nurses in the system, allowing for shorter average throughput times in the entireemergency flow. The freed up resource can be relocated to the vocational car flow of theENT clinic and decrease throughput time as well as contribute to increase accessibilityof the entire ENT clinic. The authors recommend the Hospital to pilot the solution on asmaller scale before a full-scale implementation.
In terms of generalisability and suggestions for further research, this thesis indicatesthe occurrence of sub-optimised systems within healthcare and that simulation modelingcould be used as a tool in healthcare to solve complex problems in healthcare operations.Simulation can be used to visualise and explain complex systems such as patient flows,leading to better understanding and communication.

Acknowledgements
The work entailed in this master’s thesis was carried out between January and June2020 as the final project of the authors’ master’s degrees in Industrial Engineering andManagement at Chalmers University of Technology, Gothenburg. A number of peoplehave been involved in the work that led to this report, and we would like to express ourgratefulness to everyone who has been involved.
Since it was decided that the hospital where the study was carried out was to be keptanonymous, we will not name the people who have been involved from the hospital’s side.However, we would like to extend our sincere gratitude to all of you who were involved inanswering our questions, letting us observe the processes and providing feedback to ourmodel and suggestions. Without you, this study could now have been carried out.
We would also like to thank Peter Almstrom and Per Medbo, who assisted with super-vision and guidance when we were faced with complications or if we needed some quickinput to the report and model.
Soren Lambrecht Johan Skoglund
Gothenburg, June 2020

Contents
1 Introduction 2
1.1 Background . . . . . . . . . . . . . . . . . . . . . . . . . . . . . . . . . . 2
1.2 Problem description . . . . . . . . . . . . . . . . . . . . . . . . . . . . . . 3
1.3 Aim and research questions . . . . . . . . . . . . . . . . . . . . . . . . . 3
1.4 Limitations and delimitations . . . . . . . . . . . . . . . . . . . . . . . . 4
2 Theoretical framework 5
2.1 Operations planning and control . . . . . . . . . . . . . . . . . . . . . . . 5
2.1.1 The 4 V’s of operations management . . . . . . . . . . . . . . . . 5
2.1.2 The performance objectives of healthcare operations . . . . . . . . 7
2.1.3 Capacity management . . . . . . . . . . . . . . . . . . . . . . . . 10
2.1.4 E�ciency and e�ectiveness . . . . . . . . . . . . . . . . . . . . . . 12
2.1.5 Variation and queues . . . . . . . . . . . . . . . . . . . . . . . . . 13
2.2 Healthcare organisation . . . . . . . . . . . . . . . . . . . . . . . . . . . . 14
2.2.1 What di�ers healthcare from other sectors? . . . . . . . . . . . . . 14
2.2.2 Healthcare stakeholders . . . . . . . . . . . . . . . . . . . . . . . 15
2.3 Discrete-event simulation . . . . . . . . . . . . . . . . . . . . . . . . . . . 16
2.3.1 Simulation methodology . . . . . . . . . . . . . . . . . . . . . . . 17
2.3.2 Pros and cons of simulation . . . . . . . . . . . . . . . . . . . . . 19
3 Methodology 20
3.1 Introduction . . . . . . . . . . . . . . . . . . . . . . . . . . . . . . . . . . 20

3.2 Theoretical framework . . . . . . . . . . . . . . . . . . . . . . . . . . . . 20
3.3 Data collection . . . . . . . . . . . . . . . . . . . . . . . . . . . . . . . . 21
3.3.1 Interviews . . . . . . . . . . . . . . . . . . . . . . . . . . . . . . . 21
3.3.2 Observations . . . . . . . . . . . . . . . . . . . . . . . . . . . . . 22
3.3.3 Secondary data . . . . . . . . . . . . . . . . . . . . . . . . . . . . 23
3.4 Conceptual model . . . . . . . . . . . . . . . . . . . . . . . . . . . . . . . 23
3.5 Data analysis . . . . . . . . . . . . . . . . . . . . . . . . . . . . . . . . . 23
3.5.1 Primary data . . . . . . . . . . . . . . . . . . . . . . . . . . . . . 24
3.5.2 Secondary data . . . . . . . . . . . . . . . . . . . . . . . . . . . . 26
3.6 Simulation model . . . . . . . . . . . . . . . . . . . . . . . . . . . . . . . 26
3.7 Verification and validation . . . . . . . . . . . . . . . . . . . . . . . . . . 27
3.7.1 Verification . . . . . . . . . . . . . . . . . . . . . . . . . . . . . . 27
3.7.2 Face validity . . . . . . . . . . . . . . . . . . . . . . . . . . . . . . 27
3.7.3 Statistical validity . . . . . . . . . . . . . . . . . . . . . . . . . . . 28
3.8 Future state model . . . . . . . . . . . . . . . . . . . . . . . . . . . . . . 28
3.8.1 Factorial analysis . . . . . . . . . . . . . . . . . . . . . . . . . . . 28
3.8.2 Future state model design . . . . . . . . . . . . . . . . . . . . . . 30
3.8.3 Sensitivity analysis . . . . . . . . . . . . . . . . . . . . . . . . . . 30
3.9 Reliability . . . . . . . . . . . . . . . . . . . . . . . . . . . . . . . . . . . 31
3.10 Ethics . . . . . . . . . . . . . . . . . . . . . . . . . . . . . . . . . . . . . 31
3.11 Sustainability . . . . . . . . . . . . . . . . . . . . . . . . . . . . . . . . . 32
4 Results 33
4.1 Current state . . . . . . . . . . . . . . . . . . . . . . . . . . . . . . . . . 33
4.1.1 System description and operations characteristics . . . . . . . . . 33
4.1.2 Conceptual map . . . . . . . . . . . . . . . . . . . . . . . . . . . . 34
4.1.3 Simulated results . . . . . . . . . . . . . . . . . . . . . . . . . . . 39
4.2 Factorial analysis . . . . . . . . . . . . . . . . . . . . . . . . . . . . . . . 41
4.2.1 Factorial design . . . . . . . . . . . . . . . . . . . . . . . . . . . . 41
4.2.2 Resources’ e�ects on the KPIs . . . . . . . . . . . . . . . . . . . . 43
4.3 Desired future state . . . . . . . . . . . . . . . . . . . . . . . . . . . . . . 45
4.3.1 Sensitivity analysis . . . . . . . . . . . . . . . . . . . . . . . . . . 46
5 Discussion 48
5.1 Method discussion . . . . . . . . . . . . . . . . . . . . . . . . . . . . . . 48
5.2 Discussion of system description and operations characteristics . . . . . . 50
5.3 Discussion of simulation model and results . . . . . . . . . . . . . . . . . 51
5.4 Implementation considerations . . . . . . . . . . . . . . . . . . . . . . . . 52
5.5 Extraordinary circumstances impacting the study . . . . . . . . . . . . . 53
5.6 Generalisability . . . . . . . . . . . . . . . . . . . . . . . . . . . . . . . . 54
5.7 Suggestions for further research . . . . . . . . . . . . . . . . . . . . . . . 54
6 Conclusion 56
References 58

This page has intentionally been left blank.

1Introduction
1.1 Background
Swedish healthcare is known to have a very high degree of clinical excellence and ranksamong the top 10 nations in Europe (Bjornberg & Phang, 2019). However, Sweden scoreslow in the accessibility category due to long queues and waiting times, even though thegovernment has spent a considerable amount of money to rectify the issues. Partly dueto this, Sweden has one of the highest healthcare spend per capita in Europe.
This study is carried out at one of Sweden’s largest hospitals, situated in one of Sweden’slargest regions, where the demand for care is high and waiting times for care in manycases are very long.
As a response to the accessibility and cost problems experienced in Swedish healthcare,a pilot study of a new production system within otorhinolaryngology in the VastraGotaland region is being carried out with the help of Chalmers University of Technologyresearchers. The aim of the pilot study is to increase the throughput rate without addingadditional resources. To achieve this, there is a need to create a general operations mind-set and appropriate controls, as well as aiding in the design of e�cient operations andprocesses. The pilot study also aims to develop tools that can be used for more e�ectiveplanning and decision making. This thesis is part of the pilot study.
The otorhinolaryngology clinic at the Hospital deals with patients seeking medicaltreatment for conditions related to the ears, nose or throat (ENT). The clinic receivesboth elective and emergency patients through referrals, time bookings and in some casesby patients walking in and asking for care. Paired with the department having severalflows for di�erent patient groups and carrying out both simple and complex surgeries,the planning is complicated further. As a result of this, the patient flows quickly becomecomplex. To tackle these issues, this thesis aims to leverage discrete-event simulation(simulation modelling) to find potential bottle necks and experiment with possible flowimprovements.
2

1.2 Problem description
As mentioned in chapter 1.1, Swedish healthcare is wrestling with long waiting timesand capacity issues leading to low accessibility scores. The government has historicallytried to solve the problem by increasing spending, but the e�orts have not yielded anysignificant improvements (Bjornberg & Phang, 2019).
According to Kaplan and Porter (2011), there is a general lack of understanding inhealthcare about how much delivery of patient care actually costs. Measuring healthcarecost is challenging due to the complex nature of healthcare delivery and the wide arrayof resources used. There is also a di�culty in taking a cost cutting approach, ascost reductions need to be backed by accurate data on resource utilisation and processe�ciencies to avoid jeopardising the quality of the service delivered.
Healthcare process improvement aims to improve both the quality of care and coste�ectiveness (Collden & Hellstrom, 2018). It is driven by high-level societal objectivesand financial incentives to deliver higher value to patients by utilising and managingresources e�ectively (Conway, 2019). Historically, this has not been the case as manydi�erent healthcare functions have operated in silos with limited communication andcross-functional collaboration, leading to higher overall costs in healthcare delivery.
Queues are not an issue related only to healthcare but to all kinds of operations such aslines at the supermarket, in airports and manufacturing operations. According to Slack etal. (2013), queues appear due to e.g. limited capacity, task-time variation and variabilityin demand or supply. By utilising operations management methods and tools for planningand control, long queues can be reduced and lead to an increase in operational e�ciency.
Simulation is a well-tested method to analyse how new or altered production systems willact in reality (Chung, 2004). Simulation is a cost e�ective tool to plan the design and scaleof a proposed change, as simulation runs, made on a computer, can be made in a fractionof the time demanded in the real system, with reduced analytic requirements requiredcompared to traditional mathematics and operations research. Furthermore, animatinga simulation model can act as a tool for visualising, demonstrating and communicatinga process, instead of relying solely on text and numeric descriptions.
Based on the identified problems, it is believed that operations management theory pairedwith discrete-event simulation can be used e�ectively to map and understand the ENTemergency flow. Furthermore, this thesis aims to discern how and if the emergency flowcan be altered to free up resources without negative implications to the clinic.
1.3 Aim and research questions
The aim of this thesis is to, with the help of discrete-event simulation, map and modelthe patient flow at the ENT clinic within the Hospital. The simulation model and the
3

thesis’s conclusions will, as a part of the pilot study, act as a base for analysis of thesystem and propose potential improvements.
Based in the aim and problem analysis, two research questions have been formulated thatwill be answered by utilising discrete-event simulation:
• RQ 1: What is the current state of the Hospital’s ENT emergency flow?
• RQ 2: How can the emergency flow be altered to free up resources?
1.4 Limitations and delimitations
This thesis will be delimited to the ENT clinic at the Hospital, mapping the process andsimulating the emergency patient flow. This is because the thesis is a part of the abovementioned wider pilot study, which focuses on the ENT clinic.
The simulation model will be limited to the above mentioned unit, starting with thepatient being received at the clinic and ending with the patient leaving the clinic toproceed to another unit or exit the flow entirely.
As the thesis takes an operations management and simulation perspective, any tasks thatare considered to need specific medicinal expertise will be considered outside the scope.The focus will instead be placed on the administrative and logistical aspects connectedto the patient flow.
Another limitation experienced during the thesis work was the COVID-19 pandemic,limiting access to the clinic where the study was conducted. As the pandemic took forceduring the study, the clinic was forced to restrict access to non-essential visitors. Thisimpacted the data collection work, which in turn impacted the rest of the study andsimulation model, forcing adjustments to the method as the work progressed.
4
2Theoretical framework
This chapter introduces the academic theory used during the study and for subsequentanalysis and discussion. The chapter covers three topics connected to the researchquestion: Operations planning and control, Healthcare organisation and Discrete-eventsimulation.
2.1 Operations planning and control
According to McLaughlin and Olson (2017), quality improvement is progressing at a slowrate in healthcare generally, and a strong focus on operations can help resolve this issue byincreasing safety, improving clinical outcomes, reducing costs and helping organisationsbecome more competitive. Furthermore, Chan and Green (2013) suggest that operationsresearch is useful for dealing with a high rate of variability and navigating through periodsof high congestion.
2.1.1 The 4 V’s of operations management
The 4 V’s of operations management is a way to describe an operation’s characteristicsin its dimensions of volume and variety of output, variation in demand and the degree ofvisibility that customers have into the operation (Slack et al., 2013). These V’s can furtherbe used to describe how an operation transform its inputs into outputs, helping categoriseand distinguish between di�erent operations in both similar and di�erent sectors.
Volume
The volume dimension of an operation describes how high volumes an operation produces,e.g. the number of patients treated in a hospital (Jacobsson, 2012; Slack et al., 2013).An operation with a high volume would typically enjoy benefits from specialised processtechnology and high systematisation and repetition, leading to lower unit costs andgreater e�ciency than an operation producing low volumes (Slack & Lewis, 2017).
5

However, there are not only benefits to producing in high volumes. An operationproviding a luxury service, such as a hotel, might want to limit the number of guestsand tailor its service to each individual customer, thus providing a higher variety (Slacket al., 2013).
Variety
Variety implicates the range of di�erent activities o�ered by the operation, for example ataxi service being able to pick up customers from many di�erent locations, or the numberof di�erent diseases treated in a hospital (Jacobsson, 2012; Slack & Lewis, 2017). Anoperation with a high variety requires a higher degree of flexibility than an operationwith a more standardised o�ering, like a bus service that can plan its routes in advanceand determine pickup locations and schedules in advance (Slack et al., 2013).
Variation
Variation describes how demand fluctuates as a function of changing customer demand,e.g. for healthcare services or degree of patient contact (Jacobsson, 2012; Slack et al.,2013). An operation experiencing high variety, normally has to readjust its resource basemore frequently to deal with fluctuating demand and seasonality. This requires a higherability to adjust its capacity in terms of e.g. inventory or extra resources, often leadingto a higher unit cost (Slack & Lewis, 2017).
Visibility
Visibility is the dimension which describes how ’exposed’ an operation’s activities are toits customers (Slack et al., 2013). In general, an operation which processes customershas a higher degree of visibility, for example a physical store or a healthcare process incomparison to an operation which handles material or information. Due to this highervisibility, customers will typically have a shorter waiting tolerance, and may choose towalk out if they do not get served in what they perceive to be a reasonable time. Thus, ahigh-visibility operation generally requires personnel with better customer service skills.
The degree of visibility can, even in customer processing operations, be altered to bettersuit the operation (Slack et al., 2013). For example, a retailer can choose to be web-based instead of using physical stores. By doing so, the operation can more resemblea factory with more standardised packing and dispatching, as well more centralisedwarehouses. Furthermore, the customer’s waiting tolerance typically becomes higher,making it possible for the operation to schedule its activities to a greater extent, leadingto higher resource utilisation and lower costs, compared to a physical store.
6

Implications of the 4 V’s of Operations Management
Generally, all 4 V’s have implications for how costly a product or service will be todeliver (Slack et al., 2013). Briefly summarised, a high volume, low variety, variation andvisibility help maintain processing costs on a low level, and vice versa. The 4 V’s areillustrated in figure 2.1, with high cost factors being located to the left in the figure.
Figure 2.1: Overview of the 4 V’s (Slack et al., 2013)
2.1.2 The performance objectives of healthcare operations
A common way for an operation to measure its performance is according to the basicperformance objectives quality, speed, dependability, flexibility and cost (Slack et al.,2013). These generic objectives apply to any type of operation, and can be used to guidethe organisation’s focus and improvement initiatives. Of course, each operation will haveto interpret the performance objectives to its own context and goals, and healthcare isno exception.
7

Quality
Quality is a wide concept that briefly can be regarded as the practice of ’doing thingsright’ (Slack et al., 2013). Delivering high-quality products and services to customers helpbring higher external customer satisfaction, and bring benefits to the internal operationsby reducing cost for correcting mistakes and increasing the dependability of deliveries.
In healthcare, quality is important because it concerns giving patients appropriatetreatments and carrying them out in a correct manner (Slack et al., 2013). Thus,healthcare customers can become more satisfied with their care and the tax payer canbe sure to receive value for his or her money (Ross, 2014). Furthermore, emphasisinghigh-quality care can limit the need for revisits (Modig & Ahlstrom, 2012), and ensurethat patients are protected from mistakes of well-meaning personnel (Ross, 2014).
Speed
Speed can be described as the time elapsed between a customer request and the receiptof those products or services (Slack et al., 2013). Speedy deliveries mean that customerreceives products or services quicker, increasing the likelihood that they are willing topay, or increasing the benefit that they receive.
Healthcare operations are very dependent on speed (Belvedere, 2014). This fact isparticularly true in emergency services, where increasing speed by a matter of secondscan determine whether a patient lives or dies (Slack et al., 2013). Thus, being able todeliver the correct care within minutes is a great advantage within healthcare. Moreover,speed can also be an advantage within non-emergency operations to minimise waitingtimes, e.g. when waiting for test results or x-ray pictures to come back.
Dependability
Dependability is doing things in time, such as delivering products or services when theyare needed or promised (Slack et al., 2013). Dependability is important because deliveringtoo early could mean that a product needs to be placed in inventory, running the risk ofbecoming old, or that a service is carried out before it is needed. Delivering too late runsthe risk of supplying the product or service when it is no longer needed.
Dependability in healthcare could mean for example that appointments are carried out intime and not cancelled, or that test results are returned when they are promised (Slacket al., 2013). Moreover, achieving a high dependability can help save time and moneythrough utilising resources more e�ectively, and keep the operation running with a higherdegree of stability.
8

Flexibility
Flexibility is described as being able to change the operations and can be definedaccording to four general categories: (1) product/service flexibility, meaning how anoperation can introduce new/modified products or services, (2) mix flexibility, the abilityto produce a wide range or di�erent kinds of products and services, (3) volume flexibility,governing how an operation can scale up or down its activity or output volume, and(4) delivery flexibility, being able to change when deliveries are carried out (Slack et al.,2013).
In healthcare, flexibility might mean that new types of treatments can be introduced(product/service), that a wide range of treatments can be supplied (mix), that the volumeof treated patients can be adjusted (volume), and that the operation is easily able toreschedule appointments (delivery) (Slack et al., 2013). Moreover, a flexible healthcareoperation can quickly transfer sta� and equipment between departments, adapt quicklyto changing patient conditions, and take care of sudden spikes in patient inflow withoutdisrupting the rest of the operations.
Cost
Cost is a central performance objective for many operations, and is heavily a�ected by thechoices being made in regards to the other performance objectives (Slack et al., 2013). Alow internal cost structure can enable a company to successfully compete on price, or keepprofit margins high to free up capital for new investments or dividends to shareholders.
Healthcare is a costly sector, requiring substantial expenses for technology, materials,facilities and sta� (Slack et al., 2013). Moreover, a healthcare operation must be coste�cient (Belvedere, 2014). By reducing costs where possible, funds can be transferred todepartments that require more money and in turn, the provided care can o�er a higherdegree of quality (Slack et al., 2013).
Trade-o�s between performance objectives
Naturally, an organisation cannot be good at everything. Skinner (1969) exemplifies theconcept of trade-o�s by stating an airplane design analogy: ”For instance, no one todaycan design a 500-passenger plane that can land on a carrier and also break the sonicbarrier” (Skinner, 1969, p.140). In the same way, there might exist trade-o�s betweenoperations performance objectives (Slack et al., 2013). An easy way to illustrate how anoperation performs is to draw the objectives in a polar diagram, illustrated in figure 2.2where a taxi and a bus service are compared.
However, Slack et al. (2013) states that there are two general ways of viewing trade-o�s.The first way is to regard an increase in one performance objective to come at the expenseof another, also called ’repositioning’. The other way is to increase the organisation’s
9

Figure 2.2: Polar diagram of performance objectives (Slack et al., 2013)
e�ectiveness and overcome trade-o�s in a sense that several performance objectives canbe improved simultaneously. Generally, an operation deals with both approaches.
2.1.3 Capacity management
A fundamental decision area in an operation is capacity, dictating the ability to providesu�cient supply to satisfy demand (Slack & Lewis, 2017). However, it is not asstraightforward as simply providing a steady state of capacity. As demand fluctuates, anoperation needs to adjust accordingly, leading to important decisions having to be madein order to get its capacity right and not incur losses in its competitive abilities. Forexample, too much capacity leads to underutilisation of resources and higher costs, whiletoo little capacity fails to supply customer demand and impacts the operation’s revenuesand drives up cost here as well.
In healthcare operations, capacity management is di�cult due to the processing andscheduling of patients, paired with issues regarding high resource utilisation due tocapacity bottlenecks moving across the system (Boaden et al., 2008). Furthermore,hospitals tend to focus more on long-term aggregate capacity because of trends in demandand budgetary requirements. Consequently, it is di�cult for managers in healthcare torespond to small changes in volume or variety.
However, healthcare operations can, like other operations, deal with varying supply
10

and demand, and there are generic strategies for doing so. Slack et al. (2013) outlinesthree generic approaches for coping with demand fluctuations: level capacity plan, chasedemand plan, and demand management.
Level capacity plan
A level capacity plan attempts to ignore forecast demand fluctuations and deal withdemand by setting processing capacity at a constant level during the planning period(Slack et al., 2013). Because services cannot be stored, a level capacity plan would implythat a service operation would run with slack resources during periods of low demand,usually leading to wasted sta� resources and low productivity. Generally, a lower capacityutilisation can be accepted in high contact service operations, like healthcare, to be ableto meet peak demand (Chase, 1978).
In healthcare, a level capacity plan can help contain costs at the expense of longer queues,but this implies that patients are willing to wait for the services (Boaden et al., 2008).
Chase demand plan
The chase demand plan is opposite to the level capacity plan and implies that companyattempts to match its capacity to varying forecast demand, and is usually leveraged byoperations producing perishable goods or services (Slack et al., 2013). Ways to adjustthe capacity are e.g. adding or removing shifts, using part-time sta� and subcontracting.In healthcare, the chase demand plan focuses on service quality and helps maintain lowwaiting times (Boaden et al., 2008). For example, the NHS (United Kingdom NationalHealth Service) chose to start increasing its capacity during wintertime to cope with thehigher demand.
Demand management
The third strategy for coping with demand is to try to adjust the demand itself (Slack etal., 2013). Two general approaches to this are price adjustments and providing alternativeproducts and services. Since healthcare services rarely can be stored for later use, demandmanagement can be an e�ective way to manage processes related to patient admissionsand surgical schedules, based on the expected time a patient will spend at a hospital, andcan lead to better quality and cost performance (Boaden et al., 2008).
An important part of healthcare demand management is the extent of ’failure demand’(Boaden et al., 2008). This is when services have to be provided again due to the customernot being satisfied the first time, or if an alternative service is not available at the timewhen a customer needs it. The reason for failure demand can be because of severalsystem failures, e.g. when a system cannot provide a service or if a customers do notunderstand what the system expects from them. According to Kjøller and Westergaard
11

(2017), reducing failure demand helps an organisation shift its e�orts towards solving thecustomer’s needs, instead of focusing on the demand that the organisation created itself(failure demand).
2.1.4 E�ciency and e�ectiveness
When measuring a process, it is important to consider several measures to capture theprocess’ performance (Holweg et al., 2018). Process performance can be divided into twobasic categories: e�ectiveness and e�ciency. Generally speaking, e�ectiveness concernsdoing the right things, while e�ciency concerns doing the things right (Alange, 1994). Inessence, there is no use working towards an e�cient process if it is not e�ective in thefirst place.
E�ectiveness it the external view of performance, describing if the process delivers whatis expected by the customer (Holweg et al., 2018). With this definition, the e�ectivenesscan only be determined by the customer alone.
E�ciency regards how good a process is at converting resources into outcomes (Holweget al., 2018). Generally, it considers the notion of productivity, e.g. labour, energy,machinery or materials e�ciency. A measure that is more complete but more di�cultto assess it the total factor productivity, which consists of the ratio of the sum of alloutputs to the sum of all inputs, illustrated by equation 2.1. As this is measure is a ratio,productivity can be increased by either increasing the output or reducing the inputs fora given output.
(Total factor) Productivity =q
outputsq
inputs(2.1)
In relation to services, internal e�ectiveness has a strong impact on performance objectivesand cost (Slack et al., 2013). For example, high-quality operations rarely need to wastee�ort on redoing things. Fast operations maintain low in-process inventories and reduceadministrative overhead costs. Dependable operations can be relied on to deliver what isplanned and on time, eliminating wasteful disruptions. Flexible operations can quicklyadapt to changing circumstances without impacting the other pars of the operations,while being able to switch between tasks quickly.
Some examples on how to increase e�ciency are given by Sasser (1976). During peakhours, employees can be instructed only to perform tasks that are essential for servicedelivery, backed up by managers who can perform supporting tasks during slack times.Managers can also examine tasks performed during peak time and find out whethercertain skills are ine�ciently used or lacking, e.g. through the use of paramedics. A finalway to manage peak capacity constraints is through cross-training of employees. If theylearn to perform several tasks, employees in the system can switch from underused tostrained stations and thus increase its capability to handle bottlenecks.
12

2.1.5 Variation and queues
Holweg et al. (2018) describe 10 principles in their book about process theory. The firstprinciple states that all operations are composed of processes. The next step is aboutvariation and how it inherited by di�erent processes. Variation can occur in quantity,quality and timing. Additionally, variation can be bu�ered by the following three means:time, inventory, and capacity.
Bu�ering refers to decrease the impact of blocking and starving parts of an operation(Holweg et al., 2018). High variation impacts an operation and its processes in manyways, among these, it impacts the capacity and the queues. A way to represent therelation between capacity utilisation, variation and the length of queue is the ’KingmanFormula’. If the variation of a system increases, the utilisation rate decreases and thequeuing time increases. A graphical representation of the Kingman Formula is shown infigure 2.3, illustrating the relationship between capacity utilisation (fl) and queue length(lead time).
Figure 2.3: Graph of the Kingman Formula (Holweg et al., 2018)
Another measure used to judge processes is the throughput rate, which is the speed of aprocess (Holweg et al., 2018). It is the time it takes to journey from the beginning of aprocess to its end. Throughput rate is often targeted in operations management. Sincebeing able to increase the throughput rate with the same resources means an increasein output with the equal input, this implies a higher profit. There are several waysof decreasing throughput time, some of them are: breaking up bottle necks, removingnon-value adding steps and changing the physical layout of the system.
Modig and Ahlstrom (2012) describes the e�ciency paradox and how it a�ects improve-ment work. From a organisation’s perspective, maximising resource utilisation is usuallydesirable, however from a customer’s perspective it is not. Maximal utilisation of re-sources implies no capacity for variation in demand and increased queuing time, therefore
13

it is not always desirable to maximise the utilisation. Especially in healthcare, increasedqueues can lead to ine�ciency from a customer perspective in various ways. For exam-ple, when waiting too long for surgery, a patient has to leave work for a longer period.The authors mean that all needs create new ones, hence from a customer and societyperspective healthcare needs to decrease throughput time.
2.2 Healthcare organisation
The healthcare organisation is a complex subject, and applying quality and processimprovement approaches in healthcare is not entirely straightforward, partly attributedthe healthcare sector’s di�erence from other industries (Boaden et al., 2008). Thestakeholder perspective is also discussed by Glouberman and Mintzberg (2001), and isdiscussed later in this section.
2.2.1 What di�ers healthcare from other sectors?
Since the healthcare sector is di�erent from other industries, Boaden et al. (2008) outlinedi�erences related to e.g. the professional nature of healthcare, the complex internaland external structure of the healthcare system, and di�culties in succeeding in changee�orts.
The professional nature of healthcare
Due to the professional nature of healthcare services, it is characterised by a highlevel of professional autonomy (Boaden et al., 2008). Illustrative of this, doctors haveconsiderable discretion and autonomy due to the breadth and depth of knowledgein solving complex problems. They are also loyal to their profession, tend to workindependently and usually have to be persuaded to support change initiatives. Currently,doctors tend to act as skilled craftpersons managing their own patient waiting lists, clinicsand operations inside a mass production-focused general hospital (Jones, 2006).
The complex structure of healthcare
Healthcare is more complex compared to other industries working with quality improve-ment approaches according to Boaden et al. (2008). A wide variety of inputs are trans-formed to produce conceptually complex outputs, and the methodologies used to measurethese are measured in a wide number of dimensions. There is a general lack of top-down,whole-system view, leading to di�culties in defining both the output and who the cus-tomers are.
14
Another factor adding complexity is that the healthcare system is financed by publictax money (Druckler, 2011). Healthcare institutions need to be independent frompoliticisation and governed according to the institution’s own values. At the same time,healthcare policy making is one of the political areas with the highest magnitude, andgovernments are held accountable for the performance of the healthcare system. Thisgives politicians a high degree of responsibility, but a low degree of control over how thesystem performs.
The di�culty and complexity of change e�orts
Boaden et al. (2008) describe several factors as to why changing healthcare is di�cult.Since the system consists of several organisations with potentially conflicting missions,the assessment would require tackling issues from several dimensions.
The workforce in healthcare is made up of multiple di�erent professions with di�erenteducations and training, e.g. doctors, nurses and engineers (Boaden et al., 2008). Dueto this, these professional groups tend to be influenced by their background, leadingto the groups identifying with their professions and not necessarily their organisations.Goransson et al. (2018) state that doctors and nurses tend to work for di�erent managers,leading to di�culties regarding social a�liation and identification.
Lastly, both the internal and external environments are complex with multiple stake-holders such as patients, their families, governments and professional associates (Boadenet al., 2008). Druckler (2011) emphasises the importance of considering external factors,as a complex and chaotic system cannot exclude these factors. As the environment iscomplex, pressure to standardise clinical work while allowing for flexibility, paired withemerging evidence that supports or discredits current ways of working and variation inperformance between units build upon the challenges of implementing change in health-care (Boaden et al., 2008).
2.2.2 Healthcare stakeholders
Glouberman and Mintzberg (2001) explain the complexity of healthcare due to thedi�erent stakeholders and their underlying interests. These interests do not necessaryoverlap, hence the di�culty in governance. The authors start by describing the internalinterest at a hospital and continue with describing the di�erent stakeholders involved inhospital governance from macro perspective. In figure 2.4 managing is divide into fourdi�erent directions: out, up, in and down. Managing out refers to people involved inthe organisation but technically independent, up refers to managing towards people incontrol, in, towards units and people under clear control of the institution and down, intothe operations that focuses on treatment of patients.
As figure 2.4 shows, doctors are relatively independent and focused on treating patients.Nurses are also concerned with taking care of patients, but in contrast to doctors, theyare under clear control and cannot enjoy the same institutional freedom. The di�erence
15

between trustees and managers is the same as between doctors and nurse, with theexception that both are managing towards people in control and not patients.
Glouberman and Mintzberg (2001) take the framework in the left of figure 2.4 (GeneralHospital) and expand it into the framework represented on the right (Society). This newframework includes external stakeholders impacting the operations and leadership withina hospital. The Four Worlds of Society follows the same logic as in the General Hospital,and gives an explanation to why healthcare is one of the most complex systems knownto contemporary society. The larger the di�erence is between di�erent groups, the moretheir independent goals di�er. Since the stakeholders are presented as very di�erent,there is a need for extensive integration.
Figure 2.4: Four Worlds of the General Hospital and Society (Glouberman & Mintzberg,2001)
2.3 Discrete-event simulation
Chung (2004) describes simulation modelling as mathematically modelling a physicalsystem. Simulation is a comprehensive way to test hypothesises by experimenting witha model. It is also a way of gaining insights into a physical system without actuallydisturbing it. Di�erent physical systems can be modelled, for example manufacturingsystems and service systems like warehouses, hospitals and medical clinics.
Jingshan et al. (2017) describe several use cases of simulation in healthcare. The authorsbelieve that simulation modelling is well suited for some of the complex systems withinhealthcare, and that a more scientific strenuous approach towards solving these problemsis a trend that will continue.
16

2.3.1 Simulation methodology
Chung (2004) describes the practical agenda of simulation modelling in nine steps:problem formulation, project planning, system definition, input data collection, modeltranslation, verification, validation, experimental design, analysis and presenting resultsand conclusion. Out of these nine steps six, slightly modified, steps are presented morein depth below.
All steps are a important part of a successful simulation modelling project, however theearlier a mistake is made the more di�cult it becomes to rectify it. Hence, the systemdefinition and data collection are crucial to provide a successful model translation. Sincethe later steps still are possible to conduct even if mistakes are made in previous steps,verification and validation cannot be emphasised enough (Chung, 2004).
System definition
The system definition sets the boundaries for the future model (Chung, 2004). Inthis step the system is classified, i.e. decided on how much of the physical systemthat should be included, what events to include and what data to collect. It isimportant to understand whether the system is of discrete, continuous or combinednature. Furthermore, understanding whether it is terminating or non-terminating.
The conceptual model is a high-level flow chart representing the physical model. Thismodel sets the foundation for further modelling. It illustrates where input and outputenter and exit the system, it also demonstrates what kind of data that needs to becollected. The practitioner should endeavour to construct a well representative conceptualmodel, yet not a too detailed one (Chung, 2004).
Empirical data and analysis
To be able to translate the conceptual model into an actually functioning simulationmodel data needs to be collected (Chung, 2004). The data represents the di�erentactivities in the conceptual model. For example, to model a process, the process needsto be assigned, for example, a probability distribution in order to be simulated. If not,the model does not know how long a certain entity lasts in the process. All activities,described as processes in the model, need to be described by underlying mathematicalfunctions. Therefore, data needs to be gathered for every activity.
After the data is gathered it needs to be fitted (Chung, 2004). Random samples cannot beused, however they can be utilised to create distributions. To fit data, di�erent softwarecan be used, but using Excel can be fully su�cient. To generate appropriate distributionsit is important to have enough data points. If not, the distributions can contribute to amisleading model.
17

Model translation
After understanding the physical flow and fitting data, the system (conceptual model)can be translated into a computer based model (Chung, 2004). If the prior steps are notconducted, the practitioner does not know what to include. In this step it is importantto choose a simulation software that the practitioner is comfortable with. When startingto translate the model, it is important to follow a strategy that prohibits building a toocomplex, possibly erroneous system. By starting in a certain section and building in anadd-on manner, also called a divide-and-conquer approach, it becomes easier to test thesystem during the build up. This is one of many strategies.
Verification
To enable that the simulation model works properly, it is important to be certain thatthe model is a good representation of the physical system (Chung, 2004). Verifying themodel is not a one time check, but rather a continuous approach. Therefore, verification isincluded in the model translation. By including representations of queues and processes,in terms of pictures, it becomes easier to understand the model and make sure that itrepresents the physical system.
Validation
Validation is understanding whether the model actually performs as intended (Chung,2004). There are two types of validation: face validity and statistical validity. Validationcan tell the practitioner if the model performs correctly however it does not necessarytell what the defect is.
Validation is an important step after verification, since verification does not test forassumptions, simplifications, oversights, etc. (Chung, 2004). Face validity is achievedby the assistance of a domain expert. Meaning, if the expert does not see a di�erencebetween the physical system and the model, face validity is reached.
Statistical validity is reached by statistical comparison between output data from thephysical model and the simulation model (Chung, 2004). Statistical validity can beconducted on individual entity data or entire system data. If statistical validity cannotbe reached, the model needs to be examined for flaws. If not, the model can generallynot be used for experimental design.
Experiment design and analysis
The experimental design looks slightly di�erent if the system modelled actually exists oris non-existent (Chung, 2004). If the system is non-existent, a reference system needsto be created. Given existing or non-existing systems, the experimental design can be
18

of one-factor, two-factor or multiple factor design. An increase in factors contributesto a more complex analysis. To clarify, factors can for example be number of clerks orqueue policies. To counteract an increasing complexity the levels of each factor shouldbe limited.
After the experimental design, an analysis of the experiment usually follows (Chung,2004). Depending on the experiment and the predetermined confidence level, di�erentstatistical tests should be conducted. Further, if the model is non-terminating, the steadystate needs to be determined, often by using linear regression. In non-terminating systemsauto-correlation could become a problem. This could occur due to subsequent runsdepending on previous runs. To cancel auto-correlation, a non-terminating system canbe run for a longer time and be divided into batches.
2.3.2 Pros and cons of simulation
Chung (2004) mentions three distinctive advantages with simulation modelling: exper-imentation in compressed time, reduced analytic requirements and easily demonstratedmodels. The simulation model is modelled on a computer which means that once themodel is constructed experiments can be made in compressed time. With the softwareaiding both modelling and experimenting the analytical requirements of the practitionerare no longer as high as they once were. The modern software also includes animationmaking it easier to demonstrate the model. In addition to this, the model, as mentionedabove, does not disturb the physical system.
Chung (2004) further explains disadvantages with simulation modelling: simulationcannot give accurate results when input data is inaccurate, simulation cannot provideeasy answers to complex problems and simulation cannot solve problems by itself. If theinput data is inaccurate no model can generate a just foundation for implications, alsothe model does not solve any problems itself, a well functioning simulation model canonly be of help if the practitioner knows how to conduct relevant experiments and convertthese into implications. These implications in turn can only improve the physical systemif they are implemented.
19
3Methodology
This chapter describes the method used to investigate the research questions. It aimsto give the reader a comprehensive understanding of the work carried out for deeperunderstanding and potential additional research.
3.1 Introduction
Chung (2004) describes simulation as a technique for mathematical modelling of physicalsystems. Regarding the research questions of this thesis, simulation was regarded as anappropriate tool to find possible solutions based on theory and experiments, which thenin turn helped answer the questions. Simulation provided both the ability to mappingthe operation in detail, as well as the ability to experiment with the system by adjustingparameters.
In accordance with Wallen (1993), this is a descriptive study with normative tendencies.Due to mapping out the operations of the ENT clinic and modelling the flow of patients,this study utilises a descriptive method. Experimenting with di�erent scenarios andrunning them in the model also included normative elements.
Given that this study considered existing problems at the ENT clinic by analysingcollected data and applying an iteratively developed theoretical framework, it alsoincludes some inductive elements. Wallen (1993) describes that inductive studies drawconclusions upon insights in data rather than by using abduction. One of the implicationsof induction is that empirical data directs the extent of the literature review.
3.2 Theoretical framework
The theoretical framework was created to enable a stringent analysis of the empiricaldata. It was later leveraged to fully analyse and understand the findings presented inthe study. For example, results that were found during data collection and analysis werecompared with literature from the framework in the discussion chapter. By doing so, the
20
authors could enable a more robust analysis and a more reliable result. The approach iswell aligned with what Wallen (1993) describes as part of an inductive approach.
Recommended literature by expert guidance and literature from Chalmers University’slibrary, Google Scholar and other internet sources were used when creating the theoreticalframework. These sources helped in creating three subsections in the framework:operations planning and control, the performance objectives of healthcare operations, andsimulation modelling.
3.3 Data collection
Data was collected throughout the project with the highest intensity during the earlystages. To be able to model the ENT clinic’s emergency flow, it first had to be mappedout and then be thoroughly examined to clearly model all the di�erent steps. To enablethis, di�erent data sources were used. Interviews and observations provided primary dataand secondary data was extracted from the ENT clinic’s database.
Due to external reasons that could not be controlled, namely the COVID-19 pandemic,precautionary measures were taken by the hospital halfway through the project, restrict-ing access to the clinic and limiting the ability to collect quantitative data. As a result ofthis, more assumptions had to be made, e.g. around logical sequences and process times,which were later verified with interviews.
3.3.1 Interviews
Interviews were mainly used to understand the system and verify that the mappingwas conducted in a rightful manner. The interviews were not structured but adjustedaccording to what the interviewed candidate had to say. This kind of unstructuredinterviews are supported by Bryman et al. (2005). Furthermore, the authors claimthat rich answers are preferred, with the options for candidates to complement thesein additional future interviews.
The initial interviews were conducted face-to-face at the clinic with both physicians andnurses, and acted as a base for the conceptual model. Questions were asked aboutthe patient flow layout, the work in each process and rough estimates of process times.As access was restricted due to precautionary measures concerning COVID-19, laterinterviews had to be conducted over telephone. These later interviews focused onclarifying assumptions made in the model, collecting missing data about process timesand logical flows, and validating output from the simulation model. In total, six peoplewere interviewed about the system, presented in table 3.1. Some people were interviewedmore than once, e.g. Nurse A (Clinic Manager) being consulted throughout the wholeproject from conceptual modelling to providing input to the recommendations.
21

Description of intervieweesNo. Role Medium1 Receptionist Face-to-face2 Nurse A (Clinic Manager) Face-to-face and telephone3 Nurse B Face-to-face4 Nurse C Face-to-face5 Physician A Face-to-face6 Physician B Face-to-face7 Physician C Telephone
Table 3.1: Description of interviewees
3.3.2 Observations
According to Wallen (1993), observations generate knowledge that does not emerge ininterviews. It is knowledge that people in possession of take for granted and do notnecessarily mention. This type of knowledge is also called ’tacit’. Therefore, observationsare regarded as a complement to interviews.
In this case observations played an important role, since they are fundamental for worksampling. As Kumar (2011) mentions, observations are suitable when behaviour is de-manded rather than perception. Furthermore, Kumar (2011) tells that there are par-ticipating observations and non-participating observations. In this case, non-participantobservations were relevant due to the need for process times without disturbing the workat the ENT clinic. Observations were also used to understand the logical sequences inthe emergency flow.
Work sampling is a time study, often applied to determine the specific time of variousactivities for an operation. Work sampling is built upon the belief that a su�cientlylarge random sample can predict the behaviour of the entire group (Barnes, 1956). Itcan provide the necessary information to calculate a certain utilisation rate or, as inthis case, the required information to model the operation. To be able to create a validconceptual model, activities have to be classified properly. The practitioner needs tobe aware of pitfalls like classifying several activities with di�erent treats as one (Chung,2004). Subsequently, the right times for the activities were measured by timing.
The time study was initiated by collecting smaller samples from the di�erent process toaid in the initial modelling. Processes were timed with the help of a stopwatch, withthe observer placed in the same room as the process was carried out. The times for eachprocess was measured from beginning to end, with the ENT sta� informing as the processwas started, stopped or put on hold. No further divisions were made, as breaking downthe processes further were not deemed necessary to answer the research questions. Doingso would have made the simulation model too detailed and di�cult to manage for thepurpose.
As mentioned in the interviews section, as access to the clinic was restricted, observations
22

could no longer be carried out. In this case, interviews were used as a substitute methodfor observations. The data that had already been collected was then used in combinationwith interview results, to act as a base for the distribution functions entered in thesimulation model.
3.3.3 Secondary data
Secondary data was used to the extent where it was provided by the organisation anddeemed to be appropriate for the purpose of simulation. The advantage of secondarydata was that it saved time in the project and provided the simulation model with largesamples. An example of secondary data collected was an overview of all the ENT clinic’sadmitted and discharged patients during recent years.
3.4 Conceptual model
In line with the approach of Chung (2004), the first productive step was to create aconceptual model of the operation of the ENT clinic’s emergency flow. To do so, thesystem had to be classified. The classification consisted of determining whether thesystem was discrete, continuous or combined and terminating or non-terminating, whichresulted in a discrete, terminating system. Post hoc, the system was mapped out on ahigh level flow chart base. In consent with the approach of Chung (2004), the mappedout system was validated with the help of people familiar with the operations of the ENTclinic.
System validation was carried out with the help of unstructured interviews, where severalnurses and doctors were shown the conceptual model and had the opportunity to provideinput and amendments. The interviews also helped discern what sub-processes eachprocess contained and weather it was feasible to divide the processes. This validation isfurther described in section 3.7.
3.5 Data analysis
Chung (2004) describes the next step in simulation modelling as data collection andanalysis. Therefore, data was gathered by imposing work sampling principles. Thedata was fitted to matching probability functions, given the requirement of it beingnon-deterministic data. For processes that lacked data due to COVID-19 constraints,probability distributions were created with the help of estimations from the sta�.
23

3.5.1 Primary data
The first step in handling the collected data was to judge whether the data points collectedfrom each process were independent (random) from one another. Law (2014) describedscatter plots as a suitable method for assessing a sample’s independence. The observationsX1, X2, ..., Xn were plotted in pairs such as (X1, Xi+1) where i = 1, 2,...,n-1. If the pointsare scattered randomly in the first quadrant of the plane made up by (X1, Xi+1), thepoints can be expected to be independent. However, if the points are scattered aroundone or more sloped lines, one can expect the Xi points to be correlated.
When the collected data had been assessed for independence, the data points wereplotted in histograms to check for local modes and to estimate a hypothesis of a densityfunction corresponding to the data points’ distribution, as described by Law (2014).Several parameters such as range, mean, standard deviation, variance, and coe�cient ofvariance were calculated from the collected data points to aid the estimation of probabilitydistribution. The nature of the processes were also taken into consideration, since certainprocesses are characterised by general treats and can often be described by a limitednumber of probability distributions, leading to the practitioners not having to investigateall possible distributions.
After an initial hypothesis had been made regarding a suitable distribution function,the parameters for the given probability distribution were calculated. Depending on theprobability distribution these parameters are calculated di�erently. Since the Gamma dis-tribution, Weibull distribution and the Log-normal distribution are similar in behaviourand all well suited to describe process times to complete a task (Law, 2014), the Gammadistribution was preferred due to the approximation of the maximum likelihood estima-tion of its parameters. It is displayed in equation 3.1. To find the approximation ofthe parameters for the function, – and — were approximated using equation 3.2 and thevalues corresponding to the calculated T value were found in the table presented in Law(2014, p.386).
F (x) =
Y]
[1 ≠ e
≠x/— q–≠1j=0
(x/—)j
j! , if x > 0.
0, otherwise.(3.1)
T = [lnX(n) ≠nÿ
i=1lnXi/n]≠1 (3.2)
In the cases where it was determined that primary data collected through initial interviewsand observations was missing or incomplete due to limited access to the ENT clinic, itwas determined that further interviews had to be conducted with physicians and nurses.Although it would have been preferable to conduct more observations or rely on third-party data collection, the circumstances didn’t allow for neither case, creating the need tocontinue in an alternative way. Thus, interviews were determined to be the only suitableway to collect further data.
In case of processes where data had been collected but was determined insu�cient, the
24
Excel plugin NtRand3 was used to assist in finding suitable parameters for probabilitydistribution functions. NtRand3 could only be used if the mean value, coe�cient ofvariance and min value were known or could be estimated by collected data.
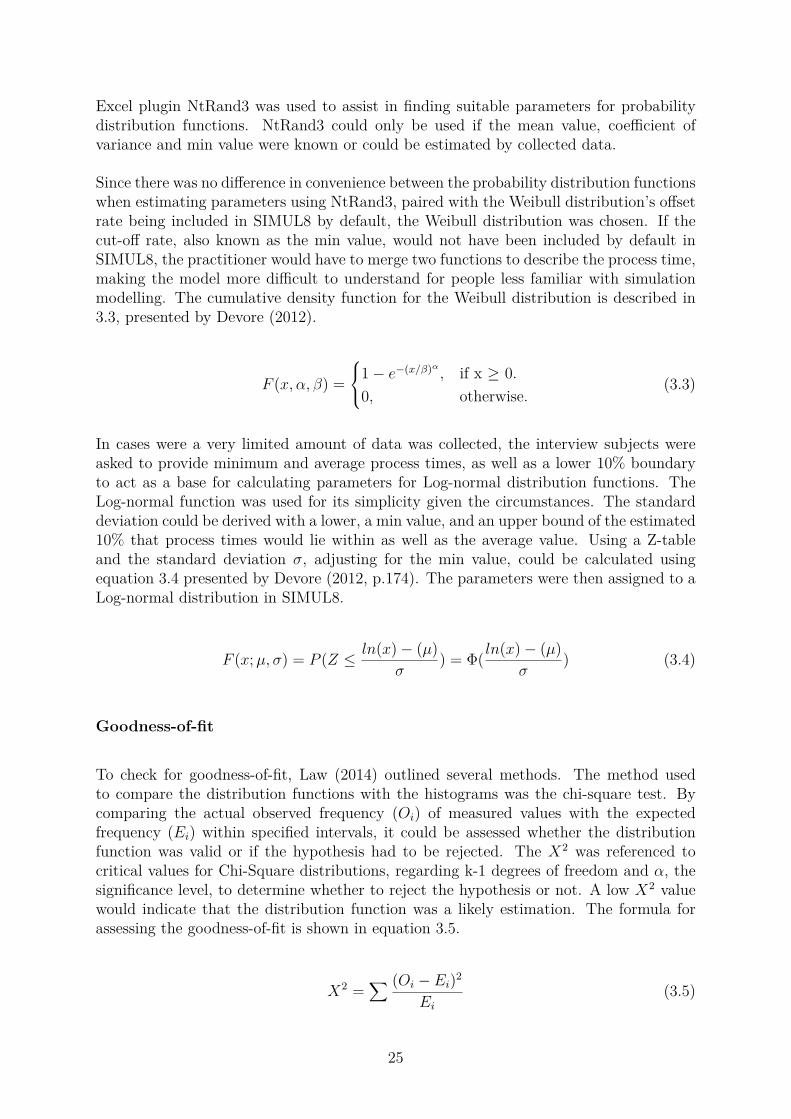
Since there was no di�erence in convenience between the probability distribution functionswhen estimating parameters using NtRand3, paired with the Weibull distribution’s o�setrate being included in SIMUL8 by default, the Weibull distribution was chosen. If thecut-o� rate, also known as the min value, would not have been included by default inSIMUL8, the practitioner would have to merge two functions to describe the process time,making the model more di�cult to understand for people less familiar with simulationmodelling. The cumulative density function for the Weibull distribution is described in3.3, presented by Devore (2012).
F (x, –, —) =
Y]
[1 ≠ e
≠(x/—)–, if x Ø 0.
0, otherwise.(3.3)
In cases were a very limited amount of data was collected, the interview subjects wereasked to provide minimum and average process times, as well as a lower 10% boundaryto act as a base for calculating parameters for Log-normal distribution functions. TheLog-normal function was used for its simplicity given the circumstances. The standarddeviation could be derived with a lower, a min value, and an upper bound of the estimated10% that process times would lie within as well as the average value. Using a Z-tableand the standard deviation ‡, adjusting for the min value, could be calculated usingequation 3.4 presented by Devore (2012, p.174). The parameters were then assigned to aLog-normal distribution in SIMUL8.
F (x; µ, ‡) = P (Z Æ ln(x) ≠ (µ)‡
) = �( ln(x) ≠ (µ)‡
) (3.4)
Goodness-of-fit
To check for goodness-of-fit, Law (2014) outlined several methods. The method usedto compare the distribution functions with the histograms was the chi-square test. Bycomparing the actual observed frequency (Oi) of measured values with the expectedfrequency (Ei) within specified intervals, it could be assessed whether the distributionfunction was valid or if the hypothesis had to be rejected. The X
2 was referenced tocritical values for Chi-Square distributions, regarding k-1 degrees of freedom and –, thesignificance level, to determine whether to reject the hypothesis or not. A low X
2 valuewould indicate that the distribution function was a likely estimation. The formula forassessing the goodness-of-fit is shown in equation 3.5.
X2 =
ÿ (Oi ≠ Ei)2
Ei(3.5)
25

Further assessment of goodness-of-fit was not conducted due to the lack of data and thelimitations accompanying this. If this would not have been the case, di�erent types ofplots could have been suitable, for example a Q-Q plot or P-P plot as advocated by Law(2014). It would also have been reasonable to use both, since they amplify di�erent dif-ferences between the model distribution function and the empirical distribution function.However, if there is limited data, the graphical comparison becomes less accurate, andtherefore it was not conducted.
3.5.2 Secondary data
The secondary data provided from the Hospital was analysed mainly through the use ofmanual calculations and Microsoft Excel. A large data file consisting of all the patientsadmitted to the clinic since January 2017 up until March 2020 was provided by thehospital and acted as a foundation for the analysis.
Since the data file consisted of many database keys and acronyms, two expert interviewswere conducted with representatives from the hospital to provide an understanding ofwhat to search for in order to extract the data that was relevant to the ENT emergencyflow specifically. Key figures used were the total number of patients treated each day andsplitting the patient numbers into two-hour time intervals representing time slots whenthe clinic was more or less busy. The number of patients per time slot were then translatedinto exponential functions, with inter-arrival times used as a parameter, for each entrypoint. To enable this, the secondary data had to be complemented with primary data.Finally, the data was anonymised, aggregated and entered into the simulation model.
3.6 Simulation model
With the conceptual model as a base, the simulation model was built and programmedin the simulation software SIMUL8. The software provided a programming environmentwith predefined building blocks, and allowed for a great deal of customisation throughusing its visual logic environment, which was used for defining logical sequences andcustom key performance indicators (KPIs).
Before collection of quantitative data had commenced, the model was built as an ’emptyshell’ consisting of entry points, queues and processes without assigned distributionfunctions. The model also consisted of some logical sequences. As data was collected,through interviews, observations and secondary data, and analysed the simulation modelwas revisited continuously and programmed with logical sequences and distributions forentry points and processes.
26

3.7 Verification and validation
This section addresses both verification and validation. Both processes are crucial whenbuilding a successful simulation model according to Chung (2004).
3.7.1 Verification
According to Chung (2004) verification often gets confused with validation. The authorclaims that the main di�erence between the two is that verification verifies that the modelworks as intended and validation insures that the model represents reality. Mentioned arealso di�erent methods to verify the model whilst building it. Some of them are animation,divide-and-conquer and writing to output file.
This simulation model was build by a divide-and-conquer approach, routs where createdby entry and examined in order to find early mistakes. It was also continuously verifiedby using animations, always being able to see how di�erent categories of patients movedthroughout the model, helping prohibit for example false logical sequences. In additionto this, the output of several KPIs were examined to determine whether changes of thesystem were implemented correctly.
3.7.2 Face validity
Wallen (1993) mentions that validation is to determine if the measured result is the sameas what was initially intended to measure. Bryman et al. (2005) agree with this notion,yet they divide between internal and external validation. Internal validation examines ifthe causality of a conclusion is rightful or not, and external whether the results can begeneralised outside of the specified research context. In a simulation context, face validityand statistical validity are emphasised (Chung, 2004).
Face validity was assessed through interviews with people familiar with the system, i.e.physicians, nurses and the Hospital’s logisticians. The interviews consisted of questionsrelated to both the model’s structure, logical sequences, input and output data. Interviewsubjects were walked through the model during individual interviews and asked to confirmor deny whether the flow of patients was correct and if the processes and queues prioritisedpatients in the right way. In regards to the input and output data, questions wereasked whether e.g. the number of patients treated each day and inter-arrival times wereconsistent with the real-life system. This process of validation was conducted in aniterative manner as the model became more detailed and complete.
27

3.7.3 Statistical validity
Statistical validation was di�cult to assess in the system for two main reasons. First,the hospital does not conduct measurements of throughput times, process times, queuecontents or resource utilisation. This led to a lack of secondary data to statisticallyvalidate the model’s results. Second, due to the aforementioned circumstances regardingaccess to the clinic and subsequent data collection di�culties, there was a lack ofcomprehensive primary data to measure against. Thus, a thorough statistical validationwas not performed, leading to uncertainties about what kinds of statistically accurateconclusions can be determined with the model as a sole basis.
3.8 Future state model
One of the research questions was focused on suggesting alterations for greater e�ciencyin the emergency care flow. In this section, the process of designing a ’future state model’is presented along with steps taken to assess the model’s sensitivity to di�erent types ofvariation.
3.8.1 Factorial analysis
A main goal of experimental design in simulation is to assess which factors have thehighest e�ect on the result with the least amount of simulating (Law, 2014). Based onthis, the factorial analysis was designed with the idea to judge the e�ects of the basemodel’s resources di�erent KPIs, and thus discover which of the resources were the mostcritical.
In the base model case, four factors connected to the resources were investigated: Nurse1, Nurse 2, Nurse 3 in combination with Physician 1, and Physician 2. The resources aredescribed more in detail in the Results chapter, table 4.3. Each factor was set to one lowand one high configuration (-/+), with the low configuration meaning 1 resource (basecase) and high meaning 2 resources (one extra). According to Law (2014), one of the mainadvantages with simulation is to comparing alternative systems before implementation.Since the resources of this thesis’ simulation model were altered between trials, it wasjudged that each trial was comprised of a unique system.
To determine the e�ects between di�erent systems, a Two-Sample-t Confidence Intervalcan be utilised to assess whether the e�ect of a system can be considered to be di�erentfrom another system (Law, 2014). An advantage of forming confidence intervals fordi�erences in e�ects, compared to a hypothesis test, only assessing whether to rejectthe null hypothesis or not, is that the confidence interval not only provides informationwhether the e�ect is significantly di�erent from zero, but also quantifies the di�erencebetween systems.
28

According to Chung (2004), if more than two comparisons are involved the t-test shouldbe replaced by the analysis of variance (ANOVA). The ANOVA determines if there isa significant di�erence between the samples, therefore, if there is a di�erence a posthoc test/multiple comparison procedure needs to be carried out in order to determinewhich means are statistically significantly di�erent. There are several di�erent post hoctests. Chung (2004) describes the Ducan multiple-range test and Devore (2012) Tukey’sprocedure. The authors of the thesis chose Tukey’s procedure if there was homogeneity ofvariance, however, if the homogeneity was violated Tamhane’s T2 multiple comparisontest was applied.
First, the required number of runs (n) was calculated using the formula described byChung (2004), presented in equation 3.6. The number of runs was derived by choosinga 95% confidence level as well as setting the Standard Error (SE) to an acceptable levelgiven the characteristics of the physical system. In equation 3.6, (s) is the standarddeviation of the replication means and (SE) an acceptable deviation in throughput times.Second, it had to be assessed whether the individual results were normally distributed.According to Law (2014), this should not be a problem due to the test being comprised ofa large number of individual observations. Also, the Central Limit Theorem states, thata sample mean, derived from a large enough sample, will approach a normal distribution.This is valid for any population with independent random variables and a finite standarddeviation (s).
n = (t1≠–/2,n≠1 ú s/SE)2 (3.6)
When comparing two samples, the Welch’s t-test was performed and the Welch ConfidenceInterval calculated using the method described by Law (2014). First, the trials’ meanvalues (X) and standard deviation (S) was calculated using equations 3.7 and 3.8.
Xi(ni) =qni
j=1 Xij
ni(3.7)
S2i (ni) =
qnij=1[Xij ≠ Xi(ni)]2
ni ≠ 1 (3.8)
for i = 1,2.
Second, the trials’ estimated degrees of freedom f were calculated using equation 3.9.
f = [S21(n1)/n1 + S
22(n2)/n2]2
[S21(n1)/n1]2/(n1 ≠ 1) + [S2
2(n2)/n2]2/(n2 ≠ 1) (3.9)
Finally, the confidence interval was calculated using equation 3.10.
X1(n1) ≠ X2(n2) ± tf ,1≠–/2
ÛS2
1(n1)n1
+ S22(n2)n2
(3.10)
29

When comparing more than two samples, the ANOVA and subsequent post hoc test wherecalculated in IBM SPSS Statistics. The ANOVA test is conducted by first calculating themeans square for treatments, using equation 3.11. I represents the number of populationsbeing compared and J the number of observations in each sample. Secondly, the meansquare of errors is calculated using equation 3.12. Here, I is still the number of populationsbeing compared and S
2 the sample variance. Finally, the F statistic, using equation 3.13(Devore, 2012).
MSTr = J
I ≠ 1ÿ
i
(Xi. ≠ X..)2 (3.11)
MSE = S21 + S
22 + ... + S
2I
I(3.12)
F = MSTr
MSE(3.13)
If the ANOVA resulted in di�erences of means, either Tukey’s procedure or Tamhane’sT2 multiple comparison test was carried out in IBM SPSS Statistics depending on thehomogeneity of variance, as mentioned above. The logic behind these post hoc tests issimilar to Welch’s t-test, in terms of comparing means, and therefore not displayed indetail in this thesis.
Irrespective of the number of samples that were compared, when the appropriate statis-tical testing was conducted, each individual case, later in the report described as Trials,was compared to determine which factors had the largest impact, and which adjustmentswould be feasible in a real scenario. This factorial analysis was conducted for all KPIs togenerate an overall picture of the impact of each resource.
3.8.2 Future state model design
After performing the factorial analysis, the impact of each resource on the physical systemwas assessed. Starting with the current state model in SIMUL8, alterations were madeto the model’s resource schedule and allocation to allow for task sharing and flexibility.The results were then compared to the base model by comparing the KPIs which areoutlined in the Results chapter.
3.8.3 Sensitivity analysis
Due to a lack of statistical validation, it was determined that a sensitivity analysis hadto be conducted, to see how variation in the most uncertain process times a�ected themeasured KPIs. In agreement with one of the thesis group’s supervisors, the processdistributions with the least amount of underlying collected data were tested.
30

The sensitivity analysis was conducted by increasing the variation in the processes thatwere deemed to hold the highest uncertainty, i.e. the Fax referral assessment, Faxreferral registration, Further assessment, and Further treatment (described in table 4.2),since these Log-normal process time distributions were approximated through interviews.Variation was doubled in all four processes, after which the total throughput time andutilisation were measured to assess whether the change in variation had a significantimpact. This was statistically tested in the same way as described above in the factorialanalysis section.
3.9 Reliability
Pruzan (2016) argues that reliability refers to the consistency of a measurement. Applyingthis to simulation modelling implies that the output of several runs of the model generatesimilar results. Combining validity and reliability generates a robust result. If thesimulation model generates results that are well aligned with the actual output of thephysical operations, and they are consistent with a low variance between runs, it implieshigh validity and reliability.
To determine the reliability of the model, it was run for the same number of trials as duringthe factorial analysis. The size of the confidence interval was qualitatively assessed, anda quantitative sensitivity analysis was performed. The sensitivity analysis indicates howsensitive a certain result is in regard to changes of certain factors, variances of processesin this case. It aids in understanding how reliable the KPI values are and if the confidenceintervals of, for example, throughput times are applicable to the analysis.
3.10 Ethics
Since this study was conducted in the healthcare sector, ethics played a central part inhow the research was carried out. Since some information and processes were of a sensitivenature, not following an ethical approach might have given negative implications on e.g.patient security, data integrity and the possible impact of the studies recommendations.
Confidential information pose an ethical dilemma since asking for the information mightplace the respondent in a di�cult situation, and might also have legal implications forboth the interviewer and respondent (Gillham, 2008; Kumar, 2011). However, not askingfor the data might lead to the study not yielding any significant results. Therefore,information was carefully considered and questions that might have invaded privacy werecarefully asked. In any case, collected information was be anonymised and handledcarefully to ensure that the respondents could not be identified from this study duringor after it was published.
Regarding interviews, it is important that they are carried out with respondents thatare not feeling forced to participate (Berg, 2009). Even if participation is presented as
31

being voluntary, an employee might feel forced to participate due to e.g. pressure from asuperior or peer pressure. Therefore, respondents were informed that participation wasvoluntary and that they could choose to end the interview at any time.
3.11 Sustainability
Sustainable development has been defined by the World Commission on Environmentand Development in the Brundtland report as ”development that meets the needs ofthe present without compromising the ability of future generations to meet their ownneeds.” (World Commission on Environment and Development, 1987, Chapter 2). Theconcept can be divided into three areas: (1) ecological, dealing with the environmentalimpacts of development, (2) social, describing well-being, happiness and human rights,and (3) economical, which can be described as both meaning economic growth as well aseconomic development that does not negatively impact ecological or social sustainability(KTH, 2019).
As the context of this thesis is within the healthcare sector, social and economicsustainability were of the highest relevance. The project has dealt with planning ofresources, which a�ects how funds are distributed. By making processes more e�ective,more patients can be treated for less money, and resources can be distributed to otherdivisions or sectors in need. The ecological perspective was deemed to be less impactedby the thesis’ work, as ecology is not central to the posed research questions. However,there might be indirect positive e�ects on ecological sustainability as resources are freed,redistributed and higher utilised, and waste is minimised.
32
4Results
This chapter describes the results collected from the current state model and dataanalysis. Next, results from the experimental design are presented, after which a desiredfuture state model is presented containing slight amendments to the base model.
4.1 Current state
This section contains a description of the current ENT emergency flow and its identifiedoperations characteristics, along with a conceptual map and the results from running thesimulation model.
4.1.1 System description and operations characteristics
The results from the interviews and secondary data analysis indicated that the systemdeals with a moderate volume of patients, averaging around 20 patients each day whoreceive treatment, not including the patients that are turned away in the early stagesof the patient flow. Even though a considerable amount of patients enter the system,a large share is directed out of the system due to them not being in need of specialistemergency care at the ENT clinic, but should rather seek medical assistance at theirlocal care centre. According to several of the interviewed nurses, this share of patientsis responsible for a considerable amount of volume, leading to extra work having to becarried out in the beginning of the system.
The variety of conditions treated in the emergency care flow is very high, ranging fromalien objects stuck in any of the ENT pathways to respiratory issues and broken noses.Secondary data covering admitted cases during recent years confirms this as there wereover 2200 diagnosis codes covered during the last three years. According to interviewednurses and physicians, variety is also deemed to be higher than in the elective care flowsince the latter is divided into sub-specialities such as oto (ear), rhino (nose), tumoursetc., making the emergency flow a suitable place for training and development of juniorphysicians. However, since the clinic provides specialist care to ENT patients, the varietyis not as high as it would have been at a general emergency clinic treating a wider range
33

of conditions.
The general variation in the system is considered to be high in regards to patient types,arrival and process times, and ways of working. As a result of the large variety ofconditions treated and the fluctuating nature of emergency cases, the variation in demandfor di�erent treatments is high, and it is thus di�cult to plan ahead in terms of capacityand specialised physicians. In addition to the variation in conditions, the number ofpatients seeking care every day also varies, both in between days and in terms of certaintime periods such as early mornings and afternoons.
Results from both interviews and observations of the processes indicate that individualstend to work in di�erent ways and at varying speeds. While di�erent conditions requiredi�erent actions and treatments, there are notable contrasts depending on who is sta�edon a given process at a given time. As an example, some nurses tend to reject a smallershare of potential patients early in the flow, resulting in larger queues and workloads forthe physicians.
The visibility in the system is high as patients experience the service provided directly.Throughout the majority of the flow, the patients are treated in processes and wait inphysical queues. However, before the patients arrive at the clinic, they can be part ofless visible processes such as referral handling by fax, phone queues and internal bookingprocesses. Some discussions and consultations made by physicians are also conductedwithout the patient being present.
4.1.2 Conceptual map
After conducting interviews, work sampling by timekeeping and observing the distinctprocesses in the emergency flow, it was possible to map out the entire system. The scopeof the mapped out system spans from patients entering the system in five di�erent waysto exiting after being treated. Figure 4.1 illustrates the emergency patient flow at theENT clinic. Figure 4.2 gives the reader a general overview of the physical layout of theclinic.
Patient types
To fully understand the logic of the system, how patients move throughout the system, itis crucial to understand the di�erent types of patients, as a wide variety of patients enterthe system every day. In the interpretation of the physical system, di�erent patients aresegmented by three types: (1) the patients that are not in need of emergency care, (2)patients that are in need of emergency care but do not need to be prioritised while in thesystem, and (3) patients that are in need of emergency care and need to be prioritisedwithin the system.
The first type of patients exit the system as soon as the medical sta� determines thecurrent state of the patients and never proceeds to meet a physician. The other two
34

Figure 4.1: Conceptual map
Figure 4.2: Physical layout of the ENT clinic
types both proceed through the entire system but are prioritised di�erently. The reasonfor this is that some patients entering the system do not have time to wait, otherwisethey might su�er serious consequences or, in the worst case, die.
35
Entry points and routes
From a schematic point of view, patients move from left to right in the system, indicatedby the directional arrow in Figure 4.1. The first entry point is the one most evident whenvisiting the clinic, it is when patients just show up to the emergency flow and requesttreatment. The second and third entry points are both entries for patients that call theclinic or get referred by a call from other medical sta�. The split between internal andexternal is not entirely exclusive, nevertheless it intends to divide cases from the samehospital and external cases from outside of the hospital. The external cases could beindividuals, health centres, etc. calling.
The fourth entry point describes all cases that enter the system by a referral sent byfax. Due to physicians tending to send referrals through several channels, which is notconsidered best practice, this implies that patients are sometimes referred multiple times.As a consequence of this, the same patient could theoretically enter the system during thesame day in several ways. An example of this is when an external health care providersends a fax and calls the clinic’s external phone as well.
The fifth entry point describes all patients that are scheduled from previous days. Patientsentering through entry point 5 are patients that could not be treated the previous day orpatients from the elective care flow that cannot wait until their scheduled time. Thesepatients are mostly of type 2.
Every entry point is described in table 4.1. The underlying data for the table is bothsecondary data as well as empirical data. The ENT clinic measures the number of patientsentering the system everyday, but does not make a distinction between di�erent entrypoints, hence the need for empirical data to achieve a complete view.
On a very high level, patients enter the system in a certain way with the purpose ofseeing a physician. From the patients’ perspective this is true for every patient, but fromthe medical sta�’s perspective this is only valid for patient type 2 and 3. This is becausea patient of type 1 is not in need of emergency care, but still seeks it. In the physicalsystem, the entry of patients takes various shapes depending on the way patients enterand their condition. They encounter di�erent processes and wait in di�erent queuesdepending on type and entry. After visiting a physician, patients are sent home in amajority of the cases. However, some patients need to be kept in the system for testingor further treatment. The reason why most patients do not stay in the system is becauseit is an emergency clinic and once patients are no longer in an emergency state, they canbe sent home or transferred to another division.
Processes and queues
Every process describes a step in which a patient interacts with sta� from the emergencyflow. The various processes include interaction between the patient and a receptionist,between the patient and a nurse and between the patient and a physicians. Theinteractions can be di�erent in nature, such as calling and being treated at distance
36

Detailed information about entry pointsName Distribution
of patienttypes
Inter-arrival times (Ex-ponential distribution)
Unplanned Label 1: 34%Label 2: 46%Label 3: 20%
08:30-09:45: 67.8 min09:45-11:45: 39.2 min11:45-13:45: 52.4 min13:45-16:00: 41.5 min
Externalphone entry
Label 1: 90%Label 2: 8%Label 3: 2%
Exception* 07:45: 50 pa-tients arrive
Internalphone entry
Label 1: 75%Label 2: 20%Label 3: 5%
08:30-09:45: 96.9 min09:45-11:45: 56 min11:45-13:45: 74.9 min13:34-16:00: 59.3 min
Fax referralentry
Label 1: 75%Label 2: 25%Label 3: 0%
08:30-09:45: 96.9 min09:45-11:45: 56 min11:45-13:45: 74.9 min13:45-16:00: 59.3 min
Bookedpatients
Label 1: 0%Label 2: 100%Label 3: 0%
08:30-09:45: 135.6 min09:45-11:45: 78.4 min11:45-13:45: 104.8 min13:45-16:00: 83 min
Table 4.1: Table of entry points
or being examined in a physical room. The queues, on the other hand, are ratherhomogeneous as they di�er only in the amount of time spent in them and the orderpatients enter and exit. Every queue implies that the patients are waiting before enteringthe next process. In table 4.2 all processes that patients encounter are described. It is adetailed description including the probability distributions that best describe the processtimes, along with the parameters, which are combinations of –, —, average, standarddeviation (‡) and o�set (minimum value). However, the probability functions are notpart of the original conceptual model but they are included when the conceptual modelis translated to a simulation model in SIMUL8.
All processes are described from a patient flow perspective and the average of theprobability distributions describe the expected time it takes for the sta� to process apatient in a given process. The di�erent processes in table 4.2 are not necessary indi�erent physical locations but are divided into di�erent processes because they implydi�erent steps of treating patients. The physical location of the di�erent processes is notessential to understanding the system and will not be discussed in detail, but figure 4.2is provided for reference. For processes located far away from each other, travel timeshave been taken into consideration during the translation of the conceptual model intoSIMUL8.
37
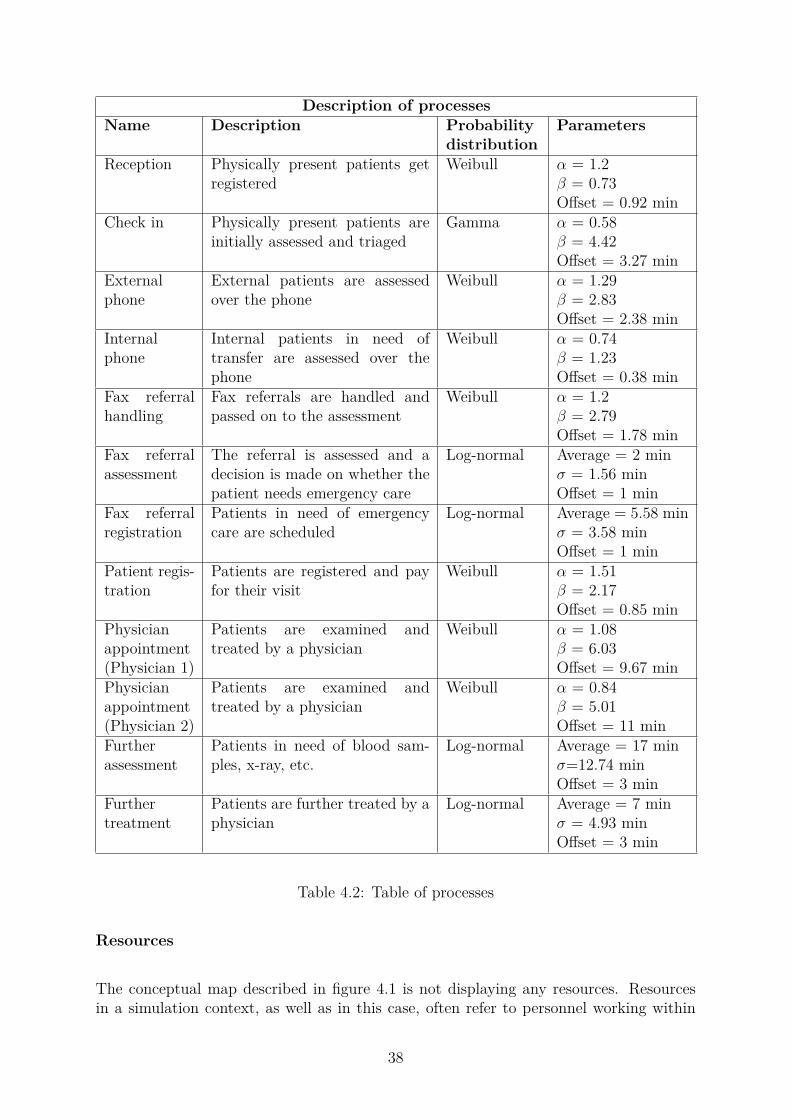
Description of processesName Description Probability
distributionParameters
Reception Physically present patients getregistered
Weibull – = 1.2— = 0.73O�set = 0.92 min
Check in Physically present patients areinitially assessed and triaged
Gamma – = 0.58— = 4.42O�set = 3.27 min
Externalphone
External patients are assessedover the phone
Weibull – = 1.29— = 2.83O�set = 2.38 min
Internalphone
Internal patients in need oftransfer are assessed over thephone
Weibull – = 0.74— = 1.23O�set = 0.38 min
Fax referralhandling
Fax referrals are handled andpassed on to the assessment
Weibull – = 1.2— = 2.79O�set = 1.78 min
Fax referralassessment
The referral is assessed and adecision is made on whether thepatient needs emergency care
Log-normal Average = 2 min‡ = 1.56 minO�set = 1 min
Fax referralregistration
Patients in need of emergencycare are scheduled
Log-normal Average = 5.58 min‡ = 3.58 minO�set = 1 min
Patient regis-tration
Patients are registered and payfor their visit
Weibull – = 1.51— = 2.17O�set = 0.85 min
Physicianappointment(Physician 1)
Patients are examined andtreated by a physician
Weibull – = 1.08— = 6.03O�set = 9.67 min
Physicianappointment(Physician 2)
Patients are examined andtreated by a physician
Weibull – = 0.84— = 5.01O�set = 11 min
Furtherassessment
Patients in need of blood sam-ples, x-ray, etc.
Log-normal Average = 17 min‡=12.74 minO�set = 3 min
Furthertreatment
Patients are further treated by aphysician
Log-normal Average = 7 min‡ = 4.93 minO�set = 3 min
Table 4.2: Table of processes
Resources
The conceptual map described in figure 4.1 is not displaying any resources. Resourcesin a simulation context, as well as in this case, often refer to personnel working within
38

the physical system. Several processes are often dependent on resources being availablein order to process, in this case, patients. In the actual emergency flow, no process canfunction without personnel, but in the simulation model context resources are of interestif they are, or can be, shared by several processes. Furthermore, the resources’ schedulescan be adjusted as an easy way to vary the capacity. In this case, nurses and physicianscan theoretically work all across the model. However, no receptionist was modelled sinceit is not a shared resource and, if relocated, is not able to aide with treating patients inthe vocation care flow. Furthermore, all resources are set to have a maximum capacity of90% to take personal time into consideration, such as going to the toilet or taking shortbreaks.
In table 4.3 all resources and the processes that depend om them are listed. The tablecan be interpreted like; if Nurse 1 is occupied at the expedition, assessing patients, bothfax referral processes need to wait until Nurse 1 is available. The resource’s utilisationdepends on how many responsibilities a resource has, the time each responsibility takesand the amount of patients flowing through it.
Two types of physician resources are present in the emergency flow. Physician 1 isthe main resource that works with diagnosing and treatment and has Nurse 3 workingalongside them in the process Physician appointment (Physician 1). Physician 2 alsoworks with diagnosing and treatment, but is a resource that is shared between all processesat the Hospital in need of specialised ENT competence. Thus, the resource spends theworking days between taking referrals, consulting other caregivers by phone, and treatingpatients both in the emergency flow and all over the Hospital. In practice, a very lowshare of Physician 2’s time is allocated to the studied emergency flow.
Resources and their responsibilitiesResource Processes handledNurse 1 Expedition, Fax referral handling and Fax referral registrationNurse 2 External phoneNurse 3 Physician appointment (Physician 1), Further assessment and Further
treatmentPhysician 1 Physician appointment (Physician 1), Further assessment and Further
treatmentPhysician 2 Fax referral assessment and Physician appointment (Physician 2)
Table 4.3: Table of resources
4.1.3 Simulated results
After determining the input data distributions and translating the model into a computer-based model, the initial state of the simulation model was reached. This model is adescription of current state of the emergency flow, i.e. the physical system. The di�erentprobability distributions that are the basis of the process times in the simulation modelare described in table 4.2. Distributions that concern the entry points are described intable 4.1. Together, these underlying probability distributions are the cornerstone of
39

the simulation model. They are what transform the model into a representation of thephysical system.
As mentioned in the theoretical framework chapter, variation is inherited throughout asystem and it can result in increasing queuing time. Queuing time is in direct relation withthroughput rate as well as throughput time (TT). Therefore, the latter was chosen as themain key performance indicator (KPI). Since the physical system is not homogeneous, interms of patients being assessed over the phone or via fax referral, one single throughputrate was not su�cient. Therefore, seven di�erent KPIs regarding TT were measured.
In addition to the TT KPIs, the utilisation of four di�erent resources were measured.Only four utilisation KPIs were measured although there are five resources in total. Thiswas due to the Physician 1 and Nurse 3 working together in all their processes. TheKPIs displayed in table 4.4 are extracted from the simulation base model, later referredto as Trial 1. The average out of 28 runs with a 95 percentage confidence interval aredisplayed. One run means running the entire simulation model for one week, Mondayto Friday. The table is structured with the KPIs in the left column along with theirrespective units in brackets (minutes or %), with the average value of the KPI in thethird column, and the lower 95% and upper 95% confidence interval limits in the secondand fourth column. As an example, the average throughput time for KPI (1) is 172minutes, with 95% of the times falling in between 170 and 175 minutes.
KPIs base systemKPI -95% Average 95%(1) TT Entire system [min] 170 172 175(2) TT External phone to patient registration [min] 213 216 219(3) TT Internal phone to patient registration [min] 9 10 11(4) TT Fax referral to patient registration [min] 181 203 225(5) TT from Patient registration (patient type 2) [min] 73 79 86(6) TT from Patient registration (patient type 3) [min] 46 48 51(7) TT Unplanned [min] 59 64 69(8) Utilisation Nurse 1 [%] 36 37 38(9) Utilisation Nurse 2 [%] 79 80 81(10) Utilisation Physician 1/ Nurse 3 [%] 68 70 73(11) Utilisation Physician 2 [%] 86 87 89
Table 4.4: Table of results for the base system
A large part of the TT consists of waiting in queues. Especially before physically enteringthe system patients have to wait relatively long before being assessed. For example whenpatients call over the external phone and happen to be put last in queue, in this scenariothe waiting time before being called by Nurse 2 could be several hours. In general, oncepatients physically enter the system the TT decreases, relatively to before physicallyentering the system, yet, it occurs that patients have to wait several hours before anappointment with a physician. One scenario where this is likely to happen is if there area few patients of type 2 and many patients of type 3, then the patients of type 2 have towait due to their lower priority.
40

Due to limitations, mentioned above in more detail in the method and discussion chapters,statistical validity was never extensively assessed or reached. Without the option ofgoing back to the physical system and measure throughput times, it was not possibleto conduct statistical tests for validation. However, by presenting the initial state ofthe model to employees at the ENT clinic and other stakeholders, validity was reached.Additional sensitivity analysis validated the model to an extent that the practitionersfound satisfying, given the circumstances.
4.2 Factorial analysis
To better understand how resources impact the defined KPIs, a factorial analysis wasused. This section describes the way in which the factorial analysis was designed, andthe most important results that were extracted.
4.2.1 Factorial design
The factorial analysis was constructed and carried out in line with its description in themethod chapter. Due to five resources, with the constraint of Nurse 3 and Physician1 on call depending on each other, the 2k ≠ p factorial design had 16 combinations. p,the degree of fractionation, was limited to two, meaning that the resources could only beincreased with one unit from their base level. The base system is represented in Trial 1in table 4.5. It has one of each resource, regarding Nurse 3 and Physician 1, there is oneof each.
By comparing the di�erent trials with each other for each KPI, it was possible to geta better understanding of how di�erent resources impact the system. Each KPI wasanalysed with 16 trials, where an ANOVA test was used to determine if the trials di�eredsignificantly. As all KPIs showed significant di�erences, Levene tests were conductedin SPSS to check for unequal variance between the trials. Finally, a post hoc test wasconducted for each KPI. A Tukey’s test was used if there was homogeneity of variancesamong the samples, and a Tamhane test if not. An example matrix is shown in Table4.6, analysing the KPI TT Entire system.
Table 4.6 is an example of how the post hoc tests were interpreted. On the top row, theanalysed KPI is noted, in this case TT Entire system, KPI (1). In the leftmost column,the trial that is being assessed is marked, in this case Trial 1. The next column stateswhich trial is being compared to Trial 1. Column 4 contains the mean di�erence betweenthe trials and column 5 the standard error associated with the mean value. Column 6contains the significance level, stating whether there is any significant di�erence betweenTrial 1 and the compared trial. Finally, column 7 and 8 contains the upper and lower95% confidence interval bounds. In a similar fashion, 16 matrices were constructed foreach KPI.
For example, Trial 2 indicates a mean di�erence of 0.88 minutes and a standard error
41

Factorial design matrix: += High, -= LowResource Nurse 1 Nurse 2 Nurse 3 /
Physician 1Physician 2
Trial 1 - - - -Trial 2 + - - -Trial 3 + + - -Trial 4 + - + -Trial 5 + - - +Trial 6 + + - +Trial 7 + + + -Trial 8 + + + +Trial 9 - + - -Trial 10 - + + -Trial 11 - + - +Trial 12 - + + +Trial 13 - - + -Trial 14 - - + +Trial 15 - - - +Trial 16 + - + +
Table 4.5: Table of factorial design matrix - factorial analysis
of 2.03, but this di�erence is not significantly di�erent from Trial 1 as the significancelevel is above the defined alpha value of 0.05. This can be confirmed by assessing theconfidence interval bounds, which contain the value 0. Hence, it is impossible to say thatadding an additional Nurse 1 to the system has any e�ect on KPI (1), as Trial 2 wasdefined as having an extra Nurse 1 resource.
Trial 3 indicates a larger mean di�erence of 65.9 minutes with a standard error of 2.17and a significance value close to 0. Furthermore, the confidence interval does not include0, confirming the hypothesis that the systems give di�erent results. Hence, this givesreason to believe that adding a Nurse 2 would reduce KPI (1) by 65.9 minutes.
In the same fashion as table 4.6 compares Trial 1, the initial state, with all other states,the 16 matrices for each KPI indicated the impact of the di�erent trials. Choosing anothertrial as example, Trial 8, shows that the di�erence in KPI (1) is 87.8 minutes, which isgreater than for Trial 3. To assess whether there is a significant di�erence between Trial 8and Trial 3, a similar table was used. Here, it was shown that the systems are significantlydi�erent, and thus there is reason to believe that Trial 8 has a lower throughput timethan Trial 3. This might not come as a surprise, as Trial 8 had all resource levels set tohigh (+). Following the same logic, each KPI was assessed.
The four utilisation KPIs were analysed qualitatively in parallel with the factorial analysisof the di�erent throughput times, and were used in the assessment of the desired futurestate described in section 4.3. This was done by comparing the utilisation figures andnoting if there were any large deviations from the base system.
42

Tamhane post hoc test - TT Entire system [min]Trial Trial Mean
Di�erence(I-J)
Std.Error
Sig. Lower95%bound
Upper95%bound
1 2 0.88 2.03 1.0 -6.73 8.493 65.9 2.17 0.0 57.75 74.104 17.01 1.91 0.0 9.83 24.195 14.52 1.75 0.0 7.91 21.126 79.64 1.61 0.0 73.50 85.797 83.59 1.58 0.0 77.56 89.618 87.77 1.47 0.0 82.04 93.509 64.26 1.98 0.0 56.83 71.6910 81.90 1.59 0.0 75.84 87.9711 78.48 1.67 0.0 72.16 84.8012 86.46 1.53 0.0 80.57 92.3513 15.40 1.84 0.0 8.49 22.3114 20.19 1.79 0.0 13.46 26.9315 12.92 1.79 0.0 6.21 19.6416 20.88 1.79 0.0 14.15 27.61
Table 4.6: Tahmane post hoc test - TT Entire system
4.2.2 Resources’ e�ects on the KPIs
Physician 1 and Nurse 3 have the greatest overall impact in terms of decreasingthroughput times after the patient has entered the physical system, either through theunplanned entry or after the patient has been registered before a physician visit. Bothresources are often highly utilised with utilisation figures of 70%, which indicated thatthis resource combination might be a bottle neck.
The analysis of the throughput time of the external phone is very straightforward. SinceNurse 2 is the only resource working in this part of the patient flow, paired with thepatients not yet having physically entered the system, all trials containing an additionalNurse 2 significantly decrease this throughput time KPI. It is also not possible todi�erentiate between the di�erent trials containing an additional Nurse 2. In terms ofthe entire system’s throughput time, KPI (1), this resource has the largest impact as thetime spent in the phone queue is greatly reduced. Furthermore, the utilisation of Nurse2 reaches 80% in the initial system, indicating that this too might be a bottle neck inthe system.
The throughput time of the internal phone is a�ected by changing the resource Nurse 1,as this was confirmed by the ANOVA test. Since Nurse 1 is the only resource sta�ed onthe internal phone, this is not very surprising. However, the post hoc test test showed thatthe di�erence in mean values of throughput times were not statistically significant. It isalso interesting to note that the decrease in throughput time when adding an additionalNurse 1 is fractional. This might be connected to low utilisation of Nurse 1, which only
43

reaches 37% in the initial system.
The throughput time of the fax referral highly depends on the availability of Physician 2on call as well as Nurse 1. The throughput time is significantly decreased by adding bothresources. However, if only a Nurse 1 is added it does not impact the throughput timesignificantly, hence Physician 2 is the limited resource. This well aligned with Physician2’s high utilisation. An interesting observation is that adding a Physician 1 and a Nurse3 further decreases the throughput time to the fax referral. This is due to them freeingup time for Physician 2 who can focus on fax referrals instead of treating patients.
Regarding TT from patient registration (patient type 2), Physician 1 and Nurse 3 havethe biggest impact in terms of decreasing throughput time. An additional Physician 2also shortens the throughput time but not to the same degree as an extra Physician 1 andNurse 3. For example, an extra Physician 1 and Nurse 3 reduces the throughput timeby 39 minutes, while an extra Physician 2 reduces the throughput time by 16 minutes.
However, adding a Physician 2 at the same time as adding a Physician 1 and Nurse 3, aswhen comparing Trial 7 and Trial 8, there is no significant di�erence in throughput time,which indicates the relatively low impact of an additional Physician 2. Neither Nurse 1or Nurse 2 seem to impact the throughput time significantly.
TT from patient registration (patient type 3) is a�ected similar to the throughput timepatients registered (patient type 2). An additional Physician 1 and an addition Nurse3 decrease the throughput time significantly and neither Nurse 1 or Nurse 2 seem todecrease the throughput time. However, Physician 2 does not impact the throughputtime significantly. This could be due to patients of type 3 being prioritised. Since thePhysician 2 is not exclusively working with assessing patients at the ENT clinic andtherefore treats far less emergency patients compared to the Physician 1 and Nurse 3,prioritised patients will often find their way to the more available resource, i.e. Physician1 and Nurse 3.
TT Unplanned is slightly di�erent from the other throughput times. It concerns thethroughput time for patients that enter through the unplanned entry and measuresthroughput time throughout the entire system. Neither Nurse 1 or Nurse 2 significantlyimpact the throughput time. The reason for this might be the low utilisation of Nurse 1and that nurse two exclusively works with patients entering through the external phone.
However, when adding an additional Nurse 2, there is a tendency of increasing thethroughput time, although the result is not statistically significant. This could be due toan decreased throughput time in other patient flows that later flow into the same sharedpatient flow. This could imply that unplanned patients experience a larger queue whenwaiting for a physician appointment.
All systems with an additional Physician 1 and Nurse 3 reduces TT Unplanned withstatistical significance, and Physician 2 does not. This can be seen when comparing Trial1 with Trial 12, 13 and 14, where adding a Physician 2 does not impact the throughputtime. The reason for this might again be the low availability of Physician 2, as discussedabove. In conclusion, adding one each of Physician 1 and Nurse 3, the throughput time
44

is decreased the most, out of which the majority of the throughput time is made up ofwaiting time for the patient, such as waiting in a queue to the external phone or faxassessment.
4.3 Desired future state
In line with the stated research question, the desired future state is a state in which lessresources manage to treat the same number of patients without increasing the throughputtime radically. Since Physician 1 and Nurse 3 have a high utilisation rate and almostalways decrease the throughput time at the higher factorial level, in the experimentsabove, when increased by one, these are resources that cannot be reduced or removed.Continuing on this trajectory, Nurse 1 and Nurse 2 are the remaining choices to reduce.Since Nurse 1 showed a low utilisation rate and Nurse 2 being highly utilised in theexternal phone, allowing Nurse 1 to assist with the external phone was considered to bea viable solution. When this system was simulated, it was shown that Nurse 2’s schedulecould be reduced. This option was also considered to not require a complex adaptationin the physical system, as all nurses in the system are trained to work at each station,and currently sta�ed on a rotating schedule.
As displayed in table 4.7, the throughput time of the entire system decreases if one allowsNurse 1 to help Nurse 2 with the external phone, and reducing Nurse 2’s scheduled hoursby half. The obtained result can be explained by the low utilisation of Nurse 1 and thehigh impact of patients entering the system by the external phone on the throughputtime. Removing Nurse 2 completely from the model was tested as well and did notshow large increases in the throughput time. However, this solution showed a simulatedutilisation of Nurse 1 of almost 90%, which is a considerably high value. The modeldoes not account for some of the personal time, such as drinking co�ee or social mediausage, however, it is only done by restricting the utilisation of resources to 90%, whichmight be somewhat optimistic. Furthermore, some process time might be prolonged byimplementing changes, this is unlikely in the long run but could become the case initially.Hence, this thesis proposes that the scheduled time for Nurse 2 in the emergency flow isreduced by half. A graph of the 11 KPIs is provided in figure 4.3, comparing the current(initial) state with the desired future state.
The desired future state enables transferring half of resource Nurse 2 to the elective care.By doing so, it is possible to assist the elective care and also in the medium term beingable to decrease the number of patients that enter through the booked patients entrypoint. Because, as mentioned above, some of the patients entering through this entry arepatients that the elective care does not manage to treat in time. Furthermore, Nurse 2will not have any issue of changing to the elective care since the personnel at the ENTclinic rotate between the emergency flow and the elective care unit.
45

TT Entire system [min]State of the model -95% Average 95%Initial state model 169.5 172.4 175.2Nurse 2 working half-day 115.1 118.9 122.6Nurse 2 not working 186.3 191.6 196.8
Table 4.7: Table of desired output
Figure 4.3: KPI comparison - Initial vs. Desired future state
4.3.1 Sensitivity analysis
In order to hedge some of the initial limitations and their impact on the KPIs of thedesired future state, a sensibility analysis was conducted. Similar to the experimentaldesign, a 2k ≠ p factorial design, with the number of levels in each factor reduced totwo, was conducted. This time the factorial design was limited to three combinations. Inthis factorial design, the initial state, Trial 1, was the desired future state with Nurse 1assisting with the external phone and Nurse 2 scheduled for half days, and the varianceof a certain process. The variance was changed by multiplying the initial variance by afactor of two, and is indicated by a (+) sign in table 4.8.
46

Since all factors were variances of process distributions, the initial state, Trial 1 wascompared to the worst case, Trial 2. Of all processes variances that constitute a factorin the sensitivity analysis, Nurse 1 is responsible for Fax referral registration and Nurse2 for none.
Factorial design matrix: += High, -= LowResource Fax referral
assessmentFax referralregistration
Furtherassessment
Furthertreatment
Trial 1 - - - -Trial 2 + + + +
Table 4.8: Table of factorial design matrix - Sensitivity analysis
None of the trials yielded any significant di�erences in throughput time, when measuringthe throughput time of the entire system, KPI (1). This could be due to the processesconstituting a factor not being highly utilised, hence the increased variance does notnecessarily increase existing queues. Another reason might be that the majority ofpatients never enter these processes and therefore have limited impact on the overallthroughput time.
Nevertheless, the impact of the uncertainty of variance in the adjusted processes isdetermined to be limited. Therefore, on the basis of this sensitivity analysis, the desiredfuture state is judged to be reliable.
47

5Discussion
5.1 Method discussion
As mentioned in the theoretical framework, Chung (2004) and Jingshan et al. (2017)describe simulation modelling as a good way to comprehensively analyse complex systemwithout disturbing them. During the project, the choice of simulation modelling, in linewith Chung (2004), has helped both the personnel working at the clinic and the authorsof this thesis in better understanding the physical system. Among others, mapping thepatient flow and quantitatively estimating throughput time and utilisation were activitiesthat increased the understanding. Up until this thesis, there were no detailed descriptionsof how individual processes are carried out, and most process times were estimates asno detailed data had been collected by the Hospital. Being involved in the process ofmapping out the system as well as being presented with the final model and the desiredfuture state, increases employee understanding and awareness of the operations of theemergency flow. This involvement of the ENT clinic personnel could even lead to afuture increase in improvements to the physical system initialised from within the ENTclinic.
In the specific case of healthcare, as Boaden et al. (2008) describe it, the implementationof change is strenuous. Therefore, according to the authors of this thesis, simulationmodelling could be an adequate tool. It is a comprehensive tool that allows for easieranalysis of complex and dynamic systems, paired with ease of visualisation (Chung, 2004).This makes it easier to present, understand and trust the results. Since it could beperceived as a more scientific approach over other more common used practices in asimilar context, a result achieved through simulation modelling could also experience ahigher probability of implementation. Simulation modelling also allows practitioners to,once the model is built, run it in compressed time. This means that the model can beexamined for a large number of runs leading to both a better understanding of the modeland better statistical analysis.
Simulation within healthcare has also shown to come with its di�culties. As statedearlier, access to data could be di�cult as the collected data, at this Hospital, mainlycovers when patients are admitted along with respective diagnosis codes. No statisticsare collected on a process level, which required the simulation practitioner to collect mostdata themselves. Many physicians and nurses tend to approach tasks in their own ways,
48
possibly due to a lack of detailed process descriptions. Additionally, the work requiresspecific professional skills, making it di�cult to fit data to highly accurate distributionfunctions. Furthermore, high variation increases the data quantity requirement.
A clear drawback to simulation modelling as Chung (2004) states is that it cannot solveany issues on its own, provides no easy answers to complex problems and is very dependenton the quality and amount of input data. In addition to this it is resource intensive interms of knowledge and time. These drawbacks to simulation modelling are importantto take into consideration during the process of choosing a method. In this particularcase, it was determined that simulation modelling would be a suitable fit, since thephysical system was very complex and one where changes could be di�cult to promote andimplement. However, due to COVID-19, the data collection phase was interrupted andinput data limited, further discussed in section 5.5. This could not have been anticipatedand therefore simulation modelling still is considered to be a suitable tool in this context.
Due to the limited input data, the data analysis method had to be altered for someof the processes described in the conceptual model in figure 4.1. Due to a lowervolume of underlying data points than desired, these distributions may be less valid.However, they where validated by qualitative methods and are believed to be good-enoughapproximations. Therefore, it is not believed that the probability distributions nor themodel as a whole make up a non-desirable representation of the physical system, as thepractitioners experienced it. Yet, the limited observations made it di�cult to accountfor the high variance between di�erent employees at the clinic and the seasonality of thesystem. Due to a rotational sta�ng system the suggested future state could easily beimplemented as all employees have knowledge of all stations, but this also means thatthere are, for example, several nurses that occupy the post of Nurse 1. This imposes amajor variance on both average times and the appurtenant variance. The practitionershedged some of these e�ects in the sensitivity analysis, but it is suspected that not alle�ects could be caught.
The desired future state was derived by an experimental design. This method imposes aquantitative approach to a complex task. By understanding the impact of every resourceon the entire system as well as subsystems, it becomes easier to design a new system.Both Chung (2004) and Law (2014) describe the factorial analysis as a way of determiningthe design of new systems. Due to the research question of this thesis and the di�cultyof change within healthcare as described above, only resources composed factors. With11 KPIs and 16 factors the factorial analysis became rather complex, however, it couldhave been conducted in a even more extensive matter by increasing the number of factors.There is no clear disadvantage to increasing the number of factors or their levels in termsof better understanding the model. Yet, an increased analysis makes it easier to mix upresults and is time demanding. Therefore, this experimental design was limited to 120comparisons of mean values for every KPI. This comparison of mean values is displayedin ?? for the entire throughput time, i.e. KPI (1).
In summary, this thesis reiterates that simulation can be used as a powerful tool forunderstanding complex systems with large degrees of variation. As could be expected,higher quality of collected data could lead to a more precise the model. However, eventhough a model can become very precise the more work is put into it, how detailed does
49

the model have to be, in order to draw relevant conclusions? The authors of this thesisargue that if one wants to draw precise solutions about outcomes from system changes,detailed data is needed. But as this thesis has shown, relevant results can still be found,even though the data collection phase is limited.
5.2 Discussion of system description and operationscharacteristics
As mentioned in section 4.1.1, the emergency flow is characterised by a high volume,variety, variation, and visibility. According to Slack and Lewis (2017), this would indicatethat three out of four V’s would be associated with higher costs, while the higher volumehelps drive down cost, since the physicians and nurses can become more specialised.However, Swedish healthcare is typically costly (Bjornberg & Phang, 2019). This leadsto a position where the high variety, variation and visibility could have a higher weightfrom a cost perspective.
In relation to Slack et al. (2013), quality and speed seemed to be the most importantperformance objectives for the clinic, since it is important to deliver the right care in orderto minimise second visits and utilise the capacity on new patients, while the patientsneed to be treated quickly in emergency situations. The system also needs to be flexiblesince although the clinic provides specialised care within ENT, the emergency flow ismore generalised than the elective care. Dependability does not seem to be of utmostimportance, as patients are booked in preliminary time slots and receive care as the queuebefore the physician is worked through.
The above factors had to be taken into consideration when designing the new model. Asthe emergency flow is predominately sta�ed with a single resource where a resource isrequired, it was not as simple as removing a resource from a process to free up capacity.Instead, every resource’s individual schedule and utilisation had to be taken into account,resulting in shortening the day of Nurse 2 by 50% while allowing for Nurse 1 to assist inhandling the external phone, and suggesting to redirect Nurse 2 to the elective care unitfor the rest of the day.
Relating to Slack and Lewis (2017), the above illustrates a trade-o� between quality, speedand cost. Removing a whole resource could free up capacity from the emergency flow andthus reduce direct cost, but could lead to a slower throughput time and indirectly impactthe quality of the provided care. Furthermore, taking into account the high variation andhigh potential capacity utilisation for Nurse 1, this could lead to longer queue times inreality, as increased variation and utilisation have an exponential impact on queue lengthaccording to the Kingman Formula (Holweg et al., 2018).
As Modig and Ahlstrom (2012) wrote, the e�ciency paradox means that an organisationtypically strives for higher resource utilisation, while customers tend to want highervariety and short queues. Therefore, a case is made for maintaining some slack resourcesin the emergency flow, since reallocating Nurse 2 completely flow leads to a utilisation
50

rate for Nurse 1 that was deemed too high.
5.3 Discussion of simulation model and results
The simulation base model was constructed under unusual circumstances with COVID-19 occurring during the study. This only impacted the data collection, however, that inturn impacted the model’s process times. Anyhow, given that the model reached highface validity, sensitivity analysis was performed on the future state model, and both thepractitioners and supervisors have experience from healthcare improvement projects, theresults are thought to be reliable. This does not necessary imply that the physical system,if suggested future state changes are applied, experiences the exact same throughput timesas the desired future state model, but the result of this thesis provides a good-enoughapproximation to indicate that the suggested changes can have positive implications forthe clinic.
The final result, reducing Nurse 2’s availability by half, provides the ENT clinic emer-gency flow with an increased utilisation of resources and a decreased throughput time.Since the throughput time is decreased in the model and Nurse 1 is able to perform aportion of Nurse 2’s tasks, it seems like a feasible solution from a operations standpoint.This way of task sharing is also in line with what Sasser (1976) stated about utilisingcross-trained employees for managing capacity constraints. However, to avoid wastefultravel times for Nurse 1, a workstation could be set up in the expedition room. Thiswould enable Nurse 1 to e�ciently switch between physically assessing patients and do-ing so over the phone. This would require a small investment, but this is not expected tobe a large cost in the scope of total cost for providing care. A prerequisite to this solutionis that the patient flow entering through the external phone is managed the same way inthe future. This means that patients call in early and all slots are filled, hence, Nurse 2can be fully utilised. If there was no initial queue the utilisation would decrease and thefuture state would not be as viable, as a basic assumption in the model is that the queuedoes not start filling up again as the day goes on.
As presented in the results, Nurse 2 could be reallocated entirely but this would imply avery high utilisation of Nurse 1, and would probably not be viable in reality. Since themodel is limited in its underlying input data, this future state was somewhat to close toa critical value of utilisation, in addition, the model does not mitigate the e�ects of non-value creating activities, therefore, this future state was rejected. The only mitigation ofnon-value creating activities is performed by decreasing the overall ability of each resourceto 90%.
The desired future state, if implemented, decreases throughput time for the entire systemas well as allows for Nurse 2 to partly be reallocated to the elective care of the ENTclinic. This is not a drastic change but o�ers several possibilities for the ENT clinic. Sincethe emergency flow’s throughput time is decreased, it is, in theory, possible to increasethe number of treated patients per day. It is also possible to decrease the number ofpatients that enter through the booked patients entry, since some of these patients are
51

patients redirected from the elective care. These patients are usually not able to fit intothe strained schedule of the elective care and cannot wait for a later assigned time slot.However, one concern is raised regarding the need for an additional nurses in the electivecare. Regarding empirical data from interviews, it seems like there is a need for additionalnurses, yet, the practitioners have not conducted any additional research on this subject.This limits the thesis’ ability to predict what e�ects this would have on the elective caresystem.
Overall, the proposed future state helps the entire ENT clinic with increasing itsaccessibility and decreasing patients’ waiting times. Although this is a small step towardsa bigger goal, reaching a potential sub-goal of gaining momentum and experiencing thepositive e�ects of providing better care, could impact the personnel at the ENT clinicpositively in terms of work satisfaction and psychosocial work environment Goranssonet al. (2018).
5.4 Implementation considerations
Making changes to a healthcare system is not entirely straight forward. As Boaden etal. (2008) stated, healthcare workers have considerable discretion and autonomy, andusually need to be persuaded in change initiatives. Therefore, it is important to includethe sta� early on in both problem assessment, solution design and implementation toensure that change e�orts meet as little resistance as possible. Given that the healthcaresystem is also very complex and there generally exists a lack of whole-system views,paired with Druckler (2011)’s point about healthcare being financed by public tax money,implementation work becomes even more di�cult.
Any implementation should, according to one of the interviewed physicians, be consideredwith quality and patient safety (Swedish: ”patientsakerhet”) in mind, to not let speedand cost dominate too much. However, this is a matter of debate. This thesis’ view isthat maximising resource utilisation is not necessary preferable in Swedish healthcare,due to the long queues and waiting times. Therefore, the implementation of this thesiswould imply increased resources within the elective care unit, without increasing labourcosts. Although the proposed solution increases the utilisation in the emergency flow, itdoes decrease the throughput time. This is a rare but desirable combination.
After consulting with one of the main stakeholders at the ENT clinic, a potential hinderfor implementation could be that unforeseen emergency circumstances might make Nurse1 unable to assist in the external phone as the resource is needed elsewhere. The externalphone must also be reachable during the entire day, for example in the case of externalcaregivers calling for consultation. Furthermore, patients that have a scheduled time, asin the case of a time where they should be expecting a call from the clinic, might beless tolerant towards waiting or undependable time slots, which is in line with Slack andLewis (2017)’s view on process visibility, waiting times and dependability. In the eventof exceptional emergencies, these perspectives in combination might lead to di�cultieswhen planning the schedule to balance availability and resource utilisation. Since the
52

thesis takes variation and today’s demand into account, this is assessed to not a�ect thepotential impact of the suggested future state significantly.
The healthcare stakeholder perspective presented by Glouberman and Mintzberg (2001)adds to the complexity of implementation. Balancing the needs of each stakeholder canmake it di�cult to implement system changes like the one proposed, possibly due to alack of clear ownership between stakeholders as a large number of people tends to becomeinvolved and each stakeholder has its own interest and agenda. In brief terms, there mightbe risk that one stakeholder who is not satisfied with where the project is heading couldhinder the progress, e.g. a physician that doesn’t want to adhere to new standards, orpoliticians who don’t share the view of the change project.
Even though a change like this might be di�cult to implement, it is not impossible.Given that the proposed change is not of a drastic or radical nature, simply altering theresource schedule and allowing for more task sharing between Nurse 1 and Nurse 2 isa relatively small change and could be tried out on a small scale before assessing thesuggestion’s feasibility. Therefore, this thesis recommends that the proposed change isdiscussed and piloted before taking a final decision to implement.
5.5 Extraordinary circumstances impacting the study
As mentioned throughout the report, there were external factors impacting the work thatwas carried out in the thesis. The COVID-19 pandemic brought drastic restrictions to amajority of the world’s countries, with Sweden being no exception. Access to the Hospitalwas restricted to anyone who didn’t have a specific reason to visit, i.e. only healthcareworkers and patients were allowed. This meant that the data collection phase at the ENTclinic had to be discontinued.
Luckily, the restrictions didn’t come in force before the data collection started, meaningthat data collection had already been conducted in the form of interviews and initial timestudies of a majority of the processes. However, the extraordinary circumstances led to ageneral lack of data volume, impacting the ease of translating data into highly accuratedistribution functions. After discussions with thesis supervisors, it was determined thatdata had to be completed with interviews and more face validation, as well as use softwareto assist in assigning distribution functions.
Although a higher volume of data could be desired, the study could be carried out withoutmuch di�culty after adjustments to the situation had been made. While statisticalvalidity could not be reached, the model is an accurate description of reality in terms oflogical flows and decision points. What is left for an accurate statistical description is tosimply complement with more data points and compare the model output to the physicalsystem’s output. Furthermore, it is believed that for the aim of this study, relevantconclusions about the current and desired state could be drawn to answer the outlinedresearch questions.
53

5.6 Generalisability
The desired future state can only be applied to the emergency flow of the ENT clinic oremergency flows designed in a similar way. Therefore, it is a very specific result. Thishowever is the case with any new tailor-made layout for an operation. However, this doesnot mean that there are no general results that can be drawn from this study.
Being able to decrease throughput time as well as increasing utilisation of resources, byrelocating parts of resources, implies a sub-optimised operation. As cited earlier, Boadenet al. (2008) describe healthcare as complex and often lacking a whole-system view. Thiscould be an underlying reason to suspect that other clinics and inpatient wards withinthe Hospital, as well as within other hospitals, face similar sub-optimised operations.Therefore, the broader result of this study, the ability to create a more e�cient patientsflow by changing the operational layout, could be applied to other potential studies. Thiscould by done by using a tool such as simulation modelling, but also be accomplished byleveraging other tools.
Describing and understanding the current state of any operation is a spillover e�ect ofapplying simulation modelling. As Chung (2004) mentions, thorough understanding and aconceptual model of a physical system are steps that should be included in any simulationmodelling project. By taking these steps, practitioners will be able to describe the currentstate of any operation that is to be modelled. This spillover e�ect is determined to berather general.
Jingshan et al. (2017) describes several cases where simulation has been used as a e�ectivetool within healthcare. After conducting the study, it has become clear that simulationmodelling is adequate tool to tackle optimisation tasks within a complex environment.Two advantages found in this thesis are the probability of impact and the di�usion duringthe process of building a model. This refers to the better understanding of the systemof people working within it and the perception of simulation modelling as complex andscientific. It has been noticed that people within healthcare often are critical towardschange, as described by Goransson et al. (2018), however, in this particular case theywere rather receptive towards simulation modelling. This is not a final conclusion sincethe empirical data is too limited, but it opens up the possibility of an additional reasonto continue using simulation modelling in solving complex problems within healthcare.Altogether, it appears like simulation modelling is a suitable tool for solving complexproblems, both within and outside of healthcare. From this thesis’ perspective, it is aparticularly suitable method when relevant secondary data exists and primary data iseasily accessible.
5.7 Suggestions for further research
Building upon this project by simulating the emergency flow of the ENT clinic with abroader and larger conducted data collection is a consideration for future research. The
54

existing model, or a new one, complemented with more data, could be used to conducta di�erent experimental design with other objectives, for example with decreasing thethe throughput time as the main objective. Also, by using the findings from this thesis,practitioners can gain a base understanding of one part of the patient flow and connect itto a larger model, incorporating several units like the elective care flow, referral bookingprocess, etc. Researchers could base their study in this thesis’ model in both the abovedescribed future research suggestions. Additionally, the finding that the emergency flowat the ENT clinic was sub-optimised gives rise to the possibility of sub-optimised patientflows at other clinics and inpatient wards within the Hospital and the region. Assumingthat this statement is valid, simulation modelling could be applied in the aforementionedcases and this thesis’ model could act as a reference and guideline in these studies.
As simulation was a helpful tool for mapping, understanding and quantifying factorsin a patient flow, the authors of this thesis argue that simulation can be used in moresettings than just at the Hospital. An advantage of simulation is the ability to quantifyfactors in both the base system and e�ects on system changes, as well as account forvariation in processes and arrival times. These advantages might not be as prominentin other methods such as standard flowcharts or Value Stream Mapping, to name a few.However, during the process of conducting this thesis, the authors have experiencedseveral ine�ciencies within the physical system that do not necessarily need to bequantified, and could serve as basis for future research within the Hospital without theuse of simulation modelling.
55

6Conclusion
The current state of the ENT clinic deals with a moderate volume and high variety,variation and visibility. There are several entry points through which the patients canenter, which are either walking in unplanned through the front door, through an externalphone, referrals to the internal phone or fax, or being pre-booked for appointments. Theexternal phone and the fax referral are currently the entry points where the throughputtimes are the longest.
The physical system consists of several processes and di�erent resources are required fordi�erent processes. From studying the di�erent processes, it could be concluded thatNurse 2, Nurse 3, Physician 1, and Physician 2 are highly utilised, and that Nurse 3and Physician 1 constitute a bottle neck in regards to physical throughput time, andNurse 2 constitutes a bottle neck as a large phone queue is built up each day at theexternal phone. However, neither resource is currently utilised to the degree where thethroughput time is impacted to an extent that is regarded as non-feasible. With theparts of the research question aiming towards freeing up resources the conclusion was toemphasise on Nurse 1 and Nurse 2.
The desired future state presented in this report suggests allowing for task sharingbetween Nurse 1 and Nurse 2, where Nurse 1 assists with the external phone. By doingso, the throughput time for patients waiting in the external phone queue can be shortened.Furthermore, by decreasing the hours of Nurse 2 working within the emergency flow ofthe ENT clinic and reallocating the rest to the hours to the elective care of the ENT clinic,resources are freed and the throughput time of the entire system is decreased. This resultis reached by letting Nurse 1 aid with the assessment of patients entering through theexternal phone. Since the nurses rotate within the ENT clinic and a relatively smallinvestment is required, in order to enable the task sharing, this is judged to be a feasiblesolution.
Decreasing the availability of resources within a system often leads to increasing through-put times. Yet, it is possible to reallocate part of Nurse 2’s hours and still be able toshorten the throughput time of the entire system. This is somewhat counter-intuitive butbecomes clear when understanding how the assessment of patients through the externalphone is designed. As patients call in the early morning and book time slots, the externalphone creates a large queue that gradually decreases as each patient is assessed. Thisconstruction in combination with the new advocated state allows more patients to enterother parts of the system earlier, decreasing throughput times and slightly increasing
56

utilisation. The decrease in overall throughput time is reached by a large decrease of thethroughput time from the external phone outweighing the slight increases in the rest ofthe throughput times.
Starting with setting up an additional work station to answer and assess patients calling inthrough the external phone is the suggested first step in implementing the desired futurestate. This enables Nurse 1 to aid Nurse 2 without increasing travel times. Consequently,the hours of Nurse 2 can continuously be decreased to the level of a half day, one hourat a time. This way, the system will not have to adapt immediately and it could alsoexperiment with a further decrease of Nurse 2’s hours. Since the computer based modelsuggests that it is possible to fully reschedule Nurse 2 to a half day, the ENT clinic couldcontinue reallocating Nurse 2’s hours until reaching an optimal state.
The specific clinic, in which this thesis was conducted, is viewed as open to changeand willing to test new solutions. Although they were not instantly convinced whenpresented with the thesis’ results, there is a good chance that the desired future state willbe trialled for implementation. If this project were to be implemented, it is possible thatin the trajectory of this, several other simulation modelling projects could be conductedin healthcare in the region by future researchers.
As discussed in section 5.6, a takeaway for future research is that a lack of whole-systemview might make it di�cult to see where processes or schedules could be optimised, asprocesses or resources may appear strained as a result of sub-optimisation. However, theresults from this thesis show that there still existed room for improvement, giving reasonto believe that this phenomena might exist in other healthcare systems as well.
57

References
Alange, S. (1994). The new paradigm for industrial practices - total quality management,CIM-working papers - Department of Industrial Management, Chalmers Univer-sity of Technology: WP 1994-01.
Barnes, R. M. (1956). Work sampling. New York: John Wiley & Sons, Inc.
Belvedere, V. (2014). Defining the scope of service operations management: An inves-tigation on the factors that a�ect the span of responsibility of the operationsdepartment in service companies. Production Planning and Control, 25 (6), 447–461.
Berg, B. L. (2009). Qualitative research methods for the social sciences (7th ed.). Boston:Allyn & Bacon.
Bjornberg, A., & Phang, A. Y. (2019). Health consumer powerhouse: European healthconsumer index 2018. https://healthpowerhouse.com/media/EHCI-2018/EHCI-2018-report.pdf Accessed 2020-01-22
Boaden, R., Harvey, G., Moxham, C., & Proudlove, N. (2008). Quality improvement:Theory and practice in healthcare. Coventry: NHS Institute for Innovation; Im-provement.
Bryman, A., Bell, E., & Nilsson, B. (2005). Foretagsekonomiska forskningsmetoder.Stockholm: Liber Ekonomi.
Chan, C. W., & Green, L. V. (2013). Improving access to healthcare: Models of adaptivebehaviour (Ed. B. T. Denton), In Handbook of healthcare operations management:Methods and applications. New York: Springer Science+Business Media.
Chase, R. B. (1978). Where does the customer fit in a service operation. Harvard BusinessReview, 56 (6), 137–142.
Chung, C. (2004). Simulation modeling handbook: A practical approach. Boca Raton: CRCPress.
Collden, C., & Hellstrom, A. (2018). Value-based healthcare translated: A complementaryview of implementation. BMC Health Services Research, 18 (1).
Conway, K. (2019). Value-based healthcare starts with standard definitions. https://www.hpnonline.com/sourcing-logistics/article/13002078/valuebased-healthcare-starts-with-standard-definitions Accessed 2020-01-24
58
Devore, J. (2012). Probability and statistics for engineering and the sciences, 8th ed.Boston: Brooks/Cole.
Druckler, P. F. (2011). The new realities. Oxford; New York: Routledge.
Gillham, B. (2008). Forskningsintervjun: Tekniker och genomforande (E. J. Gromark,Trans.). Lund: Studentlitteratur.
Glouberman, S., & Mintzberg, H. (2001). Managing the care of health and the cure ofdisease—part i: Di�erentiation. Health care management review, 26 (1), 56–69.
Goransson, P., Johansson, E., Kross, A., Lambrecht, S., Rye, S., & Westberg, C.(2018). Leadership and psychosocial work environment in an intensive care setting,Chalmers University of Technology, Sweden.
Holweg, M., Davies, J., De Meyer, A., Lawson, B., & Schmenner, R. W. (2018). Processtheory: The principles of operations management. Oxford University Press.
Jacobsson, T. (2012). Operations management in healthcare – principles for creating swifteven patient flow and increased accessibility, Chalmers University of Technology,Sweden.
Jingshan, L., Nan, K., & Xiaolei, X. (2017). Stochastic modeling and analytics inhealthcare delivery systems. World Scientific.
Jones, D. T. (2006). Leaning healthcare. Management Services, 50 (2), 16–17.
Kaplan, R. S., & Porter, M. E. (2011). The big idea: How to solve the cost crisis inhealthcare. Harvard Business Review, 89 (9), 46–64.
Kjøller, A., & Westergaard, N. (2017). The hidden potential of managing failure demand.Implement Consulting Group, October.
KTH. (2019). Hallbar utveckling. https://www.kth.se/om/miljo- hallbar- utveckling/utbildning - miljo - hallbar - utveckling / verktygslada / sustainable - developmentAccessed 2020-01-27
Kumar, R. (2011). Research methodology: A step-by-step guide for beginners. London:Sage Publications Limited.
Law, A. (2014). Simulation modeling and analysis, 5th ed. New York: McGraw-HillEducation.
McLaughlin, D. B., & Olson, J. R. (2017). Healthcare operations management, thirdedition. Chicago: Health Administration Press.
Modig, N., & Ahlstrom, P. (2012). This is lean: Resolving the e�ciency paradox.Rheologica.
Pruzan, P. (2016). Research methodology: The aims, practices and ethics of science.Cham: Springer International Publishing Switzerland.
Ross, T. K. (2014). Health care quality management: Tools and applications. New York:John Wiley & Sons, Inc.
Sasser, W. E. (1976). Match supply and demand in service industries. Harvard BusinessReview, November 1976, 133–140.
59

Skinner, W. (1969). Manufacturing – missing link in corporate strategy. Harvard BusinessReview, 47 (3), 136–145.
Slack, N., Brandon-Jones, A., & Johnston, R. (2013). Operations management. Harlow:Pearson Education Limited.
Slack, N., & Lewis, M. (2017). Operations strategy: Fifth edition. Harlow, UK: PearsonEducation Limited.
Wallen, G. (1993). Vetenskapsteori och forskningsmetodik. Lund: Studentlitteratur.
World Commission on Environment and Development. (1987). Our common future.Oxford: Oxford University Press.
60

DEPARTMENT OF TECHNOLOGY MANAGEMENT AND ECONOMICS DIVISION OF SUPPLY AND OPERATIONS MANAGEMENT CHALMERS UNIVERSITY OF TECHNOLOGY Gothenburg, Sweden www.chalmers.se
61