diplomarbeit paul steiner - othes.univie.ac.atothes.univie.ac.at/25547/1/2013-01-30_0601500.pdf ·...
TRANSCRIPT

1
DIPLOMARBEIT
Titel der Diplomarbeit
„Abundance and diversity of nitrate assimilating bacteria in the deep waters of the Atlantic Ocean“
Verfasser
Paul Alan Steiner
angestrebter akademischer Grad
Magister der Naturwissenschaften (Mag.rer.nat.)
Wien, 2013
Studienkennzahl lt. Studienblatt: A 444
Studienrichtung lt. Studienblatt: Diplomstudium Ökologie
Betreuerin / Betreuer: Univ.-Prof. Dr. Gerhard Herndl

2
Table of content
Einleitung .............................................................................................................. 3
Introduction .......................................................................................................... 5
References ............................................................................................................ 8
Zusammenfassung .............................................................................................. 10
Abstract ............................................................................................................... 12
Introduction ........................................................................................................ 13
Materials and Methods ....................................................................................... 15
Results ................................................................................................................ 21
Discussion ........................................................................................................... 25
Acknowledgments .............................................................................................. 31
References .......................................................................................................... 32
Tables and Figures .............................................................................................. 40
Curriculum Vitae ................................................................................................ 50

3
Einleitung Das marine Ökosystem ist ein heterogener Lebensraum, der von verschiedensten
physikalischen, chemischen und biologischen Faktoren gekennzeichnet ist und eine
dementsprechend vielfältige Organismenwelt aufweist. Prokaryoten machen durch ihre
Allgegenwärtigkeit und Häufigkeit den Großteil der marinen Biomasse aus. Abundanzen von
105 bis 106 Zellen/mL in der Wassersäule des Kontinentalschelfs und den oberen 200 m des
offenen Ozeans und 5 x 10⁴ Zellen/mL im tiefen Ozean (<200 m) wurden berichtet (Whitman
et al., 1998). Prokaryoten spielen daher auch eine wichtige Rolle in den biogeochemischen
Zyklen von Kohlenstoff, Sauerstoff, Stickstoff, Phosphor und Kalzium etc. (Lavelle et al.,
2005). Der Stickstoffkreislauf ist besonders interessant, da die Verfügbarkeit von Sickstoff
(N) Ökosystemfunktionen wie Primärproduktion und Dekomposition beeinflussen kann (Zehr
und Kudela, 2011). Wegen seiner Vielfalt an chemischen Formen und den dazugehörigen
Umwandlungen, die durch mikrobielle metabolische Prozesse durchgeführt werden, ist der N-
Kreislauf so komplex wie kein anderer.
Stickstoff kommt in Oxidationsstufen von -3 bis +5 vor und kann im Energiehaushalt
als Elektronen-Akzeptor und -Donor verwendet werden (Zehr und Kudela, 2011). In
Oberflächengewässern sind gasförmiger Stickstoff und gelöster organischer Stickstoff
(dissolved organic nitrogen, DON) neben Nitrat und Ammonium die häufigsten N Formen
(Zehr und Kudela, 2011). Diese werden durch biologische Aktivitäten verfügbar gemacht.
Durch N2 Fixierung wird inertes atmosphärisches N-Gas in biologisch verfügbare
Verbindungen, wie Ammonium, umgeformt (Zehr und Paerl, 2008). Nur wenige
Mikroorganismengruppen können atmosphärisches N2 fixieren, während die meisten
Mikroorganismen N in anderen Formen, wie Nitrat, Nitrit, Harnstoff, Ammonium oder
organischen N, aufnehmen (Zehr und Paerl, 2008). In gelöstem organischem Material kommt
N meistens als Amin- oder Amid-Gruppen in Aminosäuren und Harnstoff vor. Diese sind
labile Stoffe, die von Mikroorganismen leicht aufgenommen und schnell regeneriert werden

4
(Baker et al., 2009), wobei das erste für Organismen verfügbare Aufschlussprodukt
Ammonium ist. Die meisten Mikroorganismen verwenden Ammonium als primäre N Quelle,
weil es energetisch günstiger ist als Nitrat und daher auch oft nur in geringen oder kaum
messbaren Konzentrationen vorhanden ist (Zehr und Kudela, 2011).
Ammonium wird von „Ammonia Oxidizing Bacteria“ (AOB) und „Ammonia
Oxidizing Archaea“ (AOA) bei der Nitrifikation als Energiequelle verwendet, indem
Ammonium zu Nitrit oxidiert wird (Wuchter et al., 2006; Mincer et al., 2007). Ammonium-
Monooxygenase (amo) Gene von Crenarchaeota sind die dominanten Stickstoff-oxidierenden
Gene im Ozean (Venter et al. 2004). Amo Gene sind daher in vielen marinen Lebensräumen
sehr verbreitet (Francis et al. 2005), einschließlich der photischen Zone (Church et al. 2010).
Im Gegensatz zu AOA können AOB nur in der aphotischen Zone nitrifizieren, da
nitrifizierende Bakterien von Licht inhibiert werden (Zehr und Kudela, 2011). Wegen der
biologischen Oxidation von Ammonium zu Nitrit und nachfolgend zu Nitrat nimmt die Nitrat-
Konzentrationen mit der Tiefe zu (Sarmiento und Gruber, 2006).
Denitrifikation, der Prozess bei dem Nitrat zu molekularem N umgewandelt wird,
kann nur in sauerstoffarmen Regionen, den „oxygen minimum zones“ (OMZ) oder
Sedimenten passieren. Nitrat kann wegen seiner hohen Oxidationszahl als Ersatz für
Sauerstoff verwendet werden, um organisches Material zu oxidieren (Zehr und Kudela, 2011).
Dabei wird es zu molekularem N reduziert und verlässt letztendlich das marine System. Ein
weiterer biologischer Prozess bei dem N vom marinen System verloren geht ist die „anaerobic
ammonia oxidation“ (Anammox), die ebenfalls in sauerstoffarmen Regionen passiert. Im
Anammox-Prozess wird Ammonium zusammen mit Nitrit, direkt zu Stickstoff Gas
umgeformt (Zehr und Kudela, 2011). Denitrifikation und Anammox sind biologische
Prozesse die dem Ozean N entziehen. Eine weiter Form der Nitrat-Reduktion ist die direkte
Umwandlung von Nitrat zu Ammonium, ein Prozess der dissimilatorisch oder assimilatorisch

5
sein kann (Gardner et al., 2006; Allen et al., 2001). In beiden Fällen wird Nitrat zu
Ammonium reduziert und bleibt dem marinen System erhalten (An und Gardner, 2002). Viele
Enzyme des N Kreislaufes wurden bereits identifiziert und die Gene, die diese kodieren
werden verwendet, um die mikrobiellen Lebensgemeinschaften die diese Prozesse ausführen
zu quantifizieren und phylogenetisch zu charakterisieren.
Diese Studie fokussiert auf Nitrat als anorganischen Nährstoff und dessen
Assimilation durch heterotrophe Bakterien in der Tiefsee. Dass Nitrat für marines
Phytoplankton ein wichtiger anorganischer Nährstoff ist, ist schon lange bekannt (Zehr und
Kudela, 2011), doch erst kürzlich wurde gezeigt, dass auch heterotrophe marine Bakterien
Nitrat zum Wachstum und der Synthese von Biomasse verwenden können (Kirchman, 2000;
Allen et al., 2001). Um einen besseren Einblick in den N-Kreislauf und das N-Budget des
Atlantiks zu bekommen, analysierten wir Häufigkeit und Diversität des nasA Genes in der
Wassersäule des westlichen Atlantik von 64°N bis 50°S von der Oberfläche bis zum
Bathypelagial. Das nasA Gen kodiert das Enzym Nitrat-Reduktase, verantwortlich für die
assimilatorische Nitratreduktion.
Introduction
The marine ecosystem is a heterogeneous environment characterized by contrasting
physical, chemical and biological factors, and is inhabited by a diverse set of organisms
highly adapted to certain conditions. Prokaryotes account for the largest part of marine
biomass due to their ubiquitous occurrence and average cellular abundances of 105 to 106
cells/mL in the continental shelf and the upper 200 m of the open ocean and 5 x 10⁴ cells/mL
in the deep ocean (<200 m) (Whitman et al., 1998). Due to the high abundance and metabolic
diversity, prokaryotes facilitate the biogeochemical cycling of carbon, oxygen, nitrogen,

6
phosphorus and calcium etc. (Lavelle et al., 2005). Nitrogen (N) is of particular importance as
its availability can affect the rate of key ecosystem processes such as primary production and
decomposition (Zehr and Kudela, 2011). The multitude of chemical forms of N and the
corresponding transformation pathways and microbial metabolisms that drive this
biochemical cycle makes it more complex than other element cycles. Nitrogen exists in redox
states ranging from -3 to +5 and can serve as electron acceptor and donor in energy
metabolism (Zehr and Kudela, 2011). The most abundant forms of N in surface oceans are
dissolved dinitrogen gas and dissolved organic nitrogen (DON) (Zehr and Kudela, 2011)
which are both made available through biological activities. The process of N2 fixation
converts inert atmospheric gas into biologically available ammonium (Zehr and Paerl, 2008).
However, only a few groups of microorganisms can perform N2 fixation while most
microorganisms obtain the N from other forms such as nitrate, nitrite, urea, ammonium, or
organic N (Zehr and Paerl, 2008). In dissolved organic matter, N usually is present as amine
or amide groups in amino acids and urea. These are labile compounds that are easily
assimilated by microorganisms and rapidly recycled (Baker et al., 2009), whereby ammonium
is the first breakdown product that becomes available to other organisms. Most
microorganisms use ammonium as primary N source as it is energetically favourable over
nitrate and thus, often only present at low or undetectable concentrations (Zehr and Kudela,
2011).
Ammonia is used by ammonia oxidizing Bacteria (AOB) and ammonia oxidizing
Archaea (AOA) to harvest energy by oxidizing ammonia to nitrite in the first nitrification
pathway (Wuchter et al., 2006; Mincer et al., 2007). Crenarchaeal ammonia monooxygenase
(amo) genes are the dominant nitrogen oxidation genes in oceanic waters (Venter et al. 2004).
It has been reported that amo genes are very common in a number of marine environments
(Francis et al. 2005) including the euphotic zone (Church et al. 2010). Contrary to AOA,

7
nitrification by AOB is only possible in the dysphotic realm because nitrifying Bacteria are
inhibited by light (Zehr and Kudela, 2011). Due to these biological processes, nitrate
abundance increases with depth in the oceanic water column (Sarmiento and Gruber, 2006).
Denitrification, the process of transforming nitrate to molecular nitrogen occurs only
in oxygen-depleted regions of the water column such as the oxygen minimum zones (OMZ)
or suboxic to anaerobic sediments. Due to its high oxidation state, nitrate can be used as
substitute of oxygen to oxidize organic material (Zehr and Kudela, 2011). It is thereby
reduced to molecular nitrogen and eventually leaves the marine system. Another biological
pathway of N loss from the system is anaerobic ammonia oxidation (Anammox), which also
occurs in oxygen-depleted environments. Anammox is mediated by Planctomycetes Bacteria
that directly convert ammonium and nitrite to dinitrogen gas (Zehr and Kudela, 2011).
Anammox, together with heterotrophic denitrification are sinks of nitrogen from the ocean.
Another form of nitrate reduction is the direct transformation of nitrate to ammonium, a
process that can be dissimilatory or assimilatory (Gardner et al., 2006; Allen et al., 2001). In
both cases the nitrate is reduced to ammonium and therefore not lost from the system, but
rather conserved and made available to organisms at higher trophic levels (An and Gardner,
2002). Many enzymes involved in the nitrogen cycle have been identified and the genes
encoding them have been used to quantify and phylogenetically characterize the microbial
communities carrying out these processes.
This study focuses on nitrate assimilation by heterotrophic Bacteria in the deep sea.
The importance of NO3- as an inorganic nutrient source for marine phytoplankton has long
been recognized (Zehr and Kudela, 2011). Only fairly recently, however, marine
heterotrophic Bacteria have been shown to utilize NO3- for growth and biomass synthesis
(Kirchman, 2000; Allen et al., 2001). To gain better insights into the distribution and
abundance of nitrate assimilating Bacteria in the water column of the Atlantic Ocean, we

8
analyzed samples collected along a transect in the Western Atlantic basin from 64°N to 50°S
from the surface to bathypelagic waters. We determined the abundance and diversity of the
nasA gene, which encodes the enzyme nitrate reductase responsible for assimilatory nitrate
reduction in heterotrophic Bacteria.
References
• Allen AE, Booth MG, Frischer ME, Verity PG, Zehr JP, Zani S. (2001). Diversity and
detection of nitrate assimilation genes in marine Bacteria. Appl. Environ. Microbiol.
67: 5343-5348
• An S, Gardner WS. (2002). Dissimilatory nitrate reduction to ammonium (DNRA) as
a nitrogen link, versus denitrification as a sink in a shallow estuary (Laguna
Madre/Baffin Bay, Texas). Mar. Ecol. Prog. Ser. 237: 41-50
• Baker KM, Gobler CJ, Collier JL. (2009). Urease gene sequences from algae and
heterotrophic Bacteria in axenic and nonaxenic phytoplankton cultures. J. Phycol. 45:
625–34
• Church MJ, Wai B, Karl DM, DeLong EF. (2010). Abundances of crenarchaeal amoA
genes and transcripts in the Pacific Ocean. Environ. Microbiol. 12: 679–88
• Francis CA, Roberts KJ, Beman JM, Santoro AE, Oakley BB. (2005). Ubiquity and
diversity of ammonia oxidizing archaea in water columns and sediments of the ocean.
Proc. Natl. Acad. Sci. USA 102: 14683-14688

9
• GardnerWS, McCarthy MJ, An SM, Sobolev D, Sell KS, Brock D. (2006). Nitrogen
fixation and dissimilatory nitrate reduction to ammonium (DNRA) support nitrogen
dynamics in Texas estuaries. Limnol. Oceanogr. 51: 558–68
• Kirchman DL. (2000). Uptake and regeneration of inorganic nutrients by marine
heterotrophic Bacteria. In: Kirchman DL (ed) Microbial ecology of the oceans. John
Wiley & Sons, New York, p. 261-288
• Lavelle P, Dugdale R, Scholes R, Berhe AA, Carpenter E, Codispoti L, et al. (2005).
"12. Nutrient cycling". Millennium Ecosystem Assessment: Objectives, Focus, and
Approach. Island Press. ISBN 1-55963-228-3. pp 333-347
• Mincer TJ, Church MJ, Taylor LT, Preston C, Kar DM, DeLong EF. (2007).
Quantitative distribution of presumptive archaeal and bacterial nitrifiers in Monterey
Bay and the North Pacific Subtropical Gyre. Environ. Microbiol. 9: 1162-75
• Sarmiento JL and Gruber N. (2006). In: Sarmiento JL and Gruber N. (ed) Ocean
Biogeochemical Dynamics. Princeton, New Jersey, pp.189-196
• Venter JC, Remington K, Heidelberg JF, Halpern AL, Rusch D, et al. (2004).
Environmental genome shotgun sequencing of the Sargasso Sea. Science 304:66-74
• Whitman WB, Coleman DC, Wiebe WJ. (1998). Prokaryotes: The unseen majority.
Proc. Natl. Acad. Sci. USA 95: 6578-6583
• Wuchter C, Abbas B, Coolen MJL, Herfort L, van Bleijswijk J, et al. (2006). Proc.
Natl. Acad. Sci. USA 103: 12317-12322
• Zehr JP and Kudela RM. (2011). Nitrogen Cycle of the Open Ocean: From Genes to
Ecosystems. Annu. Rev. Mar. Sci. 3: 197-225

10
• Zehr JP and Paerl HW. (2008). In: Microbial ecology of the oceans Chapter 13:
Molecular ecological aspects of nitrogen fixation in the marine environment
(Kirchman DL). John Wiley & Sons. DOI: 10.1002/9780470281840.ch13
Zusammenfassung Es wird angenommen dass heterotrophe Bakterien der Tiefsee durch die Verfügbarkeit
von organischem Material limitiert sind. Das Vorkommen von Abbau-resistentem
organischem Stickstoff und Phosphor der Tiefsee steht im Gegensatz zu potentiell
verfügbarem Nitrat und Phosphat, die in großen Mengen vorhanden sind. Um die potentielle
Aufnahme von Nitrat durch Bakterien in der Tiefsee zu bestimmen, wurden Wasserproben
von Oberflächengewässern bis zum Bathy- und Abyssopelagial an 51 Stationen eines
latitudinalen Transekts von der arktischen bis zur subantarktischen ozeanographischen
Provinz des Atlantik genommen. Die Abundanz von Nitrat-assimilierenden Bakterien wurde
über das nasA Gen (welches die assimilatorische Nitrat-Reduktase kodiert) und quantitativer
PCR gemessen. Eine größere Fraktion mutmaßlich Nitrat-assimilierender Bakterien wurde in
tieferen Regionen des Bathypelagial der Subantarktis (51%) und der nordatlantischen Drift
Provinz (20%) und im tiefen Mesopelagial der südatlantischen Provinz (20%) als im
Epipelagial und der arktischen Region (0 – 3%) gefunden. Um die Nitrat-assimilierende
Bakteriengemeinschaft phylogenetisch zu charakterisieren, wurde eine „nested“ PCR
verwendet, um das nasA Gen zu amplifizieren, klonieren und zu sequenzieren. Die
Bakteriengemeinschaft, die das nasA Gen besitzt, bestand hauptsächlich aus
Gammaproteobakterien und Bacteroidetes, obwohl Unterschiede in der Zusammensetzung
der nasA-beinhaltenden Gemeinschaft zwischen einzelnen ozeanischen Provinzen und
Tiefenschichten festgestellt wurden. Die nasA-beinhaltenden Gemeinschaften der arktischen
Provinz waren in allen Tiefenschichten ähnlich und signifikant unterschiedlich von den nasA-

11
beinhaltenden Gemeinschaften anderer ozeanographischen Provinzen. Die nasA-
beinhaltenden Gemeinschaften der Tiefengewässer der nordatlantischen Drift, der
nordatlantischen Gyre, der westlichen-tropischen atlantischen und der südlichen atlantischen
Provinz waren alle ähnlich zueinander. Allgemein wurden größere Fraktionen mutmaßlich
Nitrat-assimilierender Bakterien in Regionen mit organischer Stickstofflimitierung, wie den
Tiefengewässern der subtropischen Regionen und der mesopelagischen (sub)tropischen
Gewässer, gefunden. Demzufolge hat zumindest ein Teil der heterotrophen Bakterien der
Tiefsee das Potential, Limitierung durch organischen Stickstoff durch Aufnahme von frei
verfügbarem Nitrat zu kompensieren.

12
Abstract Heterotrophic Bacteria in the deep ocean are generally limited by the availability of
organic matter. The recalcitrant nature of the organic nitrogen and phosphorus pool in the
deep ocean contrasts the high concentrations of potentially available nitrate and phosphate. To
determine the potential of deep-water Bacteria to take up nitrate, water samples were taken
from the epipelagic to the lower bathypelagic and abyssopelagic waters of the Atlantic at 51
stations along a latitudinal transect from the Arctic to the Subantarctic oceanographic
province. The abundance of nitrate assimilating Bacteria was quantified by q-PCR of the
nasA gene (encoding the assimilatory nitrate reductase). A higher fraction of putatively nitrate
assimilating Bacteria was found in the lower bathypelagic waters of the Subantarctic (51%)
and the North Atlantic Drift (20%) province and in lower mesopelagic waters of the South
Atlantic province (20%) than in the epipelagic waters and the Arctic region (0 – 3%). To
phylogenetically characterize the nitrate assimilating bacterial community, nested PCR was
used to amplify, clone and sequence the nasA gene. The nasA gene harboring bacterial
community consisted mainly of Gammaproteobacteria and Bacteroidetes, although
differences in the composition of the nasA-containing community were observed among
oceanic provinces and depth layers. The composition of the nasA-containing communities of
the Arctic province was similar throughout the water column and significantly different from
the nasA-containing communities of the other oceanic provinces. The deep-water nasA-
containing communities of the North Atlantic Drift, the North Atlantic Gyre, the Western
Tropical Atlantic and the South Atlantic province were all similar to each other. Overall,
higher fractions of putatively nitrate assimilating Bacteria were found in regions where the
bioavailability of organic nitrogen is presumably limited such as in the deep waters of the
subtropical regions and the mesopelagic (sub)tropical waters. Hence, at least a certain fraction
of the heterotrophic Bacteria in the deep ocean has the potential to compensate organic
nitrogen limitation by utilizing the readily available nitrate.

13
Introduction Heterotrophic Bacteria are utilizing a diverse array of organic compounds consisting
of carbon, nitrogen and phosphorus which are usually available in surface waters either via
phytoplankton extracellular release or via grazing mediating release of dissolved organic
matter (DOM) (Azam et al. 1983). In mesopelagic waters, organic P and N are preferentially
utilized over C (Benner, 2002). Consequently, organic matter in the deep sea is typically
depleted in metabolizable organic N and P (reviewed in Arístegui et al. 2009). However,
accompanied with a decline in organic N availability with depth in the oceanic water column,
the concentrations of inorganic N, essentially NO3- is increasing (Sarmiento and Gruber,
2006). Deep ocean NO3- concentrations range from 20-45 µM with phosphate concentrations
corresponding to the Redfield ratio of inorganic N:P of about 16 (Sarmiento and Gruber,
2006).
Nitrate is used as nitrogen source not only by marine phytoplankton (Zehr and Kudela,
2011) but can also be utilized by marine heterotrophic Bacteria (Kirchman, 2000). The
structural genes for nitrate reductase have been characterized in the Gammaproteobacterium
Klebsiella pneumoniae (Lin et al., 1993). The alpha subunit of the nitrate reductase (nasA)
protein, which contains the active site for nitrate reduction has been characterized in the
phototrophic Alphaproteobacterium Rhodobacter capsulatus (Moreno-Vivan et al., 1992;
Blasco et al., 1997). Analysis of currently available prokaryotic genome sequences suggests
that the nasA gene is present in a wide range of Bacteria (Richardson et al., 2001). Nitrate
assimilation genes of heterotrophic prokaryotes are distinct from those of autotrophs (Allen et
al., 2001). Heterotrophic NO3- assimilation has been confirmed to occur in several distinct
clades of Bacteria and in a variety of marine environments such as the South Atlantic Bight,
the Barents Sea and the North Pacific Gyre, where heterotrophic Bacteria can account for up

14
to 40% of the total NO3- uptake in surface waters (Kirchman, 2000; Middelburg and
Nieuwenhuize, 2000; Allen et al., 2001; Allen et al., 2002; Joint et al., 2002; Ovreas et al.,
2003).
From the surface to the deep euphotic zone, nitrate becomes an increasingly important
N source for heterotrophic Bacteria (Allen et al., 2005). Moreover, the distribution and
diversity of the nasA harboring bacterial community vary among epipelagic oceanic regions
with contrasting nutrient regimes and, in general, are strongly related to NO3- availability
(Allen et al., 2005). Polar regions and upwelling areas of the oceans are highly productive due
to high concentrations of labile organic and inorganic nutrients, the latter fueling primary
production (Sarmiento and Gruber, 2006). Labile organic material supplied by the primary
producers provides heterotrophic microorganisms with substrate within the epipelagic layers
of the ocean (Jiao et al., 2010). In these highly productive areas, particulate organic carbon
(POC) export rates can be up to 10 mol C m-² yr-² (Sarmiento and Gruber, 2006), while in the
deep waters of gyral and tropical regions refractory forms of organic material low in nitrogen
content dominate (Jiao et al., 2010) leading to a limitation of deep-water microbial
communities in bioavailable organic nitrogen. However, NO3- is available at copious
concentrations in the deep ocean (Sarmiento and Gruber, 2006) providing potentially an
alternative source of N for deep-water heterotrophic microbial communities.
The extent to which deep-water heterotrophic microbial communities are capable of
utilizing nitrate, however, has not been investigated yet. We hypothesized that the potential
for nitrate utilization increases in heterotrophic Bacteria with depth as the readily available
organic nitrogen becomes increasingly depleted. To test this hypothesis, we analyzed the
bacterial nasA gene abundance and phylogenetically characterized the nasA harboring
bacterial community along a transect in the Western Atlantic Ocean from 64°N to 50°S from
the surface to bathypelagic waters.

15
Materials and Methods Sampling site
During the GEOTRACES research cruises-1 to -3, 51 stations were sampled along a
latitudinal transect from 64°N to 50°S in the Atlantic Ocean between April and July 2010 on
board the R/V Pelagia (GEOTRACES-1 and -2) and in February-March 2011 on board the
R/V James Cook (GEOTRACES-3) (Fig. 1). Sampling was performed with a CTD
(conductivity-temperature-depth; Seabird, Bellevue, WA, USA) rosette sampler equipped
with 24 25-L Niskin bottles and sensors for chlorophyll fluorescence, turbidity,
photosynthetic active radiation and oxygen.
Samples for DNA (2-10 L depending on the depth) were collected at 6 to 8 depths per
station, filtered onto 0.2µm pore-size polycarbonate filters, flash-frozen in liquid N2 and kept
at -80°C until DNA extraction. Samples for abiotic parameters and for prokaryotic abundance
were taken at 24 depths per station. Five pelagic zones were sampled at different depths: the
epipelagic (0–200 m), the upper (200–500 m) and lower (500-1000 m) mesopelagic, the upper
(1000–2000 m) and lower (2000-6000 m) bathypelagic layer including abyssopelagic waters,
subsequently referred to as lower bathypelagic zone. Water samples were taken in six
different oceanographic provinces based on the classification scheme of ecological provinces
in the ocean (Longhurst, 1998): the North Atlantic Arctic province (ARCT; 70°N-55°N), the
North Atlantic Drift province (NADR; 55°N-40°N), the North Atlantic Gyral province (NAG)
comprising the North Atlantic Tropical and Subtropical Gyre province (40°N-12°N), the
Western Tropical Atlantic province (WTRA; 12°N-10°S), the South Atlantic Gyre Province
(SATL; 10°S-40°S) and the Subantarctic (SANT; 40°S-55°S) province (Fig. 1).
Inorganic nutrient concentration

16
The concentrations of NO3-, NO2
- and PO43- were determined on a TRAACS800
autoanalyzer system immediately after filtering the samples through 0.2 µm filters (Acrodisc,
Gelman Science). NO2- was measured after diazotation with sulfanilamide and N-(1-naphtyl)-
ethylene diammonium dichloride as the reddish-purple dye complex at 540 nm (Parsons et al.,
1984). NO3- was reduced in a copper cadmium coil to nitrite with imidazole as buffer and
subsequently measured as nitrite. Inorganic PO43- was measured via the molybdenum blue
complex at 880 nm (Murphy and Riley, 1962).
Prokaryotic abundance
For the enumeration of prokaryotic cells the standard procedure for flow cytometric
enumeration (Del Giorgio et al., 1996) was used with modification as described previously
(De Corte et al., 2012). Briefly, 2 mL samples were fixed with glutaraldehyde (0.5% final
concentration), flash-frozen in liquid N2 and kept at -80°C until analysis. Samples were
thawed to room temperature and 0.5 mL subsamples were stained with SYBR Green I
(Molecular Probes, Invitrogen, Carlsbad, CA, USA) in the dark for 10 min. The prokaryotes
were enumerated on a FACSAria II flow cytometer (Becton Dickinson, Fraclin Lakes, NJ,
USA) by their signature in a plot of green fluorescence versus side scatter.
DNA extraction
Filters for DNA were cut in half in the home lab. Half of the filter was again stored at
-80°C while the DNA of the other half was extracted with the Mobio UltraClean Soil DNA
isolation kit, following the manufacturer’s protocol.
PCR amplification for cloning and sequencing of nasA gene
The nasA gene was amplified via nested PCR following the protocol described by
Allen et al. (2001). The forward primer nas22 and the reverse primer nas1933 were used for

17
the outer PCR (Table 1). PCR cycles were carried out according to the following protocol: a
hot start at 94°C for 5 min was followed by 35 cycles consisting of a DNA denaturation step
at 94°C for 10 s, then by the annealing step at 55°C for 15 s and the extension step at 72°C for
1 min. Subsequently, a final extension step was conducted at 72°C for 7 min and a final hold
at 4°C. The reaction mixture for each well contained 1x Taq buffer, 0.2 mM dNTP’s, 3.5 mM
MgCl2, 1 mM of each primer, 1 U Taq Polymerase, 0.2 µM BSA, 2 µL of sample, made up to
25 µL with ultrapure sterile water (Roche). The forward primer nasA964 and the reverse
primer nasA1735 were used for the inner PCR amplification (Table 1). PCR cycles were
performed as follows: a hot start at 94°C for 3 min followed by 30 cycles of denaturation at
94°C for 10 s, annealing at 55°C for 30 s, and extension at 72°C for 1 min, and by a final
extension at 72°C for 7 min and hold at 4°C. The PCR reaction mixture was the same as for
the outer PCR amplification except the MgCl2 concentration was decreased to 2.5 mM and the
amount of sample was increased to 3 µL.
After the nested PCR, the amplicons of 18 samples from meso- (250 m), upper
bathypelagic (1250 m) and lower bathypelagic (>2000m) waters covering all oceanographic
provinces were cloned using the TOPO-TA cloning kit (Invitrogen) following the
manufacturer’s instructions. Four µL of fresh PCR product were gently mixed with 1 µL salt
solution and 1 µL of TOPO Vector and incubated on ice for 35 min. Thereafter, 2 µL of the
cold TOPO ligation reaction were added to a vial of One Shot Chemically Competent E. coli,
gently mixed and incubated on ice for 20 min. After transfer to a round floating rack, the vials
were heat shocked by placing the rack in a 42°C water bath for 30 s. Then, 250 µL of SOC
(Super Optimal broth with Catabolite repression) medium (~20°C) was added to the cells and
the tubes were shaken (200 rpm) at 37°C for 1 h. Three pre-warmed LB plates (containing
ampicillin sodium salt, 100 mg L-1) for each sample were treated with 40 µL X-gal. Different
amounts (75 µL, 100 µL and 125 µL) of SOC medium with E. coli cells were spread out in
18
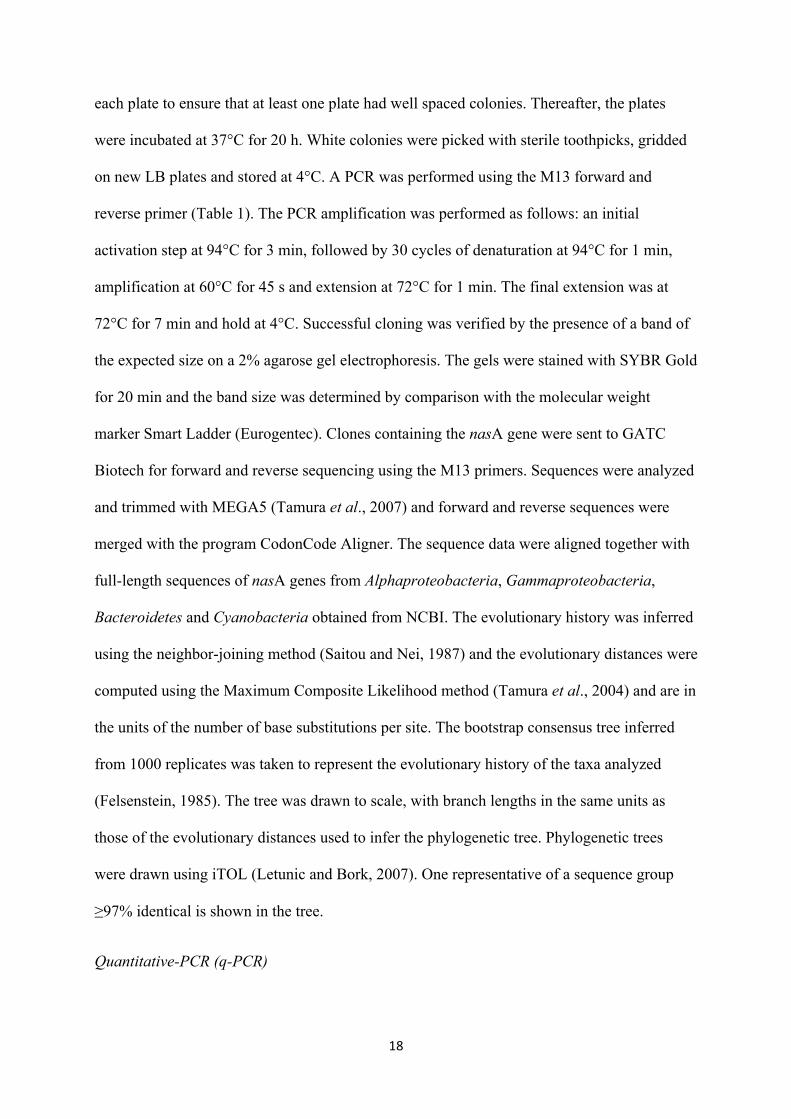
each plate to ensure that at least one plate had well spaced colonies. Thereafter, the plates
were incubated at 37°C for 20 h. White colonies were picked with sterile toothpicks, gridded
on new LB plates and stored at 4°C. A PCR was performed using the M13 forward and
reverse primer (Table 1). The PCR amplification was performed as follows: an initial
activation step at 94°C for 3 min, followed by 30 cycles of denaturation at 94°C for 1 min,
amplification at 60°C for 45 s and extension at 72°C for 1 min. The final extension was at
72°C for 7 min and hold at 4°C. Successful cloning was verified by the presence of a band of
the expected size on a 2% agarose gel electrophoresis. The gels were stained with SYBR Gold
for 20 min and the band size was determined by comparison with the molecular weight
marker Smart Ladder (Eurogentec). Clones containing the nasA gene were sent to GATC
Biotech for forward and reverse sequencing using the M13 primers. Sequences were analyzed
and trimmed with MEGA5 (Tamura et al., 2007) and forward and reverse sequences were
merged with the program CodonCode Aligner. The sequence data were aligned together with
full-length sequences of nasA genes from Alphaproteobacteria, Gammaproteobacteria,
Bacteroidetes and Cyanobacteria obtained from NCBI. The evolutionary history was inferred
using the neighbor-joining method (Saitou and Nei, 1987) and the evolutionary distances were
computed using the Maximum Composite Likelihood method (Tamura et al., 2004) and are in
the units of the number of base substitutions per site. The bootstrap consensus tree inferred
from 1000 replicates was taken to represent the evolutionary history of the taxa analyzed
(Felsenstein, 1985). The tree was drawn to scale, with branch lengths in the same units as
those of the evolutionary distances used to infer the phylogenetic tree. Phylogenetic trees
were drawn using iTOL (Letunic and Bork, 2007). One representative of a sequence group
≥97% identical is shown in the tree.
Quantitative-PCR (q-PCR)
19
All q-PCR analyses were performed on a Light Cycler 480 SW 1.5. The amplification
products from different clones containing the amplified fragment were run on an agarose gel
(1%) and stained with SYBR Gold (Invitrogen) for 20 min. The bands were isolated from the
gel and purified using a PCR Gel Extraction MiniKit (5-PRIME). Thereafter, the DNA
concentration of the PCR product was quantified on a Nanodrop 2000 spectrophotometer and
the amount of PCR product needed for a specific nasA gene abundance per µL was estimated
according to fragment length and concentration of the PCR product. A standard dilution series
was made by diluting the PCR product with Tris buffer (10mM, pH=8.0) and subsequently
used as internal standard for quantification. The standard series from 107 to 102, blanks and
samples were added in triplicates to each 96-well qPCR plate (Bio-Rad) and closed with
optical tape (Bio-Rad). The reaction mixture for each sample contained 1x Mastermix
(LightCycler 480 SYBR Green I Master, Roche), 0.5 mM nasA964 and 0.5 mM nasA1735
primers (Table 1) and filled up to 10 µL with ultrapure sterile water (Roche). Denaturation
was conducted in the first step at 95°C for 10 min, followed by a touchdown PCR over 50
amplification cycles each consisting of denaturation at 95°C for 5 s, annealing for 30 s,
extension at 72°C for 45 s and measurement at 80°C for 3 s. During the first 5 cycles, the
annealing temperature was decreased by 1°C each cycle starting at 65ºC until it reached 60°C.
The specificity of the q-PCR reaction was tested on a 2% agarose gel and with the melting
curve analysis (65°C - 95°C). PCR efficiency was on average 93±14% and the mean
correlation coefficient 0.967±0.017 (n=5).
The recA gene abundance was also measured by q-PCR (Light Cycler 480 SW 1.5) to
relate bacterial nasA to recA gene abundance. The abundance of recA genes served as a
proxy for bacterial abundance as commonly, Bacteria harbor one recA gene per genome
(Miller and Kokjohn, 1990). Q-PCR was performed on all samples in triplicate using the
primers recAF and recAR (Table 1). The initial denaturation step at 95ºC for 10 min was
20
followed by 50 cycles consisting on an initial denaturation at 95ºC for 5 s, followed by an
annealing step at 53ºC for 5 s, extension at 72ºC for 15 s and a plate read at 74ºC for 3 s. An
internal standard for quantification was generated from a PCR amplified recA from an
environmental sample. The concentration of DNA in the purified PCR product was measured
with a Nanodrop 2000, and a dilution series was prepared as described above for the nasA
gene. All wells contained 1x Mastermix (LightCycler 480 SYBRGreen I Master, Roche), 0.5
mM of each primer, 1µL of sample and filled up to 10µL with ultrapure sterile water (Roche).
The specificity of the PCR amplification was checked on a gel after a melting curve analysis
(65ºC-95ºC). PCR efficiencies and correlation coefficients were on average 83±9% and
0.963±0.029, respectively (n=15).
Statistical analysis
Statistical analysis on the variations of abiotic and biotic factors between depth layers
and oceanographic provinces was done by two-way ANOVA and the Holm-Sidak method and
ANOVA on Ranks following Dunn’s test using SigmaPlot 12. The results were considered
statistically significant if P<0.05. A principal component analysis (PCA) was conducted to
test for differences in the phylogenetic composition of nitrate assimilating microbial
communities between different depth layers and oceanographic provinces using UniFrac
software and the Unifrac significance level (Lozupone et al., 2006). The distance-based
multivariate analysis for a linear model using forward selection (DISTML forward) was
applied to test the relationship between nasA gene abundance and biotic and abiotic
environmental parameters (Anderson et al., 2004). Single correlation analysis was conducted
to test for the relationship between bacterial abundance assessed by flow cytometry and the
recA gene abundance.

21
Results Physical and chemical variables of the water column
In the epipelagic layer (0-200 m depth), mean water temperature in the different
oceanographic provinces increased from the northernmost province (ARCT) (mean ± SD:
5.47 ± 0.81°C) to the WTRA province (24.14 ± 5.68°C) and decreased to 11.77 ± 4.83°C in
the southernmost province (SANT) (Suppl. Table 1, Fig. 2A). In the upper and lower
mesopelagic waters, mean water temperature increased from the ARCT province (4.97 ±
0.90°C and 4.01 ± 0.30°C, respectively) to the NAG province (17.30 ± 1.88°C and 10.65 ±
3.50°C, respectively). The WTRA province showed lower temperature in the upper
mesopelagic waters (10.11 ± 2.07°C) than the SATL province (14.10 ± 2.12°C) (t-test, P <
0.001). The lower mesopelagic waters of the SANT province were colder (3.25 ± 0.63°C)
than the lower mesopelagic waters of the ARCT province (Mann-Whitney Rank Sum Test P <
0.05). In the upper bathypelagic waters, temperature increased from the ARCT province (3.53
± 0.21°C) to the NAG province (4.77 ± 0.92°C) (Mann-Whitney Rank Sum Test, P < 0.001)
and then decreased to 2.61 ± 0.37°C in the SANT province (Mann-Whitney Rank Sum Test, P
< 0.001).
For the lower bathypelagic waters, no differences in the water temperature were
detectable (ANOVA on Ranks, P > 0.05) among the different oceanic provinces except the
lower bathypelagic waters of the SANT province were significantly colder than in the other
provinces (ANOVA on Ranks, P < 0.05). All oceanographic provinces showed a significant
temperature stratification between depth layers (two way ANOVA, P < 0.05) except the water
column of the ARCT and the SANT province.
Salinity was not significantly different between the depth layers of the ARCT province
(ANOVA on Ranks, P > 0.05). However, the upper mesopelagic layer exhibited a higher
salinity than the lower bathypelagic layer (ANOVA on Ranks, P < 0.05) (Suppl. Table 1, Fig.

22
2B). In the NADR province, the salinity was significantly lower in the lower bathypelagic
zone than in the epipelagic and upper mesopelagic waters (ANOVA on Ranks, P < 0.05). In
the NADR, salinity ranged from 34.91 ± 0.06 to 34.97 ± 0.12 at depth from 1000 m to 4727 m
representing North Atlantic Deep Water (NADW). In the WTRA province, salinity of the
lower and upper bathypelagic water masses decreased to 34.88 ± 0.14 and 34.88 ± 0.08,
respectively, indicating mixing of Antarctic Bottom Water (AABW) with NADW. Generally,
the SANT province was characterized by low salinity values (34.29 ± 0.12 and 34.27 ± 0.02
in the lower and upper mesopelagic waters, respectively), indicating the presence of Antarctic
Intermediate Water (AAIW) (Fig. 2B).
Nitrate concentrations were generally lower in the epipelagic zone of the oligotrophic
subtropical and tropical provinces (0.76 ± 1.22 µmol kg-1, 1.9 ± 1.78 µmol kg-1 and 6.50 ±
8.19 µmol kg-1 in the NAG, SATL and WTRA, respectively) than in the higher latitude
provinces (Suppl Table 1, Fig. 2C). While nitrate concentrations in the ARCT increased from
the epipelagic layer from 13.74 ± 1.11 µmol kg-1 to 16.61 ± 0.19 µmol kg-1 in the upper
bathypelagic zone, nitrate increased over the same depth range in the NAG and WTRA from
0.76 ± 1.22 µmol kg-1 to 19.88 ± 2.90 µmol kg-1 and 6.50 ± 8.19 µmol kg-1 to 24.64 ± 5.01
µmol kg-1, respectively, with a maximum of 33.68 ± 1.35 µmol kg-1 in the lower mesopelagic
zone of the WTRA (Suppl. Table 1, Fig. 2C). Similar to the ARCT, the SANT province
exhibited a weak stratification in nitrate concentrations ranging from 11.93 ± 7.51 µmol kg-1
in the epipelagic to 32.86 ± 1.15 µmol kg-1 in the upper bathypelagic layer (Suppl. Table 1,
Fig. 2C).
Prokaryotic abundance as determined by flow cytometry
In the epipelagic layer, prokaryotic abundance was higher in the SANT (4.94 ± 2.86 x
105 cells mL-1) and ARCT province (3.18 ± 1.17 x10⁵ cells mL-1) than in the oligotrophic
NAG province (1.77 ± 0.93 x10⁵ cells mL-1) (ANOVA on Ranks, P < 0.05) (Suppl. Table 1,
23
Fig. 3A). The SANT and ARCT province exhibited a higher prokaryotic abundance than the
NAG province (ANOVA on Ranks, P < 0.05) in all depth layers. Prokaryotic abundance
decreased with depth by two orders of magnitude from highest mean abundances in the
epipelagic zone to lowest prokaryotic abundance in the lower bathypelagic zone of the NAG
province (8.37 ± 1.97 x10³ cells mL-1) (Fig. 3A).
recA and nasA gene abundance determined by qPCR
Prokaryotic abundance determined by flow cytometry was tightly related to recA gene
abundance determined by q-PCR (y = 1592.2x0.52; R2 = 0.68, Fig. 4). Within the individual
depth layers, however, and in contrast to prokaryotic abundance, recA gene abundance was
not significantly different among the oceanographic provinces (two way ANOVA, P > 0.05)
except in the epipelagic layer (Fig. 3B). In the epipelagic layer of the NAG province, the recA
gene abundance was significantly higher than in the NADR and the ARCT province (two way
ANOVA, P < 0.05) and the recA gene abundance in the SATL was significantly higher than
the NADR province (two way ANOVA, P < 0.05). Overall, the mean recA gene abundance
was highest in the epipelagic layer of the SATL province (2.17 x10⁴ ± 0.00 recA mL-
1).(Suppl. Table 1, Fig. 3B). Similar to prokaryotic abundance determined by flow cytometry,
recA gene abundance decreased by two orders of magnitude from the epipelagic to the
bathypelagic zone throughout the Atlantic (Fig. 3B).
The nasA gene in the epipelagic layer was more abundant in the SANT (3.32 ± 1.93 x
102 nasA mL-1) than in the SATL province (1.21 x 10² ± 0.00 nasA mL-1) and the NADR
province (0.46 ± 0.09 x 10² nasA mL-1) (two way ANOVA, P < 0.05) (Suppl. Table 1, Fig.
3C). In the upper mesopelagic layer, the nasA gene abundance in the SATL province was
significantly higher than in the NAG, the NADR, the ARCT and the WTRA province (two
way ANOVA, P < 0.05). Within the lower bathypelagic layer, nasA gene abundance of the

24
ARCT province was significantly higher than in the other oceanic provinces (two way
ANOVA, P < 0.05). In the ARCT province, nasA gene abundance was highest in the
epipelagic zone (1.11 ± 0.71 x 10² nasA mL-1), decreasing towards the upper bathypelagic
zone (0.19 ± 0.15 x 10² nasA mL-1) and increasing again in the lower bathypelagic zone
(0.42 ± 0.45 x 10² nasA mL-1) (Fig. 3C).
The relative contribution of putatively nitrate assimilating Bacteria to the total
Bacteria, expressed as the ratio of nasA to recA gene abundance, was low in the epipelagic
zone (0.013 ± 0.004) and increased with depth to a maximum of 0.178 ± 0.230 in lower
bathypelagic waters (Fig. 3D). The lowest nasA:recA ratios (0.005 ± 0.007) were found in the
epipelagic waters of the NAG province (Fig. 5), due to the high abundance of recA genes
there (1.81 ± 1.36 x10⁴ recA mL-1). In epipelagic waters, the highest nasA:recA ratio was
found in the SANT province (0.033 ± 0.010, Fig. 5) associated with high nasA gene
abundance (3.32 ± 1.93 x 10² nasA mL-1) and also high recA gene abundance (1.27 ± 0.28
x104 recA mL-1). The highest nasA:recA gene abundance ratio obtained in the Atlantic ocean
(0.513 ± 0.636) was found in the lower bathypelagic waters of the SANT province (Fig 5). In
the ARCT province, the nasA:recA gene abundance ratio ranged from 0.013 ± 0.006 in the
epipelagic to 0.032 ± 0.024 in the upper bathypelagic (Fig. 3D, Fig. 5). The NADR province
also exhibited low nasA:recA gene abundance ratios throughout the water column, except in
the lower bathypelagic waters where this ratio increased to 0.200 ± 0.246 (Fig. 3D, Fig. 5).
The nasA:recA gene abundance ratio in the meso- and bathypelagic waters of the NAG,
WTRA and SATL province ranged from 0.066 ± 0.033 to 0.202 ± 0.140, with highest ratios
in the lower mesopelagic waters of the SATL province (Fig. 3D).
Phylogenetic community composition of nasA harboring Bacteria
The phylogeny of the nasA gene containing Bacteria was assessed from three depth
layers (mesopelagic: 250 m, upper bathypelagic: 1250 – 1750 m and lower bathypelagic:

25
2500 – 4500 m) at 6 stations (see Fig. 1) covering all oceanographic provinces. In total, 413
clones were sequenced resulting in 81 operational taxonomic units (OTUs). Most of the nasA
harboring OTUs (54 OTUs) were affiliated to the Gammaproteobacteria, 16 OTUs to
Bacteroidetes, one OTU to Aphaproteobacteria and 10 remained unknown (Fig. 6). The most
abundant OTU (76 clones) was a bathypelagic (1250 – 4500 m) Gammaproteobacterium
which occurred in all provinces except the ARCT. The second most abundant OTU (52
clones) was affiliated to Bacteroidetes and was present in all depth layers of the SANT
province. Most nasA harboring OTUs (86.3%) were confined to specific oceanographic
provinces, while the remaining 13.7% (all from the class Gammaproteobacteria) were
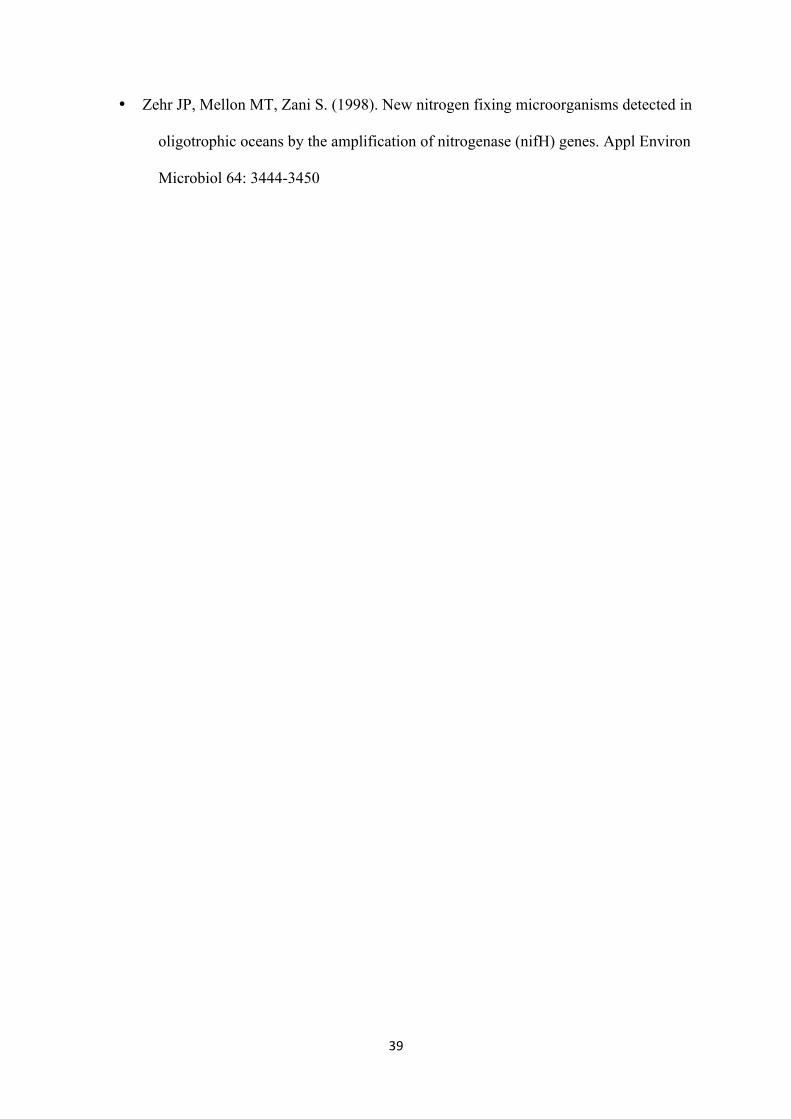
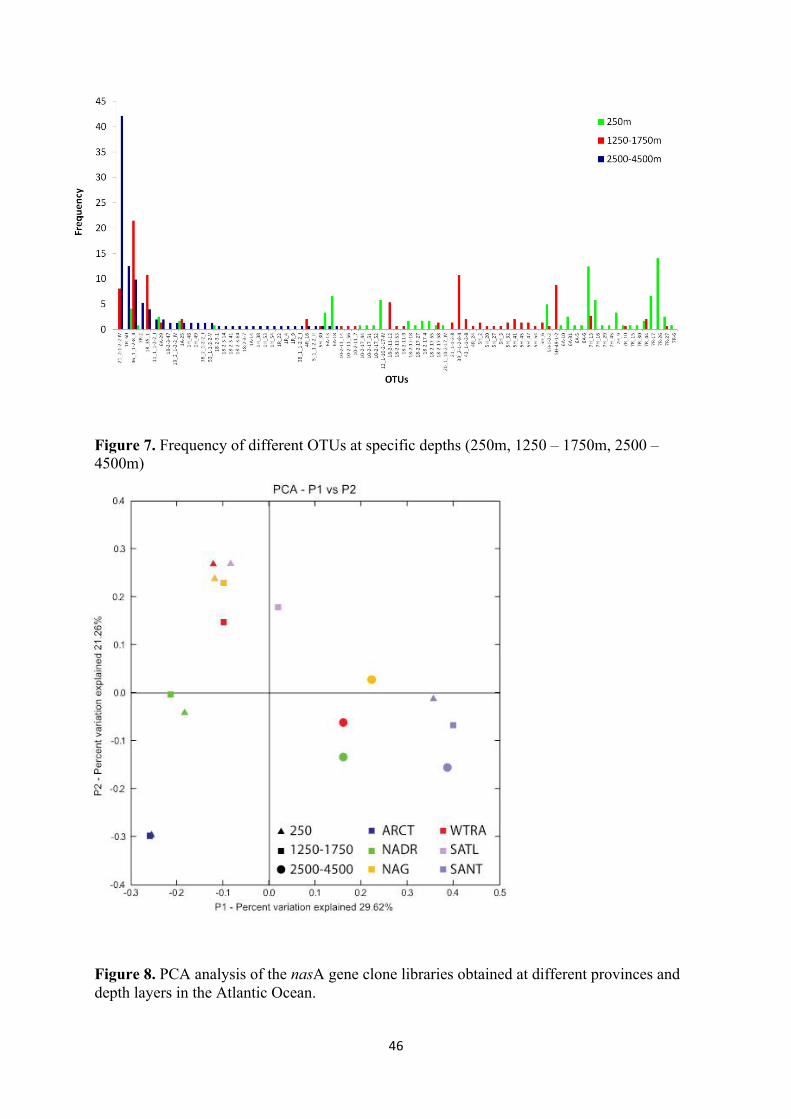
distributed over more than one oceanographic province. Also, most OTUs (64) occurred in
one specific depth layer, among them 22 OTUs were confined to the mesopelagic layer, 21
OTUs to the upper bathypelagic and 21 OTUs to the lower bathypelagic (Fig. 7). Only 17
OTUs (or 13.77%) occurred in more than one depth layer (Fig. 7). The nasA harboring
bacterial community composition of the ARCT province was not stratified and differed from
that of the other provinces (p < 0.001, Unifrac level of significance) (Fig. 8). Also, the nasA
containing bacterial community of the SANT province showed only a weak stratification with
depth (p < 0.1 between meso- and upper-bathypelagic, Unifrac level of significance). In
contrast, the NADR, the NAG, the WTRA and the SATL province exhibited a strong
stratification of the nasA harboring Bacteria with depth (p <0.001, Unifrac level of
significance). The nasA harboring bacterial community present in the deep waters of the gyral
and tropical provinces were compositionally similar (p > 0.05, Unifrac level of significance)
(Fig. 8).
Discussion Prokaryotic abundance determined by flow cytometry versus recA gene abundance

26
Generally, the prokaryotic abundance decreased from epipelagic to lower bathypelagic
waters in all oceanographic provinces (Fig. 3A), in accordance with previous studies from the
North and South Atlantic (Reinthaler et al., 2006; Schattenhofer et al., 2009; De Corte et al.,
2012). The recA gene encodes the recombinase A protein and has a unique role in DNA
damage repair as synaptase in homologous recombination and operating abilities. It is
maintained across species and genus lines and is universally present in Bacteria (Miller and
Kokjohn, 1990). The fact that the recA gene, in contrast to the 16SrRNA gene, has remained
a single-copy gene in Bacteria makes it a suitable proxy of bacterial abundance (Lin et al.,
2006). The recA gene also occurs in Archaea but was not targeted with the primers used in
this study (Table 1), as determined by cloning and sequencing of the recA gene (data not
shown).
Bacterial abundance determined by q-PCR quantification of the recA gene showed
similar patterns as prokaryotic abundance determined with flow cytometry (compare Fig. 3A
and 3B), but was one order of magnitude lower (Fig. 4). This discrepancy in the absolute
abundance obtained with the two methods is probably mainly associated to the efficiency of
the DNA extraction, which has been reported to be as low as 14.9 ± 16.0% (Mean ± S.D.) for
the commercial kit used in this study (Mumy and Findlay, 2004), close to our one order of
magnitude difference between flow cytometric cell counts and the recA q-PCR approach.
Additionally, the presence of a certain, albeit variable proportion of archaeal cells not targeted
with the recA primers, might explain some of the differences between the two methods.
Determining the abundance of Euryarchaeota and Crenarchaeota with catalyzed reporter
deposition fluorescence in situ hybridization (CARD-FISH) in the North Western Atlantic
revealed that Crenarchaeota and Euryarchaeota together can contribute more than 50% to the
total picoplankton abundance in deep waters (Herndl et al., 2005; Teira et al., 2006).
Regardless of the differences in absolute numbers, the correlation between prokaryotic
abundance determined via flow cytometry and the abundance of recA genes determined via

27
qPCR (y = 1592.2 x0.52; R2 = 0.6754) indicates that the use of recA gene abundance is a
suitable proxy for total bacterial abundance in the water column (Fig. 4).
Distribution of nitrate assimilating Bacteria and nitrate concentrations in the Atlantic Ocean
The nasA to recA ratio increased with depth (Fig. 3D). Allen et al. (2005) reported an
8-fold increase in nasA-containing Bacteria in the epipelagic Norwegian coastal waters and
the Barents Sea (5 m compared to 80 m depth). In the present study, the lowest percentage of
nitrate assimilating Bacteria was found in epipelagic waters (<200 m depth) (0 – 2%) as
compared to meso- and bathypelagic waters (Fig. 3C, Fig. 5). Also low contributions of nasA
gene containing Bacteria to bacterial abundance (estimated by recA gene abundance) were
found throughout the water column of the ARCT province (1 – 3%) (Fig. 5). In the epipelagic
waters, low nasA:recA gene ratios correspond to low NO3- concentrations (6.815 ± 0.316
µmol kg-1) (DISTML test, P = 0.044, cumulative r2 = 0.5807, Table 2, Fig. 2C), while high
nasA:recA ratios were measured in deep waters where NO3- concentrations were high (> 9
µmol kg-1 below 200 m depth). Despite the high NO3- concentrations in the deep waters
throughout the Atlantic, the contribution of the nasA containing bacterial community to the
total bacterial community varies across oceanographic provinces and depth layers. In the
lower bathypelagic waters of the SANT province, 51% of the total bacterial community
contain the nasA gene and therefore, could be assigned to putatively nitrate assimilating
Bacteria. Further ‘hotspots’ of nitrate assimilating Bacteria are found in the lower
bathypelagic waters of the NADR province and the lower mesopelagic waters of the SATL
province (Fig. 3C), where nitrate assimilating Bacteria contribute on average 20% to the total
bacterial community (Fig. 5). A surprisingly low percentage of nasA containing Bacteria was
found in the lower bathypelagic waters of the NAG and the WTRA provinces (0.1% and
0.09%, respectively, Fig. 3C), although nitrate concentrations are high (19.6 ± 1.64 µmol kg-1

28
and 21.9 ± 4.02 µmol kg-1, respectively). However, in contrast to epipelagic waters, the
abundance of deep-water nitrate assimilating Bacteria does not correlate to NO3-
concentrations, but relates to leucine incorporation in the upper bathypelagic waters, bacterial
abundance and latitude (Fig. 3A, B) in the lower bathypelagic waters (DISTML test, P=0.002,
0.001, 0.01, and cumulative r2=0.2346,0.419,0.468, respectively) (Table 3). This suggests that
the heterotrophic bacterial community in the deep waters of the Atlantic might fuel its
biomass production with organic carbon-rich material and its N-requirements at least partly
by nitrate.
Nitrate assimilating bacterial community linked to primary production and organic matter
export
The cruise track followed the water masses forming the Deep Western Boundary
Current (DWBC) and the major water masses of the thermohaline circulation system. The
temperature and salinity distribution across the western Atlantic Ocean indicated deep-water
formation in the northern and the southernmost latitudes (Fig. 2 A, B). The first four stations
in the ARCT province were characterized by the presence of Denmark Strait Overflow Water
(DSOW), which further south mixed with Labrador Sea Water (LSW) and Iceland Scotland
Overflow Water (ISOW) to form the DWBC at the Charlie Gibbs Fracture Zone. The DSOW,
the LSW and the ISOW together form the North Atlantic Deep Water (NADW) in the NADR
province (Smethie et al., 2000). Deep water formation has also been determined in the SANT
province as Antarctic Bottom Water (AABW) and Antarctic Intermediate Water (AAIW).
The North Atlantic Ocean, the Antarctic Convergence and equatorial upwelling regions are
regions of high annual net primary production (NPP), particulate (POM) and dissolved
organic matter (DOM) export (Longhurst et al., 1995; Antoine et al., 1996; Palmer and
Totterdell, 2001). The produced organic matter is categorized in three forms: labile, semi-
labile and refractory organic matter (Jiao et al. 2010). Labile DOM is taken up by

29
heterotrophic microorganisms within hours or days, while semi-labile DOM persists for
months to years (Bauer et al., 1992; Kirchman et al., 2001) and accounts for the largest part of
the DOM pool that is exported, while refractory DOM is the most persistent form of organic
matter and can be stored for millennia in the ocean’s interior (Hopkinson et al., 2005). In
contrast to labile and semi-labile DOM that can provide nitrogen for heterotrophic Bacteria,
refractory DOM is low in N content, as nitrogen and phosphorus are preferentially
remineralized relative to carbon (Hopkinson et al., 1996). Remineralization of organic
nitrogen leads to high concentrations of nitrate potentially representing a readily available N
source in the deep ocean.
It has been shown that microorganisms from the bathypelagic realm have evolved
metabolic strategies as an adaptation to the low reactivity of deep sea DOM (Eichinger et al.,
2006). In this context, utilization of inorganic nitrogen in the oligotrophic deep sea may be an
adaptation to the low amount of organic N in the deep-sea.
The ARCT province exhibits low nasA:recA ratios even in deep waters probably due
to its high labile and semi-labile organic matter content compared to the deep water regions
towards the south (Palmer and Totterdell, 2001). By the time organic material is transported
to the NADR province in the NADW, it is degraded to a more refractory form by microbial
activity (Jiao et al., 2010) accompanied with increasing concentrations of nitrate (Fig. 2C)
leading to a higher potential of heterotrophic Bacteria to assimilate nitrate from 40°N
southwards as indicated by higher nasA gene abundance and a higher nasA:recA gene ratio in
the NADR than in the ARCT province (Fig. 3C, D). The Southern Ocean also is an area of
high primary production with seasonal phytoplankton blooms and high organic matter export
rates (Palmer and Totterdell, 2001). The nasA-containing community of the SANT province
was distinctly different from that of the other oceanic provinces and weaker stratified. In
contrast to the ARCT province, the SANT province exhibited a high relative abundance of
putatively nitrate assimilating Bacteria (Fig. 5). This might be because deep-water formation

30
in the Southern Ocean occurs mainly in the Weddell and Ross Seas (Talley, 1999), which is
further south than the SANT province. Water mass and organic matter transport from the
Southern Ocean to the northern SANT province where samples were taken (≈40°S), is
estimated to occur within 50 years (England, 1995). Organic matter arriving from the
Southern Ocean is refractory and the nitrate assimilating bacterial community present there
might be adapted to use NO3- as nitrogen source, in a similar way as the community of the
deep waters of the NADR province (Fig. 5).
Composition of the nasA harboring bacterial community
NasA genes are widespread among different phylogenetic groups in diverse
environments (Allen et al., 2001). The majority of nitrate assimilating Bacteria found in the
South Atlantic Bight, the Barents Sea and the North Pacific Gyre were affiliated to
Gammaproteobacteria (Allen et al., 2001), similar this study. Most OTUs were restricted in
their distribution to specific oceanic provinces and/or specific depth layers suggesting a
highly adapted nasA harboring bacterial community (Figs. 6, 7). The most abundant nasA
harboring OTU (a Gammaproteobacteria) however, was found in all oceanic provinces and
depth layers, except the ARCT and the upper 250 m layer. Another highly abundant nasA
harboring OTU from the Bacteroidetes clade was confined to the SANT province but was
present in all depth layers.
Regionally distinct nasA containing communities have been reported previously using
a fingerprinting technique, although differences with depth (5 m versus 80 m) could not be
deciphered (Allen et al., 2005). In contrast to the former study, the PCA analysis of the clone
libraries indicates a nasA harboring community in the ARCT province distinctly different
from all the other provinces but lacking depth stratification (Fig. 8). The lack of stratification
of putatively nitrate assimilating communities in the ARCT province might be related to the

31
deep-water formation in this province and the corresponding weak stratification of the water
column (Fig. 2A,B). The nasA containing bacterial community of the SANT province also
displayed weak stratification supporting the notion that the extent of stratification of the
bacterial community is linked to the physical structure of the water column. In contrast, the
strong stratification of the water column of the NADR, NAG, WTRA and the SATL
provinces was reflected in the stratification of the nasA harboring bacterial communities (Fig.
8). The deep-water nasA harboring bacterial communities of these provinces from 40°N to
40°S were similar to each other (Fig. 8).
Conclusion
Taken together, the composition and abundance of the putatively nitrate assimilating
heterotrophic bacterial community vary among different oceanic provinces and depth layers in
the Atlantic Ocean, linked to water mass transport, epipelagic primary production and, as a
consequence of that, organic matter export. The nitrate assimilating community composition
from the Arctic province differs significantly from other oceanographic provinces as it is not
stratified with depth. The communities of the other oceanographic provinces exhibit a depth-
related distribution. Collectively, our results point to the utilization of nitrate as a nitrogen
source in deep-water heterotrophic Bacteria throughout the Atlantic Ocean, where up to 51%
of the bacterial community can potentially assimilate nitrate and thereby, circumvent the
limitation in organic nitrogen sources in the deep ocean.
Acknowledgments I want to thank Gerhard J Herndl for giving me the opportunity to write my diploma
thesis at the Department of Marine Biology at the University of Vienna and Eva Sintes for
instructing and supervising me. Thank you. Also, I’d like to thank all the people working in
the department for helping me and for having a great time. Shiptime for this work was

32
provided by the Dutch Science Foundation (ALW-NWO project Geotraces). Laboratory work
was supported by the ESF MOCA project and the Austrian Science Fund (FWF) projects
I486-B09, Z194-B17 and P23234-B11 all to GJH.
References • Allen AE, Booth MG, Frischer ME, Verity PG, Zehr JP, Zani S. (2001). Diversity and
detection of nitrate assimilation genes in marine Bacteria. Appl Environ Microbiol
67: 5343-5348
• Allen AE, Booth MG, Verity PG, Frischer ME. (2005). Influence of nitrate availability
on the distribution and abundance of heterotrophic Bacterial nitrate assimilation
genes in the Barents Sea during summer. Aquat Microb Ecol 39: 247-255
• Allen AE, Howard-Jones MH, Booth MG, Frischer ME, Verity PG, Bronk DA,
Sanderson MP. (2002). Importance of heterotrophic Bacterial assimilation of
ammonium and nitrate in the Barents Sea during summer. J Mar Syst 38: 93-108.
• Anderson MJ, Ford RB, Feary DA, Honeywill C. (2004). Quantitative measures of
sedimentation in an estuarine system and its relationship with intertidal soft-
sediment infauna. Mar Ecol Prog Ser 272:33-48
• Antoine D, André JM, Morel A. (1996). Oceanic primary production: 2. Estimation at
global scale from satellite (Coastal Zone Color Scanner) chlorophyll. Global
Biogeochem Cycles 10: 57-69
• Aristegui J, Gasol JM, Duarte CM, Herndl GJ. (2009). Microbial oceanography of the
dark ocean's pelagic realm. Limnol Oceanogr 54: 1501-1529

33
• Azam F, Fenchel T, Field JG, Gray JS, Meyerreil LA, Thingstad F. (1983). The
ecological role of water-column microbes in the sea. Mar Ecol Prog Ser 10: 257-
263
• Bauer JE, Williams PM, Druffel ERM. (1992). 14C activity of dissolved organic
carbon fractions in the north-central Pacific and Sargasso Sea. Nature 357: 667-670
• Benner R. (2002). Chemical composition and reactivity, p. 59-90. In D. A. Hansell
and C. A. Carlson [eds.], Biogeochemistry of marine dissolved organic matter.
Elsevier Science.
• Blasco R, Castillo F, Matinez-Luque M. (1997) The assimilatory nitrate reductase
from the phototrophic bacterium, Rhodobacter capsulatus E1F1, is a flavoprotein.
FEBS Lett 414: 45 49
• Casey JR, Lomas MW, Mandecki J, Walker DE. (2007). Prochlorococcus contributes
to new production in the Sargasso Sea deep chlorophyll maximum. Geophys Res
Lett 34: L10604
• De Corte D, Sintes E, Yokokawa T, Reinthaler T, Herndl GJ. (2012). Links between
viruses and prokaryotes throughout the water column along a North Atlantik
latitudinal transect. ISME J 12: 1751-7362
• Del Giorgio P, Bird DF, Prairie YT, Planas D. (1996). Flow cytometric determination
of Bacterial abundance in lake plankton with the green nucleic acid stain SYTO 13.
Limnol Oceanogr 41: 783-789.
• Eichinger M, Poggiale JC, Van Wambeke F, Lefévre D, Sempéré R. (2006).
Modelling DOC assimilation and Bacterial growth efficiency in biodegradation
34
experiments: a case study in the Northeast Atlantic Ocean. Aquat Microb Ecol 43:
139-151
• England MH. (1995). The Age of Water and Ventialation Timescales in a Global
Ocean Model. J Phys Oceanogr 25: 2756-2777
• Felsenstein J. (1985). Confidence-limits on phylogenies – an approach using the
bootstrap. Evolution 39: 783-791
• Francis CA, Beman JM, Kuypers MMM. (2007). New processes and players in the
nitrogen cycle: the microbial ecology of anaerobic and archaeal ammonia oxidation.
ISME J 1: 19-27
• Herndl GJ, Reinthaler T, Teira E, van Aken H, Veth C, Pernthaler A, Pernthaler J.
(2005). Contribution of Archaea to Total Prokaryotic Production in the Deep
Atlantic Ocean. Appl Environ Microbiol 71: 2303-2309
• Hopkinson CS, Fry B, Nolin AL. (1996). Stoichiometry of dissolved organic matter
dynamics on the continental shelf of the northeastern U.S.A. Cont Shelf Res 17:
473-489
• Hopkinson CS, Vallino JJ. (2005). Efficient export of carbon to the deep ocean
through dissolved organic matter. Nature 433: 142-145
• Howarth RW. (1988). Nutrient limitation of net primary production in marine
ecosystems. Annu Rev Ecol Syst 19: 89-110
• Jiao N, Herndl GJ, Hansell DA, Benner R, Kattner G, Wilhelm SW, Kirchman DL,
Weinbauer MG, Luo T, Chen F, Azam F. (2010). Microbial production of
35
recalcitrant dissolved organic matter: long-term carbon storage in the global ocean.
Nature Rev Microbiol 8: 593-599
• Joint I, Henriksen P, Fonnes GA, Bourne D, Thingstad TF, Riemann B. (2002).
Competition for inorganic nutrients between phytoplankton and bacterioplankton in
nutrient manipulated mesocosms. Aquat Microb Ecol 29:145-159
• Kirchman DL, Meon B, Ducklow HW, Carlson CA, Hansell DA, Steward GF. (2001).
Glucose fluxes and concentrations of dissolved combined neutral sugars
(polysaccharides) in the Ross Sea and Polar Front Zone, Antarctica. Deep-Sea Res.
II 48: 4179-4197
• Kirchman DL. (2000). Uptake and regeneration of inorganic nutrients by marine
heterotrophic Bacteria. In: Kirchman DL (ed) Microbial ecology of the oceans. John
Wiley & Sons, New York, p 261-288
• Könneke M, Bernherd A, De la Torre J, Walker C. (2005). Isolation of an autotrophic
ammonia-oxidizing marine archaeon. Nature 437: 543-546
• Letunic I, and Bork P. (2007). Interactive tTree Of Live (iTOL): an online tool for
phylogenetic tree display and annotation. Bioinformatics 23: 127-128
• Lin Z, Kong H, Nei M, Ma H. (2006). Origins and evolution of the recA/RAD51 gene
family: Evidence for ancient gene duplication and endosymbiotic gene transfer.
Proc Natl Acad Sci USA 103: 10328-10333
• Longhurst A, Sathyendranath S, Platt T, Caverhill C. (1995). An estimate of global
primary production in the ocean from satellite radiometer data. J Plankton Res 17:
1245-1271

36
• Longhurst AR. (1998). Ecological Geography of the Sea. Academic Press: San Diego,
CA, USA
• Lozupone C, Hamady M, and Knight R. (2006). UniFrac – an online tool for
comparing microbial community diversity in a phylogenetic context. BMC
Bioinformatics 7: 371. doi:10.1186/1471-2105-7-371
• Middelburg JJ, and Nieuwenhuize J. (2000). Nitrogen uptake by heterotrophic
Bacteria and phytoplankton in the nitrate-rich Thames estuary. Mar Ecol Prog Ser
203: 13-21
• Miller RV, and Kokjohn TA. (1990). General Microbiology of recA: Environmental
and Evolutionary Significance. Annu Rev Microbiol 44: 365-94
• Moore LR, Rocap G, Chisholm SW. (1998). Physiology and molecular phylogeny of
coexisting Prochlorococcus ecotypes. Nature 67: 393-464
• Moreno-Vivan C, Soler G, Castillo F. (1992). Arginine catabolism in the phototrophic
bacterium Rhodobacter capsulatus E1F1. Eur J Biochem 204: 531-537
• Murphy J, Riley JP. (1962). A modified single solution method for the determination
of phosphate in natural waters. Anal Chim Acta, 27: 31-36
• Mumy KL, and Findlay RH. (2004). Convenient determination of DNA extraction
efficiency using an external DNA recovery standard and quantitative-competitive
PCR. Journal Microbiol Meth 57: 259-268
• Ovreas L, Bourne D, Sandaa RA, Casamayor EO, Benlloch S, Goddard V, Smerdon
G, Heldal M, Thingstad TF. (2003). Response of Bacterial and viral communities to
nutrient manipulations in seawater mesocosms. Aquat Microb Ecol 31: 109-121

37
• Parsons T, Maita Y, Lalli C. (1984). A manual of chemical biological methods for
seawater analysis. Pergamon Press, Oxford, UK 173pp
• Palmer JR and Totterdell IJ. (2001). Production and export in a global ocean
ecosystem model. Deep-Sea Res 48: 1169- 1198
• Reinthaler T, van Aken H, Veth C, Arístegui J, Robinson C, Williams PjleB, Lebaron
P, Herndl GJ. (2006). Prokaryotic respiration and production in the meso- and
bathypelagic realm of the eastern and western North Atlantic basin. Limnol
Oceanogr 51: 1262-1273
• Richardson DJ, Berks BC, Russell DA, Spiro S, Taylor CJ. (2001). Functional,
biochemical and genetic diversity of prokaryotic nitrate reductases. Cell Mol Life
Sci 58: 165-178
• Saitou N, and Nei M. (1987). The neighbour-joining method – a new method for
reconstructiong phylogenetic trees. Mol Biol Evol 4: 406-425
• Sarmiento JL and Gruber N. (2006). In: Sarmiento JL and Gruber N. (ed) Ocean
Biogeochemical Dynamics. Princeton, New Jersey
• Schattenhofer M, Fuchs BM, Amann R, Zubkov MV, Tarran GA, Pernthaler J. (2009).
Latitudinal distribution of prokaryotic picoplankton populations in the Atlantic
Ocean. Environ Microbiol 11: 2078-2093
• Schlesinger WH. (1991). Biogeochemistry: An Analysis of Global Change. Academic
Press

38
• Smethie WM, Fine RA, Putzka A, Jones EP. (2000). Tracing the flow of North
Atlantic Deep Water using chlorofluorocarbons. Journal of Geophysical Research
105C6: 14,297-14,323
• Talley LD. (1999). Some aspects of ocean heat transport by the shallow, intermediate
and deep overturning circulations. AGU Geophysical Monograph 112
• Tamura K, Nei M, Kumar S. (2004). Prospects for inferring very large phylogenies by
using the neighbour-joining method. Proc Natl Acad Sci USA 101: 11030-11035
• Tamura K, Dudley J, Nei M, Kumar S. (2007). MEGA4: Molecular Evolutionary
Genetics Analysis (MEGA) software version 4.0. Mol Biol Evol 24: 1596-1599
• Teira E, Lebaron P, van Aken H, Herndl GJ. (2006). Distribution and Activity of
Bacteria and Archaea in the Deep Water Masses of the North Atlantic. Limnol
Oceanogr 51: 2131-2144
• Van Aken HM. GEOTRACES, the hydrography of the Western Atlantic Ocean,
cruises 64PE319, 64PE321, and 74JC057
• Vitousek PM and Howarth RW. (1991). Nitrogen limitation on land and in sea: How
can it occure? Biogeochem 13: 87-115
• Zehr JP and Kudela RM. (2011). Nitrogen Cycle of the Open Ocean: From Genes to
Ecosystems. Annu Rev Mar Sci 3: 197-225
• Zehr JP and Paerl HW. (2008). In: Microbial ecology of the oceans Chapter 13:
Molecular ecological aspects of nitrogen fixation in the marine environment
(Kirchman DL). John Wiley & Sons. DOI: 10.1002/9780470281840.ch13
39
• Zehr JP, Mellon MT, Zani S. (1998). New nitrogen fixing microorganisms detected in
oligotrophic oceans by the amplification of nitrogenase (nifH) genes. Appl Environ
Microbiol 64: 3444-3450

40
Tables and Figures
Table 1. Primers used to amplify the nasA gene and the recA gene fragments for q-PCR and
cloning and sequencing.
Method Primer Sequence (5' to 3') Annealing temp. Reference
PCR nas22 TGYCCNTAYTGYGGNGT 55°C Allen et al. 2001 nas1933 CARTGCATNGGNAYRAA 55°C Allen et al. 2001 nasA964 CARCCNAAYGCNATGGG 55°C Allen et al. 2001 nasA1735 ATNGTRTGCCAYTGRTC 55°C Allen et al. 2001
Cloning M13 forward GTAAAACGACGGCCAG 60°C Invitrogen
M13 reverse CAGGAAACAGCTATGAC 60°C Invitrogen
qPCR nasA964 CARCCNAAYGCNATGGG 65°C Allen et al. 2001 nasA1735 ATNGTRTGCCAYTGRTC 65°C Allen et al. 2001
recAF TGTGCNTTTATWGATGCNGAGCATGC 53°C Holmes et al. 2004
recAR CCCATGTCNCCTTCKATTTCNGCTTT 53°C Holmes et al. 2004
Table 2. Multivariate multiple regression analysis with forward selection (DISTML forward) performed on biotic and abiotic parameters to explain the nasA gene abundance in depth layers through the water column.
Depth layers Variable pseudo-F P r2 cumulative Epipelagic (n=26) Latitude 24.3839 0.001 0.504 0.504 NO3 4.2091 0.044 0.0767 0.5807 RecA 7.4068 0.015 0.1056 0.6863 Upper Meso (n=46) RecA 19.5865 0.001 0.308 0.308 Latitude 14.6352 0.001 0.1757 0.4837 Temp 8.8675 0.002 0.09 0.5737 Lower Meso (n=27) NO3 12.3157 0.003 0.33 0.33 RecA 5.6681 0.03 0.128 0.458 Latitude 5.8169 0.029 0.1094 0.5674 bac 8.5997 0.01 0.1216 0.689 PP 5.1394 0.025 0.0611 0.7502 Temp 4.9633 0.043 0.0501 0.8081 Upper Bathy (n=50) PP 14.7098 0.002 0.2346 0.2346 Lower Bathy (n=76) bac 53.4415 0.001 0.4193 0.4193 Latitude 6.7751 0.01 0.0493 0.4687

41
Figure 1. Cruise track and sampling stations (indicated by dots) occupied during the GEOTRACES cruises 1, 2 and 3 in April/July 2010 and February/March 2011. Dashed horizontal lines denote borders between oceanic provinces as defined by Longhurst (1998). Encircled dots indicate stations where samples were taken for establishing clone libraries.
ARCT
NADR
NAG
WTRA
SATL
SANT

42
Figure 2. (A) Temperature (in °C), (B) salinity and (C) nitrate concentrations (µmol kg-1)
throughout the western Atlantic Ocean from 64°N to 45°S from the epi- to the lower
bathypelagic waters. Dashed lines indicate boundaries between oceanographic provinces:
North Atlantic Arctic province (ARCT), North Atlantic Drift province (NADR), North
Atlantic Gyral province (NAG), Western Tropical Atlantic province (WTRA), South Atlantic
Gyral Province (SATL) and the Subantarctic province (SANT) (Longhurst, 1998).
ARCT NADR NAG WTRA SATL SANT
A
ARCT NADR NAG WTRA SATL SANT
B
ARCT NADR NAG WTRA SATL SANT
C

43
Figure 3. Latitudinal and depth distribution of (A) prokaryotic abundance (log cells mL-1), (B) recA gene abundance (log gene abundance mL-1), (C) nasA gene abundance (log gene abundance mL-1), and (D) nasA:recA gene ratio along the transect in the western Atlantic Ocean.
ARCT NADR NAG WTRA SATL SANT
A
ARCT NADR NAG WTRA SATL SANT
B
ARCT NADR NAG WTRA SATL SANT
C
ARCT NADR NAG WTRA SATL SANT
D

44
Figure 4. Correlation between recA gene abundance determined by q-PCR and prokaryotic abundance determined by flow cytometry throughout the Atlantic.
Figure 5. Average ± standard deviation of nasA:recA gene ratio at specific depth layers (epipelagic, upper mesopelagic, lower mesopelagic, upper bathypelagic and lower bathypelagic) in the different oceanic provinces (ARCT, NADR, NAG, WTRA, SATL and SANT) of the western Atlantic .
ARCT
0,0 0,1 0,2 0,3 0,4 0,5 0,6
lower bathype lagic
upper bathype lagic
lower mesope lagic
upper mesope lagic
e pipe lagic
NADR
0,0 0,1 0,2 0,3 0,4 0,5 0,6
NAG
0,0 0,1 0,2 0,3 0,4 0,5 0,6
WTRA
0,0 0,1 0,2 0,3 0,4 0,5 0,6
SATL
0,0 0,1 0,2 0,3 0,4 0,5 0,6
SANT
0,0 0,1 0,2 0,3 0,4 0,50,6

45
Figure 6. Neighbor-Joining phylogenetic tree from the nasA gene sequences. One representative of sequence group ≥ 97% identical is shown.
46
Figure 7. Frequency of different OTUs at specific depths (250m, 1250 – 1750m, 2500 – 4500m)
Figure 8. PCA analysis of the nasA gene clone libraries obtained at different provinces and depth layers in the Atlantic Ocean.

47
Supplementary Table 1. Average (av) and standard deviation (sd) of abiotic and biotic
parameters of the different oceanic provinces and depth layers. Abbreviations: PA,
prokaryotic abundance
EPI Temp [°C]
Salinity
PA [N x 104mL-1]
NO3
[µmol kg-1] nasA
[gene mL-1] recA
[gene mL-1] nasA/recA
ARCT av 5.47 34.96 31.8 13.74 66.1 10219.23 0.013
sd 0.81 0.11 11.7 1.11 66.05 14598.31 0.006
NADR av 11.39 35.4 24.2 7.11 45.53 4562.22 0.01
sd 3.73 0.55 13.4 4.66 8.7 458.83 0
NAG av 22.58 36.42 17.7 0.76 53.6 18055.32 0.005
sd 4.05 0.9 9.26 1.22 62.04 13586.31 0.007
WTRA av 24.14 36.01 25.6 6.5 50.34 10246.71 0.007
sd 5.68 0.68 13.7 8.19 21.91 6620.88 0.004
SATL av 21.12 36.17 34.6 1.9 120.53 21688.89 0.01
sd 3.77 0.57 13.1 1.78 0 0 0
SANT av 11.77 34.56 49.4E 11.93 331.76 12673.33 0.033
sd 4.83 0.49 28.6E 7.51 192.95 2798.91 0.01
average 16.08 35.59 30.6 6.99 111.31 12907.62 0.013
sd 1.65 0.26 6.8 3.2 71.26 6451.52 0.004
Upper Meso Temp [°C]
Salinity
PA [N x 104mL-1]
NO3
[µmol kg-1] nasA
[gene mL-1] recA
[gene mL-1] nasA/recA
ARCT av 4.97 34.98 14.4 15.95 33.11 2223.02 0.022
sd 0.9 0.08 6.94 0.79 17.76 1754.76 0.016
NADR av 8.91 35.26 8.23 14.75 16.16 1036.01 0.025
sd 4.02 0.43 2.8 4.56 9.46 550.55 0.026
NAG av 17.3 36.41 5.19 6.9 39.7 1169.51 0.067
sd 1.88 0.32 1.51 5.42 33.73 1714.14 0.047
WTRA av 10.11 34.97 7.82 27.2 54.7 793.08 0.098
sd 2.07 0.26 9.4 4.96 48.39 701.89 0.095
SATL av 14.1 35.41 11.9 8.57 105.19 1306.24 0.102
sd 2.12 0.3 3.42 5.61 58.85 813.9 0.072
SANT av 5.28 34.27 16.8 24.74 68.48 2266.67 0.033
sd 2.24 0.2 4.23 4.51 26.44 1031.47 0.01
average 10.11 35.22 10.7 16.35 52.89 1465.75 0.058
sd 1.01 0.12 2.9 1.78 18.62 520.12 0.033

48
Continuation of Supplementary Table 1.
Lower Meso Temp [°C]
Salinity
PA [N x 104mL-1]
NO3
[µmol kg-1] nasA
[gene mL-1] recA
[gene mL-1] nasA/recA
ARCT av 4.01 34.91 8.68 16.51 50.63 1378.23 0.028
sd 0.30 0.03 2.66 0.18 69.95 1481.92 0.015
NADR av 5.64 34.97 4.00 18.36 9.28 389.65 0.025
sd 2.04 0.10 1.77 1.82 7.10 216.10 0.007
NAG av 10.65 35.41 2.77 21.07 19.10 169.21 0.133
sd 3.50 0.50 1.21 8.10 22.11 218.49 0.041
WTRA av 5.90 34.59 3.50 33.68 11.61 196.49 0.066
sd 1.22 0.10 1.24 1.35 7.44 148.23 0.033
SATL av 6.90 34.52 5.98 24.33 62.33 411.02 0.202
sd 2.89 0.29 2.00 6.44 13.21 189.08 0.140
SANT av 3.25 34.29 9.87 31.27 27.92 1038.80 0.035
sd 0.63 0.12 2.49 3.06 11.13 476.82 0.024
average 6.06 34.78 5.8 24.20 30.14 597.23 0.081
sd 1.27 0.17 0.6 3.12 24.20 516.31 0.049
Upper Bathy Temp [°C]
Salinity
PA [N x 104mL-1]
NO3
[µmol kg-1] nasA
[gene mL-1] recA
[gene mL-1] nasA/recA
ARCT av 3.53 34.92 5.67 16.61 39.23 1691.20 0.032
sd 0.21 0.02 2.17 0.19 43.71 1333.95 0.024
NADR av 3.86 34.93 2.55 17.11 7.39 215.27 0.035
sd 0.44 0.03 1.08 0.31 4.52 63.69 0.019
NAG av 4.77 35.01 1.35 19.88 10.86 113.74 0.134
sd 0.92 0.06 0.440 2.90 8.17 142.57 0.103
WTRA av 4.35 34.88 1.86E 24.64 14.84 134.55 0.108
sd 0.41 0.14 0.723E 5.01 12.98 82.91 0.063
SATL av 3.33 34.63 2.83 29.16 18.57 173.31 0.136
sd 0.38 0.21 1.41 4.10 9.74 94.14 0.104
SANT av 2.61 34.58 6.03 32.86 20.51 293.45 0.119
sd 0.37 0.13 1.23 1.15 25.38 173.32 0.144
average 3.74 34.82 3.4 23.38 18.57 436.92 0.094
sd 0.24 0.07 0.6 2.03 14.73 500.77 0.049
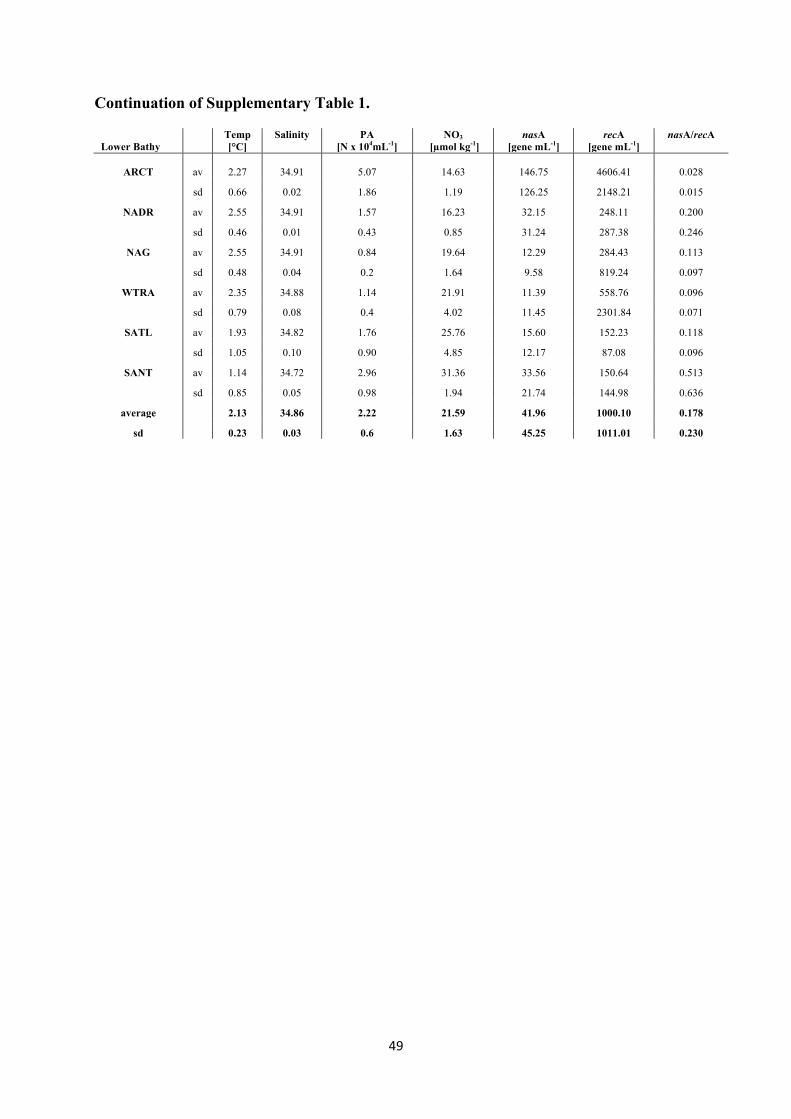
49
Continuation of Supplementary Table 1.
Lower Bathy
Temp [°C]
Salinity
PA [N x 104mL-1]
NO3
[µmol kg-1] nasA
[gene mL-1] recA
[gene mL-1] nasA/recA
ARCT av 2.27 34.91 5.07 14.63 146.75 4606.41 0.028
sd 0.66 0.02 1.86 1.19 126.25 2148.21 0.015
NADR av 2.55 34.91 1.57 16.23 32.15 248.11 0.200
sd 0.46 0.01 0.43 0.85 31.24 287.38 0.246
NAG av 2.55 34.91 0.84 19.64 12.29 284.43 0.113
sd 0.48 0.04 0.2 1.64 9.58 819.24 0.097
WTRA av 2.35 34.88 1.14 21.91 11.39 558.76 0.096
sd 0.79 0.08 0.4 4.02 11.45 2301.84 0.071
SATL av 1.93 34.82 1.76 25.76 15.60 152.23 0.118
sd 1.05 0.10 0.90 4.85 12.17 87.08 0.096
SANT av 1.14 34.72 2.96 31.36 33.56 150.64 0.513
sd 0.85 0.05 0.98 1.94 21.74 144.98 0.636
average 2.13 34.86 2.22 21.59 41.96 1000.10 0.178
sd 0.23 0.03 0.6 1.63 45.25 1011.01 0.230

50
Curriculum Vitae Paul Alan Steiner
Education
2013 Diploma thesis at the Department of Marine Biology, University of
Vienna;
Diploma title: Abundance and diversity of nitrate assimilating bacteria
in the deep waters of the Atlantic Ocean
2006-2013 Diploma study of Biology/Ecology with specification in marine
biology at the University of Vienna
2004-2005 Civil Service at the AKH Linz (Hospital pharmacy)
2000-2004 Bundes Oberstufen Realgymnasium (BORG) Linz Honauerstraße 24
1996-2000 Akademisches Gymnasium, Linz
1992-1996 Primary School, VS9, Linz
Publications
‘Temporal dynamics in the free-living bacterial community
composition in the coastal North Sea’
Eva Sintes, Harry Witte, Karen Stodderegger, Paul
Steiner, Gerhard J. Herndl (2012). FEMS Microbiology Ecology.
DOI: 10.1111/1574-6941.12003
Marine and biological field courses

51
2012 MEDEA II cruise, on board of the RV Pelagia (Texel/The Netherlands
– Iceland)
2011 Practical course on marine biology, Texel/The Netherlands
2011 Practical course for protection of sea turtles (Caretta caretta) in the
Mediterranean Sea (Fethiye, Turkey)
2011 Marine biological field course on the mediterranean fauna and flora;
Centre for Marine Research (Rovinj, Croatia)
2011 Tropical excursion at the field station La Gamba (Costa Rica)
2010 Marine biological field course (Piran, Slovenia)
2010 Biology and systematics of neotropical amphibians (French Guyana)
2009 Practical course on terrestrial ecology of Siberia (from the steppe to the
tundra)
Pesonal skills
Languages German (first language), English (fluent)
Computer skills MS Office, Sigma Plot, Ocean Data View (ODV)
Additional work experience
Rock/Funk/HipHop band – Drums
Background music group - Percussion
Mango farm (Australia) – Worker

52
Apple farm (New Zealand) – Worker
Office ‘Ziviltechnik Geologie’ (Linz, Austria) – Trainee
Steel industry VOEST (Linz, Austria) – Trainee
Interests
Music, art