digital market overview: kenya - frost & sullivan...mobile payment services such as m-pesa are...
TRANSCRIPT

50 Years of Growth, Innovation and Leadership
Digital Market Overview: Kenya
A Frost & Sullivan White Paper
www.frost.com
Digital Market Overview: Kenya
2 All rights reserved © 2018 Frost & Sullivan
Overview & Methodology
To understand and help inform UK companies about emerging digital market opportunities in a number of key countries under the UK’s Prosperity Fund, the FCO (Foreign and Commonwealth Office) commissioned Frost & Sullivan to provide summary digital market research and analysis across three growing digital markets; telecommunications, digital services and cybersecurity.
The UK Prosperity Fund is an innovative instrument directing £1.2 billion of UK ODA and non-ODA investment to tackle barriers to economic growth, targeting middle-income developing countries. The Fund aims to remove barriers to economic growth in order to reduce poverty – the Fund’s primary purpose. It supports delivery of the United Nations’ Sustainable Development Goals (SDG), particularly SDG 8, to “Promote inclusive and sustainable growth, employment and decent work for all.” Removing barriers and helping harness the potential of developing markets, will also boost global and UK prosperity through increased investment and trade. It is in achieving this latter objective that Non-Official Development Assistance funding is used alongside Prosperity Fund ODA programmes, and in support of the government’s post-EU trade policy ambition and wider government policies.
.Frost & Sullivan MethodologyTo complete the project, Frost & Sullivan engaged analysts from its ICT group based in offices in Indonesia,
Brazil and South Africa. Four main activities were completed during the process. These were:
• Internal Data Audit: Frost & Sullivan leveraged information from its ongoing research programme of the ICT
sector and digital markets in the target countries.
• In-depth Secondary Research: Frost & Sullivan searched all open sources and published documents, including
company information, official government-released information and statistics, international organisations,
industry-recognised associations, as well as national and international press.
• Conducting Primary Research: Frost & Sullivan leveraged its existing networks to speak with the major
stakeholders and industry participants within the country.
• Forecasting the Market Size: Frost & Sullivan constructed a propriety and bespoke data model that captured
all of the research and analysis to forecast the market size across sectors. The methodology followed a
simple and transparent approach and used statistics from government-published sources as well as internal
Frost & Sullivan data.
Frost & Sullivan
TA B L E O F C O N T E N T S
Executive Summary ....................................................................................... 4
Key Findings ..................................................................................................... 4
Market Forecast ................................................................................................ 5
PESTLE Analysis ............................................................................................. 8
Drivers & Restraints ......................................................................................... 10
SWOT Analysis ................................................................................................ 13
Telecommunications ...................................................................................... 14
Market Overview .............................................................................................. 14
Market Size and Forecast .................................................................................. 17
Opportunities for UK firms .............................................................................. 18
Digital Services .............................................................................................. 19
Market Overview .............................................................................................. 19
Market Size and Forecast .................................................................................. 20
Opportunities for UK Firms ............................................................................ 24
Cybersecurity Services ................................................................................... 25
Market Overview .............................................................................................. 25
Market Size and Forecast .................................................................................. 26
Opportunities for UK Firms ............................................................................ 29
Digital Market Overview: Kenya
4 All rights reserved © 2018 Frost & Sullivan
EXECUTIVE SUMMARY
Key Findings
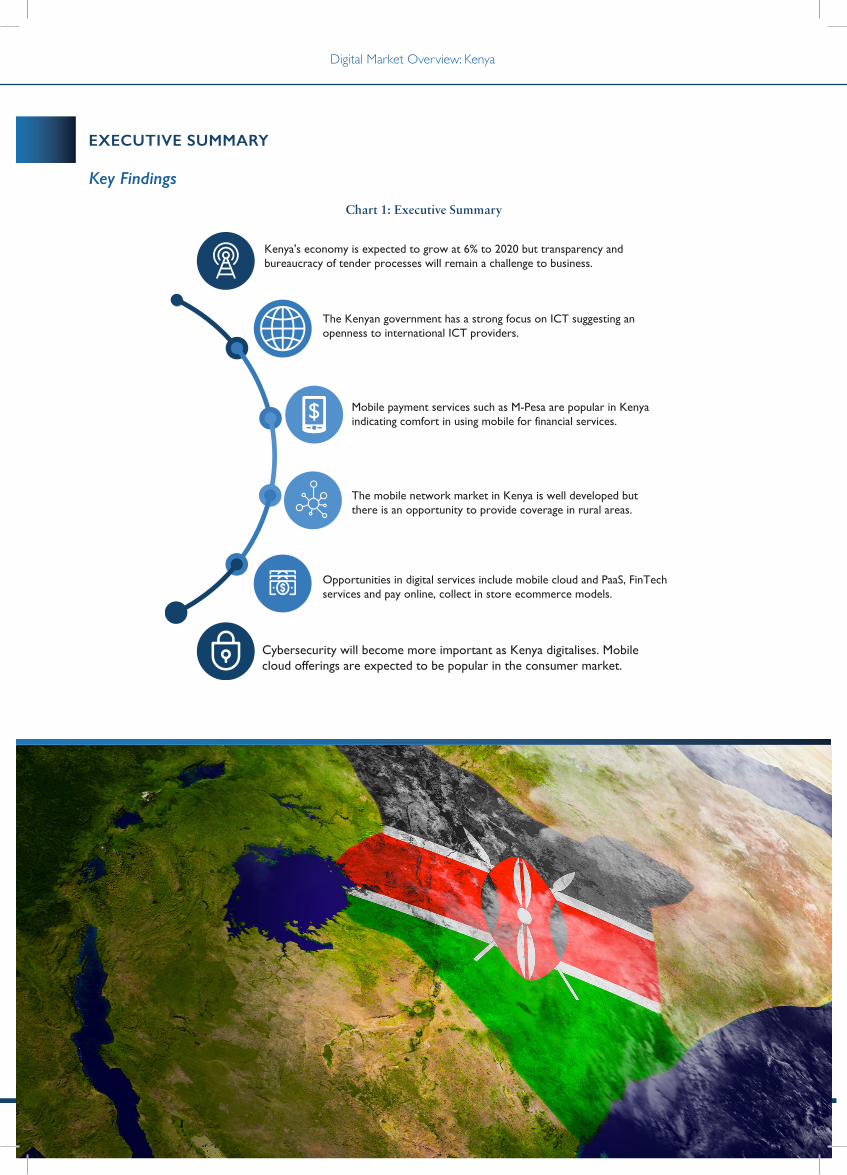
Chart 1: Executive Summary
Kenya's economy is expected to grow at 6% to 2020 but transparency and bureaucracy of tender processes will remain a challenge to business.
The Kenyan government has a strong focus on ICT suggesting an openness to international ICT providers.
Mobile payment services such as M-Pesa are popular in Kenya indicating comfort in using mobile for financial services.
The mobile network market in Kenya is well developed but there is an opportunity to provide coverage in rural areas.
Opportunities in digital services include mobile cloud and PaaS, FinTech services and pay online, collect in store ecommerce models.
Cybersecurity will become more important as Kenya digitalises. Mobile cloud offerings are expected to be popular in the consumer market.
Digital Market Overview: Kenya
5All rights reserved © 2018 Frost & Sullivan
Market Forecast
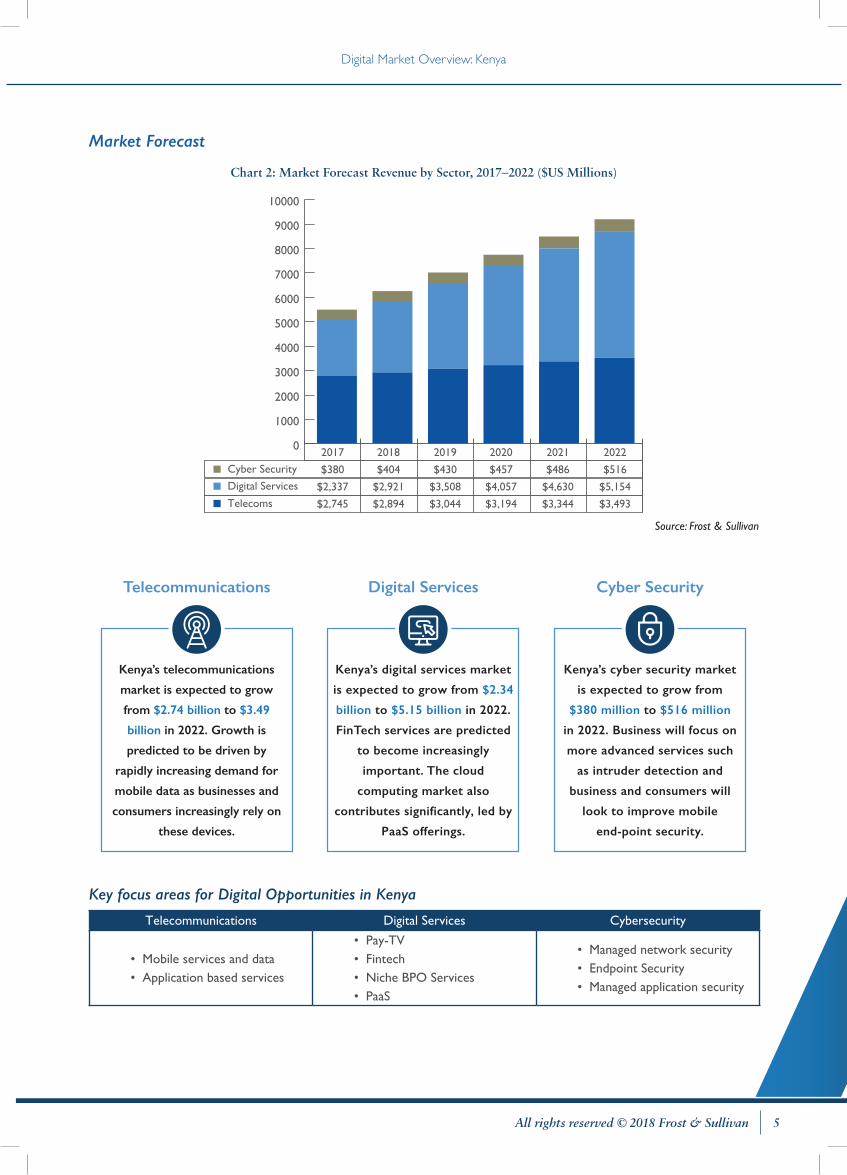
Chart 2: Market Forecast Revenue by Sector, 2017–2022 ($US Millions)
2017 2018 2019 2020 2021 2022
Cyber Security
Digital Services
Telecoms
$380 $404 $430 $457 $486 $516
$2,337 $2,921 $3,508 $4,057 $4,630 $5,154
$2,745 $2,894 $3,044 $3,194 $3,344 $3,493
0
1000
2000
3000
4000
5000
6000
7000
8000
9000
10000
Source: Frost & Sullivan
Cyber Security
Kenya’s cyber security market
is expected to grow from
$380 million to $516 million
in 2022. Business will focus on
more advanced services such
as intruder detection and
business and consumers will
look to improve mobile
end-point security.
Digital Services
Kenya’s digital services market
is expected to grow from $2.34
billion to $5.15 billion in 2022.
FinTech services are predicted
to become increasingly
important. The cloud
computing market also
contributes significantly, led by
PaaS offerings.
Telecommunications
Kenya’s telecommunications
market is expected to grow
from $2.74 billion to $3.49
billion in 2022. Growth is
predicted to be driven by
rapidly increasing demand for
mobile data as businesses and
consumers increasingly rely on
these devices.
Key focus areas for Digital Opportunities in Kenya
Telecommunications Digital Services Cybersecurity
• Mobile services and data• Application based services
• Pay-TV• Fintech• Niche BPO Services• PaaS
• Managed network security• Endpoint Security• Managed application security
Digital Market Overview: Kenya
6 All rights reserved © 2018 Frost & Sullivan
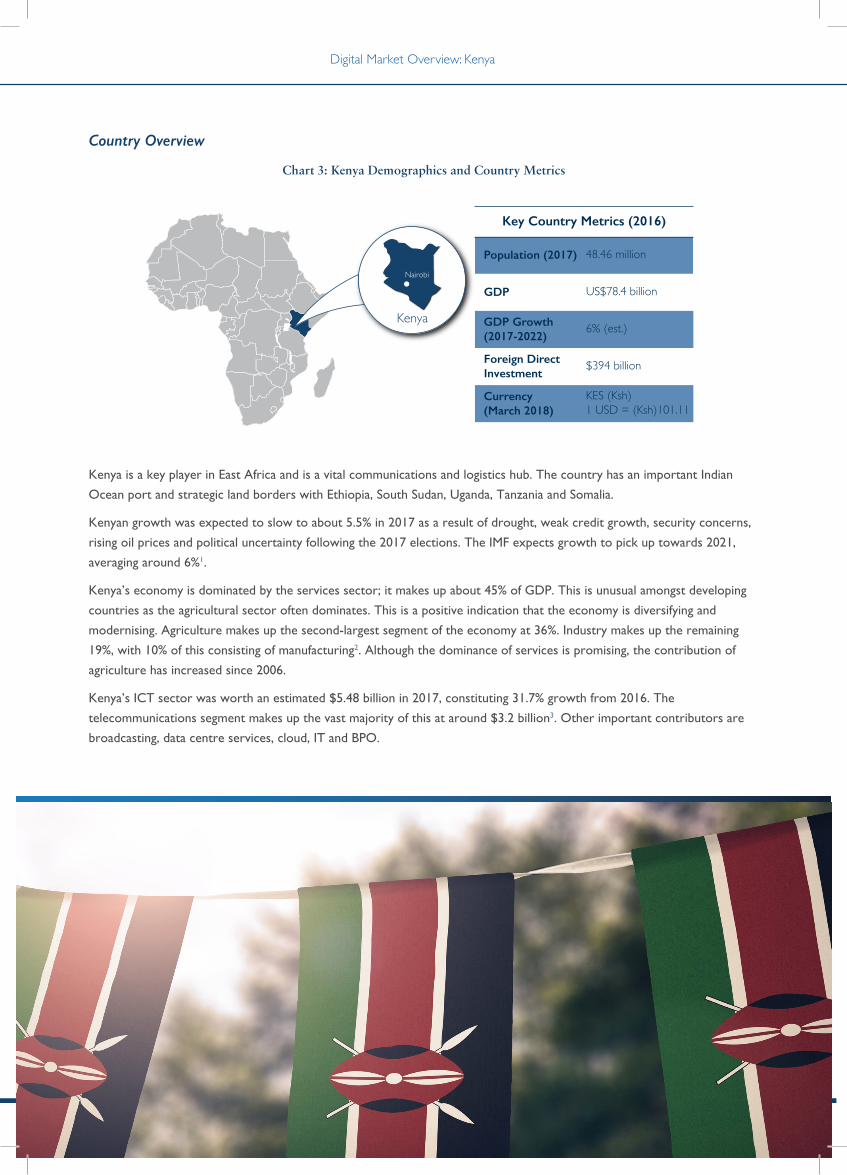
Country Overview
Chart 3: Kenya Demographics and Country Metrics
Kenya
Nairobi
Population (2017) 48.46 million
GDP US$78.4 billion
GDP Growth(2017-2022)
6% (est.)
Foreign DirectInvestment
$394 billion
Key Country Metrics (2016)
Currency(March 2018)
KES (Ksh)1 USD = (Ksh)101.11
Kenya is a key player in East Africa and is a vital communications and logistics hub. The country has an important Indian
Ocean port and strategic land borders with Ethiopia, South Sudan, Uganda, Tanzania and Somalia.
Kenyan growth was expected to slow to about 5.5% in 2017 as a result of drought, weak credit growth, security concerns,
rising oil prices and political uncertainty following the 2017 elections. The IMF expects growth to pick up towards 2021,
averaging around 6%1.
Kenya’s economy is dominated by the services sector; it makes up about 45% of GDP. This is unusual amongst developing
countries as the agricultural sector often dominates. This is a positive indication that the economy is diversifying and
modernising. Agriculture makes up the second-largest segment of the economy at 36%. Industry makes up the remaining
19%, with 10% of this consisting of manufacturing2. Although the dominance of services is promising, the contribution of
agriculture has increased since 2006.
Kenya’s ICT sector was worth an estimated $5.48 billion in 2017, constituting 31.7% growth from 2016. The
telecommunications segment makes up the vast majority of this at around $3.2 billion3. Other important contributors are
broadcasting, data centre services, cloud, IT and BPO.
Digital Market Overview: Kenya
7All rights reserved © 2018 Frost & Sullivan
Economic Perspective
Kenya’s combination of relatively stable governance, strategic location and young and innovative population has made it an
attractive destination for multinational companies. Several notable firms such as Oracle, IBM, Microsoft, Cisco, HP and SAP
have offices in Nairobi, and some have based their entire African operations from these offices.
FDI fell dramatically from $1.4 billion in 2015 to $394 million in 2017. This can largely be attributed to political uncertainty
and rising oil prices4.
Kenya’s population of 48 million people is particularly young with an average age of 19 years. The population is regarded as
being particularly innovative, especially with respect to developing and adapting technological solutions to combat specific
regional problems. The success of mobile transfer service, M-Pesa, in the region is testament to this. Kenya’s population is
growing at 1.69% annually5, suggesting a fast-growing consumer and enterprise market.
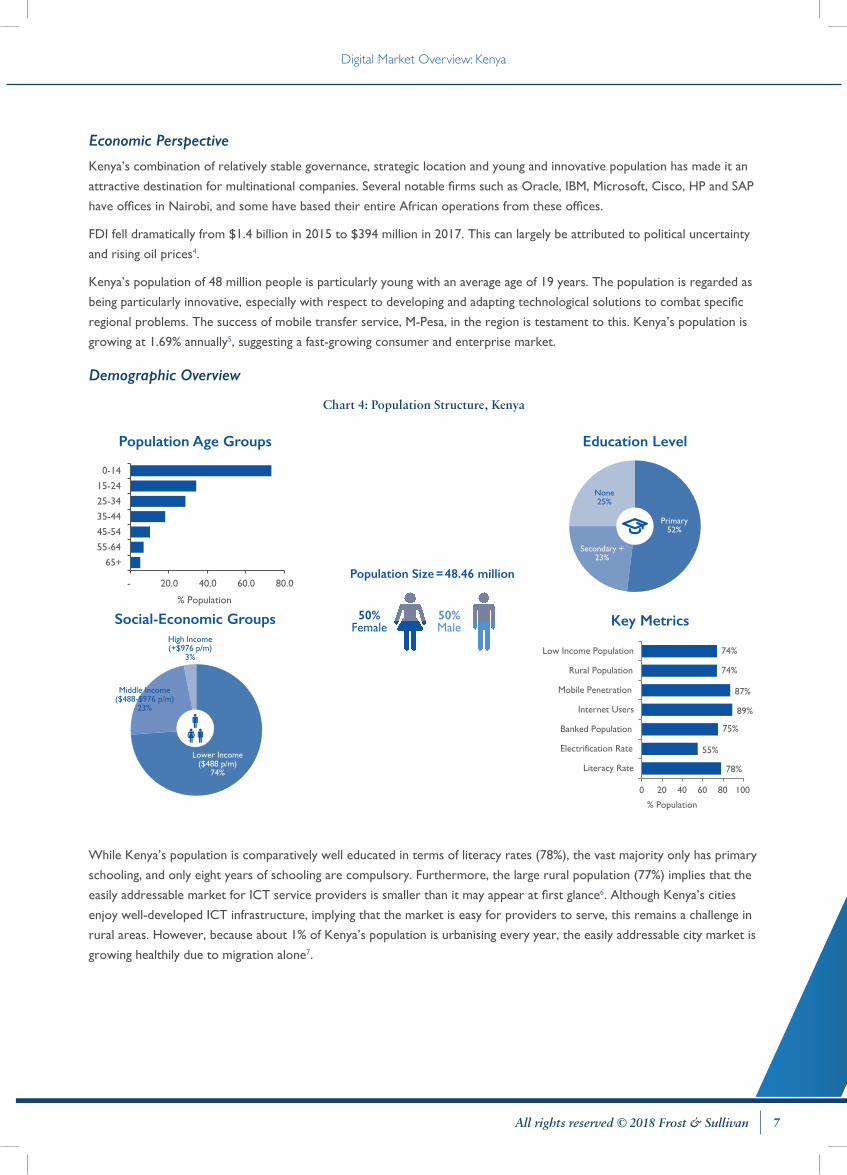
Demographic Overview
Chart 4: Population Structure, Kenya
- 20.0 40.0 60.0 80.0
65+
55-64
45-54
35-44
25-34
15-24
0-14
Population Age Groups
Population Size = 48.46 million
50%Female
50%Male Key Metrics
Education Level
Primary 52%
Secondary +23%
None25%
Social-Economic Groups
Lower Income($488 p/m)
74%
Middle Income($488-$976 p/m)
23%
High Income(+$976 p/m)
3%
0 20 40 60 80 100
Literacy Rate
Electrification Rate
Banked Population
Internet Users
Mobile Penetration
Rural Population
Low Income Population 74%
74%
87%
89%
75%
55%
78%
% Population
% Population
While Kenya’s population is comparatively well educated in terms of literacy rates (78%), the vast majority only has primary
schooling, and only eight years of schooling are compulsory. Furthermore, the large rural population (77%) implies that the
easily addressable market for ICT service providers is smaller than it may appear at first glance6. Although Kenya’s cities
enjoy well-developed ICT infrastructure, implying that the market is easy for providers to serve, this remains a challenge in
rural areas. However, because about 1% of Kenya’s population is urbanising every year, the easily addressable city market is
growing healthily due to migration alone7.
Digital Market Overview: Kenya
8 All rights reserved © 2018 Frost & Sullivan
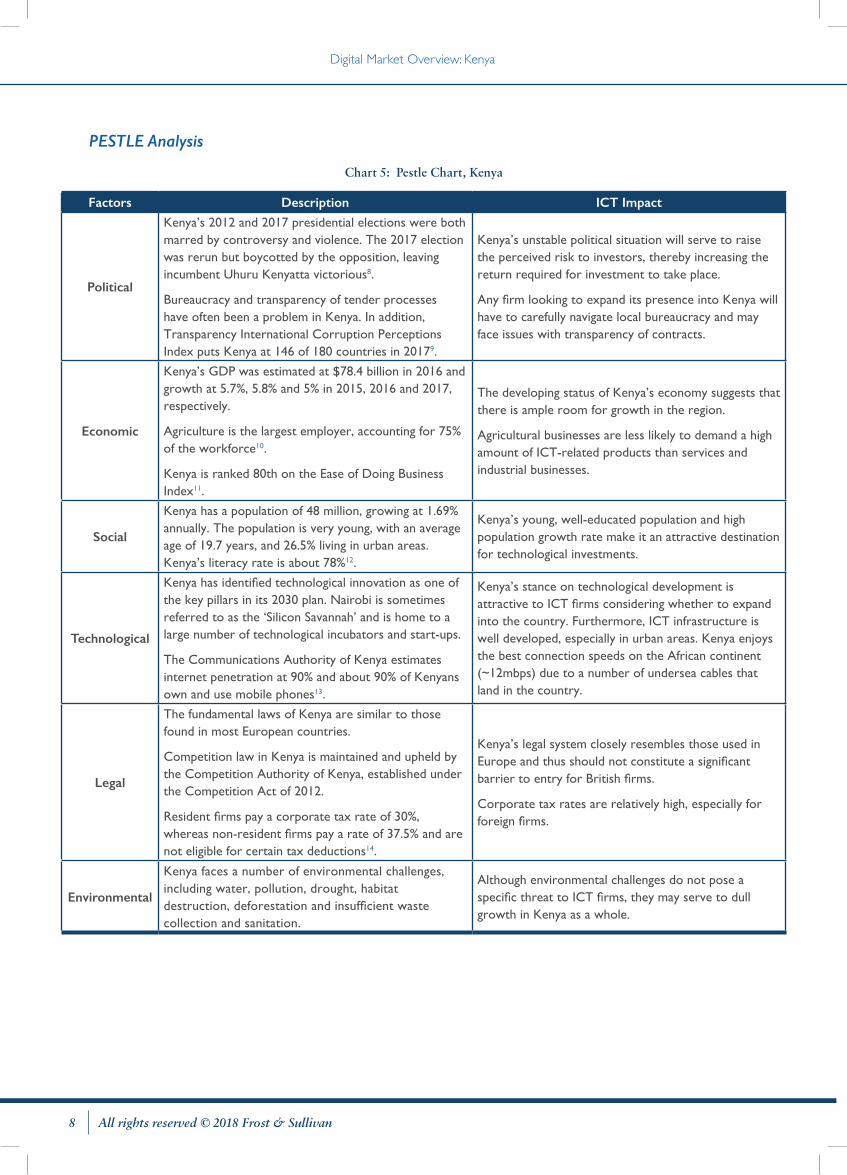
PESTLE Analysis
Chart 5: Pestle Chart, Kenya
Factors Description ICT Impact
Political
Kenya’s 2012 and 2017 presidential elections were both marred by controversy and violence. The 2017 election was rerun but boycotted by the opposition, leaving incumbent Uhuru Kenyatta victorious8.
Bureaucracy and transparency of tender processes have often been a problem in Kenya. In addition, Transparency International Corruption Perceptions Index puts Kenya at 146 of 180 countries in 20179.
Kenya’s unstable political situation will serve to raise the perceived risk to investors, thereby increasing the return required for investment to take place.
Any firm looking to expand its presence into Kenya will have to carefully navigate local bureaucracy and may face issues with transparency of contracts.
Economic
Kenya’s GDP was estimated at $78.4 billion in 2016 and growth at 5.7%, 5.8% and 5% in 2015, 2016 and 2017, respectively.
Agriculture is the largest employer, accounting for 75% of the workforce10.
Kenya is ranked 80th on the Ease of Doing Business Index11.
The developing status of Kenya’s economy suggests that there is ample room for growth in the region.
Agricultural businesses are less likely to demand a high amount of ICT-related products than services and industrial businesses.
Social
Kenya has a population of 48 million, growing at 1.69% annually. The population is very young, with an average age of 19.7 years, and 26.5% living in urban areas. Kenya’s literacy rate is about 78%12.
Kenya’s young, well-educated population and high population growth rate make it an attractive destination for technological investments.
Technological
Kenya has identified technological innovation as one of the key pillars in its 2030 plan. Nairobi is sometimes referred to as the ‘Silicon Savannah’ and is home to a large number of technological incubators and start-ups.
The Communications Authority of Kenya estimates internet penetration at 90% and about 90% of Kenyans own and use mobile phones13.
Kenya’s stance on technological development is attractive to ICT firms considering whether to expand into the country. Furthermore, ICT infrastructure is well developed, especially in urban areas. Kenya enjoys the best connection speeds on the African continent (~12mbps) due to a number of undersea cables that land in the country.
Legal
The fundamental laws of Kenya are similar to those found in most European countries.
Competition law in Kenya is maintained and upheld by the Competition Authority of Kenya, established under the Competition Act of 2012.
Resident firms pay a corporate tax rate of 30%, whereas non-resident firms pay a rate of 37.5% and are not eligible for certain tax deductions14.
Kenya’s legal system closely resembles those used in Europe and thus should not constitute a significant barrier to entry for British firms.
Corporate tax rates are relatively high, especially for foreign firms.
Environmental
Kenya faces a number of environmental challenges, including water, pollution, drought, habitat destruction, deforestation and insufficient waste collection and sanitation.
Although environmental challenges do not pose a specific threat to ICT firms, they may serve to dull growth in Kenya as a whole.
Digital Market Overview: Kenya
9All rights reserved © 2018 Frost & Sullivan
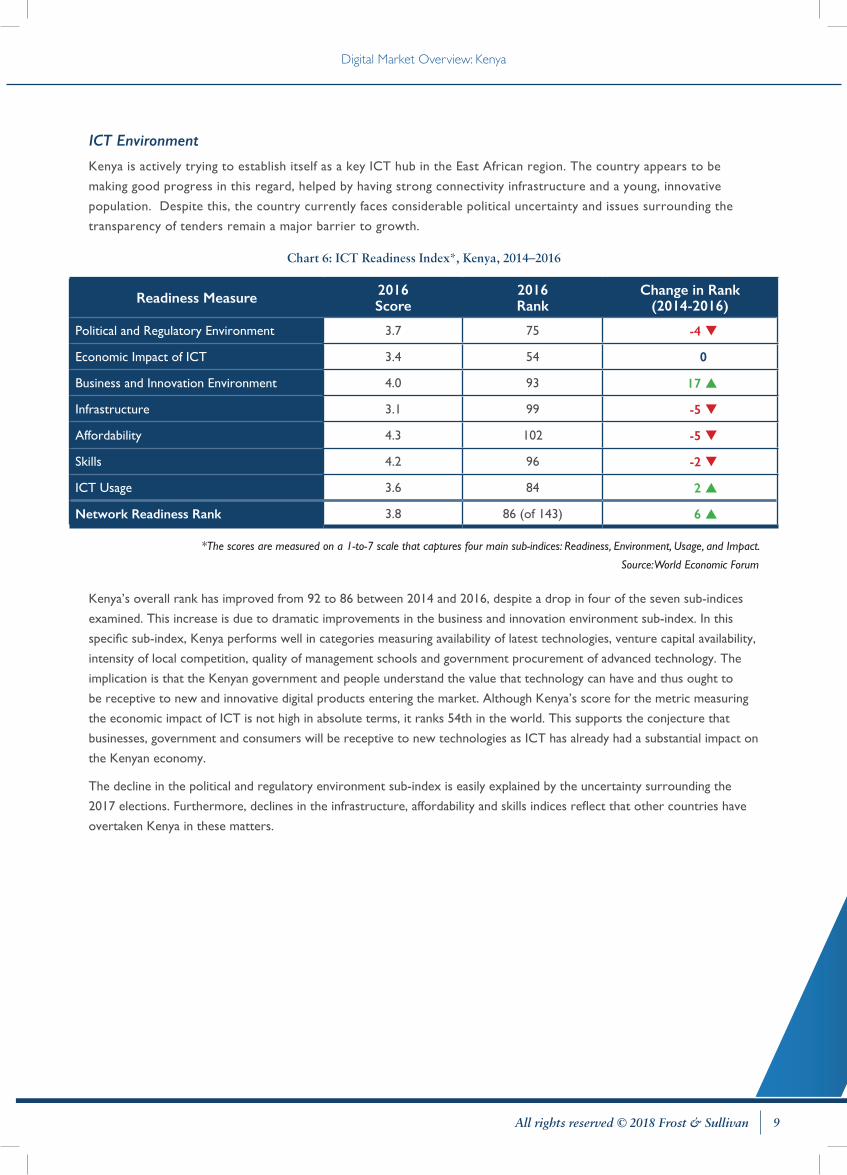
ICT Environment
Kenya is actively trying to establish itself as a key ICT hub in the East African region. The country appears to be
making good progress in this regard, helped by having strong connectivity infrastructure and a young, innovative
population. Despite this, the country currently faces considerable political uncertainty and issues surrounding the
transparency of tenders remain a major barrier to growth.
Chart 6: ICT Readiness Index*, Kenya, 2014–2016
Readiness Measure 2016 Score
2016 Rank
Change in Rank (2014-2016)
Political and Regulatory Environment 3.7 75 -4
Economic Impact of ICT 3.4 54 0
Business and Innovation Environment 4.0 93 17
Infrastructure 3.1 99 -5
Affordability 4.3 102 -5
Skills 4.2 96 -2
ICT Usage 3.6 84 2
Network Readiness Rank 3.8 86 (of 143) 6
*The scores are measured on a 1-to-7 scale that captures four main sub-indices: Readiness, Environment, Usage, and Impact.
Source: World Economic Forum
Kenya’s overall rank has improved from 92 to 86 between 2014 and 2016, despite a drop in four of the seven sub-indices
examined. This increase is due to dramatic improvements in the business and innovation environment sub-index. In this
specific sub-index, Kenya performs well in categories measuring availability of latest technologies, venture capital availability,
intensity of local competition, quality of management schools and government procurement of advanced technology. The
implication is that the Kenyan government and people understand the value that technology can have and thus ought to
be receptive to new and innovative digital products entering the market. Although Kenya’s score for the metric measuring
the economic impact of ICT is not high in absolute terms, it ranks 54th in the world. This supports the conjecture that
businesses, government and consumers will be receptive to new technologies as ICT has already had a substantial impact on
the Kenyan economy.
The decline in the political and regulatory environment sub-index is easily explained by the uncertainty surrounding the
2017 elections. Furthermore, declines in the infrastructure, affordability and skills indices reflect that other countries have
overtaken Kenya in these matters.
Digital Market Overview: Kenya
10 All rights reserved © 2018 Frost & Sullivan
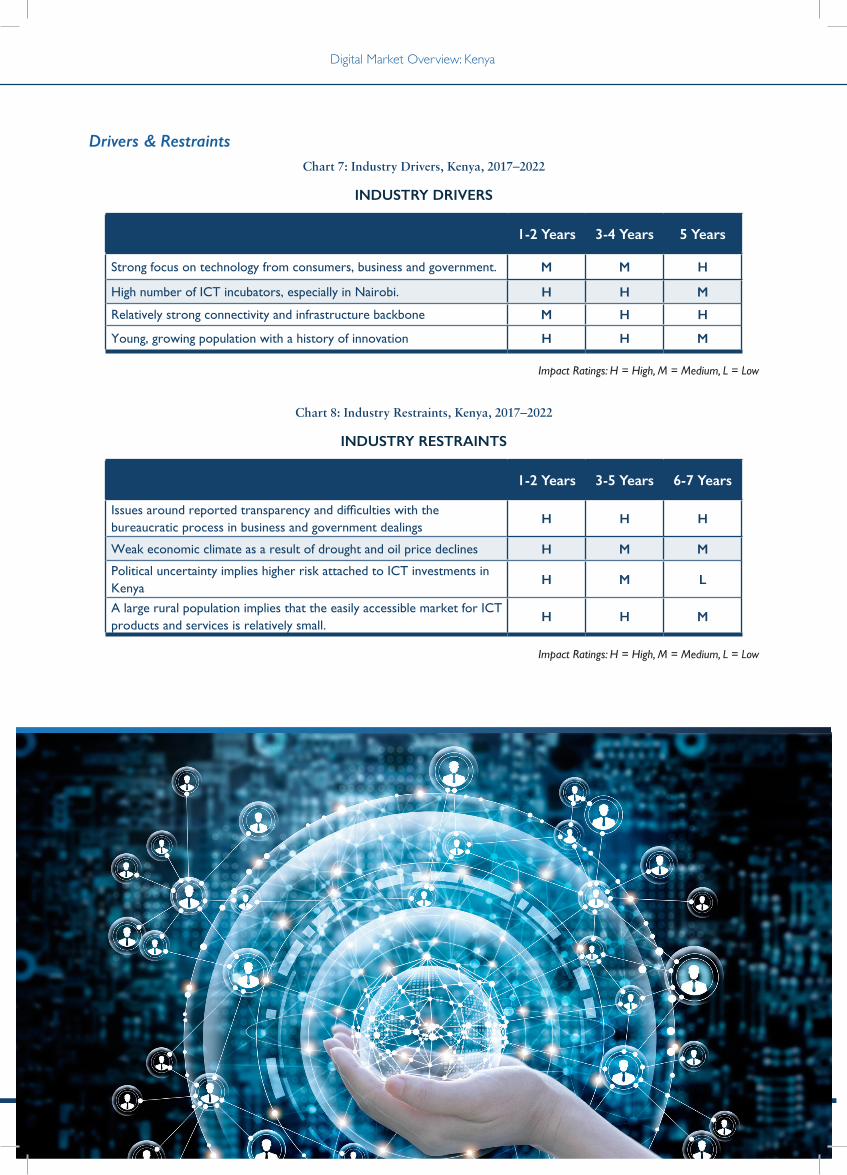
Drivers & RestraintsChart 7: Industry Drivers, Kenya, 2017–2022
INDUSTRY DRIVERS
1-2 Years 3-4 Years 5 Years
Strong focus on technology from consumers, business and government. M M H
High number of ICT incubators, especially in Nairobi. H H M
Relatively strong connectivity and infrastructure backbone M H H
Young, growing population with a history of innovation H H M
Impact Ratings: H = High, M = Medium, L = Low
Chart 8: Industry Restraints, Kenya, 2017–2022
INDUSTRY RESTRAINTS
1-2 Years 3-5 Years 6-7 Years
Issues around reported transparency and difficulties with the bureaucratic process in business and government dealings
H H H
Weak economic climate as a result of drought and oil price declines H M M
Political uncertainty implies higher risk attached to ICT investments in Kenya
H M L
A large rural population implies that the easily accessible market for ICT products and services is relatively small.
H H M
Impact Ratings: H = High, M = Medium, L = Low

Digital Market Overview: Kenya
11All rights reserved © 2018 Frost & Sullivan
Host Government Structures and Policies
Kenya’s telecommunications industry is governed by the Ministry of Information, Communications and Technology.
The two state-owned firms most relevant to the ICT sector are the Kenyan Broadcasting Corporation (the national
broadcaster) and Telkom Kenya, which is 40% government-owned.
Ministry of Information, Communications and
Technology
National Optic Fibre Backbone
Infrastructure Project
Communications Authority of Kenya
Kenya Broadcasting Corporation
Joint Project
Ownership (100%) Ownership (40%)
Regulation and oversight
Multiple Mobile and internet service
providers
National Government
Telkom Kenya

Digital Market Overview: Kenya
12 All rights reserved © 2018 Frost & Sullivan
Agency FunctionMinistry of
Information,
Communications
and Technology
The Ministry of Information, Communications and Technology is responsible for formulating, administering,
managing and developing Kenya’s information, broadcasting and communications policy. The ministry is
divided into the State Department of Broadcasting and Telecommunications and the State Department of
ICT and Innovation.
Telkom Kenya
Telkom Kenya is a partially state-owned (40% holding) telecommunications provider. It is the only provider
of fixed-line services in the country. Telkom Kenya used to provide mobile services via its former brand
Orange Kenya. Following its sale to private equity firm Helios Investment Partners in June 2016, Telkom
Kenya now uses its own brand—Telkom Kenya.
Communications
Authority of
Kenya
The Communications Authority of Kenya is responsible for the regulation of the greater
telecommunications sector. The Authority was established by the Kenya Information and Communications
Act of 1998 and is tasked with facilitating the development of the ICT sector.
National Optic
Fibre Backbone
Infrastructure
Project (NOFBI)
NOFBI is a project undertaken by government, the Ministry of ICT, the ICT Authority and Telkom Kenya
that seeks to ensure adequate fibre connectivity to all 47 of Kenya’s counties. Phase 1 was completed in
2009 and provided a national fibre backbone, whilst phase 2 began in 2014 and seeks to link all significant
regional hubs to the network.
Mobile and
Internet Service
Providers
Kenya has three primary mobile service providers: market leader Safaricom, Equitel and Telkom Kenya.
Kenya
Broadcasting
Corporation
The Broadcasting Corporation of Kenya is the state-owned radio and television broadcaster. It is entirely
government-owned and regulated by the Ministry of Information, Communications and Technology.
National ICT Masterplan, 2013–2018
Kenya’s ICT policy has been broadly determined by the National ICT Masterplan, developed by the Ministry of Information,
Communications and Technology since 201315. The primary focus of this is to ensure that Kenya’s ICT sector makes a
major positive impact towards the achievement of certain national development goals. The ICT Masterplan clearly lays
out the manner in which the Ministry of Information, Communications and Technology believes that these developmental
objectives can be achieved. The two main goals in the Masterplan are the creation of 180,000 jobs and the sector
contributing 8% to GDP by 2019. Kenya claims to have recognised that future successful countries will be those based on
‘knowledge economies’ and the ICT Masterplan is designed to aid Kenya’s transformation into a regional technological hub.
As Kenya’s current ICT Masterplan expires in 2018, there is some uncertainty around policy goals going forward. Kenya’s
Vision 2030, a set of development goals to be attained by 2030, does, however, suggest that technology will continue to
be a key focus area. Through its Vision 2030 proposals, the Kenyan government is committed to making use of science,
technology and innovation to support the economic, political and social pillars of the scheme.

Digital Market Overview: Kenya
13All rights reserved © 2018 Frost & Sullivan
SWOT Analysis
Chart 9: SWOT Analysis, Kenya
• A large rural population (74%) implies that the easily addressable market for ICT services is relatively small.
• Issues with bureaucracy and transparency can make doing business in Kenya a challenge.
• Although connectivity is good by regional standards, it is very expensive and lags behind that found in more developed countries.
• Although political uncertainty and upheaval have lessened following the rerun of the 2017 election, this remains a risk and may put off investors.
• As Kenya becomes progressively more digital, the risk of cyber-attacks increases.
• The vast majority of the Kenya’s ICT resources are concentrated in Nairobi. There is considerable difficulty with diversifying away from this.
• Fast-growing, young population amenable to technological developments.
• History of innovation. • Significant presence of ICT multinationals.• Relatively well educated population.• A culture of entrepreneurship.
• Mobile and internet penetration are extremely high. This would be a key method for service delivery.
• Digital terrestrial television is expected to emerge as the fastest growing pay-tv segment. The KBC does not offer these services.
• Although SaaS and IaaS markets are expected to continue growing, the PaaS market will grow far more rapidly.
• Demand for security services will increase due to digitalisation.
BOP Industry Statistics
• The Communications Authority of Kenya reports the country as having 43.3 million internet users, translating into
a penetration rate of 89.4%16. The CIA, on the other hand, reports Kenya’s internet penetration as being 26%17.
Given that Safaricom reports ~35% of the population as mobile data customers in its audited 2017 annual report, the
Communications authority estimate is used in the remainder of this report18.
• Kenya is aiming for universal electrification (95% electrification rate) by 2021. Government sources suggest that,
currently, about 55% of the population has access to electricity, up from 27% in 2013. Kenya produces about 9.6 billion
kWh annually and consumes around 7.7 kWh annually. Kenya is a world leader in renewable energy production, with
54% of total energy stemming from these sources19.
• Kenya’s adult literacy rate, 78%, is high compared to the rest of Africa. Importantly, the youth literacy rate (87%)
exceeds the adult literacy rate, indicating that basic education is improving20.
• About 75% of Kenyan adults have access to a financial account of some type. This is considerably higher than the
average in sub-Saharan Africa of 26%. Furthermore, 55% of the population has access to an account at a formal financial
institution such as a traditional bank21.
BOP Industry Initiatives
If the internet penetration statistics offered by the Communications Authority of Kenya are accurate, Kenya is already close
to achieving universal internet access. Some of this success can be attributed to a government and private programme to
provide Wi-Fi connectivity, through hot spots, to historically underserved and mostly rural towns. One such hot spot, in
the town of Nakuru, attracted 30,000 unique users per day22.
Electrification rates have increased substantially since 2013, but universal electrification by 2021 remains a significant
challenge given the country’s large rural population. Standard grid provision is expensive, especially in rural areas. In 2017,
the World Bank approved a $150 million International Development Association credit intended to enable access to off-
grid solar energy for marginalised rural communities in Kenya.
Despite Kenya’s rapid progress in electrification, outages remain common for several reasons.

Digital Market Overview: Kenya
14 All rights reserved © 2018 Frost & Sullivan
TELECOMMUNICATIONS
Market Overview
Chart 10: Telecommunications Industry Overview, Kenya, 2016
Telecommunications Industry Overview, Kenya, 2016
Mobile Subscriptions 39.8 million
Mobile Penetration Rate 87%
Fixed Line Penetration 0.5%
Internet Penetration 89.4%
Mobile Broadband Penetration 37.3%
Number of MNOs 3
Source: CAK, ITU
The traditional telecommunications market in Kenya comprises three mobile network operators and one fixed-line
operator. Safaricom, the largest mobile network operator (MNO), has a market share of over 70%. Much of Safaricom’s
dominance in the mobile segment is due to its M-Pesa mobile phone-based money transfer service, available nationally.
Currently, Safaricom has an estimated 71.2% of mobile subscriptions in the country, whilst Airtel and Telkom Kenya hold
17.6% and 7.4%, respectively23. Smaller Mobile Virtual Network Operators (MVNOs) control the remainder of the market.
The Communications Authority of Kenya issued five MVNO licences in an attempt to end Safaricom’s dominance in the
sector. They went to Finserve Africa Limited (a subsidiary of Equity Bank), Mobile Pay Limited, Zioncell Kenya Limited,
Lycamobile and Homeland Group. The relatively poor performance of MVNOs, coupled with Safaricom’s growing market
share, suggests that the government’s plan to increase competition in the sector by licensing MVNOs has not been
particularly successful24.
Fixed-line penetration in Kenya is low at about 0.5% of the population25. The very low fixed-line penetration rate in Kenya
can be attributed to the country’s enthusiastic preference for mobile technology (mostly driven by M-Pesa) as well as the
large rural population, implying high costs for fixed-line providers.
Although Telkom Kenya currently has a monopoly in the fixed-line market, the government has embarked on a process
to license a second fixed-line operator. This operator is expected to be operational by 2019. Various privately owned
companies, most notably Safaricom, have had fixed-line provision as a strategic goal at some point in time. This suggests that
there is some belief that fixed-line services have the potential to grow. This growth will be contingent upon finding a way to
provision fixed-line services to relatively small populations at low costs.
Although the mobile telecommunications industry has proven vital to Kenya’s growth and technological development, a
number of significant challenges remain to the sector’s continued growth. These include:
• Cost of connecting rural populations
• Intermittent blackouts
• High corporate tax rates
• Lack of competition in the sector
• Market driven by subsidiary services (M-Pesa)
Digital Market Overview: Kenya
15All rights reserved © 2018 Frost & Sullivan
The undersea cables that land in Mombasa form the core of Kenya’s ICT infrastructure. There are currently three cables
landing in Mombasa, namely SEACOM, the Eastern African Submarine Cable System (EASSy) and the East African Marine
Systems cable (TEAMS). The three cables represent a cumulative bandwidth availability of 6,400 Gbps. Furthermore, the
lower Indian Ocean Network 2 cable provides 1.28 Tbps of bandwidth between Kenya, Rwanda, Tanzania, Ethiopia and
Madagascar.
Kenya’s internal fixed-line systems are plagued by regular power outages and logistic problems that have considerably
slowed deployment. There are on average 36 service interruptions a year and a fixed-line request can take over 100 days
to complete.
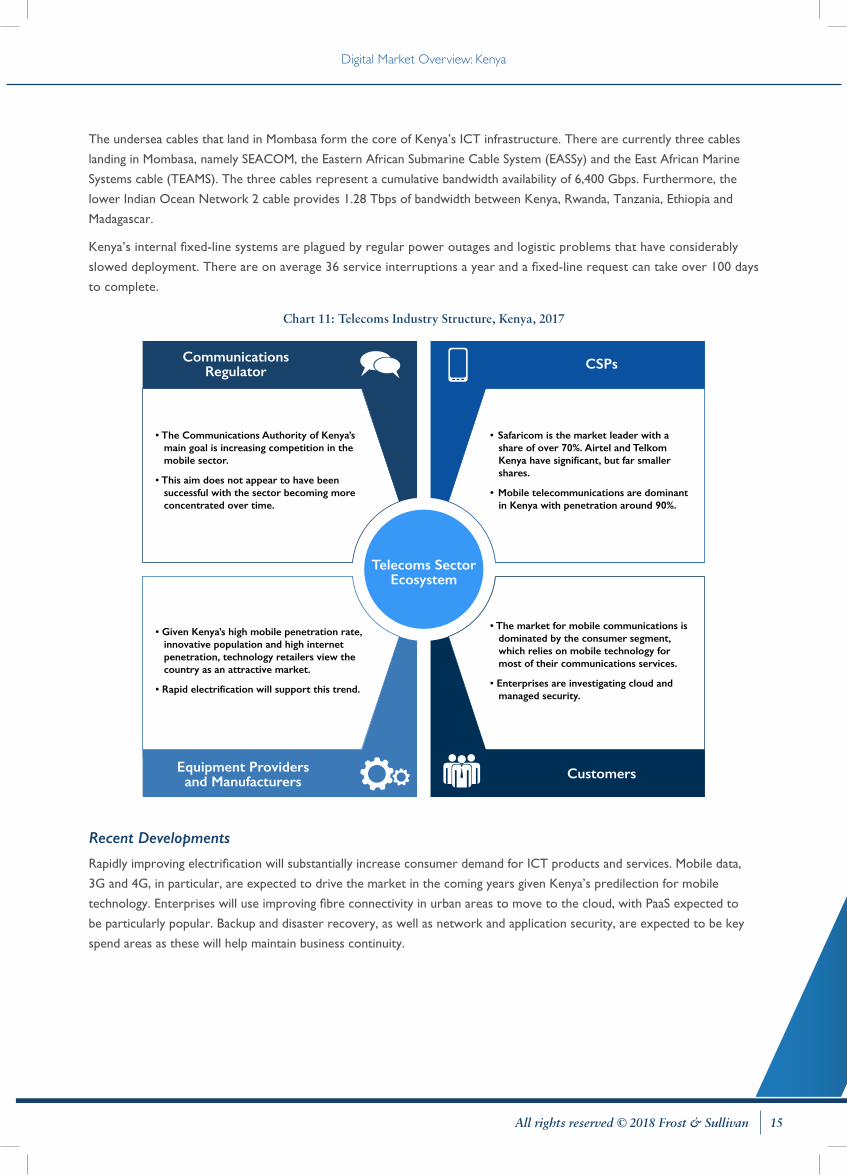
Chart 11: Telecoms Industry Structure, Kenya, 2017
• The Communications Authority of Kenya’s main goal is increasing competition in the mobile sector.
• This aim does not appear to have been successful with the sector becoming more concentrated over time.
• Given Kenya’s high mobile penetration rate, innovative population and high internet penetration, technology retailers view the country as an attractive market.
• Rapid electrification will support this trend.
• The market for mobile communications is dominated by the consumer segment, which relies on mobile technology for most of their communications services.
• Enterprises are investigating cloud and managed security.
• Safaricom is the market leader with a share of over 70%. Airtel and Telkom Kenya have significant, but far smaller shares.
• Mobile telecommunications are dominant in Kenya with penetration around 90%.
CommunicationsRegulator
Equipment Providersand Manufacturers
CSPs
Customers
Telecoms Sector Ecosystem
Recent Developments
Rapidly improving electrification will substantially increase consumer demand for ICT products and services. Mobile data,
3G and 4G, in particular, are expected to drive the market in the coming years given Kenya’s predilection for mobile
technology. Enterprises will use improving fibre connectivity in urban areas to move to the cloud, with PaaS expected to
be particularly popular. Backup and disaster recovery, as well as network and application security, are expected to be key
spend areas as these will help maintain business continuity.
Digital Market Overview: Kenya
16 All rights reserved © 2018 Frost & Sullivan
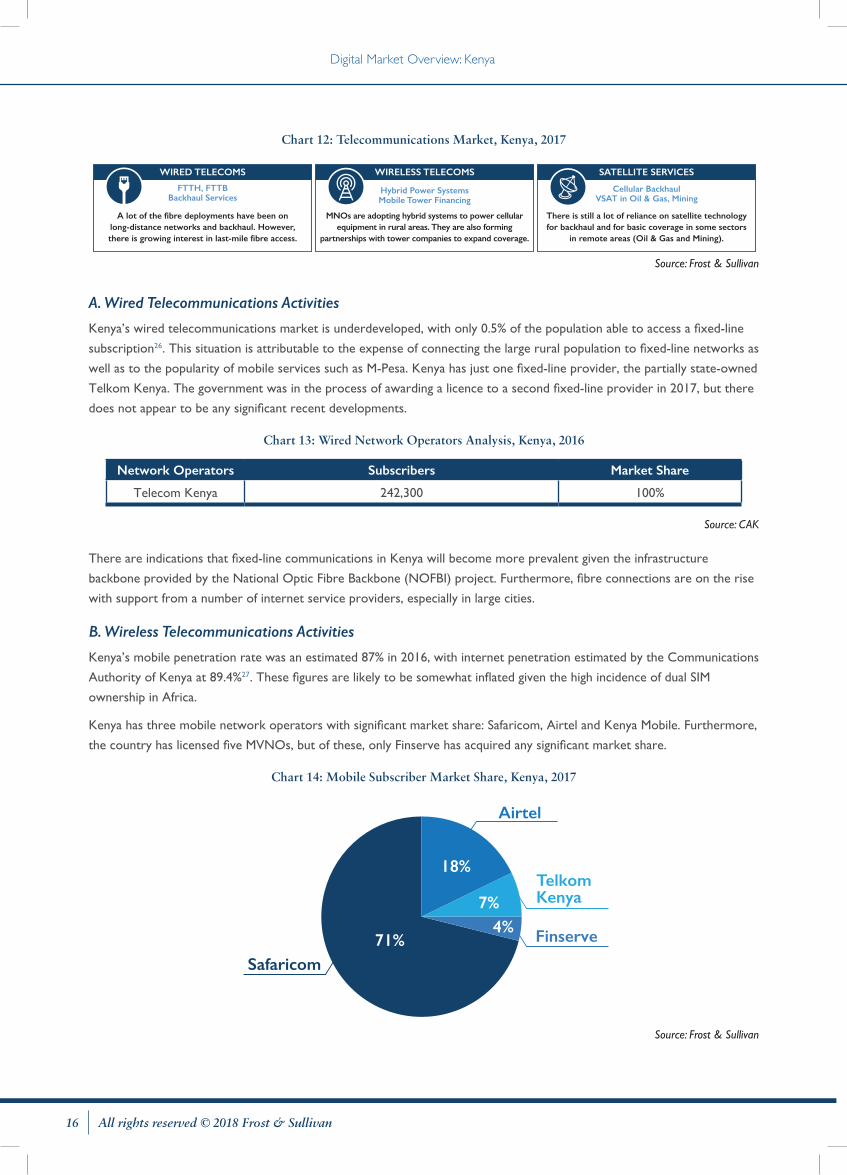
Chart 12: Telecommunications Market, Kenya, 2017
FTTH, FTTBBackhaul Services
A lot of the fibre deployments have been on long-distance networks and backhaul. However, there is growing interest in last-mile fibre access.
WIRED TELECOMS
Hybrid Power SystemsMobile Tower Financing
WIRELESS TELECOMS
MNOs are adopting hybrid systems to power cellular equipment in rural areas. They are also forming
partnerships with tower companies to expand coverage.
There is still a lot of reliance on satellite technology for backhaul and for basic coverage in some sectors
in remote areas (Oil & Gas and Mining).
Cellular BackhaulVSAT in Oil & Gas, Mining
SATELLITE SERVICES
Source: Frost & Sullivan
A. Wired Telecommunications Activities
Kenya’s wired telecommunications market is underdeveloped, with only 0.5% of the population able to access a fixed-line
subscription26. This situation is attributable to the expense of connecting the large rural population to fixed-line networks as
well as to the popularity of mobile services such as M-Pesa. Kenya has just one fixed-line provider, the partially state-owned
Telkom Kenya. The government was in the process of awarding a licence to a second fixed-line provider in 2017, but there
does not appear to be any significant recent developments.
Chart 13: Wired Network Operators Analysis, Kenya, 2016
Network Operators Subscribers Market Share
Telecom Kenya 242,300 100%
Source: CAK
There are indications that fixed-line communications in Kenya will become more prevalent given the infrastructure
backbone provided by the National Optic Fibre Backbone (NOFBI) project. Furthermore, fibre connections are on the rise
with support from a number of internet service providers, especially in large cities.
B. Wireless Telecommunications Activities
Kenya’s mobile penetration rate was an estimated 87% in 2016, with internet penetration estimated by the Communications
Authority of Kenya at 89.4%27. These figures are likely to be somewhat inflated given the high incidence of dual SIM
ownership in Africa.
Kenya has three mobile network operators with significant market share: Safaricom, Airtel and Kenya Mobile. Furthermore,
the country has licensed five MVNOs, but of these, only Finserve has acquired any significant market share.
Chart 14: Mobile Subscriber Market Share, Kenya, 2017
TelkomKenya
Airtel
Safaricom
Finserve
18%
7%
71%4%
Source: Frost & Sullivan
Digital Market Overview: Kenya
17All rights reserved © 2018 Frost & Sullivan
As Kenya’s population appears well served by mobile networks, the primary regulatory concern in the industry has been
increasing competition in general and reducing Safaricom’s market share in particular. Much of Safaricom’s dominance is a
result of offering the exceptionally popular M-Pesa service.
Satellite Telecommunications Activities
Satellite communications have been used in the following areas:
• Weather Forecasting
• Radio and TV Broadcasting
• Military
• Navigation
• Global Telephone and Mobile Communications
The main challenge with remote area connectivity is how to minimize operational expenditure so that dispersed, low
average revenue per user (ARPU) communities are served profitably. As we move beyond the current 7 billion cellular
subscribers worldwide, traditional mobile network business models are no longer economically viable. This is due to the
next billion users being more expensive to serve (due to geographical dispersion) and having lower budgets to spend on
communications. For MNOs, this means that future growth will require many more cell sites to cover increasingly larger
areas with smaller user populations. At the same time, the expanded networks are likely to bring lower revenues due to
lower income levels across those regions.
Satellite connectivity is a popular service offering in Kenya with a host of internet service providers offering very small
aperture terminal (VSAT) packages. These are appealing as they avoid the infrastructural challenges associated with
fixed connectivity. The popularity of satellite is expected to decrease, especially in urban areas, as last-mile connectivity
challenges are resolved, thus making fixed-line connections cheaper and more appealing than satellite offerings.
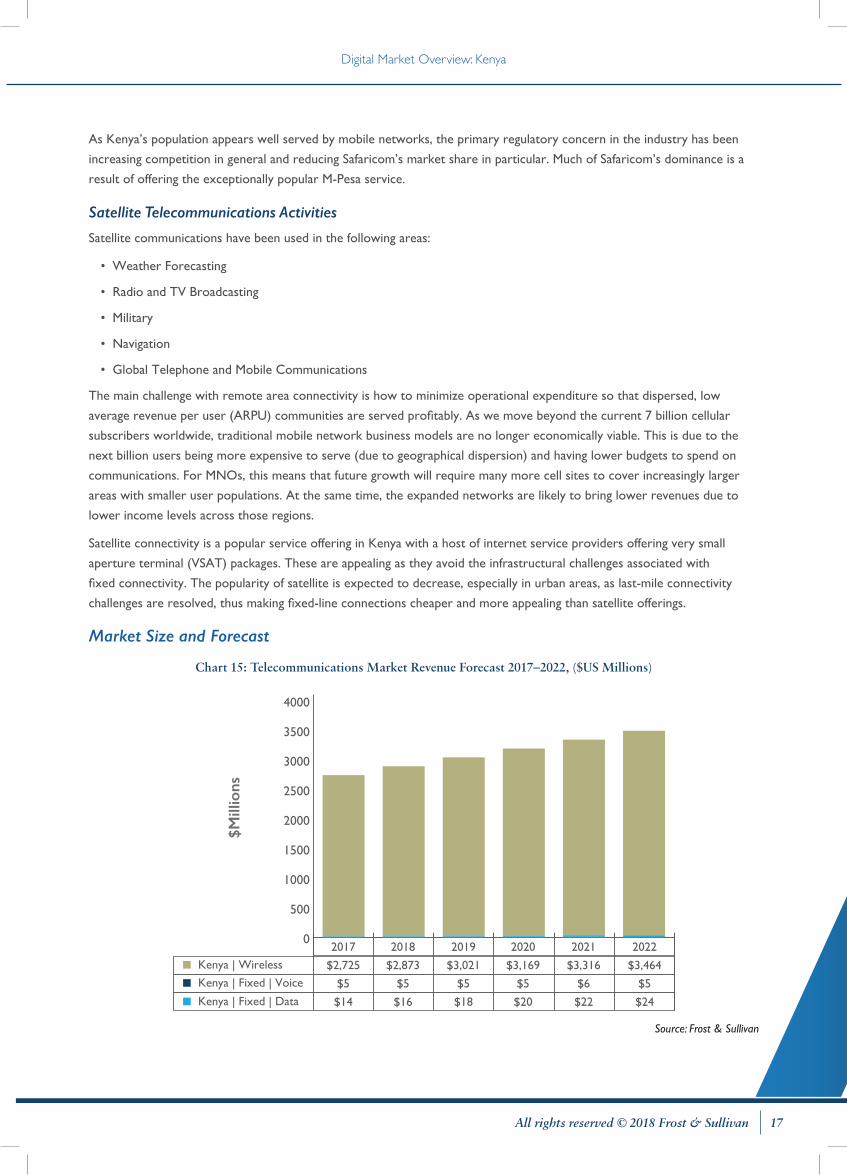
Market Size and Forecast
Chart 15: Telecommunications Market Revenue Forecast 2017–2022, ($US Millions)
2017 2018 2019 2020 2021 2022
Kenya | Wireless
Kenya | Fixed | Voice
Kenya | Fixed | Data
$2,725 $2,873 $3,021 $3,169 $3,316 $3,464
$5 $5 $5 $5 $6 $5
$14 $16 $18 $20 $22 $24
0
500
1000
1500
2000
2500
3000
3500
4000
$Mill
ions
Source: Frost & Sullivan
Digital Market Overview: Kenya
18 All rights reserved © 2018 Frost & Sullivan
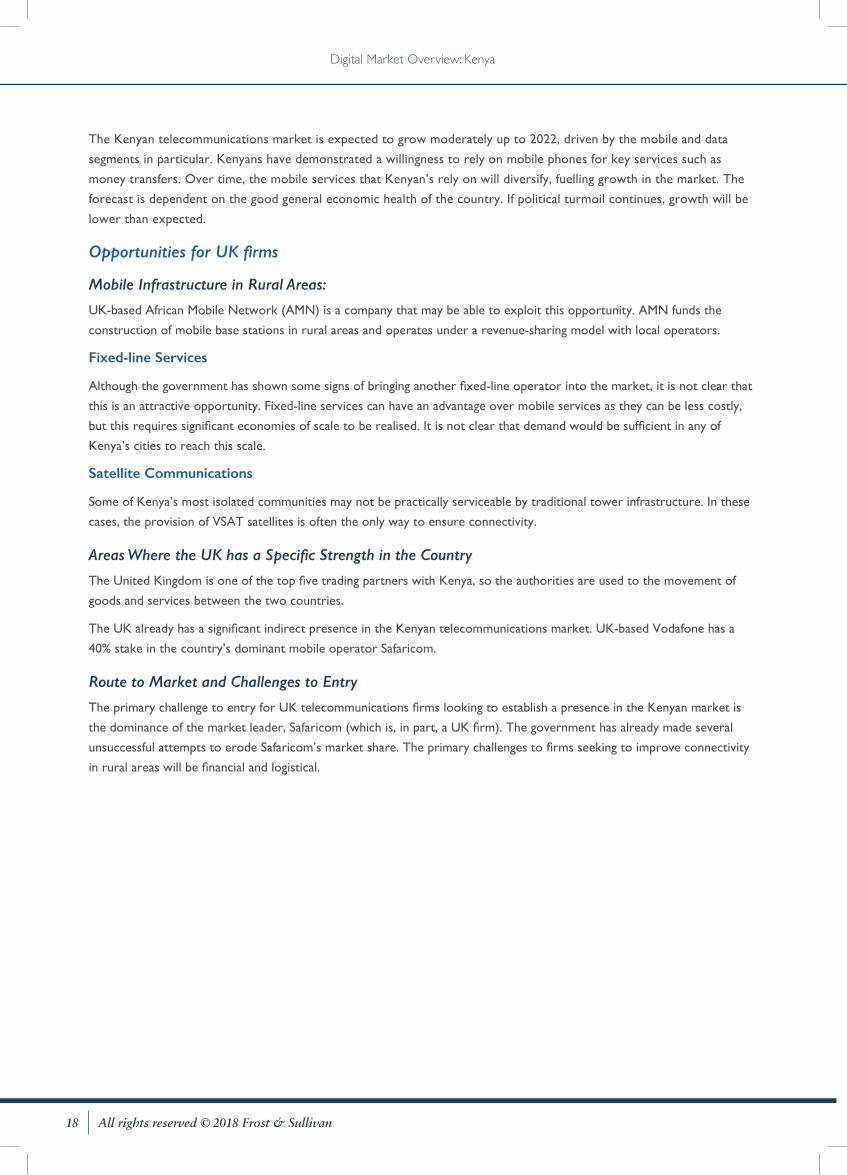
The Kenyan telecommunications market is expected to grow moderately up to 2022, driven by the mobile and data
segments in particular. Kenyans have demonstrated a willingness to rely on mobile phones for key services such as
money transfers. Over time, the mobile services that Kenyan’s rely on will diversify, fuelling growth in the market. The
forecast is dependent on the good general economic health of the country. If political turmoil continues, growth will be
lower than expected.
Opportunities for UK firms
Mobile Infrastructure in Rural Areas:
UK-based African Mobile Network (AMN) is a company that may be able to exploit this opportunity. AMN funds the
construction of mobile base stations in rural areas and operates under a revenue-sharing model with local operators.
Fixed-line Services
Although the government has shown some signs of bringing another fixed-line operator into the market, it is not clear that
this is an attractive opportunity. Fixed-line services can have an advantage over mobile services as they can be less costly,
but this requires significant economies of scale to be realised. It is not clear that demand would be sufficient in any of
Kenya’s cities to reach this scale.
Satellite Communications
Some of Kenya’s most isolated communities may not be practically serviceable by traditional tower infrastructure. In these
cases, the provision of VSAT satellites is often the only way to ensure connectivity.
Areas Where the UK has a Specific Strength in the Country
The United Kingdom is one of the top five trading partners with Kenya, so the authorities are used to the movement of
goods and services between the two countries.
The UK already has a significant indirect presence in the Kenyan telecommunications market. UK-based Vodafone has a
40% stake in the country’s dominant mobile operator Safaricom.
Route to Market and Challenges to Entry
The primary challenge to entry for UK telecommunications firms looking to establish a presence in the Kenyan market is
the dominance of the market leader, Safaricom (which is, in part, a UK firm). The government has already made several
unsuccessful attempts to erode Safaricom’s market share. The primary challenges to firms seeking to improve connectivity
in rural areas will be financial and logistical.

Digital Market Overview: Kenya
19All rights reserved © 2018 Frost & Sullivan
DIGITAL SERVICES
Market Overview
Mobile technology has been central to the development of some of the most innovative solutions in Africa in a range of
sectors, including finance, agriculture, healthcare and education. Start-ups have leveraged the growing access to mobile
networks and internet services to enable innovation in these sectors. Some of the main opportunities for growth identified
in this research include cloud services, fintech services, business process outsourcing (BPO) and eCommerce.
PaaS, SaaS, IaaS
All segments of the cloud market are expected to grow over the next 5 years, with
PaaS leading the way.
CLOUD COMPUTING
InternationalRemittances
FinTech SERVICES
Kenya has the largest international mobile remittance market. Increased competition to
M-Pesa is expected.
eCommerce is expected to become more prevalent with improved connectivity and
increased trust in online transactions.
Payment, Facilitation
eCOMMERCE
Contact centre services are growing steadily and niche market segments are
expected to develop.
NicheServices
BPO SERVICES
Recent Developments
Cloud Services
» Cloud services are becoming steadily more viable in Kenya as connectivity becomes cheaper and more
reliable. As a result, several large, international players such as Salesforce, Seven Seas Technologies and IBM
have entered the market. Furthermore, Internet Solutions recently re-entered the market.
Fintech Services
» Fintech has a rich history in Kenya following the adoption of M-Pesa. The majority of start-ups located in
Nairobi’s many technology incubators are fintech firms.
» Credit, mobile payment and banking services represent the core of the market, but there are also innovations
in the agricultural and peer-to-peer lending domains.
BPO Services
» The Kenyan government has recently reiterated its interest in the country’s BPO sector, and it is expected to
generate 10,000 jobs by 2022.
» Niche services such as analytics and knowledge process outsourcing are expected to lead growth.
eCommerce
» eCommerce in Kenya is expected to grow healthily off the back of mobile services. This is due to low levels
of fixed internet access and computer usage.
» Much of Kenya’s start-up activity is around mobile payment systems.

Digital Market Overview: Kenya
20 All rights reserved © 2018 Frost & Sullivan
Host Government Structures and Policies
Given the breadth of the digital services market, there are a number of relevant stakeholders at play.
Central Bank of Kenya
The Central Bank of Kenya plays a significant role in the regulation of digital services, especially as they involve financial
information. Many firms have suggested that these regulations are overly stringent and unclear.
The Central Bank is also responsible for the regulation of the national payment system which determines the conditions
under which operators seeking to use the system may enter the market.
Communication Authority of Kenya
The Communications Authority is charged with regulating the communications industry in general and will thus have a
bearing on digital services regulation, especially cloud and BPO services.
Ministry of Information, Communications and Technology
The Ministry of Information, Communications and Technology is responsible for developing and managing policy on ICT.
This will impact all forms of digital services.
Market Size and Forecast
Chart 16: Digital Services (Consumer) Market Revenue Forecast, 2017–2022, ($US Millions)
2017 2018 2019 2020 2021 2022
Kenya | Pay TV
Kenya | mHealth
Kenya | mEducation
$151.0 $175.5 $201.2 $227.9 $255.6 $284.6
$147.8 $206.2 $275.7 $356.9 $450.5 $557.1
$59.8 $85.5 $116.1 $152.2 $193.9 $241.6Kenya | Insurance
Kenya | Fintech
$5.2 $7.9 $11.1 $14.9 $19.4 $24.5
$53.5 $63.8 $74.9 $87.0 $99.9 $113.7
$0
$200
$400
$600
$800
$1,000
$1,200
$1,400
$Mill
ions

Digital Market Overview: Kenya
21All rights reserved © 2018 Frost & Sullivan
Chart 17: Digital Services (Business) Market Revenue Forecast, 2017–2022, ($US Millions)
Kenya | Data Centres
Kenya | Cloud
Kenya | BPO
20172016 2018 2019 2020 2021 2022
$602 $825 $1,047 $1,279 $1,486 $1,679
$197 $275 $345 $407 $461 $514
$602 $825 $998 $1,154 $1,286 $1,437
$1,848
$564
$1,545
$0
$500
$1,000
$1,500
$2,000
$2,500
$3,000
$3,500
$4,000
$4,500
$Mill
ions
Cloud Services Market
Kenya’s cloud service market is expected to grow at a healthy rate with PaaS driving growth. This is attributed to PaaS
offerings displaying higher per-unit revenues than IaaS or SaaS offerings. Additionally, PaaS deployments offer developers far
more control over their applications than SaaS offerings.
Furthermore, Kenya’s cloud service market will expand as connectivity and energy constraints are mitigated.
Hybrid public-private cloud models are expected to become more popular due to increased trust in cloud systems and the
cost advantage these models offer.
Kenya’s cloud market has seen the entry of many large international firms, primarily from the United States, frequently
in partnership with local providers whereby the local provider acts as a broker and manages the transition process. An
example of this is a reseller partnership between Google and Nairobi-based Naisoft, whereby Naisoft resells Google cloud
services in the Kenyan market.
PaaS2016: $39 million2019: $94 million
SaaS2016: $59 million2019: $109 million
IaaS2016: $99 million2019: $189 million
Year2016 2019
~$400m
~$197m
Rev
enue
($
Mill
ion)
Iaas Saas Paas
$0
$100
$200
$300
$400
• Demand for cloud services was estimated at $197.4 million in 2016, and grew by almost 40% in 2017 to $275 million.
• Growth is expected to be driven by PaaS and the easing of constraints around trust and connectivity.
• Unusually, the public sector leads the private sector in terms of cloud adoption in Kenya with 35.6% of public-sector
institutions using cloud services compared to 23% of private businesses28. This divergence is attributable to a clear
policy of digitalising government services.

Digital Market Overview: Kenya
22 All rights reserved © 2018 Frost & Sullivan
The key opportunities in the Kenyan cloud services market revolve around making mobile and mobility services
more accessible to small and medium-sized enterprises. Data protection laws will need to be considered in this
process, and a differentiating feature may be for the provider to ensure compliance with these laws as smaller firms
may lack the capabilities.
‘Lite’ mobile CRM and ERP solutions may prove popular as well as PaaS offerings that provide flexibility and easy
programming interfaces.
Competitive Overview
The Kenyan cloud market is split between local and international providers. Frequently, local providers act as resellers and
brokers in partnerships with large international providers. Companies such as Seven Seas Technologies, Angani, Safaricom,
Dimension Data, IBM and Salesforce are active in the market.
Chart 18: Cloud Services Market: Service Revenue Share (%), Kenya, 2016
Internet Solutions/Dimension Data
Safaricom Business,Seven Seas
MTN Business
IBM
Others
18%28%
18%
12%
24%
Source: Frost & Sullivan
BPO Sector
The Kenyan government is targeting the creation of 10,000 jobs in the BPO sector by 2022. Although demand from
domestic firms for BPO services is limited, Kenya is a fairly attractive destination for international firms seeking to
outsource these functions. Kenya has a good combination of strong connectivity and education, as well as relatively low
labour costs. Furthermore, Kenya is situated in an attractive time zone for European customers.
Although the BPO market is currently dominated by traditional call centre services, niche services such as knowledge
process outsourcing and market research and analytics are expected to boom from 2018 to 2022.
Most of the growth in the BPO industry is expected to be on the back of increased demand from retailers, fast-moving
consumer goods firms, eCommerce firms and fast food chains.
Competitive Overview
The Kenyan BPO market is made up of about 16 firms, including some prominent international companies such as Accu
BPO and Omron Adept Technologies. There are also a number of home-grown firms in the market such as Ken-Tech Data.
The BPO industry covers services such as in- and outbound contact centres, data entry, capture and conversion, medical
and financial transcription, and software and web development.
Fintech
Kenya performs remarkably well relative to other developing countries in terms of financial and digital inclusion. This is
primarily due to high adoption rates of mobile money services amongst traditionally underserved groups. The range of
mobile money services is broadening to include insurance and loan products.

Digital Market Overview: Kenya
23All rights reserved © 2018 Frost & Sullivan
An estimated 75% of Kenyan adults have access to a financial services account of some type, considerably higher than the
sub-Saharan average of 26%. This represents a 50% increase since 200629.
Kenya’s primary payment system is the Kenya Electronic Payment and Settlement System (KEPS) and is used by
commercial banks to transfer funds between their accounts. It is administered by the Central Bank. Additionally, Kenya
makes use of two regional payment systems to facilitate transactions with regional partners—the East African Payment
System and the Regional Payment and Settlement System. The two primary retail payment systems (systems used by
consumers for standard transactions) are mobile phone money transfer services and payment cards30. The Chart below
details the total value of transactions processed over these payment systems in 2016, which provides some indication of
the addressable market.
KEPS/ Regional
Mobile
Cards
$287.1billion
$33.15 billion
$13.8 billion
Source: KCB
The most significant aspect of the Kenyan payments market is the dominance of mobile payments over card payments.
Note that card payments made online through a mobile device are classified as card payments. Mobile payments are those
made using mobile wallet services or applications such as M-Pesa. The dominance of mobile markets reflects the success
of M-Pesa and other mobile financial service offerings in the country. As smartphone penetration in Kenya increases, the
variety of mobile financial service offerings is expected to increase.
Competitive Overview
Current estimates suggest that there are about 40 significant fintech firms in the Kenyan market. Although M-Pesa is
dominant, several other firms have exploited niches in the mobile payments market. BitPesa, for example, enables regional
mobile payment using Bitcoin rather than traditional currency, and Kopo Kopo offers a SaaS suite that allows small
businesses to process mobile payments. The market has proven attractive to large international firms such as Vodafone
(through Safaricom and M-Pesa) and Opera as well as to local start-ups—many of which stem from Nairobi’s many tech
incubators. There is evidence that the mobile payment market is maturing and that other avenues, such as insurance and
loans, are being explored.
eCommerce
The Kenyan market appears particularly well suited to eCommerce due to the high use of mobile phones in the country
and the population being accustomed to conducting transactions over mobile phones.
The Kenyan market is sometimes compared to the Chinese eCommerce market in the early 2000s and, as such,
should benefit from employing similar strategies. Two important similar strategies will be to make buying and selling on
eCommerce platforms as cheap as possible and also to enable real-time text communication on the platforms. Whilst
Kenyans are fairly comfortable with mobile payments, the population has shown a reticence toward trusting product
images, and real-time text communication may mitigate this. Another challenge to eCommerce operators is ensuring an
efficient and viable delivery network due to difficulties in achieving economies of scale in the relatively poor cities.

Digital Market Overview: Kenya
24 All rights reserved © 2018 Frost & Sullivan
Competitive Overview
The main competitors in the eCommerce market in Kenya are Jumia, OLX, Kilimall and Cheki. Although OLX is still
operational in the country, it recently closed its Kenyan offices. Key challenges in the industry involve developing viable and
efficient delivery networks.
Areas of Technology-specific Strength
Digital service providers in the cloud and BPO markets are largely involved in the provision, rather than the development,
of services, whilst Kenyan firms are more prevalent in the fintech and eCommerce markets. The physical technology
required for the delivery of digital services is typically imported, and it is not clear that Kenya could produce these products
more efficiently.
A key strength in the digital services market is the acceptance of mobile services. Any consumer solution entering the
market would have to be mobile-compatible. Mobile healthcare services are expected to grow particularly rapidly as the
sophistication of these offerings increases.
Opportunities for UK Firms
Cloud – There is significant opportunity for the development and sale of mobile cloud services in the Kenyan market.
The primary opportunity lies in targeting small and medium enterprises with mobile-compatible versions of ERP and CRM
solutions.
Fintech – Successful fintech offerings in the Kenyan market have typically focussed on addressing specifically Kenyan
problems. M-Pesa, for example, was successful as it provided easy, cheap access to a historically under-banked Kenyan
population. Kenyan’s have shown a preference for mobile commerce and the opportunity lies in developing more advanced
mobile services around healthcare, finance and insurance.
eCommerce – eCommerce has great potential in Kenya due to a willingness to make payments online or through
a mobile money account. The primary restraint to growth in this area is under-developed transportation and delivery
infrastructure. There is an opportunity here for vendors with creative delivery solutions to capture the market. A possible
strategy here would be to employ a pay online, collect at store model.
UK presence in the country
Sage and Vodafone (through Safaricom and M-Pesa) appear to be the most prominent UK firms in the Kenyan digital
services market.
Sage has an office in Nairobi as well as 11 local partners that resell its payroll, HR and payment systems.
Route to Market and Challenges to Entry
On the consumer side, it is vital that any proposed digital service offering be mobile-compatible due to the prevalence
of mobile usage in Kenya. Furthermore, smartphone penetration in the region is steadily increasing, thus increasing the
sophistication of viable digital service offerings.
Given the acceptance of fintech by the Kenyan population, a possible route to entry in the consumer market is to acquire
one of the many smaller fintech firms in the industry. This would resolve some of the primary barriers to entry, most
specifically bureaucratic red tape and a lack of local knowledge.
On the corporate side, the most effective route to entry is likely through partnerships with smaller local resellers. This
model is already popular in the Kenyan market. A key differentiating feature here will be how well the service adapted to
the Kenyan market.
Digital Market Overview: Kenya
25All rights reserved © 2018 Frost & Sullivan
CYBERSECURITY SERVICES
Market Overview
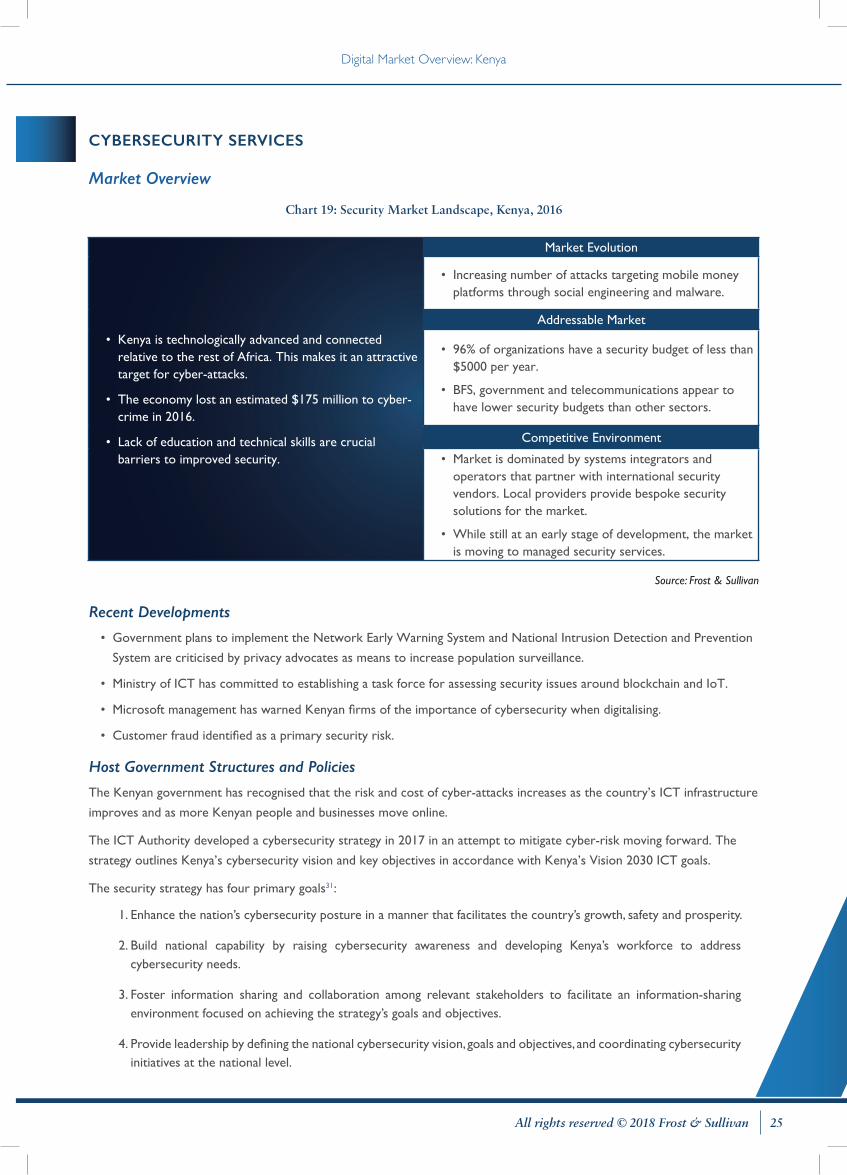
Chart 19: Security Market Landscape, Kenya, 2016
• Kenya is technologically advanced and connected relative to the rest of Africa. This makes it an attractive target for cyber-attacks.
• The economy lost an estimated $175 million to cyber-crime in 2016.
• Lack of education and technical skills are crucial barriers to improved security.
Market Evolution
• Increasing number of attacks targeting mobile money platforms through social engineering and malware.
Addressable Market
• 96% of organizations have a security budget of less than $5000 per year.
• BFS, government and telecommunications appear to have lower security budgets than other sectors.
Competitive Environment
• Market is dominated by systems integrators and operators that partner with international security vendors. Local providers provide bespoke security solutions for the market.
• While still at an early stage of development, the market is moving to managed security services.
Source: Frost & Sullivan
Recent Developments
• Government plans to implement the Network Early Warning System and National Intrusion Detection and Prevention
System are criticised by privacy advocates as means to increase population surveillance.
• Ministry of ICT has committed to establishing a task force for assessing security issues around blockchain and IoT.
• Microsoft management has warned Kenyan firms of the importance of cybersecurity when digitalising.
• Customer fraud identified as a primary security risk.
Host Government Structures and Policies
The Kenyan government has recognised that the risk and cost of cyber-attacks increases as the country’s ICT infrastructure
improves and as more Kenyan people and businesses move online.
The ICT Authority developed a cybersecurity strategy in 2017 in an attempt to mitigate cyber-risk moving forward. The
strategy outlines Kenya’s cybersecurity vision and key objectives in accordance with Kenya’s Vision 2030 ICT goals.
The security strategy has four primary goals31:
1. Enhance the nation’s cybersecurity posture in a manner that facilitates the country’s growth, safety and prosperity.
2. Build national capability by raising cybersecurity awareness and developing Kenya’s workforce to address cybersecurity needs.
3. Foster information sharing and collaboration among relevant stakeholders to facilitate an information-sharing environment focused on achieving the strategy’s goals and objectives.
4. Provide leadership by defining the national cybersecurity vision, goals and objectives, and coordinating cybersecurity initiatives at the national level.
Digital Market Overview: Kenya
26 All rights reserved © 2018 Frost & Sullivan
Increased political awareness of cyber-risks should result in heightened awareness of the problem in Kenyan businesses.
Small ICT budgets, especially in smaller firms, will remain a barrier to adoption.
Kenya is relatively advanced in terms of cybersecurity policy. The Information and Communications Act of 1998 mandated
the creation of a national cybersecurity management framework through the establishment of a national Computer
Incidence Response Team (CIRT). The National Kenya Computer Incidence Response Team Coordination Centre (
National KE-CIRT/CC) is mandated with coordinating the response to and management of cybersecurity incidents
nationally and to collaborate with relevant local, regional and international actors32.
Market Size and Forecast
The demand for cybersecurity services in Kenya varies greatly with the size of organisation under consideration.
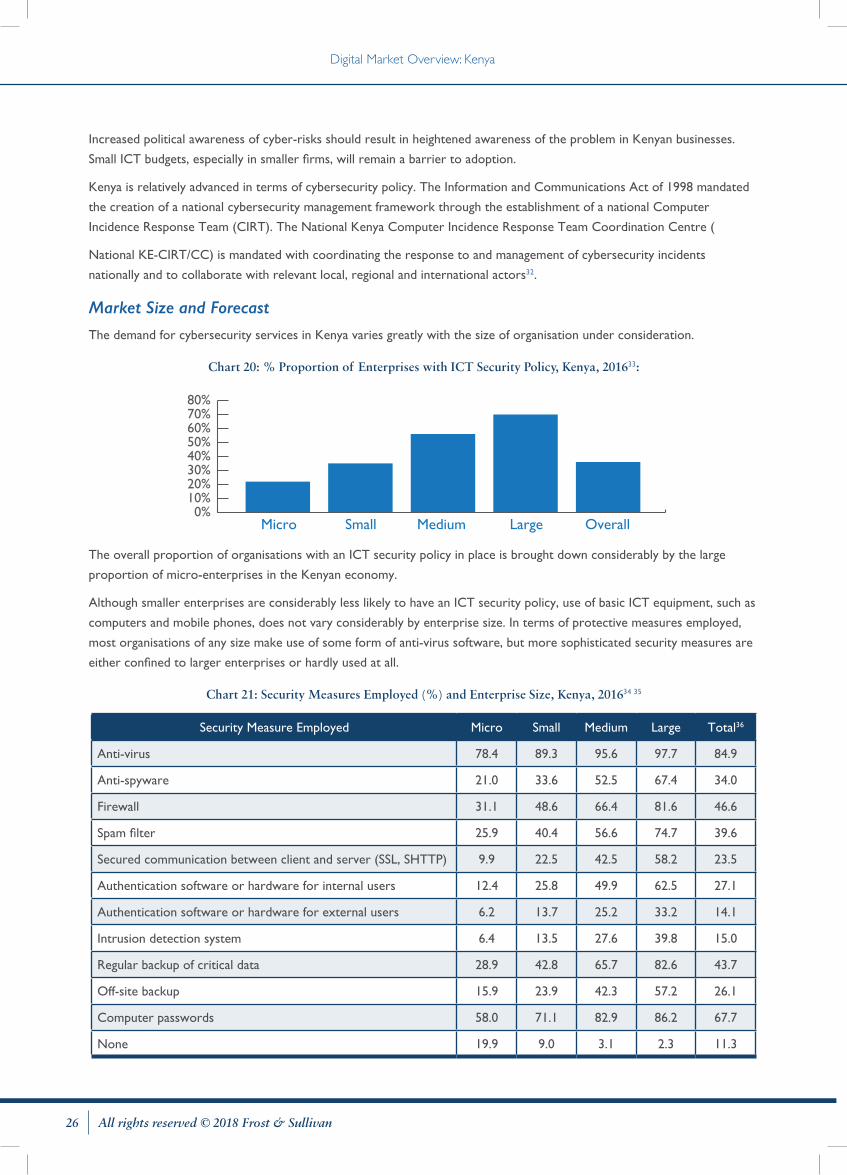
Chart 20: % Proportion of Enterprises with ICT Security Policy, Kenya, 201633:
0%10%20%30%40%50%60%70%80%
Micro Small Medium Large Overall
The overall proportion of organisations with an ICT security policy in place is brought down considerably by the large
proportion of micro-enterprises in the Kenyan economy.
Although smaller enterprises are considerably less likely to have an ICT security policy, use of basic ICT equipment, such as
computers and mobile phones, does not vary considerably by enterprise size. In terms of protective measures employed,
most organisations of any size make use of some form of anti-virus software, but more sophisticated security measures are
either confined to larger enterprises or hardly used at all.
Chart 21: Security Measures Employed (%) and Enterprise Size, Kenya, 201634 35
Security Measure Employed Micro Small Medium Large Total36
Anti-virus 78.4 89.3 95.6 97.7 84.9
Anti-spyware 21.0 33.6 52.5 67.4 34.0
Firewall 31.1 48.6 66.4 81.6 46.6
Spam filter 25.9 40.4 56.6 74.7 39.6
Secured communication between client and server (SSL, SHTTP) 9.9 22.5 42.5 58.2 23.5
Authentication software or hardware for internal users 12.4 25.8 49.9 62.5 27.1
Authentication software or hardware for external users 6.2 13.7 25.2 33.2 14.1
Intrusion detection system 6.4 13.5 27.6 39.8 15.0
Regular backup of critical data 28.9 42.8 65.7 82.6 43.7
Off-site backup 15.9 23.9 42.3 57.2 26.1
Computer passwords 58.0 71.1 82.9 86.2 67.7
None 19.9 9.0 3.1 2.3 11.3

Digital Market Overview: Kenya
27All rights reserved © 2018 Frost & Sullivan
As evident from Chart 21, there is a high level of use of basic anti-virus software across all firms. This suggests that growth
in the cybersecurity market will be driven by other factors. These are likely to be cloud-based spyware, firewall backup
facilities for smaller enterprises, and authentication and intrusion detection for large enterprises.
Market Size and Forecast
Chart 22: Cybersecurity Market Revenue Forecast, 2016–2022 ($US Millions)
2016 2017 2018 2019 2020 2021
Government
Commercial$29 $31 $33 $35 $37 $39
$329 $349 $371 $395 $420 $446
2022
$42
$475
$0
$100
$200
$300
$400
$500
$600
Source: Frost & Sullivan
Kenya’s commercial cybersecurity market is expected to grow from an estimated $329 million in 2016 to $475 million in
2022. This is driven by increasing threats as cyber becomes a greater priority across financial services and telecoms. Whilst
the government lags behind larger African countries such as Nigeria and Kenya, greater engagement will see a slow increase
in expenditure of $ million to $42 million in 2022.
Competitive Analysis
Kenya’s cybersecurity market is primarily made up of local and international firms that re-sell services from large security
providers such as AVG, Kaspersky and Fortinet as well as providing consulting services. The exact nature of competition in
the market is difficult to assess due to security services frequently being bundled with other IT services and due to these
services often being purchased by means of cross-border electronic transactions. As the member states of the World
Trade Organisation maintain a moratorium on the discussion of customs duties on eCommerce, countries do not keep
records of imports and exports of security services.
Although the banking and financial services sector is reportedly most at risk of cyber-attacks in Kenya, an estimated
77% of these organisations have a dedicated security budget of less than $1,000 per year. In addition 87% of
government departments and 77% of telecommunication organisations also have a dedicated security budget of less
than $1000 per year37.
This suggests that while about 62% of organisations in these sectors have experienced cyber-crime, they have not yet split
security into a separate budget item. This will constitute a challenge to security providers as security will have to compete
with various other services for its share of funding. Furthermore, security services are often viewed as a cost centre and,
whilst they may save a business a considerable amount of money, they do not further the businesses growth.
Digital Market Overview: Kenya
28 All rights reserved © 2018 Frost & Sullivan
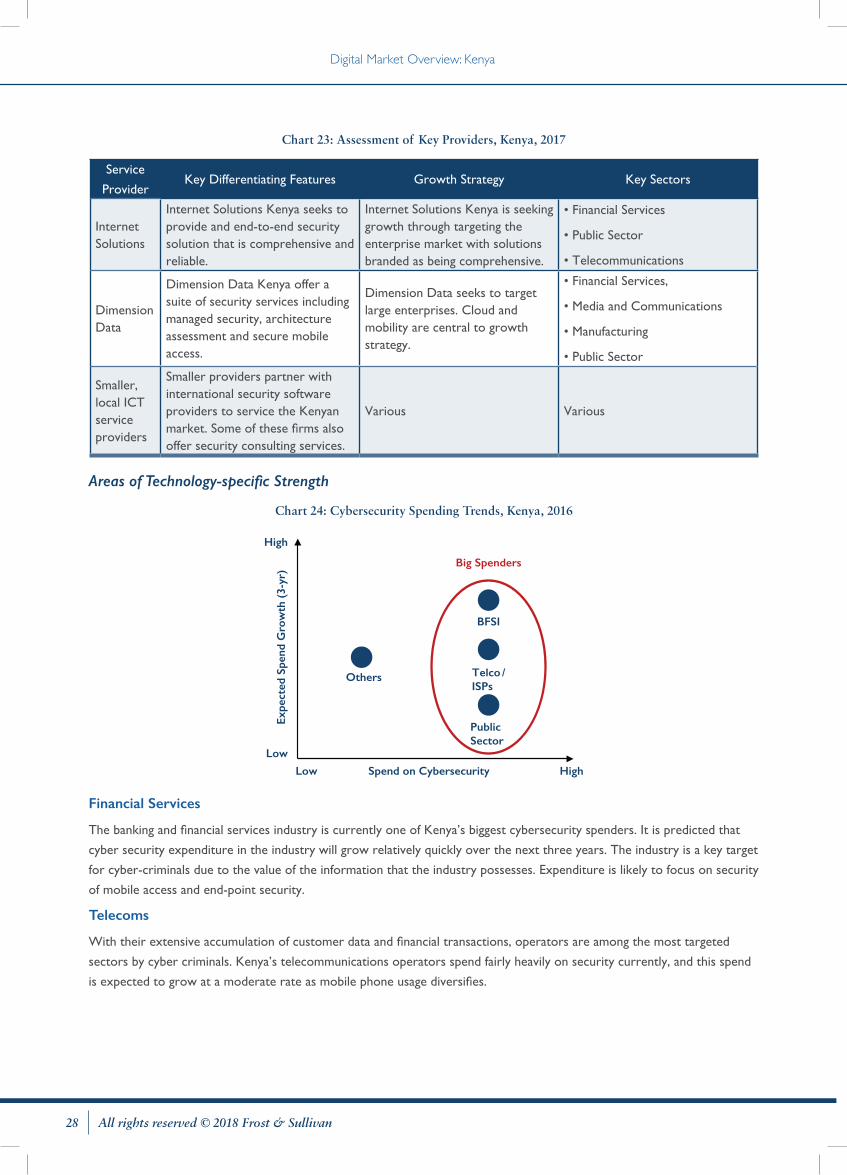
Chart 23: Assessment of Key Providers, Kenya, 2017
Service
ProviderKey Differentiating Features Growth Strategy Key Sectors
Internet Solutions
Internet Solutions Kenya seeks to provide and end-to-end security solution that is comprehensive and reliable.
Internet Solutions Kenya is seeking growth through targeting the enterprise market with solutions branded as being comprehensive.
• Financial Services
• Public Sector
• Telecommunications
Dimension Data
Dimension Data Kenya offer a suite of security services including managed security, architecture assessment and secure mobile access.
Dimension Data seeks to target large enterprises. Cloud and mobility are central to growth strategy.
• Financial Services,
• Media and Communications
• Manufacturing
• Public Sector
Smaller, local ICT service providers
Smaller providers partner with international security software providers to service the Kenyan market. Some of these firms also offer security consulting services.
Various Various
Areas of Technology-specific Strength
Chart 24: Cybersecurity Spending Trends, Kenya, 2016
Low
Low
PublicSector
Spend on Cybersecurity
Expe
cted
Spe
nd G
row
th (
3-yr
)
High
High
Big Spenders
Others
BFSI
Telco /ISPs
Financial Services
The banking and financial services industry is currently one of Kenya’s biggest cybersecurity spenders. It is predicted that
cyber security expenditure in the industry will grow relatively quickly over the next three years. The industry is a key target
for cyber-criminals due to the value of the information that the industry possesses. Expenditure is likely to focus on security
of mobile access and end-point security.
Telecoms
With their extensive accumulation of customer data and financial transactions, operators are among the most targeted
sectors by cyber criminals. Kenya’s telecommunications operators spend fairly heavily on security currently, and this spend
is expected to grow at a moderate rate as mobile phone usage diversifies.

Digital Market Overview: Kenya
29All rights reserved © 2018 Frost & Sullivan
Government and Public Sector
Although government does not appear to publish their cyber security expenditure, it is more advanced in cyber security
policy and engagement than other sectors. Despite the public sector remaining a key target for cyber attack, there is no
indication that there will be a sudden increase in funding for cyber security solutions in government as budget constraints
restrict growth.
Opportunities for UK Firms
The primary need in the Kenyan cybersecurity market revolve around the provision of anti-spyware, firewall and
back-up services for smaller enterprises, and more advanced services, such as authentication and intrusion detection,
for larger enterprises.
Mobile security is also likely to become a more important area as more and more business-critical functions are conducted
using mobile devices.
Areas Where the UK has a Specific Strength in the Country The UK does not appear to have any firms with physical operations in Kenya that provide cybersecurity services. The actual
market presence of UK firms is not possible to assess due to the frequency with which these services are ordered and
delivered online.
Route to Market and Challenges to EntryThe most promising route-to-market strategies will involve considerable marketing of the service in Kenya. Notably,
a physical presence in the country is not likely required, and services could either be sold through partnerships or
exclusively online. The online nature of the security market makes marketing vital due to brand recognition. Security
spending in Kenya believed to be about to increase as the country becomes more digitalised. It is likely that mobile
cloud-based security in particular will be in high demand.

Digital Market Overview: Kenya
1. International Monetary Fund - www.imf.org/external/datamapper
2. CIA World Factbook
3. Frost & Sullivan
4. World Bank - data.worldbank.org
5. Population Pyramid - www.populationpyramid.net/kenya/2017
6. Ibid
7. Ibid
8. The Kenya Standard - www.standardmedia.co.ke/politics
9. Transparency international Corruption Perceptions Index: https://www.transparency.org/news/feature/corruption_perceptions_index_2017
10. The World Bank - data.worldbank.org
11. The World Bank Ease of Doing Business Index - www.doingbusiness.org/rankings
12. CIA World Factbook - www.cia.gov/library/publications/the-world-factbook
13. Communications Authority of Kenya - ca.go.ke/index.php/statistics
14. Oxford Business Group - oxfordbusinessgroup.com/overview/duties-detail-look-tax-regulation-and-recent-changes
15. http://www.ict.go.ke/wp-content/uploads/2016/04/MinistryStrategic.pdf
16. Kenya Communications Authority - ca.go.ke/index.php/statistics
17. CIA World Factbook - www.cia.gov/library/publications/the-world-factbook
18. Safaricom Annual Report 2017 - www.safaricom.co.ke/investor-relation/financials/reports/annual-reports
19. The World Bank - data.worldbank.org
20. CIA World Factbook - www.cia.gov/library/publications/the-world-factbook
21. International Monetary Fund - data.imf.org
22. Liquid Telecom - www.liquidtelecom.com/information-centre/innovation-blog/free-wifi-hotspots.html
23. Frost & Sullivan
24. ITweb Africa - www.itwebafrica.com/mobilex/309-kenya/232712-kenya-officially-gives-green-light-to-three-mvnos
25. Kenya Communications Authority - ca.go.ke/index.php/statistics
26. Kenya Communications Authority - ca.go.ke/index.php/statistics
27. Kenya Communications Authority - ca.go.ke/index.php/statistics
28. Business Daily Africa - www.businessdailyafrica.com/corporate/Why-Kenya-is-yet-to-fully-embrace-cloud-computing
29. International Monetary Fund - /data.imf.org
30. Kenya Central Bank - www.centralbank.go.ke/national-payments-system
31. Kenyan Ministry of Information, Communications and Technology - icta.go.ke/national-cyber-security-strategy/
32. Ibid
33. Serianu Kenya Cyber Security Report 2016 – www.serianu.com/downloads/KenyaCyberSecurityReport2016.pdf
34. Note that firms that do not have an official security policy (see Chart 20) may still employ security measures of some type.
35. Serianu Kenya Cyber Security Report 2016 – www.serianu.com/downloads/KenyaCyberSecurityReport2016.pdf
36. Note that the ‘Total’ column is the average across all firms and this gives more weight to small and medium enterprises as there are far more of these in the Kenyan market.
37. Serianu Kenya Cyber Security Report 2016 – www.serianu.com/downloads/KenyaCyberSecurityReport2016.pdf
E N D N OT E S

Frost & Sullivan, the Growth Partnership Company, works in collaboration with clients to leverage visionary innovation
that addresses the global challenges and related growth opportunities that will make or break today’s market
participants. For more than 50 years, we have been developing growth strategies for the Global 1000, emerging
businesses, the public sector and the investment community. Is your organization prepared for the next profound wave
of industry convergence, disruptive technologies, increasing competitive intensity, Mega Trends, breakthrough best
practices, changing customer dynamics and emerging economies?
For information regarding permission, write:
Frost & Sullivan
3211 Scott Blvd
Santa Clara CA, 95054
Schedule a meeting with our global team to experience our
thought leadership and to integrate your ideas, opportunities and
challenges into the discussion.
Visit our Digital Transformation web page.
Interested in learning more about the topics covered in this white
paper? Call us at 877.GoFrost and reference the paper you’re
interested in. We’ll have an analyst get in touch with you.
Attend one of our Growth Innovation & Leadership (GIL)
events to unearth hidden growth opportunities.
NE X T STEPS
Silicon Valley 3211 Scott Blvd Santa Clara, CA 95054 Tel +1 650.475.4500 Fax +1 650.475.1571
San Antonio 7550 West Interstate 10, Suite 400, San Antonio, Texas 78229-5616 Tel +1 210.348.1000 Fax +1 210.348.1003
London Floor 3 - Building 5, Chiswick Business Park 566 Chiswick High Road, London W4 5YF Tel +44 (0)20 8996 8500 Fax +44 (0)20 8994 1389
877.GoFrost • [email protected]://www.frost.com