differential responses of abandoned wet grassland plant communities to reinstated cutting management
TRANSCRIPT
WETLAND SERVICES AND MANAGEMENT
Differential responses of abandoned wet grassland plantcommunities to reinstated cutting management
Maureen Berg • Chris Joyce • Niall Burnside
Received: 25 November 2010 / Accepted: 15 July 2011 / Published online: 19 August 2011
� Springer Science+Business Media B.V. 2011
Abstract The nature of ecological stability is still
debated, and there is a need to establish which types
of communities show resistance to environmental
change and to explore community responses in
relation to their environmental context. This study
aims to investigate the effects of reinstating cutting
management on abandoned wet grasslands by com-
paring responses in two different communities with
contrasting environmental conditions, to elucidate the
restoration potential of wet grasslands. Two coastal
wet grassland plant communities in Estonia were
monitored over 5 years: a species-poor lower shore
grassland and a more diverse tall grassland. Piezom-
eters and soil samples were used to characterise the
hydrology, while cutting effects and ongoing aban-
donment were compared using replicate quadrats in
both grasslands. Annual changes and significant
differences in community composition were analysed
using Detrended and Canonical Correspondence
Analyses, diversity indices, and inferential statistics.
The results showed that cutting produced greater
changes in composition and species abundance in the
lower shore community compared to the tall grass-
land, including a greater proportion of significant
differences. The increased responsiveness of the
lower shore community may be related to its variable
hydrological regime, especially flooding, which cre-
ates a dynamic environment favouring adaptable
species. In contrast, the tall grassland featured a more
stable water regime and species that responded less to
perturbation, and manifested resistance to cutting
management. Thus, restoring abandoned wet grass-
lands through vegetation management may be a
slow process, especially where there is residual
diversity, and the importance of hydrological regime
in determining wet grassland communities should be
considered.
Keywords Abandonment � Ecological stability �Diversity � Management � Restoration � Wetland
Introduction
Understanding the dynamics and stability of ecolog-
ical systems has had a long and controversial history
(e.g. May, 1973; Pimm, 1984), and more recently has
been associated with a debate about the role of
Electronic supplementary material The online version ofthis article (doi:10.1007/s10750-011-0826-x) containssupplementary material, which is available to authorized users.
Guest editor: Chris B. Joyce / Wetland services and
management
M. Berg
School of Pharmacy and Biomolecular Sciences,
University of Brighton, Brighton, UK
C. Joyce (&) � N. Burnside
School of Environment and Technology,
University of Brighton, Brighton, UK
e-mail: [email protected]
123
Hydrobiologia (2012) 692:83–97
DOI 10.1007/s10750-011-0826-x
diversity in ecosystem functioning (e.g. Kinzig et al.,
2001; Loreau et al., 2002; Naeem et al., 2009). A key
mechanism for increased functioning and stability in
biological systems is believed to be niche comple-
mentarity, which relates to the greater efficiency of
resource use by a community of species whose
functional traits are different. Compensatory dynam-
ics exist when increases in the abundance of one
species are associated with decreases of another
species (Gonzalez & Loreau, 2009). Thus, it is
suggested that species-rich communities are more
capable of buffering environmental variability than
species-poor communities and that a loss of biodiver-
sity can reduce ecosystem resistance against ecolog-
ical perturbation (Naeem et al., 1994). Plant strategies
may also be important, with some species being able
to gain a competitive advantage from disturbance,
while others are favoured by undisturbed conditions
(Grime, 1979). However, there is still a need to
establish which types of communities show resistance
to environmental change and to explore community
responses in relation to their environmental context
(Kinzig et al., 2001; Grman et al., 2010).
Wet grassland ecosystems combine wetland and
semi-natural grassland properties, with plant commu-
nity composition largely determined by hydrological
regime and management practices, such as grazing or
mowing for agriculture (Joyce & Wade, 1998).
Typical plant species are functionally adapted to the
prevailing hydroperiod, including any flooding, and
are able to tolerate defoliation. Plants are therefore
good indicators of ecosystem functioning and plant
communities have been used to assess and monitor
environmental perturbations and changes (Diekmann,
2003). Regular wet grassland management favours
open habitats with species-rich, low-growing herba-
ceous vegetation that supports considerable biodiver-
sity (e.g. wading birds and wildfowl) and is of
importance for nature conservation. A lack of man-
agement due to neglect or abandonment will lead to
more competitive species of larger stature forming a
dense canopy, such as Phragmites australis, displac-
ing smaller species and reducing diversity (Burnside
et al., 2007). Abandonment of formerly managed
grasslands is a widespread phenomenon due to
changing economic and social conditions, for exam-
ple, in Europe where approximately 15 million
hectares have been abandoned (Benstead et al.,
1999), resulting in concerns over losses of grassland
communities of nature conservation value and an
urgency to restore degraded grasslands.
Restoration of the wet grassland resource focuses
upon rewetting sites and/or reinstating vegetation
management to encourage characteristic species and
enhance diversity (Toogood & Joyce, 2009). Rein-
stating management, such as cutting, to abandoned
vegetation may increase disturbance levels, provok-
ing responses in plant species richness and abundance
(Gerard et al., 2008). Joyce (1998) found that an
inundation grassland community characterised by
short-lived species responded rapidly to perturbations
while a flood-meadow community comprising peren-
nial plants was resistant to abandonment, but gener-
ally wet grassland community dynamics have not
been well documented in relation to restoration
management. The aim of this study was to investigate
the effects of reinstating cutting management on
abandoned wet grasslands by comparing responses in
two different communities with contrasting environ-
mental contexts, to elucidate the restoration potential
of wet grasslands. The field study was undertaken in
west Estonia, where coastal wet grasslands are of
international conservation significance for their bio-
diversity, including rare plants and breeding and
migratory birds, but are threatened by grazing and
cutting abandonment because of agricultural and
socio-political changes in recent decades (Burnside
et al., 2007). Plant communities were monitored for
5 years by measuring the abundance of species to
interpret changes in diversity and composition.
Methods
Study area
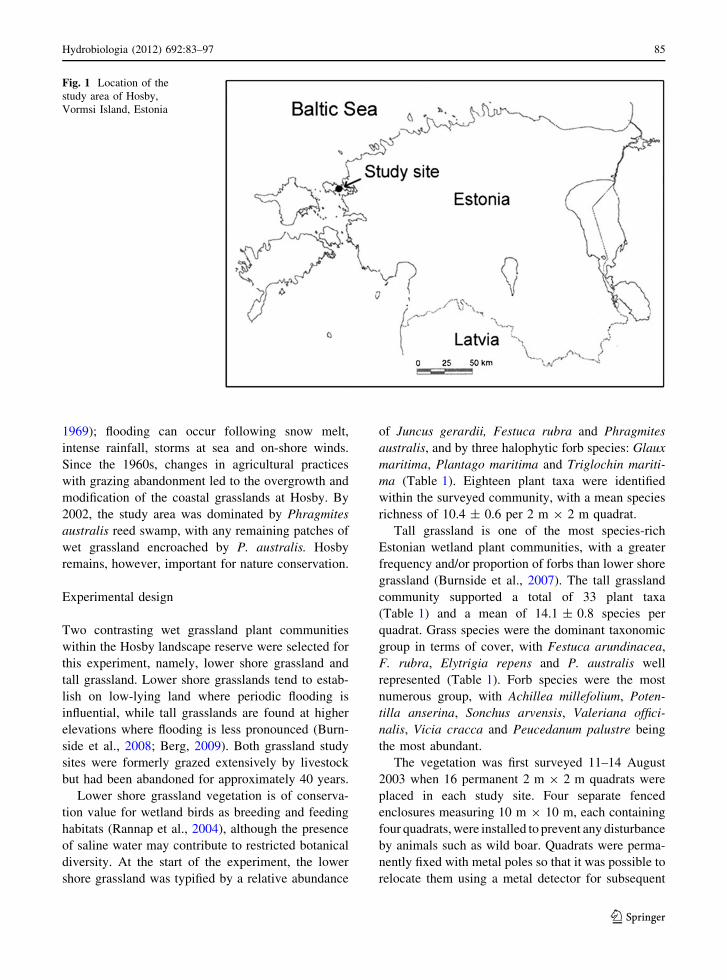
The study area was located within the landscape
reserve of Hosby (58�5900600N, 23�2201200E), on
Vormsi island, west Estonia (Fig. 1). The reserve
comprises 136 ha and is designated for the wet
grassland and other wetland habitats it sustains, and
the protected plants and birds. The topography of the
study area varies between 0.5 and 0.8 m a.s.l. and the
substrate is composed of marine sands covered by
saline littoral soil. The hydrology at Hosby is
dominated by precipitation and the proximity of the
Baltic Sea, which, in western Estonia, has a small
tidal range and a salinity of generally \6% (Tyler,
84 Hydrobiologia (2012) 692:83–97
123
1969); flooding can occur following snow melt,
intense rainfall, storms at sea and on-shore winds.
Since the 1960s, changes in agricultural practices
with grazing abandonment led to the overgrowth and
modification of the coastal grasslands at Hosby. By
2002, the study area was dominated by Phragmites
australis reed swamp, with any remaining patches of
wet grassland encroached by P. australis. Hosby
remains, however, important for nature conservation.
Experimental design
Two contrasting wet grassland plant communities
within the Hosby landscape reserve were selected for
this experiment, namely, lower shore grassland and
tall grassland. Lower shore grasslands tend to estab-
lish on low-lying land where periodic flooding is
influential, while tall grasslands are found at higher
elevations where flooding is less pronounced (Burn-
side et al., 2008; Berg, 2009). Both grassland study
sites were formerly grazed extensively by livestock
but had been abandoned for approximately 40 years.
Lower shore grassland vegetation is of conserva-
tion value for wetland birds as breeding and feeding
habitats (Rannap et al., 2004), although the presence
of saline water may contribute to restricted botanical
diversity. At the start of the experiment, the lower
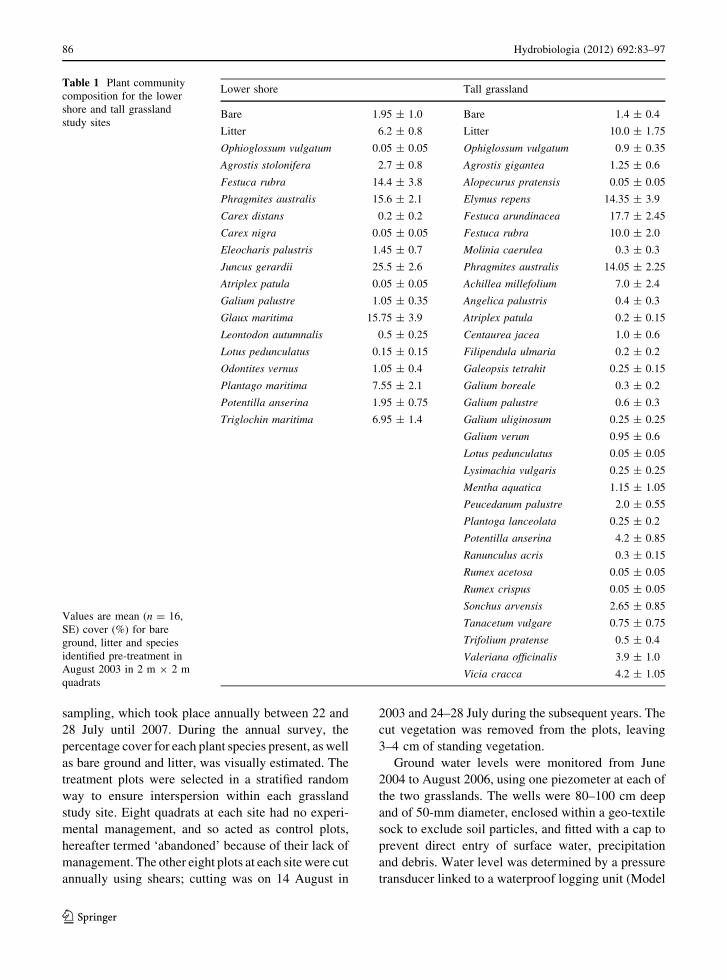
shore grassland was typified by a relative abundance
of Juncus gerardii, Festuca rubra and Phragmites
australis, and by three halophytic forb species: Glaux
maritima, Plantago maritima and Triglochin mariti-
ma (Table 1). Eighteen plant taxa were identified
within the surveyed community, with a mean species
richness of 10.4 ± 0.6 per 2 m 9 2 m quadrat.
Tall grassland is one of the most species-rich
Estonian wetland plant communities, with a greater
frequency and/or proportion of forbs than lower shore
grassland (Burnside et al., 2007). The tall grassland
community supported a total of 33 plant taxa
(Table 1) and a mean of 14.1 ± 0.8 species per
quadrat. Grass species were the dominant taxonomic
group in terms of cover, with Festuca arundinacea,
F. rubra, Elytrigia repens and P. australis well
represented (Table 1). Forb species were the most
numerous group, with Achillea millefolium, Poten-
tilla anserina, Sonchus arvensis, Valeriana offici-
nalis, Vicia cracca and Peucedanum palustre being
the most abundant.
The vegetation was first surveyed 11–14 August
2003 when 16 permanent 2 m 9 2 m quadrats were
placed in each study site. Four separate fenced
enclosures measuring 10 m 9 10 m, each containing
four quadrats, were installed to prevent any disturbance
by animals such as wild boar. Quadrats were perma-
nently fixed with metal poles so that it was possible to
relocate them using a metal detector for subsequent
Fig. 1 Location of the
study area of Hosby,
Vormsi Island, Estonia
Hydrobiologia (2012) 692:83–97 85
123
sampling, which took place annually between 22 and
28 July until 2007. During the annual survey, the
percentage cover for each plant species present, as well
as bare ground and litter, was visually estimated. The
treatment plots were selected in a stratified random
way to ensure interspersion within each grassland
study site. Eight quadrats at each site had no experi-
mental management, and so acted as control plots,
hereafter termed ‘abandoned’ because of their lack of
management. The other eight plots at each site were cut
annually using shears; cutting was on 14 August in
2003 and 24–28 July during the subsequent years. The
cut vegetation was removed from the plots, leaving
3–4 cm of standing vegetation.
Ground water levels were monitored from June
2004 to August 2006, using one piezometer at each of
the two grasslands. The wells were 80–100 cm deep
and of 50-mm diameter, enclosed within a geo-textile
sock to exclude soil particles, and fitted with a cap to
prevent direct entry of surface water, precipitation
and debris. Water level was determined by a pressure
transducer linked to a waterproof logging unit (Model
Table 1 Plant community
composition for the lower
shore and tall grassland
study sites
Values are mean (n = 16,
SE) cover (%) for bare
ground, litter and species
identified pre-treatment in
August 2003 in 2 m 9 2 m
quadrats
Lower shore Tall grassland
Bare 1.95 ± 1.0 Bare 1.4 ± 0.4
Litter 6.2 ± 0.8 Litter 10.0 ± 1.75
Ophioglossum vulgatum 0.05 ± 0.05 Ophiglossum vulgatum 0.9 ± 0.35
Agrostis stolonifera 2.7 ± 0.8 Agrostis gigantea 1.25 ± 0.6
Festuca rubra 14.4 ± 3.8 Alopecurus pratensis 0.05 ± 0.05
Phragmites australis 15.6 ± 2.1 Elymus repens 14.35 ± 3.9
Carex distans 0.2 ± 0.2 Festuca arundinacea 17.7 ± 2.45
Carex nigra 0.05 ± 0.05 Festuca rubra 10.0 ± 2.0
Eleocharis palustris 1.45 ± 0.7 Molinia caerulea 0.3 ± 0.3
Juncus gerardii 25.5 ± 2.6 Phragmites australis 14.05 ± 2.25
Atriplex patula 0.05 ± 0.05 Achillea millefolium 7.0 ± 2.4
Galium palustre 1.05 ± 0.35 Angelica palustris 0.4 ± 0.3
Glaux maritima 15.75 ± 3.9 Atriplex patula 0.2 ± 0.15
Leontodon autumnalis 0.5 ± 0.25 Centaurea jacea 1.0 ± 0.6
Lotus pedunculatus 0.15 ± 0.15 Filipendula ulmaria 0.2 ± 0.2
Odontites vernus 1.05 ± 0.4 Galeopsis tetrahit 0.25 ± 0.15
Plantago maritima 7.55 ± 2.1 Galium boreale 0.3 ± 0.2
Potentilla anserina 1.95 ± 0.75 Galium palustre 0.6 ± 0.3
Triglochin maritima 6.95 ± 1.4 Galium uliginosum 0.25 ± 0.25
Galium verum 0.95 ± 0.6
Lotus pedunculatus 0.05 ± 0.05
Lysimachia vulgaris 0.25 ± 0.25
Mentha aquatica 1.15 ± 1.05
Peucedanum palustre 2.0 ± 0.55
Plantoga lanceolata 0.25 ± 0.2
Potentilla anserina 4.2 ± 0.85
Ranunculus acris 0.3 ± 0.15
Rumex acetosa 0.05 ± 0.05
Rumex crispus 0.05 ± 0.05
Sonchus arvensis 2.65 ± 0.85
Tanacetum vulgare 0.75 ± 0.75
Trifolium pratense 0.5 ± 0.4
Valeriana officinalis 3.9 ± 1.0
Vicia cracca 4.2 ± 1.05
86 Hydrobiologia (2012) 692:83–97
123
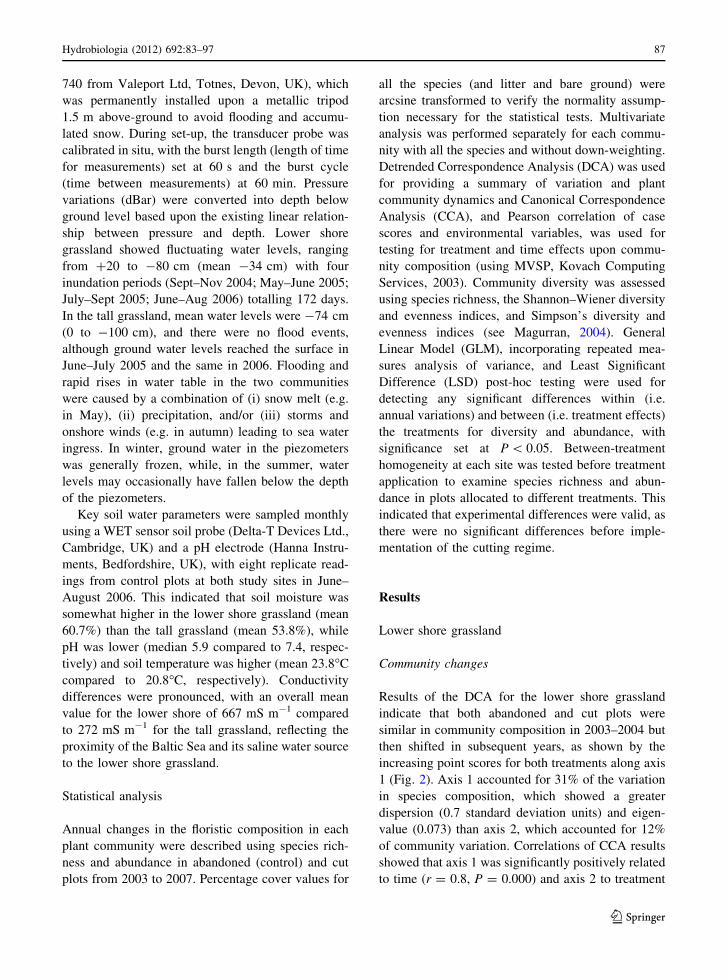
740 from Valeport Ltd, Totnes, Devon, UK), which
was permanently installed upon a metallic tripod
1.5 m above-ground to avoid flooding and accumu-
lated snow. During set-up, the transducer probe was
calibrated in situ, with the burst length (length of time
for measurements) set at 60 s and the burst cycle
(time between measurements) at 60 min. Pressure
variations (dBar) were converted into depth below
ground level based upon the existing linear relation-
ship between pressure and depth. Lower shore
grassland showed fluctuating water levels, ranging
from ?20 to -80 cm (mean -34 cm) with four
inundation periods (Sept–Nov 2004; May–June 2005;
July–Sept 2005; June–Aug 2006) totalling 172 days.
In the tall grassland, mean water levels were -74 cm
(0 to -100 cm), and there were no flood events,
although ground water levels reached the surface in
June–July 2005 and the same in 2006. Flooding and
rapid rises in water table in the two communities
were caused by a combination of (i) snow melt (e.g.
in May), (ii) precipitation, and/or (iii) storms and
onshore winds (e.g. in autumn) leading to sea water
ingress. In winter, ground water in the piezometers
was generally frozen, while, in the summer, water
levels may occasionally have fallen below the depth
of the piezometers.
Key soil water parameters were sampled monthly
using a WET sensor soil probe (Delta-T Devices Ltd.,
Cambridge, UK) and a pH electrode (Hanna Instru-
ments, Bedfordshire, UK), with eight replicate read-
ings from control plots at both study sites in June–
August 2006. This indicated that soil moisture was
somewhat higher in the lower shore grassland (mean
60.7%) than the tall grassland (mean 53.8%), while
pH was lower (median 5.9 compared to 7.4, respec-
tively) and soil temperature was higher (mean 23.8�C
compared to 20.8�C, respectively). Conductivity
differences were pronounced, with an overall mean
value for the lower shore of 667 mS m-1 compared
to 272 mS m-1 for the tall grassland, reflecting the
proximity of the Baltic Sea and its saline water source
to the lower shore grassland.
Statistical analysis
Annual changes in the floristic composition in each
plant community were described using species rich-
ness and abundance in abandoned (control) and cut
plots from 2003 to 2007. Percentage cover values for
all the species (and litter and bare ground) were
arcsine transformed to verify the normality assump-
tion necessary for the statistical tests. Multivariate
analysis was performed separately for each commu-
nity with all the species and without down-weighting.
Detrended Correspondence Analysis (DCA) was used
for providing a summary of variation and plant
community dynamics and Canonical Correspondence
Analysis (CCA), and Pearson correlation of case
scores and environmental variables, was used for
testing for treatment and time effects upon commu-
nity composition (using MVSP, Kovach Computing
Services, 2003). Community diversity was assessed
using species richness, the Shannon–Wiener diversity
and evenness indices, and Simpson’s diversity and
evenness indices (see Magurran, 2004). General
Linear Model (GLM), incorporating repeated mea-
sures analysis of variance, and Least Significant
Difference (LSD) post-hoc testing were used for
detecting any significant differences within (i.e.
annual variations) and between (i.e. treatment effects)
the treatments for diversity and abundance, with
significance set at P \ 0.05. Between-treatment
homogeneity at each site was tested before treatment
application to examine species richness and abun-
dance in plots allocated to different treatments. This
indicated that experimental differences were valid, as
there were no significant differences before imple-
mentation of the cutting regime.
Results
Lower shore grassland
Community changes
Results of the DCA for the lower shore grassland
indicate that both abandoned and cut plots were
similar in community composition in 2003–2004 but
then shifted in subsequent years, as shown by the
increasing point scores for both treatments along axis
1 (Fig. 2). Axis 1 accounted for 31% of the variation
in species composition, which showed a greater
dispersion (0.7 standard deviation units) and eigen-
value (0.073) than axis 2, which accounted for 12%
of community variation. Correlations of CCA results
showed that axis 1 was significantly positively related
to time (r = 0.8, P = 0.000) and axis 2 to treatment
Hydrobiologia (2012) 692:83–97 87
123
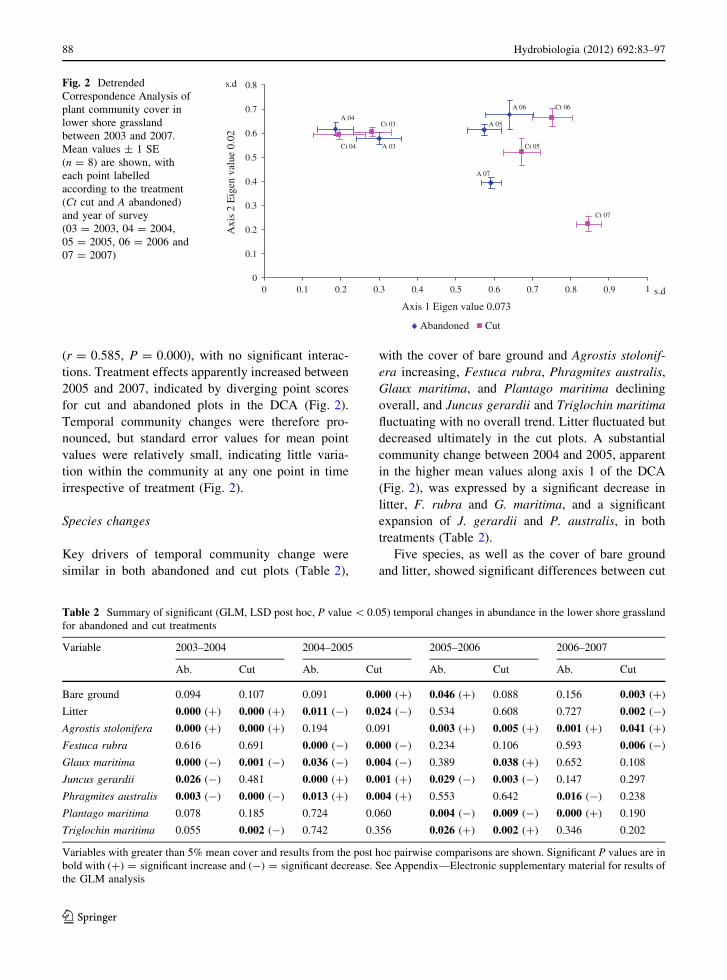
(r = 0.585, P = 0.000), with no significant interac-
tions. Treatment effects apparently increased between
2005 and 2007, indicated by diverging point scores
for cut and abandoned plots in the DCA (Fig. 2).
Temporal community changes were therefore pro-
nounced, but standard error values for mean point
values were relatively small, indicating little varia-
tion within the community at any one point in time
irrespective of treatment (Fig. 2).
Species changes
Key drivers of temporal community change were
similar in both abandoned and cut plots (Table 2),
with the cover of bare ground and Agrostis stolonif-
era increasing, Festuca rubra, Phragmites australis,
Glaux maritima, and Plantago maritima declining
overall, and Juncus gerardii and Triglochin maritima
fluctuating with no overall trend. Litter fluctuated but
decreased ultimately in the cut plots. A substantial
community change between 2004 and 2005, apparent
in the higher mean values along axis 1 of the DCA
(Fig. 2), was expressed by a significant decrease in
litter, F. rubra and G. maritima, and a significant
expansion of J. gerardii and P. australis, in both
treatments (Table 2).
Five species, as well as the cover of bare ground
and litter, showed significant differences between cut
0
0.1
0.2
0.3
0.4
0.5
0.6
0.7
0.8
0 0.1 0.2 0.3 0.4 0.5 0.6 0.7 0.8 0.9 1
Axis 1 Eigen value 0.073
Axi
s 2
Eig
en v
alue
0.0
2
Abandoned Cut
Ct 03
A 03
A 04
Ct 04
A 07
Ct 07
Ct 05
A 05
Ct 06A 06
s.d
s.dFig. 2 Detrended
Correspondence Analysis of
plant community cover in
lower shore grassland
between 2003 and 2007.
Mean values ± 1 SE
(n = 8) are shown, with
each point labelled
according to the treatment
(Ct cut and A abandoned)
and year of survey
(03 = 2003, 04 = 2004,
05 = 2005, 06 = 2006 and
07 = 2007)
Table 2 Summary of significant (GLM, LSD post hoc, P value \ 0.05) temporal changes in abundance in the lower shore grassland
for abandoned and cut treatments
Variable 2003–2004 2004–2005 2005–2006 2006–2007
Ab. Cut Ab. Cut Ab. Cut Ab. Cut
Bare ground 0.094 0.107 0.091 0.000 (?) 0.046 (?) 0.088 0.156 0.003 (?)
Litter 0.000 (?) 0.000 (?) 0.011 (-) 0.024 (-) 0.534 0.608 0.727 0.002 (-)
Agrostis stolonifera 0.000 (?) 0.000 (?) 0.194 0.091 0.003 (?) 0.005 (?) 0.001 (?) 0.041 (?)
Festuca rubra 0.616 0.691 0.000 (-) 0.000 (-) 0.234 0.106 0.593 0.006 (-)
Glaux maritima 0.000 (-) 0.001 (-) 0.036 (-) 0.004 (-) 0.389 0.038 (?) 0.652 0.108
Juncus gerardii 0.026 (-) 0.481 0.000 (?) 0.001 (?) 0.029 (-) 0.003 (-) 0.147 0.297
Phragmites australis 0.003 (-) 0.000 (-) 0.013 (?) 0.004 (?) 0.553 0.642 0.016 (-) 0.238
Plantago maritima 0.078 0.185 0.724 0.060 0.004 (-) 0.009 (-) 0.000 (?) 0.190
Triglochin maritima 0.055 0.002 (-) 0.742 0.356 0.026 (?) 0.002 (?) 0.346 0.202
Variables with greater than 5% mean cover and results from the post hoc pairwise comparisons are shown. Significant P values are in
bold with (?) = significant increase and (-) = significant decrease. See Appendix—Electronic supplementary material for results of
the GLM analysis
88 Hydrobiologia (2012) 692:83–97
123
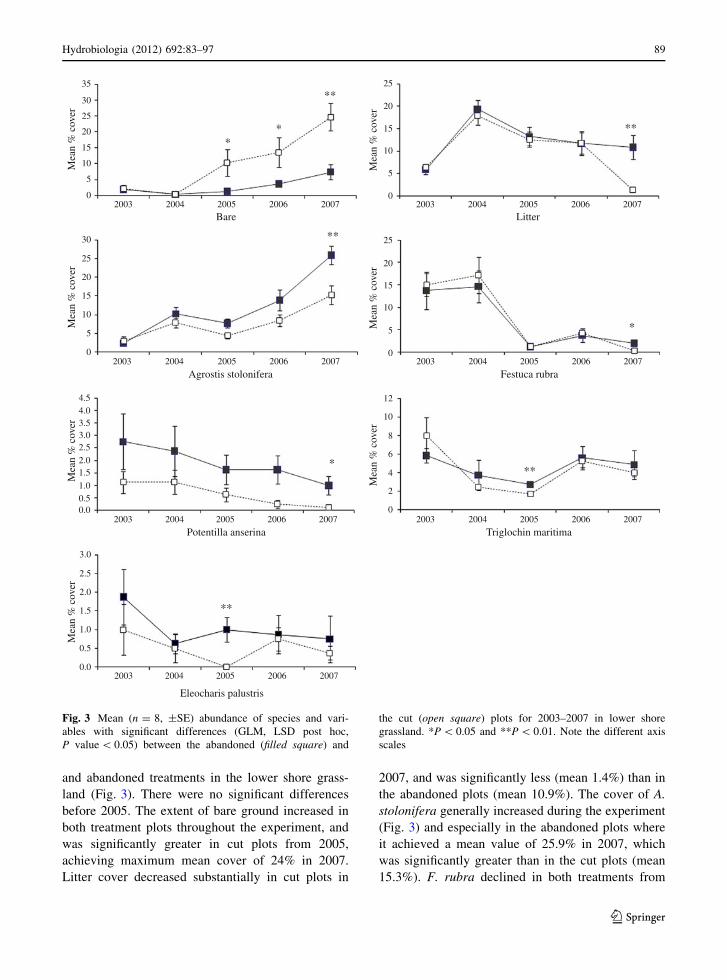
and abandoned treatments in the lower shore grass-
land (Fig. 3). There were no significant differences
before 2005. The extent of bare ground increased in
both treatment plots throughout the experiment, and
was significantly greater in cut plots from 2005,
achieving maximum mean cover of 24% in 2007.
Litter cover decreased substantially in cut plots in
2007, and was significantly less (mean 1.4%) than in
the abandoned plots (mean 10.9%). The cover of A.
stolonifera generally increased during the experiment
(Fig. 3) and especially in the abandoned plots where
it achieved a mean value of 25.9% in 2007, which
was significantly greater than in the cut plots (mean
15.3%). F. rubra declined in both treatments from
25
20
15
10
5
0
Mea
n %
cov
er
2003Bare
2004 2005 2006 2007 2003Litter
2004 2005 2006 2007
25
35
30
20
15
10
5
0
Mea
n %
cov
er
2003
Festuca rubra2004 2005 2006 2007
25
20
15
10
5
0
Mea
n %
cov
er
25
30
20
15
10
5
0
Mea
n %
cov
er
2003
Agrostis stolonifera2004 2005 2006 2007
10
12
8
6
4
2
0
Mea
n %
cov
er
2.5
3.54.04.5
3.0
2.01.5
1.00.50.0
Mea
n %
cov
er
2003
Potentilla anserina2004 2005 2006 2007 2003
Triglochin maritima2004 2005 2006 2007
2003
Eleocharis palustris
2004 2005 2006 2007
2.5
3.0
2.0
1.5
1.0
0.5
0.0
Mea
n %
cov
er
**
**
**
**
*
***
**
Fig. 3 Mean (n = 8, ±SE) abundance of species and vari-
ables with significant differences (GLM, LSD post hoc,
P value \ 0.05) between the abandoned (filled square) and
the cut (open square) plots for 2003–2007 in lower shore
grassland. *P \ 0.05 and **P \ 0.01. Note the different axis
scales
Hydrobiologia (2012) 692:83–97 89
123
approximately 15% mean cover before 2005 to \5%
thereafter, with significantly less in cut compared to
abandoned plots in 2007. Other species showing
significant differences had low levels of abundance
(Fig. 3); Potentilla anserina declined under both
treatments but was significantly more abundant in
abandoned plots in 2007, while the cover of T.
maritima and Eleocharis palustris was significantly
greater in abandoned compared to cut plots in 2005.
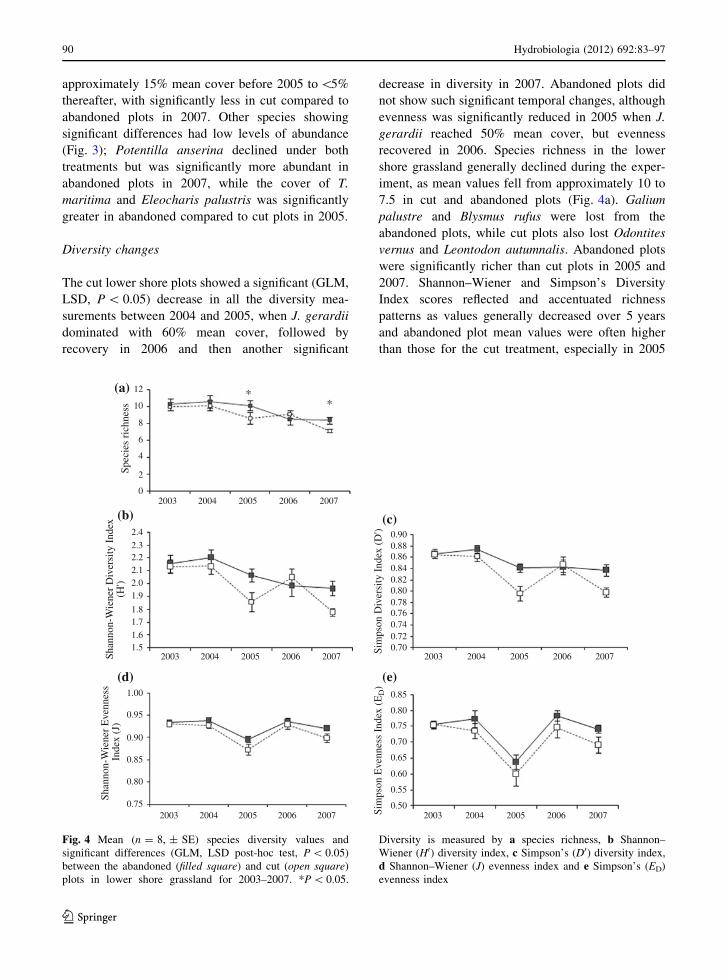
Diversity changes
The cut lower shore plots showed a significant (GLM,
LSD, P \ 0.05) decrease in all the diversity mea-
surements between 2004 and 2005, when J. gerardii
dominated with 60% mean cover, followed by
recovery in 2006 and then another significant
decrease in diversity in 2007. Abandoned plots did
not show such significant temporal changes, although
evenness was significantly reduced in 2005 when J.
gerardii reached 50% mean cover, but evenness
recovered in 2006. Species richness in the lower
shore grassland generally declined during the exper-
iment, as mean values fell from approximately 10 to
7.5 in cut and abandoned plots (Fig. 4a). Galium
palustre and Blysmus rufus were lost from the
abandoned plots, while cut plots also lost Odontites
vernus and Leontodon autumnalis. Abandoned plots
were significantly richer than cut plots in 2005 and
2007. Shannon–Wiener and Simpson’s Diversity
Index scores reflected and accentuated richness
patterns as values generally decreased over 5 years
and abandoned plot mean values were often higher
than those for the cut treatment, especially in 2005
12(a) *10
8
6
4
2
02003
2.4
2.32.22.12.01.9
1.81.7
1.61.5
Shan
non-
Wie
ner
Div
ersi
ty I
ndex
(H')
Shan
non-
Wie
ner
Eve
nnes
s In
dex
(J)
Sim
pson
Eve
nnes
s In
dex
(ED
)Si
mps
on D
iver
sity
Ind
ex (
D')
2004 2005 2006 2007
Spec
ies
rich
ness
2003 2004 2005 2006 2007
0.900.880.860.840.820.800.780.760.740.720.70
0.85
0.80
0.75
0.70
0.65
0.60
0.55
0.50
2003 2004 2005 2006 2007
20030.75
0.80
0.85
0.90
0.95
1.00
2004 2005 2006 2007 2003 2004 2005 2006 2007
*
(b)
(d) (e)
(c)
Fig. 4 Mean (n = 8, ± SE) species diversity values and
significant differences (GLM, LSD post-hoc test, P \ 0.05)
between the abandoned (filled square) and cut (open square)
plots in lower shore grassland for 2003–2007. *P \ 0.05.
Diversity is measured by a species richness, b Shannon–
Wiener (H0) diversity index, c Simpson’s (D0) diversity index,
d Shannon–Wiener (J) evenness index and e Simpson’s (ED)
evenness index
90 Hydrobiologia (2012) 692:83–97
123
and 2007 when cut plots had low scores (Fig. 4b, c).
However, there were no significant treatment differ-
ences for the diversity indices, or for the evenness
scores, which gave similar results for cut and
abandoned plots (Fig. 4d, e).
Tall grassland
Community changes
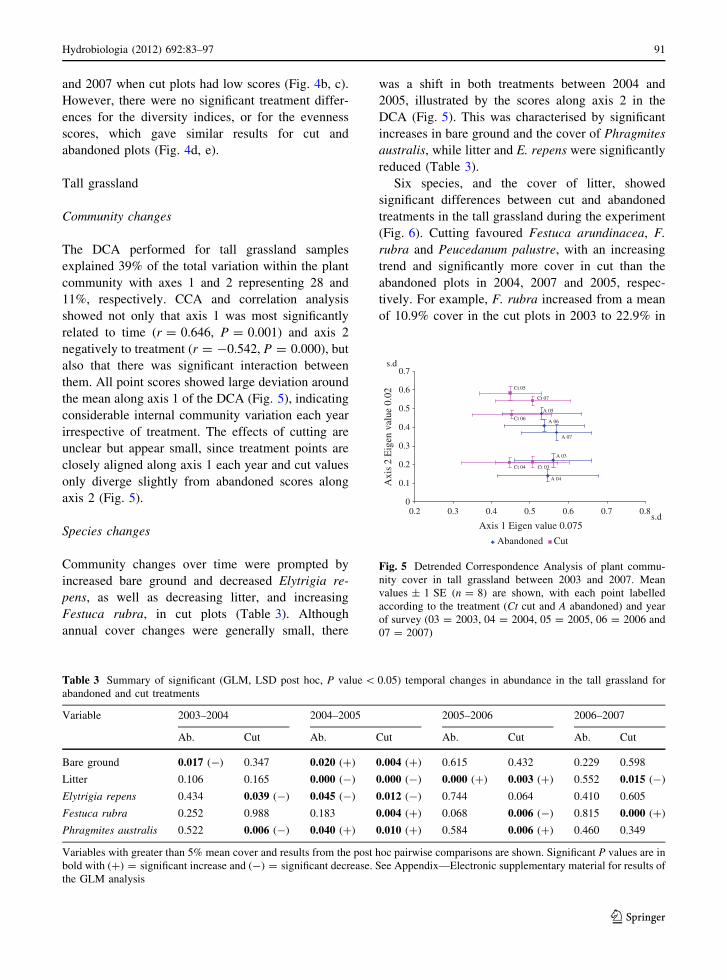
The DCA performed for tall grassland samples
explained 39% of the total variation within the plant
community with axes 1 and 2 representing 28 and
11%, respectively. CCA and correlation analysis
showed not only that axis 1 was most significantly
related to time (r = 0.646, P = 0.001) and axis 2
negatively to treatment (r = -0.542, P = 0.000), but
also that there was significant interaction between
them. All point scores showed large deviation around
the mean along axis 1 of the DCA (Fig. 5), indicating
considerable internal community variation each year
irrespective of treatment. The effects of cutting are
unclear but appear small, since treatment points are
closely aligned along axis 1 each year and cut values
only diverge slightly from abandoned scores along
axis 2 (Fig. 5).
Species changes
Community changes over time were prompted by
increased bare ground and decreased Elytrigia re-
pens, as well as decreasing litter, and increasing
Festuca rubra, in cut plots (Table 3). Although
annual cover changes were generally small, there
was a shift in both treatments between 2004 and
2005, illustrated by the scores along axis 2 in the
DCA (Fig. 5). This was characterised by significant
increases in bare ground and the cover of Phragmites
australis, while litter and E. repens were significantly
reduced (Table 3).
Six species, and the cover of litter, showed
significant differences between cut and abandoned
treatments in the tall grassland during the experiment
(Fig. 6). Cutting favoured Festuca arundinacea, F.
rubra and Peucedanum palustre, with an increasing
trend and significantly more cover in cut than the
abandoned plots in 2004, 2007 and 2005, respec-
tively. For example, F. rubra increased from a mean
of 10.9% cover in the cut plots in 2003 to 22.9% in
0
0.1
0.2
0.3
0.4
0.5
0.6
0.7
0.2 0.3 0.4 0.5 0.6 0.7 0.8
Axis 1 Eigen value 0.075
Axi
s 2
Eig
en v
alue
0.0
2
Abandoned Cut
Ct 04
A 07
A 03
Ct 03
A 06Ct 06
A 05
Ct 07
Ct 05
A 04
s.d
s.d
Fig. 5 Detrended Correspondence Analysis of plant commu-
nity cover in tall grassland between 2003 and 2007. Mean
values ± 1 SE (n = 8) are shown, with each point labelled
according to the treatment (Ct cut and A abandoned) and year
of survey (03 = 2003, 04 = 2004, 05 = 2005, 06 = 2006 and
07 = 2007)
Table 3 Summary of significant (GLM, LSD post hoc, P value \ 0.05) temporal changes in abundance in the tall grassland for
abandoned and cut treatments
Variable 2003–2004 2004–2005 2005–2006 2006–2007
Ab. Cut Ab. Cut Ab. Cut Ab. Cut
Bare ground 0.017 (-) 0.347 0.020 (?) 0.004 (?) 0.615 0.432 0.229 0.598
Litter 0.106 0.165 0.000 (-) 0.000 (-) 0.000 (?) 0.003 (?) 0.552 0.015 (-)
Elytrigia repens 0.434 0.039 (-) 0.045 (-) 0.012 (-) 0.744 0.064 0.410 0.605
Festuca rubra 0.252 0.988 0.183 0.004 (?) 0.068 0.006 (-) 0.815 0.000 (?)
Phragmites australis 0.522 0.006 (-) 0.040 (?) 0.010 (?) 0.584 0.006 (?) 0.460 0.349
Variables with greater than 5% mean cover and results from the post hoc pairwise comparisons are shown. Significant P values are in
bold with (?) = significant increase and (-) = significant decrease. See Appendix—Electronic supplementary material for results of
the GLM analysis
Hydrobiologia (2012) 692:83–97 91
123
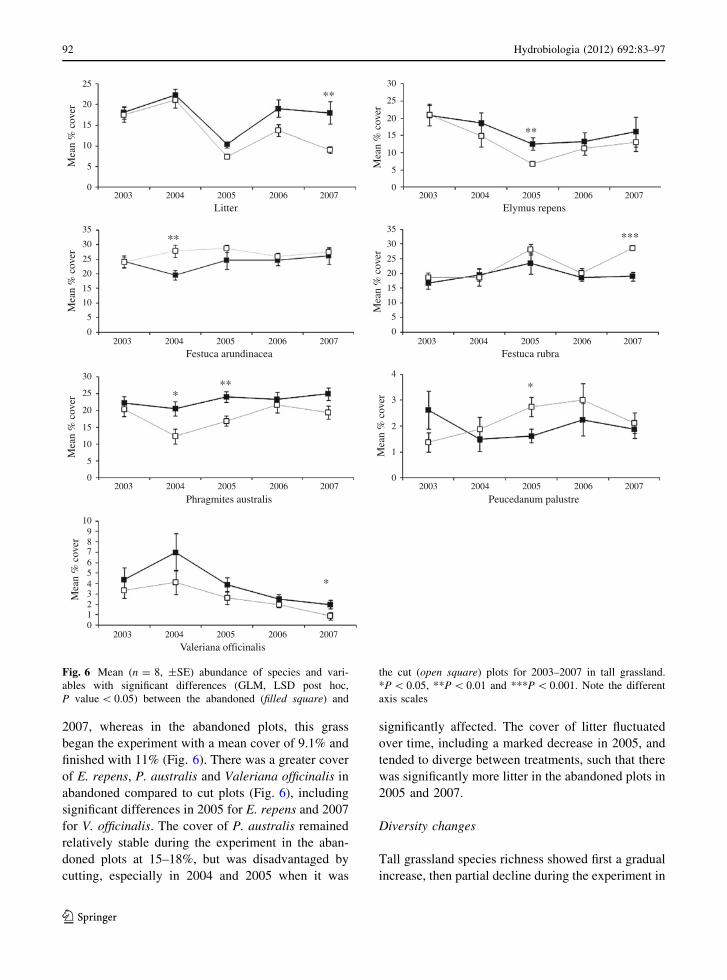
2007, whereas in the abandoned plots, this grass
began the experiment with a mean cover of 9.1% and
finished with 11% (Fig. 6). There was a greater cover
of E. repens, P. australis and Valeriana officinalis in
abandoned compared to cut plots (Fig. 6), including
significant differences in 2005 for E. repens and 2007
for V. officinalis. The cover of P. australis remained
relatively stable during the experiment in the aban-
doned plots at 15–18%, but was disadvantaged by
cutting, especially in 2004 and 2005 when it was
significantly affected. The cover of litter fluctuated
over time, including a marked decrease in 2005, and
tended to diverge between treatments, such that there
was significantly more litter in the abandoned plots in
2005 and 2007.
Diversity changes
Tall grassland species richness showed first a gradual
increase, then partial decline during the experiment in
25
20
15
10
5
02003
Litter2004 2005 2006 2007
Mea
n %
cov
er
25
35
30
20
15
10
5
0
Mea
n %
cov
er
2003Elymus repens
2004 2005 2006 2007
2003Festuca rubra
2004 2005 2006 20072003Festuca arundinacea
2004 2005 2006 2007
2003
Phragmites australis2004 2005 2006 2007 2003
Peucedanum palustre2004 2005 2006 2007
2003
Valeriana officinalis2004 2005 2006 2007
**
**
***
*
*
***
**
25
30
20
15
10
5
0
Mea
n %
cov
er
109876543210
Mea
n %
cov
er
25
30
20
15
10
5
0
Mea
n %
cov
er
25
35
30
20
15
10
5
0
Mea
n %
cov
er4
1
2
3
0
Mea
n %
cov
er
Fig. 6 Mean (n = 8, ±SE) abundance of species and vari-
ables with significant differences (GLM, LSD post hoc,
P value \ 0.05) between the abandoned (filled square) and
the cut (open square) plots for 2003–2007 in tall grassland.
*P \ 0.05, **P \ 0.01 and ***P \ 0.001. Note the different
axis scales
92 Hydrobiologia (2012) 692:83–97
123
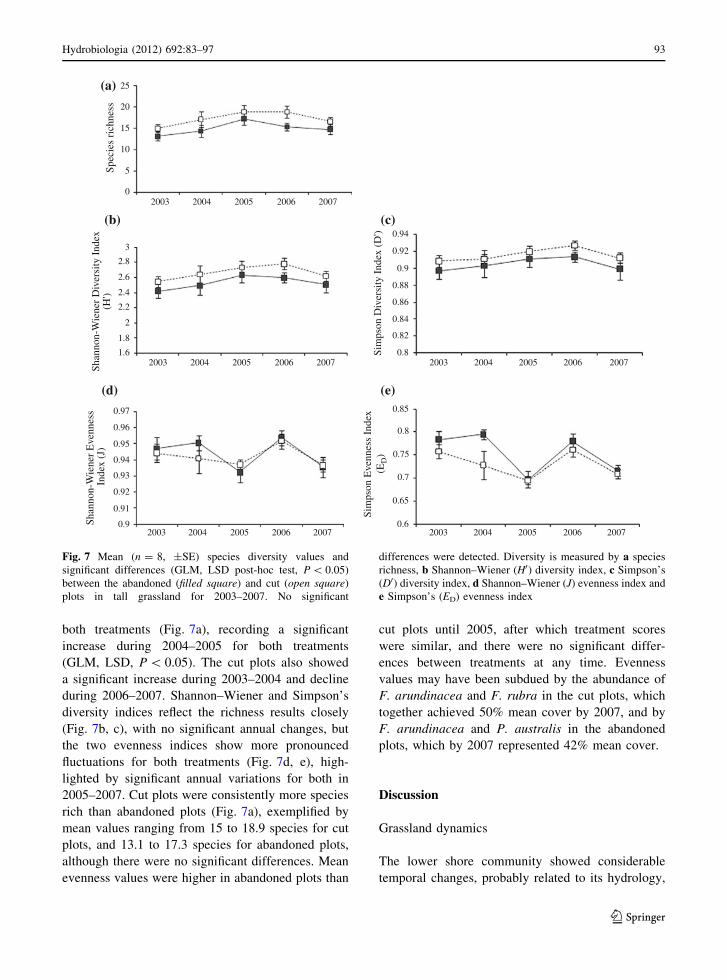
both treatments (Fig. 7a), recording a significant
increase during 2004–2005 for both treatments
(GLM, LSD, P \ 0.05). The cut plots also showed
a significant increase during 2003–2004 and decline
during 2006–2007. Shannon–Wiener and Simpson’s
diversity indices reflect the richness results closely
(Fig. 7b, c), with no significant annual changes, but
the two evenness indices show more pronounced
fluctuations for both treatments (Fig. 7d, e), high-
lighted by significant annual variations for both in
2005–2007. Cut plots were consistently more species
rich than abandoned plots (Fig. 7a), exemplified by
mean values ranging from 15 to 18.9 species for cut
plots, and 13.1 to 17.3 species for abandoned plots,
although there were no significant differences. Mean
evenness values were higher in abandoned plots than
cut plots until 2005, after which treatment scores
were similar, and there were no significant differ-
ences between treatments at any time. Evenness
values may have been subdued by the abundance of
F. arundinacea and F. rubra in the cut plots, which
together achieved 50% mean cover by 2007, and by
F. arundinacea and P. australis in the abandoned
plots, which by 2007 represented 42% mean cover.
Discussion
Grassland dynamics
The lower shore community showed considerable
temporal changes, probably related to its hydrology,
2003 2004 2005 2006 2007
2003 2004 2005 2006 2007 2003 2004 2005 2006 2007
2003 2004 2005 2006 2007 2003 2004 2005 2006 2007
25
20
15
10
5
0
Spec
ies
rich
ness
2.4
2.6
2.8
3
2.2
2
1.8
1.6
Shan
non-
Wie
ner
Div
ersi
ty I
ndex
(H')
Shan
non-
Wie
ner
Eve
nnes
s In
dex
(J)
0.92
0.91
0.9
0.93
0.94
0.95
0.96
0.97
Sim
pson
Div
ersi
ty I
ndex
(D
') 0.94
0.92
0.9
0.88
0.86
0.84
0.82
0.8
Sim
pson
Eve
nnes
s In
dex 0.85
0.8
0.75
0.7
0.65
0.6
(E
D)
(a)
(b)
(d) (e)
(c)
Fig. 7 Mean (n = 8, ±SE) species diversity values and
significant differences (GLM, LSD post-hoc test, P \ 0.05)
between the abandoned (filled square) and cut (open square)
plots in tall grassland for 2003–2007. No significant
differences were detected. Diversity is measured by a species
richness, b Shannon–Wiener (H0) diversity index, c Simpson’s
(D0) diversity index, d Shannon–Wiener (J) evenness index and
e Simpson’s (ED) evenness index
Hydrobiologia (2012) 692:83–97 93
123
which was more variable than for the tall grassland
(see Berg, 2009). This is highlighted by the frequency
of its flood events, namely 4 in 27 months of
hydrological monitoring, compared to the tall grass
vegetation, which was not inundated. Moreover, the
lower shore grassland was regularly flooded for
several weeks, with mean depths up to 20 cm above
ground during the summer (Berg, 2009). The water
table was also characteristically higher in the lower
shore than the tall grassland, with water levels being
within 20 cm of the ground surface continuously for
the peak growing period of June to September in
2005 and 2006, whereas the rhizosphere was usually
drained in the tall grassland. Hydrological fluctua-
tions not only affect the distribution of adult plants
(Leyer, 2005) but also the emergence and establish-
ment of seedlings (Peterson & Baldwin, 2004), which
consequently modify community composition and
could explain temporal vegetation changes. Winter
storms and/or flooding in summer just before sam-
pling in 2005 provoked particularly pronounced
changes in the lower shore community. These were
greater than any annual cutting effect, with signifi-
cantly depleted Festuca rubra and Glaux maritima,
while evenness was significantly reduced as Juncus
gerardii dominated. This species is an important
forage resource for wildfowl (Rannap et al., 2004),
highlighting a potential value of flooding for nature
conservation.
The tall grass community showed considerable
inherent community variation, reflecting its more
diverse composition, but rather modest temporal
changes. Winter storms of 2004–2005, and/or high
water levels in summer 2005, however, prompted a
shift in community composition. Bare ground and
Phragmites australis significantly increased, and
litter and Elytrigia repens decreased significantly,
although there was some recovery in subsequent
years. It is likely that litter was scoured by storms,
leaving bare ground and an opportunity for the
robust, hydrophytic P. australis to expand.
Responses to cutting
A loss of bare ground and accumulation of litter is
commonly related to management cessation (Bakker,
1998; MacDonald et al., 2000; Pavlu et al., 2005),
such that the main ecological consequences of long-
term abandonment is a decrease in regeneration
niches (Grubb, 1977) and small-scale diversity (e.g.
Persson, 1984; Rosset et al., 2001; Bouchard et al.,
2003; Pavlu et al., 2005). Thus, management prac-
tices such as grazing and cutting are usually associ-
ated with the creation of gaps within the sward and
decreased litter through removal of above ground
biomass and associated disturbance, which often
leads to enhanced species diversity (Fossati &
Pautou, 1989; Gerard et al., 2008).
In this study, cutting lower shore grassland
produced significantly more bare ground and even-
tually less litter than in abandoned lower shore
vegetation, but species diversity was not enhanced.
However, positive impacts on species diversity in
other studies were only revealed after 5–10 years of
management (e.g. Bakker et al., 2002; Lindborg &
Eriksson, 2004), suggesting that the 5-year duration
of this study may have been insufficient to detect
significant cutting trends upon diversity. Indeed, bare
ground also increased slightly within the abandoned
lower shore plots, demonstrating that additional
environmental factors impinged on the plant com-
munity, such as prolonged flooding, which also
creates gaps within the sward. Thus, the pronounced
hydrological dynamics of the lower shore grassland
are likely to have contributed to the fluctuating
diversity of this community, irrespective of vegeta-
tion management. Agrostis stolonifera increased in
both the abandoned and cut lower shore, and was
significantly more abundant after 5 years in the
abandoned plots. This grass spreads laterally and
rapidly using its stolons, which may have given it a
competitive advantage over other species, such as F.
rubra, which is a less competitive grass of small
stature (Grime et al., 1988) and decreased during the
study.
In contrast to the lower shore, cut tall grassland
was generally more diverse than abandoned vegeta-
tion, although not significantly so. Cutting signifi-
cantly stimulated Festuca arundinacea abundance in
the short term. The removal of tall vegetation through
cutting at the start of the experiment may have
triggered the germination of short-lived transient
seeds (Grime et al., 1988) and the production of new
tillers (Gibson & Newman, 2001) of this species,
resulting in increased cover. The advantage was not
sustained, however, possibly because F. arundinacea
is sensitive to competition by other grasses (Gibson &
Newman, 2001) such as F. rubra, which was also
94 Hydrobiologia (2012) 692:83–97
123
favoured by cutting and was significantly more
abundant in cut compared to abandoned tall grassland
after 5 years. The colonisation of F. rubra is
relatively slow compared to fast-growing species
(Grime et al., 1988), but it may have benefitted over
time from the significantly reduced litter, Elytrigia
repens and P. australis in the cut plots compared to
the abandoned vegetation. Other species of relatively
small stature may also have been favoured by such
community changes following cutting, including the
forb Peucedanum palustre, which is of conservation
value as a food plant for butterflies but is sensitive to
competition (Meredith & Grubb, 1993).
Overall, the implementation of cutting led to
greater changes in composition and species abun-
dance in the lower shore community compared to the
tall grassland. Eight variables were significantly
affected by cutting in lower shore grassland (includ-
ing bare ground, litter, species richness and five
species) from a total of 24 that were measured (33%)
compared to only seven in the tall grassland (includ-
ing litter and six species) from a total of 39 (18%).
The greater responsiveness of the lower shore
grassland may have been related to its dynamic
hydrological regime, as the community is adapted to
a fluctuating hydroperiod featuring episodic and
sometimes prolonged flooding. It is possible that
cutting increased the level of disturbance and/or
stress above a threshold that affected plant abundance
and diversity in the frequently flooded grassland, and
that the lower shore community is characterised by
species with some ruderal traits (Grime, 1979) that
respond rapidly to changes. These results partially
concur with a study of Belgian restored floodplains,
which found that both flood frequency and mowing
affect species composition, but they differ in that
annual cutting and frequent flooding increased spe-
cies richness in the floodplain grasslands (Gerard
et al., 2008). In contrast to the lower shore, the tall
grassland featured a more stable water regime and
competitive species that respond more slowly to
changes, such that the community showed compar-
atively few effects of cutting, including any signif-
icant diversity impacts. Thus, species sensitive to
high disturbance or stress levels (e.g. F. rubra) were
negatively affected by cutting in the dynamic lower
shore grassland but favoured in the more stable tall
grassland. While this study was not an explicit test of
the role of diversity in wet grassland stability, the
results are consistent with Tilman (1999) who
suggested that species-poor communities are less
stable when stressed or disturbed compared to
species-rich communities, as there is more likelihood
that some species in diverse communities are able to
compensate for the reduction of competitors caused
by disturbance. However, Grman et al. (2010) found
that disturbed annual-dominated grassland communi-
ties were more stable than undisturbed perennial
communities, and that stability was maintained
despite losses in species richness, possibly because
of increased compensatory dynamics and increased
dominance by stable dominant species.
Conclusion: implications for restoration
This study has demonstrated that wet grassland plant
communities are dynamic and show differential
responses to cutting for restoration management.
Dynamism is dependent upon environmental factors,
illustrated in this study, particularly by hydrological
regime, which control plant community composition
and may interact with cutting to produce synergistic
effects. A greater proportion of significant changes
were observed in a species-poor lower shore grass-
land with a variable hydroperiod compared to a more
diverse tall grassland, which manifested some resis-
tance to cutting management during the 5 years of
study. This may have been because disturbance
thresholds were exceeded by the combination of
flooding and cutting in the lower shore grassland but
not in the tall grassland, where inundation was less
frequent and prolonged.
The relatively few significant changes that could
be directly attributed to cutting indicate that restora-
tion of abandoned wet grasslands may be a slow
process, in particular in communities composed of
highly competitive species such as the tall grassland
in this study. Cutting reduced the dominance of
competitive species in tall grassland (e.g. Phragmites
australis and Elytrigia repens) in the short term, to
the advantage of wet grassland species such as
Festuca arundinacea, Festuca rubra and Peuceda-
num palustre. More substantial community changes,
however, may only be apparent after many years or
with an increased level of disturbance, perhaps
through flooding, intensive grazing, burning or by
rotovating the grassland surface. Thus, if the
Hydrobiologia (2012) 692:83–97 95
123
restoration or management target is to remove
encroaching species or further enhance grassland
with residual diversity, then this may take consider-
able time and effort to achieve. However, the
apparent resistance of more diverse grasslands to
change may prevent rapid degradation in adverse
conditions, such as abandonment, inappropriate man-
agement, or even climate change, as the variety of
species present may help buffer impacts.
The significant changes in vegetation composition
observed in the lower shore grassland suggests that
cutting may have a more immediate and pronounced
effect in species-poor communities already subject,
and adapted, to environmental change, such as that
imposed by frequent flooding. In such circumstances,
restored vegetation management may impose addi-
tional disturbance upon the community, yielding
rapid species responses. However, the study has also
highlighted the importance of the hydrological
regime, and especially flooding, for restoring wet
grassland communities. If the target, therefore, is to
restore ‘naturally’ functioning wet grassland irre-
spective of plant diversity, then a dynamic hydrope-
riod incorporating water levels in the rhizosphere and
flooding may suffice.
Acknowledgments The study was funded by the Darwin
Initiative (Project Reference Number 162/13/013) and the
Earthwatch Institute. The authors would particularly like to
thank Elle Puurmann and Silvia Lotman for their support and
assistance in Estonia.
References
Bakker, J. P., 1998. The impact of grazing on plant commu-
nities. In Bakker, J. P. & S. E. Van Wieren (eds), Grazing
and Conservation Management. Kluwer, Dordrecht:
137–184.
Bakker, J. P., J. A. Elzinga & Y. De Vries, 2002. Effects of
long term cutting in a grassland system: perspectives for
restoration of plant communities on nutrient-poor soils.
Applied Vegetation Science 5: 107–120.
Benstead, P., P. Jose, C. Joyce & P. M. Wade, 1999. European
Wet Grassland: Guidelines for Management and Resto-
ration. RSPB, Sandy, UK.
Berg, M., 2009. Abandonment and reinstated management
upon coastal wet grasslands in Estonia. PhD thesis, Uni-
versity of Brighton.
Bouchard, V., M. Tessier, D. Digaire, J. P. Vivier, L. Valery, J.
C. Gloaguen & J. C. Lefeuvre, 2003. Sheep grazing as
management tool in Western European saltmarshes.
Comptes Rendus Biologies 326: 148–157.
Burnside, N. G., C. B. Joyce, E. Puurmann & D. Scott, 2007.
Vegetation classification and plant indicators to assess
wetland abandonment: a case study in West Estonia.
Journal of Vegetation Science 18: 645–654.
Burnside, N. G., C. B. Joyce, M. Berg & E. Puurman, 2008.
The relationship between microtopography and vegetation
in Estonian coastal wetlands: implications for climate
change. Publications Instituti Geographici Universitatis
Tartuensis 106: 19–23.
Diekmann, M., 2003. Species indicator values as an important
tool in applied plant ecology – a review. Basic and
Applied Ecology 4: 493–506.
Fossati, J. & G. Pautou, 1989. Vegetation dynamics in the fens
of Chautagne (Savoie, France) after the cessation of
mowing. Vegetatio 85: 71–81.
Gerard, M., M. El Khaloun, J. Rymen, O. Beauchard & P.
Meire, 2008. Importance of mowing and flood frequency
in promoting species richness in restored floodplains.
Journal of Applied Ecology 45: 1780–1789.
Gibson, D. J. & J. A. Newman, 2001. Festuca arundinaceaSchreber (F. elatior L. ssp. arundinacea (Schreber) Hac-
kel). Journal of Ecology 89: 304–324.
Gonzalez, A. & M. Loreau, 2009. The causes and conse-
quences of compensatory dynamics in ecological com-
munities. Annual Review of Ecology, Evolution and
Systematics 40: 393–414.
Grime, J. P., 1979. Plant Strategies and Vegetation Processes.
Wiley, Chichester.
Grime, J. P., J. G. Hodgson & R. Hunt, 1988. Comparative
Plant Ecology: A Functional Approach to Common Brit-
ish Species. Unwin, Hyman, London.
Grman, E., J. A. Lau, D. R. Schoolmaster & K. L. Gross, 2010.
Mechanisms contributing to stability in ecosystem func-
tion depend on the environmental context. Ecology Let-
ters 13: 1400–1410.
Grubb, P. J., 1977. The maintenance of species-richness in
plant communities: the importance of regeneration niche.
Biological Review 52: 107–145.
Joyce, C. B., 1998. Plant community dynamics of managed and
unmanaged floodplain grasslands: an ordination analysis.
In Joyce, C. B. & P. M. Wade (eds), European Wet
Grasslands: Biodiversity, Management and Restoration.
Wiley, Chichester: 173–191.
Joyce, C. B. & P. M. Wade, 1998. Wet grassland: a European
perspective. In Joyce, C. B. & P. M. Wade (eds), Euro-
pean Wet Grasslands: Biodiversity, Management and
Restoration. Wiley, Chichester: 1–12.
Kinzing, A. P., S. W. Pacala & D. Tilman, 2001. The Func-
tional Consequences of Biodiversity. Empirical Progress
and Theoretical Extensions. Princeton University Press,
Princeton.
Leyer, I., 2005. Predicting plant species’ responses to river
regulation: the role of water level fluctuations. Journal of
Applied Ecology 42: 239–250.
Lindborg, R. & O. Eriksson, 2004. Effects of restoration on
plant species richness and composition in Scandinavian
semi-natural grasslands. Restoration Ecology 12:
318–326.
96 Hydrobiologia (2012) 692:83–97
123
Loreau, M., S. Naeem & P. Inchausti, 2002. Biodiversity and
Ecosystem functioning: Synthesis and Perspectives.
Oxford University Press, Oxford.
Macdonald, D., J. R. Crabtree, G. Wiesinger, T. Dax, N. Sta-
mou, P. Fleury, J. Guitierrez-Lazpita & A. Gibon, 2000.
Agricultural abandonment in mountain areas of Europe:
environmental consequences and policy response. Journal
of Environmental Management 59: 47–69.
Magurran, A. E., 2004. Measuring Biological Diversity.
Blackwell Publishing, Oxford.
May, R. M., 1973. Stability and Complexity in Model Eco-
systems. Princeton University Press, Princeton.
Meredith, T. C. & P. J. Grubb, 1993. Peucedanum palustre (L.)
Moench. Journal of Ecology 81: 813–826.
Naeem, S., L. J. Thompson, S. P. Lawler, J. H. Lawton & R.
M. Woodfin, 1994. Declining biodiversity can alter the
performance of ecosystems. Nature 368: 734–736.
Naeem, S., D. E. Bunker, A. Hector, M. Loreau & C. Perrings
(eds), 2009. Biodiversity, Ecosystem Functioning, and
Human Wellbeing: An Ecological and Economic Per-
spective. Oxford University Press, Oxford.
Pavlu, V., M. Hejcman, L. Pavlu, J. Gaisler, P. Nezerkova &
M. G. Andaluz, 2005. Vegetation changes after cessation
of grazing management in the Jikerske Mountains (Czech
Republic). Annales Botanica Fennici 42: 343–349.
Persson, S., 1984. Vegetation development after the exclusion
of grazing cattle in a meadow area in the south of Sweden.
Vegetatio 55: 65–92.
Peterson, J. E. & A. H. Baldwin, 2004. Seedling emergence
from seed banks of tidal freshwater wetlands: response
to inundation and sedimentation. Aquatic Botany 78:
243–254.
Pimm, S. L., 1984. The complexity and stability of ecosystems.
Nature 307: 321–326.
Rannap, R., L. Briggs, K. Lotman, I. Lepik, V. Rannap & P.
Podra, 2004. Coastal Meadow Management – Best Prac-
tice Guidelines. Ministry of the Environment of the
Republic of Estonia, Tallinn.
Rosset, M., M. Montani, M. Tanner & J. Fuhrer, 2001. Effects
of abandonment on the energy balance and evapotrans-
piration of wet subalpine grassland. Agriculture, Ecosys-
tems and Environment 86: 277–286.
Tilman, D., 1999. Diversity and production in European
grasslands. Science 286: 1099–1100.
Toogood, S. E. & C. B. Joyce, 2009. Effects of raised water
levels on wet grassland plant communities. Applied
Vegetation Science 12: 283–294.
Tyler, G., 1969. Studies in the ecology of Baltic sea-shore
meadows II. Flora and vegetation. Opera Botanica 25:
1–101.
Hydrobiologia (2012) 692:83–97 97
123