diet diversity study - friedman school of nutrition...
TRANSCRIPT

i
◙DAN
.:: EMERGENCY NEEDS ASSESSMENT SERVICE
SSTTRREENNGGTTHHEENNIINNGG EEMMEERRGGEENNCCYY NNEEEEDDSS AASSSSEESSSSMMEENNTT CCAAPPAACCIITTYY ((SSEENNAACC))
Diet Diversity Study
Friedman School of Nutrition Science and Policy
Tufts University, Boston
NNOOVVEEMMBBEERR 22000077

ii
DIET DIVERSITY STUDY Prepared by Jennifer Coates, Beatrice Lorge Rogers, Patrick Webb, Daniel Maxwell, Robert Houser and Christine McDonald November, 2007 © World Food Programme, Emergency Needs Assessment Service (ODAN) This study was prepared under the umbrella of the “Strengthening Emergency Needs Assessment Capacity” (SENAC) project. The SENAC project aims to reinforce WFP’s capacity to assess humanitarian needs in the food sector during emergencies and the immediate aftermath through accurate and impartial needs assessments.
United Nations World Food Programme Headquarters: Via C.G. Viola 68, Parco de’ Medici, 00148, Rome, Italy ODAV Vulnerability Assessment & Mapping Service Chief: Joyce Luma Tel: +39 06 6513 3123 ODAN Emergency Needs Assessment Service SENAC Methodology Specialist: Agnès Dhur Tel: +39 06 6513 3650 Programme Officer: Simon Renk Tel: +39 06 6513 3276 This document has been produced with the financial assistance of the European Union. The views expressed herein can in no way be taken to reflect the official opinion of the European Union.

iii
Acknowledgements
This report was supported by a grant from the World Food Program. We would like to acknowledge the helpful comments and suggestions from Agnes Dhur, Simon Renk, Joyce Luma, Peter Horjus, and Jan Delbaere of the World Food Program in Rome. We received very able assistance from Ankur Patel, Kyungjae Kang, and Akoto Osei in data analysis. We gratefully acknowledge the sources of the data used in this report. The data sets for Ghana and Ethiopia were obtained from the International Food Policy Research Institute; the Afghanistan data set was obtained from the World Food Program with permission of the Government of Afghanistan, and the Bangladesh data set was collected by researchers at Tufts with the support of the Food and Nutrition Technical Assistance Project of the Academy for Educational Development with funding from the US Agency for International Development. The Darfur data set was obtained from the World Food Program. We appreciate the opportunity to make use of these data.

iv
Diet Diversity Study
Executive Summary
Adequate human nutrition involves regular intake of a wide range of nutrients, some of which
must be consumed on a frequent basis, even if in small quantities. As such, dietary diversity
(DD), typically measured in the form of a count of food groups or food group frequency, has been
suggested as a proxy indicator for nutrient adequacy. Recently, the potential for measures of diet
diversity to help identify food insecure households has received growing attention from
operational agencies. This interest is founded on the observed relationship between income and
diet diversification and is fuelled by the ease and low-cost of collecting and using dietary
diversity indices. Nevertheless, a dietary diversity measure that is operationally relevant in
diverse contexts remains an un-met programmatic need, particularly in settings of acute food
insecurity requiring humanitarian intervention where the relationships between dietary diversity
and income may be confounded.
The aims of this study were to: 1) compare various DD indicators to determine the best proxy for
caloric adequacy; 2) assess which method for classifying households using their dietary diversity
characteristics best predicts caloric insufficiency; 3) determine whether households in different
contexts with the same dietary diversity profile have the same caloric intake; 4) determine the
extent to which the same DD measure and cut-offs could be used in different locations; 5) assess
the effects of certain characteristics of acute food insecure settings, such as wild food
consumption and food aid receipts on the interpretation of measures of dietary diversity in very
food constrained populations; and 6) to examine the implications of the above for emergency
needs assessment data collection.1
To test the relationship of dietary diversity measures to caloric indicators, data from four surveys
were used: the Bangladesh Food Insecurity and Validation Study (FIMVS); the Accra Urban
Food and Nutrition Security Study (AUFNS); the Ethiopia Rural Household Survey (ERHS); and
the Afghanistan National Risk and Vulnerability Assessment (NRVA). Since none of these
surveys were conducted in specifically emergency-affected areas, data were also analyzed from
the Darfur Emergency Food Security Assessment (EFSA). Though the latter did not include 1 The aim of the study originally commissioned by WFP/SENAC was to test the operationalization of dietary diversity measures as proxy indicators of household food insecurity in emergency-affected populations. Part-way through the study process, WFP called for a reorientation in the objectives, which involved assessing dietary diversity as an indicator of caloric adequacy, specifically, rather than as an indicator of food security more broadly. These study aims reflect this modification.

v
measures of caloric intake, this data set was nevertheless useful for testing the relationships
between dietary diversity and other food security indicators in an acutely food insecure context,
for examining the impact of wild foods and food aid on dietary diversity, and for assessing the
constraints of displacement, and specifically camp-based displacement, on dietary diversity.
In order to evaluate and compare various dietary diversity indicators, bivariate correlations were
examined both among the candidate indicators and between each indicator and the caloric
adequacy benchmark. Individual OLS regression models for each of the candidate DD indicators
in each data set were tested and logistic regression models for each indicator and data set tested
the degree to which different levels of the candidate DD indicators increased the likelihood of a
shortfall in a consumption threshold. To explore the feasibility of applying the same cut-off (not
just the same approach) across data sets, contingency table analysis was used to compare the
classification of households above and below a cut-off on the candidate measure to households
above and below a critical level of a benchmark, examining the sensitivity, specificity and
predictive value of each indicator. Five dietary diversity indicators were tested: Food Group
Score (using standardized groupings from the DHS surveys), Nutrient Groups Score, Calorie-
Dense Food Groups Score, Unique Foods Score, and Calorie Dense Unique Foods Score. The
Darfur data were assessed according to WFP’s own dietary diversity measure.
A clear relationship between caloric adequacy and dietary diversity was shown across all the data
sets with the partial exception of Ethiopia. The Ethiopia data were not collected in such a way as
to enable accurate calculation of caloric intake, so many of the results of the analysis of data from
Ethiopia are unreliable. While the statistical relationships were the same across the other data
sets, the specifics varied considerably: both dietary diversity and caloric intake were significantly
higher in Accra and Afghanistan than in Bangladesh. All of the dietary diversity indicators are
highly correlated, and most correlate reasonably well with caloric adequacy. The correlations
were the highest for the Unique Foods and the DHS Food Groups indicators. The Nutrient
Groups and Calorie-Dense Food Groups indicators had fewer categories, and tended to have
scores mostly in the higher ranges, meaning that these might be good indicators of extreme stress,
but are not particularly suited for measuring small changes in status over time. All measures
correlated well with a battery other food security indicators. All indicators were significantly
associated with caloric adequacy in regression analysis, with DHS Food Groups and Unique
Foods explaining the most variance.

vi
The sensitivity and specificity analysis to test for appropriate cut-offs in scores of dietary
diversity measures showed very different results for different locations, and no clearly adequate
cut-off (ie. a cut off that did not include a significant number of false positives and false
negatives) for dietary diversity scores was identified. This was true not only for a universally
applicable cut-off across data sets, but also within even a single data set. Again, the DHS Food
Groups indicator did the best job of maximizing specificity and sensitivity.
The results confirm that measures of dietary diversity do reflect the adequacy and quality of diet
at the household level. After controlling for confounders in a multivariate analysis, all DD
indicators showed very significant positive relationships with calorie consumption in all four
countries. However, all the data sets used to analyze caloric adequacy were drawn from settings
that were not currently affected by an acute emergency. The extent to which dietary diversity
may have a different meaning in emergencies cannot be inferred from these results. All the
constructed measures of diet diversity were closely correlated with each other. Nonetheless, each
one may have a somewhat different interpretation. Indicators with more groups are more
sensitive to minor changes; those with fewer groups, reflecting very basic, generic diet patterns,
are likely to be better indicators of extreme stress. Results were inconsistent regarding which
indicator showed the greatest predictive ability or the most robust correlation with calorie
consumption. Analysis of DD indicators in Darfur suggested that the incorporation of such
aspects of emergency settings as the consumption of wild or 'famine' foods, and the effect of food
aid receipt on diversity merit further exploration. The relationship with caloric intake could not
be investigated.
Based on sensitivity and specificity analysis, it proved impossible to find a universal cut-off in
any of the indicators tested that would consistently identify a set proportion of households falling
below a chosen level of calorie consumption. The variability of results suggests that relying on a
single indicator to proxy dietary adequacy will likely result in the misclassification of households
for diagnostic or targeting purposes. These results indicate that for assessment and targeting
purposes, more than one proxy indicator should be used.
Further study and primary data collection to quantify calorie intake directly (not through proxies),
along with other measures of dietary diversity and household food security, is strongly
recommended in order to assess the usefulness of the dietary diversity indicator in access-
constrained, emergency settings.

vii
We can briefly summarize our conclusions as follows.
- These results confirm that dietary diversity measures show a consistent association with dietary adequacy and caloric intake.
o We did not find clear superiority of one indicator over another; all are closely correlated
o Because of diverse contexts and the strong desire of households to diversify at very low levels of caloric intake, universal cut off values are unlikely to be found
o Very aggregated (e.g. five food group) measures may discriminate in severely deprived more than in less deprived populations
- This relationship has not been tested in emergency or crisis settings; such research is badly needed
o The role and significance of 'famine foods' needs to be explored further
o The effect of food aid on DD indicators needs to be explored
- Assessing the use of DD indicators as a proxy for diet adequacy requires information on both variables
o Food expenditures or provisioning are poor proxies for consumption; detailed consumption data are needed
o DD indicators constructed from detailed consumption data may be different from indicators collected from general questions specifically to construct DD scores.
- The promising potential for using DD as one in a set of indicators of household food security and diet quality justifies further research on the issue.

viii
Table of Contents Acknowledgements ····························································································Error! Bookmark not defined. Executive Summary········································································································································ iv List of Figures·················································································································································· xi 1. Introduction················································································································································· 1 2. Study Aims···················································································································································· 4 3. Background and Review of Relevant Literature ···················································································· 6 4. Methods······················································································································································· 15
4.1 ANALYTICAL STRATEGY ··················································································································15 4.2 SELECTION OF DATA SETS ················································································································18 4.3 DESCRIPTION OF DATA SETS··············································································································19 4.4 CALCULATION OF CALORIC INTAKE PER ADULT EQUIVALENT ··························································23
4.4.1 Bangladesh: Bangladesh Food Insecurity Measurement and Validation Study (FIMVS) ········· 23 4.4.2 Ghana: The Accra Urban Food and Nutrition Security Study (AUFNS).·································· 24 4.4.3 Ethiopia: The Ethiopia Rural Household Survey (ERHS). ························································ 24 4.4.4 Afghanistan: Afghanistan National Risk and Vulnerability Assessment (NRVA). ····················· 25
4.5 CALCULATION OF CANDIDATE DIETARY DIVERSITY INDICATORS ·····················································26 4.5.1 Darfur Dietary Diversity Indicators ····················································································· 27 4.5.2 Darfur Dietary Adequacy Categories··················································································· 28
4.6 LIMITATIONS ····································································································································29 5. Results ························································································································································· 30
5.1 THE SAMPLE ····································································································································30 5.2 MEASURES OF DIETARY DIVERSITY··································································································31 5.3 DIETARY PATTERNS··························································································································31
5.3.1 DHS Food Groups ····················································································································· 33 5.3.2 Nutrient Groups ························································································································· 34 5.3.3 Calorie Dense Food Groups ······································································································ 34
5.4 PATTERN ANALYSIS ·························································································································35 5.5 RELATIONSHIPS AMONG THE INDICATORS·························································································37 5.6 RELATIONSHIP OF DD INDICATORS TO CALORIE INTAKE···································································37 5.7 RELATIONSHIP OF INDICATORS TO OTHER HOUSEHOLD CHARACTERISTICS·······································38 5.8 INDICATORS AS PREDICTORS OF CALORIE INTAKE ············································································40 5.9 SENSITIVITY AND SPECIFICITY··········································································································42 5.10 DARFUR RESULTS: HOUSEHOLD DEMOGRAPHICS AND DIETARY PATTERNS ···································44 5.11 WILD FOODS CONSUMPTION IN DIETARY DIVERSITY INDICES AND AS A STAND-ALONE MARKER OF FOOD INSECURITY··································································································································46 5.12 DARFUR DIETARY DIVERSITY INDEX CORRELATIONS WITH FOOD SECURITY PROXIES ····················47 5.13 DIETARY ADEQUACY CLASSIFICATIONS AND FOOD SECURITY CATEGORIZATION ···························47 5.14 REGRESSION MODELS PREDICTING DIETARY DIVERSITY IN DARFUR HOUSEHOLDS························48
Tables ······························································································································································ 57 Figures··························································································································································· 100 References ····················································································································································· 112

ix
List of Tables
Table 1: Key Characteristics of Study Data Sets .......................................................................................... 57
Table 2: Description of Candidate Dietary Diversity Indicators .................................................................. 58
Table 2a: Mapping of DHS Food Groups to Major Nutrient Groups Based on Primary Nutrient
Contribution....................................................................................................................................... 59
Table 2b: Definition and Construction of Darfur Candidate Dietary Diversity Indicators........................... 60
Table 3: Key Characteristics of Sample Households.................................................................................... 61
Table 4: Frequency of HH Consumption of Food and Nutrient Groups....................................................... 62
Table 5: Mean (+/-SD) of Candidate DD Indices by Country and Kcal per AE) Adequacy Group............. 63
Table 6a: Distribution of DHS Food Group Score by Kcal per AE Categories for Each Dataset ................ 64
Table 6b: Distribution of Nutrient Food Group Scores by Kcal per AE Categories for Each Dataset ......... 65
Table 6c: Distribution of Calorie Dense Group Score by Kcal per AE Categories for Each Dataset........... 66
Table 7: Percentage of Households Meeting Various Caloric per AE Cut-offs with Different Nutrient
Group Consumption Patterns............................................................................................................. 67
Table 8-1a: Bivariate Spearman Associations among Candidate Dietary Diversity and Common Household
Food Insecurity Indicators for Bangladesh ........................................................................................ 68
Table 8-1b: Bivariate Spearman Associations among Candidate Dietary Diversity and Common Household
Food Insecurity Indicators for Ghana ................................................................................................ 69
Table 8-1c: Bivariate Spearman Associations among Candidate Dietary Diversity and Common Household
Food Insecurity Indicators for Afghanistan ....................................................................................... 70
Table 8-1d: Bivariate Spearman Associations among Candidate Dietary Diversity and Common Household
Food Insecurity Indicators for Ethiopia ............................................................................................. 71
Table 8-2a: Bivariate Spearman Associations among Candidate Dietary Diversity and Common Household
Food Insecurity Indicators for Bangladesh ........................................................................................ 72
Table 8-2b: Bivariate Spearman Associations among Candidate Dietary Diversity and Common Household
Food Insecurity Indicators for Ghana ................................................................................................ 73
Table 8-2c: Bivariate Spearman Associations among Candidate Dietary Diversity and Common Household
Food Insecurity Indicators for Afghanistan (overall n=26135) ......................................................... 74
Table 8-2d: Bivariate Spearman Associations among Candidate Dietary Diversity and Common Household
Food Insecurity Indicators for Ethiopia (overall n=961) ................................................................... 75
Table 9: Spearman Bivariate Associations among Candidate Dietary Diversity Indicators and Household
Caloric Intake per AE by Country ..................................................................................................... 76
Table 10a: Comparison by Country of OLS Multivariate Regressions Predicting HH Kcal Intake per AE:
DHS Food Groups ............................................................................................................................. 77
Table 10b: Comparison by Country of OLS Multivariate Regressions Predicting HH Kcal Intake per AE:
Nutrient Groups ................................................................................................................................. 78

x
Table 10c: Comparison by Country of OLS Multivariate Regressions Predicting HH Kcal Intake per AE:
Calorie Dense Food Groups.............................................................................................................. 79
Table 10d: Comparison by Country of OLS Multivariate Regressions Predicting HH Kcal Intake per AE:
Unique Foods .................................................................................................................................... 80
Table 10e: Comparison by Country of OLS Multivariate Regressions Predicting HH Kcal Intake per AE:
Calorie Dense Unique Foods ............................................................................................................ 81
Table 11: Regression Parameters for Five DD Indicators, Cross-Country Comparison............................... 82
Table 12a: Comparison by Candidate Dietary Diversity Indicator of Logistic Regressions Predicting HH
Consumption of > 1800 Kcal per AE for Bangladesh ....................................................................... 83
Table 12b: Comparison by Candidate Dietary Diversity Indicator of Logistic Regressions Predicting HH
Consumption of > 1800 Kcal per AE for Ghana ............................................................................... 84
Table 12c: Comparison by Candidate Dietary Diversity Indicator of Logistic Regressions Predicting HH
Consumption of > 1800 Kcal per AE for Afghanistan ...................................................................... 85
Table 12d: Comparison by Candidate Dietary Diversity Indicator of Logistic Regressions Predicting HH
Consumption of > 1800 Kcal per AE for Ethiopia (n= 972).............................................................. 86
Table 13: Adjusted Odds Ratios for Five DD Indicators, Cross-Country Comparison................................ 87
Table 14: Sensitivity and Specificity Analysis: Conceptual Summary ........................................................ 88
Table 15a: Sensitivity/Specificity Analysis Testing Nutrient Groups Index Thresholds against Households
Consuming either < or ≥1800 Kcals per AE, by Country................................................................. 89
Table 15b: Sensitivity/Specificity Analysis Testing DHS Groups Index Thresholds against Households
Consuming either < or ≥1800 Kcals per AE, by Country................................................................. 90
Table 15c: Sensitivity/Specificity Analysis Testing Calorie Dense Group Thresholds against Households
Consuming either < or ≥1800 Kcals per AE, by Country................................................................. 91
Table 16: Household Demographics ............................................................................................................ 92
Table 17: Frequency and Source (Food aid or Not) of Food Group Consumption ...................................... 93
Table 18: Bivariate Correlations among Frequency of Wild Food Consumption, Frequency of Consumption
of Individual Food Groups, and Dietary Diversity Indices................................................................ 94
Table 19: Crosstabulation of Wild Food Consumption, Household Displacement Status (IDP or Camp), and
Total Per Capita Monthly Expenditure Terciles ................................................................................ 95
Table 20: Bivariate Associations among Darfur Dietary Diversity Indicators and Common Food Insecurity
Proxies ............................................................................................................................................... 96
Table 21: Crosstabulation of Nutrient Consumption Adequacy Groups with Food Expenditure p.c. and
Percentage of Total Expenditure Spent on Food ............................................................................... 97
Table 22: Predictors of Dietary Diversity - OLS with Robust SE ................................................................ 98
Table 23: Predictors of Dietary Diversity amongst IDPs – OLS with Robust SE........................................ 99

xi
List of Figures
Fig 1 Calories per AE by DHS Food Groups Bangladesh Fig 2 Calories per AE by Nutrient Groups Bangladesh Fig 3 Calories per AE by Calorie Dense Food Groups Bangladesh Fig 4 Calories per AE by Unique Foods Bangladesh Fig 5 Calories per AE by Calorie Dense Unique Foods Bangladesh Fig 6 Calories per AE by DHS Food Groups Ghana Fig 7 Calories per AE by Nutrient Groups Ghana Fig 8 Calories per AE by Calorie Dense Food Groups Ghana Fig 9 Calories per AE by Unique Foods Ghana Fig 10 Calories per AE by Calorie Dense Unique Foods Ghana Fig 11 Calories per AE by DHS Food Groups Afghanistan Fig 12 Calories per AE by Nutrient Groups Afghanistan Fig 13 Calories per AE by Calorie Dense Food Groups Afghanistan Fig 14 Calories per AE by Unique Foods Afghanistan Fig 15 Calories per AE by Calorie Dense Unique Foods Afghanistan Fig 16 Calories per AE by DHS Food Groups Ethiopia Fig 17 Calories per AE by Nutrient Groups Ethiopia Fig 18 Calories per AE by Calorie Dense Food Groups Ethiopia Fig 19 Calories per AE by Unique Foods Ethiopia Fig 20 Calories per AE by Calorie Dense Unique Foods Ethiopia
1
Diet Diversity Study Contract S26-06-ODAN-01
Final Report to the World Food Programme Friedman School of Nutrition Science and Policy,
Tufts University, Boston. November 21, 2007
1. Introduction
The World Health Organization has suggested that at least 20, perhaps as many as 30,
biologically distinct variants of foods should be consumed each week for a healthy diet
(WHO/FAO 2003). This is because adequate human nutrition involves regular intake of a wide
range of nutrients, some of which are manufactured in the human body but many of which are
not, and therefore have to be consumed on a frequent basis even if in small quantities.2 This
essential underpinning of nutrition science has led to the creation of various measures of dietary
diversity that correlate with identified risk factors linked to a range of health-related outcomes,
including premature mortality (Kant et al. 1993; Seymour et al. 2003), chronic and acute diseases
(Schneider et al. 2000; Menotti et al. 2004; Schulze and Hoffmann 2007), and compromised
growth (Arimond and Ruel 2004; Cordeiro 2007)—all mediated through, or at least interacting
with, macro-, and micronutrient deficiencies. Building on epidemiologic studies validating such
approaches to analysing diet-disease interactions (see Newby et al. 2003; Neuhouser et al. 2003;
Newby and Tucker 2004), the potential for measures of diet diversity to help identify risk factors
related to household food insecurity, as opposed to individual wellbeing, has received growing
attention from operational agencies.
A measure of the risk of dietary inadequacy that is simple to collect and easy to interpret remains
an un-met programmatic priority in the context of humanitarian action. One of the agreed
principles of Good Humanitarian Donorship is rigorous and transparent methods of emergency
needs assessment (DI 2006). The work of ODAN at WFP, the introduction of a Needs Analysis
Framework and Matrix by OCHA, and the continued multi-partner development of an Integrated
Food Security and Humanitarian Phase Classification are all part of a broad attempt to harmonize
measurement tools and indicators for universal use in emergency settings (Walker and Pepper
2007). It is widely believed that an indicator of diversity in household consumption patterns can
serve to enhance needs assessment approaches.
2 Of course sound nutrition is not only about foods consumed; it also depends on a balance between nutrient intake and requirements, consumption in relation to energy expenditure, a interactions with non-food factors, including clean water, disease burden/health care, caring practices, etc.
2
Diet quality has long been referred to in UN manuals dealing with emergency management. For
example, UNHCR’s 1982 handbook for field operations states that “essential vitamin and mineral
requirements must be met: a varied diet is the best means of doing so” (p.102).3 The multi-
agency manual on management of nutrition in major emergencies from 2000 similarly notes that
a diet that is diversified is key to good nutrition and that, “if evaluation of dietary intake indicates
specific deficiencies,” then rations should be tailored to deal with identified problems; the food
basket composition should be varied; and the provision of appropriate combinations of nutrient-
rich and micronutrient-fortified foods should be ensured (WHO 2000, p.15) Similarly, in its
guidelines for fieldworkers dealing with emergency assessments, Save the Children (UK) argues
that “you need to be able to answer the following questions in order to assess the impact of food
security on nutrition in the affected population:…What is the overall quality of the diet of
different population groups? Is there access to foods of high dietary quality?” (SCF 2004, p. 23)
It is important to emphasize the term “access” in the latter quote because interest in the
operational applications of dietary diversity indicators has grown not only because of perceived
ease of collection (compared with detailed household expenditure or consumption surveys), but
also because diversity is thought to be a less distal proxy for the access dimension of food
security than other commonly used measures. For example, FAO’s (2005) reference guide on
‘nutrition indicators for development’ specifies the use of food diversity (number of food groups
consumed) and food variety (number of foods consumed) as proxies for the ‘food access’ domain
of widely-held food security conceptual frameworks.
WFP also sees the potential for ‘household dietary diversity’ to proxy food access and
availability, as part of a suite of indicators focused on consumption behaviour (WFP 2005). Aiga
and Dhur (2006) state that WFP combines information on food consumption in terms of three
separate but related elements: i) dietary diversity, (number of unique food items consumed during
the previous seven days); ii) food consumption frequency (number of days during which each
food item was consumed over the previous week); and iii) the primary source of each food. This
recently-developed approach recognizes diet quality, separate from dietary ‘adequacy’ (volume of
consumption, or adequate calorie intake), and links these to information on sources of food which
allows for attention to entitlement issues, and to issues relating to personal and social
acceptability of food procurement methods, reliance on transfers, and other potentially 3 Even earlier, a 1966 WHO manual on nutrition assessment stated that “it is obviously important to have as much detailed knowledge as possible of the foods actually eaten in the community, both for assessing nutritional status and for discovering the dietary etiological factors that may be amenable to correction.” (p.114)

3
unacceptable means of food provisioning. 4 The underlying concept is that appropriately
constructed indices of diversity in patterns of consumption reflect overall food adequacy at the
household level, nutrient adequacy across members of the household, as well as an ability to
avoid dietary monotony that may be associated with poor diet quality, and that such indicators
offer an understanding of household food access that is related to, but different from,
conventional measures of child nutritional status or mortality (Dhur 2007).
However, the key is to determine what “appropriately constructed” means for WFP’s
beneficiaries—people who are food insecure, often nutritionally compromised, usually facing
high mortality risks in a very wide range of settings, not only in the context of chronic poverty
but also in emergencies where food systems are constrained if not facing total collapse. This
study was commissioned as part of a wider process that has sought to determine if measures of
diet diversity can indeed be constructed to determine levels of dietary inadequacy in populations
at risk of nutritional compromise—particularly in the context of acute food insecurity.
4 Attention to quality of diet is reflected in recent statements such as: “WFP has seen no evidence of starvation in Kandahar city, although there are many people who have inadequate diets both in terms of the amount of food available to them, and in diet diversity.” (Reliefweb, report on food insecurity in Afghanistan, May 30, 2007)

4
2. Study Aims
The aim of the study originally commissioned by WFP/SENAC was to test the operationalization
of dietary diversity measures as proxy indicators of household food insecurity in emergency-
affected populations. Part-way through the study process, WFP called for a reorientation in the
objectives, which involved assessing dietary diversity as an indicator of caloric adequacy,
specifically, rather than as an indicator of food security more broadly. This shift in focus affected
which secondary data sets were suitable for analysis and introduced limitations related other
subsidiary questions of interest to both WFP and TUFTS. This final report responds to this
refocusing by WFP. The revised objectives are presented here, followed by a brief discussion of
the questions that cannot be answered within the limitations imposed by the new study aims.
The main objective of this study is to provide guidance on operationalizing dietary diversity (DD)
indicators in the assessment of household caloric adequacy. (As noted, this represents a change
from the original objective to explore such indicators as measures of household food insecurity in
emergency situations.)
The aims are the following.
1) Compare various DD indicators (constructed from food groups and/or individual food
items) to determine which is the closest proxy for deficiencies in household caloric
adequacy
2) Assess which method for classifying households using their dietary diversity
characteristics best predicts caloric insufficiency.
3) Determine the extent to which households in widely different contexts with the same
dietary diversity profile also have the same caloric intake. To what extent can the same
DD measure and cut-offs be used in different locations.
4) Assess the potential confounding effects of issues like wild food consumption, distress
food consumption, and food aid receipts, on the interpretation of measures of dietary
diversity in very food constrained populations.5
5) Examine the implications of the above for the collection of baseline and emergency needs
assessment data.
5 This set of questions was de-emphasized after a refocusing of the study objectives by WFP which limited the data that we could use to chronically food insecure populations rather than crisis-affected ones, However, this small set of questions pertaining specifically to emergencies will be explored in a single data set collected from Darfur in 2005.

5
WFP was hopeful that it would be possible to examine these objectives in both emergency and
non-emergency contexts. However, our ability to meet these two priorities in combination was
severely limited by the lack of calorie data in emergency data sets. Because of these data
limitations, and based on discussion with WFP, we were required to prioritize those data sets that
offered scope to calculate a caloric adequacy benchmark for validation purposes, even though all
of these data sets originated from non-emergency situations. Other sub-questions related to
operationalizing DD were not examined here due to the data limitations imposed by restricting
the data sets to those with caloric adequacy information:
a. What is the most appropriate reference period?
b. Should the actual number of times a food was consumed be counted, or is it adequate to
capture the number of days that a food was consumed?
c. Should individual level dietary information be included, or just household level?
d. Does applying weights based on frequency of consumption improve predictive ability of
the DD indicator?
e. How well does the current WFP approach to classifying households based on DD
information predict caloric sufficiency?
f. How important are seasonal variations, and how can we account for them?
None of the available data sets (that were selected because they yielded caloric consumption
information) included a variable reference period; none included information at the individual
level, and none included information on the same households in different seasons. Only a single
data set, the NRVA 2005 data from Afghanistan, included information on frequency of food/food
group consumption that would have enabled a validation of the WFP approach to classifying
households based on their dietary diversity. However, the frequency data were found to be
inconsistent with the food consumption data for nearly 50% of households, and these
inconsistencies were not randomly distributed throughout the sample (see Appendix A for a more
complete description of the inconsistencies). As such, Tufts and WFP agreed that the results of
the frequency questions in the NRVA data were not sufficiently reliable to use in testing the WFP
dietary diversity approach.
We recommend WFP consider undertaking data collection to make it possible to address these
very important questions in an appropriate population; in our conclusions we briefly summarize
the types of information that would be needed for such a study.

6
3. Background and Review of Relevant Literature
Diversity in diet carries the implication not only of ‘sufficiency’ (in nutrient terms), but also of
avoiding monotony. Dietary choice was seen to be important as early as the late 19th century,
when first attempts were made to determine national poverty lines—drawn up (as still today)
using the cost of a basket of foods considered to be essential to meet minimum dietary needs
(Dixon and Macarov 1998). From the earliest days of poverty measurement, adequacy was never
considered solely in terms of a single food that would meet most energy requirements. This is
because, as pointed out by Behrman and Deolalikar (1989) in their analysis of data from 47
developing countries, “as food budgets increase from very low levels, there is a very pronounced
increase in the demand for food variety. [Food] variety per se is valued so that people purchase
increased food variety as their incomes increase, even though that may not alter their calorie
intakes.”
The challenge has been to determine how much diversity is minimally sufficient—or, to put it the
other way, below what point can we universally determine there to be a dietary adequacy
problem? Behrman and Deolalikar (1989) noted that this is not easy to establish since it depends
on, a) demand factors (e.g. nutrition knowledge, taste and preferences), and b) supply factors (e.g.
availability of foods to choose from, relative prices, research and transaction costs), and both are
relevant at even the lowest levels of consumption--that is, even at very low incomes, poor
households are concerned not only with obtaining calories at the lowest cost, but with moving
away from monotony as fast as they can. This means that diversity is a relevant concept even
when calorie requirements have not yet been met, and this makes the determination of absolute
cut-off points for measures of dietary diversity difficult.6
Of course in times of crisis, typically characterized by a collapse of purchasing power coupled
with constrained food supply, diversity is squeezed in the search for minimum calories. This
results in dietary adaptations that lie at the core of most household coping strategies. These go
beyond reduced consumption to include substitution towards nutritionally inferior (and less
desired) commodities, trade-offs in the allocation of food within households (some family
members receiving less food or specific nutrients than they need), compromised quality of foods
(consumption of otherwise marginally edible stocks), and increased consumption of foods strange
to the normal diet, including uncultivated or so-called ‘famine’ foods that may in fact be harmful
6 Behrman and Deolalikar (1989) point to additional methodological difficulties that are well laid out in Patil and Tallie (1982).

7
to the consumer (Wiesman et al. 2006; Webb et al. 2006). 7 Each of these consumption
adaptations has implications for dietary adequacy measured in terms of ‘quality’ (diversity,
nutrient density, nutrient adequacy, etc), not just quantity.
The scientific literature on measures of dietary diversity (hereafter referred to as DD) has
mushroomed recently. Most of this literature continues to be supportive of an important general
conclusion: measures of DD (be they counts of unique foods, food frequency measures, or indices
constructed around food groups) are typically robustly correlated with outcome measures of
human wellbeing, including socioeconomic status, child nutritional status, energy consumption,
and some aspects of micronutrient status (Hoddinott and Yohannes 2002; Arimond and Ruel
2004; Wiesman et al. 2006; Savy 2006). One example of a study that measured diet diversity not
against nutritional outcomes but explicitly against indicators of household food security was
Gittleson et al. (1998), which found in Nepal that, “caste status and socio-economic status were
more associated with frequency of consumption of the different food groups than the food
security scales” constructed around current food stores and the flow of 20 key foods ‘into and out
of the household’ during the preceding 12 months (p. 215).
That said, there is little consistency in the way that indicators are constructed or what they are
measured against (i.e. what they proxy for). Most DD indicators are similar in that they are
commonly constructed as a score. DD scores tend to consist of a simple or weighted sum of
either of individual food items or groupings of items consumed in a given recall period. The
‘score’ approach generates a relative measure; that is, it only determines whether one household
ranks higher or lower than others in the same sample, not how well a household fares relative to
an absolute standard. Continuous scores are usually ordinal rather than using intervals. Whereas
ordinal scores tell us that a household with a higher score has more dietary diversity than
households with a lower score, interval level scales suggest (more usefully), that a household with
a score of 8 has double the degree of dietary diversity as a household with a score of 4. One
example of this approach is the work in Mali of Torheim et al. (2004) who tested two simple
scores: one based on the number of unique foods consumed (a food variety score for individual
consumers), and the other based on the number of food groups consumed (a dietary diversity
score). They found both scores to be positively correlated with total energy intake, with
7 In this sense, ‘diversity’ is not axiomatically desirable in all cases since it could be linked to higher consumption of potentially deleterious foods, such as the drought-resistant grain Lathyrus sativus (see Getahun et. al. 2003), or (in urban settings) with unhealthy foods (van Dam 2005). As Arimond and Ruel (2004, p. 2585) put it, “depending on local diet patterns, high diversity scores may be more or less nutritionally meaningful.”

8
coefficients of 0.38 and 0.29, respectively. Another example is provided by work in Vietnam by
Olgle et al. (2001), who divided their sample into those with a high food variety score (≥15) and a
high diet diversity score (≥8), and those below those score levels. They too found that women
with high scores had significantly higher mean energy intakes than those with lower scores.
The problem is that the content of such scores has limited consistency across studies. For
example, the number of food groups used (which derive from choices about how to group foods
together or separately), and the number of potential individual ‘unique’ foods, differ widely.
Behrman and Deolalikar (1989) used 9 food groups in their 47 country study--separating fish
from meat, combining milk, cheese and eggs in one group, combining fruits and vegetables,
combining sugar with spices and salt, but separating out ‘coffee, tea and cocoa’ from other
‘beverages’. While Torheim et al. (2004), also created 9 food groups for work in Mali, these
groups were quite different in composition: cereals, legumes, oil/sugar, fruit, vegetables, meat,
milk, fish, eggs, and green leaves. By comparison, Kant and Graubard (1999) used only 5
groups: namely, fruit, vegetables, grain, dairy, and meat; and in Iran, Mirmiran et al. (2004) used
a score based on 5 groups (bread-grains, vegetables, fruits, meats, and dairy foods), but divided
into 23 sub-groups-- the bread-grain group broken down into 7 categories (refined bread, biscuits,
macaroni, whole bread, corn flakes, rice, refined meal), the fruit group divided into only 2
subgroups (fruit and fruit juice, berries and citrus), vegetables into 7, and so on. The only
commonality across these studies was significant correlations among diversity scores and various
nutrition outcomes. This commonality should not be downplayed, however, since it suggests that
the associations between diversity scores and nutrition outcomes are robust to their construction –
an important observation for a study attempting to identify the ‘ideal’ DD index.
The aggregation of foods/food groups in an index, while useful to some extent, obscures
potentially important details regarding which foods are lacking from the diet and how often they
were or were not consumed. In Malawi, children with kwashiorkor were found to have a similar
diet diversity score as those with marasmus—although it is widely thought that kwashiorkor is
linked to a diet low in micronutrients and antioxidants as well as protein (Ndekha et al. 2006; Lin
et al. 2007). In other words, it is not easy to discern from a continuous measure which elements
of ‘diversity’ are doing what. Furthermore, including frequency weights into scoring systems can
exacerbate the problem since two different dimensions are folded into a single total, which

9
hampers interpretation.8 However, adding the number (frequency) of servings of foods consumed
does bring any score closer to actual consumption patterns. In Iran, Azadbakht et al. (2005)
found that while energy intake was a strong predictor of the mean probability of adequacy in
models controlled for age, body mass index, education level and job status (R2=0.48), adding the
number of servings from each of the food group to the models significantly improved the model
fit (R2=0.55).
Categories within groups also matter; that is, it has been argued that within a single food group it
is important to consume more than one item (such as wheat, sorghum and rice within the rubric of
cereals), rather than only one of them (Kennedy et al. 2005). And while not consuming vegetables
is a known health risk, it has also been shown that an increase in the number of different
‘vegetables’ consumed can lower cancer risk—again suggesting that within category differences
may matter (Slattery et al. 1997). Similarly, Proudhon (2002, p.66) has argued that “it is
essential that protein intake be diversified in order to compensate for [the fact that] foods from
animal sources generally offer a more satisfactory amino acid profile than foods from vegetable
sources.”
Nutrient density is another feature of many scoring systems that seek to interpret the ‘value’ of
the diversity, beyond diversity’s sake. For example, the Consortium for Southern Africa Food
Security Emergency (C-SAFE) activity has used a score based on the nutrient density of multiple
foods, leading to a maximum possible score of 48 (the higher the score the more nutritionally
dense the diet).9 Similarly, researchers in Zambia weighted their food groups according to
density, such that consumption of foods from a nutrient-rich meats group received 4 points, while
the cereals group received only 2 points (FHANIS/CSO 1998). Indeed, Hoenicke et al. (2006) go
so far as to suggest that micronutrient deficiencies in the Philippines are “caused by low
quantities of micronutrient-rich foods [more] than by a low diversification in the meals. Dietary
diversity measured in the number of different food items consumed does not differ significantly
between poor and non-poor, nor between micronutrient-deficient and non-deficient households.”
This view is supported by Pathak et al. (2004) who found in India that consumption of foods “rich
in micronutrients (pulses, vegetables, fruits, nuts and oil seeds, animal foods) was infrequent [and
8 Consider a score with just 2 food groups and frequency options ranging from 1-4 days. A household scoring a “4” may be consuming one food group on four days or two food groups on two days each. 9 A consortium of international NGOs led by CARE, CRS and World Vision implementing food security programming in Southern Africa

10
therefore that] low frequency of consumption of food groups rich in micronutrients” was a key
factor in deficiencies.
It is in part because of such concerns that some researchers specify the nutrient-specific outcomes
of specific interest, and tie those to the foods most likely to deliver the required nutrients. For
example, Newby et al. (2003) constructed an index to measure diet quality on a risk gradient
specific to diet-related chronic disease. For this index they used 8 ‘food’ groups that are in fact a
mix of foods and individual nutrients (total fat, saturated fat, cholesterol, fruit and vegetables,
grains and legumes, protein, sodium, and calcium). These were summed into a composite diet
quality score ranging from 0 to 16, and the authors found that the index is strongly related with
high fiber and vitamin C intakes. Also in this domain, Rose and Tschirley (2000) devised a
Mozambique Diet Quality Index, with a range from 0 to 10 representing a sum of component
scores for individual nutrients--2 points each for iron, vitamin A, energy, protein, plus 2 points
for the mean level of adequacy for 7 other nutrients. And Pedro et al. (1996), who focused on
dietary inadequacy of Vitamin A intake, categorized foods as being high, moderate or low
providers of vitamin A based on the retinol content of typical portion sizes, and found significant
correlations between intake scores and biochemical markers of nutrient status among pre-school
children.
Of course, school children have different absolute requirements than adults, and men have
different requirements than women, and some researchers have sought to specify relationships
between food groups and nutrient outcomes or diseases not only for the general population, but
also for specific sub-populations of consumers. Kennedy et al. (2007), for instance, assessed
whether a diet diversity score based on a simple count of food groups consumed, combined with a
quantity measure (a 10-g minimum intake for each food group), can indicate micronutrient intake
in non breast-fed Filipino children of 24 to 71 months old. They found that while the average diet
consisted of 4 to 5 food groups, the best cut-off points for achieving 50 and 75% probability of
adequate micronutrient intake (thereby maximizing sensitivity and specificity) were 5 and 6 food
groups, respectively—for pre-school children only. Similarly, in Malawi, Gibson et al. (2003)
calculated a food diversity score aimed at assessing micronutrient status in only stunted children
ages 30 to 90 months, while Sullivan et al. (2006) used a diversity score to assess micronutrient
sufficiency among severely malnourished children aged 1 to 5 years. At the other end of the age
spectrum, Bernstein et al. (2002) used a dietary variety score ranging from 23 to 48 (with a
specific fruit and vegetable variety score from 5 to 20) applied to the consumption of frail, elderly
nursing home residents. Again, higher variety was associated with better markers of nutrition.

11
A second type of DD measure classifies households and facilitates judgment about their absolute
dietary adequacy or well-being.10 For example, Kennedy et al. (1995) developed a Healthy
Eating Index using a score based on the degree to which respondents self-reported consumption
in line with dietary guidelines (as well as validating against biochemical markers of nutrient
adequacy). Similarly, Mirmirian et al. (2006) found that a constructed dietary diversity score in
Iran was a useful indicator of adequacy achieved across 14 nutrients. But again there is a wide
range of approaches used. Sometimes the reference or benchmark is defined as the a ‘normal’
diet for the population (when seeking to determine relative changes in patterns), while others
refer to national or international standards set for adequate intake (AI), recommended daily
allowances (RDA), or specific levels of micronutrient requirements (see Devaney et al. 2007 and
Bondia-Pons et al. 2007).
An additional element is consideration of balance among foods, often measured in absolute terms
against food pyramid recommendations on servings by food group. Using a Diet Quality Index to
assess diet quality across countries (at the national level), Kim et al. (2003) also focus not only on
food variety and adequacy, but also on overall dietary balance, as do Arimond and Ruel (2004) in
their focus on “balance between plant foods and animal-source foods”. Schneider et al. (2000)
constructed a ‘mini nutritional assessment’ as a prognostic tool in hospitals that combines
questions about food items and frequency, such as whether or not an individual consumes, “at
least one serving of dairy products per day; two or more servings of beans or eggs per week; two
or more servings of fruits or vegetables per day”, and so on.
In some cases, ‘balance’ is defined in terms of first meeting minimum requirements in terms of
energy or some other nutrient (a conditional term), and then adding diversity above that.
According to Allen (2006), for instance, “dietary diversity is an especially important determinant
of micronutrient intakes when animal source food intake is low.” Her contention is that when
animal source food consumption is high, several other conditions of ‘balance’ in the diet will
have already been met, and hence a diversity score is only useful at certain levels of deficient
consumption. Tarini et al. (1999) similarly argue that while dietary scores can be useful, “the
diversity of food eaten may be a better determinant of growth status if energy intake is close to
meeting dietary requirements.”
10 This method has so far mostly been used in richer countries, although WFP has adopted this approach in its VAM Household Food Security Profile Thematic Guidelines (2005). .

12
Operational organizations are interested in such issues, which relate to important elements of
categorical indicators, for several reasons--not least because they allow for estimates of the
prevalence of a particular problem. However, categorical indicators are not always more useful
than a continuous score. Coates et al. (2003) found that a continuous household food insecurity
score could detect more subtle changes in household food insecurity than three broad categories.
The reason is that a greater magnitude of change was required for a household to shift from one
entire category to the next, than to shift more subtly along the scale. Furthermore, a continuous
DD score is well-suited for monitoring changes in DD over time. With a baseline, the increase
or decrease in number of food groups consumed can be reported and, with a known relationship
to other indicators of interest, the information can be used to predict corresponding improvements
or deteriorations in dietary adequacy or other measures of household well-being.
Categories are typically created by applying cut-offs to an existing score (e.g. households with a
score >5 may be considered to have sufficient dietary diversity). In the literature, these score cut-
offs are sometimes arbitrary (subjectively defined), sometimes derived by splitting the score into
statistical terciles, and other times arrived at using a systematic process of sensitivity/specificity
analysis or ROC curves that compare the proxy indicator to some gold standard. When there is
no clear gold standard, as in the case of household food insecurity measurement, ‘expert
judgement’ or ‘consensus’ is relied on instead (see FANTA, 2006; Ohls et al. 1997).
The ultimate goal of food insecurity measurement is the identification of a score and categorical
indicator that can validly measure food insecurity in any context, and therefore facilitate
comparisons not only across time and space but also across geographic and cultural context.
Much of the literature that seeks to construct and validate diversity scores begins with the a priori
assumption that all diets are local and that any DD score is not likely to be generalizeable. For
example, Lorenzana and Sanjur (1999) created their index only using 12 foods identified as being
‘important in the local diet’. Indeed, both Ruel (2004) and Wiesman et al. (2006) suggest that
since individual foods can be highly context-specific, food groups need to be carefully defined for
each population based on their specific local diet: “cut-off points to define varying levels of
diversity have to be defined in the context where they are used, taking into account local food
systems and dietary patterns” (Ruel 2004, p. 3924).
However, there remains a hope that, while so-called ‘process’ indicators may be context specific
(such as ability to make charcoal, to migrate, or to sell land), a diet diversity measure, based on
13
common physiological underpinning, still has the potential be comparable across contexts.
Coates et al (2006) recognized that there is a commonality to the experience of household food
insecurity that appears to transcend cultural settings and experiences, since it relates (at a deeper
level) to consuming or not consuming sufficient food to survive and thrive. Analysis across
multiple data sets resulted in a set of generic questions that tap into this ‘universality’ and allow
for construction of continuous and categorical indicators from 9 core questions. Similarly, the
Coping Strategies Index developed by Maxwell and colleagues (Maxwell 2007) has been tested
across many settings and has shown to be strongly associated with food insecurity benchmarks
regardless of context. The question now is, can the same be said of indicators of diet diversity
that link directly to consumption patterns, but also relate to differing degrees of household
vulnerability to food insecurity?
We must acknowledge, however, that construction of dietary diversity indicators may not always
represent the simple, fast, cheap alternative to other diagnostic approaches. Some studies have
questioned the power of food frequency questionnaires to assess critical aspects of consumption
behavior and resultant nutrient intakes—not because such approaches are not valid, but because
the methods adopted in getting information from consumers will have a significant impact on the
results obtained (Shaefer et. al. 2000). For example, Persson et al. (2001) conducted a study in
Indonesia of the reliability of dietary intake methods using 24 hour recalls. They found that a
single dietary report had relatively poor predictive power for actual consumption; two or three
repeated recalls gave good results for macronutrient intake, but at least six replicates were needed
to get reasonable data on micronutrient consumption. Longer recall periods may improve
representativeness of the usual diet, but often at a cost in accuracy of recall. Similarly, a recent
report from the US Department of Agriculture was based on a critical assessment of methods
used in dietary surveys (Devaney et. al. 2007). The authors found that errors in dietary recall
data—either underreporting or over-reporting of intakes—led to reported inadequacies in food
intakes. And Tur et al. (2005) found that an international diet quality index was not always useful
in identifying dietary inadequacies, “due to methodological factors and cultural biases.” None of
this invalidates DD measures, but these studies do remind us of the need for caution in the
interpretation of any indicator, and for methodological rigor in collecting the data on which it is
to be based.
Testing the relationship of dietary diversity to caloric or nutrient adequacy or household food
security is a significant challenge. As van Dam (2005) put it, “the methodology to study dietary
patterns is still developing, [and it is not yet clear] what methods will be most useful for

14
addressing confounding factors, formulating new hypotheses on the link between diet and
disease, and providing information for…interventions” (p.574). A valid assessment across
contexts requires data that are collected using standardized instruments in different (ideally food
insecure) locations. For instance, the Demographic and Health Surveys recently began to use a
standard set of 15 food groups when collecting information on dietary patterns in their multi-topic
surveys, and FANTA has recently published a guide advocating the use of those same food
groups for measuring household food insecurity (Coates et al. 2006). This study is not so much
concerned with taking a single, ‘standardized’ score or index and validating it for use in
emergency contexts, but rather tackling two underlying, first-order objectives: 1) to identify an
optimal (valid, predictive) construction, and 2) to ensure it is suitable for use within and across
multiple food insecure contexts.

15
4. Methods
4.1 Analytical Strategy
The first aim of the study was to evaluate which of various continuous DD indicators (ie. in the
form of an index) were most closely associated with the benchmark variable, household daily
caloric intake per adult equivalent. The investigators were interested not only in associations
within a particular data set, but also in the extent to which these associations were similar across
data sets, in order to judge the universality of dietary diversity patterns as predictors of calorie
intake.
The variable ‘household caloric adequacy per adult equivalent’ was computed from each data set
(see section 4.4, below, for more detail) along with candidate DD indicators. These candidate
indicators were standardized to the extent possible across each of the four data sets analyzed for
this part of the study (See section 4.5 for a description of these indicators). In order to assess
which of these candidate indicators did the best job of predicting caloric adequacy, first bivariate
correlations (Spearman r for non-parametric distributions) were examined both among the
candidate indicators and between each indicator and the caloric adequacy benchmark. The
direction and magnitude of these correlations were also compared across data sets. Next,
individual OLS regression models for each of the candidate DD indicators in each data set were
tested, predicting household kcal per ae from the DD indicator and controlling for common
confounders like household size and geographic (urban/rural) location. Next, logistic regression
models for each indicator and data set tested the degree to which different levels of the candidate
DD indicators increased the likelihood of a shortfall in a consumption threshold (defined as
consuming at least 1800 kcals/ae, specified as a yes/no dummy variable).
A second key goal of the study was to determine whether households could be classified on the
basis of their dietary diversity patterns in order to draw conclusions about the sufficiency of their
caloric intake. Another goal was to explore the feasibility of applying the same cut-off (not just
the same approach) across data sets, in order to make comparisons from one place to another
about the households’ or populations’ status.
One way of doing this is to conduct a contingency table analysis comparing the classification of
households above and below a cut-off on the candidate measure to households above and below a
critical level of a benchmark (in this case, caloric adequacy using the 1800-calorie benchmark).
There are three primary concepts of interest here: the ‘sensitivity’ of the indicator – the

16
proportion of households with insufficient caloric consumption detected as such by the candidate
indicator; the ‘specificity’ of the indicator – the proportion of households with sufficient calories
detected as such by the candidate indicator; and the ‘predictive value’ – the proportion of
households with insufficient caloric intake among all households with insufficient intake detected
by the candidate indicator. The extent of misclassification is also of interest. Because contingency
table analysis can be quite sensitive to the specific cut-offs chosen for the candidate index (Chung
et al, 1997), in this study, the sensitivity and specificity were computed by consecutively
evaluating each value on the index as a potential cut-off, using the same benchmark cut-off (did
not meet 1800 kcals) throughout. This approach was chosen as an easier-to-communicate
alternative to estimating receiver-operator curves (ROC), that look at the classification of one
variable against another along a continuum of cut-off values, assessing the optimal relative
sensitivity and specificity of one against another. In this study the sensitivity and specificity of
different cut-off values were assessed against the benchmark in order to determine at which value
the sensitivity and specificity were maximized. These results were then compared across data sets
to see how similarly/differently the same cut-offs performed in different contexts.
An additional categorization approach was tested as an alternative to drawing cut-offs based on
an index. This approach is similar to the one currently used by WFP to classify households by
dietary pattern, but the WFP approach incorporates a measure of frequency of consumption over
a reference week along with a simple measure of whether or not the food was consumed. None of
the four data sets we used contained both kcal data AND information on the frequency of
individual food consumption – this frequency information would be needed to replicate the WFP
method, and the kcal data would be needed to validate it. In our approach, we constructed diet
patterns based on consumption of each of five nutrient groups: carbohydrates, fruits/vegetables
(non-animal micronutrient sources), fats/oils, animal protein sources, and vegetable protein
sources. All patterns of nutrient group consumption adhered to by households in the sample were
described using a simple pattern analysis: each of five nutrient groups were coded with a 1 if the
nutrient was consumed, zero otherwise. These 5 variables were combined in a string to produce a
summary of the consumption pattern for each household. We considered this approach to be more
straightforward to interpret than the cluster analysis used by WFP, and we would recommend it
for future work of this type. Once the various patterns were identified, the next step was to
determine which of the patterns best predicted caloric consumption (in)adequacy by examining
the percentage of households exhibiting each pattern that exceeded the caloric thresholds 1800

17
and 1600 kcals. As with all other analyses, these were performed for each data set so that
comparisons in local (and universal) categorization approaches could be made.
The third objective of the study was to conduct a limited analysis of an emergency data set to
assess basic issues related to the performance of DD indicators in contexts of acute food
insecurity (despite the lack of calorie availability data). Recall that the original intention of the
study was to examine issues related to dietary diversity measurement in emergency contexts and
the relationships between dietary diversity and food insecurity indicators. After WFP decided to
refocus away from food insecurity indicators more broadly to HH kcal adequacy specifically, it
was necessary to identify data sets that would enable the calculation of HH kcals/ae. Because no
data from an emergency context could be identified that had HH kcal/ae information, no
emergency-affected/acutely food insecure populations were included in the earlier analyses
described above. Despite the lack of the calorie benchmark in the emergency data, Tufts
investigators felt it was worthwhile to conduct some basic assessment of issues in the
performance of DD indicators in contexts of acute food insecurity.
Therefore, the following questions were tested using data collected from Darfur in 2005:
1) What is strength of the correlation of DD indicators – constructed both with and without
wild/distress foods - with other food security benchmarks?
2) How does wild food consumption relate to the consumption of other types of foods? How
well does it serve as a proxy for food insecurity?
3) How well does the WFP method of categorizing households by DD predict household
food security?
4) To what extent do households that received food aid and those that live in camps for
internally displaced persons (IDPs) have higher dietary diversity than those that do not?
Cross-tabulations and bivariate correlations were performed to assess the role of wild foods in the
dietary diversity score, to examine the association among different dietary diversity indices and
proxy indicators of food insecurity, and to assess the extent to which various dietary adequacy
classifications also classify households as food insecure.
Multivariate linear regression analysis using ordinary least squares (OLS) was used to identify
predictors of dietary diversity and, in particular, to determine whether and how food aid receipts
and household displacement status (ie. camp resident or IDP non-camp resident) affects dietary

18
diversity. A Breusch-Pagan test identified heteroskedasticity in all regression models, so each
model was re-estimated using robust standard errors.
Two separate models were used to identify predictors of dietary diversity amongst all households.
The first used a dietary diversity score that represented the average number of foods consumed
per day (including the collapsed cereals category and excluding wild foods) as the dependent
variable. The second model used a score which reflected the number of food items the household
consumed per week. This indicator maintained each cereal category separately and included wild
foods. Both of these models included IDP household status as a binary variable (1=IDP
household living in a camp or IDP household living in a community; 0=resident household).
Two additional models were estimated to more closely analyze the effects of different variables
on dietary diversity amongst only IDP households. The same outcome variables and independent
variables were included in the model with one exception: IDP household status was used as a
binary variable with 1=IDP households living in a camp and 0= IDP households living in a
community.
It was expected that the set of analyses from this portion of the study, though not exhaustive,
would be most useful for assisting WFP to determine which issues are most important in field-
testing and validating an 'ideal' DD indicator for application in emergency contexts.
4.2 Selection of Data Sets
In order to enable the assessment of different DD predictors of caloric adequacy, data sets were
evaluated according to the following criteria:
1) Data sets analyzed in the study were selected if they offered the means to calculate a) the
benchmark, in this case household caloric intake per ae, AND b) various candidate DD
indicators believed to be possible proxies for the benchmark.
2) Data sets also needed to contain information on other covariates, including urban/rural
location, socio-economic status, land holdings, and household size and dependency ratio
that could be constructed comparably from one data set to the next.
None of the EFSA or CSFVA data sets reviewed offered the means to calculate household caloric
adequacy. For this reason, other available data sets were evaluated for the study, including a

19
number of data sets owned by Tufts, several publicly available data sets on the IFPRI website,
and LSMS data from the World Bank.
Based on these criteria, data sets from the following countries were selected for further
evaluation: South Africa, Ghana, Afghanistan, Burundi, Malawi, Bangladesh, and Ethiopia. After
a preliminary evaluation suggested that these data sets were suitable, work began to construct the
benchmark, caloric adequacy. However, part way into the task, three of the data sets (S. Africa,
Burundi, Malawi) had to be dropped after investigators encountered obstacles that impeded the
calculation of the calorie variables. These obstacles included: data in an overly aggregated form
that made it impossible to apply to a nutrient database for conversion from quantity consumed to
calories, data collected as part of very simplified food expenditure modules that were not detailed
enough to be accurate/complete, and food expenditure modules that collected information on
purchased quantity using units (eg. finger, can) that could not be converted to weights and
therefore not to calories. We were left with four data sets for the calculation of DD indicators and
their relationship to calorie consumption: Afghanistan, Bangladesh, Ethiopia, and Ghana, as well
as a data set containing different information collected in Darfur. A description of these data sets
follows.
4.3 Description of data sets
Five data sets were used in the analysis for this report. This section offers a brief description of
the characteristics of these data sets.
The Bangladesh Food Insecurity Measurement and Validation Study (FIMVS) was a three-year
FANTA-funded research initiative intended to develop and test a process for adapting the US
household food insecurity scale to developing countries. During the third survey round analyzed
for this study, experienced male and female enumerators administered a detailed questionnaire to
565 of the 600 households that had participated in the prior survey rounds (35 households were
lost to follow-up). The original sample was drawn from the north, center, and south regions of the
country. The subdistricts (upazilas) from which the villages and households were chosen were
classified primarily as ‘highly food insecure’ by the WFP/VAM Bangladesh mapping exercise.
Implemented in February 2003, the third survey round included information on individual and
household characteristics including demographics, anthropometry, morbidity/mortality, income
sources, water, agricultural production, food and non-food expenditures, assets, nutrition
knowledge, and household’s experience with and perceptions of food insecurity. Dietary data
from the survey was in the form of a 24-hour recall of individual food consumption by the female

20
respondent in charge of meal preparation. Individual recalls were aggregated to construct an
estimate for the household. In addition, enumerators provided a household food security rating of
each household based on their observations.
The Accra Urban Food and Nutrition Security Study (AUFNS)11. This dataset was collected
among households in the urban area of Accra in Ghana between January and April 1997. A total
of 559 households in 16 enumeration areas in the Greater Accra Metropolitan Area were selected
on the basis of including at least one child under the age of 36 months. Data were collected by
the International Food Policy Research Institute (IFPRI) in collaboration with the Noguchi
Memorial Institute for Medical Research at the University of Ghana, Legon. The data set includes
information on household livelihoods, income and employment status; household food
consumption (including detailed information on street food consumption) based on a seven-day
recall; household food and non-food expenditures, assets; care practices; and the nutritional and
health status of women and children. Topics in the community survey included market prices,
street foods, quality of services, and NGO activity. Data for the present study were drawn from
the modules on food consumption and expenditure, household demographics and coping
strategies. Information about household food expenditure and consumption was based on a
seven-day recall, which included detailed individual accounts of street food consumption.
The Ethiopia Rural Household Survey (ERHS)12. This dataset was collected from households in
selected rural communities in Ethiopia in four rounds (1989, 1994, 1995 and 1997). Initially
conducted in seven Peasant Associations (PAs) located in Amhara, Oromiya and the Southern
regions, the last three rounds included 15 villages in various parts of the country, including the
central and northern highlands, enset-growing areas in the south, and sorghum growing areas in
drier parts of the country. The sample was 450 households for the first round, 1477 for the latter
rounds. The nine additional communities were selected to account for the diversity in the farming
11 The data from the Ethiopia Rural Household Survey (ERHS) have been made available by the Economics Department, Addis Ababa University, the Centre for the Study of African Economies, University of Oxford and the International Food Policy Research Institute. Funding for data collection was provided by the Economic and Social Research Council (ESRC), the Swedish International Development Agency (SIDA) and the United States Agency for International Development (USAID); the preparation of the public release version of these data was supported, in part, by the World Bank. AAU, CSAE, IFPRI, ESRC, SIDA, USAID and the World Bank are not responsible for any errors in these data or for their use or interpretation. 12 The data from the Accra Urban Food and Nutrition Security Study (AUFNS) have been made available by the Nutrition Unit of the Noguchi Memorial Institute for Medical Research at the University of Ghana, Legon, and the International Food Policy Research Institute. Funding for data collection was provided by the World Health Organization and the Rockefeller Foundation. IFPRI and the University of Ghana are not responsible for any errors in these data or for their use or interpretation.

21
systems in the country, including the grain-plough areas of the Northern and Central highlands,
the enset-growing areas and the sorghum-hoe areas. One pastoralist area in Southern Ethiopia that
was included in the 1989 round had to be dropped from subsequent rounds because of conflict in
the area. Food consumption data were collected based on summing all purchases in the past
seven days, and adding food consumed in the last seven days that was obtained from own
production or draw-down of household stocks, or received as pay or gifts. Purchases, of course,
might have been intended for a longer period than the week of the purchase. Given how the first
part of the question was asked, respondents might have misunderstood the second and third parts
and reported food received in the past seven days, even if it was not consumed during that period.
The calorie intake data from this survey are somewhat suspect, therefore.
The data for the ERHS were collected by the International Food Policy Research Institute (IFPRI)
in collaboration with Addis Ababa University and the University of Oxford. The data set
includes information on household demographics, livelihood assets and knowledge, food
consumption and expenditure, health, women's time allocation, and community level data on
services and marketing. Data for the present study were drawn from the demographics and food
consumption modules of the fourth round data set.
The Afghanistan National Risk and Vulnerability Assessment (NRVA) was carried out in 2005
with the aim to “to gather information to update and guide policy-making decisions in
development programmes and to improve the efficacy of sectoral interventions” (Ministry of
Rehabilitation and Development and the Central Statistics Office, 2007). The NRVA was a
nationally representative survey, reaching 30,822 households in 34 provinces spread across
Kuchi, rural, and urban areas. Dietary data for the survey was captured with an instrument that
asked the person in the household primarily responsible for food preparation to report the quantity
of 64 different foods consumed by the household during the previous seven days. The authors
report that the amounts of food reported were only estimated, not weighed directly. Enumerators
were instructed to question respondents if they reported grain and fat/oil consumption suggesting
total consumption below 2100 calories per person per day; this instruction may have resulted in
overestimation of calorie consumption, since low-end consumption might have been rejected.
This information was used for both dietary diversity and caloric intake analysis.
Household survey data for the second part of the study were analyzed from the 2005 Darfur
Emergency Food Security and Nutrition Assessment (EFSNA). The assessment was conducted
jointly by the World Food Programme (WFP), the United Nations Children’s Fund (UNICEF),
22
the Food and Agriculture Organization of the United Nations (FAO) and the Government of
Sudan (GoS) from 26 August to 14 October, 2005. The 2005 exercise was a follow-up to a
baseline assessment which was conducted in September, 2004. The 2005 dataset was chosen for
this particular study because it was more comprehensive and collected more detailed information
on food security than the 2004 survey. Furthermore, by 2005, WFP had scaled-up its food aid
program, and the 2005 survey collected more data specific to food aid receipt, so this data set
offered the possibility of testing the effect of food aid on dietary diversity. The sample was
designed to be representative of “crisis-affected” populations (as classified by OCHA in August
2005) across the three Darfur states. Populations in the sample include ‘community residents’,
internally displaced persons living in camps, and IDPs living outside of an official camp situation.
A multi-stage cluster sampling technique was used to select 30 clusters of 30 households for each
state, and the total number of households surveyed was 2,090. Survey respondents were an adult
male or female, usually brother or sister of the household head.
In this survey, a household was defined as, “A group of people who routinely ate out of the same
pot, and [author emphasis] slept in the same structure or family compound (or physical
location)”. The WFP (2005b) report notes that individuals qualifying as household members
under this definition were not necessarily relatives and may have lived (but not slept) in a
different physical environment. Available dietary data from this survey include a dietary
diversity module asking respondents to recall the frequency of their consumption of 12 different
foods and food groups over a period of 7 days. This module includes information on the primary
source of food consumed in each of these groups. Additional questions asked separately about
the number of meals that adults and children consumed in the previous day.
Table 1 summarizes the characteristics of each study data set.

23
4.4 Calculation of Caloric Intake per Adult Equivalent
Due to differences among the data sets in how the dietary information was recorded, each of the
four data sets used for the bulk of the study required slightly different approaches and
assumptions for the construction a caloric adequacy variable. In the sections that follow, we
summarize the approaches and assumptions for each data set.
4.4.1 Bangladesh: Bangladesh Food Insecurity Measurement and Validation Study (FIMVS)
Calorie consumption was derived from a 24-hour recall administered to the female head of
household or main food preparer, who estimated amounts prepared at home, and the portions for
each member or guest consuming the meal. Quantities of foods as consumed were converted to
calories using appropriate food composition data bases.
First each individual household member’s caloric needs were estimated based on age, gender, and
physiologic status (pregnancy/lactation). Rather than using the body weight of individual, the
Bangladesh population’s average weight is taken13. Medium body frame and medium level of
activity was assumed. For women who were identified as pregnant or lactating, an allowance for
the extra calorie needs (e.g. 285 kcal for pregnant women) was added. For the children between 6
months and less than ten years old, the child’s age and gender were used to determine the calorie
requirement. The children less than 6 month old are excluded from the analysis since there is no
information on their breast milk consumption or food allocation. Each individual’s calorie
requirement was divided by caloric requirement of an adult male with average weight and
moderate physical activity level, age between 30 to 60 years old, considered to be 1.0 adult
equivalent. The following is an example of how the adult equivalent size of household.
In this data set, information was collected on guests in the household. The presence of guest
requires special treatment. Guests often did not share all three meals in the households. In this
case, adding the caloric n the calorie availability per adult equivalent per day. Therefore the
presence of guests was considered meal by meal. In most cultures, calories consumed at daily
meal are not equal to each other (e.g. breakfast can be lighter than the lunch and perhaps lunch is
lighter than dinner). In the data from Bangladesh we found that 30%, 35%, and 35% of total
caloric intake were taken at breakfast, lunch and dinner respectively by using household heads’
13The average weight per each age and gender group is taken from “Measuring household food consumption: a technical guide”, (Swindale and Ohri-Vachaspati 2004).

24
meal pattern14. The weight of each meal’s calorie was factored in the calculation for the guest’s
caloric need. For instance, a 30 year old male guest who was present for breakfast and lunch is
considered as .65 adult equivalent.
4.4.2 Ghana: The Accra Urban Food and Nutrition Security Study (AUFNS).
The caloric adequacy variable was constructed from a food expenditure and consumption module
that took into consideration food purchase, home production, food gifts, remittances of food into
and out of the household, and changes in food stocks over a seven day period. Given the
complexity of food preference, this module was extensive, and covered a vast array of street
foods that had to be collected on an individual by individual basis, not a household basis. In total,
street foods accounted for about 1/3 of total consumption. A variety of common measures were
used to estimate quantities of food, which were then converted into weights, and each item was
given a caloric value per 100 grams using a locally applicable nutrient database. Food
consumption at the household level was then divided by the number of adult equivalent units in
the household to get an estimate at the ae level. This estimate included in the calculation of
calories per adult equivalent guests and the number of days out of the past seven that such guests
consumed food in the household. Street food consumption by individuals was aggregated into the
household total.
One issue in the Ghana data set was that mixed dishes could not be disaggregated into their
component ingredients, so that such items were categorized according to the ingredient that was
presumed to provide the greatest proportion of calories.
4.4.3 Ethiopia: The Ethiopia Rural Household Survey (ERHS).
The caloric adequacy variable was derived from a food expenditure questionnaire that asked
households to recall, over the previous 7 days, whether they had purchased any of 34 common
foods for consumption or consumed these foods from their own stock or from food received as
pay or gifts. The questionnaire collected a) the quantity of foods purchased, b) quantity of foods
consumed from household stock, and c) foods received and consumed from gifts, in-kind wages,
or barter. A few prepared dishes were also included. Because the amounts of foods were
recorded using local units (eg. chinet, dawla), a conversion file, included with the IFPRI data set,
was applied to convert the local unit amount of each of the different food items into kilograms.
Next, the amount consumed for each food item was converted to calories using a nutrient
14 The male household head who had breakfast, lunch, and dinner was selected. The average contribution of breakfast to the calorie was .30. that of lunch and dinner was .35.
25
database obtained from the Ethiopian Health and Nutrition and Research Institute (EHNRI)15 that
adjusted appropriately for edible portion, supplemented with the FAO Infoods data base for
Africa when necessary. The calories for each food item were summed to obtain a total household
value. Once total calories consumed by the household was calculated, this figure was adjusted by
the age/sex composition of the household using adult equivalent (AE) conversions based on
calorie requirements by age/sex category listed in WHO/FAO (1985).
Though the process sounds simple enough, there were several challenges with this data set in
deriving calories from a module that was designed primarily to calculate food expenditures. The
calorie estimates derived from these data were high and extremely variable and did not behave as
expected. There are several possible explanations for these results. For instance, this type of
module does not include information on guests (or day laborers) who may have eaten with
household members. Additional food is typically purchased to feed guests, but we had no way to
count these additional individuals in the per capita or per ae calculations. This of course inflated
the number of calories actually eaten by household members. Second, the structure of this
module was difficult for respondents to understand, in that it asked about purchases in two
different ways – in the second way, it did not specify clearly that the interest was in purchases
that were consumed in the previous 7 days. Given the wording of the questions, it is probable that
respondents were reporting food that entered the household, not what they actually ate during the
previous week. In other words, bulk purchases that were intended to feed the family over time
were lumped together with smaller purchases that were actually consumed by the family within
the 7 day recall period. In order to account for these lumpier expenditures, reported items
weighing more than 25 kgs were dropped from the analysis. In the final calculation, the
distribution of consumption was truncated at kcals per AE higher than 8000 and lower than 500,
meaning that households with totals in this range were excluded as biologically implausible
outliers. These same cut-offs were used in all four data sets.
4.4.4 Afghanistan: Afghanistan National Risk and Vulnerability Assessment (NRVA).
The NRVA report (Johnecheck and Holland 2005) describes computation of caloric intake as
follows. “Caloric intake was estimated by converting consumed weights by the caloric values
listed in the FAO’s Food Composition Tables for the Near East. Caloric figures were adjusted by
using standardized amounts to account for partial wastage and refuse (labeled as the ‘as
15 Food Composition Table for Use in Ethiopia, Part IV. A Research Project Sponsored Jointly by the Ethiopian Health and Nutrition Research Institute (EHNRI) and the Food and Agriculture Organization of the United Nations (FAO), 1995-1997.

26
purchased’ caloric equivalents in the FAO’s table). These figures were then adjusted by age and
sex composition of the household in order to calculate household caloric sex and age adjusted
daily per capita intake levels. Adjustment was made for guests by taking the average adult
equivalent value for a person in the sample, and adjusting for the number of times a guest ate in
the household in the past week. The mean consumption level estimated using this method was
very close to the mean reported in the NVRA report. Because the food was not weighed during
the assessment, the data only provided rough caloric estimates for the household and are not
adequate for calculating the dietary intake of other nutrients”
These data were collected immediately following a record harvest. In addition, instructions on the
survey instrument stated that households should report a minimum amount of food consumed
(estimated in a table by household size and composition) in order for the reports to be plausible.
We believe, therefore, that the calories are overestimated, as enumerators were required to report
a minimum amount of consumption per household before submitting their completed surveys.
4.5 Calculation of Candidate Dietary Diversity Indicators
An often underestimated challenge in the construction and testing of DD indicators is to ensure
that the choice of comparator benchmark (for validation purposes) is driven by a clear sense of
what is being measured (is it energy adequacy, all-nutrient adequacy, ‘household food security’,
socioeconomic status?), and why (how will the measure be used?). In this study, WFP was
interested in testing dietary diversity primarily as a short-cut to assessing nutrient adequacy.
Nutrient adequacy represents both ‘sufficiency’ (calories) and ‘quality’ (macro and
micronutrients) dimensions of household food insecurity. Though nutrient adequacy was of
primary interest, other nutrient intakes aside from calories were considered by WFP to be too
difficult to estimate accurately from available data. As a result, the decision was taken to limit
the benchmark variable to ‘caloric adequacy’ only. This decision has obvious implications for
the approach taken to select data and to construct candidate proxy indicators of dietary diversity –
in essence, candidate dietary diversity indicators were constructed that were thought to best
predict calories (eg. using only calorie dense food groups); therefore other constructions that
might better predict dietary quality were not tested.
Five candidate dietary diversity indicators were constructed for testing for the first part of the
study. The first indicator, Unique Foods, was constructed by creating an index from all food items
that had been reported as consumed. All items were equally weighted and then summed. Because
the different data sets asked about different numbers of food items, the total possible score for
27
this indicator varied by data set. Though the scores of the Unique Foods indicator are not directly
comparable across these data sets, the associations between Unique Foods and household
kilocalories per ae are. The second candidate dietary diversity indicator was ‘DHS Food Groups’,
an equally weighted index of those food groups out of the 12 standard DHS groups from which at
least one food item was consumed. Table 2a lists the food groups that comprised the DHS Food
Group index. In assigning foods to food groups, often the choice of which of the DHS groups the
food belonged to was obvious. However, at times the food items were actually listed not
individually but as prepared or processed foods with more than one ingredient. In such cases,
foods were assigned to the group based on their primary ingredient (that is, the ingredient
providing the bulk of the calories). The third indicator was Nutrient Groups, an index of
consumption of key nutrient groups, comprised of a possible five categories – carbohydrates, fat,
non-animal sources of micronutrients (i.e. fruits and vegetables), animal protein, and non-animal
protein (vegetables, e.g. pulses). We felt that this index stood the best chance of having universal
properties, given that it was the most generic of the five. Two other indicators were calculated
that we thought might best approximate calories. Calorie Dense Food Groups is an index of only
those DHS food groups consumed that were particularly calorie dense. These food groups are
shown in Table 2a: cereals, roots/tubers, fats/oils, sugar/honey, pulses/nuts, and animal foods
(meat, eggs, dairy, etc). . Calorie Dense Unique Foods follows the same logic, but is the sum of
all unique foods drawn from these calorie dense groups.
4.5.1 Darfur Dietary Diversity Indicators
To assess food consumption and dietary diversity, the Darfur survey asked respondents to report
the number of days in the past week the household consumed particular foods/food groups16 from
a list of twelve items. Table 2b summarizes the variable names, definitions, and constructions of
the dietary diversity indicators created and tested from these data. It should be noted that all
indicators weighted each of the foods/food groups equally. The first indicator (DDavg) was an
average of the number of food items consumed per day. The score for this indicator was
calculated by summing the number of days of consumption of each food and dividing by 7. The
maximum score possible was 12, if foods from all 12 groups were consumed every day. There
was a potential issue with the ‘wild food’ group being included in this indicator, since the
consumption of wild foods could inflate dietary diversity but be negatively associated with
nutritional adequacy. Therefore, a second indicator (DDavg_nowild) was developed that was
16 List of 12 foods/food groups: sorghum, millet, other cereals, groundnuts/legumes, meat/chicken/bush meat, cooking oil/fats, vegetables, fruits, milk/yogurt/cheese, sugar, eggs, wild foods.

28
identical to the first without the information on wild foods. Because sorghum, millet, and other
cereals were individually listed, but most other foods were listed by group, there was concern that
the first two indicators would overestimate the household’s true dietary diversity. Therefore, a
third indicator (AvgDD2) was calculated by collapsing the sorghum, millet, and other cereal
categories and calculating the average number of days per week that any one of the three items
was consumed. Then, this value for the new comprehensive cereal group was added to the sum
of the number of days the other listed food items (excluding wild foods) were consumed and
divided by seven. The maximum score possible for this third indicator was 9.
Though the third indicator was used in the majority of analyses, three additional and more
conventional indicators were included for comparison. The variable, ‘Allfdssumwk’ was an
average number of different food items consumed at all per week was calculated by summing the
number of all foods/food groups that the household reported consuming at least once per week. If
a household had consumed all listed foods at least once in the past week, they would have
achieved a maximum score of twelve. This same indicator was slightly recalculated to exclude
the wild foods group and was renamed ‘Allfdssumwk_nowild’.
An average number of different food groups consumed per week (allfdgrpwk) was also calculated
by collapsing listed food items into five food groups17 and summing the number of food groups
the household reported consuming at least once per week. If the household consumed all five
food groups in the past week, they would have achieved a score of five.
4.5.2 Darfur Dietary Adequacy Categories
In addition to dietary diversity scores, households were classified based on their dietary adequacy
as proxied by collapsing food groups from the survey into their primary nutrient source. Because
the survey did not collect a detailed diet history at the individual level, nor did it collect
information on quantity or frequency (per day) of consumption, it was not possible to assess
nutritional intake and make comparisons with established caloric and nutrient standards. In
WFP’s 2004 Emergency Food Security and Nutrition Assessment (EFSNA) in Darfur,
‘minimum’ consumption was defined as daily consumption of one source of carbohydrate (i.e.
sorghum, millet or wheat), one source of protein (pulses, egg, meat/poultry), one source of fat
(oil, or cooking fat) and sugar (considering the social importance of coffee and tea).
17 5 food groups: cereals (includes sorghum, millet, ‘other’ cereals), protein (includes groundnuts/legumes, meat/chicken/bush meat, eggs, milk/yogurt/cheese), fat (includes oil), fruits and vegetables, and sugar. Sugar was included as a separate category because that is how the WFP EFSNA defined it.

29
This analysis employed the same definitions, with one exception: milk, yogurt, and cheese were
included as sources of protein. However, because the WFP classification system does not
account for the importance of micronutrient intake from fruit and vegetable sources, a second
indictor was defined as daily intake of at least one source of carbohydrate, one source of protein,
one source of fat and one fruit or vegetable. A similar, but less strict indicator was also
developed, which defined minimum consumption as daily intake of at least one source of
carbohydrate, one source of protein and one source of fat, but consumption of fruits or vegetables
was only necessary three or more times per week. Both of these indicators excluded sugar in its
definition of minimum consumption. A more simplistic indicator that defined minimum
consumption as daily intake of at least one source of carbohydrate, one source of protein, and one
fat was also included.
4.6 Limitations
The analysis was severely constrained by four main factors: a) a paucity of rigorous empirical
survey data on food consumption from true emergency settings, b) a complete lack of dietary data
that could be used to calculate household caloric adequacy in any of these emergency data sets, c)
a shortage of dietary intake data (rather than merely expenditure data), even in non-emergency
settings, and d) in any survey that did have dietary intake data, there was a lack of accompanying
food frequency information with which to calculate frequency weights for the construction of
potentially useful dietary diversity indicators. A wide number of surveys were considered for this
analysis, most of which had to be discarded for one or both of these reasons.
This last data limitation prevented the construction and validation of DD indicators using the
current WFP method for classifying households according to their dietary diversity patterns, since
the WFP method uses information on the frequency of food/nutrient group consumption over the
previous week in order to perform this classification. The ‘WFP method’ was replicated using the
Darfur data and tested with various other indicators of food insecurity aside from caloric
adequacy.
30
5. Results
Analysis of the usefulness of Dietary Diversity as an indicator of caloric adequacy depends on
having accurate assessment of household caloric consumption. The data from Bangladesh were
based on 24-hour recall of quantified consumption data; the data from Ghana were based on a
seven-day recall of household consumption, as were the Afghanistan data. Information on
calories in Ethiopia was imputed from seven-day recall of purchases and of consumption from
own production/stocks and gifts/pay. Concerns about the accuracy of these methods are
discussed above. Furthermore, the samples are quite different as well. The Ghana data were
collected from an urban sample, not selected to be low income or vulnerable, while the other data
sets are entirely or almost all rural (see Table 3) and biased toward low income. None, however,
was an emergency or crisis-affected population at the time of their respective surveys. The
differences in geographic context and in data collection method should inform any interpretation
of the results presented here.
5.1 The Sample
Table 3 shows the characteristics of the samples from the four countries, demonstrating clearly
how different they are in many respects. Average household size ranges from 5 members to 5.9.
In Ghana, only households with children under 36 months were included. In the Bangladesh
sample, 43.7% of households had children under five; this proportion was somewhat lower for
Ethiopia and Afghanistan. Female headship is rare in Bangladesh (5.4% of households) and
Afghanistan (1.75%), but not uncommon in Ethiopia (24%) and Ghana (35%). The Ghana
sample was 100% urban (all living in the capital city of Accra); the Bangladesh sample was
almost entirely (93.7%) rural, and the Afghanistan and Ethiopia samples were drawn from rural
areas, in Afghanistan representing about 80% of the population. Land ownership is about zero
in the urban Ghana sample; it is very high (94%) in Ethiopia, and more balanced for Afghanistan
(39% of households have some productive land) and Bangladesh (56%). For those that do have
productive land, the amount of land varies widely among the three countries: about six acres in
Ethiopia and Afghanistan, but only .8 acres in Bangladesh. Note also that the sample size for
Afghanistan, over 29,000 households, is widely divergent from the other three studies (about
1,000 for Ethiopia; about 550 for Bangladesh and Ghana). The large sample size means that some
results will be statistically significant even if they are small in functional terms.

31
5.2 Measures of Dietary Diversity
The measures of Dietary Diversity were described earlier. They are: DHS Food Groups; Nutrient
Groups; Calorie Dense Groups; and Unique Foods and Calorie Dense Unique Foods.
5.3 Dietary patterns
In Ghana and Bangladesh, 100% of households consumed a cereal grain; close to 100%
consumed some oil or fat, and almost all consumed some vegetables or fruits. Within these
similarities, there are notable differences. Within the carbohydrate group, diversity was much
higher in Ghana than in Bangladesh. Ghanaians consumed 13 different foods in the carbohydrate
group: eight different cereals, and four different roots and tubers, compared with only one of each
type in Bangladesh. The number of households consuming roots/tubers and sugars was lower in
Bangladesh as well. The same pattern is repeated in the protein group: in the Ghana sample, the
median number of different protein foods consumed was seven, compared with two in
Bangladesh, and pulses, meat, fish, milk, and eggs were all consumed by a much lower fraction
of Bangladeshi households than of Ghanaian ones. In Bangladesh, all households consumed
some vegetables, but only 16 percent consumed any fruits, while over 90% of Ghanaian
households consumed both fruits and vegetables.
Virtually all households in the Afghanistan and Ethiopia samples consumed cereal grains, but far
more Afghan households consumed roots, tubers and sugars than was the case in Ethiopia. This
means that diversity within the carbohydrate groups was higher in Afghanistan than in Ethiopia.
A much lower proportion of households in Ethiopia consumed any major protein source: 59%,
compared with over 90% in Afghanistan. Most households in Afghanistan consumed animal
source protein: meat, or milk, while fewer than half the households in Ethiopia consumed milk,
and fewer than one in five consumed meat. (Fish was not a significant food in either country.)
Close to 90% of households in both countries consumed vegetables, on average two different
types; but almost half of Afghan households consumed fruits, while under 15% of Ethiopian
households did. Table 4 shows these results in detail.
All measures of diet diversity show the same pattern across countries, with Ghana the highest,
followed by Bangladesh, Afghanistan, and then Ethiopia. Ghana shows a higher number of
unique foods within each food group than any of the other country samples. Compared to the
other three countries, Ghana has a very diverse diet. In addition, the high level of diversity in
Ghana no doubt reflects the urban location and the fact that the sample was not selected to be low
income. Given this higher diversity in unique foods, it is not surprising that the Ghanaian sample

32
showed higher dietary diversity by all the measures tested (Table 5). On average, they consumed
10.4 food groups out of 12, compared with seven for Bangladesh, 6.7 for Afghanistan, and 4.6 for
Ethiopia; and 33.5 unique foods, compared with only 13.7 in Bangladesh, 11.3 for Afghanistan,
and 8.5 for Ethiopia. When we consider Nutrient Groups, we might expect the numbers to be
much more similar, and this is largely the case: number of Nutrient Groups is 4.9 for Ghana, 4.1
for Bangladesh, and 4.2 for Afghanistan, but only 2.8 for Ethiopia. Although dietary variety
within categories is much higher in Ghana, diets in three of the four countries tend to contain the
major nutrient sources – carbohydrates, fruits/vegetables, a source of fat, and a protein source
(animal or vegetable). Ethiopia is the exception, with lower variety than the other countries at the
level of Food Groups, Nutrient Groups, and Unique Foods.
Table 5 shows the degree to which these measures are associated with greater caloric adequacy.
These results show a consistent pattern, with higher scores on any indicator associated with
higher categories of caloric intake, in all but the Ethiopian data. These differences are significant
except for Nutrient Groups, where, as we noted before, the differences among countries are small,
and the differences in Nutrient Group score among calorie intake categories are also small. This
may mean that this indicator of number of aggregated food groups discriminates less well than
the other indicators, in particular number of food groups out of 12 (DHS Groups), or number of
unique foods. Because households apparently preserve their basic dietary pattern (as reflected in
Nutrient Group score) even at lower levels of calorie intake, we may speculate that a shortfall in
this indicator may be an indicator of severe distress not observed in our samples. In the Ethiopian
sample, none of the DD indicators constructed on the basis of food groups was significantly
different by category of caloric intake; only the measures based on unique foods showed a
consistent and significant relationship with level of caloric intake per adult equivalent. Recall,
though, we question the validity of the calorie data from Ethiopia.
While the patterns are the same, the proportion of the population falling into each category of
calorie intake is markedly different among the four countries. The average caloric intake per
adult-equivalent in Bangladesh is 1601 (median 1407), while in Ghana, the mean is 2606 (median
2331); the figures are 3037 (median 2893) for Afghanistan and mean 2350 (median 1907) for
Ethiopia. We find the figures for Afghanistan unreasonably high given the context in the country,
despite the fact that these data were collected immediately after a very good harvest. The figures
for Ethiopia are more plausible, but as we will see, they are highly variable and often
inconsistent. As discussed above, the way consumption data were collected in the Ethiopian

33
survey resulted in unreliable estimation of weekly intake; the method for Afghanistan had a
serious risk of overestimating consumption.
Only 32 percent of the Bangladeshi households consume at least 1800 kcals/adult equivalent (ae),
while 73 percent of those from Ghana do. These figures are plausible, given the differing
populations from which the data were drawn. The figures for consuming at least 1800 kcals/ae
are 92% for Afghanistan, and 53% for Ethiopia. Despite the fact that recommended caloric intake
for an adult-equivalent is similar in these populations, falling below 1800 kcals per day represents
relatively severe hardship in Accra, while it is the norm for the Bangladesh households in this
sample. It is unclear how to interpret the figures for Afghanistan and Ethiopia, given our
uncertainty about the reliability of the calorie figures.
Table 6a-c presents these results in more detail, broken down by individual score on three
indicators: DHS Groups, Nutrient Groups, and Calorie Dense Food Groups.
5.3.1 DHS Food Groups
In the Bangladesh sample, not a single household consumed fewer than four food groups, and
only 2.4 percent consumed as few as four. Most people consumed between five and nine food
groups. The relationship between number of food groups and percent consuming 1800 kcals/ae
or more is consistent: the percentage rises from 5.7% for those consuming only five, steadily to
53% for those consuming foods from nine food groups. Above nine, almost no one is in the
lower calorie categories – but fewer than five percent of households consumed foods from ten or
more groups. In Ghana, the picture is similar at the low end: fewer than three percent of
households reported consuming foods from five or fewer groups (none consumed a single food
group), and these households are almost universally in the lower calorie categories. Far more of
the Ghana households consumed a wider variety of foods. Almost 30% consumed foods from all
twelve groups, and another 28% consumed foods from 11 of the 12. Less than a quarter of the
sample consumed fewer than ten food groups. Still, there is a consistent relationship between this
indicator and the likelihood of consuming 1800 kcals/ae: the percent of households in this higher
consumption category is 20% for those consuming 8 groups, rising to 82% for those consuming
11 or 12, a very marked relationship.
Fewer than six percent of households in Afghanistan consumed three or fewer food groups, and
fewer than three percent consumed ten or more. The relationship between number of food groups
and the likelihood of consuming at least 1800 calories is consistent, rising from 55% of those

34
consuming only one group (less than half of one percent), to 96% of those consuming ten, and
100% of those consuming eleven groups. Only at the level of six food groups or above does the
proportion of household achieving 1800 calories reach the population average of 92%. The
picture is somewhat different for Ethiopia. Less than one percent of the sample consumed nine or
more food groups, but six percent reported consuming only two. Most consumed between three
and six. No consistent pattern emerges between number of food groups and the likelihood of
consuming more than 1800 calories: the figure is about 52% for every group except the lowest
and highest; for both of these, one third of the small number of households in the category,
reported being in the highest calorie category. Again, the relationships are quite consistent except
for Ethiopia, where we question the calorie figures.
5.3.2 Nutrient Groups
Essentially no one in Bangladesh reported consuming only two nutrient groups: two households,
both below 1600 calories. Between three and five nutrient groups, the percentage falling into the
highest calorie intake category rises steadily from 14% for three to 50% for five. Fifty seven
percent of households consumed food from four nutrient groups, but only 27% of this group is in
the high consumption category; these figures are reversed for those consuming all five nutrient
groups: 28% have this DD indicator score, but over 50% of them are in the highest consumption
category. Only above four nutrient groups did more than half the households consume at least
1800 calories. In Ghana, only the top two scores are represented, and the percent of households
in the highest calorie category rises from 63% to 75% as the DD score rises from 4 to 5.
Because of the large numbers in the Afghan sample, we find households representing all five DD
scores. The percent of households consuming 1800 calories or more rises systematically from
59% for the lowest score to 95% for the highest. Among the Ethiopia households, the nutrient
group indicator is a poor discriminator except for the highest score: 69% of households
consuming from all five nutrient groups consumed 1800 calories or more, compared with about
50% for all the other groups.
5.3.3 Calorie Dense Food Groups
We see much the same pattern with the Calorie Dense Food Groups indicator. In Bangladesh, the
percent of households in the highest calorie consumption group rises monotonically from 9.3% in
the group consuming two, to 69% in the group consuming all six of the calorie dense food
groups. In Ghana, the comparable figures are 33% for those consuming three groups
(representing two percent of the sample), to 81% of those consuming six. In both cases,

35
consuming more than four groups is a marker for more than half the households being in the
highest group. In Afghanistan, over half the households consumed at least 1800 calories at every
score level, but the relationship between this percentage and the DD score is consistent: 63% for
the lowest score of 1, rising to 96% for the highest score of 6. Since 92% of households in this
sample report consuming 1800 calories or more, the lower categories are an indicator of below
average calorie consumption. Once again, the results for Ethiopia do not conform to the pattern:
there is no consistent relationship between Calorie Dense Food Group score and percent of
households consuming 1800 calories or more.
5.4 Pattern Analysis
We used the Nutrient Group indicator to create a set of descriptors for different dietary patterns
among the sample households, based on whether they consumed anything from each of the five
nutrient groups: carbohydrates, fruits/vegetables, fats, animal protein sources, and vegetable
protein sources (see Table 2a for the composition of these groups). These results are shown in
Table 7. In Bangladesh, the two commonest patterns were consuming all the nutrient groups (153
households, or 28%), and consuming all the groups except vegetable protein (288 households, or
52%). About five percent of households consumed all the groups except for animal protein, and
about 14% consumed carbohydrates, fruits/vegetables, and fats, but no protein source. Not
surprisingly, the groups that lacked one or both protein sources were more likely to be in the
groups consuming less than 1800 calories per adult equivalent per day: 85% of those with no
protein source, 67% of those with no animal protein, and 72% of those with no vegetable protein.
Mean calorie consumption showed a similar consistent pattern: about 1260 for those with no
protein source; about 1550 for those with only one of the protein sources, and 1922 for those
consuming foods from all five groups. It does not appear that animal versus vegetable protein
sources are an indicator of better or worse dietary circumstances in this sample. Among
households consuming foods from all five nutrient groups, about half consumed below 1800
calories, and about half were at or above that level. Consuming all five nutrient groups is
strongly associated with a higher likelihood of being in the higher calorie consumption category,
since overall, only 32% of households consume more than 1800 calories/adult equivalent/day.
These results present a stark contrast with Ghana, where 88% of households consumed foods
from all five nutrient groups, and about nine percent consumed all but a vegetable protein source,
with insignificant numbers demonstrating any of the other patterns. These two patterns show a
modest relationship with calorie intake: those consuming foods from all five groups consumed an

36
average of 2667 calories, compared with 2437 for those lacking a vegetable protein source – too
close to be considered different. Of those consuming from all five groups, 75% consumed at least
1800 calories, compared with 67% of those lacking a vegetable protein source. There is a
suggestion in the data that perhaps consuming from all five nutrient groups implies higher calorie
intake, but neither group showed calorie deficiency. Overall, 73% of households in the Accra
sample consumed at least 1800 calories per adult equivalent per day. Since so few different
patterns were represented in the Ghana sample, the Nutrient Group indicator is not very sensitive
to different levels of calorie intake, although we may speculate that households consuming fewer
than four groups (that is, entirely missing a major nutrient group source) might show more
severely limited food adequacy.
In Afghanistan, the modal pattern is consumption from all five nutrient groups: 47% of
households are in this category, and of these, 95% consume at least 1800 kcals per AE (Recall
that overall, 92% of Afghan households reported consuming above this level.) The next
commonest pattern is consumption of all foods except vegetable protein (27%); only 4% were
missing only animal protein; in both these patterns, 92% of households, the average for the
sample, consume at least 1800 kcals/ae. Of those missing both vegetable protein and
fruits/vegetables, a relatively small number (4.4%), 89% consumed at least 1800 kcals/ae, Of
those consuming only one or two Nutrient Groups, only 75% consumed at least 1800 calories/ae,
and of the very small number consuming only cereals, 59% reached the 1800 kcal benchmark.
These results suggest that, despite the apparently high caloric intake in this sample, considerably
lower calorie consumption is associated with a very restricted number of Nutrient Groups in the
diet.
In Ethiopia, the modal pattern, reported by 27% of households, was to consume only two Nutrient
Groups: carbohydrates and fruits/vegetables. In this group, 56% of households consume at least
1800 kcals/ae, compared with 53% of the total sample. The second most common pattern (25%
of households) was to consume cereals, fruits/vegetables, and animal protein, but no fat source or
vegetable protein. In this group, 45% report consuming at least 1800 kcals/ae. Fewer than five
percent of households reported consuming food from all five Nutrient Groups, and among these,
69% reported consuming at least 1800 kcals/ae, suggesting a positive relationship between
Nutrient Groups and calorie consumption. But, as mentioned earlier, we consider the calorie
intake information from Ethiopia to be unreliable.

37
5.5 Relationships among the Indicators
We would expect that the five candidate indicators would be closely related to each other, and
this indeed is the case. All the indicators show fairly high and very significant correlations in
both countries. Table 8-1a -d shows the correlations among the five indicators for each of the four
countries. The correlations among indicators in Bangladesh range from .86 (between Calorie
Dense Foods and Calorie Dense Groups), to .46 - .51 for Nutrient Groups with Unique Foods,
Calorie Dense Groups, and Unique Dense Foods. The correlation of Food Groups with Unique
Foods is .79 in Bangladesh. For Ghana, the range is similar, from .9 to a low of .33, but more of
the correlations are on the lower side. The weakest correlations in the Bangladesh data are
between Nutrient Groups and Unique Calorie-dense Foods, and between Nutrient Groups and
Unique Foods, and the strongest are between Unique Calorie-dense Foods and Calorie-dense
Food Groups. The pattern is somewhat different in Ghana, where the correlations between Food
Groups and Nutrient Groups and between Nutrient Groups and Unique Foods and Unique
Calorie-dense foods are much weaker. The Nutrient Groups indicator in particular shows lower
correlations with all the other DD indicators. The correlation between food groups and Unique
Foods is .68. In both the Afghan and Ethiopian data sets, correlations among the five indicators
are consistently quite high: the lowest is .68, and the highest is .88 for Afghanistan, and they fall
between .67 and .85 for Ethiopia. The correlation between Food Groups and Unique Foods is .88
in Afghanistan and .83 in Ethiopia.
These relationships suggest that all the indicators do measure aspects of the same underlying
phenomenon of dietary diversity, and they capture much of the same information. It is fairly
consistent that the Nutrient Groups indicator shows somewhat lower correlations with the other
indicators. The key question, though, is how well these indicators relate to the outcome of
interest, calorie consumption per adult equivalent.
5.6 Relationship of DD Indicators to Calorie Intake
Table 9 shows the correlation of each DD indicator with household caloric intake per capita in
each country. Graphs 1-4 (a-e) show the distribution of caloric intake according to each DD
indicator for each country, with the best fitted regression line for the relationship.
For all the countries except Ethiopia, all the correlations of the DD indicators with calorie
consumption are positive and highly significant, although they are consistently lower than the
correlations among the indicators themselves. In Bangladesh, they range between .3 and .39, and
between .16 and .41 in Ghana. In Afghanistan, the correlations range from .22 to .35.

38
Correlations are somewhat lower for Nutrient Groups (Afganistan) or Calorie Dense Groups
(Bangladesh, Ghana), than for the DD indicators that have a wider range of variation (DHS Food
Groups, and the two measures incorporating unique foods.) It may be that households preserve a
broad dietary pattern to include at least some food from most of the major food groups, under
normal circumstances. Recall that none of these populations was in a crisis or emergency
situation.
The strongest correlations with calorie intake are for DHS Food Groups, Unique Foods, and
Calorie-dense Food Groups in Bangladesh, and with Unique Foods, DHS Food Groups, and
Unique Calorie-dense Foods in Ghana. In Afghanistan, the highest correlations are with Unique
Foods and Unique Calorie Dense Foods. There is no consistent pattern as to which indicator
shows the highest correlation with calorie intake. For Bangladesh, all the indicators except
Nutrient Groups have very similar correlations, .37 to .39. In Ghana, the highest is with DHS
Food Groups, while in Afghanistan the highest is with Calorie-dense Unique Foods.
The correlations of the DD indicators with calorie intake in Ethiopia raise serious questions (as
discussed before) about the validity of the calorie intake indicator. All but one of the DD
indicators show correlations that are very low and not significantly different from zero. We find
this result implausible. The Ethiopia questionnaire was ill-suited to capturing dietary intake, and,
in light of the consistent results for the other three countries, calls into question the calorie intake
measure rather than the value of the DD indicators.
The accompanying graphs demonstrate that, with the exception of Ethiopia, there is a consistent
positive relationship between each measure of DD and household calorie intake per adult
equivalent, though the relationship is somewhat tempered by the very wide variability in calorie
intake at each level of the indicators.
These results demonstrate that, except for Ethiopia, the DD indicators do behave as would be
expected for measures of diet quality or adequacy.
5.7 Relationship of Indicators to Other Household Characteristics
Table 8-2a-d shows the bivariate nonparametric correlations between the various DD indicators
and key household characteristics. All the indicators show the expected positive, significant
relationships with food expenditure per capita and negative relationships with food share of total
expenditure. Female headship is consistently negatively associated with all the indicators of
dietary diversity in Bangladesh (where female headship is an indicator of hardship), but not

39
significantly related to any of the indicators except DHS Food Groups in Ghana. In Ghana, we
were able to calculate a Coping Strategies Index (CSI) score. The higher the score, the greater
the level of coping – hence a greater level of food insecurity and an expected negative correlation
with dietary diversity. All the diversity indicators show the expected negative relationship with
the CSI, with the exception of Nutrient Groups (where it is not different from zero) – once again
indicating that the Nutrient Groups indicator is perhaps less responsive to changes in a
household’s circumstances than the other indicators, within the normal (non-emergency) range.
In fact, Nutrient Groups generally show somewhat lower correlations with household
characteristics (food expenditure, food share of expenditure) than the other DD indicators.
Bangladesh was the only sample for which we had a direct measure of food insecurity (the female
enumerator’s judgment of whether the household was food secure or not). Being food secure
showed a consistent, highly significant correlation with dietary diversity by every measure; the
range of values was .37-.39 except for nutrient groups, where the correlation was .30, still highly
significant.
In Ghana, all the households were urban. In Bangladesh, about five percent of the sample was
classified as urban, but urban location showed no significant relationships with any of the
indicators (or any other household characteristic). Owning productive land, though, was
positively and significantly related to all the dietary diversity indicators in Bangladesh, though the
correlations were not high (.10 to .16).
In Afghanistan, household size is consistently positively correlated with diet diversity, as is food
expenditure per capita. Owning productive land shows a consistent, highly significant, though
low negative correlation with all the DD indicators (recall the large sample size allows even weak
relationships to reach statistical significance); perhaps depending on home production results in
lower market participation and thus a less varied diet. This relationship would be worth exploring
further. Female headship is not significantly related to any of the DD indicators in the
Afghanistan sample, despite the plausible expectation that female headship is a sign of food
security risk.
We have seen that four of the five DD indicators showed no relationship with caloric intake in the
Ethiopia sample. However, all the DD indicators showed very significant positive correlation
with food expenditure per capita and with household size, and negative relationship with female
headship.

40
5.8 Indicators as Predictors of Calorie Intake
We tested the strength of each indicator as a predictor of calorie intake per adult equivalent using
multiple regression, first with calories as a continuous variable, and then using logistic regression
to predict whether a household fell at or above, or below the cut-off of 1800 calories per adult
equivalent.
In both the Bangladesh and Ghana samples, all the indicators were very significantly associated
with calories consumed (p<.000 for all indicators), after adjusting for a few easily observed
household characteristics (Table 10a-e). Table 11 shows the results of the multivariate OLS
regression of all four countries. In both Bangladesh and Ghana, the percent of variance explained
(adjusted R-squared) was highest for Number of Unique Foods, and lowest for Nutrient Groups.
There is a striking difference between the two countries in the explanatory power of all the DD
indicators. In the Bangladesh sample, the adjusted R-square values range from .35 to .53, and the
standardized coefficients show an effect of about half a standard deviation. In the Ghana sample,
the adjusted R-square values are much lower, between .10 and .23. These differences may reflect
the fact that the Ghana sample was not selected to be low income; it represents an urban
population with a relatively high level of calorie intake, in a culture in which diet tends to be
quite varied. In the mostly rural, mostly low-income Bangladesh sample, with quite low levels of
calorie intake overall, and with a greater range of dietary diversity scores, the DD indicators do a
better job of predicting calorie consumption.
In the logistic regression results, once again all the DD indicators are significant and positive
predictors of a household consuming at least 1800 kcals/ae/day. In all cases, the measures of
goodness of fit were higher for the Bangladesh sample, and the percent correctly predicted was
slightly higher for Bangladesh than for Ghana. In Bangladesh, consuming one more food group
raised the probability of consuming at least 1800 calories by 2.3 times; consuming one more
Nutrient Group multiplied by almost five times the probability of reaching that level. In the case
of Ghana, consuming one more food group raised the chance of consuming 1800 calories or more
by 1.5 times, and consuming one more nutrient group multiplied the chances by 1.4 times.
Because the range of number of unique foods was much greater, the odds ratios for a one-unit
change were (of course) smaller: only 1.1 for Ghana (though still significant), and 1.6 for
Bangladesh. Table 12a-d shows these results, with one panel for each country.
In the Bangladesh sample, adjusting for confounders greatly improves the predictive ability of the
odds ratios. Compared with the crude (unadjusted) odds ratios, the adjusted odds ratios are larger

41
in value, and the percent of cases correctly predicted rises noticeably – most dramatically in the
case of the DHS food groups. In contrast, in Ghana the odds ratios for the DD indicators as
predictors of consuming 1800 calories or more do not change at all after adjusting for
confounders, and the predictions do not improve. For Bangladesh, the percent correctly predicted
by the adjusted odds ratio is considerably better than would be achieved by guessing (all are at or
above 80%); for Ghana, the percentage correctly predicted is almost the same as the percent of
households falling into the higher consumption category and does not represent much of an
improvement.
In both the Afghanistan and Ethiopia samples, every DD indicator is a significant, positive
predictor of household kcals/ae, after controlling for a few household characteristics in an OLS
multiple regression. In the Afghan results, adjusted R-square for the regressions ranged from .10
for Nutrient Groups to .19 for Calorie Dense Unique Foods. This is consistent with the simple
bivariate correlations – highest for calorie dense unique foods and lowest for nutrient or calorie
dense nutrient groups. Both regressions using unique foods (unique and calorie dense unique)
have higher R-square values than those using groups, presumably because there is a wider
variation to begin with in these. The effect of a unit change in the DD score on kcals/ae is
substantial, ranging from .3 of a standard deviation for DHS food groups to around .4 of a
standard deviation for the unique food indicators.
Given the very low, non-significant correlations of the DD indicators with calorie consumption in
the Ethiopia data, it is perhaps unexpected that we find all the indicators are consistent,
statistically significant, positive predictors of household calorie intake, after controlling for
household size, female headship, land ownership, and dependency ratio. The explanatory power
of the regressions (adjusted R-square) ranges from .17 to .31. The greatest explanatory power is
provided by the number of unique calorie dense foods consumed; all the others are similar,
between .18 and .21. The measured size of the effect of a unit change in the DD indicator is
smaller in Ethiopia than in Afghanistan: for the food group indicators, the effect ranges from .09
to .14 of a standard deviation, while the unique food indicators show effects of .2 of a SD for
unique foods, and .38 of a SD for unique calorie dense foods. Controlling for possible
confounders greatly improves the predictive power of the DD indicators for Ethiopia;
nonetheless, these results must be treated with caution, given our concerns about the calorie
consumption data.

42
Based on the logistic regressions, all the odds ratios for the DD indicators in the Afghanistan
sample are positive and highly significant, increasing the likelihood of consuming more than
1800 kcals/ae by a factor of 1.2 to 2. The percent of cases correctly predicted is about 92% for all
the indicators; given that 92% of households report consuming above this level, the result is not
better than simply guessing “yes” for every household. Once again, controlling for confounders
results in DD indicators that show significant and positive odds ratios, with the exception of the
DHS Food Groups. An increase in the number of DHS Groups does not significantly increase
calorie intake; the other indicators have odds ratios ranging from 1.1 to 1.6. The percent of cases
correctly predicted is about 65% for all the indicators; this is better than random guessing, since
only 53% of households report consuming more than 1800 kcals/ae. After controlling for
confounders, the odds ratios become statistically significant, and slightly larger in absolute terms
than the crude odds ratios. The predictive power, though, is not improved: the percent correctly
predicted remains at about 92%.
Adjusting for confounders in the logistic regression, the DD indicators that measure individual
foods, and the indicator for Calorie Dense Groups reach statistical significance in the Ethiopia
data. Compared with the crude odds ratios, the model fit is improved. The crude odds ratios
explain almost none of the variance, though, which means that it is the other household
characteristics, not the DD indicators, that are contributing to any explanatory power. Once
again, though, we have concerns about the validity of the calorie information for Ethiopia.
5.9 Sensitivity and Specificity
We tested the indicators to see whether we could identify the best cut-off for each indicator to
define the group at most risk of consuming less than 1800 calories per adult equivalent per day.
We did this by estimating the sensitivity and specificity of each indicator at every possible level.
These results are shown in Table 15a-c.
These tables show five different parameters that measure how well a particular indicator
identifies those with insufficient (below 1800) calorie intake. Sensitivity (Se) gives the
proportion of all those with insufficient consumption who would be identified by that cut-off
value. Specificity (Sp) gives the proportion of those who are correctly identified as having
sufficient (1800 or over) calorie intake. The inverse, or one minus the specificity proportion, is
the proportion of those with sufficient calories who are identified incorrectly as having
insufficient calorie intake. The next two columns identify the percent of “true positives”
(households correctly identified as having insufficient calorie intake) among all those identified

43
as “positive” (P+) on the DD indicator, and the percent of “true negatives” (households correctly
identified as having sufficient calories) among all those identified as negative, or having
sufficient calories (P-). Finally, the last column shows the percent of all cases correctly
identified.
Ideally, one would want a high value for both sensitivity and specificity: to capture a high
proportion of those at risk for low calorie intake, while correctly excluding a high proportion of
those who are not at risk. The only one of the DD indicators that comes close to achieving this is
the DHS Food Group score. Table 15b shows that for Ghana, a cut-off of 11 or fewer food
groups will capture 63% of those who have low calorie consumption, and only 36% of those who
ought not to be included in this group, but only 39% of those identified as low consumers actually
are in the lower consumption category. For Bangladesh, the two best cut-off points are at eight or
seven food groups. At eight, 75% of those at risk of insufficient consumption are captured, but
47% of those not at risk are also incorrectly included in that group. At seven, only 53% of those
with low calorie consumption are captured, but the ‘false positive’ rate is reduced to 26%, and
81% of those identified as at risk in fact consume less than 1800 calories. For Afghanistan, a cut
off value of seven DHS food groups correctly identifies 62% of those at risk of insufficient
calorie intake (recall this is only 8% of the sample), but incorrectly captures 39% of the much
larger number of households consuming 1800 calories or more. Of those identified as at-risk,
only 12% are actually consuming insufficient calories. Looking at Ethiopia, even with our
concern for the validity of the calorie data, the best cut-off value is at five food groups, and this
captures under half of those with insufficient calories, while including half of those in the higher
consumption category. Given that about 50% of households reach the 1800 calorie benchmark,
this is not much better than simply assigning everyone to one group. Given the very different
consumption patterns among these samples, it is unrealistic to hope that the same number of food
groups might be used in all three settings as an indicator of calorie insufficiency.
The DHS Food Group indicator does better than either of the other indicators considered here.
For the Nutrient Group indicator, there is no value for the Ghana sample that achieves anywhere
close to even 50% of sensitivity and specificity; in fact, the best sensitivity level is a poor 19%,
and that is only for households consuming fewer than all five groups. For Bangladesh, the same
cut-off value of five performs fairly well, capturing 80% of those with low consumption, and
excluding 56% of those whose consumption is high; 75% of those identified as having low
consumption actually consume less than 1800 calories, compared with a population probability of
68%. For Afghanistan, a cut-off value of five correctly identifies 73% of low consumers and

44
excludes just about half of those consuming more than 1800 calories, but only 11% of households
identified as low consumers actually are. Furthermore, a cut-off value at the very top of the
distribution may not be very useful as a mechanism for targeting food assistance.
The pattern is similar for Calorie Dense Food Groups. Only in Bangladesh is it possible to find a
cut-off value – four groups – that captures more than half of the low consumers while excluding
more than half of the high consumers. At this level, 83% of those counted as low consumers
actually are. The best cut-off value for Ghana is at six. By selecting households that consume
fewer than the maximum of six food groups, 69% of low consumers are captured, and 51% of
high consumers are excluded. Still, this is a relatively high value, and even so, only 34% of those
identified as low consumers really are. In Afghanistan, a cut off value of five shows a sensitivity
of 59% and a specificity of 65%, but still, because of the small number of low consumers, only
13% of those identified as low consumers really are.
We conclude that DHS Food Groups may be better at discriminating among levels of calorie
consumption than the other more aggregated food group indicators. We were unable to conduct a
comparable analysis of the two indicators based on unique foods because there were simply too
many to do a sensitivity/specificity analysis for every possible level. In any case, the range is
quite different from one country sample to another, making it very unlikely that a common cut off
value could be used for all countries.
5.10 Darfur Results: Household Demographics and Dietary Patterns
Table 16 shows key household demographics. The geographic distribution was relatively even
across the three states: approximately 38% of households residing in North Darfur, 30% in South
Darfur and 32% in West Darfur. Fifty-nine percent of households were considered to be
internally displaced 18 , and 41% were residents 19 . Of the internally displaced households,
approximately two-thirds lived in camps and one-third lived in resident communities. Two-thirds
of all households were headed by males, and one-third of households were female-headed. In
terms of economic status and sources of income, quite a range of sources of income was
observed. The most commonly reported primary source of household income was wage/skilled
labor or salaried work, followed by sale of cereal, agriculture, livestock or animal products. The
mean monthly household expenditure on food, including cash and credit purchases, was 9606
18 An Internally Displaced Person (IDP) was defined as a person who was not residing in their usual place of residence and who was displaced for more than 30 months. 19 A resident was defined as a person who reported to be living in their usual place of residence.
45
dinars (48 USD). The total monthly household expenditure, including cash and credit purchases
for food and non-food items, was 14,918 dinars (74 USD). Therefore, food purchases accounted
for approximately 64% of all household expenditure. Just over half of all households reported
owning at least one large animal and approximately half of all households reported cultivating
any agricultural land in the past year.
Table 17 summarizes the type and frequency of foods/food groups consumed, as reported in the
dietary diversity module and, in Darfur, the proportion of those HHs consuming a food group that
received it in the form of food aid. Cereals were consumed on more than three days by nearly all
households. That cereals consumption is so high is not surprising given its role as major staple in
nearly all cultures and the fact that 78.6% of households that consumed cereals received it as food
aid. What is more interesting is the fact that, in Darfur, a slightly higher percentage of
households reported eating meat than pulses, and 60.2% ate meat at least 3 days while only
29.1% ate pulses with that frequency. Not only is this unexpected given that meat is not typically
included in a food ration, but almost everywhere meat is a more luxurious and expensive source
of protein than pulses or groundnuts. It is possible that portions of the pulses in the food aid
rations were being sold or traded for the preferred food (meat), and those Darfur households
receiving the ration were able to access meat because of this additional entitlement. Importantly,
it is not possible to tell from these data alone whether a food is not eaten because it cannot be
afforded (signalling hardship) or isn’t available (supply constraint) or whether it is simply not part
of a customary diet. Conversely, a food may be accessible due to external support (food aid) and
the possibility for substitution, and its consumption does not necessarily signal sustainable dietary
well-being, if food aid were withdrawn.
Another useful observation revealed in this table is the high prevalence of sugar consumption
relative to the consumption of other, potentially more nutrient dense food sources like fruits.
Again, the fact that sugar was commonly part of the food ration in Darfur (for use in tea)
underscores the difficulty in drawing conclusions about the security of the diet (i.e., what happens
if the ration is withdrawn) and in comparing the meaning of food group consumption from one
place to the next without additional context. Sugar is treated as its own food group because of its
importance in the Darfur context; about half of households consuming it received it as food aid;
but sugar is not nutrient dense, and, as an additional 'food group' might not be a marker of dietary
adequacy. In a cultural context where sugar is so important, its presence might well be an
indicator of SES or food security, but this is probably not applicable to many other settings.

46
5.11 Wild Foods Consumption in Dietary Diversity Indices and as a Stand-alone Marker
of Food Insecurity
Table 18 presents the results of bivariate correlations among the frequency of wild food
consumption and other consumption variables, including individual food groups and diet diversity
indices. Based on the significant and negative correlations of wild foods with every consumption
variable except sorghum, it is clear that wild foods are an ‘inferior’ food group (in terms of
preference, not necessarily nutrition) that is consumed as an alternative to other types of foods.
This result suggests that wild foods should not be included in any dietary diversity index where a
higher score represents a preferred dietary practice. This represents a conundrum in the design of
a diversity index. It is possible that wild foods are providing a vital source of nutrition,
maintaining households that would otherwise severely lack nutrients at a consumption threshold
on par with other better of households. But consumption of such foods nonetheless may represent
for the consuming households severe supply or access constraints to food security, and inclusion
of wild foods in an additive fashion might incorrectly suggest a higher food security status.
Unfortunately, this possibility cannot be tested within these data.
Given that wild food consumption appears to increase when preferences are curtailed, and given
that income/expenditures represent a primary means of exercising preferences, it is possible that
the consumption of wild foods may signify a severe shortage of purchasing power. If this is true,
then this indicator on its own may be sufficiently discriminating to be used for the basis of
targeting of a food aid response. Table 19 presents the results of a cross-tabulation of wild food
consumption (consumed at all in the past week – yes or no) with displacement status, camp
residency and per capita expenditure (total and food only). Contrary to the hypothesis, and
despite the negative bivariate correlations referred to earlier, Table 19 shows that the proportion
of people consuming wild foods is fairly similar across all categories, with a slightly higher
proportion of the middle expenditure tercile consuming wild foods.
Table 19 also presents the cross-tabulation of wild food consumption with displacement status. A
similar hypothesis would suggest that displaced people would be more reliant on wild foods, and
the camp-bound IDPs would have less ability to access wild foods, since it is quite possible that
wild food availability and freedom to access it play a role in whether or not it is consumed when
necessary. Table 19 shows similar results for the relationship between wild food consumption and
displacement status. The table suggests that those who consume wild foods are hardly any less
likely to reside in a camp setting and are no more likely to be IDPs than not. Overall, Table 19

47
suggests that the consumption of wild foods, on its own, is not a sufficient marker of hardship to
be useful for targeting purposes, since other factors like access interact to determine whether this
behavior is reported or not.
5.12 Darfur Dietary Diversity Index Correlations with Food Security Proxies
Table 20 presents the results of the examination of the association among various candidate
dietary diversity indices. The purpose of this portion of the analysis was to assess which indicator
is most strongly associated with various food insecurity proxies. This analysis is similar to one
done in other sections of this study, except that the candidate indicators from this data set are
different in some potentially useful ways – that is, this data set offers the ability to examine
indicators that are weighted by frequency of consumption over a week, which other work
(SENAC 2006) has suggested to have better capability in predicting nutrient adequacy. All the
DD indicators tested correlate robustly with the alternative measures of food security. The best
single DD indicator is the average number of foods consumed per day (AVGDD2) which
correlates significantly with all the food security variables except for proportion of household
budget spent on food, for which the correlation is the opposite of what would be expected. (It
may be that the bivariate correlation is masking the effect of other household characteristics that
increase food expenditures at a given level of income.) The same indicator with wild foods
removed (DDAVG_nowild) is the second best indicator. None of the indicators correlated
particularly well with the proportion of households budgets spent on food, though all correlated
strongly with per capita expenditure on food.
5.13 Dietary Adequacy Classifications and Food Security Categorization
Table 21 presents the classification of households into the 4 dietary adequacy groups described in
the methods section. When the 2004 WFP definition was used 23.6% of households were
classified as achieving minimum consumption. When the more rigorous definition of dietary
adequacy was employed, which excluded intake of sugar and included daily intake of fruits or
vegetables, this proportion fell to a mere 3.6%. When this definition was relaxed to require
consumption of fruits or vegetables at least three times per week 20% of households achieved
minimum consumption. Twenty-six percent of households met the basic consumption definition
of daily consumption of at least one source of carbohydrate, one source of protein and one source
of fat.
Household membership in each one of these groups was cross-tabulated with two proximate
indicators of insecure food access –food expenditure per capita and the percentage of total

48
expenditures devoted to food spending – in order to determine whether these classifications are
useful in predicting the household’s food security status.
The results suggest that, indeed, those households that achieve the minimum consumption of each
of these adequacy groups are more likely to also have the highest per capita food expenditure and
spend the smallest portion of their budget on food, although the results are somewhat mixed on
the latter point. Though there is a clear trend, these dietary adequacy indicators are not perfect
proxies. This table suggests that greater food spending does not guarantee ‘healthy’ food
consumption patterns, and that the route from food access (‘potential consumption’) to dietary
diversity (‘actual consumption’) is likely to be mediated by important forces like preferences,
knowledge, and culture. With regard to using these adequacy indicators to target households or
to signal the need for a response, further exploration is warranted, since based on this preliminary
analysis it appears that a large percentage of households would be misclassified based simply on
DD indicators.
5.14 Regression Models Predicting Dietary Diversity in Darfur Households
The final step in this analysis of the Darfur dietary diversity data was to model the predictors of
dietary diversity in order to ascertain, among other things, whether households receiving food aid
reflect higher dietary diversity (as we expect), and whether camp-residing or non-camp IDP
households have higher dietary diversity.
The results of multivariate linear regression analysis to predict dietary diversity in all households
are illustrated in Table 22. The first model included the average number of food groups
consumed per day (with cereal groups collapsed and wild foods excluded) as the dependent
variable, while model two used the number of different unique foods consumed by the household
per week as the dependent variable. Both models were found to be highly significant. Twenty-
four percent, and 26% of the variation in dietary diversity was explained by the independent
variables included in models one and two, respectively.
The cultivation of agricultural land was found to be negatively associated with dietary diversity in
the first model and had no significant effect in the second model. Recall we found a similar result
for Ethiopia in the calorie adequacy analyses. The negative association is somewhat surprising,
as one may expect that household food production and consequently household food availability
and consumption would be greater amongst households that are able to cultivate land. However,
this variable reflects land cultivated over the past year and may not necessarily identify effects on

49
recent consumption. Also, households depending on their own production may be more likely to
limit consumption to those items they can produce themselves. Another possibility is that
members of households who are not cultivating land may be more likely to be employed in the
formal sector and may have a higher, more reliable source of income which would allow them to
purchase a greater variety of foods; in any case, they may be more reliant on the market, which
provides a more varied food supply. Households receiving food aid in the past two months had a
dietary diversity score that was 0.262 and 0.230 points greater than households who did not
receive food aid, in models one and two, respectively. Not surprisingly, number of meals
consumed by adults per day was positively associated with dietary diversity in both models. As
the number of adult meals consumed per day increased by one, the number of foods consumed
per day increased by 0.226 and the number of different foods consumed by the household
increased by 0.34 per week. Of course, the direction of causality in this relationship is dual:
higher access to a diverse diet translates into more meals consumed. Though the household’s
food expenditure did not have an effect on either dietary diversity score, the household’s total
expenditure was significantly and positively associated with both outcome variables. As to be
expected, experiencing a recent shock and the number of consumption-related coping strategies
employed in the past 30 days were both negatively associated with dietary diversity. As the
household employed one additional coping strategy, the number of foods consumed per day
decreased by 0.09, and the number of foods consumed per week fell by 0.77, all else equal.
Ownership of a large animal did not have an effect on dietary diversity in either model. While
the sex of the household head did not have an effect in the first model, female headship had a
negative effect on the household’s dietary diversity in the second model. Household size did not
appear to have an effect; however, the household’s geography did. Households living in West
Darfur and South Darfur both had higher dietary diversity scores than households living in North
Darfur.
The effects of independent variables on dietary diversity amongst IDP households are presented
in Table 23. Again, both models are highly significant. Model three accounted for 23% of the
variance in daily dietary diversity and model four accounted for 28% of the variance in weekly
dietary diversity. Contrary to models one and two, cultivation of agricultural land did not have an
effect on the number of different foods consumed per day when the analysis was limited to IDPs,
but did have a significantly positive effect on the number of different foods consumed by the
household per week. IDP households cultivating land consumed nearly half a food item more per
week compared with IDP households not cultivating any land, all else equal. Whether the IDP

50
household lived in a community or camp did not have an effect in model three, but did have a
positive effect on the number of different foods consumed per week. IDP households living in
camps consumed fewer different foods per week than IDP households living in communities. As
in models one and two, total household expenditure also strongly and positively associated with
dietary diversity. The experience of a recent shock had a negative effect on daily dietary
diversity, but did not have an effect on weekly dietary diversity. This results suggests the
usefulness of having frequency information: households may struggle to preserve an acceptable
dietary pattern by reducing the frequency rather than cutting a particular food or food group from
the diet completely. Conversely, the number of consumption-related coping strategies employed
in the past thirty days had a negative effect on weekly dietary diversity, but did not have a
significant effect on daily dietary diversity. Both models three and four show a negative effect of
female headship on dietary diversity. Household size did not have a significant effect in model
three (daily DD), but did have a small, but significant negative effect on weekly dietary diversity
in model four. As in models one and two, residence in the West or the South was associated with
improved dietary diversity in comparison to residence in the North.
51
6. Conclusions and Recommendations Our results are consistent with the growing literature suggesting that measures of dietary diversity
are an accurate reflection of the adequacy and quality of diet at the household level. Even despite
the fact that the datasets used in this study a) were not designed to answer the analytical questions
at hand, and b) generally had less-than-ideal measures of caloric intake, consistent evidence was
found that all the measures of DD show a positive correlation with household measures of caloric
intake per adult equivalent. This was reflected in bivariate correlations between every indicator
and calorie consumption (except in Ethiopia). After controlling for confounders in a multivariate
analysis, all DD indicators showed very significant positive relationships with calorie
consumption in all four countries.
However, all the data sets used to analyze caloric adequacy were drawn from settings that were
not currently affected by an acute emergency. The households sampled were certainly drawn
from countries often facing covariate shocks (such as armed conflict, drought, and flood), but the
consumption patterns assessed were not, at the point of survey, currently shocked. To the extent
that dietary diversity may have a different meaning in emergencies, we cannot extrapolate from
these results to apply them to extreme situations. In particular, we might consider famine
situations, where households might rely on a diverse group of “famine foods” that are markers not
for adequacy but for food stress; in settings where people are dependent on food aid rations, it
might happen that a relatively diverse group of foods is provided so that diversity would not
necessarily proxy for adequacy in the same way that it would in a free living population.
All the constructed measures of diet diversity were closely related to each other. Nonetheless,
each one may have a somewhat different interpretation. Clearly, the number of DHS food groups
shows more variation (with a range of 1-12) than the other aggregated food group indicators (with
ranges of 1-5 or 1-6), and so may be more sensitive to change. The number of unique foods is
more variable still, and from our limited data it seems that greater variability within a food group,
as well as variability of groups, is a positive indicator of dietary adequacy. There were not
consistent results as to which indicator showed the greatest predictive ability or the most robust
correlation with calorie consumption, although the regressions with number of unique or calorie-
dense unique foods tended to have higher correlations and explanatory power (model fit) than
those using food groups, presumably because the greater variation made them more sensitive.
Fine-tuning of a particular indicator is probably less productive than improving data collection
methods and expanding our knowledge base with respect to the application of these measures in
52
diverse, particular emergency contexts. This suggests that using a consistent set of food groups
for the construction of a DD indicator would be more valuable than trying to develop different
categories for different locations and situations. The treatment of wild or 'famine' foods in
construction of a DD measures bears further exploration, given the somewhat inconsistent
relationship of this diet component with indicators of food security and hardship.
The Nutrient Groups indicator, which gave one point for consuming foods from each of only five
groups – carbohydrates, fruits/vegetables, fats/oils/ animal protein and vegetable protein – was
generally less sensitive to change than the other indicators. Regression parameters were
consistently lower for this indicator as compared with the others. This is undoubtedly due to the
fact that there is less variability in this indicator than in any of the others. These data suggest that
most households will consume foods representing at least four of these groups (possibly choosing
one of the two protein sources) if they can. There was universally a systematic relationship
between consuming fewer Nutrient Groups and having a smaller proportion of households
consuming at least 1800 calories per adult equivalent. Even in the Afghanistan data, where 92%
of households consumed at that level or above, a low Nutrient Group score indicates a lower
probability of being in the highest consumption category. The very fact that consumption
patterns with respect to nutrient groups are resistant to change might possibly make it a suitable
indicator of serious deprivation: with the inability to access foods from all five nutrient categories
suggesting relatively severe food stress. We could not observe this in the data sets we used,
where the lower scores on this indicator were not well represented. This measure of variety is no
doubt useful as an indicator of diet quality as well as caloric sufficiency: absence of any major
plant source of micronutrients, or of any animal protein source, or of a grain/pulse combination,
probably suggests a lack of balance as well as a lack of quantity.
Thus the Nutrient Group indicator is probably useful to identify the presence of a severe problem,
but probably not the most suitable indicator to measure change over time. One of the indicators
that has greater range – DHS Food Groups, or Unique Foods, for instance – would be a more
suitable measure for assessing whether and how the food adequacy situation is changing over
time, whether in response to an intervention, or as a result of changes in the environmental
context. The DHS Food Groups indicator would promote greater comparative analysis across
contexts, since it is more standard measure. It may capture local variation less well than the
Unique Foods indicator, since cultures and contexts vary in how many different individual foods
are available for consumption.

53
These data sets were not comparable in a variety of ways. The Ghana sample was urban and
representative of the entire city (i.e. included all income groups). The Bangladesh sample was
mostly rural and selected to be low income, and both Afghanistan and Ethiopia were entirely
rural. The distribution of scores for all the DD indicators was quite different from country to
country. As measured, the calorie consumption levels also varied a great deal. For example, 92%
of Afghan households, and 73% of Ghanaian ones consumed at least 1800 kcals/ae, while only
32% of Bangladesh households fell into that category. This inevitably means that the prediction
of the consumption category into which a household falls is unreliable. Note also that the data
collection methods for Ethiopia were not designed for estimation of calorie intake.
In part because of this wide variability, it proved impossible to find a universal cut-off in any of
the indicators tested that would consistently identify a set proportion of households falling below
a chosen level of calorie consumption.
The evidence is strong that dietary diversity varies systematically with calorie consumption level.
Based on our sensitivity and specificity analysis, we would not recommend using a DD indicator
as a diagnostic tool for individual households, but it might well be useful for identifying high-risk
situations when a certain proportion of households are predicted to fall below a given DD
indicator score. In general, both sensitivity and specificity were below the levels one would hope
for in a diagnostic tool. Sensitivity/specificity analysis suggested that the DHS Food Groups
indicator was probably more useful than the more aggregated groups, simply because in these
populations, acceptable levels of sensitivity were not achieved until quite high levels of the more
aggregated group scores, and so would not allow for much discrimination. Though the data
constraints did not allow for a direct assessment of how well the WFP method for calculating and
categorizing dietary diversity serves as a proxy for caloric adequacy, once the data do become
available this method should be used to assess the sensitivity and specificity of the cut-offs that
WFP currently uses. WFP should also consider applying this method for determining appropriate
cut-offs in other types of indicators, such as the coping strategies index and the household food
insecurity access scale.
The constraint we faced in analyzing dietary diversity as an indicator of caloric sufficiency was
that no data sets were drawn from current emergency or crisis-affected populations containing
required information on calorie consumption (at the level of detail needed to make judgments on
nutrient adequacy). Even in the data sets we used, in all but one, calories were not estimated
based on quantitative 24-hour recalls but on purchases or other more aggregated recall methods.

54
The data available from an actual emergency (Darfur) confirm the basic relationship between
dietary diversity indicators and other indicators of food access, but could not test the relationship
with dietary intake.
The variability of results in this study would also suggest that relying on a single indicator (or
related group of indicators as this study has done) to proxy dietary adequacy will likely result in
the misclassification of households with regard to their food security status. Based on these
results, there is little doubt that dietary diversity indicators do capture the element of dietary
quality, and to some extent dietary adequacy. However, other measures can capture other
elements of dietary adequacy – as well as other elements of the complex notion of food security –
and thus our recommendation would be that for assessment and targeting purposes, more than one
proxy indicator should be included in WFP’s analytical toolbox, and more than one should be
used in assessments (as per the current practice). Again, the results from the one emergency case
we analyzed (Darfur) confirm this conclusion.
We have addressed the study aims to the extent possible with the available data. A comparison of
the various indicators does not immediately suggest one indicator that is clearly superior to the
others. DHS Food Groups may be more sensitive to change than the other grouped indicators; we
have speculated that Nutrient Groups may be more resistant to change and perhaps an indicator of
greater deprivation. We find that these households, drawn from widely different contexts, were
not really comparable in terms of their caloric intake, and no universal cut-off appears to be
appropriate for all groups. Lacking any information on frequency, we were unable to assess the
implications of including such information to weight DD indicators in assessing household
caloric adequacy. In the Darfur data, incorporating frequency did alter some conclusions
compared with a simply knowing if a food was consumed at all in the past week. Because
measures of DD do reflect differing levels of caloric intake, information on DD would be useful
as a baseline indicator, against which to compare changes over time.
Working with these data sets suggested several methodological issues to consider in
implementing future consumption studies. Certainly, if the goal is to be able to assess caloric
intake, consumption data must be collected in terms of foods consumed, not commodities
purchased. Data collected for the purpose of estimating expenditures is a poor proxy for actual
consumption, since any day or week’s purchases may be intended to last for a longer period of
time, and households may consume food that was purchased previously. Further, consumption
data should include information on individual ingredients and their quantities in cooked, multi-

55
ingredient dishes. This is important for calorie estimation, but also for measuring dietary
diversity, as a single “food” may actually contain ingredients representing multiple food groups.
Reporting these foods in terms of only the major ingredient will understate dietary variety.
Constructing DD indices from consumption data collected as detailed 24-hour or 7-day diet
recalls may be misleading, and we cannot draw firm conclusions about the usefulness of DD
indicators as a time-saving strategy without comparing detailed consumption information with
data collected in terms of food groups. We know that food groups may mask variation in calorie
and nutrient content of individual items (this is particularly true for the “miscellaneous”
category), and it remains to be verified if food group information alone is sufficient to proxy for
detailed consumption information. Similarly, we know that simply increasing numbers may not
universally be a proxy for improved diet quality: simply ‘adding more’ (in terms of food groups)
does not inherently suggest a better diet unless certain minimum needs are met first.
We strongly recommend that WFP undertake to quantify calorie intake, along with other
measures of dietary diversity and household food security, in order to assess the usefulness of the
dietary diversity indicator in truly access-constrained, emergency settings. A study that tracked
dietary diversity along with food access and consumption through the course of an emergency
could not only test dietary diversity indicators against other indicators that could potentially
strengthen conclusions about the usefulness of the DD measures, it could also address other
questions that available data would not permit this study to address, including the following.
Absolute values in indicators compared to variations from a baseline
Whether “famine foods” and food aid significantly alter the observed relationship of dietary diversity to caloric adequacy;
How closely these indicators pick up changes in access to adequate food over the course of an emergency (and hence in relation to both shocks and interventions);
To date, no study has considered 24-hour recalls on dietary intake in an emergency, in part
because of resource constraints, but also because the analysis takes too long to be useful for
emergency assessment purposes. But the investment in such an effort would be amply repaid by
possibly being able to develop practical, time- and cost-saving measures for assessing diets of
affected populations by testing various of these against dietary intake in actual emergencies.
Given the promising results from the present study, which indeed confirmed the systematic
relationship between DD measures and caloric intake, as well as some of the other indicators
briefly observed in this study, such an investment would be highly worthwhile.

56
We can briefly summarize our conclusions as follows.
- These results confirm that dietary diversity measures show a consistent association with dietary adequacy and caloric intake.
o We did not find clear superiority of one indicator over another; all are closely correlated
o Because of diverse contexts and the strong desire of households to diversify at very low levels of caloric intake, universal cut off values are unlikely to be found
o Very aggregated (e.g. five food group) measures may discriminate in severely deprived more than in less deprived populations
- This relationship has not been tested in emergency or crisis settings; such research is badly needed
o The role and significance of 'famine foods' needs to be explored further
o The effect of food aid on DD indicators needs to be explored
- Assessing the use of DD indicators as a proxy for diet adequacy requires information on both variables
o Food expenditures or provisioning are poor proxies for consumption; detailed consumption data are needed
o DD indicators constructed from detailed consumption data may be different from indicators collected from general questions specifically to construct DD scores.
- The promising potential for using DD as one in a set of indicators of household food security justifies further research on the issue.

57
Tables
Table 1: Key Characteristics of Study Data Sets Data set Survey
year Sample (HHs)
Recall period
HH or individual
Food groups?
Unique Foods
Wild Foods?
Food Source?
Source of HH Kcal Adequacy Indicator
Other Dietary Data
1 Ethiopia 1997 1477 7 days Household Yes Yes No Yes Food consumption and expenditure
• Meals per day in past week • Bulk cereal purchase in past 4
months
2 Ghana 1997 559 7 days Household No Yes Not sure
Yes Food consumption and expenditure
• “Street foods,” • Consumption coping strategies
3 Afghanistan 2003 31412 7 days Household No Yes Yes No 7-day food recall • Food group recall- past 4 months
4 Bangladesh 2003 600 1 day
Household No Yes Yes Yes 24-hour recall • Individual 24 hour recalls • Consumption coping strategies
5 Darfur 2005 2090 7 days Household Yes No No Yes 7-day food group frequency recall
• Times adults ate previous day, • Times children < 15 ate prev. day
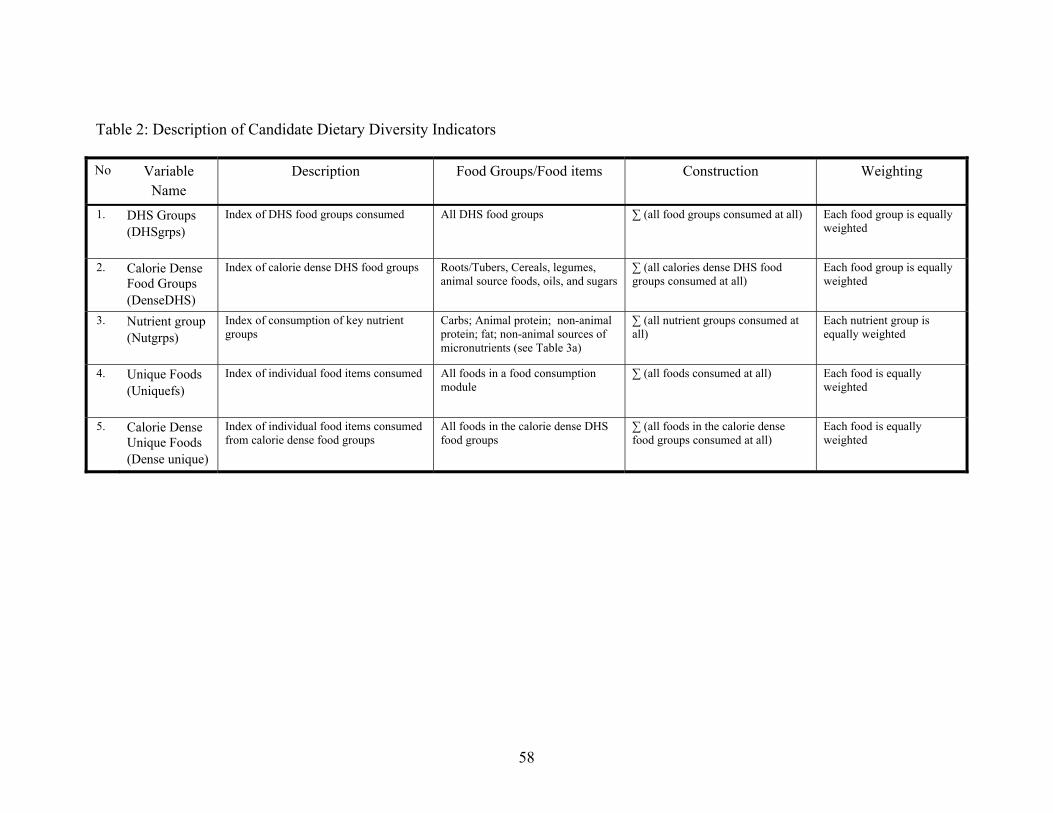
58
Table 2: Description of Candidate Dietary Diversity Indicators No Variable
Name Description Food Groups/Food items Construction Weighting
1. DHS Groups (DHSgrps)
Index of DHS food groups consumed All DHS food groups ∑ (all food groups consumed at all) Each food group is equally weighted
2. Calorie Dense Food Groups (DenseDHS)
Index of calorie dense DHS food groups Roots/Tubers, Cereals, legumes, animal source foods, oils, and sugars
∑ (all calories dense DHS food groups consumed at all)
Each food group is equally weighted
3. Nutrient group (Nutgrps)
Index of consumption of key nutrient groups
Carbs; Animal protein; non-animal protein; fat; non-animal sources of micronutrients (see Table 3a)
∑ (all nutrient groups consumed at all)
Each nutrient group is equally weighted
4. Unique Foods (Uniquefs)
Index of individual food items consumed All foods in a food consumption module
∑ (all foods consumed at all) Each food is equally weighted
5. Calorie Dense Unique Foods (Dense unique)
Index of individual food items consumed from calorie dense food groups
All foods in the calorie dense DHS food groups
∑ (all foods in the calorie dense food groups consumed at all)
Each food is equally weighted

59
Table 2a: Mapping of DHS Food Groups to Major Nutrient Groups Based on Primary Nutrient Contribution DHS Food Group Nutrient Group Assignment Calorie-dense Group
1 Cereals Carbohydrates yes
2 Root and tubers Carbohydrates yes
3 Vegetables Non-animal micronutrient sources
no
4 Fruits Non-animal micronutrient sources
no
5 Meat, poultry, offal Animal Protein yes, grouped with other animal source foods
6 Eggs Animal Protein yes, grouped with other animal source foods
7 Fish and seafood Animal Protein yes, grouped with other animal source foods
8 Pulses/legumes/nuts Non-Animal Protein yes
9 Milk and milk products Animal Protein yes, grouped with other animal source foods
10 Oil/fats Fat yes
11 Sugar/honey Carbohydrates yes
12 Miscellaneous N/A no

60
Table 2b: Definition and Construction of Darfur Candidate Dietary Diversity Indicators
Variable Name Dietary Diversity Definition Construction
DDavg Mean # of Food Items Consumed per Day 1 # of days of consumption of (sorghum + millet + other cereals + groundnuts/pulses + meat/chicken + cooking oil + vegetables + fruits + milk/yogurt + sugar + eggs + wild foods) / 7
DDavg_nowild Mean # of Food Items Consumed per Day, No Wild Foods2
# of days of consumption of (sorghum + millet + other cereals + groundnuts/pulses + meat/chicken + cooking oil + vegetables + fruits + milk/yogurt + sugar + eggs) / 7
AVGDD2 Mean # of Food Items per Day (cereals collapsed)3 # of days of consumption of (cereal* + groundnuts/pulses + meat/chicken + cooking oil + vegetables + fruits + milk/yogurt + sugar + eggs) / 7; *cereal = average # of days per week sorghum, millet, and/or cereals consumed
Allfdssumwk Mean # of Different Foods Consumed per Week4 Reported from a list of 12 food items (sorghum, millet, other cereals, groundnuts/legumes, meat/chicken/bush meat, oil, vegetables, fruit, milk/yogurt/cheese, sugar, eggs, wild foods)
Allfdssumwk_nowild Mean # of Different Foods Consumed per Week, No Wild Foods5
Reported from a list of 12 food items (sorghum, millet, other cereals, groundnuts/legumes, meat/chicken/bush meat, oil, vegetables, fruit, milk/yogurt/cheese, sugar, eggs)
Allfdgrpwk Mean # of Food Groups Consumed per Week Five food groups possible: cereals (incl. sorghum, millet, ‘other’ cereals), protein (incl. pulses, meat, eggs, milk/dairy), fat (incl. oil), fruits/vegetables, sugar

61
Table 3: Key Characteristics of Sample Households
Bangladesh Ghana Afghanistan Ethiopia
(N=551) (N=548) (N=29720) (N=1081)
Characteristic: N Value* N Value* N Value* N Value*
Household size 551 5[2] 548 5[3] 29720 5.9[2.9] 1081 5.4[3.6]
HH with at least 1 child <60 mo. (%) 551 43.70% 548 100% 16597 55.80% 715 66.10%
Dependency ratio2 551 .40[.61] 2a 548 1[1] 2b 29720 0.7[0.9] 1081 .7[.8]
Female headed household (%) 551 5.40% 548 34.90% 521 1.70% 258 23.80%
Urban (%) 551 93.50% 548 100% 29720 0% 1081 0%
Any productive land (%) 551 56.10% 548 3.10% 11518 38.70% 1007 93.10%
Productive land size (acres) 3 309 .80[1.16] 17 .0007[.003] 11518 2.5[2] 1007 3.7[5.5]
Note: *Values are percentages and median [interquartile range] 2 Dependency ratio is calculated as # household members le 12/ household members gt 12 2b Dependency ratio for Ghana includes elders as dependents 2a Dependency ratio for Bangladesh based on members le 10 years and ge 60/members gt 10 and lt 60 years 3 Households with no productive land are excluded from the average

62
Table 4: Frequency of HH Consumption of Food and Nutrient Groups
Bangladesh Ghana Afghanistan Ethiopia (N= 551) (N= 548) (N= 29720) (N= 1081 ) Food/Nutrient Groups Consumed? # Foods
eaten in each group
Consumed? # Foods eaten in
each group
Consumed? # Foods eaten in
each group
Consumed? # Foods eaten in
each group (% yes) (median) (% yes) (median) (% yes) (median) (% yes) (median)
Carbohydrates 100 2 100 13 99.98 4 99.07 2
Cereals 100 1 100 8 99.64 2 97.32 2
Roots/tubers 82.9 1 99.1 4 79.71 1 20.54 1
Sugars 39.4 1 56.8 1 72.55 1 35.71 1
Protein 86 2 99.5 7 90.45 3 58.74 2
Pulses 33.4 1 90.3 2 56.44 1 20.81 1
Meat 14.3 1 82.7 2 71.08 1 17.67 1
Fish 64.4 1 88.7 2 0.59 1 - -
Milk 30.7 1 69.9 1 59.36 2 42.65 1
Eggs 15.6 1 69 1 - - 9.44 1
Fats 99.1 1 98 3 92.48 1 24.7 1
Oils 99.1 1 98 3 92.48 1 24.7 1 Non-animal Sources of Micronutrients 100 4 98.7 7 89.38 3 89.55 3
Vegetables 100 4 96.4 4 87.72 3 89.36 3
Fruits 15.8 1 90.5 3 45.79 1 13.97 1

63
Table 5: Mean (+/-SD) of Candidate DD Indices by Country and Kcal per Adult Equivalent (AE) Adequacy Group
Bangladesh Ghana Afghanistan Ethiopia
Total < 1600 Kcals
1600-1800 Kcals
> 1800 Kcals
Total < 1600 Kcals
1600-1800 Kcals
> 1800 Kcals
Total < 1600 Kcals
1600-1800 kcals
> 1800 kcals
Total < 1600 kcals
1600-1800 kcals
> 1800 kcals
#
Indicator Name
n=551 n=330 n=45 n= 176 n=548 n=107 n=43 n=398 n= 29720 n= 1612 n= 738 n=
27370 n= 1081 n=432 n=73 n=576
7 6.6a 7.0a 7.6 10.4 9.3 10.2a 10.7a 6.7 5.5 5.7 6.8 4.6 4.7a 4.3a 4.6a 1 DHSgrp (1.5) (1.4) (1.4) (1.4) (1.7) (2.2) (1.6) (1.3) (1.8) (2.1) (2.0) (1.8) (1.6) (1.6) (1.5) (1.6)
4.1 4.0a 4.1a 4.4a 4.9 4.7 4.9a 4.9a 4.2 3.6a 3.7a 4.2 2.8 2.8a 2.7a 2.8a 2 Nutgrps (.65) (.64) (.60) (.60) (.45) (.75) (.29) (.34) (0.8) (1.1) (1.0) (0.8) (0.9) (0.9) (0.9) (0.9)
3.7 3.5a 3.6a 4.2 5.3 4.9 5.2a 5.4a 4.7 3.9a 4.0a 4.7 2.1 2.1a 1.9a 2.2 a 3 Dense DHS (.93) (.85) (.91) (.91) (.80) (.94) (.83) (.71) (1.2) (1.4) (1.4) (1.2) (1.0) (1.0) (0.9) (1.0)
13.7 12.7 14.7a 15.4a 33.5 26.9 32.7a 35.3a 11.3 8.6a 8.9a 11.4 8.5 8.3a,b 7.5a 8.8b 4 Uniquef (3.7) (3.2) (3.5) (3.8) (9.0) (8.6) (8.0) (8.4) (4.6) (4.2) (4.3) (4.5) (3.4) (3.5) (3.0) (3.4)
4.6 4.2a 4.7 a,b 5.3b 19.6 16.1 19.7a 20.5a 6.9 5.3 5.6 7 3.2 2.8a 2.8a 3.6 5 Dense
Uniquef (1.7) (1.5) (1.6) (1.7) (5.4) (5.1) (5.5) (5.1) (2.2) (2.1) (2.2) (2.2) (1.6) (1.4) (1.4) (1.6)
Dense Unique and Dense DHS are based on calories dense food groups: cereals, roots/tubers, meat, pulses, fat and sugar. Means with common subscripts are NOT significantly different from each other within kcal per AE groups (Bonferroni post hoc)

64
Table 6a: Distribution of DHS Food Group Score by Kcal per AE Categories for Each Dataset
Bangladesh
% Ghana
% Afghanistan
% Ethiopia
% Total <1600 1600-
1800 >1800 Total <1600 1600-
1800 >1800 Total <1600 1600-
1800 >1800 Total <1600 1600-
1800 >1800
kcals kcals kcals kcals kcals kcals kcals kcals kcals kcals kcals kcals n= n= n= n= n= n= n= n= n= n= n= n= n= n= n= n=
Index Score
551 330 45 176 548 107 43 398 29720 1612 738 27370 1,081 432 73 576 1 0 0 0 0 0 0 0 0 0.5 2.8 3.0 0.3 1.2 2.1 0 0.7 2 0 0 0 0 0.2 0.9 0 0 2.1 6.1 3.8 1.8 6.5 5.8 9.6 6.6 3 0 0 0 0 0.2 0.9 0 0 3.8 9.9 7.3 3.4 18.7 14.4 28.8 20.7 4 2.4 3.0 2.2 1.1 1.1 3.7 0 0.5 6.2 12.3 12.2 5.7 22.0 22.7 19.2 21.9 5 12.7 18.2 13.3 2.3 0.5 2.8 0 0 11.1 14.6 17.2 10.7 21.7 23.4 16.4 21.2 6 29.0 33.3 22.2 22.7 0.9 2.8 2.3 0.3 16.9 17.1 16.9 16.9 15.6 16.9 13.7 14.9 7 21.8 22.1 24.4 20.5 3.1 4.7 2.3 2.8 21.0 16.6 18.2 21.3 9.4 9.0 11.0 9.6 8 16.2 12.4 20.0 22.2 4.5 11.2 9.3 2.3 19.8 12.7 12.1 20.4 4.3 4.9 1.4 4.2 9 13.4 8.2 17.8 22.2 12.4 19.6 18.6 9.8 15.8 6.9 7.3 16.6 0.6 0.9 0 0.4 10 4.2 2.7 0 8.0 20.6 21.5 16.3 20.9 2.7 0.9 2.0 2.8 0 0 0 0 11 0.4 0 0 1.1 27.7 15.0 25.6 31.4 0.04 0 0 0.05 0 0 0 0 12 0 0 0 0 28.6 16.8 25.6 32.2 0 0 0 0 0 0 0 0 Median 7.0 6.0 7.0 8.0 11.0 10.0 11.0 11.0 7.0 6.0 6.0 7.0 5.0 5.0 4.0 5.0 [IQR] [2] [1] [2] [3] [2] [3] [3] [2] [2] [3] [3] [2] [3] [2] [3] [3]

65
Table 6b: Distribution of Nutrient Food Group Scores by Kcal per AE Categories for Each Dataset (possible score 1-5)
Bangladesh
% Ghana
% Afghanistan
% Ethiopia
% Total <1600 1600-
1800 >1800 Total <1600 1600-
1800 >1800 Total <1600 1600-
1800 >1800 Total <1600 1600-
1800 >1800
kcals kcals kcals kcals kcals kcals kcals Kcals kcals kcals kcals kcals n= n= n= n= n= n= n= n= n= n= n= n= n= n= n= n=
Index Score
551 330 45 176 548 107 43 398 29,720 1,612 738 27,370 1,081 432 73 576 1 0 0 0 0 0.2 0.9 0 0 0.7 3.6 3.8 0.5 6.5 6.9 8.2 5.9 2 0.4 0.6 0 0 0.5 1.9 0 0.3 4.2 12.7 9.9 3.6 30.5 28.5 38.4 31.1 3 14.2 18.5 13.3 6.3 1.1 4.7 0 0.3 12.9 21.8 22.1 12.1 39.4 42.6 28.8 38.4 4 57.7 60.9 64.4 50.0 10.4 15.9 9.3 9.0 35.2 34.8 36.0 35.2 19.1 18.8 23.3 18.8 5 27.8 20.0 22.2 43.8 87.8 76.6 90.7 90.5 47.0 27.1 28.2 48.7 4.5 3.2 1.4 5.9 Median 4.0 4.0 4.0 4.0 5.0 5.0 5.0 5.0 4.0 4.0 4.0 4.0 3.0 3.0 3.0 3.0 [IQR] [1] [0] [0] [1] [0] [0] [0] [0] [1] [2] [2] [1] [1] [1] [1] [1]

66
Table 6c: Distribution of Calorie Dense Group Score by Kcal per AE Categories for Each Dataset (possible score 0-6)
Bangladesh
% Ghana
% Afghanistan
% Ethiopia
% Total <1600 1600-
1800 >1800 Total <1600 1600-
1800 >1800 Total <1600 1600-
1800 >1800 Total <1600 1600-
1800 >1800
kcals Kcals kcals kcals kcals kcals kcals Kcals kcals kcals kcals kcals n= n= n= n= n= n= n= n= n= n= n= n= n= n= n= n=
Index Score
551 330 45 176 548 107 43 398 29,720 1,612 738 27,370 1,081 432 73 576 0 0 0 0 0 0 0 0 0 0 0 0 0 0.3 0.7 0 0 1 0 0 0 0 0 0 0 0 1.2 5.6 4.9 0.8 30.2 27.1 39.7 31.3 2 7.8 10.9 6.7 2.3 0.4 0.9 2.3 0 5.5 13.4 11.5 4.9 35.9 41.0 35.6 32.1 3 37.2 44.5 42.2 22.2 2.2 7.5 0 1.0 10.6 18.7 18.3 9.9 21.5 20.4 13.7 23.3 4 35.9 33.9 33.2 40.3 13.0 23.4 11.6 10.3 19.4 21.9 23.9 19.1 10.6 8.8 11.0 12.0 5 16.2 9.4 15.6 29.0 39.2 40.2 46.5 38.2 29.6 22.8 24.3 30.2 1.6 2.1 0 1.4 6 2.9 1.2 2.2 6.3 45.3 28.0 39.5 50.5 33.7 17.6 17.2 35.1 0 0 0 0
Median 4.0 3.0 4.0 4.0 5.0 5.0 5.0 6.0 5.0 4.0 4.0 5.0 2.0 2.0 2.0 2.0 [IQR] [1] [1] [1] [1] [1] [2] [1] [1] [2] [2] [2] [2] [2] [2] [1] [2]

67
Table 7: Percentage of Households Meeting Various Caloric per AE Cut-offs with Different Nutrient Group Consumption Patterns Afghanistan Ethiopia Bangladesh Ghana
Freq. (%)
Mean ± Std. dev Cal per adeq
% >1800 kcals
Freq. (%)
Mean ± Std. dev Cal per adeq
% >1800 kcals
Freq. (%)
Mean ± Std. dev Cal per adeq
% >1800 kcals
Freq. (%)
Mean ± Std. dev Cal per adeq
% >1800 kcals
Nutrient Groups Consumption Pattern n=
29720 n=
27370 n=
1081 n= 576
n= 551
n= 176
n= 548
n= 398
Carbohydrates 0.7 2106.8±962.3 0.46 6.29 2255.5±1458.1 5.9 0 - 0 0.18 - 0
Non-animal Micronutrient source 0 - 0 0.19 - 0 0 - 0 0 - 0
Fats 0.007 - 0 0 - 0 0 - 0 0 - 0
Animal Protein 0 - 0 0 - 0 0 - 0 0 - 0
Non-Animal Protein Source 0 - 0 0 - 0 0 - 0 0 - 0
10110 4.5 3043.9±1187.2 4.35 0.37 - 0.17 0 - 0 0 - 0
11000 1.2 2094.9±866.6 0.84 26.92 2363.6±1536.0 28.13 0.36 - 0 0 - 0
11001 0.4 2492.5±983.0 0.33 5.92 3087.7±1760.3 8.33 0.18 - 0 0.18 - 0.25
11010 2.1 2396.2±1050.9 1.76 25.35 2040.5±1341.9 21.18 0.36 - 0 0.18 - 0
11011 2.2 2688.3±1081.5 2.04 7.59 2614.6±1442.1 9.03 0 - 0 0.91 1746.5±423.9 0.75
11100 5.3 2679.5±892.0 5.16 6.94 2707.4±1729.8 7.99 13.61 1259.3±622.3 6.25 0.18 - 0
11101 4.3 2785.9±848.3 4.34 1.39 3135.8±2036.1 2.08 5.44 1556.7±611.0 5.68 0.55 - 0
11110 26.8 2999.1±1023.1 26.83 9.99 2071.0±1571.4 7.64 52.27 1537.5±732.0 44.32 8.94 2437.1±1196.9 8.29
11111 47 3231.2±1050.1 48.71 4.53 2787.8±1765.7 5.9 27.77 1922.4±896.6 43.75 87.77 2667.1±1217.9 90.45
Note: 1. Cording for Nutrient Group
Carbohydrates 10000 Non-animal Micronutrient source 1000 Fats 100 Animal Protein 10 Non-Animal Protein Source 1
2. Mean ± Std. dev is reported only if the frequency is more than 4 3. Result is presented when at least one of frequency % is more than 4 %.

68
Table 8-1a: Bivariate Spearman Associations among Candidate Dietary Diversity and Common Household Food Insecurity Indicators for Bangladesh (n=551, n varies for pairs between 485 and 551)
DHSgrps Nutgrps DenseDHS Uniquefs Dense Uniquefs
DHSgrps
Nutgrps 0.65 ***
DenseDHS 0.80 *** 0.57 ***
Uniquefs 0.79 *** 0.51 *** 0.63 ***
DenseUniquefs 0.75 *** 0.46 *** 0.86 *** 0.70 ***
* p<.05; ** p<.01; ***p<.001

69
Table 8-1b: Bivariate Spearman Associations among Candidate Dietary Diversity and Common Household Food Insecurity Indicators for Ghana (overall n=548, n varies for pairs between 542 and 548)
DHSgrps Nutgrps DenseDHS Uniquefs Dense Uniquefs
DHSgrps
Nutgrps 0.38***
DenseDHS 0.83 *** 0.46 ***
Uniquefs 0.68 *** 0.32 *** 0.58 ***
DenseUniquefs 0.52 *** 0.33 *** 0.53 *** 0.90 ***
* p<.05; ** p<.01; ***p<.001

70
Table 8-1c: Bivariate Spearman Associations among Candidate Dietary Diversity and Common Household Food Insecurity Indicators for Afghanistan (overall n=26135)
DHSgrps Nutgrps DenseDHS Uniquefs Dense Uniquefs
DHSgrps
Nutgrps 0.78***
DenseDHS 0.86*** 0.81***
Uniquefs 0.88*** 0.68*** 0.73***
DenseUniquefs 0.80*** 0.72*** 0.84*** 0.85***
* p<.05; ** p<.01; ***p<.001
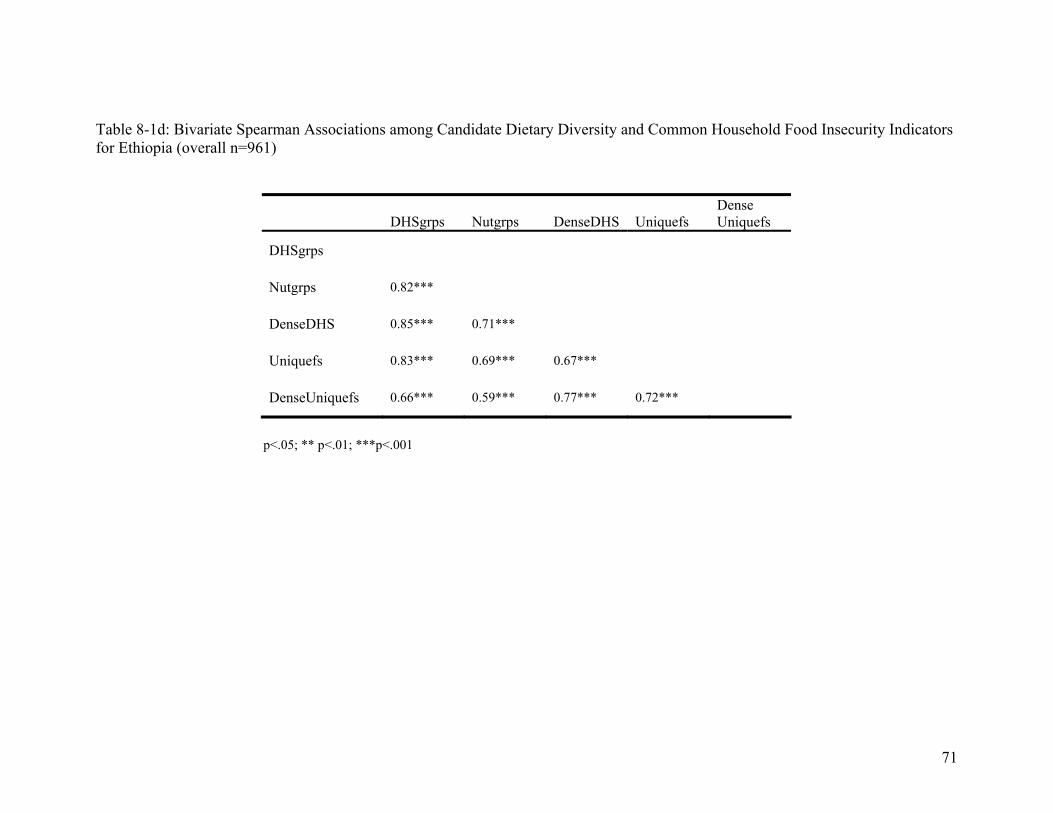
71
Table 8-1d: Bivariate Spearman Associations among Candidate Dietary Diversity and Common Household Food Insecurity Indicators for Ethiopia (overall n=961)
DHSgrps Nutgrps DenseDHS Uniquefs Dense Uniquefs
DHSgrps
Nutgrps 0.82***
DenseDHS 0.85*** 0.71***
Uniquefs 0.83*** 0.69*** 0.67***
DenseUniquefs 0.66*** 0.59*** 0.77*** 0.72***
p<.05; ** p<.01; ***p<.001

72
Table 8-2a: Bivariate Spearman Associations among Candidate Dietary Diversity and Common Household Food Insecurity Indicators for Bangladesh (overall n=551, n varies for pairs between 485 and 551)
DHSgrps Nutgrps DenseDHS Uniquefs Dense Uniquefs
HH Caloric
intake (per AE)
Food Exp p.c.
Food secure HH
Total expend.
Per capita
% of total expend. On food
Female headed
Dependency ratio
Urban location
HH Caloric Intake (per AE) 0.39 *** 0.30 *** 0.38 *** 0.39 *** 0.37 ***
Food Exp per capita 0.25 *** 0.16 *** 0.21 *** 0.25 *** 0.15 ** 0.16 ***
Food Secure 0.34 *** 0.23 *** 0.26 *** 0.37 *** 0.25*** 0.15 ** 0.35 ***
Total Expend. Per capita 0.31 *** 0.19 *** 0.25 *** 0.32 *** 0.21 *** 0.20 *** 0.74 *** 0.43 ***
% of total expend. on food -0.16 *** -0.07 ns -0.13 ** -0.19 *** -0.11 * 0.01 ns -0.12 ** -0.30 *** -0.24 ***
Female headed -0.12** -0.10 * -0.07 ns -0.15 *** -0.09 * 0.07 ns -0.06 ns -0.08 ns -0.06 ns 0.08 ns
Dependency ratio -0.02 ns -0.05 ns -0.06 ns -0.03 ns -0.01 ns -0.02 ns -0.20 *** -0.15 *** -0.23 *** 0.16 *** 0.02 ns
Urban 0.04 ns 0.06 ns 0.07 ns 0.02 ns 0.05 ns 0.08 ns 0.06 ns 0.02 ns 0.07 ns 0.04 ns 0.07 ns -0.01 ns
Has productive land 0.16 *** 0.10 * 0.15 *** 0.15 ** 0.13 ** -0.08 ns 0.08 ns 0.39 *** 0.15 ** -0.34 *** -0.10 * -0.08 ns 0.05 ns
* p<.05; ** p<.01; ***p<.001

73
Table 8-2b: Bivariate Spearman Associations among Candidate Dietary Diversity and Common Household Food Insecurity Indicators for Ghana (overall n=548, n varies for pairs between 542 and 548)
DHSgrps Nutgrps DenseDHS Uniquefs Dense Uniquefs
HH Caloric intake (per AE)
Food Exp per capita
CSI score Total Expenditure per capita
% of total expend on food
Female headed
HH Caloric intake (per AE) 0.30 *** 0.16 *** 0.27 *** 0.41 *** 0.37 ***
Food Exp p.c. 0.43 *** 0.12 ** 0.37 *** 0.48 *** 0.40 *** 0.76 ***
CSI score -0.28 *** -0.04 ns -0.18 *** -0.20 *** -0.10 * -0.10 * -0.25 ***
Tot expend. per capita 0.45 *** 0.12 ** 0.36 *** 0.42 *** 0.31 *** 0.59 *** 0.83 *** -0.35***
% of tot expend on food -0.14 ** -0.003 ns -0.10 * -0.04 ns 0.04 ns 0.12 ** 0.05 ns 0.25 *** -0.46 ***
Female headed -0.10* -0.01 ns -0.02 ns -0.03 ns 0.03 ns 0.11 ** 0.02 ns 0.26 *** -0.12 ** 0.27 ***
Depend. Ratio -0.12** -0.01 ns -0.08 ns -0.06 ns -0.02 ns -0.10 * -0.22 *** 0.22 *** -0.26 *** 0.16 *** 0.22 ***
* p<.05; ** p<.01; ***p<.001 CSI – “Coping Strategies Index”

74
Table 8-2c: Bivariate Spearman Associations among Candidate Dietary Diversity and Common Household Food Insecurity Indicators for Afghanistan (overall n=26135)
DHSgrps Nutgrps DenseDHS Uniquefs Dense Uniquefs
HH Caloric Intake
(per AE)
Household size
Food Exp per capita
Has productive
land
Female headed
HH Caloric Intake (per AE) 0.29*** 0.22*** 0.26*** 0.33*** 0.35***
Household size 0.19*** 0.16*** 0.17*** 0.20*** 0.19*** -0.17***
Food Exp per capita 0.12*** 0.10*** 0.12*** 0.15*** 0.15*** 0.16*** -0.27***
Has productive land -0.02* -0.04*** -0.05*** -0.03*** -0.02** 0.01ns 0.16*** -0.20***
Female headed -0.01ns -0.01ns -0.01ns -0.002ns -0.01ns -0.01ns -0.04*** 0.04*** -0.04***
Dependency ratio -0.06*** -0.05*** -0.04*** -0.06*** -0.05*** 0.15*** -0.12*** -0.03** -0.03*** -0.01ns
* p<.05; ** p<.01; ***p<.001

75
Table 8-2d: Bivariate Spearman Associations among Candidate Dietary Diversity and Common Household Food Insecurity Indicators for Ethiopia (overall n=961)
DHSgrps Nutgrps DenseDHS Uniquefs Dense Uniquefs
HH Caloric Intake (per
AE)
Household size
Food Exp per capita
Has productive
land
Female headed
HH Caloric Intake (per AE) -0.04ns 0.02ns 0.03ns 0.08ns 0.29***
Household size 0.24*** 0.19*** 0.19*** 0.20*** 0.14** -0.41***
Food Exp per capita 0.19*** 0.17*** 0.25*** 0.19*** 0.31*** 0.36*** -0.19***
Has productive land 0.11* 0.10ns 0.07ns 0.11ns 0.07ns -0.16*** 0.22*** -0.08ns
Female headed -0.20*** -0.13** -0.12** -0.19*** -0.09ns 0.04ns -0.17*** 0.03ns -0.20***
Dependency ratio -0.002ns -0.02ns 0.01ns 0.04ns 0.03ns 0.09ns -0.10ns 0.07ns -0.07ns -0.09ns
* p<.05; ** p<.01; ***p<.001

76
Table 9: Spearman Bivariate Associations among Candidate Dietary Diversity Indicators and Household Caloric Intake per AE by Country
Bangladesh Ghana Afghanistan Ethiopia
(n=551) (n=548) (n=26135) (n= 1081)
DHSgrps .39 *** .41 *** .28 *** -.04 ns
Nutgrps .39 *** .30 *** .22 *** .02 ns
DenseDHS .30*** .16 *** .26 *** .03 ns
Uniquefs .38*** .27 *** .32 *** .06 ns
DenseUniquefs .37*** .37 *** .35 *** .27 ***
* p<.05; ** p<.01; ***p<.001
DHSgrps Number of food groups (1-12)
Nutgrp Number of nutrient groups (1-5)
DenseDHS Number of nutrient dense food groups (1-6)
Uniquefs Number of unique foods
DenseUniquef Number of unique nutrient dense foods
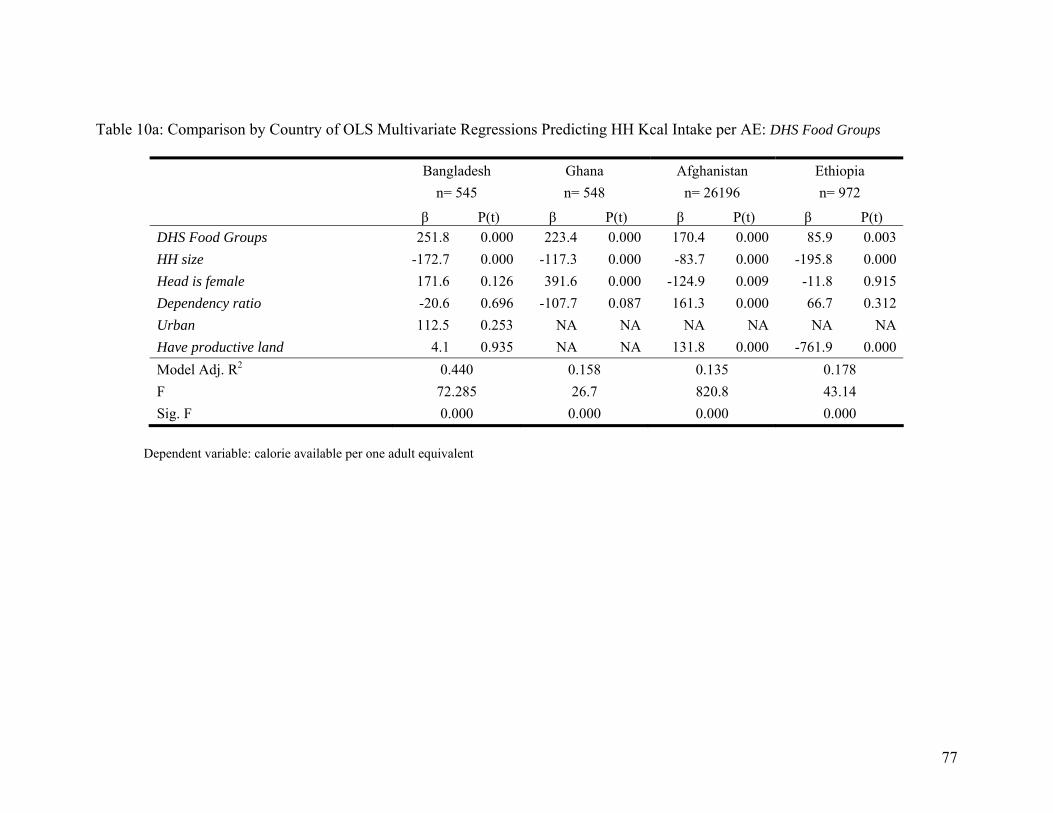
77
Table 10a: Comparison by Country of OLS Multivariate Regressions Predicting HH Kcal Intake per AE: DHS Food Groups
Bangladesh Ghana Afghanistan Ethiopia n= 545 n= 548 n= 26196 n= 972 β P(t) β P(t) β P(t) β P(t) DHS Food Groups 251.8 0.000 223.4 0.000 170.4 0.000 85.9 0.003HH size -172.7 0.000 -117.3 0.000 -83.7 0.000 -195.8 0.000Head is female 171.6 0.126 391.6 0.000 -124.9 0.009 -11.8 0.915Dependency ratio -20.6 0.696 -107.7 0.087 161.3 0.000 66.7 0.312Urban 112.5 0.253 NA NA NA NA NA NAHave productive land 4.1 0.935 NA NA 131.8 0.000 -761.9 0.000Model Adj. R2 0.440 0.158 0.135 0.178 F 72.285 26.7 820.8 43.14 Sig. F 0.000 0.000 0.000 0.000
Dependent variable: calorie available per one adult equivalent

78
Table 10b: Comparison by Country of OLS Multivariate Regressions Predicting HH Kcal Intake per AE: Nutrient Groups
Bangladesh Ghana Afghanistan Ethiopia n= 545 n= 548 n= 26196 n= 972 β P(t) β P(t) β P(t) β P(t) Nutrient Groups 435.0 0.000 498.9 0.000 301.9 0.000 228.0 0.000HH size -167.2 0.000 -122.0 0.000 -77.9 0.000 -198.4 0.000Head is female 129.4 0.285 351.5 0.001 -113.2 0.019 -11.5 0.916Dependency ratio -13.3 0.816 -141.4 0.030 157.5 0.000 71.0 0.278Urban 158.2 0.137 NA NA NA NA NA NAHave productive land 54.3 0.324 NA NA 129.9 0.000 -792.2 0.000Model Adj. R2 0.346 0.100 0.107 0.190 F 48.946 16.267 630.02 46.54 Sig. F 0.000 0.000 0.000 0.000
Dependent variable: calorie available per one adult equivalent

79
Table 10c: Comparison by Country of OLS Multivariate Regressions Predicting HH Kcal Intake per AE: Calorie Dense Food Groups
Bangladesh Ghana Afghanistan Ethiopia n= 545 n= 548 n= 26196 n= 972 β P(t) β P(t) β P(t) β P(t) Calorie Dense Food Groups 366.3 0.000 382.1 0.000 233.3 0.000 212.7 0.000HH size -160.8 0.000 -114.0 0.000 -80.8 0.000 -199.0 0.000Head is female 106.5 0.354 345.0 0.001 -124.0 0.010 -14.2 0.897Dependency ratio 8.3 0.879 -124.3 0.052 153.2 0.000 59.9 0.360Urban 104.1 0.304 NA NA NA NA NA NAHave productive land 0.8 0.988 NA NA 141.6 0.000 -762.4 0.000Model Adj. R2 0.409 0.129 0.120 0.191 F 63.719 21.204 712.18 46.75 Sig. F 0.000 0.000 0.000 0.000
Dependent variable: calorie available per one adult equivalent

80
Table 10d: Comparison by Country of OLS Multivariate Regressions Predicting HH Kcal Intake per AE: Unique Foods
Bangladesh Ghana Afghanistan Ethiopia n= 545 n= 548 n= 26196 n= 972 β P(t) β P(t) β P(t) β P(t) Unique Foods 123.7 0.000 54.7 0.000 82.9 0.000 90.6 0.000HH size -200.8 0.000 -132.6 0.000 -88.0 0.000 -204.7 0.000Head is female 203.9 0.047 345.5 0.001 -152.2 0.001 48.6 0.655Dependency ratio -9.8 0.840 -91.2 0.131 166.7 0.000 46.2 0.475Urban 64.7 0.473 NA NA NA NA NA NAHave productive land 3.8 0.936 NA NA 135.0 0.000 -789.8 0.000Model Adj. R2 0.532 0.228 0.177 0.210 F 104.270 41.307 1124.31 52.58 Sig. F 0.000 0.000 0.000 0.000
Dependent variable: calorie available per one adult equivalent

81
Table 10e: Comparison by Country of OLS Multivariate Regressions Predicting HH Kcal Intake per AE: Calorie Dense Unique Foods
Bangladesh Ghana Afghanistan Ethiopia n= 545 n= 548 n= 26196 n= 972 β P(t) β P(t) β P(t) β P(t) Calorie Dense Unique Foods 215.9 0.000 78.5 0.000 183.0 0.000 349.7 0.000HH size -171.0 0.000 -129.8 0.000 -90.8 0.000 -213.1 0.000Head is female 121.9 0.282 296.6 0.004 -137.5 0.003 29.6 0.769Dependency ratio -29.3 0.585 -108.6 0.079 165.3 0.000 30.6 0.613Urban 76.1 0.447 NA NA NA NA NA NA Have productive land 19.3 0.709 NA NA 132.2 0.000 -782.4 0.000Model Adj. R2 0.425 0.187 0.198 0.309 F 68.022 32.546 1295.35 87.96 Sig. F 0.000 0.000 0.000 0.000
Dependent variable: calorie available per one adult equivalent

82
Table 11: Regression Parameters for Five DD Indicators, Cross-Country Comparison
Bangladesh Ghana Afghanistan Ethiopia n= 545 n= 548 n= 26196 n= 972
Coeff* 251.8*** 223.4*** 170.4*** 85.9**
Beta (stdized) 0.49 0.30 0.31 0.09 DHS groups
R-square 0.44 0.16 0.14 0.18
Coeff* 435.0*** 498.9*** 301.9*** 228.0***
Beta (stdized) 0.37 0.19 0.26 0.14 Nutrient Groups
R-square 0.35 0.10 0.11 0.19
Coeff* 366.3*** 382.1*** 233.3*** 212.7***
Beta (stdized) 0.45 0.25 0.28 0.15 Cal Dense Groups
R-square 0.41 0.13 0.12 0.19
Coeff* 123.7*** 54.7*** 82.9*** 90.6***
Beta (stdized) 0.60 0.40 0.37 0.21 Unique Foods
R-square 0.53 0.23 0.18 0.21
Coeff* 215.9*** 78.5*** 183.0*** 349.7***
Beta (stdized) 0.47 0.35 0.40 0.38 Unique dense foods
R-square 0.43 0.19 0.20 0.31
Note: Stars indicate significance of the coeff, * p<.05; ** p<.01; ***p<.001

83
Table 12a: Comparison by Candidate Dietary Diversity Indicator of Logistic Regressions Predicting HH Consumption of > 1800 Kcal per AE for Bangladesh (n = 551)
DHS Food Groups Nutrient Groups Calorie Dense Food Groups Unique Foods Dense Unique
Foods Adj. OR & CI Adj. OR & CI Adj. OR & CI Adj. OR & CI Adj. OR & CI
DD indicator 2.4*** (2.0-2.8) 5.0*** (3.3-7.4) 3.8*** (2.8-5.2) 1.6*** (1.5-1.8) 2.1*** (1.7-2.4)
HH size 0.4*** (0.4-0.5) 0.4*** (0.4-0.5) 0.4*** (0.4-0.5) 0.3*** (0.3-0.4) 0.4*** (0.4-0.5)
Head is female 1.0 (0.4-2.7) 0.8 (0.3-2.1) 0.8 (0.3-2.1) 1.1 (0.4-3.2) 0.8 (0.3-2.1)
Dependency ratio 1.1 (0.7-1.8) 1.2 (0.7-1.8) 1.3 (0.8-2.1) 1.2 (0.8-2.1) 1.1 (0.7-1.8)
Urban area 1.5 (0.6-3.6) 1.7 (0.7-4.0) 1.5 (0.6-3.4) 1.2 (0.4-3.2) 1.3 (0.5-3.0)
Has productive land 1.0 (0.6-1.6) 1.3 (0.8-2.0) 1.0 (0.6-1.6) 1.0 (0.6-1.7) 1.1 (0.7-1.7)
Cox & Snell R Square 0.34 0.30 0.33 0.40 0.32
Nagelkerke R Square 0.48 0.42 0.47 0.57 0.45
Percentage predicted Correct 82.0 79.6 80.4 86.1 80.2
Crude OR & CI Crude OR & CI Crude OR & CI Crude OR & CI Crude OR & CI
DD indicator 1.7*** (1.5-1.9) 2.6*** (1.9-3.6) 2.4*** (1.9-3.0) 1.2*** (1.2-1.3) 1.5*** (1.4-1.7)
Cox & Snell R Square 0.11 0.07 0.12 0.11 0.09
Nagelkerke R Square 0.15 0.10 0.17 0.16 0.13
Percentage predicted Correct 32.4 68.8 72.1 69.9 69.9
* p<.05; ** p<.01; ***p<.001

84
Table 12b: Comparison by Candidate Dietary Diversity Indicator of Logistic Regressions Predicting HH Consumption of > 1800 Kcal per AE for Ghana (n= 548)
DHS Food Groups Nutrient Groups Calorie Dense Food Groups Unique Foods Dense Unique
Foods Adj. OR & CI Adj. OR & CI Adj. OR & CI Adj. OR & CI Adj. OR & CI
DD indicator 1.5*** (1.3-1.7) 2.4*** (1.6-3.7) 1.9*** (1.5-2.5) 1.1*** (1.1-1.1) 1.2*** (1.1-1.2)
HH size 0.9** (0.8-0.9) 0.9** (0.8-0.9) 0.9** (0.8-1.0) 0.8*** (0.8-0.9) 0.9*** (0.8-0.9)
Head is female 1.7* (1.1-2.6) 1.5 (1.0-2.3) 1.5 (0.9-2.3) 1.6 (1.0-2.5) 1.4 (0.9-2.2)
Dependency ratio 0.8 (0.6-1.1) 0.8 (0.6-1.0) 0.8 (0.6-1.0) 0.8 (0.6-1.1) 0.8 (0.6-1.1)
Cox & Snell R Square 0.11 0.06 0.08 0.15 0.11
Nagelkerke R Square 0.17 0.09 0.11 0.22 0.16
Percentage predicted Correct 75.5 74.3 73.5 74.3 74.1
Crude OR & CI Crude OR & CI Crude OR & CI Crude OR & CI Crude OR & CI
DD indicator 1.5*** (1.3-1.7) 2.1*** (1.4-3.2) 1.9*** (1.5-2.4) 1.1*** (1.1-1.1) 1.1*** (1.1-1.2)
Cox & Snell R Square 0.08 0.03 0.05 0.11 0.08
Nagelkerke R Square 0.12 0.04 0.07 0.16 0.12
Percentage predicted Correct 73.5 73.7 73.7 75.2 73.4
* p<.05; ** p<.01; ***p<.001

85
Table 12c: Comparison by Candidate Dietary Diversity Indicator of Logistic Regressions Predicting HH Consumption of > 1800 Kcal per AE for Afghanistan (n=26196)
DHS Food Groups Nutrient Groups Calorie Dense Food Groups Unique Foods Dense Unique
Foods Adj. OR & CI Adj. OR & CI Adj. OR & CI Adj. OR & CI Adj. OR & CI
DD indicator 1.4***(1.4-1.5) 2.0***(1.9-2.1) 1.7***(1.6-1.7) 1.2***(1.2-1.2) 1.6***(1.5-1.6)
HH size 0.9***(0.9-0.9) 0.9***(0.9-0.9) 0.9***(0.9-0.9) 0.9***(0.9-0.9) 0.9***(0.8-0.9)
Head is female 0.9(0.6-1.3) 0.9(0.6-1.3) 0.9(0.6-1.2) 0.9***(0.6-1.2) 0.9(0.6-1.2)
Dependency ratio 1.5***(1.3-1.6) 1.4***(1.3-1.6) 1.4***(1.3-1.5) 1.5***(1.3-1.6) 1.5***(1.4-1.6)
Has productive land 1.6***(1.4-1.7) 1.6***(1.4-1.7) 1.6***(1.4-1.7) 1.5***(1.4-1.7) 1.6***(1.4-1.7)
Cox & Snell R Square 0.04 0.04 0.04 0.05 1.00
Nagelkerke R Square 0.04 0.04 0.04 0.05 1.00
Percentage predicted Correct 92.4 92.4 92.4 92.4 92.4
Crude OR & CI Crude OR & CI Crude OR & CI Crude OR & CI Crude OR & CI
DD indicator 1.4***(1.3-1.4) 1.8***(1.8-1.9) 1.6***(1.5-1.6) 1.2***(1.2-1.2) 1.5***(1.4-1.5)
Cox & Snell R Square 0.026 0.026 0.027 0.03 0.044
Nagelkerke R Square 0.026 0.026 0.027 0.03 0.044
Percentage predicted Correct 92.09 92.09 92.09 92.09 92.09
* p<.05; ** p<.01; ***p<.001

86
Table 12d: Comparison by Candidate Dietary Diversity Indicator of Logistic Regressions Predicting HH Consumption of > 1800 Kcal per AE for Ethiopia (n= 972)
DHS Food Groups Nutrient Groups Calorie Dense Food Groups Unique Foods Dense Unique
Foods Adj. OR & CI Adj. OR & CI Adj. OR & CI Adj. OR & CI Adj. OR & CI
DD indicator 1.1(1.0-1.2) 1.3**(1.1-1.5) 1.2**(1.1-1.4) 1.1***(1.1-1.2) 1.6***(1.4-1.7)
HH size 0.8***(0.7-0.8) 0.8***(0.7-0.8) 0.8***(0.7-0.8) 0.8***(0.7-0.8) 0.7***(0.7-0.8)
Head is female 0.9(0.6-1.3) 0.9(0.6-1.3) 0.9(0.6-1.3) 1.0(0.7-1.4) 1.0(0.7-1.4)
Dependency ratio 1.2(1.0-1.4) 1.2(1.0-1.4) 1.2(1.0-1.4) 1.2(0.9-1.4) 1.1(0.9-1.4)
Has productive land 0.5*(0.3-1.0) 0.5*(0.3-0.9) 0.5*(0.3-1.0) 0.5*(0.3-0.9) 0.5*(0.2-0.9)
Cox & Snell R Square 0.11 0.12 0.12 0.13 0.20
Nagelkerke R Square 0.15 0.16 0.16 0.17 0.26
Percentage predicted Correct 64.5 64.7 64.9 65.7 69.0
Crude OR & CI Crude OR & CI Crude OR & CI Crude OR & CI Crude OR & CI
DD indicator 1.0(0.9-1.0) 1.1(0.9-1.2) 1.1(1.0-1.2) 1.0*(1.0-1.1) 1.4***(1.3-1.5)
Cox & Snell R Square 0.001 0.001 0.001 0.006 0.058
Nagelkerke R Square 0.001 0.001 0.001 0.006 0.058
Percentage predicted Correct 53.28 53.28 53.56 55.04 60.04
* p<.05; ** p<.01; ***p<.001

87
Table 13: Adjusted Odds Ratios for Five DD Indicators, Cross-Country Comparison
Bangladesh Ghana Afghanistan Ethiopia
n = 551 n =548 n = 26196 n = 972 Adj OR *** 2.4*** (2.0-2.8) 1.5*** (1.3-1.7) 1.4***(1.4-1.5) 1.1(1-1.2) Pct correct 82 75.5 92.4 64.5 CoxSnell 0.34 0.11 0.04 0.11
DHS Food Groups
Nagelkirke 0.48 0.165 0.04 0.15 Adj OR *** 5.0*** (3.3-7.4) 2.4*** (1.6-3.7) 2.0***(1.9-2.1) 1.3**(1.1-1.5) Pct correct 79.6 74.3 92.4 64.7 CoxSnell 0.30 0.06 0.04 0.12
Nutrient Groups
Nagelkirke 0.42 0.085 0.04 0.16 Adj OR *** 3.8*** (2.8-5.2) 1.9*** (1.5-2.5) 1.7***(1.6-1.7) 1.2**(1.1-1.4) Pct correct 80.4 73.5 92.4 64.9 CoxSnell 0.33 0.08 0.04 0.12
Calorie Dense Groups
Nagelkirke 0.47 0.11 0.04 0.16 Adj OR *** 1.6*** (1.5-1.8) 1.1*** (1.1-1.1) 1.2***(1.2-1.2) 1.1***(1.1-1.2) Pct correct 86.1 74.3 92.4 65.7 CoxSnell 0.40 0.15 0.05 0.13
Unique Foods
Nagelkirke 0.57 0.22 0.05 0.17 Adj OR *** 2.1*** (1.7-2.4) 1.2*** (1.1-1.2) 1.6***(1.5-1.6) 1.6***(1.4-1.7) Pct correct 80.2 74.1 92.4 69 CoxSnell 0.32 0.11 1.00 0.20
Calorie Dense Unique Foods Nagelkirke 0.45 0.16 1.00 0.26
* p<.05; ** p<.01; ***p<.001
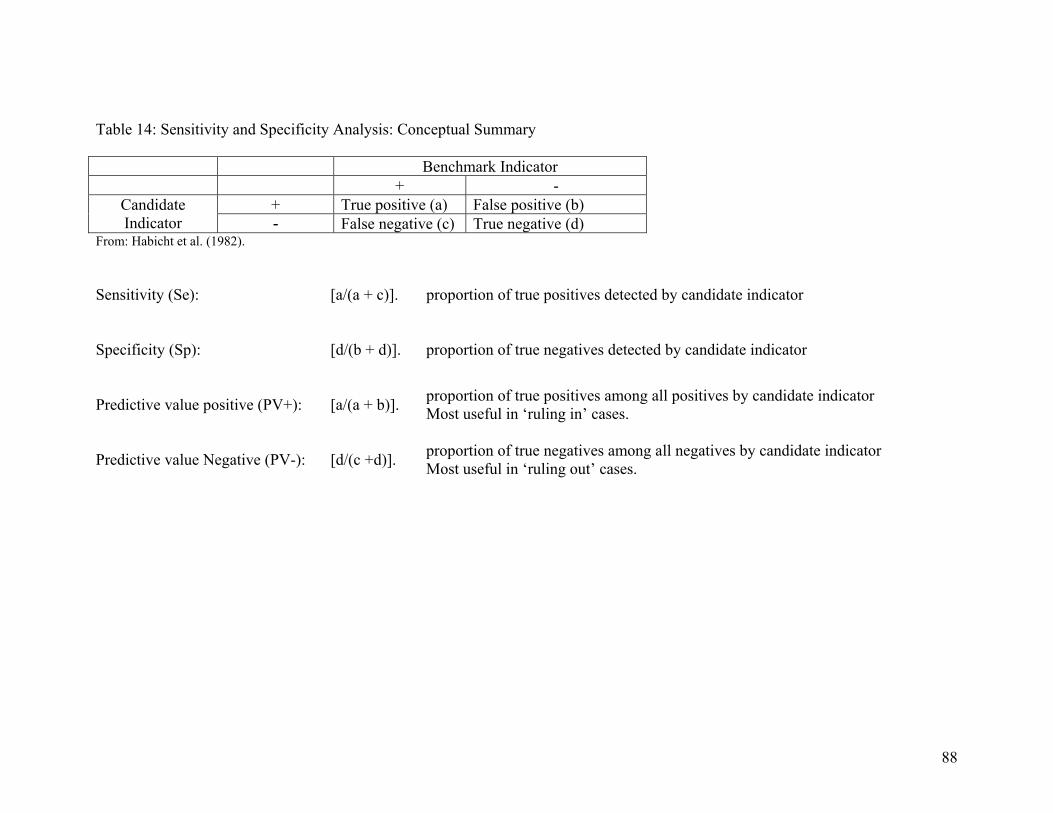
88
Table 14: Sensitivity and Specificity Analysis: Conceptual Summary Benchmark Indicator + -
+ True positive (a) False positive (b) Candidate Indicator - False negative (c) True negative (d)
From: Habicht et al. (1982).
Sensitivity (Se): [a/(a + c)]. proportion of true positives detected by candidate indicator
Specificity (Sp): [d/(b + d)]. proportion of true negatives detected by candidate indicator
Predictive value positive (PV+): [a/(a + b)]. proportion of true positives among all positives by candidate indicator Most useful in ‘ruling in’ cases.
Predictive value Negative (PV-): [d/(c +d)]. proportion of true negatives among all negatives by candidate indicator Most useful in ‘ruling out’ cases.

89
Table 15a: Sensitivity/Specificity Analysis Testing Nutrient Groups Index Thresholds against Households Consuming either < or ≥1800 Kcals per AE, by Country
Afghanistan Ethiopia Bangladesh Ghana n = 29720 n = 1081 n = 551 n = 548
< 1800
≥ 1800 Se Sp PV
+ PV- % Co
< 1800
≥ 1800 Se Sp PV
+ PV- % Co
< 1800
≥ 1800 Se Sp PV
+ PV- % Co
< 1800
≥ 1800 Se Sp PV
+ PV- % Co
ge 5 645 13333 0.73 0.49 0.11 0.95 51 15 34 0.97 0.06 0.47 0.69 48 76 77 0.80 0.44 0.75 0.50 68 121 360 0.19 0.90 0.43 0.75 71
lt 5 1705 14037 490 542 299 99 29 38
ge 4 1472 22961 0.37 0.84 0.17 0.94 80 113 142 0.78 0.25 0.47 0.56 49 306 165 0.18 0.94 0.86 0.35 42 142 396 0.05 0.99 0.80 0.74 74
lt 4 878 4409 392 434 69 11 8 2
ge 3 1987 26265 0.15 0.96 0.25 0.93 90 318 363 0.37 0.63 0.47 0.53 51 373 176 0.01 1.00 1.00 0.32 32 147 397 0.02 1.00 0.75 0.73 73
lt 3 363 1105 187 213 2 0 3 1
ge 2 2264 27245 0.04 1.00 0.41 0.92 92 469 542 0.07 0.94 0.51 0.54 53 375 176 0.00 1.00 NA 0.32 32 149 398 0.01 1.00 NA 0.73 73
lt 2 86 125 36 34 0 0 1 0

90
Table 15b: Sensitivity/Specificity Analysis Testing DHS Groups Index Thresholds against Households Consuming either < or ≥1800 Kcals per AE, by Country
Afghanistan Ethiopia Bangladesh Ghana n = 29720 n = 1081 n = 551 n = 548
< 1800
≥ 1800 Se Sp PV
+ PV- % Co
< 1800
≥ 1800 Se Sp PV
+ PV- % Co
< 1800
≥ 1800 Se Sp PV
+ PV- % Co
< 1800
≥ 1800 Se Sp PV
+ PV- % Co
ge12 0 0 1.00 0.00 0.08 na 8 0 0 1.00 0.00 0.47 na 47 0 0 1.00 0.00 0.68 na 68 29 128 0.81 0.32 0.31 0.82 45 lt12 2350 27370 505 576 375 176 121 270
ge11 0 13 1.00 0.00 0.08 1.00 8 0 0 1.00 0.00 0.47 na 47 0 2 1.00 0.01 0.68 1.00 68 56 253 0.63 0.64 0.39 0.82 63 lt11 2350 27357 505 576 375 174 94 145
ge10 30 786 0.99 0.03 0.08 0.96 10 0 0 1.00 0.00 0.47 na 47 9 16 0.98 0.09 0.70 0.64 69 86 336 0.43 0.84 0.51 0.80 73 lt10 2320 26584 505 576 366 160 64 62
ge9 195 5327 0.92 0.19 0.09 0.96 25 4 2 0.99 0.00 0.47 0.33 47 44 55 0.88 0.31 0.73 0.56 70 115 375 0.23 0.94 0.60 0.77 75 lt9 2155 22043 501 574 331 121 35 23
ge8 489 10913 0.79 0.40 0.10 0.96 43 26 26 0.95 0.05 0.47 0.50 47 94 94 0.75 0.53 0.77 0.50 68 131 384 0.13 0.96 0.58 0.75 74 lt8 1861 16457 479 550 281 82 19 14
ge7 890 16748 0.62 0.61 0.12 0.95 61 73 81 0.86 0.14 0.47 0.53 47 178 130 0.53 0.74 0.81 0.42 59 137 395 0.09 0.99 0.81 0.74 74 lt7 1460 10622 432 495 197 46 13 3
ge6 1290 21382 0.45 0.78 0.15 0.94 76 156 167 0.69 0.29 0.46 0.52 48 298 170 0.21 0.97 0.93 0.36 45 141 396 0.06 0.99 0.82 0.74 74 lt6 1060 5988 349 409 77 6 9 2
ge5 1653 24317 0.30 0.89 0.19 0.94 84 269 289 0.47 0.50 0.45 0.52 49 364 174 0.03 0.99 0.85 0.32 34 144 396 0.04 0.99 0.75 0.73 73 lt5 697 3053 236 287 11 2 6 2
ge4 1942 25876 0.17 0.95 0.21 0.93 88 381 415 0.25 0.72 0.44 0.52 50 375 176 0.00 1.00 na 0.32 32 148 398 0.01 1.00 1.00 0.73 73 lt4 408 1494 124 161 0 0 2 0
ge3 2156 26792 0.08 0.98 0.25 0.93 91 464 534 0.08 0.93 0.49 0.54 53 375 176 0.00 1.00 na 0.32 32 149 398 0.01 1.00 1.00 0.73 73 lt3 194 578 41 42 0 0 1 0
ge2 2283 27286 0.03 1.00 0.44 0.92 92 496 572 0.02 0.99 0.69 0.54 54 375 176 0.00 1.00 na 0.32 32 150 398 1.00 0.00 0.27 na na lt2 67 84 9 4 0 0 0 0

91
Table 15c: Sensitivity/Specificity Analysis Testing Calorie Dense Group Thresholds against Households Consuming either < or ≥1800 Kcals per AE, by Country
Afghanistan Ethiopia Bangladesh Ghana n = 29720 n = 1081 n = 551 n = 548
< 1800
≥ 1800 Se Sp PV
+ PV- % Co
< 1800
≥ 1800 Se Sp PV
+ PV- % Co
< 1800
≥ 1800 Se Sp PV
+ PV- % Co
< 1800
≥ 1800 Se Sp PV
+ PV- % Co
ge 6 411 9608 0.83 0.35 0.10 0.96 39 0 0 1.00 0.00 0.47 na 47 5 11 0.99 0.06 0.69 na 69 47 201 0.69 0.51 0.34 0.81 55 lt 6 1939 17762 505 576 370 165 103 197
ge 5 957 17864 0.59 0.65 0.13 0.95 65 9 8 0.98 0.01 0.47 0.47 47 43 62 0.89 0.35 0.74 0.59 72 110 353 0.27 0.89 0.47 0.76 72 lt 5 1393 9506 496 568 332 114 40 45
ge 4 1486 23096 0.37 0.84 0.17 0.94 81 55 77 0.89 0.13 0.47 0.58 49 170 133 0.55 0.76 0.83 0.44 61 140 394 0.07 0.99 0.71 0.74 74 lt 4 864 4274 450 499 205 43 10 4
ge 3 1923 25812 0.18 0.94 0.22 0.93 88 153 211 0.70 0.37 0.49 0.58 52 336 172 0.10 0.98 0.91 0.34 38 148 398 0.01 1.00 1.00 0.73 73 lt 3 427 1558 352 365 39 4 2 0
ge 2 2224 27151 0.05 0.99 0.37 0.92 92 356 396 0.30 0.69 0.45 0.53 50 375 176 0.00 1.00 na 0.32 32 150 398 0.00 1.00 na 0.73 73 lt 2 126 219 149 180 0 0 0 0

92
Table 16: Household Demographics N % State North West South
791 663 636
37.8 31.7 30.4
Type of Household Resident IDP hh in camp IDP hh in community
809 782 364
41.4 40.0 18.6
Household Headship Male-headed Female-headed
1402 688
67.1 32.9
Main Source of Income Wage Labour, Skilled Labor, Salaried Work Sale of Cereals, Ag, Livestock, Animal Prod. Food Aid Sales Firewood, Grass Sales Petty Trade Kinship, Begging, Borrowing Remittances Others
822 407 385 286 69 34 33 31
39.4 19.5 18.5 13.8 3.3 2.4 1.6 1.5
Monthly Household Expenditure (in dinars) Mean food expenditure ± SD Mean total (food+non-food) expenditure ± SD
9606 ± 8733
14918 ± 13447 Animal Ownership Ownership of ≥1 Large Animal*
1128
54.0
Agricultural Production Cultivation of any agricultural land in past year
1063
50.9
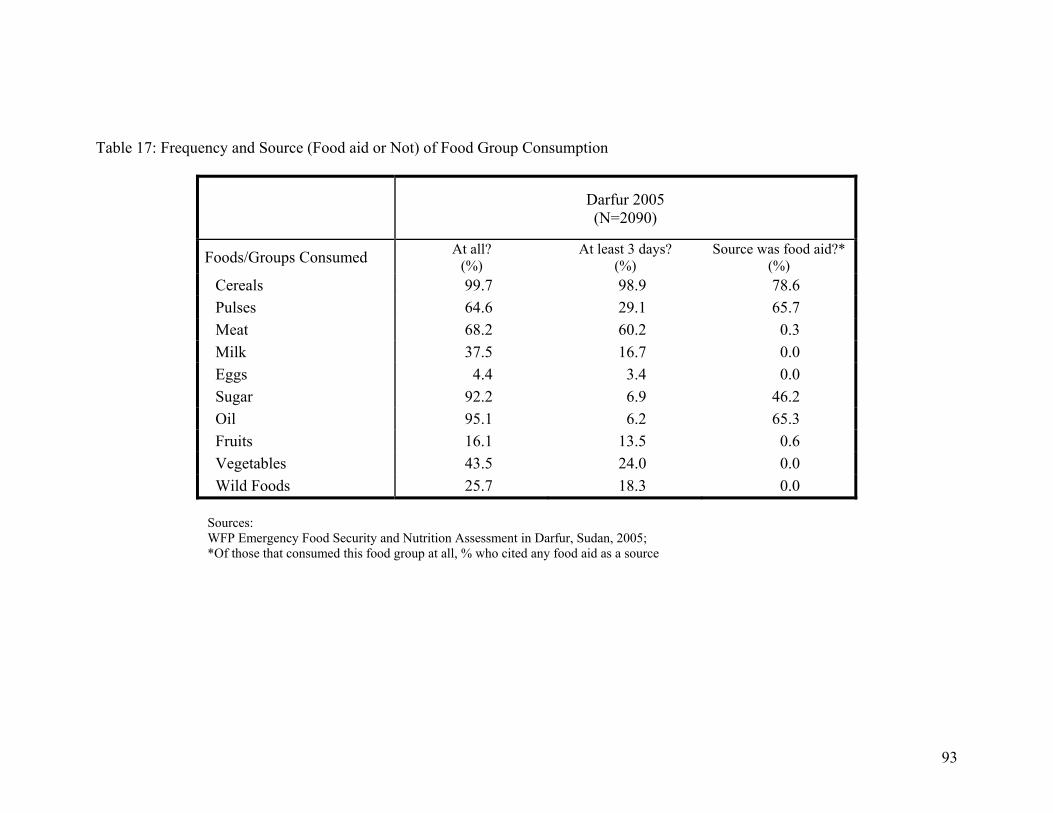
93
Table 17: Frequency and Source (Food aid or Not) of Food Group Consumption
Darfur 2005 (N=2090)
Foods/Groups Consumed At all? (%)
At least 3 days? (%)
Source was food aid?* (%)
Cereals 99.7 98.9 78.6 Pulses 64.6 29.1 65.7 Meat 68.2 60.2 0.3 Milk 37.5 16.7 0.0 Eggs 4.4 3.4 0.0 Sugar 92.2 6.9 46.2 Oil 95.1 6.2 65.3 Fruits 16.1 13.5 0.6 Vegetables 43.5 24.0 0.0 Wild Foods 25.7 18.3 0.0
Sources: WFP Emergency Food Security and Nutrition Assessment in Darfur, Sudan, 2005; *Of those that consumed this food group at all, % who cited any food aid as a source

94
Table 18: Bivariate Correlations among Frequency of Wild Food Consumption, Frequency of Consumption of Individual Food Groups, and Dietary Diversity Indices
Correlate Wild Foods (Pearson r) Millet -.06* Sorghum .09*** Other Cereals -.07** Pulses -.07** Meat -.04 Milk -.06* Eggs -.03 Sugar -.04* Oil -.02 Fruits -.01 Vegetables -.08*** AVDDD21 -.10*** DDavg_nowild2 -.09*** Allfdssumwk_nowild3 -.07** AllfdgrpWk_nowild4 -.10***
1# of days of consumption of (cereal* + groundnuts/pulses + meat/chicken + cooking oil + vegetables + fruits + milk/yogurt + sugar + eggs) / 7; *cereal = average # of days per week sorghum, millet, and/or cereals consumed 2# of days of consumption of (sorghum + millet + other cereals + groundnuts/pulses + meat/chicken + cooking oil + vegetables + fruits + milk/yogurt + sugar + eggs) / 7 3 Reported from a list of 12 food items (sorghum, millet, other cereals, groundnuts/legumes, meat/chicken/bush meat, oil, vegetables, fruit, milk/yogurt/cheese, sugar, eggs) 45 food groups possible: cereals (incl. sorghum, millet, ‘other’ cereals), protein (incl. pulses, meat, eggs, milk/dairy), fat (incl. oil), fruits/vegetables, sugar * p<.05; ** p<.01; ***p<.001

95
Table 19: Crosstabulation of Wild Food Consumption, Household Displacement Status (IDP or Camp), and Total Per Capita Monthly Expenditure Terciles
IDP Camp resident Pc Expenditure Tercile PcFood Expenditure Tercile
(N= 1955) (N= 2090) (N=2090) (N= 2090)
Consumed wild foods
Yes No Total Yes No Total Highest Middle Lowest Total Highest Middle Lowest Total
321 197 518 197 340 537 164 200 173 537 166 198 173 537 Yes (% within wild food consu.) (62.0) (38.0) (100.0) (36.7) (63.3) (100.0) (30.5) (37.2) (32.2) (100.0) (30.9) (36.9) (32.2) (100.0)
825 612 1437 585 968 1553 533 497 523 1553 532 504 517 1553 No (% within wild food consu.) (57.4) (42.6) (100.0) (37.7) (62.3) (100.0) (34.3) (32.0) (33.7) (100.0) (34.3) (32.5) (33.3) (100.0)

96
Table 20: Bivariate Associations among Darfur Dietary Diversity Indicators and Common Food Insecurity Proxies
DDAVG_nowild AVGDD2 Allfdsumwk_nowld allfdgrpwk
Consumption
Adults consume lt 3 meals per day -.25*** -.24*** -.26*** -.17***
Children consume lt 3 meals per day -.23*** -.25*** -.22*** -.22***
Expenditure
Monthly food exp. (p.c.) .30*** .28*** .34*** .23***
Monthly total exp. (pc) .35*** .34*** .39*** .26***
% spent on food† -.04 -.06** .03 .02
Assets
Asset score .36*** .32*** .42*** .26***
Livestock diversity .12*** .10*** .12*** .05*
Coping status
Number of coping strategies affirmed -.22*** -.19*** -.17*** -.12***
* p<.05; ** p<.01; *** p<.001

97
Table 21: Crosstabulation of Nutrient Consumption Adequacy Groups with Food Expenditure p.c. and Percentage of Total Expenditure Spent on Food
Tertiles of Per Capita Food Expenditure (N= 1992)
Tertiles of Percentage of Expenditures Spent on Food
(N= 2048)
Achieved minimum consumption of the following nutrient groups
Lowest Middle Highest Total Lowest Middle Highest Total 13 26 34 73 30 26 17 73 1.
Daily Intake of ≥ 1 cereal*, 1 protein†, 1 fat° & 1 fruit/veg (17.8) (35.6) (46.6) (100) (41.1) (35.6) (23.3) (100)
98 141 171 410 134 159 116 409 2.
Daily Intake of ≥ 1 cereal*, 1 protein† and 1 fat° + fr/veg consumption ≥ 3 times per week (23.9) (34.4) (41.7) (100) (32.8) (38.9) (28.4) (100)
115 165 207 487 199 168 118 485 3.
Daily Intake of ≥ 1 cereal*, 1 protein†, 1 fat° and sugar (23.6) (33.9) (42.5) (100) (41.0) (34.6) (24.3) (100)
156 178 216 550 227 184 132 543 4. Daily Intake of ≥ 1 cereal*, 1 protein† and 1 fat
(28.4) (32.4) (39.3) (100) (41.8) (33.9) (24.3) (100)
* ‘cereal’ defined as millet, sorghum or other cereal † ‘protein’ defined as pulse/legume/groundnut, animal meat, egg, milk ° ‘fat’ defined as oil

98
Table 22: Predictors of Dietary Diversity - OLS with Robust SE
Model Number 1 2
Dependent Variable AVGDD2a Allfdsumwkb
Independent Variables B (robust SE) B (robust SE)
Constant -0.588 (0.271)* -2.35 (0.427)**
Cultivate ag land (dummy) -0.202 (0.054)** 0.053 (0.095)
IDP hh (dummy) -0.127 (0.054)* -0.197 (0.096)*
Food aid received in July or August (dummy) 0.262 (0.057)** 0.230 (0.101)**
# of adult meals/d 0.226 (0.040)** 0.340 (0.069)**
Log total food expenditure -0.051 (0.057) 0.0156 (0.097)
Log total expenditure 0.485 (0.061)** 0.818 (0.099)**
Shock (dummy) -0.218 (0.062)** -0.233(0.102)*
# of consumption-related coping strategies in past 30 d -0.092 (0.031)** -0.77 (0.049)**
Large animal ownership (dummy) 0.081 (0.053) 0.036 (0.091)
Female headed household (dummy) -0.028 (0.051) -0.171 (0.085)*
Household size -0.013 (0.009) -0.029 (0.0154)
West 0.178 (0.057)** 0.662 (0.098)**
South 0.254 (0.058)** 0.728 (0.099)**
N 1800 1800
R Squared 0.244 0.268
Adjusted R Squared 0.239 0.263
F value 44.38** 50.34**
a # of days of consumption of (cereals + groundnuts/pulses + meat/chicken + cooking oil + vegetables + fruits + milk/yogurt + sugar + eggs) / 7 b # of different foods consumed by the household at least once in the past week (list of 12 food items: sorghum, millet, other cereals, groundnuts/pulses, meat/chicken, cooking oil, vegetables, fruits, milk/yogurt, sugar, eggs, wild foods) * p<0.05 **p<0.01

99
Table 23: Predictors of Dietary Diversity amongst IDPs – OLS with Robust SE
Model Number 3 4
Dependent Variable AVGDD2a Allfdsumwkb
Independent Variables B (robust SE) B (robust SE)
Constant -0.443 (0.329) -1.85 (0.503) **
Cultivate ag land (dummy) 0.031 (0.066) 0.426 (0.116)**
IDP camp (dummy) 0.0378 (0.0648) -0.282 (0.114)*
Food aid received in July or August (dummy) 0.474 (0.075)** 0.686 (0.133)**
# of adult meals/d 0.220 (0.050)** 0.159 (0.081)
Log total food expenditure -0.067 (0.069) -0.074 (0.117)
Log total expenditure 0.452 (0.0742)** 0.853 (0.124)**
Shock (dummy) -0.226 (0.084)** -0.148 (0.127)
# of consumption-related coping strategies in past 30 d -0.066 (0.040) -0.193 (0.059)**
Large animal ownership (dummy) -0.012 (0.062) -0.019 (0.106)
Female headed household (dummy) -0.130 (0.064)* -0.274 (0.103)**
Household size -0.0135 (0.012) -0.042 (0.019)*
West 0.187 (0.075)* 0.586 (0.124)**
South 0.186 (0.085)* 0.735 (0.141)**
N 1055 1055
R Squared 0.242 0.291
Adjusted R Squared 0.233 0.282
F value 25.59** 32.80** a # of days of consumption of (cereals + groundnuts/pulses + meat/chicken + cooking oil + vegetables + fruits + milk/yogurt + sugar + eggs) / 7 b # of different foods consumed by the household at least once in the past week (list of 12 food items: sorghum, millet, other cereals, groundnuts/pulses, meat/chicken, cooking oil, vegetables, fruits, milk/yogurt, sugar, eggs, wild foods) * p<0.05 **p<0.01
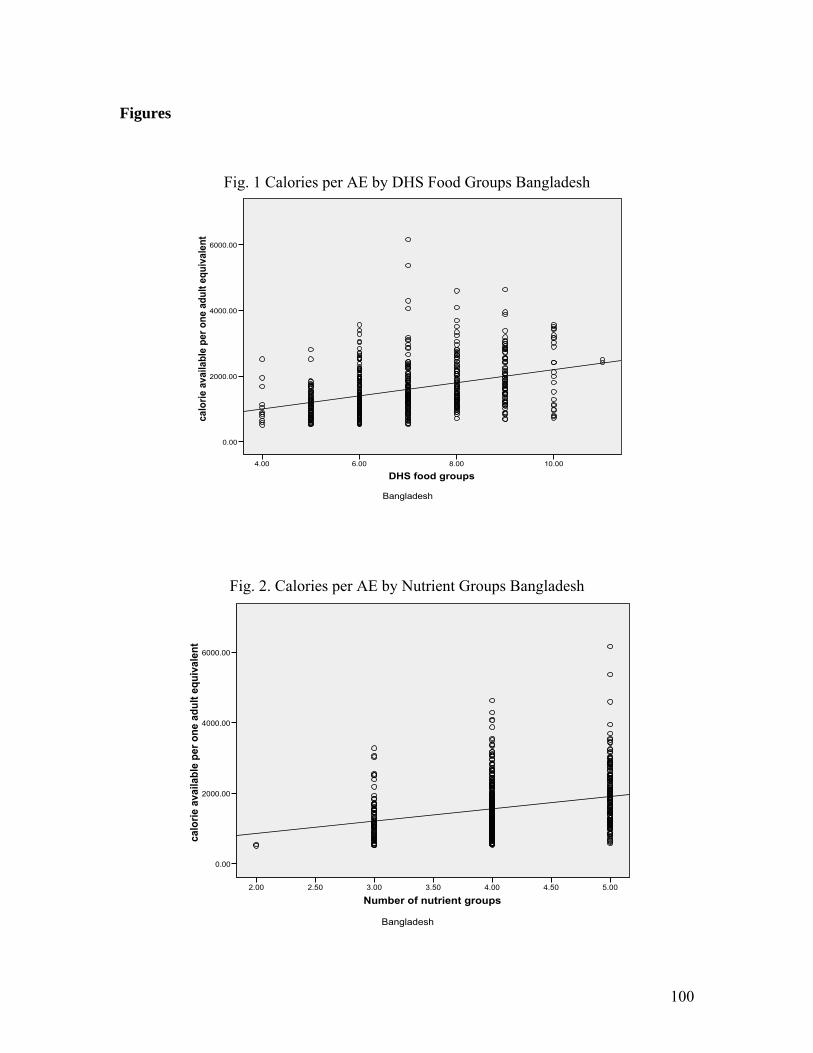
100
Figures
Fig. 1 Calories per AE by DHS Food Groups Bangladesh
DHS food groups10.008.006.004.00
calo
rie a
vaila
ble
per o
ne a
dult
equi
vale
nt 6000.00
4000.00
2000.00
0.00
Bangladesh
Fig. 2. Calories per AE by Nutrient Groups Bangladesh
Number of nutrient groups5.004.504.003.503.002.502.00
calo
rie a
vaila
ble
per o
ne a
dult
equi
vale
nt 6000.00
4000.00
2000.00
0.00
Bangladesh
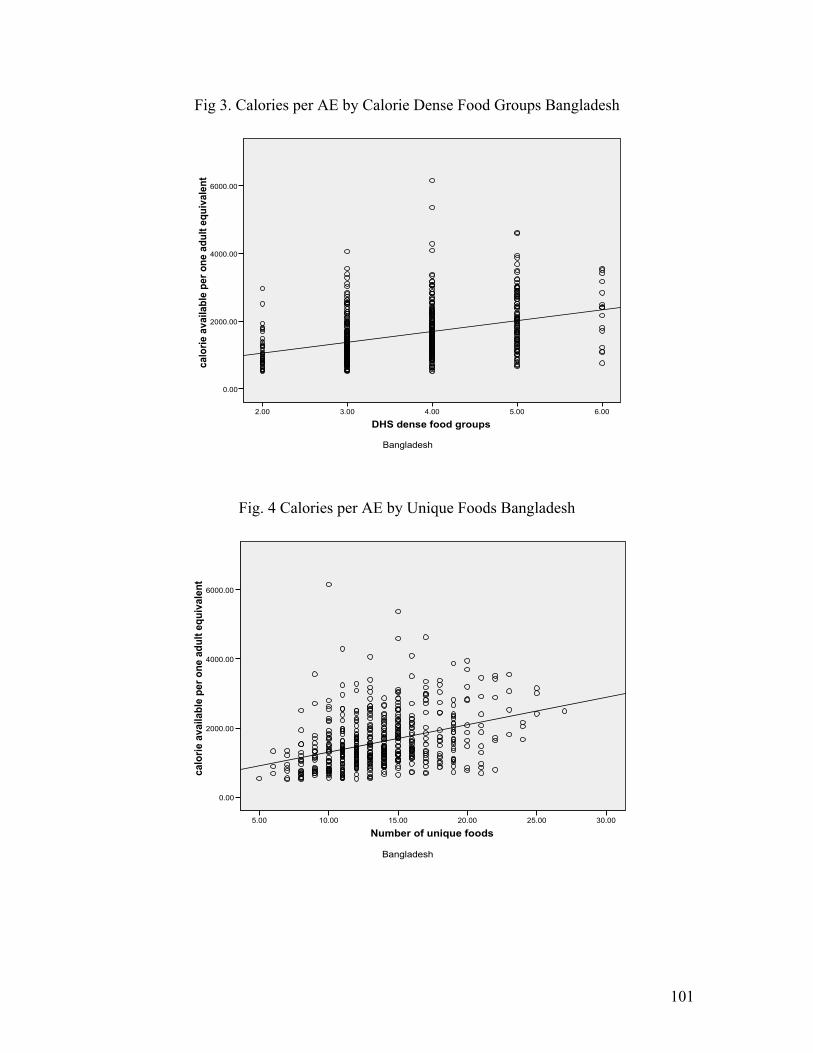
101
Fig 3. Calories per AE by Calorie Dense Food Groups Bangladesh
DHS dense food groups6.005.004.003.002.00
calo
rie a
vaila
ble
per o
ne a
dult
equi
vale
nt 6000.00
4000.00
2000.00
0.00
Bangladesh
Fig. 4 Calories per AE by Unique Foods Bangladesh
Number of unique foods30.0025.0020.0015.0010.005.00
calo
rie a
vaila
ble
per o
ne a
dult
equi
vale
nt 6000.00
4000.00
2000.00
0.00
Bangladesh

102
Fig. 5 Calories per AE by Calorie Dense Unique Foods Bangladesh
Number of unique dense foods12.0010.008.006.004.002.00
calo
rie a
vaila
ble
per o
ne a
dult
equi
vale
nt 6000.00
4000.00
2000.00
0.00
Bangladesh
Fig. 6 Calories per AE by DHS Food Groups Ghana
DHS food groups12.0010.008.006.004.002.00
Kcal
per
AEU
8000.00
6000.00
4000.00
2000.00
0.00
Ghana

103
Fig. 7 Calories per AE by Nutrient Groups Ghana
Number of nutrient groups5.004.003.002.001.00
Kcal
per
AEU
8000.00
6000.00
4000.00
2000.00
0.00
Ghana
Fig. 8. Calories per AE by Calorie Dense Nutrient Groups Ghana
DHS dense food groups6.005.004.003.002.00
Kcal
per
AEU
8000.00
6000.00
4000.00
2000.00
0.00
Ghana

104
Fig 9. Calories per AE by Number of Unique Foods Ghana
Number of unique foods60.0040.0020.000.00
Kcal
per
AEU
8000.00
6000.00
4000.00
2000.00
0.00
Ghana
Fig. 10 Calories per AE by Number of Calorie Dense Unique Foods Ghana
Number of unique dense foods40.0030.0020.0010.000.00
Kcal
per
AEU
8000.00
6000.00
4000.00
2000.00
0.00
Ghana
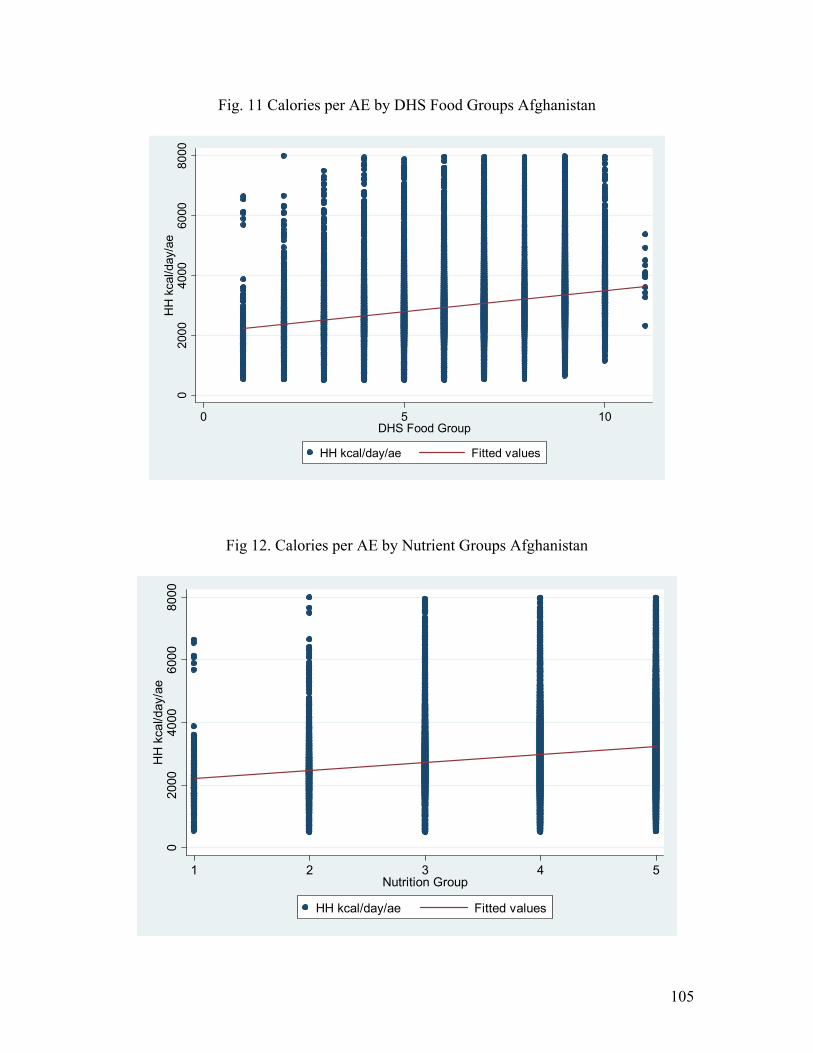
105
Fig. 11 Calories per AE by DHS Food Groups Afghanistan
020
0040
0060
0080
00H
H k
cal/d
ay/a
e
0 5 10DHS Food Group
HH kcal/day/ae Fitted values
Fig 12. Calories per AE by Nutrient Groups Afghanistan
020
0040
0060
0080
00H
H k
cal/d
ay/a
e
1 2 3 4 5Nutrition Group
HH kcal/day/ae Fitted values
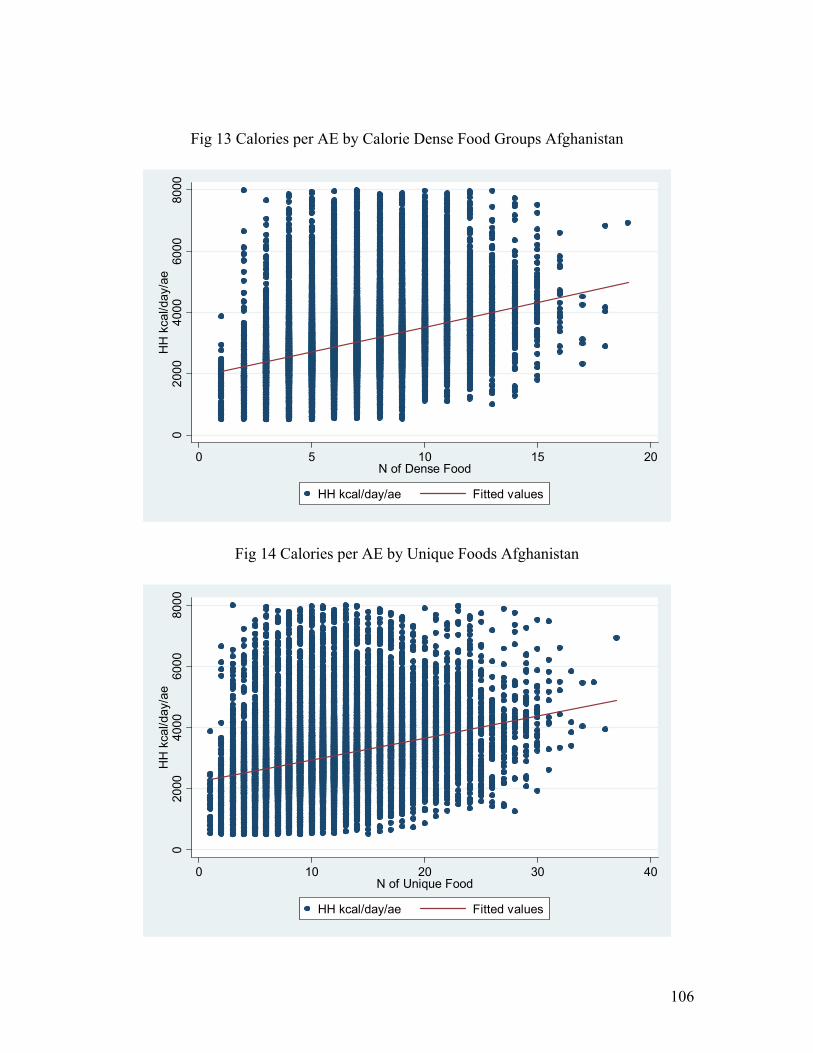
106
Fig 13 Calories per AE by Calorie Dense Food Groups Afghanistan
020
0040
0060
0080
00H
H k
cal/d
ay/a
e
0 5 10 15 20N of Dense Food
HH kcal/day/ae Fitted values
Fig 14 Calories per AE by Unique Foods Afghanistan
020
0040
0060
0080
00H
H k
cal/d
ay/a
e
0 10 20 30 40N of Unique Food
HH kcal/day/ae Fitted values
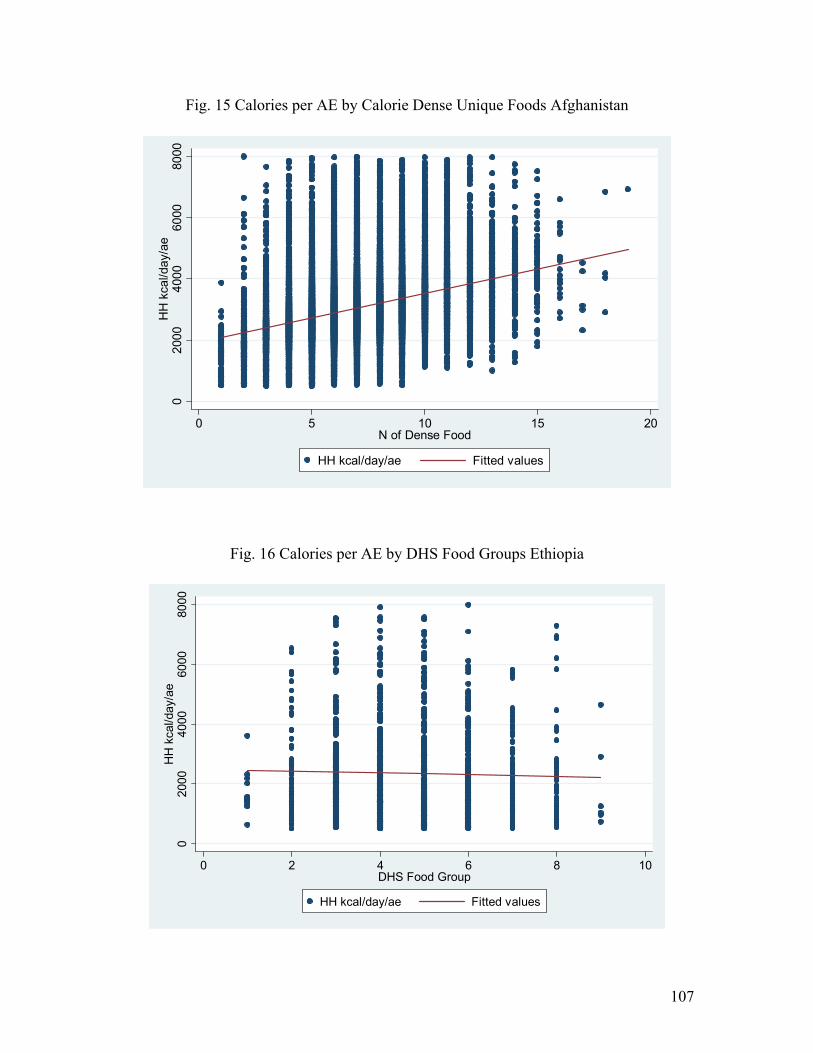
107
Fig. 15 Calories per AE by Calorie Dense Unique Foods Afghanistan
020
0040
0060
0080
00H
H k
cal/d
ay/a
e
0 5 10 15 20N of Dense Food
HH kcal/day/ae Fitted values
Fig. 16 Calories per AE by DHS Food Groups Ethiopia
020
0040
0060
0080
00H
H k
cal/d
ay/a
e
0 2 4 6 8 10DHS Food Group
HH kcal/day/ae Fitted values

108
Fig 17 Calories per AE by Nutrient Groups Ethiopia
020
0040
0060
0080
00H
H k
cal/d
ay/a
e
1 2 3 4 5Nutrition Group
HH kcal/day/ae Fitted values
Fig 18 Calories per AE by Calorie Dense Food Groups Ethiopia
020
0040
0060
0080
00H
H k
cal/d
ay/a
e
0 1 2 3 4 5Dense Nutrition Group
HH kcal/day/ae Fitted values

109
Fig 19 Calories per AE by Unique Foods Ethiopia
020
0040
0060
0080
00H
H k
cal/d
ay/a
e
0 5 10 15 20N of Unique Food
HH kcal/day/ae Fitted values
Fig 20 Calories per AGE by Calorie Dense Unique Foods Ethiopia
020
0040
0060
0080
00H
H k
cal/d
ay/a
e
0 2 4 6 8 10N of Dense Food
HH kcal/day/ae Fitted values
110
Appendix A: Summary of Inconsistencies detected in the Afghanistan National Risk and Vulnerability Assessment (2005) Data Set
The NRVA 2005 data from Afghanistan was the only data set available to Tufts that included
information for calculating caloric adequacy and frequency of food/food group consumption.
Both variables were needed for a validation of the WFP approach to classifying households based
on their dietary diversity as a proxy for caloric intake.
In the NRVA 2005 data set, dietary data were captured with an instrument that asked the person
in the household primarily responsible for food preparation to report the frequency, source, and
quantity of consumption of 64 different foods during the previous seven days. From the data on
quantity consumed of each food item, it was possible to calculate an estimate of household caloric
availability per capita using methods described in the body of the report, and these estimates were
used in many of the analyses comprising a portion of this report. The next step was to construct a
dietary diversity indicator using the WFP method, which involves a consideration of the number
of times a food/food group was consumed the previous week, for comparison to the household
caloric adequacy information. At this point, it became apparent that response options for the
frequency question were "1-7 days" - there did not seem to be an option for not consuming the
food at all (0 days). In checking to see how this issue may have influenced the data, we created a
variable for whether respondents reported eating more than 0 Kg of that item and cross-tabulated
it by the number of days that they reported consuming it. Ideally, we would not find anyone that
reported consuming an item on 1 or more days that also reported consuming 0 kg of that food
item. However, a sampling of food items showed that there were several households that
reported eating the item on at least one day but consuming 0 as the amount. For instance: Wheat:
524 hhs; Rice: 789 hhs; Beans: 1801 hhs; Chickpea: 1071 hhs; Egg: 656 hhs; Tomato: 632 hhs.
There were also instances where zero days of consumption were recorded alongside a report of a
non-zero quantity. These types of discrepancies were detected in nearly 50% of the sampled
households, where a discrepancy in a single food item marked a household as “inconsistent”. In
most cases where a household was ‘inconsistent’, there was not just a single discrepancy but
rather multiple inconsistencies. These inconsistencies were not found in reference to minor, less
important foods or foods like spices that were consumed in small quantities, they were also
detected in the data for consumption of major staples.
111
The next step in the diagnostic process was to assess whether these “funny” households, or those
households with inconsistencies, were randomly distributed throughout the sample. If they were,
then the plan was to omit these households from the sample and run the analyses for the report on
the remaining households. As such, households with and without inconsistencies were compared
according to several characteristics. The results showed that these two groups were statistically
different in terms of their mean household sizes, per capita food expenditure, and geographic
location. Based on these results, Tufts felt that these particular variables in the data set were not
reliable enough to use as the basis for assessing and validating the WFP method of classifying
households according to their dietary diversity.

112
References
Aiga, H. and A. Dhur. 2006. Measuring household food insecurity in emergencies:
WFP’s Household Food Consumption Approach. Rome. Mimeo.
Allen, L. 2006. Causes of nutrition-related public health problems of preschool children:
available diet. J Pediatr Gastroenterol Nutr. 43 (Suppl. 3): S8-12.
Azadbakht, L., P. Mirmiran and F. Azizi. 2005. Variety scores of food groups contribute
to the specific nutrient adequacy in Tehranian men. Europ. Jou. Clin.l Nutr. 59:
1233–40.
Behrman, J. and A. Deolalikar. Is Variety the Spice of Life? Implications for Calorie
Intake. 1989. Review of Economics and Statistics. :666-72.
Bernstein, M., M. Nelson, K. Tucker, J. Layne, E. Johnson, A. Nuernberger, C.
Castaneda, J. Judge, D. Buchner, S. Fiatarone. 2002. Home-Based Nutrition
Intervention to Increase Consumption of Fruits, Vegetables and Calcium-Rich
Foods in Community Dwelling Elders. Jou. Am. Dietetic Assoc. 102:1421-7.
Bondia-Pons, I., L. Serra-Majem, A. Castellote, and M. López-Sabater. 2007.
Compliance with the European and national nutritional objectives in a Mediterranean
population. Eur J Clin Nutr. doi:10.1038/sj.ejcn.1602662
Clausen T., K. Charlton, K. Gobotswang, and G. Holmboe-Ottesen. 2005. Predictors of
food variety and dietary diversity among older persons in Botswana. Nutrition.
21(1): 86-95.
Coates, J., A. Swindale and P. Bilinsky. 2006. Household Food Insecurity Access Scale
(HFIAS) for Measurement of Household Food Access: Indicator Guide (v. 2).
Washington, D.C.: Food and Nutrition Technical Assistance Project, Academy
for Educational Development.
Cordeiro, L. 2007. Household Food Security and the Nutritional Status of Rural
Tanzanian Adolescents. Doctoral Thesis. Friedman School of Nutrition Science
and Policy, Tufts University. Boston, USA.
Christiaensen, L. R. Boisvert and J. Hoddinott. 2000. Validating Operational Food
Insecurity Indicators against a Dynamic Benchmark. World Bank Policy Research
Working Paper No. 2471. Washington, D.C.: World Bank
Van Dam, R. 2005. New approaches to the study of dietary patterns. Brit. Jou. Nutr.
93 : 573-4.
Devaney, B. M. Crepinsek, K. Fortson, and L. Quay. 2007. Review of Dietary

113
Reference Intakes for Selected Nutrients Challenges and Implications for
Federal Food and Nutrition Policy. Contractor and Cooperator Report No. 28.
Washington, D.C.: United States Department of Agriculture.
Dhur, A. 2007. Strengthening Rapid Food and Nutrition Security Assessments. Draft
WFP/ODAN Guidance Note. Rome
DI (Development Initiatives). 2006. Global Humanitarian Assistance 2006.
Evercreech, UK.
Dixon, J., and d. Macarov (eds). 1998. Poverty. London, UK: Routledge.
Drescher L., S. Thiele and G. Mensink. 2007. A new index to measure healthy food
diversity better reflects a healthy diet than traditional measures. Jou. Nutr. 137
(3): 647-51.
FAO (Food and Agriculture Organization). 2005. Nutrition Indicators for Development
Reference Guide produced by B. Maire and F. Delpeuch. Rome.
FAO/WHO (Food and Agriculture Organization/World Health Organization). 1992.
Nutrition: The Global Challenge. Report for the International Conference on
Nutrition, December 5-11, Rome, Italy.
FHANIS/CSO (Food, Health and Nutrition Information System/Central Statistical
Office). 1998. FHANIS Urban Report: Monitoring of the Household Food
Security, Health, and Nutrition in Urban Areas. Lusaka, Zambia: Central
Statistical Office.
Getahun, H.., F. Lambein. M. Vanhoorne and P. Van der Stuft. 2003. Food-aid cereals
to reduce neurolathryism related to grass-pea preparations during famine.
Lancet. 362 (11): 1808-10.
Gibson, R., F. Yeudall, N. Drost, B.Mtitimuni and T. Cullinan. 2003. Animal Source
Foods to Improve Micronutrient Nutrition and Human Function in Developing
Countries Experiences of a Community-Based Dietary Intervention to Enhance
Micronutrient Adequacy of Diets Low in Animal Source Foods and High in
Phytate: A Case Study in Rural Malawian Children. J. Nutr. 133 (Suppl.):
3992S–9S.
Gittelsohn, J., S. Mookerji and G. Pelto. 1998. Operationalizing household food
security in rural Nepal. Food and Nutrition Bulletin. 19 (3): 210-22.
Hatløy, A., L. Torheim and A. Oshaug. 1998. Food variety--a good indicator of
nutritional adequacy of the diet? A case study from an urban area in Mali, West
Africa. Eur J Clin Nutr. 52 (12):891-8.

114
De Haen, H. 2002. Lessons Learned in Summary of Proceedings of the International
Scientific Symposium on Measurement and Assessment of Food Deprivation
and Undernutrition, June 26-28, 2002, Rome, Italy: Food and Agriculture
Organization of the United Nations, pp. 69-74.
Hoenicke, M., O. Ecker, M. Qaim and K. Weinberger. 2006. Vitamin A and iron
consumption and the role of indigenous vegetables: a household level analysis in
the Philippines. Discussion Paper No. 03/2006. Institute of Agricultural
Economics and Social Sciences in the Tropics and Subtropics. Stuttgart, Germany:
University of Hohenheim.
Hoffman, K., M. Schulze, A. Schienkiewitz, U. Noethlings and H. Boeing. 2004.
Application of a new statistical method to derive dietary patterns in nutritional
epidemiology. Am. Jou. Epidemiol. 159: 935-44.
Kant, A., A. Schatzkin, T. Harris, R. Ziegler and G. Block. 1993. Dietary diversity and
subsequent mortality in the First National Health and Nutrition Examination
Survey Epidemiologic Folly-Up Study. Am. Jou. Clin. Nutr. 57:434-40.
Kennedy, G., M. Pedro, C. Seghieri, G. Nantel and I. Brouwer. 2007. Dietary Diversity
Score Is a Useful Indicator of Micronutrient Intake in Non-Breast-Feeding
Filipino Children. Jou. Nutr. 137:472-77.
Kennedy G., O. Islam, P. Eyzaguirre and S. Kennedy. 2005. Field testing of plant
genetic diversity indicators for nutrition surveys: rice-based diet of rural
Bangladesh as a model. Jou Food Composition and Analysis. 8 (4): 255-268.
Kim, S., P. Haines, A. Siega-Riz and B. Popkin. 2003. The Diet Quality Index-International
(DQI-I) Provides an Effective Tool for Cross-National Comparison of Diet Quality as
Illustrated by China and the United States. J. Nutr. 133: 3476-84.
Lin C., S. Boslaugh, H. Ciliberto, K. Maleta, P. Ashorn, A.Briend, and M. Manary.
2007. A prospective assessment of food and nutrient intake in a population of
Malawian children at risk for kwashiorkor. Jou. Pediatr Gastroenterol Nutr.
44 (4): 487-93.
Maxwell, D., R. Caldwell and M. Langworthy. 2007. Comparing "Apples to Apples:" Are
Universal Measures of Household Food Security Achievable? Working Paper.
Feinstein International Center, Medford MA.
Menotti, A., G. Farchi, M. Massari, K. Freeman, and F. Seccareccia. 2004. An index to
measure the association between dietary patterns and coronary heart disease risk
factors: findings from two Italian studies. Preventive Medicine, 39 (4): 841-7.

115
Mirmiran, P., L. Azadbakht, and F. Azizi. 2006. Dietary Diversity within Food
Groups: An Indicator of Specific Nutrient Adequacy in Tehranian Women.
Jou American College Nutrition, 25 (4): 354-361
Mirmiran P., L. Azadbakht, A. Esmaillzadeh, and F. Azizi. 2004. Dietary diversity score
in adolescents - a good indicator of the nutritional adequacy of diets. Asia Pac Jou.
Clin Nutr. 13 (1):56-60.
Ndekha, M., D. Maker C. Hotz and M. Manary. 2006. The quality of the diet in
Malawian children with kwashiorkor and marasmus. Maternal and Child
Nutrition. 2 (2): 114-22.
Neuhouser, M., R. Patterson, I. King, N. Horner and J. Lampe. 2003. Selected
nutritional biomarkers predict diet quality. Public Health Nutrition. 6 (7): 703-9
Newby, P., F. Hu, E. Rimm, S. Smith-Warner, D. Feskanich, L. Sampson and W. Willett.
2003. Reproducibility and validity of the Diet Quality Index Revised as assessed
by use of a food-frequency questionnaire. Am. Jou. Clin. Nutr. 78 (5): 941-9
Newby, P. and K. Tucker 2004. Empirically derived eating patterns using factor or
cluster analysis: a review. Nutr Rev. 62 (5): 177-203.
Ogle, B., P. Hung, and H. Tuyet. 2001. Significance of wild vegetables in micronutrient
intakes of women in Vietnam: an analysis of food variety. Asia Pac J Clin Nutr.
10 (1):21–30.
Onyango, A. 2003. Dietary diversity, child nutreition and health in contemporary
African communities. Comp. Biochem. Physiol A Mol Integr Physiol. 136: 61-9.
Pathak P., U. Kapil, S. Kapoor, R. Saxena, A. Kumar, N. Gupta, S. Dwivedi, R. Singh and P.
Singh. 2004. Prevalence of multiple micronutrient deficiencies amongst
pregnant women in a rural area of Haryana. Indian J Pediatr. 71 (11):1007-14.
Patil, G. and C. Taillie. 1982. Diversity as a Concept and Its Measurement. Jou. Am.
Stats. Assoc. 77 (9): 548-61.
Pedro, R. L. Candelaria, F. Bacos, B. Ungson and E. Lanot. 1996. A simplified dietary
assessment to identify groups at-risk for dietary vitamin A deficiency. Asia
Pacific J Clin Nutr. 5 (3): 164-9.
Persson, V., A. Winkvist, T. Ninuk, S. Hartini, T. Greiner, M. Hakim and H. Stenlund.
2001. Variability in Nutrient Intakes among Pregnant Women in
Indonesia:Implications for the Design of Epidemiological Studies Using the 24-h
Recall Method. Jou. Nutr. 131: 325-30
Ponce, X., E. Ramirez and H. Delisle. 2006. A More Diversified Diet among Mexican

116
Men May Also Be More Atherogenic. J. Nutr. 136:2921-7.
Proudhon, C. 2002. Assessment and Treatment of Malnutrition in Emergency
Situations. Paris, France: Action Contre la Faim.
Rose, D. and D. Tschirley. 2000. A Simplified Method for Assessing Dietary Adequacy
in Mozambique. Ministry of Agriculture, Directorate of Economics. Research
Paper Series No. 36. Republic of Mozambique. Mimeo.
Savy, M., Y. Martin-Prével, P. Traissac, S. Eymard-Duvernay and F. Delpeuch. 2006.
Dietary Diversity Scores and Nutritional Status of Women Change during the
Seasonal Food Shortage in Rural Burkina Faso. Jou. Nutr. 136: 2625-32.
SCF (Save the Children). 2004. Emergency Nutrition Assessment. London, UK.
Scheafer, D. J. Augusin. M. Schaefer, H. Rasmussen, J. Ordovas, G. Dallal and J.
Dwyer. 2000. Lack of efficacy of a food-frequency questionnaire in assessing
dietary macronutrient intakes in subjects consuming diets of known composition.
Am Jou. Clin. Nutr. 71 (3): 746-51.
Schneider, S. And X. Hebuterne. 2000. Use of Nutritional Scores to Predict Clinical
Outcomes in Chronic Diseases. Nutr. Reviews. 58 (2): 31-8.
Schulze M., and K. Hoffmann. 2007. Methodological approaches to study dietary
patterns in relation to risk of coronary heart disease and stroke. British Jou.
Nutrition 95 (5): 860-9.
Serra-Majem, L. et. al. 2003. Comparative analysis of nutrition data from national,
household, and individual levels. Jou. Epi. and Community Health 57:74-80.
Seymour, J., E. Calle, E. Flagg, R. Coates, E. Ford and M. Thun. 2003. Diet Quality
Index as a Predictor of Short-term Mortality. Am J Epidemiol 157:980-8.
Slattery M., T. Berry, J. Potter and B. Caan. 1997. Diet diversity, diet composition, and
risk of colon cancer. Cancer Causes Control. 8 (6): 872-82.
Steyn N., J. Nel, G. Nantel, G. Kennedy and D. Labadarios. 2006. Food variety and
dietary diversity scores in children: are they good indicators of dietary
adequacy? Public Health Nutrition: 9(5): 644–50.
Sullivan, J., N. MacDonald, D. Maker, C. Hotz, and M. Manary. 2006. The quality of
the diet in Malawian children with kwashiorkor and marasmus. Maternal &
Child Nutr. 2 (2): 114–22.
Swindale, A., Ohri-Vachaspati, P. 2005. Measuring Household Food Consumption: A Technical
Guide. Washington DC: Academy for Educational Development, Food and Nutrition
Technical Assistance.

117
Tarini, A., S. Bakari, and H. Delisle. 1999. The overall nutritional quality of the diet is
reflected in the growth of Nigerian children. Sante. 9(1): 23-31.
Torheim, L., I. Barikmo, C. Parr, A. Hatløy, F. Ouattara and A. Oshaug. 2003. Validation
of food variety as an indicator of diet quality assessed with a food frequency
questionnaire for Western Mali. European Jou Clin Nutr. 57 (10): 1283-91.
Tur, J., D. Romaguera, and A. Pons. 2005. The Diet Quality Index-International (DQI-I):
is it a useful tool to evaluate the quality of the Mediterranean diet? Brit Jou Nutr.
93 (3):369-76.
UNHCR (United Nations High Commissioner for Refugees). 1982. Handbook for
Emergencies. Geneva, Switzerland.
Walker, P. and K. Pepper. 2007. Follow the Money: A review and analysis of the state
of humanitarian funding. Draft briefing paper for meeting on progress in good
humanitarian donorship. Feinstein International Center, Friedman School, Tufts
University.
Webb, P., J. Coates, E. Frongillo, B. Rogers, A. Swindale and P. Bilinsky. 2006.
Measuring Household Food Insecurity: Why It’s So Important and Yet So
Difficult to Do. Journal of Nutrition. 136: S1404-08.
WFP (World Food Programme of the United Nations). 2005. Emergency Food
Security Assesssment Handbook. Rome, Italy.
WHO (World Health Organization). 1966. The Assessment of the Nutrition Status of
the Community (with special reference to field surveys in developing regions of
the world). Principal author, D. Jelliffe. Geneva, Switzerland.
1999. Rapid Health Assessment Protocols for Emergencies. Geneva, Switzerland.
2000. The management of nutrition in major emergencies. Geneva: WHO,
International Federation of the Red Cross and Red Crescent Societies, World Food
Programme and the United Nations High Commissioner for Refugees.
WHO/FAO (World Health Organization/ Food and Agriculture Organization). 2003.
Diet, nutrition and the prevention of chronic diseases. Report of a joint WHO/FAO
expert consultation, Geneva, 28 January -- 1 February 2002. WHO technical Report
Series No. 916. Geneva, Switzerland.