diana michelle davila ronquillo ecological assessment of
TRANSCRIPT
GOVERNMENT OF THE RUSSIAN FEDERATION
FEDERAL BUDGETARY EDUCATIONAL INSTITUTION OF HIGHER
PROFESSIONAL EDUCATION
"SAINT PETERSBURG UNIVERSITY"
(SPBU)
Department of Geoecology and Nature Management
DIANA MICHELLE DAVILA RONQUILLO
Ecological Assessment of Ecuadorian Forest Ecosystems Using Remote Sensing Data
Final dissertation
Educational program 05.03.06 “Ecology and Nature Management”
Subprogram “Natural management conservation”
Scientific adviser:
Associate Professor,
Department of Geoecology and Environmental Management
PhD in Agricultural Sciences
Afonin Alexander Nikolaevich
Reviewer:
Ministry of the Environment
National Forest Directorate
Forestry engineer
José Moisés Cueva Jiménez
Saint Petersburg
2020

ПРАВИТЕЛЬСТВО РОССИЙСКОЙ ФЕДЕРАЦИИ
ФЕДЕРАЛЬНОЕ ГОСУДАРСТВЕННОЕ БЮДЖЕТНОЕ ОБРАЗОВАТЕЛЬНОЕ
УЧРЕЖДЕНИЕ ВЫСШЕГО ПРОФЕССИОНАЛЬНОГО ОБРАЗОВАНИЯ
«САНКТ-ПЕТЕРБУРГСКИЙ ГОСУДАРСТВЕННЫЙ УНИВЕРСИТЕТ»
(СПбГУ)
Кафедра геоэкологии и природопользования
Диана Мишель Давила Ронкильо
Оценка экологического состояния лесных экосистем Эквадоре с
использованием данных дистанционного зондирования
Выпускная квалификационная работа
По направлению 05.03.06 «Экология и природопользование»
“Рациональное природопользование”
Научный руководитель:
Доцент,
Кафедра геоэкологии и природопользования
Кандидат сельскохозяйственных наук
Афонин Александр Николаевич
рецензент:
Министерство окружающей среды
Национальная лесная дирекция
Лесной инженер
Хосе Моисес Куева Хименес
Санкт-Петербург
2020
1
Contents Introduction ......................................................................................................................... 4
Objectives ........................................................................................................................ 5
Chapter 1 ................................................................................................................................ 6
1.1. PHYSICAL GEOGRAPHICAL CHARACTERISTICS OF THE REPUBLIC OF
ECUADOR ......................................................................................................................... 6
1.1.1. Coastline or Coast Region ................................................................................ 6
1.1.2. Mountains or Sierra Region .............................................................................. 7
1.1.3. Amazon region ................................................................................................. 7
1.1.4. Insular Region or Galapagos ............................................................................ 7
1.2. BIOPHYSICAL COMPONENT OF THE PROVINCE OF ORELLANA ........... 8
1.2.1. Relief ................................................................................................................ 8
1.2.2. Climate ............................................................................................................. 9
1.2.3. Vegetation Cover ............................................................................................ 11
1.2.4. Ecosystems of Orellana province ................................................................... 14
1.2.5. Forest resources .............................................................................................. 18
Chapter 2: MATERIALS AND METHODS ....................................................................... 25
2.1. MATERIALS ............................................................................................................. 25
2.2. METHODS ................................................................................................................ 27
2.2.1. Remote sensing for analysis of Land-Use and Land-Cover dynamics ............... 27
2.2.2. Normalized Difference Vegetation Index (NDVI) .............................................. 31
2.2.3. Maximum Likelihood classifier (MAXLIKE) .................................................... 34
2.2.4. Land Change Modeler ......................................................................................... 36
Chapter 3: Results ................................................................................................................. 38
Use of remote sensing data for monitoring the condition of the forest of Ecuador ............. 38
3.1. Identification of anthropogenic disturbance in the forest ecosystems ................... 38
3.2. Matrix analysis of land coverage dynamics ........................................................... 41
3.3. Land use change with Maximum likelihood method ............................................. 44
3.4. Monitoring of forest resources using Land Change Modeler ................................ 47
3.5. Land change predictions......................................................................................... 50
3.6. Ecological impacts of land change use .................................................................. 52
3.7. Types of anthropogenic alterations in the Amazon territory.................................. 54
Conclusion ........................................................................................................................ 60

2
Bibliography ..................................................................................................................... 63
Appendix ................................................................................................................................. i
Appendix 1: Map composition NDVI 1996 ........................................................................ i
Appendix 2: Map composition NDVI 1996 ........................................................................ i
Appendix 3: Map composition NDVI 2013 ....................................................................... ii
Appendix 4: Map composition NDVI 2018 ....................................................................... ii
Appendix 5: Map composition - land coverage dynamics 1996-2002 .............................. iii
Appendix 6: Map composition - land coverage dynamics 2002-2013 .............................. iii
Appendix 7: Map composition - land coverage dynamics 2013-2018 .............................. iv
Appendix 8: Maximum likelihood classification 1996 ...................................................... iv
Appendix 9: Maximum likelihood classification 2002 ....................................................... v
Appendix 10: Maximum likelihood classification 2013 ..................................................... v
Appendix 11: Maximum likelihood classification 2018 .................................................... vi
Appendix 12: Change from 1996 to 2018 ......................................................................... vi
Appendix 12: Projected Land Cover 2080 and soft prediction 2060 ............................... vii
Appendix 13: Land Change Modeler MLP Model Results ............................................. viii
Figure 1 Location of the Republic of Ecuador ....................................................................... 6
Figure 2 Malvaceae: Ceiba pentandra ................................................................................ 15
Figure 3 Couratari oligantha naturalista by Byron Medina-Torres (2010) ........................ 16
Figure 4 Mauritia flexuosa, Mittermeier (2007) .................................................................. 17
Figure 5 Orellana province location in Ecuador ................................................................. 25
Figure 6 Platform USGS Earth Explorer ............................................................................. 26
Figure 7 idrisi selva .............................................................................................................. 26
Figure 8 Common Landsat Band RGB composites by USGS .............................................. 29
Figure 9 False color composite – pixel (Congalton & Dodge, 2013) .................................. 30
Figure 10 Red band and NDVI reclassification ................................................................... 32
Figure 11 Overlay in idrisi ................................................................................................... 33
Figure 12 True color visualization - RGB 543 - RGB 764 .................................................. 35
Figure 13 Transition probabilities Makrov ........................................................................... 36
Figure 14 Variables: a) distance from roads b) distance from altered vegetation ................ 37
Figure 15 Disturbance in vegetation cover: a) True color visualization b) Disturbed area
visualization .......................................................................................................................... 39
Figure 16 Dynamic of land use from 1996 to 2018 .............................................................. 40
Figure 17 Matrix analysis of land coverage dynamics 2013-2018 ...................................... 42
Figure 18 Historical Land coverage dynamics .................................................................... 44
Figure 19 Land cover MAKLIKE 2018 ................................................................................ 45

3
Figure 20 Land cover MAKLIKE 1996 ................................................................................ 46
Figure 21 Land change 1996-2018 ...................................................................................... 47
Figure 22 Transition from Forest to Anthropogenic disturbance ........................................ 48
Figure 23 Transition of Land use ......................................................................................... 49
Figure 24 Projected Land Cover 2060 ................................................................................. 50
Figure 25 Prediction of forest to anthropogenic disturbance .............................................. 51
Figure 26 Timber extraction in the tropical rain forest ....................................................... 55
Figure 27 Roads ................................................................................................................... 56
Figure 28 Human settlements ............................................................................................... 56
Figure 29 Agriculture expansion .......................................................................................... 57
Figure 30 Oil extraction ....................................................................................................... 58
Table 1 Average temperature in 2000-2013 ......................................................................... 10
Table 2 Vegetation cover of the Province of Orellana ......................................................... 13
Table 3 Ecosystems of the Province of Orellana .................................................................. 17
Table 4 Main species authorized for logging at national level during 2010 ....................... 24
Table 5 Area (ha) from 1996 to 2018 ................................................................................... 40
Table 6 Matrix analysis of land coverage 2013 to 2018 ...................................................... 41
Table 7 Historical Land coverage dynamics 1996-2018...................................................... 43
Table 8 Land cover 1996-2018 ............................................................................................. 46
Table 9 Land cover transitions (ha) ..................................................................................... 48
Table 10 Land cover predictions .......................................................................................... 51
Table 11 Emissions from gross deforestation of native forest (tCO2 eq year-1) for the
periods 1990-2000, 2000-2008............................................................................................. 53

4
Introduction
The destruction of Amazon forests is a recurring topic in Ecuador, the pressure
exerted on these forests by human activity is continuous and has increased in recent years
despite conservation policies. Tropical forests fulfill ecological functions of substantial
importance for the planet, such as carbon sequestration, habitat of endemic plants and
animals, biochemical cycles and it is also home to many ancient cultures. The promise of
economic development by extraction of raw material has led to steady increase of human
presence in this fragile ecosystem. For this reason, the destruction of tropical forests is
strongly linked to economic and social factors. Ecuadorian forests have undergone profound
transformations, since the 1970s, approximately 30% of the Amazon forests have been
deforested or transformed into secondary forests, the transition of forest to altered vegetation
has endanger thousands of species and has generated social conflicts with the Huaroni and
Cofanes ethnic groups.
The use of remote detection tools has facilitated the study of vegetation cover,
especially in places that are not very accessible, such as the Amazon. These data allow an
analysis of forests as a function of time, to understand their dynamics and how human activity
affects tropical rain forests, allows the evaluation of conservation policies and to have a
deeper understanding between the factors and their role in the destruction of rain forest and
model future state of the evergreen rain forest.
The deforestation of the Ecuadorian rain forest in a current topic and great
importance, in 2007 an initiative Yasuni ITT was created that gave priority to ecological
values over oil exploitation. This initiative was revolutionary because the intangible values
of forest systems were more appreciated that the extraction of 1,672 million barrels of oil,
this projects was carried out until 2013 when the president of Ecuador Rafael Correa put an
end to it, since then, the concern of the state of all amazon forest has risen and the pressure
of the population regarding the conservation of forest ecosystems has been fortified. The area
of study of this investigation is next to the protected area Yasuni, where in 2019 the

5
exploitation of oil has begun. The study of this area is in a way a prediction of the future of
this protected area and also its proximity means that the same factors such as colonization
and agricultural expansion will endanger the pristine forest ecosystems.
Objectives
Assess the state of the Ecuadorian tropical forests using remote sensing data, taking into
account the main driver of land use change and prognose the future scenarios of human
disturbance in the Orellana province.
• Establish the dynamics of tropical forests as a function of time in the northern
Ecuadorian Amazon in the province of Orellana.
• Use remote sensors to establish the historical change of tropical forests in the
Amazon.
• Create models that describe the future transition of land use in 2060 and 2080
• Analyze the main factors that put tropical forests at risk.
• Establish the anthropogenic impact in this area, calculating the deforested area
between 1996, 2002, 2013 and 2018.

6
Chapter 1
1.1. PHYSICAL GEOGRAPHICAL CHARACTERISTICS OF THE
REPUBLIC OF ECUADOR
Ecuador is located northwest of South America, between the parallels 01°30' N and 03° 23.5'
S and the meridians 75°12' W and 81° 00' W. The Ecuadorian territory is crossed by the
equinoctial line 22 km away from its capital Quito. Ecuador is divided into four geographical
regions: Costa, Sierra, Amazonia and the Galapagos Islands. The territory of Ecuador is
283,561 km². Ecuador borders on the north with Colombia, on the south and east with Peru
and on the west with the Pacific Ocean.
Figure 1 Location of the Republic of Ecuador
1.1.1. Coastline or Coast Region
It extends from the coast washed by the Pacific Ocean to the western mountain range.
It is a region made up of large plains very suitable for agriculture (fertile soils due to the
presence of organic materials), waterlogging lands, saltpeters and mangroves. It is a low

7
region that presents several elevations, among the main ones are: the Chongón - Colonche
mountain range, the Paján and Puca mountains, the Balzar mountain range, the Cuaque,
Cojimíes and Atacames hills. (INOCAR, 2012)
1.1.2. Mountains or Sierra Region
This region is characterized by the presence of high elevations and its great volcanic
activity, the average height is 4000 meters above sea level, it extends between the Western
and Central mountain ranges, the union of these two mountain ranges forms valleys that are
highly populated. The average height of the inter-Andean valleys is 2,500 m.a.s.l. with an
average temperature of 14 ° C.
1.1.3. Amazon region
It is the region extends from the east of the Central mountain range to the limits with
Peru. The Amazon region is divided by the Eastern Cordillera in the High East and Lower
East. The highest population density is the Upper East area because it has a mild climate,
while in the Lower East area the virgin forest predominates with abundant forests and tangled
jungles, marshlands are also found, especially near the large rivers that go through it.
(INOCAR, 2012)
1.1.4. Insular Region or Galapagos
The insular region or Galapagos is formed by the Galapagos archipelago,
approximately 600 miles off the coast of mainland Ecuador. The archipelago is made up of
a series of 13 large islands, and the rest are islets and rocks. The populated islands are five:
Santa Cruz, San Cristóbal, Isabela, Baltra and Floreana. These islands are of volcanic origin
and the soils are characterized by being sulfur calcareous. Due to the evolutionary

8
characteristics of the flora and fauna of the region, Galapagos has been declared by the United
Nations as “Natural Patrimony of Humanity” (INOCAR, 2012)
1.2. BIOPHYSICAL COMPONENT OF THE PROVINCE OF ORELLANA
The research is conducted in the Ecuadorian Amazon, specifically in the province of
Orellana, located northeast of the country, whose capital is the city of Coca. The area of the
province of Orellana is 21,730.05 km2, and is administratively divided into 4 cantons and 33
localities. (GADMFO, 2015)
1.2.1. Relief
The geomorphic characteristics of the territory are determined by two large structures:
the eastern mountain range of the Andes and the plain of the Amazon basin, the area of
intersection between these two structures generates a specific geomorphic landscape, called
the sub-Andean zone. The height varies from 168 to 3,800 meters above sea level,
corresponding to the Sumaco volcano. The landscapes gradually change from the Andean
slopes to the river swampy plains. A large part of the province's territory is located within
the Amazon plain (38.67%). The abundant water activity along the rivers such as Coca, Napo,
Tiputini, Cononaco and others, have generated strong processes of erosion, dragging and
sedimentation of materials along the river plain, therefore there are sedimentary beaches,
meanders, plateaus of erosion and other formations of alluvial origin.
The relief of the external slope of the Cordillera Oriental is considered a larger
landscape and it is characterized by an altitude range up to 2,700 meters. This area has
mountainous structures as a barrier with northwest-southeast direction, steep slopes,
mountainous reliefs with sharp peaks and large slopes 70%, which decreases in height as it
moves towards the sub-Andean area. This landscape has volcanic, lactic and pyroclastic
structures, product of the eruptions of the Sumaco and Reventador volcanoes, the relief is

9
very irregular with slopes bigger than 50%. The parental material in this area is of volcanic
origin.
The sub-Andean landscape has an altitude range from 500 to 2,500 meters, it is
characterized by a structural relief, product of the strong tectonic activity, in which structures
such as mesas, hills, slopes and foothills stand out. The sub-Andean slope with relief of mesas
presents flat areas with slopes of 15 to 12%, although mesas with slopes of 20% can be
observed. The lithologies of the site are represented by sedimentary rocks, covered by ashes.
These areas present erosion processes. The slope relief is characterized by the presence of
inclined and slightly inclined structures with slopes of 12 to 50%. In this great landscape
there are formations of low hills with a height of 5 to 15 m and high with 25 to 50 m.
The area of the Amazon basin is characterized by vast swampy plains, as well as hills,
mesas and landscapes of river origin. The plains are classified according to their level of
spreading geological materials, so there are spreading plains and high deposit of sand and
volcanic conglomerates, it is located at the intersection of the sub-Andean zone and the
Amazon River basin. The plains of medium and low recreation are characterized by
development on materials of alluvial origin such as gravels and sands, their relief is flat with
slight undulations. They are located along the Napo River and at the intersection between
this and the Tiputini River, the strong water influence is observed in the presence of
meanders, depressed areas and small dikes.
1.2.2. Climate
The geographical position of Ecuador, together with a series of factors such as: the
presence of perpendicular of the Andes mountain range, the cold Humboldt and hot currents
of Panama, generate a large number of sub climates and microclimates. Ecuador is located
in the center of the Intertropical Convergence Zone that determines the presence of air masses
from the Pacific Ocean and those that come from the Amazon. Ecuador has two important

10
climatic variations (seasons): wet and dry. The wet period extends from December to May
and the dry period in the remaining months.
The Amazonian climate is described in a generalized way, especially the plains of the
Amazon basin, which are characterized by high temperatures, not very variable, with
humidity of the air near the saturation point and abundant rainfall, however, there is
variability of conditions in the area, especially for the interaction of the eastern mountain
range of the Andes. The average temperature of the Ecuadorian Amazon is between 24 to 26
° C and can reach a maximum temperature of 40 ° C. The region presents abundant torrential
rains with precipitations that can exceed 5,000 mm per year.
The province of Orellana has a warm tropical climate, but it has a variety of
microclimates especially in the western area, influenced by the Andes mountain range,
according to data reconnected by INAMHI in the period 2000-2013, the average temperature
is of 26.14 ° C, while the minimum temperature in July is 24.3 ° C. As for rainfall in the
province of Orellana, they range between 2,086.70 mm/year and 3,828.99 mm/year. The
relative humidity is 81% while the evapotranspiration power has a maximum annual value
of 1,217 mm/year.
Table 1 Average temperature in 2000-2013
Temperature
°C
January February March April May June
Maximum 29,5 27,4 26,8 27,2 26,5 26,4
Minimum 25,3 24,5 25,1 25,3 24,8 24,9
Temperature
°C
July August September October November December
Maximum 26,1 26,9 27,1 28,1 27,7 27,3
Minimum 24,3 24,6 25,1 25,9 25,7 24,9
Source: INAMHI, 2015

11
One of the main factors that define the development of the vegetation cover of a
region is the temperature. In the province of Orellana there is an irregular relief with different
altitudes, it is not difficult to understand the relationship between temperature, altitude and
the specific development of ecosystems, this differentiation of ecosystems by climatic factors
is defined as “climatic floors”. The behavior of the temperature responds inversely with the
altitude, in the zones located in the eastern part of the Andes mountain range low
temperatures are characterized that increase as altitude decreases until reaching relatively
constant high temperatures in the Amazon plain. In the Province of Orellana, four types of
bioclimatic floors are distinguished: montane, low montane, piemontane and lowlands.
1.2.3. Vegetation Cover
Due to its geographical location, relief, climate and other factors Ecuador is a
megadiverse country, according to data from the Ministry of Environment (MAE), there are
91 ecosystems, of which 65 are wooded, 14 herbaceous and 12 shrubs; these cover an area
of 15,333,562 hectares, which is equivalent to 59.8% of the national territory and reflects the
great floristic diversity that characterizes of the country. Of the 91 ecosystems, 24 are found
on the Coast, 45 in the Andes and 22 in the Amazon. (Ministerio del Ambiente del Ecuador,
2013)
Historically, the humid tropical forests of the Amazon and the Ecuadorian coast
occupied more than 60% of the continental territory, however, the rapid human expansion in
the country has endangered several ecosystems such as inter-Andean vegetation with
transformations of up to 90%, the mangroves with 40% and the humid forests of the coast
with a progressive transformation of almost 70%, the main cause of this is agricultural
expansion, livestock and aquaculture.
In 2014, it was established that the native forests cover 12'753 387 hectares, of which
74% are in the Amazon region, the remaining 26% is distributed in the Costa region with

12
2'015.234 hectares and in the Sierra region with 1´ 331,566 hectares. Forest resources are of
great importance for the quality of life of the Ecuadorian population, especially for the
indigenous population, since they represent cultural, spiritual and economic values.
Approximately 47% of native forests are found in indigenous territory and are especially
concentrated in the Amazon of the country.
Ecuador is a megadiverse country, it has about 17,300 species of vascular plants of
which 27% are endemic, 1659 species of birds, 416 mammals, 558 amphibians, 450 reptiles
and 951 freshwater fish (Cuesta, et al., 2017), therefore it is not surprising to understand that
the destruction of forests puts the conservation of national flora and fauna at risk, since 1990
the country has seen a decrease of 14% in forests, with a range of deforestation during 2008-
2014 of 47 497 hectares per year.
The vegetation cover of the Province of Orellana is divided into natural vegetation
and agricultural areas, within the native vegetation are stable to native forests, intervened
forests, shrubby and herbaceous vegetation, as well as to swampy areas. Agricultural areas
represent perennial crops, agroforestry, planted pastures and others. Natural and intervened
forests correspond to 76.55% of the area of the province, while agricultural and urban areas
represent 9.45% and 0.05% respectively. The main threats of the native forests of the area
are the agricultural transformation of African palm, grassland and forest fragmentation by
logging.
In the historical context the Province of Orellana in 1990 native forest represented
1'695 735.74 hectares, by the end of 2002 the natural forest decreased by 3.32%, that is 72
172.44 hectares. This decrease is mainly attributed to the increase in agricultural activities,
with the transformation of forests into pastures and coffee, corn, cocoa and etc. In 2002 there
was an increase in cultivated grassland of 6.64% with respect to 1990 (145 047.84 ha) and
grassland by degradation in 1.24% (26 864.55). During the period 2002-2013 there was an
growth in the natural forest from 74.72% in 2002 to 86.19%, which is equivalent to 249

13
374.01 hectares, this is mainly due to the reduction of agricultural areas in a 4.43%, in
addition to a change in the productive activities of the area, during this period there was an
increase in oil activities.
Table 2 Vegetation cover of the Province of Orellana
Level I Level II Level III Area (ha) Percentage
Agricultural
areas
Agroforestry Agroforestry 38.981,19 1,81%
Perennial
crops Oil palm 11.685,23 0,54%
Agricultural
Mosaic Agricultural Mosaic 61.366,30 2,85%
Planted
grasses Planted grasses 40.222,53 1,87%
Crop rotation Crop rotation 51.565,05 2,39%
TOTAL 203.820,31 9,45%
Forest
Native Forest
Flooded forests 82.703,04 3,84%
Non-flooded forest 1´360.095,36 63,08%
Transition forests 206,52 0,01%
Intervened
forest
Native forest moderately
intervened 93.569,90 4,34%
Native forest heavily
intervened 87.282,65 4,05%
Secondary native forest 16.904,39 0,78%
Secondary forest formed
by anthropic causes 9.599,19 0,45%
Forest plantation 293,67 0,01%
TOTAL 1´650.654,73 76,55%
Wetlands
Water bodies Water bodies 43.724,12 2,03%
Lacustrine
grasslands
Lacustrine lowland
grassland 3.699,67 0,17%
Swamps Moretal1 Swamps 232.177,30 10,77%
TOTAL 279.601,09 12,97%
Shrub and
herbaceous
vegetation
Shrub
vegetation Riparian vegetation 10.374,06 0,48%
Herbaceous
vegetation
High Andean herbaceous
vegetation 120,56 0,01%
1 Moretes: Coverage dominated by the Maurutia flexusa palm, which inhabits relatively flat and swampy
areas. (GADMFO, 2015)

14
Pioneer herbaceous
vegetation 4.350,97 0,20%
TOTAL 14.845,59 0,69%
Other areas
Sand Sand 2.586,97 0,12%
Bare soil Bare soil 3.684,31 0,17%
Urban areas Urban areas 1.074,00 0,05%
TOTAL 7.345,28 0,34
PROVINCIAL TOTAL 2’156.266.98 100.00%
Source: Plan de Desarrollo y Ordenamiento Territorial de la Provincia de Orellana 2015-
2019
1.2.4. Ecosystems of Orellana province
The province of Orellana for be located in the transition area between Andes mountain
range and the Amazon plain and several additional factors (climate, weather soil, water and
biochemical cycles), give this territory a variety of ecosystems with high biodiversity,
according to the Ministry of Environment In the province of Orellana, 14 of the 22
Amazonian ecosystems are identified. A big portion of this ecosystems are in danger of
disappear thanks to land change use.
The most representative ecosystem is the Evergreen lowland forest of the Napo-
Curaray sector that occupies 57.40% of the province’s area, this is a tropical non-flood
ecosystem, it is characterized by a relief with low hills, terraces with flat surfaces and plains
of sedimentary origin. The height is between 150 and 400 meters above sea level. The soils
are predominantly loamy-clayey and acidic to sand-clayey, their fertility decreases as they
move away from the Andes mountain range. In the western zone of the Napo basin, in the
northwestern portion of the Yasuni National Park, and to the southwest in the upper and
middle basins of the Curaray and Pastaza there are soils with a higher concentration of
nutrients, since these soils originated in the floods volcanoclastic Andean.
The predominant bioclimate of this ecosystem is wet rainwater infra-tropical and
lower thermo-tropical climate. This ecosystem is characterized by the presence of forests of

15
different species composition, since the evergreen forest has the highest floristic diversity in
the Amazon. Forested species reach very tall and dense canopies between 30-35 meters high
with emerging trees up to 45-50 meters. In this region are the families: Arecaceae, Fabaceae
s.l., Moraceae, Rubiaceae, Sapotaceae, Melastomataceae which are the most abundant;
while the most diverse are Fabaceae S.L., Lauraceae, Myrtaceae, Rubiaceae,
Melastomataceae, Sapotaceae. Among the richest species groups are the genera Inga,
Ocotea, Pouteria, Virola, Eugenia and Calyptranthes.
Figure 2 Malvaceae: Ceiba pentandra
The second ecosystem more representative is Evergreen lowland forest of Aguarico-
Putumayo-Caquetá sector with 10,49%, it is characterized by the presence of multi-stratified
high forest, with closed canopy between 25 to 35 m and emerging trees of 40 m or more, the
trees present diameters in the range of 0,8 to 1,2 meters. The floristic composition varies
according to the lithology of the territory, in sandy areas there are trees of smaller sizes, with
varying diameters between 20 cm. The fertility of the soils varies, with fertile soils found in
the regions near the Andes mountain range, while increasing the acidity of the soils as they
move towards the Amazonian plain. Geomorphologically in this area there are hills and
terraces with heights that vary between 20 to 40 meters. This differentiation in the flat relief
of the area generates changes in the floristic structure of the area, although the lithology also
influences the differentiation of species such as the abundance of the Burseraceae,
Lecythidaceae and Myristicaceae families that make a difference with the soil forests most
fertile located in the Yasuni National Park and near the foothills of the Andes. Between the
Aguarico and Putumayo rivers, where low-altitude terraces are formed, have been found only
in this region floristic genus such as Caraipa, Sterigmapetalum, Chaunochiton,

16
Neoptychocarpus, Macoubea, Podocalyx, Adiscanthus, Pogonophora, Anthrocaryum,
Bothryarrena, Clathrotropisca, Neocalytroia, and Neocalycax.
Figure 3 Couratari oligantha naturalista by Byron Medina-Torres (2010)
The Flooded palm forest of the Amazon floodplain is characterized by flooded
hydromorphic terrain, has slightly depressed and swampy plains. The accumulation of water
in these ecosystems is generated by the runoff from the rains of the nearby lands, the water
drainage and filtration system of the black water of the mainland rivers. The soils are mainly
silty-clayey, with abundance of humus. The dominant species is Mauritia flexuosa, with a
density between 100 and 500 individuals / ha. The structure of the palm trees is made up of
stipe stipes and glasses between 25 and 30 meters high, with emergent ones from 35 to 40
meters high, generally 30 to 50 cm in diameter, in addition to modified or pneumophores
reactors with negative geotropism. (Ministerio del Ambiente del Ecuador, 2013) There are
between three to four strata with hydrophilic vegetation, in the herbaceous stratum there are
marantáceas, cyclanthaceas, zingiberaceas and ferns. Due to the characteristics of water
saturation, the presence of trees is almost nil, although there are some adaptations of trees in
these ecosystems. This ecosystem covers about 8,15% of the territory.

17
Figure 4 Mauritia flexuosa, Mittermeier (2007)
Unfortunately, 10.29% of the ecosystems in the province have been intervened. The
intervened forest is one in which the anthropogenic activity has proceeded to remove
vegetation cover, thus extending the agricultural frontier.
Table 3 Ecosystems of the Province of Orellana
N° ECOSYSTEMS EXTENSION
(HA) %
1 Evergreen lowland forest of the Napo-Curaray sector 1 244 244 57,40
2 Evergreen lowland forest of the Aguarico-Putumayo-
Caquetá sector 227 474 10,49
3 Intervened forest 228 335 10,29
4 Forest flooded with palms of the Amazon floodplain 176 616 8,15
5 Flood forest of the floodplain of the rivers of Amazonian
origin 115 426 5,32
6 Flooded forest of the floodplain of the rivers of Andean
origin and Amazonian mountain ranges 27 326 1,26
7 Evergreen low mountain forest in the north-center of the
eastern Andes 73 112 3,37
8 Water 32 147 1,48
9 Flooded forest of the Amazon floodplain 28 900 1,33
10 Others 6 599 0,30
11 Grassland flooded lake-riparian of the Amazon
floodplain 5 408 0,25
12 Piedmont Galeras evergreen forest 5 162 0,24
13 Evergreen low montane forest of Galeras 1 127 0,05
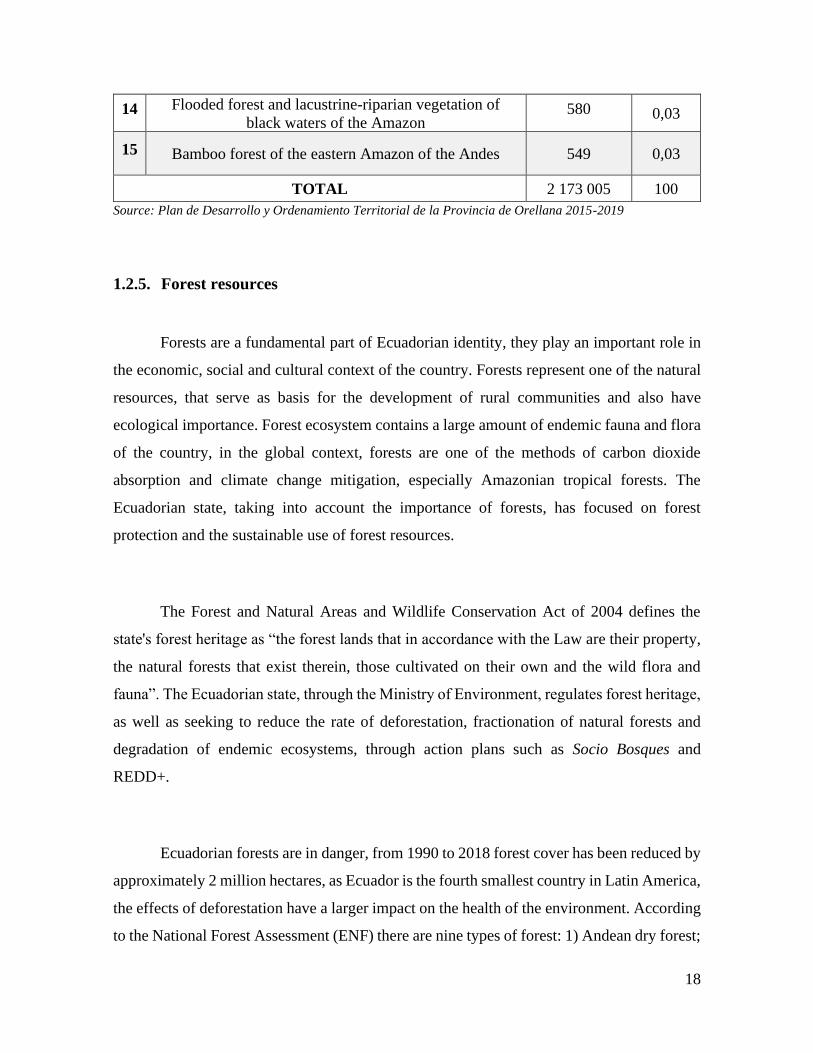
18
14 Flooded forest and lacustrine-riparian vegetation of
black waters of the Amazon 580 0,03
15 Bamboo forest of the eastern Amazon of the Andes 549 0,03
TOTAL 2 173 005 100
Source: Plan de Desarrollo y Ordenamiento Territorial de la Provincia de Orellana 2015-2019
1.2.5. Forest resources
Forests are a fundamental part of Ecuadorian identity, they play an important role in
the economic, social and cultural context of the country. Forests represent one of the natural
resources, that serve as basis for the development of rural communities and also have
ecological importance. Forest ecosystem contains a large amount of endemic fauna and flora
of the country, in the global context, forests are one of the methods of carbon dioxide
absorption and climate change mitigation, especially Amazonian tropical forests. The
Ecuadorian state, taking into account the importance of forests, has focused on forest
protection and the sustainable use of forest resources.
The Forest and Natural Areas and Wildlife Conservation Act of 2004 defines the
state's forest heritage as “the forest lands that in accordance with the Law are their property,
the natural forests that exist therein, those cultivated on their own and the wild flora and
fauna”. The Ecuadorian state, through the Ministry of Environment, regulates forest heritage,
as well as seeking to reduce the rate of deforestation, fractionation of natural forests and
degradation of endemic ecosystems, through action plans such as Socio Bosques and
REDD+.
Ecuadorian forests are in danger, from 1990 to 2018 forest cover has been reduced by
approximately 2 million hectares, as Ecuador is the fourth smallest country in Latin America,
the effects of deforestation have a larger impact on the health of the environment. According
to the National Forest Assessment (ENF) there are nine types of forest: 1) Andean dry forest;

19
2) pluviestational dry forest; 3) montane Andean evergreen forest; 4) evergreen green forest
foot of mount; 5) Andean eyebrow evergreen forest; 6) evergreen lowland forest of the
Amazon; 7) always green lowland forest of Chocó; 8) mangrove, and 9) moretales.
Forest exploitation in Ecuador during the last forty years has been characterized by a
disorganized legal forest use, but to a bigger extent an illegal use of forest resources, this led
to a lack of information when understanding the state of the country's forest landscape
Therefore, it is not surprising that Ecuador has the highest deforestation rate in relation to the
area of Latin America, according to IGM2, the country could be fully deforested by 2050 if
the annual deforestation rate of 1.7% continues. Among the causes of deforestation are the
decrease in forest cover of the province of Esmeraldas (tropical forest of the Pacific), which
had moved forestry activities to the Amazon region, the extractive oil activities generates
the construction of roads and infrastructure, which facilitates the illegal extraction of timber,
colonization and the change of land use towards agricultural activities, especially the
cultivation of African palm. The increase in population and urbanization without planning
has endangered primary forests and protected areas.
The forest capital of the country is viewed from two different perspectives:
environmental services and economic services. Environmental services is a relatively new
concept, and which has been actively implemented in Latin American countries, it is
understood that forests fulfill basic functions that have prominent repercussions on the
quality of life of the population and the economy, however they are not economically
quantified. Forest value is limited to the use of wood, discarding services such as water
production, the protection of flora and fauna, the sequestration of atmospheric CO2, soil
protection and aesthetic values.
2 IGM- instituto geográfico militar (military geographic institute)
20
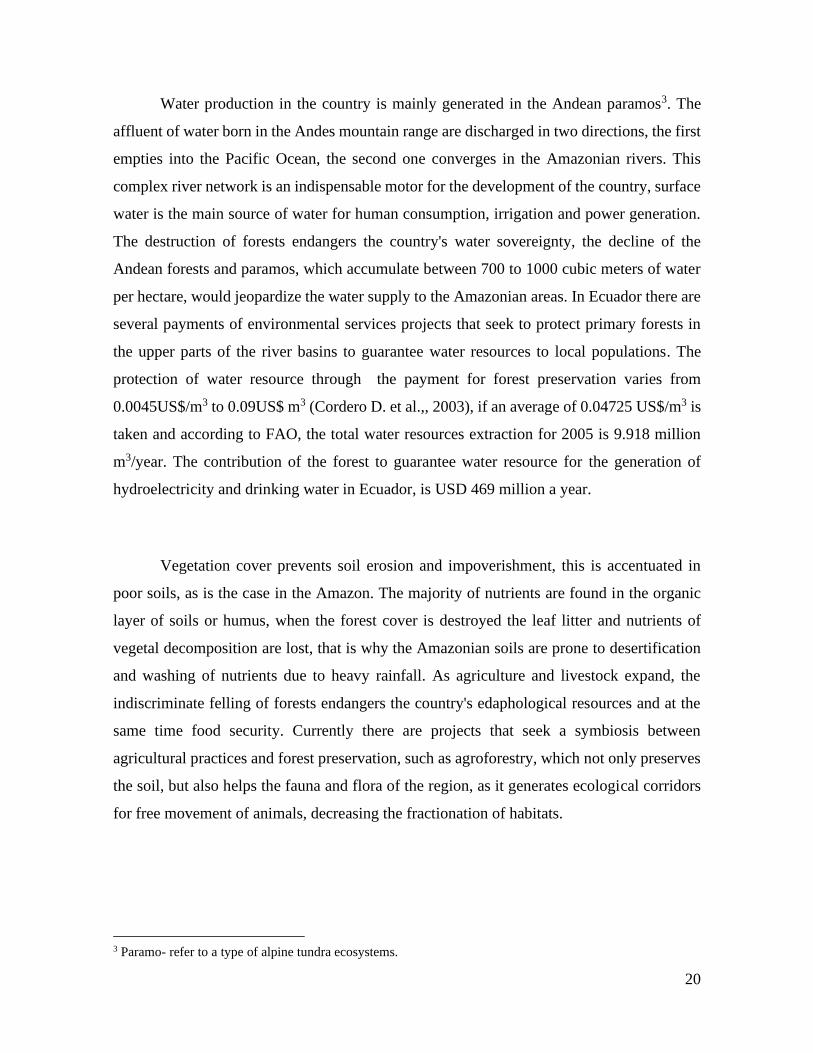
Water production in the country is mainly generated in the Andean paramos3. The
affluent of water born in the Andes mountain range are discharged in two directions, the first
empties into the Pacific Ocean, the second one converges in the Amazonian rivers. This
complex river network is an indispensable motor for the development of the country, surface
water is the main source of water for human consumption, irrigation and power generation.
The destruction of forests endangers the country's water sovereignty, the decline of the
Andean forests and paramos, which accumulate between 700 to 1000 cubic meters of water
per hectare, would jeopardize the water supply to the Amazonian areas. In Ecuador there are
several payments of environmental services projects that seek to protect primary forests in
the upper parts of the river basins to guarantee water resources to local populations. The
protection of water resource through the payment for forest preservation varies from
0.0045US$/m3 to 0.09US$ m3 (Cordero D. et al.,, 2003), if an average of 0.04725 US$/m3 is
taken and according to FAO, the total water resources extraction for 2005 is 9.918 million
m3/year. The contribution of the forest to guarantee water resource for the generation of
hydroelectricity and drinking water in Ecuador, is USD 469 million a year.
Vegetation cover prevents soil erosion and impoverishment, this is accentuated in
poor soils, as is the case in the Amazon. The majority of nutrients are found in the organic
layer of soils or humus, when the forest cover is destroyed the leaf litter and nutrients of
vegetal decomposition are lost, that is why the Amazonian soils are prone to desertification
and washing of nutrients due to heavy rainfall. As agriculture and livestock expand, the
indiscriminate felling of forests endangers the country's edaphological resources and at the
same time food security. Currently there are projects that seek a symbiosis between
agricultural practices and forest preservation, such as agroforestry, which not only preserves
the soil, but also helps the fauna and flora of the region, as it generates ecological corridors
for free movement of animals, decreasing the fractionation of habitats.
3 Paramo- refer to a type of alpine tundra ecosystems.

21
The increase in the concentration of CO2 in the atmosphere to 412 parts per million,
an increase of 48% with respect to the concentration of CO2 at the beginning of the industrial
era (280 ppm) is one of the main concerns when talking of climate change, the decrease in
its concentration in the atmosphere is essential to mitigate climate change. Forests through
photosynthetic processes fix carbon dioxide and convert it into biomass, hence its importance
in the remission of climate change. The change in land use, especially the transformations to
agricultural land, decreases the capacity of carbon absorption, according to the results of the
Carbon Capture project in the Northwest of Ecuador (Arias, et al., 2011) the carbon fixation
is 3 tm/ha/year. Socio Bosque program currently pays for forest conservation between US $
0.50 and US $ 90 per hectare4, which includes water protection, biodiversity and carbon
sequestration. Only for carbon sequestration the program would pay $ 0.167 USD and $ 30
USD respectively. Considering that the country's forest cover is 12.75 million hectares, and
if we take into account a fixation of 3 tm/ha/ year, the income would be in the range of USD
18.75 to 1 125 million per year in this ecosystem service alone.
The aesthetic value of Ecuadorian forests constitutes an important part of the
economy of the country, since the 80's tourism and ecotourism has been promoted in
Ecuador, in 2018 tourism contributed to the Ecuadorian economy 2.392 billion dollars, it is
the third source of non-oil revenues in the country. Several economic and social sectors point
to ecotourism as a source of employment and alternative development to oil extraction,
especially in the country's Amazon region, where tensions between extractive policies and
the conservation of forests are in constant conflict. This position increases the pressure on
the government to increase national parks and protected forests, at present the country has as
protected areas 19% of the national territory (4,907,609.5 hectares) including the maritime
territories. The implicit importance of forests has been recognized by the Ecuadorian
government and several payment programs for environmental services.
4 Values depend on the biological characteristics of the forests, the extent of the territory and the applicable
legal conditions.

22
Forest’s economic services forests are the extraction of wood and non-wood resources
and energy generation. In the rural areas of the country the use of firewood for thermal energy
generation and for cooking is a present reality, according to the data of the Population and
Housing Census 2010 in Ecuador 259 216 households use firewood, there are no data for the
use of wood as fuel in rural industrial activities. The square meter of firewood in 2014 had a
valuation between USD $10 and 15, the use of firewood puts pressure on the native forests
because it was estimated that 95% of the wood used for energy came from native forests and
the remaining 5% of plantations forestry (INEFAN & ITTO, 1992)The consumption of
firewood and coal of the rural population according to the 2000 census stood at 2.4 million
cubic meters and it was predicted that by 2020 this data would be maintained or there would
be minimal variations in the needs of firewood and coal, this is one of the important data that
draws the situation of forests in the country, especially in the Ecuadorian highlands where
there is bigger consumption of firewood and deforestation intensifies.
Timber production in the country is especially important in rural areas, poor planning
and insufficient control has led to the extraction of wood in an anti-technical manner and the
regeneration of forest resources has been put on hold. In 2010, the extraction of 3,704 338.70
m3 of wood from forest plantations, native forests, agroforestry systems and natural
regeneration was approved, in 2014 the forestry sector contributed 3.4% of the country's
gross domestic product. Demand for fine wood, firewood, coal and non-wood products
together with the deforestation rate of 1.7% puts Amazonian forests at risk, where the highest
amount of forest resources is concentrated.
Forestry activities in the province of Orellana began in the 1980s but sadly there is
not information on timber extraction until 2003, lack of this data prevents a deep analysis of
the historical use of forest resources. In the province of Orellana, the use of forest resources
is extensive, it is estimated that the annual gross deforestation is 5 751 hectares per year. In
the period 2010-2014 the Ministry of Environment approved 63 819.14 hectares for forest
management, this means that these areas are subject to laws and regulations that seek
sustainable use of forest resources in the province. There are four main sustainable timber

23
harvesting programs in Orellana, the Sustainable Forest Harvesting Program and the
Simplified Forest Harvesting Program are intended for native forests, focusing on wood
harvesting in large and small volumes respectively, through mechanized exploitation. The
purpose of the Logging Program is the management of forest that has already been quite
intervened and also tree plantations or pioneer formations. Finally, the Program for Legal
Conversion Zone aimed at changing the use of natural forests to oil, agricultural and other
activities. (Krainer , et al., 2011) There are different types of licenses for the special use of
rare timber. In addition, all forestry activities are subject to the Forest and Natural Areas and
Wildlife Conservation Law in force since 2004.
Despite sustainable harvesting projects and legislation, there is illegal logging
throughout Orellana province. Illegal logging in Orellana is approximately 30%, which does
not meet the regeneration requirements for its sustainability. The most affected areas are
protected areas, such as the Yasuni National Park, Waorani Territory and the Sumaco Napo
Galeras National Park. Indiscriminate logging has led to banning the extraction of mahogany
timber (Swietenia macrophylla) for ten years, its market price reaches $ 1 850 per cubic
meter, the high value has led to an overlogging of this tree species and now it is considered
vulnerable. The lack of control and corruption help the illegal extraction of timber, but also,
there is a socio-economic component, especially in the low-income families which ultimately
are employed as day laborers within an illegal timber operation, this operation ends with the
sale of fine wood on the border with Peru: “Between 20 and 40% of the wood harvested in
the Province of Orellana is illegal, usually for family support, of forest owners, this illegal
wood is transported evading and bribing controls according to versions of carriers and more
forest users ” (Hernandez , 2012)
In 2010, 358 species were approved for logging, of which 79 species were harvest of
forest plantations, 321 in agroforestry systems, 255 in native forest and 2 in pioneer
formations. The main forest plantation species are eucalyptus (30.78%), pine (23.39%), raft
(21.65%), teak, pachaco, melina, laurel and terminalia. The main species of authorized
agroforestry systems were laurel (32.87%), pichango (7.66%), bonbon (4.77%), and others.

24
Among the species that were harvested from natural forests are: sande (13.63%), lechero
(9.21%), chuncho (7.42%), coconut, copal, sandstone and chanul. (Arias, et al., 2011) In the
province of Orellana, the main logged timber species are Cordia alliodora with a volume of
115 956.18m³, followed by the species: Otoba spp, Cedrelinga cateniformis, Ceiba
pentandra, Sterculia sp., Virola spp., Erisma uncinatum, with the harvest of wood between
33 090.06 m³ - 51 013.37m³. (GADMFO, 2015)
Table 4 Main species authorized for logging at national level during 2010
COMMON
NAME
SCIENTIFIC
NAME
AUTHORIZED
VOLUME (m3)
PERCENTAGE
(%)
BALSA Ochroma piramidale 794 359,45 21,53
EUCALIPTO Eucalyptus globulus
labill 619 243,35 16,79
PINO Pinus radiata 470 493,80 12,75
LAUREL Cordia alliodora 284 644,57 7,72
PACHACO Schizolobium
parahybum 188 986,82 5,12
TECA Tectona grandis 181 915,43 4,93
PIGUE Pollalesta discolor 132 948,35 3,60
SANDE Brosimum spp 66 247,84 1.80
PICHANGO Trichospermum spp 61 772,54 1,67
LECHERO Brosimun spp. 43 908,35 1,19
OTHER SPECIES (348) 844 659,69 22,90
TOTAL VOLUME OF
AUTHORIZED TIMBER 3 689 180,19 100,00
Source: Use of forest resources in Ecuador-period 2010 (Arias, et al., 2011)

25
Chapter 2: MATERIALS AND METHODS
The investigation is delimitated in the Ecuadorian tropical rain forest, in the west part
of the Orellana province, between the cantons: Joyas de los Sachas, Loretto and Francisco de
Orellana. According to its geographical location, the territory under investigation is located
on the Amazon slope, within the hydrographic system of the Napo and Coca river basins.
Figure 5 Orellana province location in Ecuador
2.1. MATERIALS
The study of the forest dynamic in Ecuadorian rain forest was carried out using remote
sensing data, in which the main materials were the satellite images. These images of the
research territory were obtained via the USGS Earth explorer platform
(http://earthexplorer.usgs.gov, 2019), the format used was Landsat, in the years 1996, 2006,
2013 and 2018, in the months of September and October respectively.

26
Figure 6 Platform USGS Earth Explorer
Data processing and interpretation was performed using the program IDRISI version
Selva developed by ClarkLabs in 2012. The downloaded files were in Geotiff format and
were imported using the IDRISI program into a compatible format for processing.
Figure 7 idrisi selva

27
2.2. METHODS
2.2.1. Remote sensing for analysis of Land-Use and Land-Cover dynamics
The land cover of our planet has been suffering a series of alterations in the last
century, a big part of these changes is caused by human activity. The importance to study the
dynamics of the natural vegetation cover and the land use change, it is been reflected in the
understanding of the environmental processes that are interconnect with the vegetation, such
as, carbon sequestration, biodiversity preservation and climate change. The expansion of
urban and agricultural frontier into natural ecosystems needs to be monitoring, there are
several methods in situ than can provide with such an information: “Site-based observations
can be used, but remote sensing data have several characteristics, most notably repeated
synoptic coverage with consistent observation at a relatively low cost, that make them ideal
for modeling change” (Sohl & Sleeter, 2012). The use of remote data can give another
perspective when analyzed the change of land cover and land use, they not only provide the
current state of the dynamic of land use, but can give an historical perspective on the land
cover use transitions of a given territory. Remote sensing data allows to model future
scenarios of the land cover dynamics using driven factors.
The main characteristic of remote sensing is the collection of data for a substantial
distance, there are several methods of collection of data such as aerial photograph and
satellite images. The principle of aerial photography is the record of the reflectance
characteristics of a surface into photographic emulsion, which is a layer of light-sensitive
silver halide crystals on backing material (Morgan , Gergel, & Coops, 2010), this means that
the interaction between light and a body is recorder in a photographic devise and the
analyzed. Currently there is a great variety of technology that allows to record data from
different wave lengths of the spectrum, different spectral ranges give a better image of
specific features. Aerial photography is used for geographic analysis, urban planning and
cartography. These photographs gave the first perspective of land use change. (Aber,
Marzolff, & Johannes , 2010)

28
Satellite imagery are the representation of data collected by means of sensors in
artificial satellites. The working principle of the remote sensing sensor is to record the
interaction between a body, object or structure and the electromagnetic energy that strikes it.
The interactions can be various and depend on the structure and characteristics of the body.
They are distinguished between four main types of interaction, the absorption of energy by
the body, the transformation of electromagnetic energy into thermal energy, the energy
transmitted through the body and the energy reflected by it (Congalton & Dodge, 2013); with
this theoretical basis, one of the most important characteristics of remote sensing sensors is
introduced: spectral resolution.
Spectral resolution is the separation in portions of the electromagnetic spectrum, the
remote sensing sensor is able to distinguish and define wavelength intervals, each of these
portions or intervals are called bands, for example Landsat 7 (ETM+5) uses three bands for
the visible spectrum: band 1 – blue, band 2 – green and band 3 – red, the bands 4, 5 and 7 for
infrared region and the band 6 for the thermal region. (Congalton & Dodge, 2013) The main
advantage of the spectral resolution is the construction of images or composites, the different
software of image processing uses three canals (blue, green and red) to form an imagen, when
each band is used in their correspondent canal RGB it is obtain the natural colors or a true
composite, however, when bands are combine in different canals can be obtain images that
enhances a feature of the image, this combinations are called false composites. For the study
of vegetation cover can be use the combination RGB 4,3,2 which highlights healthy
vegetation in a red color, the combination RGB 5,3,1 for topographic texture and lithological
identification. There is the possibility to work with individual bands, the use of Near-Infrared
(NIR) and Red bands can be used to analyze vegetation and biomass.
5 Enhanced Thematic Mapper Plus

29
Figure 8 Common Landsat Band RGB composites by USGS
The satellite images are constituent in their most basic form by pixels. A pixel can be
defined as the most elemental unit of a digital image, and they have an important role in the
processing of satellite images. Spectral resolution of band can be analyzed in a pixel by pixel
in a graph format (Congalton & Dodge, 2013); when a composite is formed, each pixel of
each band has their own information of the intensity of energy sensed (brightness value or
the digital number), once combined an overlay of the information is obtain. For example,
when looking of a border area between a water body and vegetation, the pixels in this area
do not respond to color composition of either pure vegetation or a water body, they have mix
information of each band (Figure 9). Pixels have an essential role in spatial resolution, in
remote sensing spatial resolution refers to the capacity of distinguish the smallest object in
the image, a pixel is the smallest two-dimensional area, the sensor Landsat (TM) has a
medium resolution imagery with a o pixel size of 30 meters x 30 meters.

30
Figure 9 False color composite – pixel (Congalton & Dodge, 2013)
In a more traditional way remote sensing can be only use to study the land cover
dynamics, but there has been open approach to the use of remote sensing in a
multidisciplinary way. The combination of hydrology, ecology, cartography and geography
with social economic data, can provide a deeper view of land change use, the traditional
application gives a picture more factual of land change use, but economic and social data con
provide the causes or drivers of the change. These environmental-economic approaches can
give a better prognose of the land uses dynamic over time, the models can take into account
the economic panorama of a region, the population growth and the environmental policy that
have an impact in the change of the vegetation cover and the transformation of land.
There are several ways to study land use and land cover dynamic This research used
two methods to analyze the change of vegetation coverage in part of the province of Orellana,
the first method focuses on the use of Normalized Difference Vegetation Index, the second
uses the method of Maximum likelihood.
31
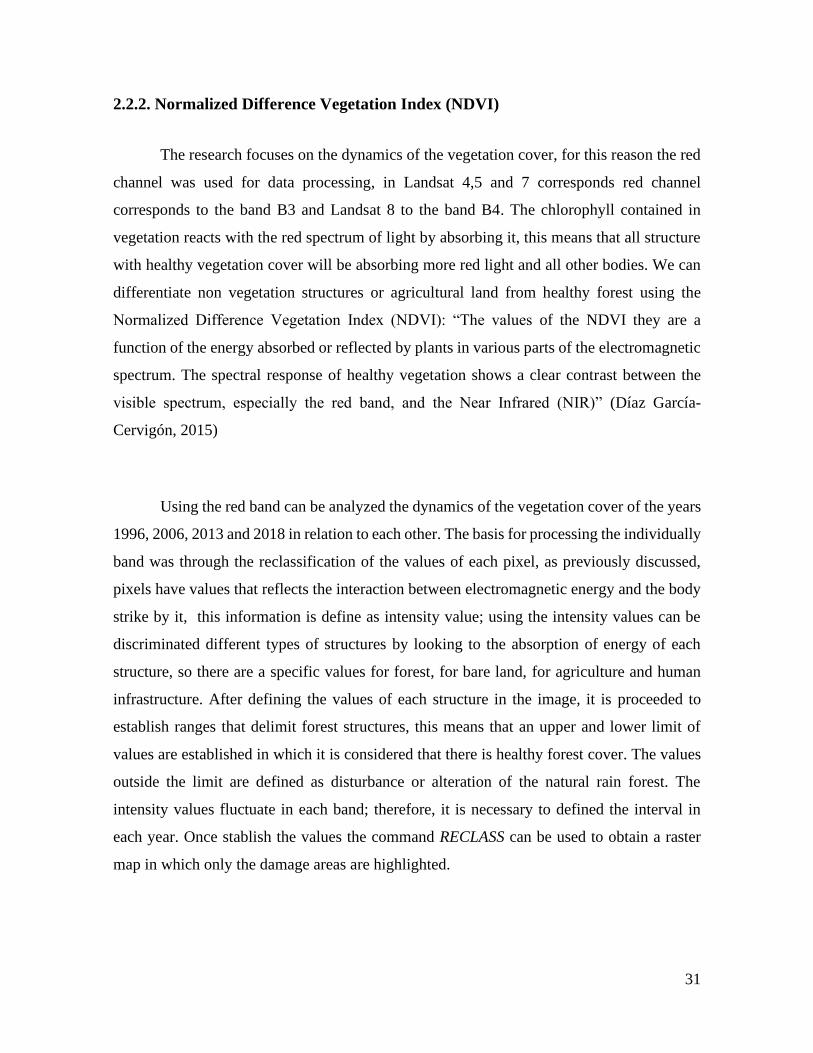
2.2.2. Normalized Difference Vegetation Index (NDVI)
The research focuses on the dynamics of the vegetation cover, for this reason the red
channel was used for data processing, in Landsat 4,5 and 7 corresponds red channel
corresponds to the band B3 and Landsat 8 to the band B4. The chlorophyll contained in
vegetation reacts with the red spectrum of light by absorbing it, this means that all structure
with healthy vegetation cover will be absorbing more red light and all other bodies. We can
differentiate non vegetation structures or agricultural land from healthy forest using the
Normalized Difference Vegetation Index (NDVI): “The values of the NDVI they are a
function of the energy absorbed or reflected by plants in various parts of the electromagnetic
spectrum. The spectral response of healthy vegetation shows a clear contrast between the
visible spectrum, especially the red band, and the Near Infrared (NIR)” (Díaz García-
Cervigón, 2015)
Using the red band can be analyzed the dynamics of the vegetation cover of the years
1996, 2006, 2013 and 2018 in relation to each other. The basis for processing the individually
band was through the reclassification of the values of each pixel, as previously discussed,
pixels have values that reflects the interaction between electromagnetic energy and the body
strike by it, this information is define as intensity value; using the intensity values can be
discriminated different types of structures by looking to the absorption of energy of each
structure, so there are a specific values for forest, for bare land, for agriculture and human
infrastructure. After defining the values of each structure in the image, it is proceeded to
establish ranges that delimit forest structures, this means that an upper and lower limit of
values are established in which it is considered that there is healthy forest cover. The values
outside the limit are defined as disturbance or alteration of the natural rain forest. The
intensity values fluctuate in each band; therefore, it is necessary to defined the interval in
each year. Once stablish the values the command RECLASS can be used to obtain a raster
map in which only the damage areas are highlighted.

32
Figure 10 Red band and NDVI reclassification
The satellite images used for remote sensing analysis must be as clear as possible,
therefore, they should not present any type of distortion that compromise the pixel values,
and the overall image surface, the most frequent distortion encounter when working with
satellite image are scattering and cloudiness. The atmospheric gases can interact with the
electromagnetic energy by absorbing energy at certain wavelengths: “The atmosphere can
affect the nature of remotely sensed images in a number of ways. At the molecular level,
atmospheric gases cause scattering that progressively affects shorter wavelengths.”
(Eastman, 2003). The correction of this phenomenon is an important step towards the precise
processing of the satellite images, there are several methods of correction, but in this
investigation where used atmospheric correction and the fragmentation of an image. The
fragmentation method is focused to separated or fragmented the scattered area and processing
by itself, since the atmospheric components tainted the interaction between the
electromagnetic energy and the earth surface, the intensity values of the pixel in these areas
are different form the rest of the imagen, it is necessary to define new intervals of healthy
forest and anthropogenic disturbances, once processed the imagen can be form with all the
fragments.
33
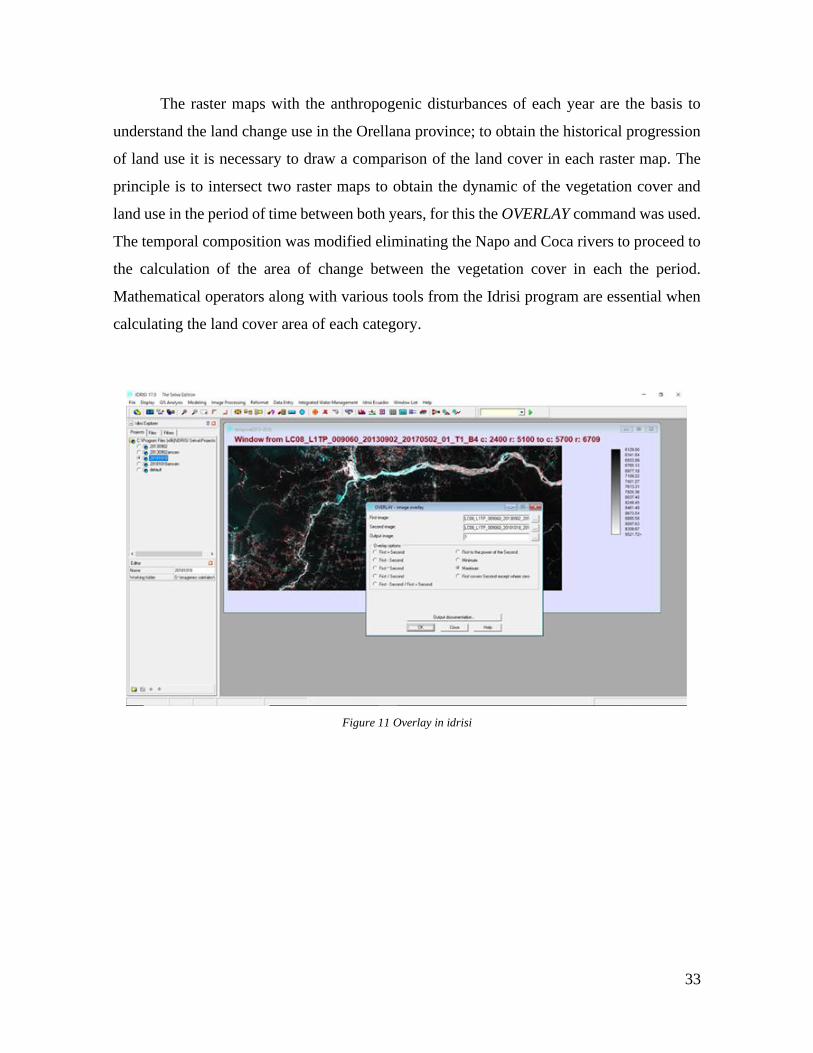
The raster maps with the anthropogenic disturbances of each year are the basis to
understand the land change use in the Orellana province; to obtain the historical progression
of land use it is necessary to draw a comparison of the land cover in each raster map. The
principle is to intersect two raster maps to obtain the dynamic of the vegetation cover and
land use in the period of time between both years, for this the OVERLAY command was used.
The temporal composition was modified eliminating the Napo and Coca rivers to proceed to
the calculation of the area of change between the vegetation cover in each the period.
Mathematical operators along with various tools from the Idrisi program are essential when
calculating the land cover area of each category.
Figure 11 Overlay in idrisi

34
2.2.3. Maximum Likelihood classifier (MAXLIKE)
Maximum Likelihood classifier is one of the hard classifiers in Idrisi, the principle of
this function is to determined where a pixel probably belongs in a classification, as already
stablish the response of the interaction of electromagnetic energy and a body depends of the
characteristic of the body, consequently, the characteristic of the pixel that represented a
structure are specific for each of them: “When using MAXLIKE, a full multidimensional
probability function is evaluated to determine the likelihood that any pixel belongs to a given
class” (Eastman, 2003) The main idea is to define classes and take a representative pixel
threshold for each class and proceed to sort out the remaining pixels based on probability of
belonging.
The MAXLIKE method use three bands to correlate the pixel values between them,
therefore, the first step towards this method is to create a composition in which the classes
are going to be stablish. It was used a false composition RGB 753 for Landsat 5-7 and the
false composition RGB 764 for Landsat 8. The false composition highlights anthropogenic
expansion into natural vegetation with atmospheric removal. The creation of a vector layer
is the basis to the discrimination of structures into classes. For this it is necessary to
determinate the bodies or structures that are urban areas, agricultural land and others, using
digitalization command each structure should be vectorize under the same class, in this case
the class 1 correspond to Forest, the class 2 to Urban construction, the class 3 respond to
Bare land, class 4 to Altered vegetation and class 5 to Water bodies.
One major limitation is the assignation structures to a class, in a natural composition
the bare land and the urban structure present different colors but in the false composition the
share the same graduation of pink but with different undertones, since this method is base in
probability of belonging the program will assign at the same class these two bodies, a specific
differentiation is really complicated to archive, thus, the classes created respond to the
structure in a macro classification that respond to the structure more representative. In the
case of altered vegetation, the same problem raised with the differentiation between the

35
agriculture, livestock and deforestation. Some type of alteration has more accurate
representation in the false composition than others. For example, degraded vegetation, grown
crops and vegetation that have some degree of coverage of the soil are represented in the
composition RGB 764 with a bright green color, when a comparison is made with the infrared
composition (the altered vegetation is viewed in a bright red), the structures intersect between
both compositions, so are more prone to be easily classified. The problem begins when there
is partial coverage of the soil by the vegetation6, in this case it is observed a gradation of
colors that complicated the classification, in a macro classification these areas are define as
altered vegetation but they are in nature different of degraded vegetation, for this reason they
were crated two types of altered vegetation: the first that are represented by areas with some
level of chlorophyll and bare soil and the second one that includes a bodies with high level
of chlorophyll as in agricultural lands.
Figure 12 True color visualization - RGB 543 - RGB 764
The process of maximum likelihood classifier needs the development of signatures
(classes) in the respective bands that they were define, the process continues with the hard
classification of the pixels using Bayesian classifier, the probability can be modified but in
this investigation the default values are used. The end product will be a map composite with
all class represent and ready for future analysis. This process needs to be carried out for 1996
to 2018. One important aspect is the continues in the moment of make the classes, the
uniformity will be needed when making land change models.
6The partially coverage of soil by vegetation includes new crops, early stages of succession.

36
2.2.4. Land Change Modeler
Land change modeler is one of the features of Idrisi that allows to study the
transformations of an area using an initial year and a final year composition, this historical
analysis gives a better understanding of the dynamics of lad use in a given territory, the
modeler can interpreter the data and determinate the gains and losses of each category or
class previously stablished: “Based on an analysis of historical land cover change, the system
develops an empirical model of the relationship between land cover transitions and a set of
explanatory variables” (Eastman J.R., et al., 2017). The land cover transitions are studied
through various tools inside of the LCM, such as Multi-Layer Perceptron neural network
(MLP), Logistic Regression (LR) and SimWeight (SW).
Figure 13 Transition probabilities Makrov
The Multi-Layer Perceptron compares the proprieties of the pixels and establishes the
changes in their characteristic between a period of time, more information can be adding to
have a deeper analysis of the causes or drivers of the transition. The knowledge of the studied
area is fundamental in the moment of define the essential parameters and to evaluated the
transition based in the anthropogenic dynamics of an area. Using Land change modeler can
be obtaining a prediction of the transformation in the land cover, for this investigation was
used the MAXLIKE composition of 1996 and the MAXLIKE composition of 2018 for the
transition analysis and for the prediction of the region in 2060 and 2080. Predictive Change
Modeling was carried out using Markov Chain Analysis: “A Markovian process is one in
which the state of a system at time 2 can be predicted by the state of the system at time 1

37
given a matrix of transition probabilities from each cover class to every other cover class.”
(Eastman, 2003) The Makov matrix was generated by default using the transition period
between 2018 and the years to predict. (Figure 13)
For the transition analysis was created a sub-model that explains the anthropogenic
disturbance in the area of study, for this model eleven variables were define. The variables
were based into the knowledge of the area of study, such as urban infrastructure, roads, rivers,
prior alterations (bare land and agricultural expansion), for each variable a raster composition
was created and also a distance of impact. The LCM modeler evaluated the variable and their
influence in the change observed between 1996 and 2018 and created transition potentials,
that describes the likelihood of change in area and their dependence of each variable.
Figure 14 Variables: a) distance from roads b) distance from altered vegetation
a b

38
Chapter 3: Results
Use of remote sensing data for monitoring the condition of the forest of
Ecuador
In the rural areas of Ecuador, agriculture and livestock as well as the extraction of
raw materials constitute the main source of sustenance for the inhabitants of the Orellana
province, consequently, the human activity and the forest resources are deeply
interconnected. The transformation of primary forest to agricultural land, the extraction of
timber and the growing population in this area compromise the health of the tropical rain
forest. The amazon basis presents a series of conditions that difficult the in-situ monitoring,
the use of remote sensing data facilitated the analysis of anthropogenic disturbances in the
forest ecosystem. Remote sensing data is one of the tools to account and protect the
economical and biological values of forest resources for future generations.
3.1. Identification of anthropogenic disturbance in the forest ecosystems
The satellite imagens are used to obtain a general perspective of the area of study,
since monitoring of forest resources is the main objective in this investigation, the NDVI
method was used to discriminated the areas in where healthy vegetation was absent. The
result of this process was the creation of five composition maps of Orellana province, in
which, only the disturbance areas were highlighted. When we talk about disturbance areas it
is referred to all bodies that lack the respond of healthy forest with the red visible light, this
include crops, pastureland, bare soil, urban settlements, roads, mines and all human
infrastructure, in Figure 15 it is observed the areas with disturbance in comparison with the
true color visualization.

39
Figure 15 Disturbance in vegetation cover: a) True color visualization b) Disturbed area visualization
20
13
a b
19
96
2
00
2
20
18

40
For each composition it is possible to calculated the area of forest and the
anthropogenic disturbances. In Table 5 it is clear that the forest ecosystem has been altered
by human activity, if it is taken as a start point the area of anthropogenic disturbance of 1996,
for the year 2002 the human disturbance had increased 11.70% , in 2013 the anthropogenic
disturbance had increase in 53.34% compared to 1996 and in 2018 the degree of disturbance
in the area was 34.53%. In 2013 there was the biggest destruction of forest territory with a
decrease of 17443.44 hectares in relationships with the forest area in 1996, the increase of
forest area in 6152.85 hectares in 2018 could respond to secondary succession and
reforestation. (See appendix 1 to 4)
Table 5 Area (ha) from 1996 to 2018
AREA (HA) 1996 2002 2013 2018
FOREST 179786.79 175960.35 162343.35 168496.20
ANTHROPOGENIC
DISTURBANCE 32701.05 36527.49 50144.49 43991.64
The dynamic of land use can be visualized in the Figure 16, that shows the transition of forest
cover to disturbed area through time. It is observed the rapidly decrease of forest cover from
2002 to 2013, from the year 2018 we see a partially recover in forest.
Figure 16 Dynamic of land use from 1996 to 2018
10000
15000
20000
25000
30000
35000
40000
45000
50000
55000
157000
162000
167000
172000
177000
182000
1996 2002 2013 2018
Dis
turb
ed a
rea
(ha)
Fo
rest
are
a (h
a)
Year
Forest Anthropogenic disturbance

41
3.2. Matrix analysis of land coverage dynamics
The territory of Orellana has suffered several alterations in its vegetation cover as
well as a change in their land use, to a better understanding of the historical transformations
of land use a matrix analysis was carried out. The principle is giving values to the disturbed
area in the NDVI map compositions of each year and proceed to sum the values on each year,
since the alteration of land cover inclined to expand from areas that had already disturbed,
we can obtain a historical picture of the areas that had change in the following years. These
means the differentiation of the unchanging human infrastructure, and their contraction or
expansion in a period of time.
Table 6 Matrix analysis of land coverage 2013 to 2018
2018
Without disturbance With disturbance
0 10
2013
Without disturbance 0 0+0=0
without alterations
0+10=10
Disturbance in 2018
With
disturbance 1 1+0=1
Disturbance in 2013
1+10=11
Disturbance in 2013 and 2018
The territory of Orellana has suffered several alterations in its vegetation cover as
well as a change in their land use, to a better understanding of the historical transformations
of land use a matrix analysis was carried out. The principle is giving values to the disturbed
area in the NDVI map compositions of each year and proceed to sum the values on each year,
since the alteration of land cover inclined to expand from areas that had already disturbed,
we can obtain a historical picture of the areas that had change in the following years. These
means the differentiation of the unchanging human infrastructure, and their contraction or
expansion in a period of time.
Table 6 illustrates the matrix analysis of land coverage, as result of this matrix a map
composition was obtain, on which the disturbed territories in 2013 and 2018 are marked in

42
yellow (category 11), black (category 0) are primary forests without changes, red (category
1) there are areas disturbed in 2013, but recovered in 2018 (succession). Blue (category 10)
represents areas that were altered in 2018, but remained intact in 2013. This analysis was
performed for 1996-2002, 2002-2013 and 2013-2018 (see appendix 5 to 7), and from it we
have can extract the area of each category.
Figure 17 Matrix analysis of land coverage dynamics 2013-2018
Figure 17 shows the historical transition from forest cover to anthropogenic disturbed
areas and vice versa. The data obtained show that in the period form 2013 - 2018 there were
recuperate 19 874.52 hectares of forest, and a decrease of new intervened forest of 13 681.8
hectares compared to the period 2002 - 2013. A reason that may explain this phenomenon is
the growing concern of government entities, that led to the creation of two national plans for
the protection and sustainable use of forests, the program Socio bosques in 2008 and the
REDD: “The REDD + Action Plan for Ecuador (2016–2025) is an important component of
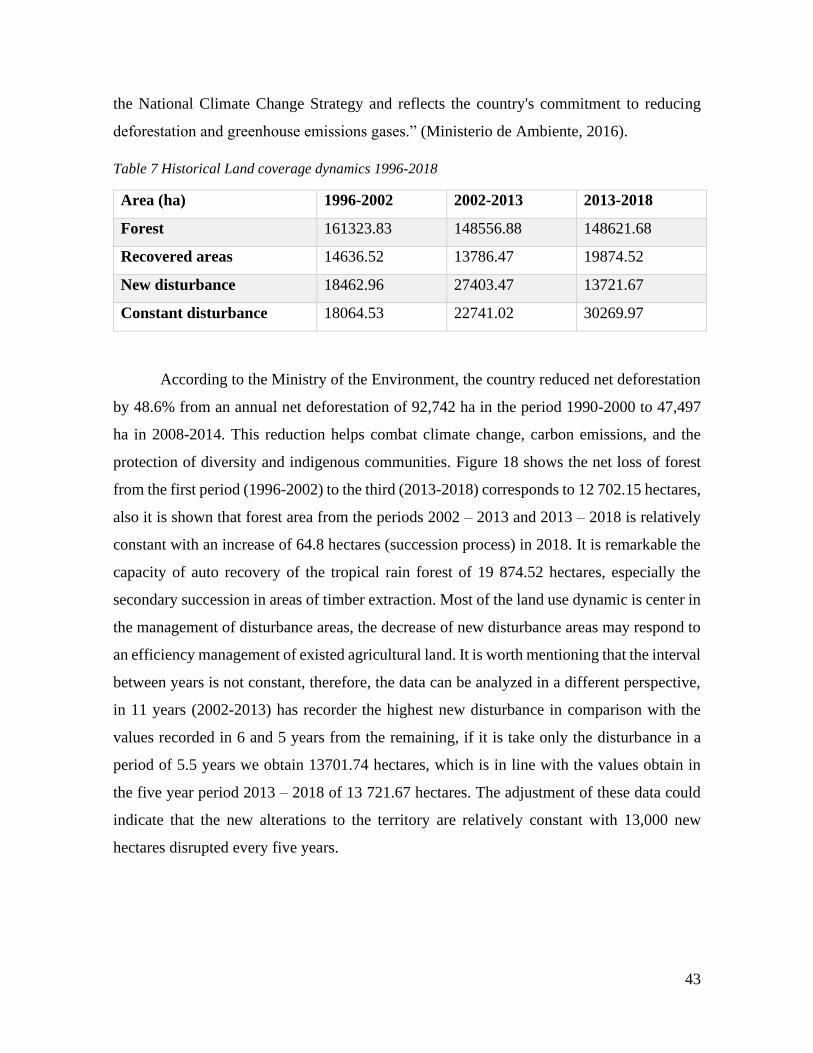
43
the National Climate Change Strategy and reflects the country's commitment to reducing
deforestation and greenhouse emissions gases.” (Ministerio de Ambiente, 2016).
Table 7 Historical Land coverage dynamics 1996-2018
Area (ha) 1996-2002 2002-2013 2013-2018
Forest 161323.83 148556.88 148621.68
Recovered areas 14636.52 13786.47 19874.52
New disturbance 18462.96 27403.47 13721.67
Constant disturbance 18064.53 22741.02 30269.97
According to the Ministry of the Environment, the country reduced net deforestation
by 48.6% from an annual net deforestation of 92,742 ha in the period 1990-2000 to 47,497
ha in 2008-2014. This reduction helps combat climate change, carbon emissions, and the
protection of diversity and indigenous communities. Figure 18 shows the net loss of forest
from the first period (1996-2002) to the third (2013-2018) corresponds to 12 702.15 hectares,
also it is shown that forest area from the periods 2002 – 2013 and 2013 – 2018 is relatively
constant with an increase of 64.8 hectares (succession process) in 2018. It is remarkable the
capacity of auto recovery of the tropical rain forest of 19 874.52 hectares, especially the
secondary succession in areas of timber extraction. Most of the land use dynamic is center in
the management of disturbance areas, the decrease of new disturbance areas may respond to
an efficiency management of existed agricultural land. It is worth mentioning that the interval
between years is not constant, therefore, the data can be analyzed in a different perspective,
in 11 years (2002-2013) has recorder the highest new disturbance in comparison with the
values recorded in 6 and 5 years from the remaining, if it is take only the disturbance in a
period of 5.5 years we obtain 13701.74 hectares, which is in line with the values obtain in
the five year period 2013 – 2018 of 13 721.67 hectares. The adjustment of these data could
indicate that the new alterations to the territory are relatively constant with 13,000 new
hectares disrupted every five years.

44
Figure 18 Historical Land coverage dynamics
3.3. Land use change with Maximum likelihood method
The natural land cover in the Amazonia rain forest is severely affected by human
activity, to understand and evaluated the profound alterations of the evergreen rain forest, we
can relay in the use of remote sensing methods. Using the maximum likelihood method, we
obtain a more precise mapping of the land cover and the change over time. The maps show
the anthropogenic disturbance label as urban areas, bare land, altered vegetation and the
natural structures as forest and water bodies. Bare land refers to areas with low vegetation
cover, mixtures of bare soil and partial vegetation cover. Altered vegetation refers to a crops,
grassland and vegetation with less amount of interaction with light (photosynthesis reaction)
that health forest as shown in Figure 19.
0 20000 40000 60000 80000 100000 120000 140000 160000 180000
Forest
Recovered areas
New disturbance
Constant disturbance
Area (ha)
2013-2018 2002-2013 1996-2002

45
Figure 19 Land cover MAKLIKE 2018

46
Figure 20 Land cover MAKLIKE 1996
The data obtained from the maximum likelihood method is shown in Table 8, the
forest area has decrease from 118 938.87 hectares in 1996 to 106 354.53 hectares in 2018,
this means a net loss of 10.58%. The human disturbances in 1996 were 85 321.98, in 2018
there is an increment of human alteration of 13 009.5 hectares in comparison with 1996.
Altered vegetation represents the 33.92% of the total area of study, which means that the
agriculture, grassland and degradation of primary forest account for 72 071.21 hectares of
the total area of study. (See appendix 8 to 11)
Table 8 Land cover 1996-2018
Land cover (ha) 1996 2002 2013 2018
Forest 118938.87 108163.8 116045.64 106354.53
Urban area 4414.05 4328.46 4460.04 5853.69
Bare land 7943.58 19387.08 10563.66 22832.46
Altered vegetation 72964.35 72137.07 73538.10 69645.33
Water body 8226.99 8471.43 7880.4 7801.83

47
The transition between forest and anthropogenic disturbance responds of a series of
factors. The area of study is rural, where the main non-oil economic activities are agriculture,
livestock and extraction of timber, therefore the interaction between these activities have
disrupted the integrity of the forest, through removal of the forest layer for the cultivation of
cocoa, soybeans, oil palm and grassland. The alteration of forest cover is shown in Figure
21, where altered vegetation and bare land accounts for 95% of the anthropogenic
disturbance. The expansion of urban area is relatively constant with an increment of 1 439.64
hectares between 1996 and 2018.
Figure 21 Land change 1996-2018
3.4. Monitoring of forest resources using Land Change Modeler
Land Change Modeler allows to analyzed the historical changes in a certain area, the
principle is to compared the land cover of the same area in two different years, as a result we
can obtain the dynamics of the land use7. Figure 22 shows the transition between the
evergreen lowland forest to anthropogenic disturbance, it is clear that majority of the
transitions correspond to the agricultural expansion towards the natural forest. The category
7 See appendix 12 - Change from 1996 to 2018
0 20000 40000 60000 80000 100000 120000 140000
Forest
Urban area
Bare land
Altered vegetation
Water body
Area (ha)
2018 2013 2002 1996
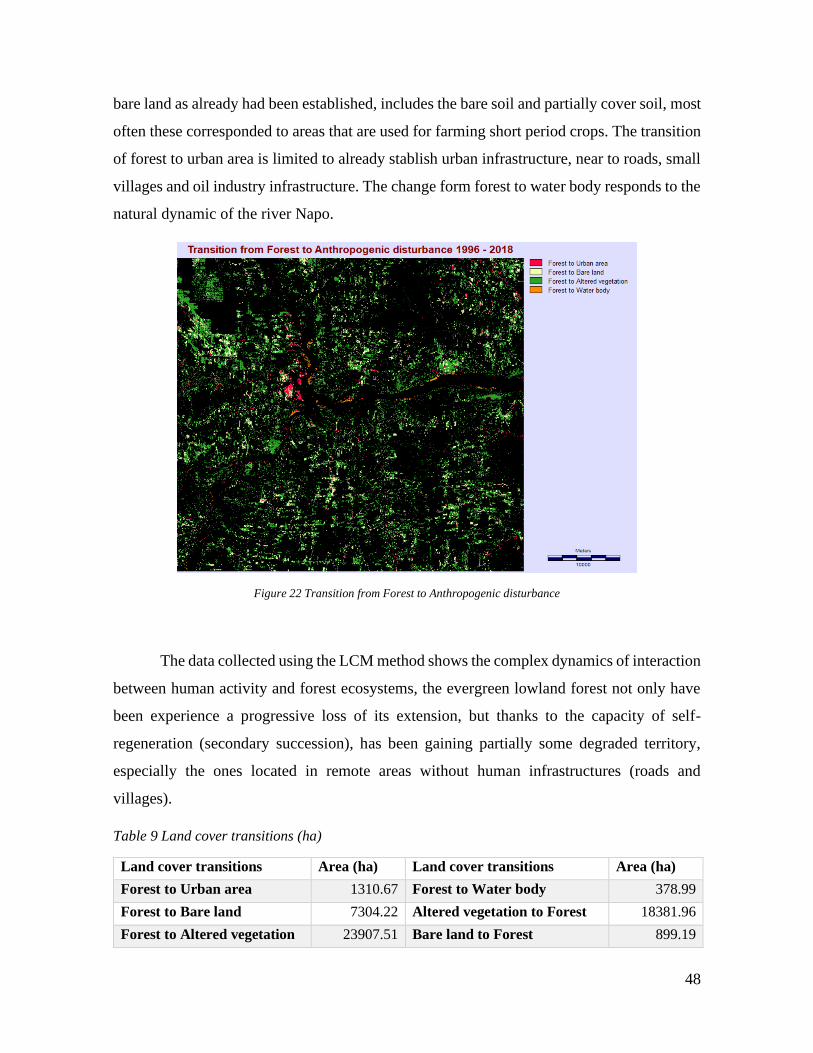
48
bare land as already had been established, includes the bare soil and partially cover soil, most
often these corresponded to areas that are used for farming short period crops. The transition
of forest to urban area is limited to already stablish urban infrastructure, near to roads, small
villages and oil industry infrastructure. The change form forest to water body responds to the
natural dynamic of the river Napo.
Figure 22 Transition from Forest to Anthropogenic disturbance
The data collected using the LCM method shows the complex dynamics of interaction
between human activity and forest ecosystems, the evergreen lowland forest not only have
been experience a progressive loss of its extension, but thanks to the capacity of self-
regeneration (secondary succession), has been gaining partially some degraded territory,
especially the ones located in remote areas without human infrastructures (roads and
villages).
Table 9 Land cover transitions (ha)
Land cover transitions Area (ha) Land cover transitions Area (ha)
Forest to Urban area 1310.67 Forest to Water body 378.99
Forest to Bare land 7304.22 Altered vegetation to Forest 18381.96
Forest to Altered vegetation 23907.51 Bare land to Forest 899.19

49
Figure 23 shows the gains and loss of forest cover, in a period of 22 years the forest
ecosystem has loss 63% of cover area, 46% expressly due the agriculture expansion, 14% to
forestry with clear cut and removal of forest cover and 2% to the growing of cities and
villages. In perspective the forest cover has reclaim 34% of the territory loss in 1996, mainly
for altered vegetation, in other words to agricultural lands. This phenomenon can be
explained due a common practice in Ecuador, where the farmer cuts forest and transformed
it into agricultural land for a short period, especially for the cultivation of corn, banana and
sugar cane; after the harvest, the areas are abandon and the farmer move on to new territories:
“The system of shifting cultivation of crops for two or three years, if they are annual crops
or seven and more years if they are permanent, then abandon the land as a soil rotation and
then clear new land in virgin or secondary forest” (Gomez de la Torre, Sara & Anda Basabe,
Susana & Bedoya, Eduardo., 2017) This migratory system expands the agricultural frontier
and increase the fragmentation and degradation of primary forest. This is not a sustainable
agricultural practice; the abandon agriculture land is object of secondary succession ant the
formation of secondary forest. The 37% of recover forest tells the history of negligent
agriculture practices in the Ecuadorian amazon.
Figure 23 Transition of Land use
2%
14%
46%
1%
35%
2%
37%
Forest to Urban area Forest to Bare land Forest to Altered vegetation
Forest to Water body Altered vegetation to Forest Bare land to Forest
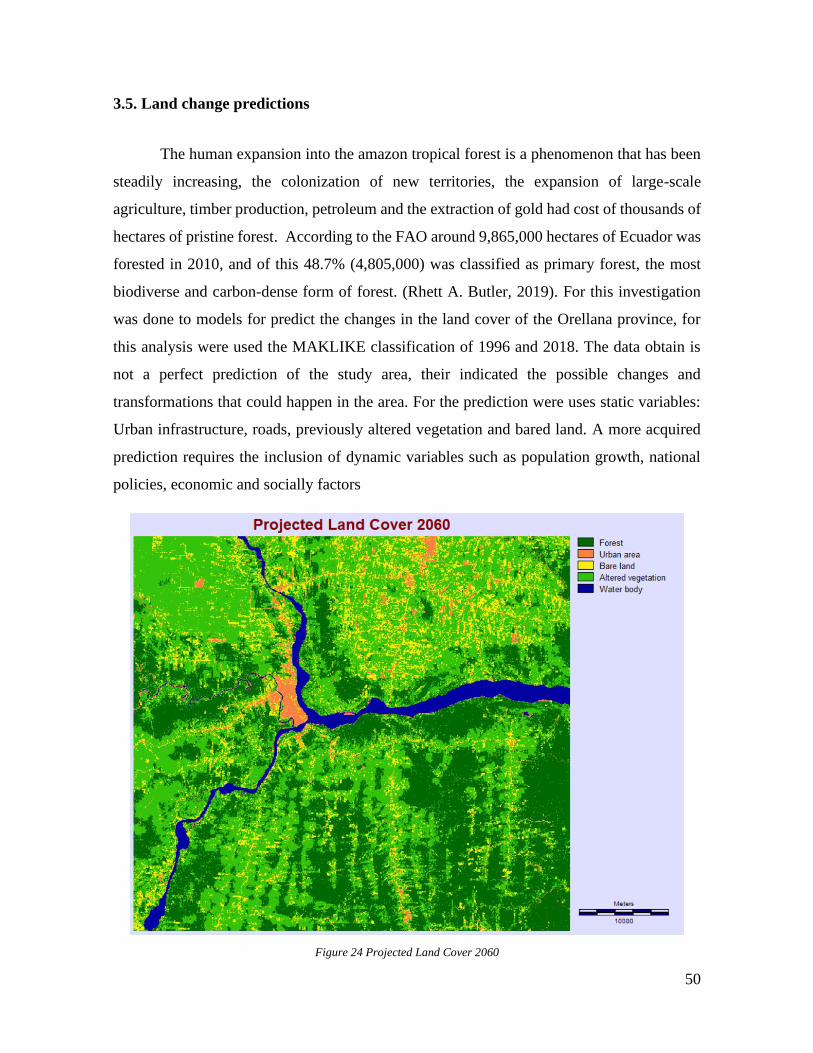
50
3.5. Land change predictions
The human expansion into the amazon tropical forest is a phenomenon that has been
steadily increasing, the colonization of new territories, the expansion of large-scale
agriculture, timber production, petroleum and the extraction of gold had cost of thousands of
hectares of pristine forest. According to the FAO around 9,865,000 hectares of Ecuador was
forested in 2010, and of this 48.7% (4,805,000) was classified as primary forest, the most
biodiverse and carbon-dense form of forest. (Rhett A. Butler, 2019). For this investigation
was done to models for predict the changes in the land cover of the Orellana province, for
this analysis were used the MAKLIKE classification of 1996 and 2018. The data obtain is
not a perfect prediction of the study area, their indicated the possible changes and
transformations that could happen in the area. For the prediction were uses static variables:
Urban infrastructure, roads, previously altered vegetation and bared land. A more acquired
prediction requires the inclusion of dynamic variables such as population growth, national
policies, economic and socially factors
Figure 24 Projected Land Cover 2060

51
Table 10 Land cover predictions
Area (ha)
Land cover 1996 2018 2060 2080
Forest 118938.87 106354.53 75862.71 71161.83
Anthropogenic
disturbance 72964.35 69645.33 100137.15 104838.03
The accuracy of the model was 66.04% with eleven static variables, that are part of a
sub-model transition denominated anthropogenic disturbance, this model describes the
transformations that forest cover suffers (see appendix 13). This model was using for the
construction of a prediction of the land changes in 2060 and 20808 as seen in the Figure 24.
Figure 25 shows growth trend of human disturbances in forest ecosystems. The expansion of
altered vegetation has more probability in areas with previous alteration and near to roads, in
the year 2060 the forest area decreases 30 491.82 hectares in relation with 2018 and 43 076.16
hectares in relation with 1996.
Figure 25 Prediction of forest to anthropogenic disturbance
8 See appendix 12
0 20000 40000 60000 80000 100000 120000
1996
2018
2060
2080
Area (ha)
Anthropogenic disturbance Forest
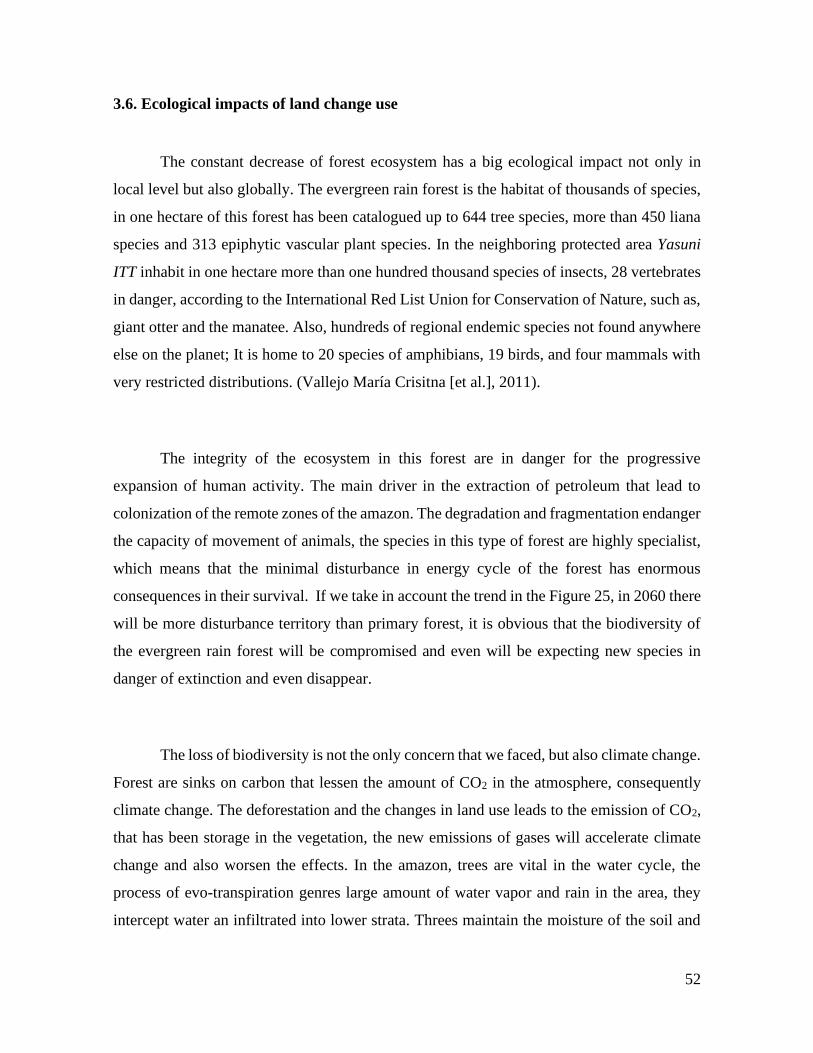
52
3.6. Ecological impacts of land change use
The constant decrease of forest ecosystem has a big ecological impact not only in
local level but also globally. The evergreen rain forest is the habitat of thousands of species,
in one hectare of this forest has been catalogued up to 644 tree species, more than 450 liana
species and 313 epiphytic vascular plant species. In the neighboring protected area Yasuni
ITT inhabit in one hectare more than one hundred thousand species of insects, 28 vertebrates
in danger, according to the International Red List Union for Conservation of Nature, such as,
giant otter and the manatee. Also, hundreds of regional endemic species not found anywhere
else on the planet; It is home to 20 species of amphibians, 19 birds, and four mammals with
very restricted distributions. (Vallejo María Crisitna [et al.], 2011).
The integrity of the ecosystem in this forest are in danger for the progressive
expansion of human activity. The main driver in the extraction of petroleum that lead to
colonization of the remote zones of the amazon. The degradation and fragmentation endanger
the capacity of movement of animals, the species in this type of forest are highly specialist,
which means that the minimal disturbance in energy cycle of the forest has enormous
consequences in their survival. If we take in account the trend in the Figure 25, in 2060 there
will be more disturbance territory than primary forest, it is obvious that the biodiversity of
the evergreen rain forest will be compromised and even will be expecting new species in
danger of extinction and even disappear.
The loss of biodiversity is not the only concern that we faced, but also climate change.
Forest are sinks on carbon that lessen the amount of CO2 in the atmosphere, consequently
climate change. The deforestation and the changes in land use leads to the emission of CO2,
that has been storage in the vegetation, the new emissions of gases will accelerate climate
change and also worsen the effects. In the amazon, trees are vital in the water cycle, the
process of evo-transpiration genres large amount of water vapor and rain in the area, they
intercept water an infiltrated into lower strata. Threes maintain the moisture of the soil and

53
protect the nutrients in it. The change between forest and agricultural land will mean less
amount of water in a region, less runoff and more impoverished soils.
Table 11 Emissions from gross deforestation of native forest (tCO2 eq year-1) for the periods 1990-
2000, 2000-2008
Period Historic data GHG emissions from
estimated deforestation
ha ha year-1 tCO2 eq year-1 tCO2 eq year-1
1990-2000 1 299 431 129 943 52 784 480 406
2000-2008 869 201 108 650 43 418 126 400
Source (Ministerio de Ambiente, 2016)
The ecology succession process is constant in the forests when a tree dies and there
is an opening in the crowns of the trees initiates the competition between individuals to grow,
this is a natural process that occurs in primary forests, ecological succession in degraded
areas is more complex and depends on a series of biological actors such as: colonizing
species, availability of seeds, environmental and other conditions. Secondary ecological
succession processes are very present in the Amazon region, agricultural practices that
include the abandonment of the area after harvesting generate space that lead to the formation
of secondary forests through ecological succession. The investigation showed that from 1996
to 2018 there was a secondary succession of 19 281.15 hectares.
Ecological succession and restoration rise to the formation of secondary forests,
which usually have less biodiversity, primary forests contain more dead organic matter,
which means more dynamism in the biological processes of the forest, in addition to the
specific ecosystems for many plants and animals, at that time as secondary forests contain
less organic matter, are more susceptible to fires and the death of endemic species.

54
3.7. Types of anthropogenic alterations in the Amazon territory
The amazon tropical rain forest is suffering significant alterations in its vegetation
cover, unfraternally this in not a phenomenon exclusive of Brazil or Ecuador, but rather, it is
happening in the eight countries that conform the amazon basin. The extraction of oil, gold
and timber initiates the colonization process of pristine forest, this colonization carries out
the expansion of the agriculture frontier, the fragmentation of forest ecosystems, wildfires
and development of villages and roads, step by step the Amazonian region loss thousands of
hectares and release CO2 to the atmosphere. The disruption of natural vegetation cover has
an effect in biochemical cycles and put thousands of species in risk. Understanding all of the
anthropogenic alterations is the first step to acknowledge the degraded state of the Ecuadorian
Amazon rainforest. This section analyzes the types anthropogenic disturbance and its effect
in the evergreen rain forest.
3.7.1. Timber extraction
Commercial demand for wood puts pressure on Ecuadorian forests, this phenomenon
occurs in different areas of Ecuador, including the mountainous forest and the Amazon forest.
In Ecuador there are laws that control the felling of trees, these regulations detail the cutting
cycle, the preservation of trees for regeneration and minimum cutting diameter, however,
there is illegal logging of forests that occurs in an anti-technical manner and increases the
risk of fire, loss of endangered species and soil desertification. In Ecuador, the international
demand for wood is countless, and there is even such a selective demand for certain species
that are transported by helicopter. According to the Ministry of the Environment (MAE), in
the period 2011-2014, the extraction of 14´190,416 cubic meters of wood was approved, of
which 11.19% were extracted from native forests.

55
Figure 26 Timber extraction in the tropical rain forest
3.7.2. Infrastructure
Historically, the Amazon region has undergone a process of colonization, during the
beginning of oil exploitation in the late 1960s, a process of migration began from the most
central regions of the country to the Amazon, in those times the Amazon was a small
populated area. The construction of infrastructure such as cities, roads and agricultural
expansion has been increasing in these areas, which has had an excessive impact on the
tropical forests of Ecuador.
Roads and highways
The exploitation of oil generated the construction of infrastructure that would allow
the transportation of oil to the center of the country. These roads facilitated access to
previously inaccessible areas. Roads and highways facilitate the transport of wood,
agricultural and livestock products, which are generated by the change from forests to
agricultural areas. The pressure to access the jungle to extract wood, minerals or establish
agricultural or ranching ventures also leads to thousands of kilometers of unofficial routes.
Until a few years ago deforestation areas were located near rivers, which served as
transportation routes in the Amazon, however, this situation is changing, there is pressure in
the forests near the roads. "The loggers are responsible for the opening of roads, along with

56
the oil farms that open roads for explorations and wells. Those routes are then used by the
colonizers. " (Martino, 2007)
Figure 27 Roads
Human settlements
Internal migration to the Amazon area increased in the number of human settlements,
human expansion has generated growth in cities and new human settlements. The
construction of roads facilitates access and the construction of new villages. According to
INEC, there is a consolidated population of 438,944.00 inhabitants (59.33%), located in
41,244.07 km2 (35.20%) of the Amazon territory, and a dispersed population represented by
the eleven Amazonian indigenous nationalities that inhabit forming small communities in the
753,600 km2 (64.80%), with a population of 245,014 inhabitants.
Figure 28 Human settlements

57
3.7.3. Agricultural activity
In continental Ecuador, during the 2008-2014 period of the total areas that went from
forest (2008) to non-forest (2014), 65% of forest went to pasture, 12% to agricultural
mosaics, 4% to cocoa, 3% to hard corn, 3% to African palm, 2% to coffee, more than 10%
in other types of agricultural products; and finally, 1% of the deforested area went to
infrastructure and human settlements. (MAE, 2018) The transformation of primary forests to
areas of agricultural activity is frequent, beginning with the cutting of the primary forest, the
burning of residual material, the settlement of new crops, and then the abandonment of the
area. The abandonment of these areas can generate secondary forests, and in some cases soil
erosion. Livestock activity generates a greater economic return than agricultural activity, so
it is common to find grasslands instead of forests and crops.
Figure 29 Agriculture expansion
3.7.4. Oil extraction
In the late 1960s the oil extraction process began in the Ecuadorian Amazon, this
event led to an economic transformation of the country with profound environmental
consequences. Damage to the environment from oil spills, mismanagement of wastewater
and gas emissions from the oil extraction and transport process have generated an
environmental crisis, but oil activity has led the cutting of forests directly and indirectly.
According to the MAE: “Oil activity opens pathways that loggers take advantage of to extract
the most valuable species from the forest; they generally do so without any type of sustainable
forest management, nor minimum impact logging systems. This type of exploitation affects

58
the biodiversity and the composition of the forest, making the conversion of forest areas to
other uses, such as livestock, many times more feasible and less expensive.” (Ministerio de
Ambiente, 2016)
Figure 30 Oil extraction
3.7.5. Mining activity
Artisanal mining is called all those activities that are carried out by simple machinery
and that can be transported from one place to another, whose extraction methods are
rudimentary and little technified, where a larger part of the work requires intensive physical
activity from the workers, occurs in places without prior investigation, with poor security. In
general, artisanal or small-scale mining in the country is dedicated to obtaining gold in river
beds. Illegal or artisanal mining generates more impacts to the environment than large-scale
mining, among them is the felling of primary forests on the banks of the river, formations of
bodies of water that contain large amounts of arsenic, mercury and other toxic elements,
product of mining activities. These residual waters migrate towards the rivers by rain or by
filtration through the soil.
целей, таких как животноводство ". (Министерство окружающей среды, 2016
г.)
Рисунок 1 Нефтяная активность

59
3.7.6. Wildfires
Wildfires in tropical forests are difficult to imagine, however, they are a reality, the
selective cutting of trees leaves open spaces that are susceptible to fires especially in the dry
season. The solar energy together with the litter create a potential risk for a forest fire. In the
transformation of primary forests to cultivated areas, waste is burned in order to fertilize the
soil, this practice generates accidental fires in the Amazon. Unlike temperate forest fires,
tropical forest fires start near ground and spread horizontally consuming leaves and near-
ground matter. Once flames reach tall trees, the fire has spread by several kilometers. The
burning of forests generates the emission of CO2 into the atmosphere, the burning of one
million hectares of tropical forest caused the emission of more than 30 million tons of CO2.
That is, four times more CO2 than estimated in similar events worldwide.

60
Conclusion
Rainforests are indispensable for environmental services such as carbon capture, the
water cycle and the habitat of plants and animals, so their conservation is a priority for many
sectors of society. In recent decades, global warming and its effects in the short and long term
have launched a number of climate change mitigation projects, including the protection of
tropical forests. A number of projects have been stablished in Ecuador to reduce the
destruction of primary forests. Using remote sensing satellite tools, it is possible to
monitoring the state of forests resources and analyzed land cover transitions.
The NDVI method is highly effective for differentiated the anthropogenic disturbance
form healthy forest vegetation. This discrimination gave a perspective of the land cover
distribution of an area and allows to calculated the area with high amount of vegetation, with
prior knowledge of the study area this method can be used to calculated biomass and carbon
sequestration. In the study area it was concluded that net loss area of forests between 1996
and 2018 is 11290.59 hectares with a constant decrease in 2002 and 2013 but in 2018 there
was a partial recovery of forest cover with an increment of 6152.85 hectares (3.17%)
compared to 2013. This data may be the result of sustainable forest management projects as
Socio Bosques, although it is important to emphasize that the process of ecological
succession in the Amazon is relatively fast, where average productivity (1.1-5.7 Mg/ha/year)
and accumulation of litter (2.4-10.5 Mg/ha) (Celentano, 2011), this decrease may reflect the
dynamics of ecological continuity in this territory.
The matrix analysis shows that the land use change has as its main axis the human
alterations previously constructed such as roads, cities and agricultural land, the transitions
from forest to non-forest territory occur in the vicinity of these shared axes since 1996 until
the present. It is observed a slight contraction of human expansion in 2018 of 12.27%,
however, the general trend is an aggressive expansion of human activity, that it is gradually
spreading towards inaccessible areas with the construction of new roads and infrastructure.

61
In conclusion areas near to previously altered vegetation have more probability to be
subjected to change, specially roads and agriculture land.
With maximum likelihood classifier method, we observe the net loss of forest cover
in the period 1996-2018 is 12584.34 hectares and altered vegetation and bare land accounts
for 95% of the anthropogenic disturbance in the area of study. There is a main difference
between both methods, with MAXLIKE we observe an increase of forest cover in 2013 of
9691.11 hectares in relation with 2018, the NDVI method shows that the increase of forest
in 2018 and record the lowest amount of forest cover in 2013. The difference in the data can
be the result of the basis of each method, in another words, the NDVI use only one band for
the analysis, the values of the pixels are confine only at the reaction of the body in that
specific section of the electromagnetic spectrum, the MAXLIKE use three bands, this means
that are more information per pixel and the discrimination of structure depends of a
composition not only one band. The NDVI classification of a body with a degree of
chlorophyll could be classified as forest even though it is altered vegetation, in MAXLKE
there are more parameters that a pixel needs to archive to be part of a classification.
The results obtain with LCM shows a worrisome future for the Orellana province in
2060 altered vegetation will surpass forest areas in 24274.44 hectares, the area will loss
28.67% of forest in relationships with 2018 and in 2080 the loss of forest will reach 33.10%.
This means that at least 20% of the forest in Orellana is endanger of disappear or be modified,
the consequences of land use change will be reflected in loss of biodiversity, degradation of
soils, local and global clime change, increase of wildfires and changes in the biochemical
cycles. New policies and a structural change of the resource-based economy in Ecuador is
necessary to safeguard forest resources for future generations.
Using satellite imagery, it is possible to clearly determine the anthropogenic impact
on the study area, the oil industry is the main reason for the destruction of forests, for oil
production it is necessary to build roads to previously inaccessible areas, this contributes to

62
the colonization and expansion of agricultural, livestock farming, logging and other activities
on untouched territories. Human activity penetrates more and more into the heart of the
Amazon rainforest. The conversion of forests to agricultural land is an ongoing problem that
leads to desertification of the soil, forest fires and fragmentation of forests. This
fragmentation threatens the Amazonian fauna.

63
Bibliography
Corvalan Carlos , Hales Simon and McMichael Anthony ECOSYSTEMS AND HUMAN
WELL-BEING [Report]. - Frace : WHO Library Cataloguing-in-Publication Data, 2005.
Aber James S, Marzolff Irene and Johannes B. Ries Small-Format Aerial Photography
[Book]. - [s.l.] : Elsevier Science, 2010.
Alarcón Esther El Agua, un Don de la Vida para los Pueblos Indígenas [Report]. - La Paz :
COINCABOL, 2009.
Arias Estefanía and Robles Marco APROVECHAMIENTO DE RECURSOS
FORESTALES EN EL ECUADOR (PERIODO 2010) Y PROCESOS DE INFRACCIONES
Y DECOMISOS [Report]. - Quito : Ministerio de Ambiente, 2011.
Buis Alan The Atmosphere: Getting a Handle on Carbon Dioxide [Online] // Sizing Up
Humanity's Impacts on Earth's Changing Atmosphere: A Five-Part Series. - NASA's Jet
Propulsion Laboratory, October 9, 2019. - Febraury 12, 2020. -
https://climate.nasa.gov/news/2915/the-atmosphere-getting-a-handle-on-carbon-dioxide/.
CEDERENA Pago por servicios ambientales: La experiencia de la Asociación Nueva
América. [Report]. - Ibarra : CEDERENA & Interamerican Foundation, DFC-FAO. , 2002.
Celentano Danielle, Zahawi, Rakan A, Finegan, Bryan, Casanoves, Fernando, Ostertag,
Rebecca, Cole, Rebecca J, & Holl, Karen D. Restauración ecológica de bosques tropicales
en Costa Rica: efecto de varios modelos en la producción, acumulación y descomposición de
hojarasca [Report]. - San José : [s.n.], 2011.
Congalton Russell and Dodge Rebecca L. Meeting Environmental Challenges with Remote
Sensing Imagery [Book]. - Alexandria : American Geosciences Institute, 2013.
Cordero D. et al., PSA para la protección del recurso hidricos en el canton Cuenca
[Report]. - Quito : Empresa Pública Municipal de Telecomunicaciones, Agua Potable,
Alcantarillado y Saneamiento del cantón Cuenca (ETAPA), 2003.
Cuesta Francisco [et al.] Priority areas for biodiversity conservation in mainland Ecuador,
[Journal]. - [s.l.] : Neotropical Biodiversity, 2017. - 1 : Vol. 3.
Díaz García-Cervigón Juan José Estudio de Índices de vegetación a partir de imágenes
aéreas tomadas desde UAS/RPAS y aplicaciones de estos a la agricultura de precisión.
[Report]. - Madrid : [s.n.], 2015.
Eastman J. Ronald IDRISI Kilimanjaro Guide to GIS and Image Processing [Book]. -
Worcester : Clark Labs, 2003.
Eastman J.R. and Toledano J. Geomatic Approaches for Modeling Land Change Scenarios
[Book]. - [s.l.] : Springer, Cham, 2017.

64
Ecodecisión EVALUACIÓN DE IMPACTO DE LOS SERVICIOS AMBIENTALES EN
LAS CUENCAS EN ECUADOR Lecciones emergentes de Pimampiro y Cuenca [Report]. -
Quito : IIED, 2002.
EPA Inventory of U.S. Greenhouse Gas [Report]. - Washington : National Service Center
for Environmental Publications (NSCEP), 2014.
Freeland Joanna Molecular ecology / Joanna R. Freeland, Stephen Petersen, and Heather
Kirk [Report]. - Hobonken : Wiley-Blackwell, 2011.
GADMFO Plan de Desarrollo y Ordenamiento Territorial Municipal de Francisco de
Orellana, 2014-2019 [Report]. - Francisco de Orellana : [s.n.], 2015.
Gomez de la Torre, Sara & Anda Basabe, Susana & Bedoya, Eduardo. Procesos políticos
y estructurales de la deforestación en la Amazonía: el caso de Tena, Ecuador (2014)
[Journal]. - [s.l.] : Espacio y Desarrollo., 2017. - 29. - pp. 7-36.
Hernandez Rueda Generación Y Verificacion De Estadisticas Forestales En La Provincia
De Orellana Durante El Periodo 2009 Hasta Octubre Del 2010 [Report]. - Ibarra : UTN,
2012.
INEFAN & ITTO Estrategias para la Industria Sostenida de la Madera en Ecuador
[Report]. - Quito. : Proyecto PD 137/91, 1992.
INFORMES Ecuador es el país con la mayor tasa de deforestación de Latinoamérica en
comparación con su tamaño, incluso más que Brasil [Article] // EL UNIVERSO. - Quito : El
Universo, 2019. - Sunday edition.
INOCAR Información General de la República del Ecuador [Report]. - Guayaquil : [s.n.],
2012.
Krainer Anita and Mora María Fernanda Retos y amenazas en Yasuní [Book]. - Quito :
FLACSO, 2011.
MAE MAE promueve conservación y recuperación de bosques tropicales [Online] //
Ministerio del Ambiente. - 2018. - http://www.ambiente.gob.ec/mae-promueve-
conservacion-y-recuperacion-de-bosques-tropicales/#.
Mark L. Brusseau Ian L. Pepper and Charles P Environmental and Pollution Science
[Book]. - Tucson : Academic Press, 2019.
Martino Diego Deforestación en la Amazonía: principales factores de presión [Journal] //
Revista del Sur Nº 169. - 2007. - pp. 3-22.
McMichael A. J., Friel, S., Nyong, A., & Corvalan, C. Global environmental change and
health: impacts, inequalities, and the health sector. [Journal] // BMJ (Clinical research ed.),
336(7637),. - 2008. - pp. 191–194.
Ministerio de Ambiente del Ecuador Sistema de clasificación de los Ecosistemas del
Ecuador Continental [Report]. - Quito : [s.n.], 2012.

65
Ministerio de Ambiente Plan de Acción REDD+ r “Bosques para el Buen Vivir” (2016-
2025) [Report]. - Quito : [s.n.], 2016.
Ministerio del Ambiente del Ecuador Sistema de Clasificación de los Ecosistemas del
Ecuador Continental [Book]. - Quito : Subsecretaría de Patrimonio Natural, 2013.
Morgan Jessica L., Gergel Sarah and Coops Nicholas Aerial Photography: A Rapidly
Evolving Tool for Ecological Management [Journal] // BioScience. - 2010. - pp. 47-59.
Pourrut Pierre LOS CLiMAS DEL ECUADOR - FUNDAMENTOS EXPLICATIVOS
[Report]. - Quito : OR5TOM, 1983.
Redacción Medio Ambiente Los incendios en el Amazonas son más destructores que en
otras regiones [Article] // El Espectador . - Octubre 08, 2018.
Rhett A. Butler THE RAINFOREST [Online] // MONGABAY. - April 01, 2019. - May 02,
2020. - https://rainforests.mongabay.com/deforestation/2000/Ecuado.
Sohl Terry and Sleeter Benjamin Remote Sensing of Land Use and Land Cover: Principles
and Applications [Book]. - Boca Raton : Taylor and Francis CRC Press, 2012.
Vallejo María Crisitna [et al.] La iniciativa Yasuní - ITT: desde una perspectiva
multicriterial [Book]. - Quito : FLACSO, 2011.
WWF Clima e Incendios Forestales [Online] // Clima e Incendios Forestales. - 2015. -
http://awsassets.wwf.es.
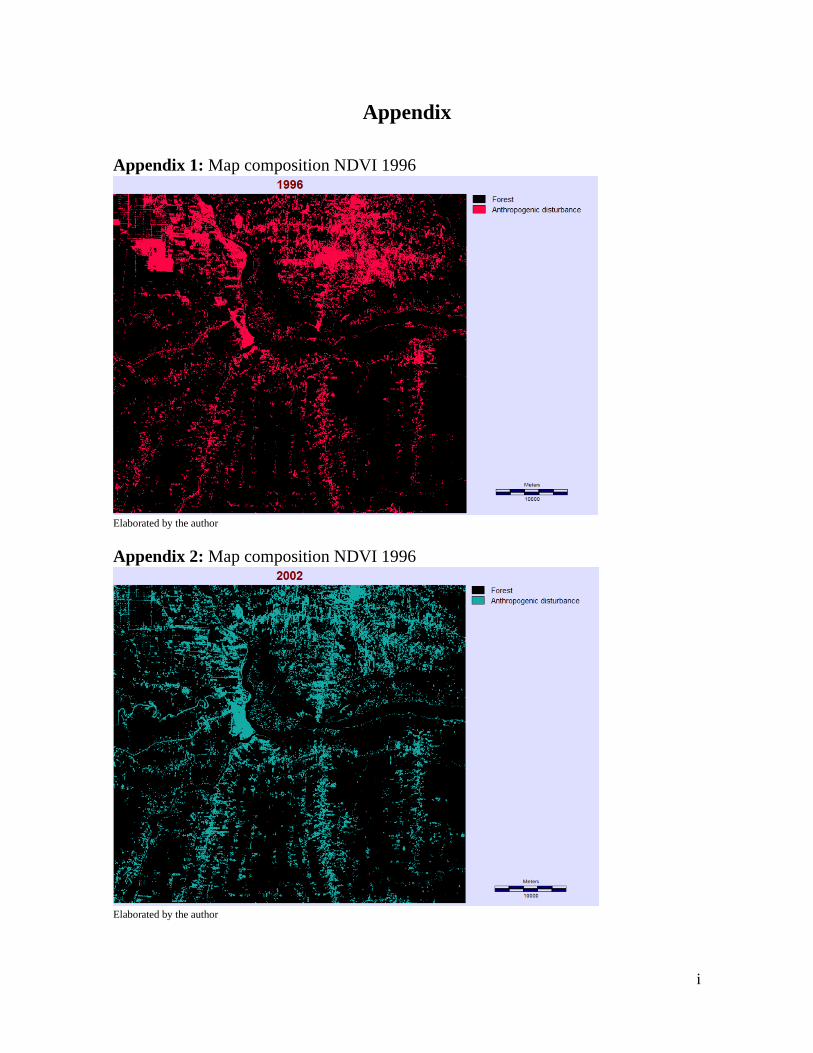
i
Appendix
Appendix 1: Map composition NDVI 1996
Elaborated by the author
Appendix 2: Map composition NDVI 1996
Elaborated by the author

ii
Appendix 3: Map composition NDVI 2013
Elaborated by the author
Appendix 4: Map composition NDVI 2018
Elaborated by the author

iii
Appendix 5: Map composition - land coverage dynamics 1996-2002
Elaborated by the author
Appendix 6: Map composition - land coverage dynamics 2002-2013
Elaborated by the author

iv
Appendix 7: Map composition - land coverage dynamics 2013-2018
Elaborated by the author
Appendix 8: Maximum likelihood classification 1996
Elaborated by the author

v
Appendix 9: Maximum likelihood classification 2002
Elaborated by the author
Appendix 10: Maximum likelihood classification 2013
Elaborated by the author

vi
Appendix 11: Maximum likelihood classification 2018
Elaborated by the author
Appendix 12: Change from 1996 to 2018
Elaborated by the author
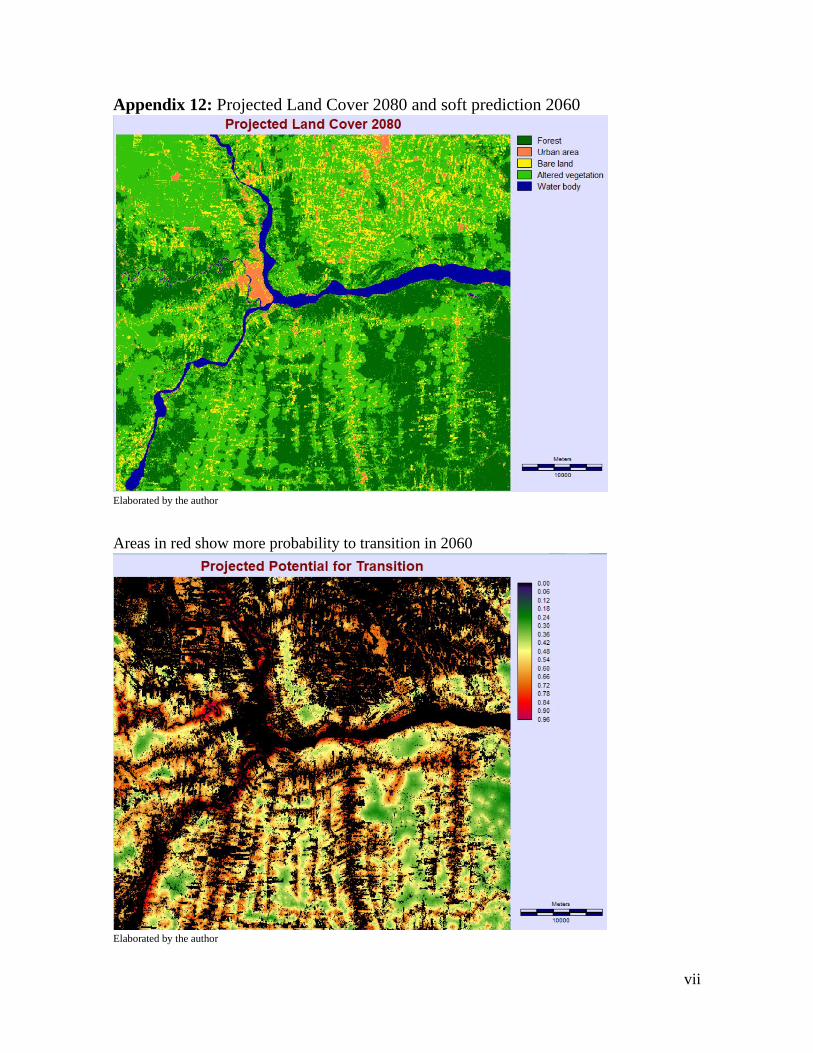
vii
Appendix 12: Projected Land Cover 2080 and soft prediction 2060
Elaborated by the author
Areas in red show more probability to transition in 2060
Elaborated by the author

viii
Appendix 13: Land Change Modeler MLP Model Results

ix
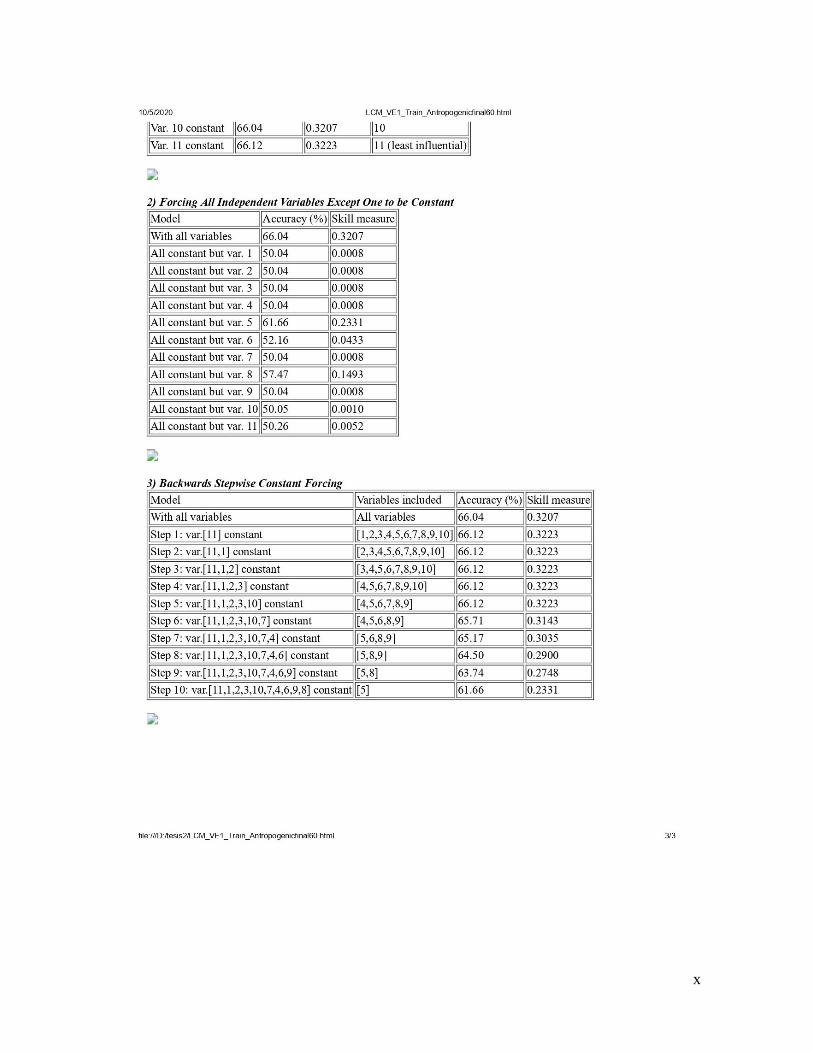
x