development of the geomorphological map for … of the geomorphological map for sagamore hill...
TRANSCRIPT

Development of the Geomorphological Map for Sagamore Hill National Historic Site Principal Characteristics and Components Natural Resource Report NPS/NRSS/GRD/NRR—2016/1348
National Park Service U.S. Department of the Interior
Natural Resource Stewardship and Science

ON THE COVER Aerial view of Sagamore Hill National Historic Site (white line is boundary) on the Cove Neck Peninsula; April 2007 image available from the New York State GIS Clearinghouse.
Development of the Geomorphological Map for Sagamore Hill National Historic Site Principal Characteristics and Components Natural Resource Report NPS/NRSS/GRD/NRR—2016/1348
Norbert P. Psuty, Jacob McDermott, William Hudacek, John Gagnon, Michael Towle, William Robertson, Andrea Spahn, Monica Patel, and William Schmelz Sandy Hook Cooperative Research Programs New Jersey Agricultural Experiment Station Rutgers University 74 Magruder Road Highlands, New Jersey 07732
December 2016 U.S. Department of the Interior National Park Service Natural Resource Stewardship and Science Fort Collins, Colorado
ii
The National Park Service, Natural Resource Stewardship and Science office in Fort Collins, Colorado, publishes a range of reports that address natural resource topics. These reports are of interest and applicability to a broad audience in the National Park Service and others in natural resource management, including scientists, conservation and environmental constituencies, and the public.
The Natural Resource Report Series is used to disseminate comprehensive information and analysis about natural resources and related topics concerning lands managed by the National Park Service. The series supports the advancement of science, informed decision-making, and the achievement of the National Park Service mission. The series also provides a forum for presenting more lengthy results that may not be accepted by publications with page limitations.
All manuscripts in the series receive the appropriate level of peer review to ensure that the information is scientifically credible, technically accurate, appropriately written for the intended audience, and designed and published in a professional manner.
This report received informal peer review by subject-matter experts who were not directly involved in the collection, analysis, or reporting of the data. Data in this report were collected and analyzed using methods based on established, peer-reviewed protocols and were analyzed and interpreted within the guidelines of the protocols.
Views, statements, findings, conclusions, recommendations, and data in this report do not necessarily reflect views and policies of the National Park Service, U.S. Department of the Interior. Mention of trade names or commercial products does not constitute endorsement or recommendation for use by the U.S. Government.
This report is available in digital format from the Geologic Resources Inventory program (http://go.nps.gov/gripubs), and the Natural Resource Publications Management website (http://www.nature.nps.gov/publications/nrpm/). To receive this report in a format optimized for screen readers, please email [email protected].
Please cite this publication as:
Psuty, N. P, J. McDermott, W. Hudacek, J. Gagnon, M. Towle, W. Robertson, A. Spahn, M. Patel, and W. Schmelz. 2016. Development of the geomorphological map for Sagamore Hill National Historic Site: Principal characteristics and components. Natural Resource Report NPS/NRSS/GRD/NRR—2016/1348. National Park Service, Fort Collins, Colorado.
NPS 419/135484, December 2016

iii
Contents Page
Figures.................................................................................................................................................... v
Tables ..................................................................................................................................................... v
Executive Summary .............................................................................................................................. vi
Acknowledgements ............................................................................................................................... vi
Background ............................................................................................................................................ 1
Site and Situation ................................................................................................................................... 1
Resources ............................................................................................................................................... 4
Orthophotography........................................................................................................................... 4
LiDAR ............................................................................................................................................ 4
Additional sources .......................................................................................................................... 5
Methodology of Topography Development ........................................................................................... 6
Legend: Categories and Symbolization of Geomorphological Features .............................................. 12
Glacial Features ............................................................................................................................ 12
Planar Ground Moraine ........................................................................................................... 12
Kettle ....................................................................................................................................... 12
Kame ....................................................................................................................................... 12
Fluvial/Colluvial Features ............................................................................................................ 12
Dissected Ground Moraine ...................................................................................................... 12
Fluvial/Colluvial Deposits ....................................................................................................... 12
Intermittent stream................................................................................................................... 12
Coastal Features............................................................................................................................ 13
Beach ....................................................................................................................................... 13
Coastal Scarp/Bluff ................................................................................................................. 13
Wetland ................................................................................................................................... 13
Spit Features ............................................................................................................................ 13
Anthropogenic Features................................................................................................................ 14
Artificial Fill ............................................................................................................................ 14
Buildings ................................................................................................................................. 14

iv
Roads and Parking Lots ........................................................................................................... 14
Trails ........................................................................................................................................ 14
Other Features .............................................................................................................................. 14
Spot Elevation ......................................................................................................................... 14
SAHI Boundary ....................................................................................................................... 14
Literature Cited .................................................................................................................................... 15
Topo Sheets .................................................................................................................................. 16

v
Figures Page
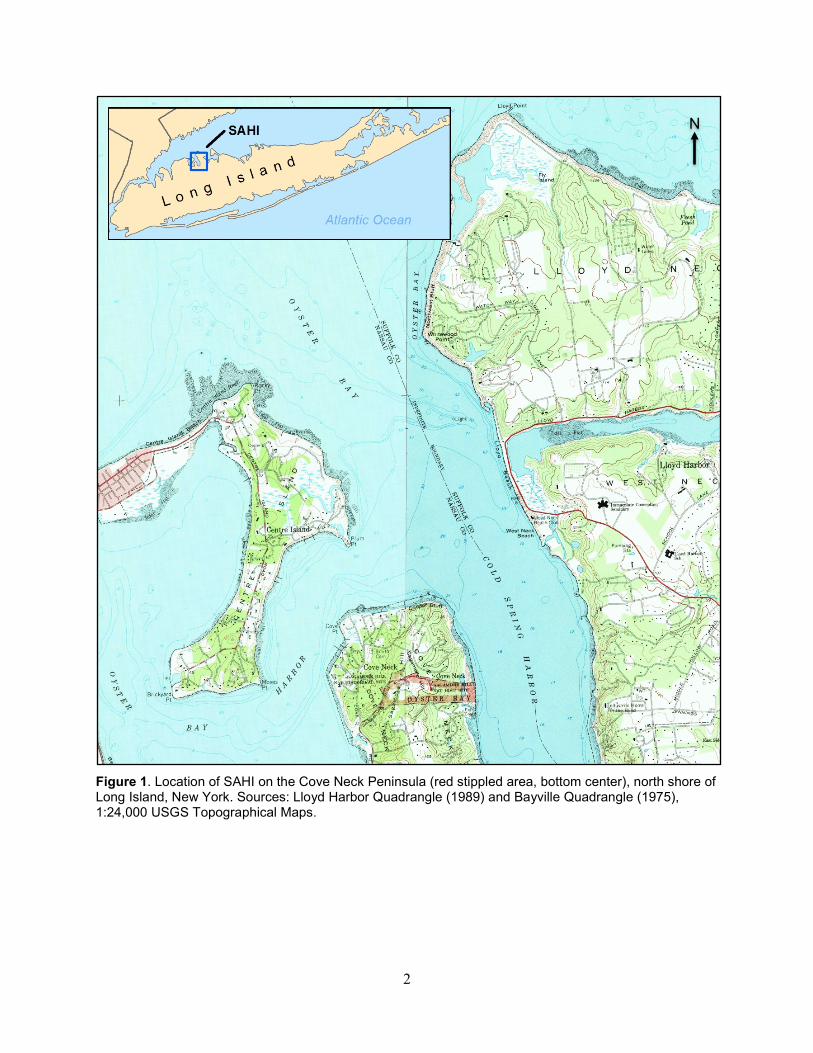
Figure 1. Location of SAHI on the Cove Neck Peninsula (red stippled area, bottom center), north shore of Long Island, New York. Sources: Lloyd Harbor Quadrangle (1989) and Bayville Quadrangle (1975), 1:24,000 USGS Topographical Maps. .................................. 2
Figure 2. Location of SAHI, outlined with red stipple, on the Cove Neck Peninsula, NY. Sources: Lloyd Harbor Quadrangle (1989) and Bayville Quadrangle (1975), 1:24,000 USGS Topographical Maps. .................................................................................................................. 3
Figure 3. Orthophoto of Sagamore Hill site, April 2007, available from the New York State GIS Clearinghouse. ....................................................................................................................... 4
Figure 4. Surface elevation image created from processed bare earth LiDAR data of the SAHI area. .............................................................................................................................................. 5
Figure 5. Surface elevation image in hillshade mode created from processed bare earth LiDAR data of the SAHI area. ............................................................................................................... 7
Figure 6. Distribution of geomorphological features, Sagamore Hill NHS. ......................................... 9
Figure 7. Distribution of geomorphological features, with hillshade effect added to emphasize slopes, Sagamore Hill NHS................................................................................................ 10
Tables Page
Table 1. Sources and quality of spatial data .......................................................................................... 5
vi
Executive Summary This report incorporates the geomorphological map, its philosophical underpinnings, legend descriptions, and the GIS data layers for the Sagamore Hill National Historic Site, Oyster Bay, New York. The theme of the map follows the current scientific organization of geomorphological mapping that includes morphometrics, causative processes, and evolutionary stages. Surface form was interpreted from data sets including recent orthophotos, recent Light Detection and Ranging (LiDAR) data sets, augmented with spatial information on soils and vegetation, and several field visits.
The geomorphological features of the site include: 1) topography that was created during the last glaciation; 2) features created by the subsequent modification produced by surface erosion of the ground moraine by surface flow and mass-movement; and 3) coastal forms created by the ambient waves and currents interacting with the margin of the ground moraine to create both erosional and depositional landforms. The geomorphological map and its legend portray the spatial association of these stages of landscape development. The cultural features of SAHI are added to the final map product.
The geomorphological map is viewable as a full compilation of all of the data layers as well as user specified combinations of the data. Each of the map layers contained in this report meets the standards of Federal Geographic Data Committee (FGDC) compliant metadata. The full set of organized data layers is available from the National Park Service, Geologic Resources Division, PO Box 25287, Denver, Colorado, 80225 or via the Geologic Resources Inventory publications page http://go.nps.gov/gripubs (accessed 22 November 2016).
Acknowledgements We would like to thank the following individuals who significantly contributed to the production, review, and publication of this report. Bruce Heise of the Geological Resources Division of the NPS Natural Resource Stewardship and Science Directorate provided direction in defining the final product of the Sagamore Hill Geomorphological Map. Jason Kenworthy, NPS Geologic Resources Division, guided the review and publication of this manuscript. Courtney Schupp and Charlie Finkl contributed thoughtful comments that helped improve it. We are very appreciative of these contributions.

1
Background Sagamore Hill National Historic Site (SAHI) is one of 270 National Park System units designated to have a digital geological map and an accompanying geological resources inventory report. These products are intended to provide a valuable synthesis of the physical makeup of the site and assist in applying appropriate strategies in the management of its natural and cultural resources. Under the sponsorship of the NPS Geological Resources Division, a scoping meeting was held at the Sagamore Hill NHS on June 23, 2010 to discuss and identify the geological character and variety of resources extant at the site, and to provide direction to the compilation of the geological map. The product of the scoping meeting was a document that identified themes of interest to the managers of the site, sources of data appropriate to the mapping effort, potential geomorphological features, and considerations for inclusion (Thornberry-Ehrlich 2011).
The traditional geological map incorporates many rock formations that extend across time horizons and shows considerable structural control of the surface configuration. However, the relatively small size of SAHI and the existence of only limited sedimentary formations caused a restructuring of the map to focus on the geomorphological character of the site, the configuration of the surface forms. Hence, SAHI is being represented by the elements of a geomorphological map.
The concept of a geomorphological map traces its origins to Passarge (1914) and his representation of the surface character of the Stadtremba, Germany quadrangle that emphasized the presence of river terraces as specific physical features. Subsequent portrayals of the geomorphological character of the earth surface incorporated elements of the morphology as well as the origins of the features (processes) and chronological development (St. Onge 1968). The modern geomorphological map incorporates the elements of form, functional processes, and sequential development to depict the evolution of surficial and spatial characteristics (Dramis et al. 2011). The geomorphological map presented in this report follows the three-fold communication of form in the landscape, developmental processes, and stages in spatial evolution. It has a temporal sequence of features that is related to the stages of development of the surface characteristics. It addresses the action of the earth-forming processes on the deposition, mobilization, and subsequent accumulation of sediments to produce the resulting geomorphological characteristics at SAHI.
Site and Situation Sagamore Hill National Historic Site is located on the north shore of Long Island, in Nassau County, and it is represented on the USGS 1:24,000 topographical sheets of Bayville, NY and Lloyd Harbor, NY (Figure 1). The Historic Site occupies a portion of the Cove Neck peninsula, lying between Oyster Bay and Cold Spring Harbor (Figure 2). The Historic Site has a rectilinear shape, with a north-south width of about 300 m and an east-west length of about 1300 m, incorporating an area of 33.6 hectares (83 acres) and extends to the shoreline at Cold Spring Harbor.
2
Figure 1. Location of SAHI on the Cove Neck Peninsula (red stippled area, bottom center), north shore of Long Island, New York. Sources: Lloyd Harbor Quadrangle (1989) and Bayville Quadrangle (1975), 1:24,000 USGS Topographical Maps.
N

3
Figure 2. Location of SAHI, outlined with red stipple, on the Cove Neck Peninsula, NY. Sources: Lloyd Harbor Quadrangle (1989) and Bayville Quadrangle (1975), 1:24,000 USGS Topographical Maps.
N
4
Resources A geographic information system (GIS) was developed for the construction of the geomorphological map of SAHI. The GIS includes orthophotography, light detection and ranging (LiDAR) data sets, and additional vector files that are described below. The primary sources of surface information consisted of recent orthophotos and recent LiDAR coverage.
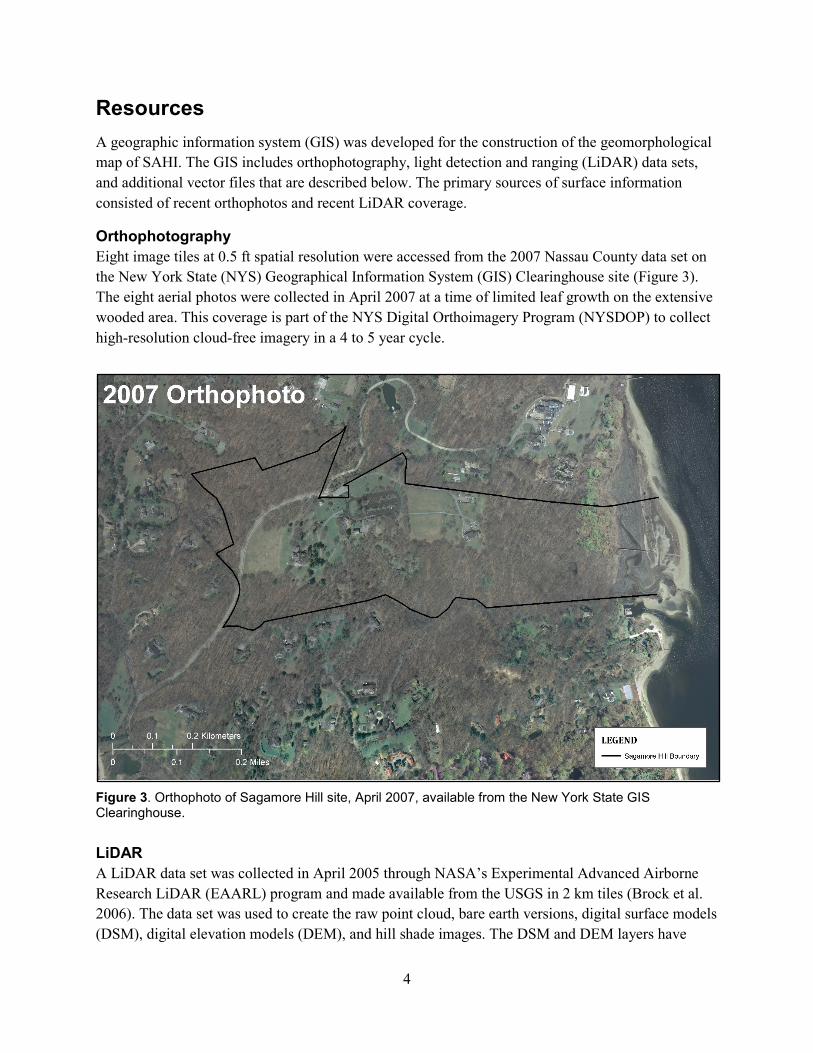
Orthophotography Eight image tiles at 0.5 ft spatial resolution were accessed from the 2007 Nassau County data set on the New York State (NYS) Geographical Information System (GIS) Clearinghouse site (Figure 3). The eight aerial photos were collected in April 2007 at a time of limited leaf growth on the extensive wooded area. This coverage is part of the NYS Digital Orthoimagery Program (NYSDOP) to collect high-resolution cloud-free imagery in a 4 to 5 year cycle.
Figure 3. Orthophoto of Sagamore Hill site, April 2007, available from the New York State GIS Clearinghouse.
LiDAR A LiDAR data set was collected in April 2005 through NASA’s Experimental Advanced Airborne Research LiDAR (EAARL) program and made available from the USGS in 2 km tiles (Brock et al. 2006). The data set was used to create the raw point cloud, bare earth versions, digital surface models (DSM), digital elevation models (DEM), and hill shade images. The DSM and DEM layers have

5
surface elevation values in raster format at 1 ft resolution. A DEM created from the bare earth LiDAR data provided categories of elevation of the site (Figure 4).
Figure 4. Surface elevation image created from processed bare earth LiDAR data of the SAHI area.
Additional sources Other contributors of spatially-organized data (see Table 1) Include a soils map (NPS 2009) as well as a vegetation map (Sams O’Neill 2008) and report (Edinger et al. 2008) from the NPS IRMA site, and several geological reports (NPS 2010; Bennington 2003). Locations of buildings, infrastructure, and boundaries were accessed from the NPS IRMA website (Sams O’Neill 2008). Intermittent streams and some roads were digitized from the orthophotos.
Table 1. Sources and quality of spatial data
Data Year Resolution File Type Source Orthophotos 2007 0.5 ft .jp2 NYS GIS Clearinghouse
DEM & DSM 2005 1 ft .img USGS LIDAR Data Request CD-Rom
Hill shade 2005 1 ft .img USGS LIDAR Data Request CD-Rom
Soils Map 2009 - .shp National Park Service
Vegetation 2008 - .shp National Park Service
Buildings 2007 - .shp National Park Service
Road 2007 - .shp IRMA NPS and digitized from orthophoto
Stream 2007 - .shp Digitized from orthophoto

6
Methodology of Topography Development The initial approach of landform identification focused on the bare earth and first-return LiDAR data sets for Sagamore Hill National Historic Site provided by the U.S. Geological Survey (USGS). However, the USGS bare earth digital elevation model (DEM) exhibited several artifacts in the data portrayal. In order to soften these surface perturbations, the raw USGS data points were processed using the Kriging method via Airborne LiDAR Data Processing and Analysis Tools (ALDPAT) to create a new bare earth digital elevation model. The subsequent DEM layer was used to generate two-foot contours using Arc GIS spatial analyst tools. The combination of contour lines and DEM layers allowed for visualization of elevation ranges and slopes to depict the topographical character of the site (Figure 4). Further, a hillshade layer was applied to the DEM to emphasize the slopes and relative relief (Figure 5). Identifying the edges and changes in slope aided in mapping the surface of the ground moraine. Looking for local irregularities were key in identifying the kettles and kames. The contour lines and hillshade provided the topographical surface discontinuity and relief to map slope features, such as valley walls, small drainage basins, and low-lying coastal features. In conjunction with these topographical units, photo-interpretation aided in manually digitizing the geomorphological features of Sagamore Hill. Photo-interpretation required knowledge of glacial, fluvial, and coastal features, as well as knowledge of the study area developed though site visits and review of orthophotos. Orthophotos and the DEMs established the slope units of the topography, and provided the reference tools for subsequent landform identification in the field. Field visits were especially important in verifying the topographies in the areas of dense vegetation (some artifacts in the LiDAR data sets) and in the low relief areas of the coastal unit. The establishment of the topographical features and the juxtaposition of the units led to the creation of the geomorphological map that is based on the geomorphological evolution of the area.

7
Figure 5. Surface elevation image in hillshade mode created from processed bare earth LiDAR data of the SAHI area.

8
Geomorphological Evolution The conceptual approach to describing, depicting, and mapping the geomorphological characteristics of the site is based on the components of morphometrics, causative processes, and temporal sequence of development of the surface. This tripartite organization is the essence of modern geomorphological maps (Dramis et al. 2011) that combine the processes and the surface expression of the sedimentary formations (either in their erosional or depositional form). The legend (discussed later) is developed to track the evolution of the surface features and their associated causative processes, and to add the cultural imprint on the landscape.
The surface topography of SAHI (Figure 6 without hillshade, Figure 7 with hillshade) represents several stages of sediment accumulation, sediment erosion, and sediment transport by a variety of formational processes over the span of the last 16,000 years, or so. SAHI lies to the north of a Wisconsinan recessional end moraine that was formed about 18,000 years BP (before present) during the last major advance of Quaternary glaciation. The general topography is composed of a ground moraine surface that forms the Cove Neck peninsula. The topographical expression of the ground moraine at SAHI is an elevated quasi-planar landscape with a high elevation of 54 m toward the west and sloping to about 32 m at its eastern margin. This surface has a number of kettle holes (locations of melted ice blocks) of varying dimensions and a kame-like knoll at the site of the Sagamore Hill manor house. The ground moraine surface is being actively eroded by surface flow along its margins. There are two intermittent streams that drain to the southwest and northwest and have created narrow valleys extending headward. The southern margin of the ground moraine plain is more strongly dissected by headward extension of a drainage basin that incorporates very steep slopes. Another drainage system at the northeastern margin is also eroding headward and creating very steep erosional slopes. These slopes are sites of colluvial processes and mass-movement. A very large depression at the eastern extent of the glacial moraine is probably a combination of a kettle hole (melted ice block) and colluvial processes because the general depression has a number of minor elongate channels converging on the center.

9
Figure 6. Distribution of geomorphological features, Sagamore Hill NHS.
The eroding edge of the ground moraine contributed sediment through a combination of fluvial and colluvial processes that eventually produced an accumulation and built a type of flood plain in the valleys. The position of the alluvial stream bottom topography is probably related to the general period of near stability of sea-level achieved about 3,000 years ago. That is, because the stream gradient was reduced in this more-recent time period, sedimentation was a more likely product in the lower reaches of the drainage basin supporting the production of features of accumulation. The extreme eastern margin of the ground moraine has a very steep erosional surface, a cliff or bluff. This was created when the rising sea level reached this location and wave action out of the north-northeast was able to interact with this site and consequently erode the margin to produce a cliffed surface. Subsequently, the exposure of the low cliff to the ambient waves was terminated as a spit extended southward from the adjacent headland and shielded the cliff from further wave attack.

10
Figure 7. Distribution of geomorphological features, with hillshade effect added to emphasize slopes, Sagamore Hill NHS.
Waves and currents out of the north eroded portions of the exposed ground moraine updrift of SAHI and transported sand and gravel southerly to build an extending spit to eventually shield the cliff and allow sediments to accumulate inland of the spit. The southerly growth of the spit had at least two episodes of development indicated by both an inactive interior gravelly foredune ridge as well as an active gravelly foredune ridge. The active ridge is immediately adjacent to the bare sand/pebble beach. The ridge is vegetated and consists of an admixture of sand, pebbles, and gravel. It has an elevation about 0.5 m higher that the highest part of the unvegetated beach. The active ridge has an elevation of about 1.5–2.5 m. Inland of the active ridge is an inactive gravelly ridge, separated by a swale that is near the elevation of high tide. The inactive gravelly ridge is a former foredune feature associated with an earlier shoreline position. It was stranded as an episode of accretion widened the spit and caused a new foredune position to develop. The active beach is continuing to extend the spit southward. A narrow saltmarsh exists between the position of the spit and the former cliff. Some tidal action is interacting with the coastal sediment transport to create a small tidal delta at the southern terminus of the spit where the salt marsh creek connects with Cold Spring Harbor. The mouth of the creek is currently prevented from shifting to the south by a human-created barrier that

11
extends along the SAHI boundary from the glacial ground moraine to the position of the mouth. Salt water apparently does not penetrate into the stream valleys. Freshwater vegetation (Typha spp.) is immediately adjacent to the salt marsh.

12
Legend: Categories and Symbolization of Geomorphological Features The legend is organized relative to the geomorphological evolution of the site, incorporating the sequence of glacial, colluvial/fluvial, and coastal landform development. Anthropogenic features are superposed on the geomorphology.
Glacial Features Planar Ground Moraine – the oldest and generally highest portion of the site, depicted as a broad, high surface derived from DEM and contours produced by the LiDAR data set; it is coincident with a sandy soils series on the soils map. It is a relatively flat surface composed of ground moraine associated with the Harbor Hill recessional stage. The surface slopes down gently from west to east.
Kettle – these are depressions or topographical lows within the ground moraine; they represent portions of the ground moraine that incorporated blocks of ice that later melted and caused the formation of isolated depressions in the gently-undulating surface. They are identified primarily by the elevation and steeply-sloped, enclosed depressions visible in the LiDAR data. A large depression on the eastern margin of the ground moraine may be a coalescing of several kettles.
Kame – a glacial deposit that creates a localized high ground, a hill, on the general ground moraine surface, identified on the LiDAR image as a small hill rising above the general elevation of the planar ground moraine. A series of closed contours identifies its extent. This feature forms the highest portion of the Sagamore Hill site.
Fluvial/Colluvial Features Dissected Ground Moraine – the margins of the planar ground moraine are locations of steep slopes that sharply alter the elevation of the general surface. Headward erosion by small intermittent streams has produced a dissected edge that is more abrupt on the southern and eastern margins than on the western side. The margins are delineated using the LiDAR slope calculations and the soils maps that include slope as a basis for soil type. The large kettle feature on the eastern flank of the planar ground moraine has a series of small drainage channels leading to a central depression. Colluvial processes, overland flow, and channelized flow have and are actively dissecting the margins of the glacial ground moraine.
Fluvial/Colluvial Deposits – Sediment has accumulated at the base of the steep slopes to create a planar surface that is the product of the erosional processes mobilizing the margins of the glacial moraine. These deposits create an alluvial plain at the bottom of the stream valleys etched into the planar ground moraine. They are identified as a change in slope (steeper to less steep) to produce a relatively-flat, low-lying surface on the LiDAR image and as a bottomland soil on the soils map.
Intermittent stream – A trace of the channel in the dissected topography leading from the margin of the ground moraine to the present sea level.
13
Coastal Features Beach – The surface expression of the beach is a free sand surface that slopes seaward into the water, it extends from water level to a few decimeters above high tide. It is free of vegetation. It is identified as the bare sand unit adjacent to the water on the orthophotography. It has a series of small projections and embayments in the shoreline that are related to pulses of sedimentation and erosion that progress from north to south along the spit face.
Coastal Scarp/Bluff – At some stage in the evolution of this area, waves and currents reached the eastern margin of the ground moraine and eroded this location to create a steeply-sloping scarp or bluff, essentially truncating the ground moraine topography. From both a process perspective and feature perspective, a new round of geomorphological development ensued that represented the mobilization of glacial deposits and the production of features created by the ambient waves and currents. This feature is a sharp termination of the planar ground moraine, a steeply-sloping margin of the LiDAR elevation model, and a change of soil type.
Wetland – A salt marsh lies immediately inland of the spit and seaward of the several alluviated stream valleys. The salt marsh is adapted to the present sea level position. Its distribution is well displayed on the orthoimagery.
Spit Features – Sediment transported southerly beyond a small headland created a spit that eventually shielded the erosional bluff from the ambient waves and currents. Episodic accumulation widened and heightened the spit to eventually create a feature that incorporated a beach and two ridge forms and displaced the local drainage to the southern terminus of the spit. Inland and seaward margins of the spit are identified on the orthoimagery. The topography of the spit is composed of the two gravelly ridges, an intervening swale, and the active beach.
Active Gravelly Ridge – Immediately inland of the beach is the ridge/foredune that is vegetated and has an admixture of fine sand incorporated with the coarser beach sediments. The active gravelly ridge extends along the length of the spit, immediately inland from the active beach. The active gravelly ridge has an elevation on the order of 2 m above NAVD88. The feature is identified on the orthophotography as the transition from bare sand to some vegetation inland from the beach.
Inactive Gravelly Ridge – Along most of the spit, an older ridge/foredune feature is present. It represents a former shoreline position and a stage in the evolution of the spit. It has similar height and breadth dimensions as the active gravelly ridge. It is vegetated and extends along the inland margin of the spit. It is a linear vegetated feature on the orthophotography, and apparent in the field visit.
Inter-ridge Swale – A topographical low separates the active and the inactive gravelly ridges. The swale is broader near the distal end of the spit and decreases in width toward the north. It is on the order of 0.5 m lower than the ridges. The linear characteristic is identifiable on the orthophotography, and is observed in the field.

14
Anthropogenic Features Artificial Fill – Sediment manipulation near the shoreline, at the southern boundary of SAHI, has created a ridge of about 3 m elevation that has limited the migration of the tidal creek lying inland of the spit. The fill is part of the dredge spoil emanating from the creation of the boat basin south of SAHI. It is a higher elevation visible on the LiDAR and identifiable on the orthoimagery.
Buildings – Locations derived from the NPS data layer.
Roads and Parking Lots – Locations derived from the NPS data layer.
Trails – Unpaved walking trails derived from the orthophotos.
Other Features Spot Elevation – These are points on several of the major landform surfaces to provide relative elevation and slopes. Elevations are derived from the LiDAR DEMs and expressed in meters relative to NAVD88.
SAHI Boundary – Derived from the NPS data layer.

15
Literature Cited Bennington, J. B. 2003. New Observations on the Glacial Geomorphology of Long Island from a
Digital Elevation Model (DEM). Long Island Geologists Conference, Stony Brook, NY, April, pp. 1-12,
Brock, J. C., C. W. Wright, M. Patterson, A. Nayegandhi, and L. J. Travers. 2006. USGS-NPS-NASA Bare Earth Topography-Sagamore Hill National Historic Site. U. S. Geological Survey Open File Report 2007-1394 (on CD). https://pubs.usgs.gov/of/2007/1394/
Dramis, F., D. Guida, and A. Cestari, 2011. Nature and Aims of Geomorphological Mapping. Pages 39-73 in Smith, M.J., P. Paron, and J. S. Griffiths (eds.). Geomorphological Mapping: Methods and Applications. Elsevier: Amsterdam.
Edinger, G. J., A. L. Feldmann, T. G. Howard, J. J. Schmid, E. Eastman, E. Largay, and L. A. Sneddon. 2008. Vegetation Classification and Mapping at Sagamore Hill National Historic Site, New York. Technical Report NPS/NER/NRTR—2008/124. National Park Service, Philadelphia, PA. https://irma.nps.gov/DataStore/Reference/Profile/2168916.
Lubke, E. R. 1964. Hydrogeology of the Huntington-Smithtown area, Suffolk County, New York. U.S. Geological Survey Water-Supply Paper 1669-D, 68 p. https://pubs.er.usgs.gov/publication/wsp1669D.
National Park Service. 2009. SRI - Soil Survey Geographic (SSURGO) for Sagamore Hill National Historic Site, New York. National Park Service Inventory & Monitoring Program, Fort Collins, CO. Project-1048972. https://irma.nps.gov/DataStore/Reference/Profile/1048972.
National Park Service. 2010. Sagamore Hill National Historic Site: Ancillary Map Information Document. Geologic Resources Inventory Program, Denver, CO, 27 p.
Passarge, S. 1914. Morphologischer Atlas. Lieferung I: Morphologie des Messtiscb lattes Stadtremda. Mittelungen der Geographischen Gesellschaft, Hamburg, 28.
Sams O’Neill, C. 2008. Sagamore Hill NHS Vegetation. Northeast Regional Office of the National Parks Service. Geospatial Dataset-1047040. https://irma.nps.gov/DataStore/Reference/Profile/1047040.
Sams O’Neill, C. 2008. Sagamore Hill NHS Buildings and Structures. Northeast Regional Office of the National Parks Service. Geospatial Dataset-1047041. https://irma.nps.gov/DataStore/Reference/Profile/1047041.
Sams O’Neill, C. 2008. Sagamore Hill NHS Circulation (Polygons). Northeast Regional Office of the National Parks Service. Geospatial Dataset-1047032. https://irma.nps.gov/DataStore/Reference/Profile/1047032.

16
St. Onge, D. A., 1968. Geomorphic Maps. Pages 388-403 in Fairbridge, R. W.( ed.). The Encyclopedia of Geomorphology. Reinhold Book Corporation: New York.
Thornberry-Ehrlich, T. L., 2011. Geologic Resources Inventory Scoping Summary: Sagamore Hill National Historic Site. Geologic Resources Division, National Park Service, Denver CO, 16 p. http://go.nps.gov/gripubs.
Topo Sheets U.S. Geological Survey. 1989. Lloyd Harbor Quadrangle, New York –Connecticut [map]. 1:24,000.
7.5 Minute Series. United States Department of the Interior, USGS, Reston, VA.
U.S. Geological Survey. 1975. Bayville Quadrangle, New York –Connecticut [map]. 1:24,000. 7.5 Minute Series. United States Department of the Interior, USGS, Reston, VA.

The Department of the Interior protects and manages the nation’s natural resources and cultural heritage; provides scientific and other information about those resources; and honors its special responsibilities to American Indians, Alaska Natives, and affiliated Island Communities. NPS 419/135484, December 2016

National Park Service U.S. Department of the Interior
Natural Resource Stewardship and Science 1201 Oakridge Drive, Suite 150 Fort Collins, CO 80525 www.nature.nps.gov
EXPERIENCE YOUR AMERICA TM