development of oral delivery systems for targeted gastro
TRANSCRIPT

This document is downloaded from DR‑NTU (https://dr.ntu.edu.sg)Nanyang Technological University, Singapore.
Development of oral delivery systems for targetedgastro intestinal tract delivery of nutraceuticalsusing food grade polymers
Sampathkumar Kaarunya
2018
Sampathkumar Kaarunya. (2018). Development of oral delivery systems for targeted gastrointestinal tract delivery of nutraceuticals using food grade polymers. Doctoral thesis,Nanyang Technological University, Singapore.
https://hdl.handle.net/10356/102665
https://doi.org/10.32657/10220/47831
Downloaded on 20 Feb 2022 22:09:43 SGT

DEVELOPMENT OF ORAL DELIVERY SYSTEMS FOR
TARGETED GASTRO INTESTINAL TRACT DELIVERY
OF NUTRACEUTICALS USING FOOD GRADE
POLYMERS
SAMPATHKUMAR KAARUNYA
SCHOOL OF MATERIALS SCIENCE AND ENGINEERING
2018


DEVELOPMENT OF ORAL DELIVERY SYSTEMS FOR
TARGETED GASTRO INTESTINAL TRACT DELIVERY
OF NUTRACEUTICALS USING FOOD GRADE
POLYMERS
SAMPATHKUMAR KAARUNYA
SCHOOL OF MATERIALS SCIENCE AND ENGINEERING
A thesis submitted to the Nanyang Technological University
in partial fulfilment of the requirement for the degree of
Doctor of Philosophy
2018


Statement of Originality
I hereby certify that the work embodied in this thesis is the result of original
research and has not been submitted for a higher degree to any other University or
Institution.
04/03/2019
Date Sampathkumar Kaarunya


Supervisor Declaration Statement
I have reviewed the content and presentation style of this thesis and declare it is free
of plagiarism and of sufficient grammatical clarity to be examined. To the best of
my knowledge, the research and writing are those of the candidate except as
acknowledged in the Author Attribution Statement. I confirm that the investigations
were conducted in accord with the ethics policies and integrity standards of
Nanyang Technological University and that the research data are presented honestly
and without prejudice.
04/03/2019 . . . . .. . . . . . . . . . . . . . . . . . . . . .
Date Assoc. Prof. Joachim Loo


Authorship Attribution Statement
This thesis contains material from the paper published in the following peer-reviewed
journal where I was the first author.
Chapter 4 is published as K. Sampathkumar and S.C.J. Loo. Targeted Gastrointestinal
Delivery of Nutraceuticals with Polysaccharide-Based Coatings. Macromolecular
Bioscience. 2018, 18, 1700363. DOI: 10.1002/mabi.201700363
The contributions of the co-authors are as follows:
Assoc Prof Loo provided the initial project direction and edited the manuscript
drafts.
I prepared the manuscript drafts.
I co-designed the study with Assoc Prof Loo and performed all the laboratory work
at the School of Materials Science and Engineering and the Singapore Centre for
Environmental Life Sciences Engineering. I also analyzed the data.
All microscopy, including sample preparation, was conducted by me in the Facility
for Analysis, Characterization, Testing and Simulation.
04/03/2019
Date Sampathkumar Kaarunya

Abstract
i
Abstract
The focus on alternative therapeutic strategies to overcome the side effects of the drugs and
to act in synergy with drugs to maximize recovery is on the rise. Nutraceuticals are one of
the candidates being explored as alternative or adjunctive therapy. Being of plant origin,
most of the nutraceuticals are sensitive to degradation and suffer from the disadvantage of
loss of bioactivity before they reach the target site. A suitable carrier would help maximize
the benefits of these nutraceuticals. Oral route is one of the common methods for the
consumption of such nutraceuticals or active ingredients (AI). Despite its numerous
advantages, it faces many disadvantages also. Some them being the poor bioavailability of
the AI, degradation of the AI during transit of the gastro intestinal tract (GIT), poor
absorption and lack of action specificity. In order to overcome this, a food grade carrier
system that can encapsulate nutraceuticals of varying solubilities and can also be
incorporated into food materials, as a direct food additive is required. In spite of the
growing research in this field, a food grade carrier, that can successfully target the delivery
of the AI to different parts of the GIT, while preserving its bioactivity, is still lacking
commercially. In view of this, a food grade oral delivery system for nutraceuticals was
developed using chitosan and starch as the base materials. Chitosan nanoparticles (chnp)
were prepared by electrospraying and used for encapsulating the AI. A coating of starch on
these particles ensured targeted delivery of the encapsulated AI. The performance of the
coating layer was tested in different simulated GIT fluids and was found to be comparable
to that of the commercial enteric polymers. The berries of the plant, Withania coagulans,
chosen as the nutraceutical candidate, was used to extract the nutraceutical coagulans. The
extracts, an aqueous fraction and an organic fraction, were characterized using various
analytical techniques and was found to match with that of previously reported extracts from
the same plant. Three different bioactive properties of the extract were tested. The aqueous
fraction was found to possess wound healing and anti-diabetic effects while the organic
fraction was found to have an anti-cancer effect. The small intestine targeting ability of
the carrier was proven by encapsulating the aqueous extract into the food grade carrier and
demonstrating the anti-diabetic effect both in vitro and in vivo. The large intestine targeting
Abstract
ii
ability of the carrier was proven by encapsulating the organic fraction into the carrier and
demonstrating the anti-cancer effect in vitro. Hence the successful working of an oral
delivery system, made entirely from food grade materials for targeting nutraceuticals to
different parts of the gastro intestinal tract has been showcased as a step towards developing
health benefiting food additives.

Lay Summary
iii
Lay Summary
The consumption of extracts from foods in concentrated form, in much greater amounts
than what can be obtained directly from food, seeking health benefits, is on the rise. Some
examples are the green tea extract or grape seed extract sold as pills. Such extracts have
been given the name nutraceuticals. While the extract itself might be useful in alleviating
some disease conditions when taken along with medicines, it is questionable whether in
the current form as capsules, they are able to exert their influence to their full potential.
This is because they can lose their activity in the stomach acid or be degraded by enzymes
in the mouth and intestine. Also, since these pills are available over the counter, their
consumption cannot be controlled and the pills usually offer very high doses of the extract
itself in order to make sure, the extracts are available for use in the body, after being
destroyed in the stomach or intestine. In order to overcome these problems, a bilayered
capsule has been designed using food grade materials-mainly chitosan (obtained from
shrimp shells) and starch, such that the coating layer can dissolve specifically either in the
small or large intestine based on a trigger. The coating layer houses particles that are in
size similar to that of the diameter of human hair. This small size facilitates better uptake
in the body and such small size ensures that each cell in the body has many particles to
interact with, thereby increasing the effectiveness of the particle cell interaction. The use
of food grade materials eliminates the inherent toxicity of the capsule materials used in the
pills and since, the capsule can release the extract on the desired region in the GIT, reduce
the amount of extract needed to be consumed. The novelty lies in the fact that the carrier is
entirely food grade and can target as well as encapsulate extract of different solubilities. In
order to exemplify the working of the carrier, two different extracts from a plant source
were filled into the food grade bilayered capsule. The outer layer made of starch, not only
protects the capsule from the stomach acid, but also decides whether it is digested in the
small intestine or the colon. This was demonstrated using the extract which had anti-
diabetic effect. For this effect to be manifested, the extract has to be absorbed in the small
intestine. The working of the capsule was proven by showing decreased blood glucose
levels in diabetic animals treated with the extract filled capsules. The anti-cancer effect of

Lay Summary
iv
the extract was proven by its ability to kill cancer cells and this can be used to demonstrate
the ability of the capsule to deliver the extract at the colon cancer affected areas in the colon.
This study not only elaborates the successful working of a food grade capsule to preserve
the activity of the extract while it reaches its site of action, but also has the ability to
package a plant extract that has so far never been used in combination with such capsules.

Acknowledgements
v
Acknowledgements
I take this opportunity to extend my heartfelt gratitude to everyone who has helped in every
step of this wonderful journey to obtain my Ph.D.
I take immense pleasure in thanking Nanyang Technological University and the School of
Materials Science and engineering in for the financial support by means of the NTU
research scholarship.
I would like to thank my supervisor, Associate Professor Joachim Loo, who was
instrumental in selecting me for the program, for his faith in me and accepting me as his
student. It is his motivation, guidance, constant support and encouragement that helped me
shape my research ideas. Also, his continuous striving to provide better platform for my
research has always encouraged me to come up with new ideas. I would also like to
acknowledge and thank him for patiently reviewing the drafts of the manuscripts and also
during the preparation of this thesis, providing his valuable inputs and suggestions.
I would also like to thank all the technicians in the School of Materials Science and
Engineering (MSE) and the Singapore Centre for Environmental Life Sciences
Engineering (SCELSE) who trained me to use the equipment and helped me whenever
their assistance was required.
I would like to make a special mention to SCELSE and thank the institute for me letting
me use their resources, where I was a visiting student.
I would also like to extend credits to the two final year project students, Ms. Tan Chiew
Kai and Ms. Saburnisha Binte Mohammad Raffi who were mentored by me, for their help
in the extraction and characterization of the extracts from the plant berries. If it were not
for them, it would not been possible to extract enough quantities to enable me to do the
various studies using the extract.
I would like to mention our collaborators from Thailand Dr. Nuannoi Chudapongse and
Ms. Siriporn Riyajan from Suranaree University of Technology, who helped us carry out
the in vivo studies on the diabetic mice.
I would like to thank all my friends and lab members whose presence have helped cheer
me up at times of failure.

Acknowledgements
vi
I am grateful to my family for their belief in my ability to perform and for their endurance
and support during times of happiness and adversaries. I would like to thank my parents
for instilling in me, the strong tendency to persevere and my husband and son for standing
by me at all times.

Table of Contents
vii
Table of Contents
Abstract ............................................................................................................................... i
Lay Summary ................................................................................................................... iii
Acknowledgements ........................................................................................................... v
Table of Contents ............................................................................................................ vii
Table Captions ................................................................................................................ xiii
Figure Captions ............................................................................................................... xv
Abbreviations ................................................................................................................. xix
Chapter 1 Introduction .................................................................................................. 1
1.1. Background .................................................................................................................. 2
1.2. Problem Statement and hypothesis .............................................................................. 3
1.3. Objectives .................................................................................................................... 4
1.4. Dissertation Overview ................................................................................................. 5
1.5. Novelty and outcomes.................................................................................................. 6
Chapter 2 Literature Review ...................................................................................... 11
2.1. Delivery systems for nutraceuticals ........................................................................... 12
2.2. Chitosan as an encapsulation material ....................................................................... 14
Methods of chitosan nanoparticle fabrication ................................................. 15
2.3. Enteric coatings .......................................................................................................... 16
2.4. Targeted oral delivery systems for nutraceuticals ..................................................... 17
2.4.1. Small intestine targeted delivery ..................................................................... 17
Table of Contents
viii
Colon targeted delivery ................................................................................... 17
2.5. Nutraceutical candidates for encapsulation ............................................................... 20
2.5.1. Withania coagulans ......................................................................................... 20
Anti-hyperglycemic effect ............................................................................... 20
Wound healing effect ...................................................................................... 21
Anti-cancer effect ............................................................................................ 22
Clinical study ................................................................................................... 22
2.6. Summary .................................................................................................................... 23
Chapter 3 Experimental Methodology ....................................................................... 33
3.1. Carrier fabrication ...................................................................................................... 34
3.1.1. Electrospraying ................................................................................................ 34
Starch coating .................................................................................................. 35
3.2. Characterization of the carrier platform ..................................................................... 36
3.2.1. Electron microscopy ........................................................................................ 36
Dynamic Light Scattering ............................................................................... 37
Laser Doppler Electrophoresis ........................................................................ 38
Confocal microscopy ....................................................................................... 39
3.3. Extraction and characterization of withanolides from plant source ........................... 41
3.3.1. Fourier Transform Infrared Spectroscopy (FTIR) ........................................... 41
Nuclear Magnetic Resonance (NMR) Spectroscopy ....................................... 42
MALDI-TOF ................................................................................................... 43
High Performance Liquid Chromatography (HPLC) ...................................... 45
Encapsulation efficiency and Release kinetics studies .................................... 45
3.4. Cell Culture ................................................................................................................ 47
3.4.1. Cell viability assay .......................................................................................... 47

Table of Contents
ix
Glucose stimulated insulin secretion assay (GSIS) ......................................... 49
ELISA .............................................................................................................. 49
Flow cytometry ................................................................................................ 50
3.5. In vivo studies ............................................................................................................ 51
3.6. Statistical analysis ...................................................................................................... 53
Chapter 4 Carrier fabrication and characterization ................................................ 57
4.1. Fabrication and characterization of chnp ................................................................... 58
4.2. Starch coating on chnp and characterization ............................................................. 61
4.3. Evaluation of starch as a protective coating .............................................................. 63
4.4. Chnp toxicity and cell uptake studies ........................................................................ 65
4.5. Discussion .................................................................................................................. 67
4.6. Summary .................................................................................................................... 69
Chapter 5 Coagulans as a nutraceutical candidate ................................................... 71
5.1. Extraction and characterization of coagulans ............................................................ 72
FTIR ................................................................................................................ 72
NMR ................................................................................................................ 74
MALDI ............................................................................................................ 76
5.2. Encapsulation of the extracts in a model polymeric carrier system ........................... 78
5.3. HPLC method development for studying release profiles of P2 and P4 ................... 79
5.4. Discussion .................................................................................................................. 80
5.5. Summary .................................................................................................................... 81
Chapter 6 Coagulans loading in nano carrier-small intestine targeted delivery ... 83
6.1. Anti-diabetic effect of coagulans ............................................................................... 84
In vitro studies on MIN6 cells ......................................................................... 84

Table of Contents
x
In vivo studies of free extract .......................................................................... 86
6.2. Encapsulation of P4 into the nano carrier .................................................................. 88
Release study of P4 from Chnp and C+S ........................................................ 88
Effect of P4 release media on MIN6 cells ....................................................... 92
In vivo studies of the nano carrier ................................................................... 94
6.3. Discussion .................................................................................................................. 95
6.4. Summary .................................................................................................................... 98
Chapter 7 Coagulans loading in nano carrier-large intestine targeted delivery .. 102
7.1. Anti-cancer effect of coagulans ............................................................................... 103
In vitro toxicity studies on colon cancer cell lines ........................................ 103
IC50 and Selectivity Index (SI) ..................................................................... 105
7.2. Encapsulation of P2 into the nano carrier ................................................................ 106
7.2.1. Release study of P2 from chnp and C+RS .................................................... 106
Effect of release media on Caco2 cells ......................................................... 109
7.3. Discussion ................................................................................................................ 111
7.4. Summary .................................................................................................................. 113
Chapter 8 Conclusions and future recommendations ............................................ 117
8.1. Conclusions .............................................................................................................. 118
8.2. Future recommendations .......................................................................................... 121
8.2.1. Evaluation of cellular uptake using triculture model .................................... 121
Biokinetics study using the GIT simulator .................................................... 122
Purification of the extracts P2 and P4 ........................................................... 123
In vivo studies ................................................................................................ 124
8.3. Reconnaissance studies ............................................................................................ 124
8.3.1. Wound healing effect .................................................................................... 124

Table of Contents
xi
Scratch wound assay ..................................................................................... 125
Appendix ...................................................................................................................... 129


Table Captions
xiii
Table Captions
Table 2.1 List of Nutraceuticals studied for encapsulation in micro and nano carriers .... 13
Table 3.1 Cell lines used and their culture conditions ....................................................... 47
Table 3.2 Grouping of animals for in vivo study .............................................................. 53
Table 4.1 Zeta potential and size of Chnp, C+S and C+RS measured using DLS ............ 61
Table 5.1 Extraction efficiencies of P2 and P4 ................................................................. 72
Table 5.2 Characteristic groups of the extract observed from FTIR and their respective
wavenumbers ..................................................................................................................... 73
Table 5.3 Characteristic peaks observed in the NMR spectra of the extract fractions P2 and
P4 ....................................................................................................................................... 75
Table 7.1 Comparison of IC 50 and selectivity of P2 on cancerous and normal cell lines
......................................................................................................................................... 105
Table 7.2 Comparison of IC 50 and selectivity of P4 on cancerous and normal cell lines
......................................................................................................................................... 105

xiv

Figure Captions
xv
Figure Captions
Figure 1.1 Challenges to the successful delivery of active ingredient through the oral route
[1]......................................................................................................................................... 2
Figure 1.2 Schematic 1- representing the novelty and outcomes ........................................ 7
Figure 1.3 Schematic 2 – representing the novelty and outcomes ...................................... 8
Figure 1.4 Schematic 3 - representing the novelty and outcomes ....................................... 9
Figure 2.1 Structure of chitosan obtained from the deacetylation of chitin [30] ............... 15
Figure 2.2 Structure of (a) amylose and (b) amylopectin - the two polymers that make up
starch. ................................................................................................................................. 19
Figure 2.3 Changes in native starch granules upon gelatinization and retrogardation. ..... 24
Figure 2.4 Design strategy for the food grade carrier ........................................................ 25
Figure 3.1 Schematic depicting the electrospray process. ................................................. 35
Figure 3.2 Working principle of Dynamic Light Scattering technique [4] ....................... 38
Figure 3.3 Principle of zeta potential measurement [5] ..................................................... 39
Figure 3.4 Basic construction of a FTIR spectrometer [10]. ............................................. 42
Figure 3.5 Basic arrangement of a NMR spectrophotometer [11] .................................... 43
Figure 3.6 Working principle of a mass spectrometer [12] ............................................... 44
Figure 3.7 Principle of cell viability detection using CCK-8 assay [16] ........................... 48
Figure 3.8 Schematic showing the steps involved in sandwich ELISA [17] .................... 50
Figure 3.9 Basic working of a flow cytometer [19] .......................................................... 51
Figure 4.1 Graphic showing the optimized parameters used for electrospraying of chnp. 59
Figure 4.2 Field-emission scanning electron microscopic images of chnp. ...................... 60

Figure Captions
xvi
Figure 4.3 Scanning electron microscopic images of (a) starch coated chnp (b) RS coated
chnp. .................................................................................................................................. 62
Figure 4.4 CLSM images of starch coated chnp showing the chitosan core and starch shell.
(a) C+S (b) C+RS. ............................................................................................................. 63
Figure 4.5 Comparison of degradation of commercial enteric coating polymers and starch
in simulated GIT fluids at various time points. ................................................................. 65
Figure 4.6 Cell uptake of chnp using flow cytometry and confocal microscopy. .......... 66
Figure 5.1 FTIR spectra of extracts from Withania coagulans: crude extract (P1), fractions
P2 and P4 ........................................................................................................................... 73
Figure 5.2 NMR spectrum of the organic fraction (P2). The inset shows the structural
backbone of steroidal lactones. .......................................................................................... 74
Figure 5.3 NMR spectra of aqueous fraction (P4). The inset shows the structural backbone
of steroidal lactones ........................................................................................................... 75
Figure 5.4 Characterization of P2 using mass spectrometry ............................................. 77
Figure 5.5 Characterization of P4 using mass spectrometry ............................................. 77
Figure 5.6 Coagulans extract encapsulated in PLGA microparticles ................................ 79
Figure 5.7 Release profiles of coagulans extract from PLGA microparticles measured using
HPLC. ................................................................................................................................ 80
Figure 6.1 Toxicity of different concentrations of (a) P4 and (b) P2 onMIN6 cells, studied
over 2 hours. ...................................................................................................................... 85
Figure 6.2 Insulin fold change observed for the mouse pancreatic beta cells (MIN6) on
treatment with different concentrations of P4. .................................................................. 86
Figure 6.3 Glucose tolerance of normal (non-diabetic) control mice fed DI water, P2 or P4.
........................................................................................................................................... 87
Figure 6.4 Fasting blood glucose levels of the normal mice fed DI water and diabetic mice,
fed DI water, P2 or P4, depicted on day 0 and day 5. ....................................................... 88
Figure 6.5 Release kinetics of P4 from chnp and C+S under simulated GIT conditions. . 90
Figure Captions
xvii
Figure 6.6 Mathematical modelling of the release kinetics of P4 from chnp and C+S. .... 92
Figure 6.7 Insulin fold change observed for the mouse pancreatic beta cells (MIN6) on
treatment with release media from C+S particles compared against free in the same release
media and blank release medium alone ............................................................................. 94
Figure 6.8 Fasting blood glucose levels of diabetic mice before and after 5 days of oral
gavage with P4 encapsulated starch coated chnp and uncoated chnp. .............................. 95
Figure 7.1 Effect of varying concentrations of P2 on the viability of Caco2 cells after 24
hours treatment. ............................................................................................................... 104
Figure 7.2 Effect of varying concentrations of P4 on the viability of Caco2 cells after 48
hours treatment. ............................................................................................................... 104
Figure 7.3 Release kinetics of P2 from chnp and C+RS sequentially in different GIT fluids.
......................................................................................................................................... 107
Figure 7.4 Mathematical modelling of the release kinetics of P2 from chnp and C+RS. 109
Figure 7.5 Effect of the release media from P2 encapsulated chnp and C+RS on the viability
of Caco2 cells, compared against free P2 and blank release media. ............................... 111
Figure 8.1 Triculture model to study nanoparticle uptake in GIT [1]. ............................ 122
Figure 8.2 Schematic of the GIT simulator [1]. .............................................................. 123
Figure 8.3 Effect of (a) P2 and (b) P4 on the viability of HDF cells .............................. 125
Figure 8.4 Wound healing effect of free P4 and P4 encapsulated in PLGA microparticles
compared against untreated control and free P4 added in parts at specific time intervals on
HDF cells over 48 hours. ................................................................................................. 127

Abbreviations
xix
Abbreviations
AI Active Ingredient
GRAS Generally Recognized As Safe
GIT Gastro Intestinal Tract
Chnp Chitosan Nanoparticles
C+S Soluble starch coated chnp
SS Soluble starch
RS Resistant starch
C+RS Resistant starch coated chnp
SGF Simulated Gastric Fluid
SIF Simulated Intestinal Fluid
SCF Simulated Colonic Fluid
EE Encapsulation Efficiency
FTIR Fourier Transform Infrared Spectroscopy
NMR Nuclear Magnetic Resonance Spectroscopy
HPLC High Performance Liquid Chromatography
HRTEM High Resolution Transmission Electron Microscopy
SEM Scanning Electron Microscopy
TEM Transmission Electron Microscopy
ELISA Enzyme Linked Immuno Sorbent Assay
TPP Sodium Tripolyphosphate
STMP Sodium Trimetaphosphate
DLS Dynamic Light Scattering
DMSO Dimethyl Sulphoxide
P2 Organic solvent soluble fraction extracted from Withania coagulans
P4 Water soluble fraction extracted from Withania coagulans

xx

Introduction Chapter 1
1
Chapter 1
Introduction
The chapter begins with outlining the basis and background for the
conception of this thesis. The current market value of nutraceuticals is
discussed and the importance of encapsulating them in food materials is
enunciated. Once the problem with the existing systems are realized, a
hypothetical design is established for solving the problems. This is followed
by laying down the objectives for proving the hypothesis. Subsequently, an
overview of the thesis is provided on a chapter by chapter basis, giving a short
summary of what would be discussed in each chapter. The last part of the
chapter outlines the novelty and findings of the work.

Introduction Chapter 1
2
1.1. Background
Oral drug delivery system is undoubtedly the most practiced system for administering the
AI and offers the advantages of ease of administration, patient compliance and requires
minimum supervision. Besides the systemic delivery of drugs to treat diseases, the oral
route offers the advantage of local delivery of drugs in many of the GIT disorders. For this
delivery method to be successful, the AI has to be protected from the diverse environment
of the GIT – pH difference, digestive enzymes and gut microbiome (Figure 1.1). Hence
numerous research is being carried out in this field, trying to achieve perfection in targeted
delivery to specific regions of the GIT where the drug absorption would be maximum
resulting in maximum bioavailability. Oral controlled drug delivery systems enhances the
advantages of oral delivery, by protecting the AI through its transit in the GIT tract and
help deliver the drugs locally.
Figure 1.1 Challenges to the successful delivery of active ingredient through the oral route
[1]. Reproduced with permission from Future Medicine LTD
The term Nutraceutical refers to a “type of dietary supplement that delivers a concentrated
form of a bioactive agent, nutrient or non-nutrient, from food origin, in a dose that must

Introduction Chapter 1
3
exceed those that could be obtained from normal foods in a balanced diet” [2]. According
to a recent report by Transparency market research, the global nutraceutical market is
estimated to reach US$278.96 billion by 2021 [3] and is driven by the changing outlook of
consumers on the health benefits and nutritional values of food. The nutraceuticals
currently being tapped, target metabolic disorders, offering to curtail the occurrence of the
disease at an early stage and in those severely progressed diseases cases, to act in synergy
with the drugs in reducing their dosage. The therapeutic values of many nutraceuticals are
being widely discussed in the literature [4, 5] and have also been reported in many
traditional and ancient systems of medicine. Most of these nutraceuticals are marketed as
dietary supplements and despite the claims from many nutraceutical companies, the
efficacy of these, in treating a disease condition, still remains questionable. In addition, the
positive role of these nutraceuticals in chronic diseases like cancer or other bacterial
infections is still unknown.
In order to realize the true potential of nutraceuticals, it is important to protect and deliver
them using a carrier system, as most of the nutraceuticals currently being used as dietary
supplements are extremely labile compounds having low bioavailability [6]. It is
hypothesized that the bioavailability of these compounds can be increased by encapsulating
them in a suitable lipophilic/hydrophilic carrier depending on the nature of the compound
and delivering them directly at the site of absorption. Since the encapsulated nutraceutical
would still be used as a dietary supplement, it would be best to use food grade polymers as
carrier materials. Also, to protect the carrier from the diverse GIT environment, an enteric
coating is essential. But currently available commercial enteric coatings are not food grade
or Generally recognized as safe (GRAS) [7]. Hence, a food grade enteric coating that
overcomes all the problems discussed above, would help to substantiate the beneficial
properties of nutraceuticals.
1.2. Problem Statement and hypothesis

Introduction Chapter 1
4
There is a lack of commercial coatings made entirely from food grade materials, that can
be used to bypass the barriers in the GIT, are completely safe and could be readily used in
food application as additives or functional foods [8]. This is important to note as there is
no regulation in the consumption of foods marketed under this category. Most of the
polymers used as enteric coating in pharmaceutical products are not approved for use as a
food additive and the processing parameters employed during the coating process, does not
make it suitable for use with nutraceuticals which are mostly labile compounds [9]. Hence
it is important to ensure that these are totally safe. Besides, there is no existing delivery
system for the nutraceutical chosen. Coagulans, being of plant origin is labile in nature and
has a very strong taste and smell that deters its usage [10]. Hence a suitable carrier system
for these nutraceuticals would help overcome these problems.
The thesis postulates the hypothesis that food grade particulate systems are excellent
vehicles for the delivery of nutraceuticals, as they can be modified to target specific parts
of the GIT. The feasibility of the hypothesis was tested by comparing the performance of
the food grade materials against commercial coating materials and the targeting ability of
the food grade nanoparticles was tested through both in vitro and in vivo studies.
1.3. Objectives
1. Design and develop a delivery platform using biopolymers/food grade materials
with the following attributes:
A carrier system, delivered through the oral route using food grade polymer
that can encapsulate nutraceuticals, cross the mucosal barrier and deliver to
the enterocytes of the intestine.
A coating layer that can selectively degrade either in the small or large
intestine.
2. To identify a suitable nutraceutical to be loaded into the delivery system, such that
the nutraceutical can be used to exemplify the targeting ability of the delivery
system

Introduction Chapter 1
5
3. Encapsulation of nutraceutical into the carrier and testing its feasibility as a small
intestine targeted delivery system
4. Encapsulation of nutraceutical into the carrier and testing its feasibility as a large
intestine targeted delivery system
1.4. Dissertation Overview
The thesis addresses the development of a food grade carrier system for the targeted
delivery of nutraceuticals to different parts of the GIT, its ability to encapsulate both
hydrophobic and hydrophilic nutraceuticals and the validation of the targeting ability of
the carrier platform. The term nanoparticles has been used in this thesis refers to particles
in the size range of 170 -200 nm obtained from the electrospraying process.
Chapter 1 provides a rationale for the conceptualization of the work that led to this thesis
and outlines the problem statement, objectives and novelty of the work.
Chapter 2 reviews the literature concerning the existing oral delivery systems for
nutraceuticals and the problems with existing enteric coatings. The chapter also discusses
the existing literature on targeted delivery systems for the small and large intestine. The
last part of the chapter summarizes the gaps in knowledge that the thesis is addressing.
Chapter 3 discusses the experimental methodologies involved in the work, while
explaining the principle of each method and also the rationale for choosing the particular
technique. The chapter is divided into three main parts, with the first part focusing on the
principles underlying the fabrication and characterization techniques employed, the second
part focusing on the techniques used for the extraction and characterization of the
nutraceutical and the last part focusing on the in vitro and in vivo experimental methods.
Chapter 4 elaborates the results for the development of the carrier platform. The
characterization of the carrier using various microscopic techniques followed by the
evaluation of the performance of the carrier are discussed. The chapter ends with the cell

Introduction Chapter 1
6
uptake studies on the nanoparticle carrier.
Chapter 5 elaborates the results on the extraction and characterization of the nutraceutical
to confirm the compounds present in the extract. The chapter also demonstrates the
feasibility of loading the extracts into a polymeric carrier and studying the release of the
extracts by developing a HPLC method to quantify the release.
Chapter 6 presents the results displaying the anti-diabetic effect of the extracts both in vitro
and in vivo, followed by the encapsulation of the extract in the delivery system, the release
kinetics of the extract, in vitro validation of the bioactivity of the extract, after
encapsulation and the ability of the carrier to target to the small intestine in vivo.
Chapter 7 presents the results displaying the anti-cancer effect of the extracts in vitro,
followed by the encapsulation in the delivery system, the release kinetics of the extract
from the carrier and the validation of the bioactivity after encapsulation and targeting
ability of the carrier in vitro.
Chapter 8 draws together the results presented in the different chapters by explaining how
each of these results fulfil the objectives as a step towards realizing the hypothesis. Future
recommendations to further strengthen the studies carried out have also been laid down.
Reconnaissance study on the bioactive property of the extracts have been included towards
the end.
1.5. Novelty and outcomes
The novel aspects of this thesis include:
1. The development of gastric protective coatings for nanosized particles for selectively
targeting of nutraceuticals to either the small or large intestine. The technique used for the
coating process is extremely mild and does not use any toxic solvents. In contrast to
existing synthetic enteric coating polymers, all the materials used in the carrier fabrication
are food derived and approved to be used as a direct food additive.

Introduction Chapter 1
7
Figure 1.2 Schematic 1- representing the novelty and outcomes
2. The encapsulation of the extracts within a polymeric carrier and studying the therapeutic
effects of the extracts in vitro. For the first time, the compounds from Withania coagulans
were encapsulated into the developed food grade delivery system in order to protect its
bioactivity and enhance the bioavailability. There have been no reports so far, on the
encapsulation of the extracts of Withania coagulans. Three different therapeutic activities
of the extracts were demonstrated using three mammalian cell lines. There have been no
reports on the in vitro testing of the therapeutic properties of the plant extract on cell lines,
to understand its cellular targets and mechanism of action.

Introduction Chapter 1
8
Figure 1.3 Schematic 2 – representing the novelty and outcomes
3. The successful demonstration of the ability of the different food grade coatings to retard
gastric release and target specifically to the large or small intestine. This was showcased
using different simulated GIT fluids to represent stomach, small intestine and large
intestine, and the different coatings, being able to modulate the release of AI in the specific
region for which it was intended.

Introduction Chapter 1
9
Figure 1.4 Schematic 3 - representing the novelty and outcomes
References
[1] Roger E, Lagarce F, Garcion E, Benoit JP. Biopharmaceutical parameters to consider
in order to alter the fate of nanocarriers after oral delivery. Nanomedicine (London,
England) 2010;5:287-306.
[2] González-Sarrías A, Larrosa M, García-Conesa MT, Tomás-Barberán FA, Espín JC.
Nutraceuticals for older people: Facts, fictions and gaps in knowledge. Maturitas;75:313-
34.

Introduction Chapter 1
10
[3] Diarrassouba F, Garrait G, Remondetto G, Alvarez P, Beyssac E, Subirade M. Food
protein-based microspheres for increased uptake of vitamin D3. Food chemistry
2015;173:1066-72.
[4] Andlauer W, Fürst P. Nutraceuticals: a piece of history, present status and outlook.
Food Research International 2002;35:171-6.
[5] Chao J, Leung Y, Wang M, Chang RC. Nutraceuticals and their preventive or potential
therapeutic value in Parkinson's disease. Nutrition reviews 2012;70:373-86.
[6] Julian MD, Liqiang Z, Ruojie Z, Laura S-T, Taha K, Hang X. Enhancing Nutraceutical
Performance Using Excipient Foods: Designing Food Structures and Compositions to
Increase Bioavailability. Comprehensive Reviews in Food Science and Food Safety
2015;14:824-47.
[7] Patra CN, Priya R, Swain S, Kumar Jena G, Panigrahi KC, Ghose D. Pharmaceutical
significance of Eudragit: A review. Future Journal of Pharmaceutical Sciences 2017;3:33-
45.
[8] Czarnocka J, A Alhnan M. Gastro-Resistant Characteristics of GRAS-Grade Enteric
Coatings for Pharmaceutical and Nutraceutical products2015.
[9] Thakral S, Thakral NK, Majumdar DK. Eudragit: a technology evaluation. Expert
opinion on drug delivery 2013;10:131-49.
[10] Dutta Pramanick D, K Srivastava S. Pharmacognostic evaluation of Withania
coagulans Dunal (Solanaceae) -an important ethnomedicinal plant2015.

Literature Review Chapter 2
11
Chapter 2
Literature Review
The chapter summarizes the various literature published in relation to
the topic of this thesis, reviewing the relevant contemporary work done,
thereby identifying the gaps in designing a completely food grade oral
delivery system for nutraceuticals. The first part of the chapter focuses
on the existing delivery systems for different nutraceuticals, followed
by a detailed review on the use of chitosan as an oral delivery system
and the different methods of fabricating chnp. Subsequently, the
existing commercial enteric coatings, the problems in using them in
food materials, current studies on small and large intestine targeted
delivery have been discussed. The last part of the chapter reviews the
existing literature on the chosen nutraceutical Withania coagulans and
its various therapeutic effects. The chapter ends with a short summary
on the various research gaps ascertained from literature review, that
the thesis addresses.

Literature Review Chapter 2
12
2.1. Delivery systems for nutraceuticals
The growing attention on nutraceuticals and the expanding market for such products has
shifted the focus on the encapsulation of nutraceuticals in order to protect its activity and
ensure maximum bioavailability, when consumed. The nutraceuticals that are of interest
to be encapsulated and delivered in the past 5 years are mostly polyphenols like resveratrol,
curcumin, catechins isolated from green tea, Quercetin, Coenzyme Q10, Vitamins like A,
C, E and D using various food-based matrix carriers like lipids, whey protein, soy proteins
and chitosan (Table 2.1). Since most of these nutraceuticals are hydrophobic, more
attention is being directed at developing oil based emulsion carriers. Though most of the
carriers were developed with the aim of oral delivery, they were not designed in such a
way to overcome the barriers of the GIT.
The advantages of using nanoparticulates as drug carriers have already been realized in
pharmaceutical sciences and is currently being looked into for use as nutraceutical carriers
also. A number of reviews comprehensively list out the nanocarriers that have been studied
so far for the oral delivery of nutraceuticals [1-6]. Some of the advantages of using
particles below 500nm for oral delivery are outlined as follows [7, 8]:
Better targeting and absorption due to increased surface to volume ratio
Ability to cross epithelial tight junctions and paracellular transport
Prolonged systemic circulation compared to micro particles
Lesser chances of being attacked by the body’s immune system

Literature Review Chapter 2
13
Table 2.1 List of Nutraceuticals studied for encapsulation in micro and nano carriers
Nutraceutical type Examples Carrier material
used Ref
Polyphenols
Epigallectocatechin
(EGCG) β-lacto globulin [9]
Curcumin Iota-carrageenan [10]
Red grape seed
extract
Chitosan and
hyaluronic acid [11]
Quercetin
Solid lipid
nanoparticles,
lipid nanocarriers
and lipid
nanoemulsions
[12]
Naringenin
Phospholipid
complex, Beta
lacto globulin-
whey protein
[13],
[14]
Resveratrol Gliadin and Zein [15]
Carotenoids Beta carotene Barley protein [16]
Vitamins
Vitamin D3 Hydrophobins
(components of
fungal cell wall)
[17]
Riboflavin Soy protein [18]
Folic acid Whey protein
concentrate and
resistant starch
[19]
Probiotics Lactobacillus
acidophilus
Zein alginate core-
shell
microcapsules
[20]

Literature Review Chapter 2
14
2.2. Chitosan as an encapsulation material
Some of the commonly used GRAS materials for encapsulation of nutraceuticals have
been listed in Table 2.1. Various polysaccharides, proteins and lipids derived from natural
sources have been used as encapsulation materials. While different materials such as whey
protein, zein and phospholipids have been reported to show retarded release of the
encapsulated nutraceutical in the gastric environment, they are not mucoadhesive in nature
and possess a negative zeta potential. Besides these materials release the cargo
immediately once they reach the small intestine.
The choice of the encapsulation material for this thesis, was based on developing a
nutraceutical encapsulated nanoparticle that could allow for coating with different food
grade materials, so that the nanoparticles could be released in the small intestine or large
intestine, providing for controlled release of the nutraceutical from the nanoparticles.
Hence the core nanoparticle should be conducive to be coated with the chosen coating
material, in this case, soluble starch and resistant starch, which possess a negative charge.
Hence a positive charged polymer would best suit this purpose. Though the materials
discussed above can be fabricated into nanoparticle in the desired size range and also
encapsulate a nutraceutical, most of them are negatively charged polymers.
Chitosan is a cationic polysaccharide obtained from deacetylation of chitin found in the
shells of crustaceans [21] and has been used widely in the encapsulations of drugs [22],
proteins [23], oligonucleotides [24] and nutraceuticals [25]. The characteristic feature of
chitosan that makes it a candidate of choice as carrier material is its ability to adhere to
negatively charged mucosal surface and capability to penetrate tight junctions between
epithelial cells [26, 27]. The mucoadhesive ability of chitosan would help increase the
residence time of the particles made from chitosan within the GIT, thereby increasing the
chances of sustaining the release of AI within the body. Chitosan, has been proven safe for
use in animals and humans [28], and is considered as GRAS by US FDA. It is also approved
for use as food additive in Japan and Korea [29].

Literature Review Chapter 2
15
Figure 2.1 Structure of chitosan obtained from the deacetylation of chitin [30]
Methods of chitosan nanoparticle fabrication
A nanoparticulate delivery system based on chitosan, is envisioned for the nutraceutical
encapsulation, as it has been shown in previous studies that the size of the particle,
enhances the cellular uptake of the particles in the GIT [8]. Besides the increased surface
area, increases the chances of adhesion to the gastric mucosa and the smaller size, allows
for faster release compared to microparticles [31], which is a trade-off between the short
residence times in the GIT and sustaining the release of AI. Chitosan nanoparticle have so
far been fabricated by different methods like emulsion droplet coalescence [32], ionic
gelation [33, 34], electro spraying [35], coacervation/precipitation [36], and self-assembly
[37]. Of the methods listed above, electrospraying offers the advantage of reproducibility,
as the process parameters are equipment controlled and chances of variability are minimal
[38]. Electrospraying is the process by which the polymer solution is atomized under the
influence of the electric field and the charged droplets are collected on a grounded collector

Literature Review Chapter 2
16
solution. The process parameters such as electric field strength, flow rate and viscosity of
the solution, determine the size of the particles [39]. Previous reports on electrospraying
chnp have yielded particles in the size range of 200 nm [40]. The parameters can be used
as a guide to optimize the fabrication parameters for the current study. Electrospraying is
a mild technique that does not use any toxic organic solvents and the nanoparticles can be
sprayed directly into the cross linker from which it can be collected. This actuates the
suitability of the method to be used in food based applications.
2.3. Enteric coatings
The important requirement for a carrier system to be used in oral delivery is that it should
primarily protect the AI from the adverse environment of the gastrointestinal tract (GIT)–
low pH in the stomach, digestive enzymes in the small intestine, and gut microbiome in
the large intestine. To achieve this, polymeric coatings capable of protecting and
degrading selectively in different organs of the GIT are used. Though there are a variety
of such coating materials, most of these materials are made of either polymethylacrylates,
poly vinyl acetate phthalate or cellulose acetate derivatives. These polymeric coatings
cater to both aqueous and organic solution dispersion and require the use of plasticizers to
aid in film formation. One example is the Eudragit polymers based on polymethacrylates
or polyvinylacetate phthalates that are marketed by Evonik. Some recent reviews outline
the detailed applications of these polymers as enteric/sustained release/colon-targeted
coatings [41, 42]. Despite the research focusing on nutraceutical encapsulation, there are
not many commercially available enteric coating systems targeting to small and large
intestine intended for food application. Extensive literature search resulted in identifying
one commercial enteric coating for nutraceuticals, developed by Colorcon®. The product
is a combination of some of the synthetic polymers mentioned above, along with shellac,
alginate and an appropriate plasticizer intending to protect the nutraceuticals in the
stomach and delivering to the small intestine. Most of the synthetic polymers used in these
commercial products are mainly intended for pharmaceutical applications and are only
approved as an indirect food additive [43]. The consumption of such products when used
in functional foods, as a direct food additive, is not regulated. In addition, due to the

Literature Review Chapter 2
17
sensitive nature of nutraceuticals, the harsh processing parameters employed during
coating of these commercial polymers also make it unsuitable for these labile compounds.
There is still no commercialized food grade, controlled release coating materials for
targeted delivery and this opens avenues for new research in this field.
2.4. Targeted oral delivery systems for nutraceuticals
Targeted delivery systems help in increasing the bio-availability of nutraceuticals by
delivering them locally. The carrier can be designed to be degraded specifically in the
small intestine triggered by pH difference or intestinal enzymes or in the large intestine by
the gut microbiome or intestinal pressure.
2.4.1. Small intestine targeted delivery
Research on small intestine targeted delivery systems, mainly exploit the pH difference
between the stomach and intestine to trigger release. Shellac, alginate, Zein and whey
protein are some of the common materials that swell in the pH of the small intestine, to
release the AI, and have been used for targeting to small intestine. Chitosan alginate
systems have been studied extensively for oral delivery of drugs and nutraceuticals [44,
45]. The problem with this delivery system is that it does not ensure the complete
absorption of the AI as the cargo is released almost instantaneously with pH change. In
addition, the AI may also undergo loss of bioactivity due to the enzymes present in the
intestine [46].
Colon targeted delivery
The advantages of colon targeted delivery systems are that the food passing through the
colon has a very long transit time, hence delivering drugs in this part of the gastro intestinal
tract increases the residence time of the carrier in the body, thereby resulting in the
continuous release and availability of the active ingredient for a long period. Additionally,
the colon has very few proteolytic enzymes, making it a choice for delivering proteins and
peptides. Some of the systems developed to target drugs and carriers to the colon are,
prodrugs, pH dependent or timed release systems intending to deliver in the colon,

Literature Review Chapter 2
18
microbiome triggered systems and intestinal pressure controlled systems [47]. While the
use of pH difference and residence times as a trigger, to tailor the release of the AI from
the delivery systems has been studied widely and has been the motivation for the
development of commercial products such as Eudragit and Colorcon®, the variation of
the pH values and residence times from person to person, depending on body conditions,
undermines the use of these colon targeted delivery systems.
An alternative to overcome such variations could be the use of microbiome triggered
delivery systems, wherein the enzymes released by the gut flora, trigger the release of AI.
The most common examples of such systems are the prodrugs [48]. Another approach is
to use polymers that are unaffected in the upper GIT and start degrading in the colon by
microbial enzymes. Pectin, Inulin, chitosan, guar gum and resistant starch are some of the
materials used for targeting to the large intestine.
Starch, which is a polysaccharide made of glucose is a copolymer of linear amylose and
branched amylopectin. Depending on its digestibility, starch has been classified as Rapidly
Digestible Starch, Slowly Digestible Starch and Resistant Starch (RS). While the first two
types of starch are digested completely in the small intestine albeit at different rates, RS
escapes digestion in the small intestine and is digested mainly by the enzymes secreted by
the colonic microbiome [49]. This property of resistant starch can be exploited for using
it as a carrier targeted to large intestine. While the existence of a form of starch that escapes
digestion known as resistant starch (RS) has been known for quite some time now, the use
of this material as coating layer is being explored recently [50].

Literature Review Chapter 2
19
Figure 2.2 Structure of (a) amylose and (b) amylopectin - the two polymers that make up
starch. Adapted from [51]
One of the preliminary work on using RS as food grade enteric coating was done by
Dimantov et al. where glass beads were used as a model to coat with starch. Though the
coating performed well in enzyme dissolution testes, it formed a cracked layer on drying
[52]. Recently Situ et al. tested the possibility of coating insulin loaded cellulose micro
particles with resistant starch and proved that the coating helped prevent the proteolytic
cleavage of insulin in small intestine. The protein retained its bioactivity and the carrier
was tested on diabetic rat model leading to a decrease in plasma glucose concentration
[53]. Another recent work using commercial resistant starch as an encapsulating material
(a)
(b)

Literature Review Chapter 2
20
for folic acid, exemplifies the use of the polymer for use in nutraceutical delivery systems
[19]. Patten et al. developed a colon-targeted delivery system for encapsulating long chain
polyunsaturated fatty acids from fish oil, using casein and a modified form of resistant
starch that is degraded specifically by the colon microbiome. The in vivo testing of the
delivery system, using 14C-trilinolenin radiolabeled fish oil loaded into the microspheres
of casein and resistant starch, prevented the premature uptake of fish oil in the small
intestine and almost 50% of the loaded oil was taken up in the colon [54].Very little work
has been focused in this direction but none as an enteric coating for nanoparticulate
delivery system. Hence this serves a good direction to explore for making a food grade
polymer based colon targeted enteric coating.
2.5. Nutraceutical candidates for encapsulation
2.5.1. Withania coagulans
Withania coagulans is an herb belonging to the family Solanaceae and has been used
traditionally in the coagulation of milk to make Indian cheese called paneer. The plant is
native to the north western parts of India, some regions in Pakistan and Afghanistan and
is known by different names as Paneer doda locally. The plant was originally identified as
a substitute for animal source of rennet to make cheese [55-57]. The extract of the dried
fruits of this plant called Rishyagandha is reported to have been used in the traditional
Indian system of medicine called Ayurveda in the treatment of diabetes. The plant extracts
have been proven widely to have numerous beneficial effects – anticancer [58, 59], anti-
diabetic [60], anti hyperlipidemic [61], immunosuppressive [62], wound healing [63].
Anti-hyperglycemic effect
Among the many beneficial health effects, the anti-diabetic property of Withania
coagulans is reported to be the most significant and studied extensively. Early studies on
the aqueous and alcoholic extracts of Withania coagulans on streptozotocin induced
diabetic rats have proven the ability of the both aqueous and alcoholic extracts to induce

Literature Review Chapter 2
21
hypoglycemia in at dosages as high as 1g/kg and 750mg/kg body weight of the rats
respectively [60, 64]. In a study conducted by Datta et al. the hypoglycemic and
hypolipidemic effects of the hydro-alcoholic extract of the fruits of Withania coagulans
was tested on rats in comparison to standard drugs – glipizide and atorvastatin, commonly
used in the treatment of the above diseases. It was concluded from this study that the
extract acts in synergy with the drug and could help lower the doses of the drugs
significantly. Also the histopathological evaluation of the pancreas of the streptozotocin-
induced rats, showed a significant difference in the recovery of the beta cells of the
untreated and Withania coagulans extract treated animals [65]. Loss of peripheral insulin
sensitivity and hepatic insulin sensitivity are the most commonly observed forms of insulin
resistance in type II diabetes. In a study conducted by Bharti et al. on Poloxamer-induced
type 2 diabetic rats, it was shown that the aqueous extract of Withania coagulans fruits
could normalize hyperglycemia in rats, by overcoming the above mentioned resistance
mechanisms, sensitizing the muscle and fat cells to absorb glucose and liver cells to stop
gluconeogenesis in response to insulin [66]. Another study by Hoda et al. has shown that
the combined aqueous and organic extracts of Withania coagulans fruits has better anti-
hyperglycemic effect on diabetic rats than those treated with Metformin [67].
In an attempt to reduce the dosage of the extract significantly, Maurya et al. extracted
specific withanolide called coagulanolide from the plant Withania coagulans and tested
the anti-hyperglycemic and anti-hyperlipidemic properties of the isolated compound in
doses comparable to standard drugs metformin and fenofibrate on streptozotocin-induced
diabetic rats. Coagulanolide was found to be better than metformin at the same dosage
[43]. Despite these various reports on the anti-diabetic property of W.coagulans, there has
not been any in vitro study on the effect of these compounds on cell lines, to understand
its mechanism of action.
Wound healing effect
A report by Prasad et.al, outlines the wound healing property tested on streptozotocin
induced diabetic rat model [63]. The study tracked the rate of wound contraction for 16
Literature Review Chapter 2
22
days, by studying the effect of hydro alcoholic extract of W.coagulans on animal wounds.
The study indicates that the extract was able to promote wound healing when administered
in the oral form compared to the untreated control. This is the only report on the wound
healing activity of the compound, which provided an avenue for testing the effect of the
extracts on cells, thereby helping to understand the mechanism by which it functions.
Anti-cancer effect
The anti-proliferative activity of withanolides extracted from Withania somnifera has been
reported previously [68], while the anti-proliferative or anti- cancer effect of compounds
extracted from W.coagulans has not been investigated before on any cancer cell lines. A
sole work by Haq et al, reports the cancer chemo preventive ability of the compounds
extracted from Withania coagulans. The study showed that the compounds were able to
suppress tumor necrosis factor-α (TNF-α)-induced nuclear factor-kappa B (NF-κB)
activation in murine macrophages, which is responsible for the uncontrolled proliferation
of tumor cells [69]. This opens a new area to study, how these compounds affect different
cancer cell lines.
Clinical study
Two different short term studies conducted independently on human subjects proved the
efficacy and safety of the plant extract in improving the symptoms of patients with type II
diabetes [70, 71]. In the study by Alam et al., 60 patients with Type II diabetes were
studied with 20 patients in the control group and 40 patients in the test group. The patients
received a combination of Withania coagulans fruits decant and Trigonella foenum
powder for 90 days. The patients in the treatment group showed significantly decreased
blood glucose levels compared to the patients in the control group [70]. Another study
using 53 patients compared the effect of Withania coagulans fruit powder individually
and in combination with a diabetes drug against the standard drug. It was observed that
the fruit powder was able to elicit a response in fasting and post prandial blood glucose
levels comparable to that of the standard drug and the combination seemed to have a more
pronounced effect that the drug or fruit powder alone [71]. Although long term study, on

Literature Review Chapter 2
23
a large population taking into consideration different contributing factors is yet to be
conducted. The plant itself being used as a food additive to make cheese, does not pose
any harmful side effects. But it has a very strong taste and odor that discourages the
consumption of the raw extract. Also very high doses of the extract itself is required to
achieve an effective treatment dosage in the body. Hence encapsulation of this
nutraceutical in a carrier that offers controlled sustained release of the nutrient could offer
many advantages over the free extract.
Despite these reports on the therapeutic efficacy of the plant extracts, there has been no
report so far on the encapsulation of the extracts of the plant into delivery systems. Gregory
et al, have attempted to encapsulate the withanolides from Withania somnifera in
Polycaprolactone nano carriers [72] in order to increase the solubility and bioavailability.
Encapsulation of the extract can help reduce the dosage and also mask the taste of the
extract.
2.6. Summary
This review of existing literature thus helps in designing a robust food grade delivery
system that can be used to target to different parts of the GIT. Chitosan has been identified
as suitable material for the nano encapsulation of the AI. Based on the methods available,
the chnp would be fabricated using electrospraying which is a mild technique that does
not use any toxic chemicals. Starch has been identified as the biopolymer to be used as the
coating over chnp (Figure 2.4).
Gelatinization of starch by moist heat treatment leads to the breakdown of starch granules
and leaching of amylose. This amylose when subjected to a temperature of 2–4 °C for 24
hours undergoes retrogradation, which alters the rate of starch digestion in the body [49].
Retrogradation, is the realignment of the polymeric chains in gelatinized starch upon
cooling [73]. Starch acquires crystallinity on retrogradation which offers gastric protection
[50]. But depending on its native source, it is converted to slowly digestible starch which
enables it to be digested in SIF over time. Hylon VII which has a high amylose content,
when modified in this manner, is converted to resistant starch that is degraded only by the

Literature Review Chapter 2
24
colonic microbiome and remains unaffected in the upper part of the GIT. Thus, subjecting
two different types of starch to retrogradation enables it to be protected in the stomach,
but selectively degraded either in the small intestine or large intestine depending on its
native susceptibility.
Some preliminary work done by Dimantov et al. and Meneguin et al. exemplify the ability
of retrograded RS to retard gastric release [50, 52] Very little work, however, has since
been focused on such research and none, so far, as an enteric coating for particulate
delivery systems of the nano-sized range. Based on this hypothesis, retrograded soluble
starch (SS) (susceptible to digestion by amylases in the small intestine) and retrograded
high amylose corn starch, Hylon VII (RS) (susceptible to digestion by enzymes in the
colon) would be used as stimuli-responsive, controlled releasing coatings for gastric
protection and targeted delivery of nanoparticles.
Figure 2.3 Changes in native starch granules upon gelatinization and retrogardation.
Adapted from [73]. Reproduced with permission from John Wiley and Sons.
Compounds extracted from Withania coagulans was chosen as the nutraceutical to be
loaded into the oral delivery system. Two main reasons for choosing this were:
1. The compounds from Withania coagulans have so far never been encapsulated into
any polymeric carrier and the feasibility of encapsulating it, could be tested.
2. The therapeutic properties of the compounds: anti-diabetic and anti-cancer effects,
suited well to exemplify the working of the oral delivery system, as a small

Literature Review Chapter 2
25
intestine targeted (systemic effect – anti-diabetic property) or large intestine
targeted delivery system (local effect – anti-cancer property).
Figure 2.4 Design strategy for the food grade carrier
References
[1] Kaya-Celiker H, Mallikarjunan K. Better Nutrients and Therapeutics Delivery in Food
Through Nanotechnology. Food Engineering Reviews 2012;4:114-23.
[2] Wang S, Su R, Nie S, Sun M, Zhang J, Wu D, et al. Application of nanotechnology in
improving bioavailability and bioactivity of diet-derived phytochemicals. The Journal of
Nutritional Biochemistry 2014;25:363-76.

Literature Review Chapter 2
26
[3] Cerqueira MA, Pinheiro AC, Silva HD, Ramos PE, Azevedo MA, Flores-López ML,
et al. Design of bio-nanosystems for oral delivery of functional compounds. Food
Engineering Reviews 2014;6:1-19.
[4] McClements DJ, Decker EA, Park Y, Weiss J. Structural design principles for delivery
of bioactive components in nutraceuticals and functional foods. Critical reviews in food
science and nutrition 2009;49:577-606.
[5] De Robertis S, Bonferoni MC, Elviri L, Sandri G, Caramella C, Bettini R. Advances in
oral controlled drug delivery: the role of drug-polymer and interpolymer non-covalent
interactions. Expert opinion on drug delivery 2015;12:441-53.
[6] Anandharamakrishnan C. Techniques for Nanoencapsulation of Food Ingredients:
Springer New York; 2013.
[7] Hua S, Marks E, Schneider JJ, Keely S. Advances in oral nano-delivery systems for
colon targeted drug delivery in inflammatory bowel disease: Selective targeting to diseased
versus healthy tissue. Nanomedicine: Nanotechnology, Biology and Medicine 2015.
[8] Roger E, Lagarce F, Garcion E, Benoit JP. Biopharmaceutical parameters to consider
in order to alter the fate of nanocarriers after oral delivery. Nanomedicine (London,
England) 2010;5:287-306.
[9] Shpigelman A, Cohen Y, Livney YD. Thermally-induced β-lactoglobulin–EGCG
nanovehicles: Loading, stability, sensory and digestive-release study. Food Hydrocolloids
2012;29:57-67.
[10] Janaswamy S, Youngren SR. Hydrocolloid-based nutraceutical delivery systems.
Food & Function 2012;3:503-7.
[11] Felice F, Zambito Y, Belardinelli E, D’Onofrio C, Fabiano A, Balbarini A, et al.
Delivery of natural polyphenols by polymeric nanoparticles improves the resistance of
endothelial progenitor cells to oxidative stress. European Journal of Pharmaceutical
Sciences 2013;50:393-9.
[12] Aditya NP, Macedo AS, Doktorovova S, Souto EB, Kim S, Chang P-S, et al.
Development and evaluation of lipid nanocarriers for quercetin delivery: A comparative
study of solid lipid nanoparticles (SLN), nanostructured lipid carriers (NLC), and lipid
nanoemulsions (LNE). LWT - Food Science and Technology 2014;59:115-21.
Literature Review Chapter 2
27
[13] Semalty A, Semalty M, Singh D, Rawat MSM. Preparation and characterization of
phospholipid complexes of naringenin for effective drug delivery. Journal of Inclusion
Phenomena and Macrocyclic Chemistry 2009;67:253-60.
[14] Shpigelman A, Shoham Y, Israeli-Lev G, Livney YD. β-Lactoglobulin–naringenin
complexes: Nano-vehicles for the delivery of a hydrophobic nutraceutical. Food
Hydrocolloids 2014;40:214-24.
[15] Joye IJ, Davidov-Pardo G, Ludescher RD, McClements DJ. Fluorescence quenching
study of resveratrol binding to zein and gliadin: Towards a more rational approach to
resveratrol encapsulation using water-insoluble proteins. Food Chemistry 2015;185:261-7.
[16] Yang J, Zhou Y, Chen L. Elaboration and characterization of barley protein
nanoparticles as an oral delivery system for lipophilic bioactive compounds. Food &
Function 2014;5:92-101.
[17] Israeli-Lev G, Livney YD. Self-assembly of hydrophobin and its co-assembly with
hydrophobic nutraceuticals in aqueous solutions: Towards application as delivery systems.
Food Hydrocolloids 2014;35:28-35.
[18] Maltais A, Remondetto GE, Subirade M. Soy protein cold-set hydrogels as controlled
delivery devices for nutraceutical compounds. Food Hydrocolloids 2009;23:1647-53.
[19] Pérez-Masiá R, López-Nicolás R, Periago MJ, Ros G, Lagaron JM, López-Rubio A.
Encapsulation of folic acid in food hydrocolloids through nanospray drying and
electrospraying for nutraceutical applications. Food Chemistry 2015;168:124-33.
[20] Laelorspoen N, Wongsasulak S, Yoovidhya T, Devahastin S. Microencapsulation of
Lactobacillus acidophilus in zein–alginate core–shell microcapsules via electrospraying.
Journal of Functional Foods 2014;7:342-9.
[21] Rinaudo M. Chitin and chitosan: Properties and applications. Progress in Polymer
Science 2006;31:603-32.
[22] Bernkop-Schnürch A, Dünnhaupt S. Chitosan-based drug delivery systems. European
Journal of Pharmaceutics and Biopharmaceutics 2012;81:463-9.
[23] Amidi M, Mastrobattista E, Jiskoot W, Hennink WE. Chitosan-based delivery systems
for protein therapeutics and antigens. Advanced Drug Delivery Reviews 2010;62:59-82.
Literature Review Chapter 2
28
[24] Saranya N, Moorthi A, Saravanan S, Devi MP, Selvamurugan N. Chitosan and its
derivatives for gene delivery. International Journal of Biological Macromolecules
2011;48:234-8.
[25] Chen L, Subirade M. Chitosan/β-lactoglobulin core–shell nanoparticles as
nutraceutical carriers. Biomaterials 2005;26:6041-53.
[26] Bowman K, Leong KW. Chitosan nanoparticles for oral drug and gene delivery.
International journal of nanomedicine 2006;1:117.
[27] Sonaje K, Lin K-J, Tseng MT, Wey S-P, Su F-Y, Chuang E-Y, et al. Effects of
chitosan-nanoparticle-mediated tight junction opening on the oral absorption of endotoxins.
Biomaterials 2011;32:8712-21.
[28] Chen M-C, Mi F-L, Liao Z-X, Hsiao C-W, Sonaje K, Chung M-F, et al. Recent
advances in chitosan-based nanoparticles for oral delivery of macromolecules. Advanced
Drug Delivery Reviews 2013;65:865-79.
[29] Kerch G. The potential of chitosan and its derivatives in prevention and treatment of
age-related diseases. Mar Drugs 2015;13:2158-82.
[30] Martinez-Huitle CA, Carlesi Jara C, Cerro M, Quiroz M. Chitosan-modified glassy
carbon electrodes: Electrochemical behaviour as a function of the preparation method and
pH2009.
[31] Aguilar ZP. Chapter 5 - Targeted Drug Delivery. In: Aguilar ZP, editor. Nanomaterials
for Medical Applications: Elsevier; 2013. p. 181-234.
[32] Cavalli R, Leone F, Minelli R, Fantozzi R, Dianzani C. New Chitosan Nanospheres
for the Delivery of 5-Fluorouracil: Preparation, Characterization and in vitro Studies.
Current drug delivery 2014;11:270-8.
[33] Rampino A, Borgogna M, Blasi P, Bellich B, Cesàro A. Chitosan nanoparticles:
Preparation, size evolution and stability. International journal of pharmaceutics
2013;455:219-28.
[34] Calvo P, Remuñan-López C, Vila-Jato JL, Alonso MJ. Chitosan and chitosan/ethylene
oxide-propylene oxide block copolymer nanoparticles as novel carriers for proteins and
vaccines. Pharmaceutical research 1997;14:1431-6.

Literature Review Chapter 2
29
[35] Arya N, Chakraborty S, Dube N, Katti DS. Electrospraying: a facile technique for
synthesis of chitosan-based micro/nanospheres for drug delivery applications. Journal of
biomedical materials research Part B, Applied biomaterials 2009;88:17-31.
[36] Ali M, Afzal M, Verma M, Misra-Bhattacharya S, Ahmad FJ, Dinda AK. Improved
antifilarial activity of ivermectin in chitosan–alginate nanoparticles against human
lymphatic filarial parasite, Brugia malayi. Parasitology research 2013;112:2933-43.
[37] Yang Y, Wang S, Wang Y, Wang X, Wang Q, Chen M. Advances in self-assembled
chitosan nanomaterials for drug delivery. Biotechnology advances 2014;32:1301-16.
[38] Jaworek A. Micro- and nanoparticle production by electrospraying. Powder
Technology 2007;176:18-35.
[39] Sridhar R, Ramakrishna S. Electrosprayed nanoparticles for drug delivery and
pharmaceutical applications. Biomatter 2013;3:e24281.
[40] Songsurang K, Praphairaksit N, Siraleartmukul K, Muangsin N. Electrospray
fabrication of doxorubicin-chitosan-tripolyphosphate nanoparticles for delivery of
doxorubicin. Archives of Pharmacal Research 2011;34:583.
[41] Thakral S, Thakral NK, Majumdar DK. Eudragit: a technology evaluation. Expert
opinion on drug delivery 2013;10:131-49.
[42] Patra CN, Priya R, Swain S, Kumar Jena G, Panigrahi KC, Ghose D. Pharmaceutical
significance of Eudragit: A review. Future Journal of Pharmaceutical Sciences 2017;3:33-
45.
[43] Maurya R, Singh AB, Srivastava AK. Coagulanolide, a withanolide from Withania
coagulans fruits and antihyperglycemic activity. Bioorganic & medicinal chemistry letters
2008;18:6534-7.
[44] Bagre AP, Jain K, Jain NK. Alginate coated chitosan core shell nanoparticles for oral
delivery of enoxaparin: in vitro and in vivo assessment. International journal of
pharmaceutics 2013;456:31-40.
[45] Garrait G, Beyssac E, Subirade M. Development of a novel drug delivery system:
chitosan nanoparticles entrapped in alginate microparticles. Journal of microencapsulation
2014;31:363-72.
[46] Gavhane YN, Yadav AV. Loss of orally administered drugs in GI tract. Saudi
Pharmaceutical Journal : SPJ 2012;20:331-44.

Literature Review Chapter 2
30
[47] Kosaraju SL. Colon targeted delivery systems: review of polysaccharides for
encapsulation and delivery. Critical reviews in food science and nutrition 2005;45:251-8.
[48] Sousa T, Yadav V, Zann V, Borde A, Abrahamsson B, Basit AW. On the colonic
bacterial metabolism of azo-bonded prodrugsof 5-aminosalicylic acid. Journal of
pharmaceutical sciences 2014;103:3171-5.
[49] Sajilata M, Singhal RS, Kulkarni PR. Resistant starch–a review. Comprehensive
reviews in food science and food safety 2006;5:1-17.
[50] Bagliotti Meneguin A, Stringhetti Ferreira Cury B, Evangelista RC. Films from
resistant starch-pectin dispersions intended for colonic drug delivery. Carbohydrate
polymers 2014;99:140-9.
[51] Penn state Coeams. John A. Dutton e-education institute. Alternative fuels from
biomass sources.
[52] Dimantov A, Greenberg M, Kesselman E, Shimoni E. Study of high amylose corn
starch as food grade enteric coating in a microcapsule model system. Innovative Food
Science & Emerging Technologies 2004;5:93-100.
[53] Situ W, Chen L, Wang X, Li X. Resistant starch film-coated microparticles for an oral
colon-specific polypeptide delivery system and its release behaviors. Journal of
agricultural and food chemistry 2014;62:3599-609.
[54] Patten G, Augustin M, Sanguansri L, Head R, Abeywardena M. Site Specific Delivery
of Microencapsulated Fish Oil to the Gastrointestinal Tract of the Rat. Dig Dis Sci
2009;54:511-21.
[55] Khan RS, Masud T. Comparison of buffalo cottage cheese made from aqueous extract
of Withania coagulans with commercial calf rennet. International Journal of Dairy
Technology 2013;66:396-401.
[56] Lea S. On a 'Rennet' Ferment Contained in the Seeds of Withania Coagulans.
Proceedings of the Royal Society of London 1883;36:55-8.
[57] Beigomi M, Mohammadifar MA, Hashemi M, rohani MG, Senthil K, Valizadeh M.
Biochemical and rheological characterization of a protease from fruits of Withania
coagulans with a milk-clotting activity. Food Science and Biotechnology 2014;23:1805-
13.

Literature Review Chapter 2
31
[58] Machin RP, Veleiro AS, Nicotra VE, Oberti JC, Padron JM. Antiproliferative activity
of withanolides against human breast cancer cell lines. J Nat Prod 2010;73:966-8.
[59] Ihsan ul H, Youn UJ, Chai X, Park EJ, Kondratyuk TP, Simmons CJ, et al.
Biologically active withanolides from Withania coagulans. J Nat Prod 2013;76:22-8.
[60] Hemalatha S, Wahi A, Singh P, Chansouria J. Hypoglycemic activity of Withania
coagulans Dunal in streptozotocin induced diabetic rats. Journal of ethnopharmacology
2004;93:261-4.
[61] Hemalatha S, Wahi A, Singh P, Chansouria J. Hypolipidemic activity of aqueous
extract of Withania coagulans Dunal in albino rats. Phytotherapy research 2006;20:614-7.
[62] Huang CF, Ma L, Sun LJ, Ali M, Arfan M, Liu JW, et al. Immunosuppressive
withanolides from Withania coagulans. Chemistry & biodiversity 2009;6:1415-26.
[63] Prasad S, Kumar R, Patel D, Hemalatha S. Wound healing activity of Withania
coagulans in streptozotocin-induced diabetic rats. Pharmaceutical biology 2010;48:1397-
404.
[64] Jaiswal D, Rai PK, Watal G. Hypoglycemic and antidiabetic effects of Withania
coagulans fruit ethanolic extract in normal and streptozotocin‐induced diabetic rats.
Journal of food biochemistry 2010;34:764-78.
[65] Datta A, Bagchi C, Das S, Mitra A, Pati AD, Tripathi SK. Antidiabetic and
antihyperlipidemic activity of hydroalcoholic extract of Withania coagulans Dunal dried
fruit in experimental rat models. J Ayurveda Integr Med 2013;4:99-106.
[66] Bharti SK, Kumar A, Sharma NK, Krishnan S, Gupta AK, Padamdeo SR. Antidiabetic
effect of aqueous extract of Withania coagulans flower in Poloxamer-407 induced type 2
diabetic rats. J Med Plants Res 2012;6:5706-13.
[67] Hoda Q, Ahmad S, Akhtar M, Najmi AK, Pillai K, Ahmad SJ. Antihyperglycaemic
and antihyperlipidaemic effect of poly-constituents, in aqueous and chloroform extracts, of
Withania coagulans Dunal in experimental type 2 diabetes mellitus in rats. Human &
experimental toxicology 2010.
[68] Machin RP, Veleiro AS, Nicotra VE, Oberti JC, J MP. Antiproliferative activity of
withanolides against human breast cancer cell lines. J Nat Prod 2010;73:966-8.

Literature Review Chapter 2
32
[69] Ihsan ul H, Youn UJ, Chai X, Park E-J, Kondratyuk TP, Simmons CJ, et al.
Biologically Active Withanolides from Withania coagulans. Journal of Natural Products
2013;76:22-8.
[70] Alam A, Siddiqui M, Hakim M. Clinical efficacy of Withania coagulans Dunal and
Trigonella foenum-graecum Linn. in Type 2 Diabetes mellitus. Indian Journal of
Traditional Knowledge 2009;8:405-9.
[71] Upadhyay B, Gupta V. A clinical study on the effect of Rishyagandha (Withania
coagulans) in the management of Prameha (Type II Diabetes Mellitus). Ayu 2011;32:507.
[72] Marslin G. Nanoencapsulation of a Withania somnifera extract with PCL and MPEG-
PCL di-block copolymer2014.
[73] Wang S, Li C, Copeland L, Niu Q, Wang S. Starch Retrogradation: A Comprehensive
Review. Comprehensive Reviews in Food Science and Food Safety 2015;14:568-85.
Experimental Methodology Chapter 3
33
Chapter 3
Experimental Methodology
This chapter outlines the materials and experimental methodologies
used in this study. For each experiment, the rationale behind choosing
the particular method of experimentation is explained. The chapter
begins with the explanation of the methodologies used for the fabrication
of chnp and the techniques used for forming a gastro resistant coating
on these nanoparticles. This is followed by the enumeration of the
characterization techniques used to analyze the carrier platform. The
second part of the chapter deals with the extraction procedure and
characterization techniques used for analyzing the nutraceutical. The
last part of the chapter focuses on the in vitro experiments carried out,
cell lines used and the various assays performed to quantify the behavior
of the extracts and understand the endpoint results, followed by the
methodology for in vivo studies on diabetic mice.

Experimental Methodology Chapter 3
34
3.1. Carrier fabrication
3.1.1. Electrospraying
Electrospraying is a technique which uses electric field to disperse the polymer solution
into very fine droplets. A high energy positive charge is applied to a metallic tip through
which the polymer solution is flowing and forms a sphere at the tip, due to surface tension.
The electric field applied to the tip then draws the spherical liquid into a cone and
depending on the strength of the applied field, viscosity and flow rate of the solution, the
liquid is either drawn into fibers or sprayed as droplets which can be collected on a
negatively charged grounded collector [1]. Error! Reference source not found. Figure
3.1 shows a typical electrospray setup. In this study, Chnp was fabricated using the
NANON electrospinning setup because of its ability produce particles with lesser poly
dispersity, higher yield in terms of the starting material used and better encapsulation
efficiency compared to the ionic gelation method. A wet electrospraying technique, where
the sprayed particles were collected in a liquid bath containing the cross-linker for chitosan
was followed. The cross linker used was Sodium Tripolyphosphate (TPP) obtained from
Sigma. Low molecular weight chitosan (≥75% deacetylated, viscosity 20–300 cps,
molecular weight 50–190 kDa), used in this study was also obtained from Sigma. The
parameters, such as voltage, working distance, and flow rate were fixed, while chitosan
solution concentration (1% and 2%) (w/v), acetic acid concentration (10%, 30%, 50%, 70%,
and 90%) (v/v), and TPP concentration (1%, 2.5%, and 5%) (w/v) were varied and
optimized to obtain particles in the desired size range [2]. The electrosprayed particles were
collected by centrifugation at 17,000 g for 5 min, washed thrice, and stored after freeze
drying for further use.

Experimental Methodology Chapter 3
35
Figure 3.1 Schematic depicting the electrospray process. Reproduced with permission
from Elsevier. [1]Starch coating
Two different types of starch were used for the coating process. Readily digestible starch,
obtained from potato was used for targeting to small intestine and was designated as SS.
High amylose corn starch Hylon VII® (Ingredion) was used as the resistant starch
designated as RS. The inherent negative charge of the starches, due to the presence of
phosphate groups, was exploited for the coating process. This was utilized for coating it
over the positively charged chnp by means of electrostatic interaction. SS at a concentration
of 5 mg/mL was gelatinized by heating the starch solution up to 1000C. Similarly for
dissolution, RS at a concentration of 5 mg/mL was subjected to three heating cycles to be
dissolved completely [3]. First, it was heated at 1000C for 45 minutes and then under
pressure in an autoclave at 1300C for 30 minutes followed by boiling at 100 0C for another
30 minutes. The volume of the solution was then made up to the initial volume such that
the concentration of starch in the solution remains to be 5 mg/mL. The nanoparticle
suspension at a concentration of 2 mg/mL was added dropwise to the starch solution stirred
at 200 rpm. Chnp and starch were allowed to react for 1 hour to form the electrostatic
interactions. The as-formed particles were collected by centrifugation at 8000 g for 7
minutes. The particles were cross-linked by suspending in 1% sodium trimetaphosphate
(STMP, Sigma) for 1 hour. The starch-coated chnp were stored overnight at 40C to allow
for the retrogradation of starch. The particles were then collected by centrifugation and
stored after freeze drying for further use.

Experimental Methodology Chapter 3
36
3.2. Characterization of the carrier platform
3.2.1. Electron microscopy
Electron microscopy was used as a tool to visualize the particles, the surface morphology,
shape and size of the particles. As the particles were in the size range of 150-200 nm, field
emission scanning electron microscope (FESEM) was used in order to achieve high
resolution images at the size range desired. For the starch coated chnp, since the size was
above 1 µm, scanning electron microscope (SEM) was sufficient to view the particles. The
scanning electron microscope uses a focused beam of electrons that interact with the
sample surface, producing signals, from which the information on topography or
composition of the sample is obtained. In a typical SEM used in this study, a thermionic
tungsten filament is used to generate an electron beam thermionically, which are then
focused onto the sample by means of condenser lenses. Depending on the energy of the
electron beam, the interaction volume varies, which in turn decides the type of signal
produced: secondary electrons (topographical information), back scattered electrons
(information on phase differences), or characteristic x-rays (information on atomic
composition). A variation of the thermionic gun is the field emission gun which produces
highly focused electron beams, that offer better signal to noise ratio enabling greater
resolutions at higher magnifications.
FESEM (JSM 6340F) was used to determine the surface morphology and size of the
particles. In order to make the samples conductive for imaging, the samples mounted onto
carbon tape, were sputter coated with platinum using platinum fine coater for 20 seconds
and 35 seconds at 30mA for drop cast liquid samples and powder samples respectively. For
imaging powder samples, a small amount of the sample was dispersed uniformly onto the
carbon tape and coated with platinum at the above-mentioned specifications. For imaging
individual chnp, the freeze-dried particles were suspended in ethanol and sonicated using
a probe sonicator. This suspension was drop cast onto silicon wafer, air dried and then

Experimental Methodology Chapter 3
37
coated with platinum. The electron micrographs were processed using ImageJ software to
calculate the size of the particles. The imaging was done at 5kV and at a working distance
of 8mm. The starch coated samples were imaged using SEM (JEOL 6360), as they were of
a bigger size. The powder sample was dispersed on carbon tape, coated with gold at imaged
at 5kV with working distance of 20mm. Electron microscopy experiments were carried out
at the Facility for Analysis Characterization Testing and Simulation (FACTS) at NTU.
Dynamic Light Scattering
Dynamic light scattering (DLS) is an optical technique in which the scattering of light by
the particles in the suspension is used to obtain information on the hydrodynamic radius or
the size distribution of the particles in suspension. It is based on the principle that particles
in solution undergo Brownian motion and when a monochromatic beam of light such as
Laser is shone on the particles, the light interacts with the particles either constructively or
destructively, depending on their size, state of motion and distance from one another. This
interference leads to a change in the wave pattern which can then be analyzed using the
photon correlation function to determine the decay time, which in turn can be used in the
Stokes-Einstein equation (Equation 3.1) to determine the particle diameter. The instrument
does the same for multiple particles at different instances and the software computes the
size distribution.
Equation 3.1 Stokes-Einstein relation
𝐷ℎ = 𝑘𝐵𝑇/3𝜋𝜂𝐷𝑡

Experimental Methodology Chapter 3
38
Figure 3.2 Working principle of Dynamic Light Scattering technique [4]
The size distribution of the chnp were characterized with Malvern Zetasizer (Zetasizer
Nano ZS) using Dynamic Light Scattering technique, as the technique offers a quick
measure of the overall size distribution of the nanoparticle suspension based on the
principle above. The samples were checked for size distribution and polydispersity index.
A disposable cuvette was used to measure size distribution. Each Sample was measured in
three runs with every run measured twenty times each. The data reported is the average of
three samples measured as above.
Laser Doppler Electrophoresis
This technique is used for measuring the surface charge or zeta potential of a nanoparticle
in suspension, in combination with a convergent beam of light as in dynamic light
scattering. When charged nanoparticles in suspension are subjected to an applied electric
field, the particles move due to the interaction between two charged particles and also in
response to the applied field. The direction and velocity of the particle is dependent on the

Experimental Methodology Chapter 3
39
particle charge and the electric field. This movement causes a doppler shift in the light that
is being scattered by the particles in motion, which can be used to determine the velocity
of the particles and in turn the surface zeta potential.
Zeta potential measurements were performed using the Malvern Zetasizer Nano ZS.
Samples were placed in a disposable folded capillary cell to measure for zeta potential.
Each Sample was measured in three runs with every run measured twenty times each. The
data reported is the average of three samples measured as above. The instrument was also
used to check the surface charge of the particles after coating them with starch to confirm
the formation of a coating layer.
Figure 3.3 Principle of zeta potential measurement [5]
Confocal microscopy
Confocal Laser Scanning Microscope (CLSM) is an optical microscopy technique that
offers better resolution compared to a fluorescent microscope. In principle, sample that is
capable of producing a fluorescent signal is illuminated using a coherent source of light

Experimental Methodology Chapter 3
40
such as Laser. The light passes through a pinhole aperture and is focused on the sample.
The fluorescence from the sample also reached the detector through a pinhole aperture
placed in from of it. This eliminates all rays that are out of the plane and collects only the
confocal rays, thereby eliminating secondary fluorescence usually observed in wide field
microscope. This results in increased resolution of the images obtained. CLSM was used
in this study, as a means of confirming the coating of starch over chnp. For this,
fluorescently tagged chitosan and starch were used to fabricate the starch coated chitosan
particles. The particles were then observed under confocal microscope to visualize the two
layers. The improved resolution of the microscopic technique greatly helped to confirm the
presence of a coating layer. Confocal microscopy was done at the Advanced Biofilm
Imaging Facility, SCELSE).
Fluorescently tagged polymers were used so that they could help visualize the presence of
core shell morphology under the confocal laser scanning microscope (CLSM). Chitosan
was labeled with rhodamine B, starch and RS were tagged with fluorescein isothiocyanate
(FITC) following the reported protocols [6, 7] . Starch was stained with FITC by incubating
the particles with a solution of FITC followed by washing to remove excess dye. The
florescent tagged polymers were used to prepare the particles with same procedure outlined
above for nanoparticle fabrication and enteric coating. For imaging, about 10 µL of the
particle suspension was dropped on to a glass slide covered with a cover slip and imaged
using Zeiss LSM confocal laser scanning microscope (Carl Zeiss, Germany) with a 20X
objective. For FITC labelled polymers, the excitation peak was centered at 488 nm and
emission peak wavelength of 519 nm. For rhodamine tagged polymers, the excitation and
emission peaks were at 553 and 627 nm respectively. Images were processed and analyzed
using the Zen lite software. Since the resolution of the optical microscope was limited to
200 nm, the chitosan nanoparticle and a layer of thin coating on the particle could not be
visualized distinctively using the confocal microscope. Hence chitosan micro particles
were fabricated using the same protocol as above for chnp, but using a higher concentration
of chitosan. The as formed micro particles were coated with starch and imaged by confocal
microscopy incorporating fluorescent polymers in the fabrication process.

Experimental Methodology Chapter 3
41
CLSM was also used to cellular uptake of chnp. For this, Caco2 cells were cultured on
cover glass coated with gelatin in 6-well plates at a cell density of 105 cells/well and
incubated for 2 h. After the incubation period, the nanoparticles were removed, the cells
were washed with PBS and fixed using 3.7 % formaldehyde for 30 min. Cell nuclei was
stained using DAPI and imaged using confocal microscope [8].
3.3. Extraction and characterization of withanolides from plant source
Withanolides were extracted from the plant Withania coagulans sourced from an herb
supplier in India. The extraction process was performed according to previously reported
procedure with slight modifications [9]. A known weight of the berries from the plant were
crushed mechanically using pestle and mortar and the coarse powder obtained was soaked
in a 1:1 mixture of water and ethanol for 24 hours. The extract was collected by filtering
out the coarse powder using Whatman filter paper. The hydro alcoholic extract was
concentrated using a rotary evaporator. An aliquot of the concentrated extract was mixed
with a 1:1 mixture of water and ethyl acetate and extracted to obtain a water soluble fraction
and ethyl acetate soluble fraction. The ethyl acetate soluble fraction was subjected to
column chromatography over silica gel (230-400 mesh size) using a mixture of chloroform
and methanol as the mobile phase. The fraction collected from this column was assigned
as P2. The water soluble fraction was concentrated using rotary evaporator and subjected
to column chromatography over silica gel (230-400 mesh size) using a mixture of water
and methanol as the mobile phase. The fraction collected from this column was assigned
as P4. When P2 and P4 are referred to collectively, it is called as coagulans
3.3.1. Fourier Transform Infrared Spectroscopy (FTIR)
Fourier-Transform Infrared (FTIR) spectroscopy is an absorption spectroscopy technique
which uses the interaction between infrared (IR) radiation interaction and the chemical
bonds in molecules, to understand the structure of the molecule (Figure 3.4). When IR
radiation interacts with a molecule, the molecule absorbs energy and the chemical bonds
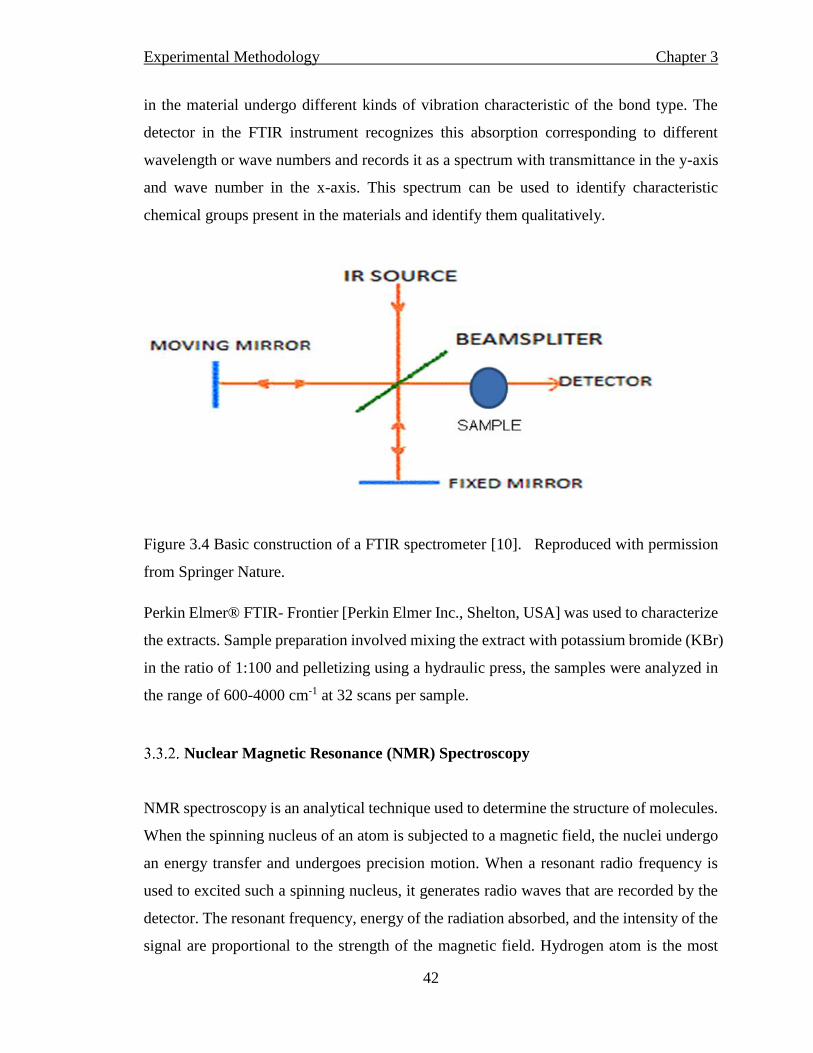
Experimental Methodology Chapter 3
42
in the material undergo different kinds of vibration characteristic of the bond type. The
detector in the FTIR instrument recognizes this absorption corresponding to different
wavelength or wave numbers and records it as a spectrum with transmittance in the y-axis
and wave number in the x-axis. This spectrum can be used to identify characteristic
chemical groups present in the materials and identify them qualitatively.
Figure 3.4 Basic construction of a FTIR spectrometer [10]. Reproduced with permission
from Springer Nature.
Perkin Elmer® FTIR- Frontier [Perkin Elmer Inc., Shelton, USA] was used to characterize
the extracts. Sample preparation involved mixing the extract with potassium bromide (KBr)
in the ratio of 1:100 and pelletizing using a hydraulic press, the samples were analyzed in
the range of 600-4000 cm-1 at 32 scans per sample.
Nuclear Magnetic Resonance (NMR) Spectroscopy
NMR spectroscopy is an analytical technique used to determine the structure of molecules.
When the spinning nucleus of an atom is subjected to a magnetic field, the nuclei undergo
an energy transfer and undergoes precision motion. When a resonant radio frequency is
used to excited such a spinning nucleus, it generates radio waves that are recorded by the
detector. The resonant frequency, energy of the radiation absorbed, and the intensity of the
signal are proportional to the strength of the magnetic field. Hydrogen atom is the most

Experimental Methodology Chapter 3
43
common nucleus used for excitation. The resonant frequency of the nuclei is dependent on
the functional groups surrounding the atom. Based on the chemical shifts reported,
information on the structure of the molecule can be obtained.
The samples were characterized using 1H NMR. NMR spectra were recorded on a (Bruker)
AV400 MHz spectrometer, using DMSO-d6 & D2O as solvents with TMS as internal
reference.
Figure 3.5 Basic arrangement of a NMR spectrophotometer [11]
MALDI-TOF
Mass spectrometry is an important characterization tool to evaluate the molecular weight
of any unknown sample or to characterize a sample with a mixture of compounds having
different molecular weights. MALDI (Matrix Assisted Laser Desorption Ionization) is a
soft ionization technique, wherein the sample is mixed with a matrix compound that can
absorb UV light (nitrogen LASER light at 334 nm) and ionize the analyte molecule as a
whole. The analyte molecule is detected based on the Time of flight (TOF) i.e. the time the
analyte molecules take to reach the detector, depending on the mass to charge ratio. The
sample to be analyzed is mixed with the analyte molecule and allowed to crystallize. Upon
evaporation of the liquid, the sample consists of dry crystals of the sample mixed with the

Experimental Methodology Chapter 3
44
matrix. When this mixture is irradiated with laser, the matrix assists in volatilization and
ionization of the samples. These charged ions are then accelerated towards the detector due
to the potential difference applied between the sample slide and the ground. Lighter ions
with a smaller m/z value and more highly charged ions move faster through the tube until
they reach the detector. As such, depending upon the mass-to-charge ratio (m/z) value of
ions, the time of flight differs accordingly from ions to ions. Thus, the time-of-flight (TOF)
is directly proportional to the mass of the molecule and has mass resolution of
approximately 0.03%. Based on the TOF, the software computes the m/z value and
chromatogram is generated by presenting intensity (y-axis) versus m/z (x-axis).
The rationale behind using this characterization technique is to identify the different
compounds, by means of identifying their molecular weights, in the two fractions P2 and
P4. P2 dissolved in methanol and P4 dissolved in water were added to the analyte plate and
mixed with the matrix molecule. The samples once dry were analyzed using AXIMA
performance MALDI-TOF.
Figure 3.6 Working principle of a mass spectrometer [12]
Experimental Methodology Chapter 3
45
High Performance Liquid Chromatography (HPLC)
HPLC is an analytical chromatographic technique that involves the separation, identification
and quantification of molecules in a mixture. The basic principle of the technique involves
eluting a liquid solvent (mobile phase) of desired polarity, through a tightly packed adsorbent
column, into which the sample is injected. Depending on the competitive affinity of the sample
to the column or to the mobile phase, it is eluted out of the column into the detector which
measures the absorbance of the molecule reaching it at that particular time. The output is
displayed as a peak with intensities depending on the concentration of the analyte molecule
at a retention time specific for each molecule in the sample. The concentration of the
analyte can be quantified by computing the peak area and comparing with a calibration
curve. HPLC was used in this study to quantify the amount of P2 and P4 encapsulated into
the delivery system and also to evaluate the release kinetics of these fractions from the
carrier.
Concentration of P2 in the supernatant was evaluated using HPLC (Shimadzu Prominence
UFLC with a photo diode array detector SPD-M20A, Ascentis C18 column (10cm, 2.1cm
I.D and 5μm) with methanol-water (3:2) as the mobile phase at a flow rate of 0.4 mL/min,
maintained at 300C. Suitable standards were prepared in methanol to obtain a calibration
curve. Similarly, for P4, the mobile phase used methanol-water (1:1), at a flow rate of 0.2
mL/min. HPLC was performed at the Analytical Instrument Facility at SCELSE.
Encapsulation efficiency and Release kinetics studies
The encapsulation efficiency (EE) of both P2 and P4 were calculated using an indirect
method by measuring the amount of extract in the supernatant from which the particles
were collected. Concentration of coagulans in the supernatant was evaluated using HPLC
as described above. The EE was then calculated based on Equation 3.2

Experimental Methodology Chapter 3
46
Equation 3.2 Formula for calculating encapsulation efficiency
𝐸𝐸 =𝐼𝑛𝑖𝑡𝑖𝑎𝑙 𝑎𝑚𝑜𝑢𝑛𝑡 𝑜𝑓 𝑑𝑟𝑢𝑔 − 𝐴𝑚𝑜𝑢𝑛𝑡 𝑜𝑓 𝑑𝑟𝑢𝑔 𝑖𝑛 𝑠𝑢𝑝𝑒𝑟𝑛𝑎𝑛𝑡𝑎𝑛𝑡
𝐼𝑛𝑖𝑡𝑖𝑎𝑙 𝑎𝑚𝑜𝑢𝑛𝑡 𝑜𝑓 𝑑𝑟𝑢𝑔∗ 100 %
Release kinetics of P2 was studied from bare chnp and RS-coated chnp (C+RS) and for P4
from bare chnp and soluble starch coated chnp (C+S), sequentially under three different
conditions – SGF, SIF and SCF in order to mimic in vivo conditions. The SGF and SIF
were prepared according to the US Pharmacopeia guidelines [13] and SCF was prepared
by adding 2 mg mL-1 lysozyme and 20µL/mL α-amylase from Bacillus licheniformis to
phosphate buffered saline (PBS) [14, 15]. P2 release studies were done in SGF, SIF and
SCF with 0.1% tween 20 added to it. pH 4.4 medium was prepared by adjusting the pH of
PBS to 4.4 using 0.1N HCl.
All release studies were performed by suspending the particles in the release media at 370C
in an incubator fitted with a rotating wheel at a speed of 20 rpm over a period of 48 h. The
time frames in each of the simulated fluids were chosen to mimic the residence times of
food in each region of the GIT – stomach (2 h), small intestine (3 h) and large intestine (43
h). The release was carried out in SGF for the first 2 h, followed by replacing the release
medium to SIF for 3 h and then to SCF until the completion of the study. For the C+S
particles, as the enteric coating is intended to break down in the small intestine and chnp
taken up by enterocytes, the particles were transferred to a pH 4.4 buffer (PBS adjusted to
pH 4.4) after SIF, to mimic the conditions after cell uptake. Aliquots were drawn from the
release medium at fixed time points and for each time point, the amount of release medium
withdrawn was replaced with fresh medium to maintain sink conditions. For P2, the
nutraceutical in the aliquots had to be extracted from the simulated GIT fluids into
methanol in order to be evaluated by HPLC. This was done by extracting it into
Dichloromethane (DCM), which was then evaporated and re-suspended in methanol. The
samples thus prepared were analyzed using HPLC as mentioned in section 3.3.4. For P4,
the release media collected at each time was freeze dried and suspended in the mobile phase
and analyzed using HPLC.

Experimental Methodology Chapter 3
47
3.4. Cell Culture
Four different cell types were used in this study to understand the function of the coagulans
extracts in vitro. The media used for each cell line is denoted in Error! Reference source
ot found.. All cells were cultured in a 370C incubator maintained at 5% CO2 condition.
Table 3.1 Cell lines used and their culture conditions
Cell line Cell type Media
Caco2 (colorectal
adenocarcinoma cells)
Human colon epithelial
cells
DMEM supplemented
with 10% FBS, 1% penicillin
streptomycin solution,
and 1% NEAA
CRL 1831 (normal
colon cells)
Human colon epithelial
cells
DMEM/F-12 supplemented with
10% FBS and 1% penicillin
streptomycin
HDF (normal skin
cells)
Human dermal
fibroblast cells
DMEM supplemented
with 10% FBS and 1% penicillin
streptomycin solution,
MIN6 (Pancreatic
beta cells)
Mouse epithelial cells
from the pancreas
DMEM supplemented
with 10% FBS and 0.001%
βmercaptoethanol
3.4.1. Cell viability assay
In order to evaluate the toxicity of the extracts and also its ability to kill cancer cells, the
percentage of cells that are actively viable, needs to be estimated. Commercially available
cell viability assays use tetrazolium salt, which is reduced by metabolically active cells to
generate a colored formazan dye. These dyes are non-toxic to the cells. CCK-8 is one such
assay that uses WST-8 to generate a colorimetric reaction. The mechanism of action of the

Experimental Methodology Chapter 3
48
assay is illustrated in Figure 3.7. The end result is absorbance measured at 450 nm. % cell
viability is calculated based on Equation 3.3 after subtracting the absorbance value of the
blank media.
For all toxicity and cell viability assays, cells were seeded onto 96 well plate at a cell
density of 104 cells per well, with 5 replicates. The cells reached confluency after 24 hours.
To begin with, the media is removed after 24 hours and fresh media was added to all wells.
The extracts whose toxicity is desired to be tested, was added as per the required
concentrations intended to be tested. After the stipulated time points (2, 24 or 48 hours),
the media containing the coagulans extracts was removed and replaced with fresh media.
To this, 10 µl of the CCK8 assay reagent (Dojindo Molecular Technologies, Inc) was added
and incubated at 370C for 2 hours. The absorbance was measured at 450nm and the cell
viability was calculated.
Figure 3.7 Principle of cell viability detection using CCK-8 assay [16]
Equation 3.3 Formula for % cell viability calculation
% 𝑐𝑒𝑙𝑙 𝑣𝑖𝑎𝑏𝑖𝑙𝑖𝑡𝑦 = (𝑎𝑏𝑠𝑜𝑟𝑏𝑎𝑛𝑐𝑒 𝑜𝑓 𝑡𝑟𝑒𝑎𝑡𝑒𝑑 𝑐𝑒𝑙𝑙𝑠
𝑎𝑏𝑠𝑜𝑟𝑏𝑎𝑛𝑐𝑒 𝑜𝑓 𝑢𝑛𝑡𝑟𝑒𝑎𝑡𝑒𝑑 𝑐𝑒𝑙𝑙𝑠) ∗ 100

Experimental Methodology Chapter 3
49
Glucose stimulated insulin secretion assay (GSIS)
For the insulin release study, cells were seeded on 6 well plates at the density of 1x10⁵ cells
per well and studied using the Glucose stimulated Insulin Secretion assay (GSIS). Briefly,
once the cells reach confluency after 48 hours, DMEM was removed, the cells were washed
and starved by incubating in Ca-10 buffer with 0.5mM glucose. After 2 hours starvation,
the buffer was removed and the cells were incubated for another 30 minutes in Ca-10 buffer
with 3.3 mM glucose and the samples were collected to be analyzed by ELISA for the
insulin secreted under low glucose condition. After this 30 minute starvation, the cells were
stimulated by treating with Ca-10 buffer containing 16.7 mM glucose and the P4 treatments
were added. The samples from the wells were collected to be analyzed by ELISA for insulin
secretion under the stimulated condition in the presence or absence of P4. Insulin index
was calculated using the Equation 3.4. For studying the effect of P4 encapsulated particles,
onMIN6 cells, the particles were subjected to different simulated fluids and the release
media collected at each time point, was added to the cells after 100 times dilution and GSIS
assay similar to that of free P4 was carried out.
Equation 3.4 Formula used to calculate insulin index
𝐼𝑛𝑠𝑢𝑙𝑖𝑛 𝑖𝑛𝑑𝑒𝑥 =𝐴𝑚𝑜𝑢𝑛𝑡 𝑜𝑓 𝑖𝑛𝑠𝑢𝑙𝑖𝑛 𝑠𝑒𝑐𝑟𝑒𝑡𝑒𝑑 𝑖𝑛 ℎ𝑖𝑔ℎ 𝑔𝑙𝑢𝑐𝑜𝑠𝑒 𝑐𝑜𝑛𝑑𝑖𝑡𝑖𝑜𝑛
𝐴𝑚𝑜𝑢𝑛𝑡 𝑜𝑓 𝑔𝑙𝑢𝑐𝑜𝑠𝑒 𝑠𝑒𝑐𝑟𝑒𝑡𝑒𝑑 𝑖𝑛 𝑙𝑜𝑤 𝑔𝑙𝑢𝑐𝑜𝑠𝑒 𝑐𝑜𝑛𝑑𝑖𝑡𝑖𝑜𝑛
ELISA
Enzyme-linked immunosorbent assay abbreviated as (ELISA) is a diagnostic tool used to
detect a particular substance using antibodies specific to that substance and an enzyme that
produces a colored reaction, in order to quantify the substance. The insulin ELISA kit from
Mercodia, used in this study for insulin detection, works on the principle of sandwich
ELISA. The schematic of the process is depicted in Figure 3.8. Briefly, the primary
monoclonal antibody specific for one of the antigenic determinants on the insulin molecule,
is coated onto the micro titration wells. Insulin in the sample is then bound to this antibody.

Experimental Methodology Chapter 3
50
Another specific antibody for the second antigenic determinant on the insulin molecule is
added, thereby sandwiching the molecule between the antibodies. A secondary antibody
conjugated to an enzyme is then added. The enzyme then reacts with a substrate to give a
colored product, which is read as absorbance signal and used to quantify the insulin in the
sample based on the calibration curve.
Figure 3.8 Schematic showing the steps involved in sandwich ELISA [17]
Flow cytometry
The basic working of a flow cytometer, involves a flow cell which allows for stream lining
of the cells using a sheath fluid and exposing each cell to the Laser source. The resulting
fluorescence from the cells are recorded on a detector and data are represented based on
fluorescence intensity with respect to the forward scatter or side scatter. The equipment
allows for multiparametric analysis of thousands of cells per second. Flow cytometry was
used in this study to quantify the uptake of fluorescent chnp by Caco2 cells.
For cytotoxicity studies, cells were seeded on a 96-well plate at a density of 104 cells/well.
Cells reached confluence after 48 h. The cells were then incubated with chnp for 2, 4, 6
and 24 h after which the nanoparticles were removed and cell viability assessed using
CCK-8 kit. For cell uptake studies, cells were seeded in a 6-well plate at a cell density of
105 cells/well. The cells reached confluence after three days. Fluorescent chnp prepared by
loading coumarin 343 was used for the cell uptake studies. Coumarin 343 was loaded into
chnp using cyclodextrin to load a hydrophobic molecule in chnp [18]. Briefly 10 mg/mL
cyclodextrin was dissolved into chitosan solution and then 0.2 mg/mL of coumarin 343
was added to this solution. The dye was solubilized due to the presence of cyclodextrin.

Experimental Methodology Chapter 3
51
This chitosan solution was then used to fabricate chnp as mentioned in section 3.1.1.
Fluorescent chnp at a concentration of 0.5 mg/mL was added to the wells and incubated
for 2, 4 and 6 h. After the incubation period, the nanoparticles were removed, the cells
washed thrice with PBS and then collected by trypsinization for analysis by flow cytometry
(BD accuri C6 flow cytometer, SCELSE).
Figure 3.9 Basic working of a flow cytometer [19]
3.5. In vivo studies
The effect of the two fractions, P2 and P4 were tested on ICR mice induced with diabetes
using alloxan. Male ICR mice, aged 5 weeks were obtained from Nomura Siam
International, Thailand. On arrival, the animals were housed in stainless steel cages (2 mice

Experimental Methodology Chapter 3
52
per cage) at the Laboratory Animal Facility, Suranaree University of Technology. After
acclimatization for a week, the mice were induced with diabetes by peritoneal injection of
alloxan (120 mg/kg), based on the protocol adapted from Alam et.al. [20]. Food and water
were given ad libitum. Fasting blood glucose (FBG) levels were monitored after 3 days of
alloxan injection. The animals with FBG ≥ 250 mg/dL were used for the study. In order to
keep the initial FBG levels same across the groups, the animals were grouped such that the
average of the FBG in each group was not statistically different across the groups. For the
initial study, animals were divided into different treatment groups and treated with P2 or
P4, with deionized water and glibenclemide being used as negative and positive controls
respectively. The extracts P2 and P4 were dissolved in its respective solvents, DMSO and
water and was fed by oral gavage every day for the entire experiment period. The body
weight and fasting blood glucose was monitored on day 0 at the start of the experiment and
at day 5 at the end of the experiment. A set of control animals that were not induced with
diabetes also received similar treatments over 15 days, to assess for any toxicity of the
fractions.
For studying the effect of encapsulating the extracts into the carrier system, chnp, C+S and
C+RS particles loaded with P4 were prepared and fed at the concentration to match the
50mg/kg every day, calculated based on encapsulation efficiency. The particles were
suspended in DI water and fed to the animals by oral gavage. The animals were grouped
as in Table 3.2. The in vivo experiments were carried out at Suranaree University of
Technology, Thailand. All procedures were approved and conducted following the
guidelines of the Institutional Animal Care and Use Committee, Suranaree University of
Technology (B 2559/00020.001 (SUT Laboratory Animal Facility), U1-01433-2558
(Investigator)).
The major limitations of the alloxan induced diabetes model is high mortality if severe
diabetes is induced or auto-reversion to normoglycemic state, due to regeneration of β cells
if the diabetes is mild [21, 22]. To overcome this limitation, the animals were grouped such
that each group had animals with a gradient of blood glucose from mildly diabetic to
severely diabetic. In addition, each group consisted of 5 animals to begin with, to allow for

Experimental Methodology Chapter 3
53
deaths of any severely diabetic animals and data from three animals were alone chosen for
the analysis. The study was limited to only 10 days, as chances of auto-reversal to
normoglycemic state was high beyond this time.
Table 3.2 Grouping of animals for in vivo study
Normal +DI Non-diabetic mice fed deionized water
Normal+DMSO Non-diabetic mice fed DMSO
Normal+P2 50mg/Kg Non-diabetic mice fed P2
Normal +P4 50mg/Kg Non-diabetic mice fed P4
DM+DI Diabetic mice fed deionized water
DM+DMSO Diabetic mice fed DMSO
DM+P2 50mg/Kg Diabetic mice fed P2
DM+P4 50mg/Kg Diabetic mice fed P4
DM+glibenclemide 20
mg/Kg
Diabetic mice fed Glibenclemide
DM+chnp Diabetic mice fed chnp
DM+ C+S Diabetic mice fed C+S particles
DM+ C+RS Diabetic mice fed C+RS particles
3.6. Statistical analysis
All experiments were carried out in triplicates and data were expressed as mean ± standard
deviation. Comparisons between test groups were made with one-way ANOVA, followed
by Tukey’s HSD post hoc test, on Origin Pro 9.0 software.
All experiments were carried out at the School of Materials Science and Engineering, NTU,
except where mentioned otherwise.

Experimental Methodology Chapter 3
54
References
[1] Anu Bhushani J, Anandharamakrishnan C. Electrospinning and electrospraying
techniques: Potential food based applications. Trends in Food Science & Technology
2014;38:21-33.
[2] Arya N, Chakraborty S, Dube N, Katti DS. Electrospraying: a facile technique for
synthesis of chitosan-based micro/nanospheres for drug delivery applications. Journal of
biomedical materials research Part B, Applied biomaterials 2009;88:17-31.
[3] Dundar AN, Gocmen D. Effects of autoclaving temperature and storing time on
resistant starch formation and its functional and physicochemical properties. Carbohydrate
polymers 2013;97:764-71.
[4] Fritsch. Dynamic Light Scattering (DLS).
[5] University SPS. Zeta potential mesearument principle. p.
http://laser.spbu.ru/en/research-eng/dzeta-eng.html.
[6] Qaqish R, Amiji M. Synthesis of a fluorescent chitosan derivative and its application
for the study of chitosan–mucin interactions. Carbohydrate Polymers 1999;38:99-107.
[7] Li Y, Tan Y, Ning Z, Sun S, Gao Y, Wang P. Design and fabrication of fluorescein-
labeled starch-based nanospheres. Carbohydrate Polymers 2011;86:291-5.
[8] Akbari A, Wu J. Cruciferin coating improves the stability of chitosan nanoparticles at
low pH. Journal of Materials Chemistry B 2016;4:4988-5001.
[9] Maurya R, Akanksha, Jayendra, Singh AB, Srivastava AK. Coagulanolide, a
withanolide from Withania coagulans fruits and antihyperglycemic activity. Bioorganic &
medicinal chemistry letters 2008;18:6534-7.
[10] Kumar D, Singh B, Bauddh K, Korstad J. Title: Bio-oil and biodiesel as biofuels
derived from microalgal oil and their characterization by using instrumental
techniques2015.
[11] University of Calgary. Basic principles of spectroscopy.
http://wwwchemucalgaryca/courses/351/Carey5th/Ch13/ch13-nmr-1bhtml.
[12] Hebrard G, Hoffart V, Beyssac E, Cardot JM, Alric M, Subirade M. Coated whey
protein/alginate microparticles as oral controlled delivery systems for probiotic yeast. J
Microencapsul 2010;27:292-302.

Experimental Methodology Chapter 3
55
[13] Christensen LD, van Gennip M, Rybtke MT, Wu H, Chiang W-C, Alhede M, et al.
Clearance of Pseudomonas aeruginosa foreign-body biofilm infections through reduction
of the cyclic di-GMP level in the bacteria. Infection and immunity 2013;81:2705-13.
[14] Cristina Freire A, Fertig CC, Podczeck F, Veiga F, Sousa J. Starch-based coatings for
colon-specific drug delivery. Part I: The influence of heat treatment on the physico-
chemical properties of high amylose maize starches. European Journal of Pharmaceutics
and Biopharmaceutics 2009;72:574-86.
[15] Shigemasa Y, Saito K, Sashiwa H, Saimoto H. Enzymatic degradation of chitins and
partially deacetylated chitins. Int J Biol Macromol 1994;16:43-9.
[16] Dojindo molecular technologies. Principle of CCK8 assay.
https://wwwvitascientificcom/colorimetric-cell-proliferation-and-cytotoxicity-assay-cell-
counting-kit-8-cck-8-various-kit-sizeshtml.
[17] Avacta. How antibodies can cause false ELISA results.
[18] Yuan Z, Ye Y, Gao F, Yuan H, Lan M, Lou K, et al. Chitosan-graft-β-cyclodextrin
nanoparticles as a carrier for controlled drug release. International Journal of
Pharmaceutics 2013;446:191-8.
[19] Abcam. Introduction to flow cytometry.
[20] Alam MM, Meerza D, Naseem I. Protective effect of quercetin on hyperglycemia,
oxidative stress and DNA damage in alloxan induced type 2 diabetic mice. Life sciences
2014;109:8-14.
[21] Ighodaro OM, Adeosun AM, Akinloye OA. Alloxan-induced diabetes, a common
model for evaluating the glycemic-control potential of therapeutic compounds and plants
extracts in experimental studies. Medicina 2017;53:365-74.
[22] Jain DK, Arya RK. Anomalies in alloxan-induced diabetic model: It is better to
standardize it first. Indian journal of pharmacology 2011;43:91-.


Carrier fabrication and characterization Chapter 4
57
Chapter 4
Carrier fabrication and characterization
The chapter focuses on the fabrication of an oral delivery system using
food grade polymers and its characterization. The first part of the
chapter discusses the results on the fabrication of chnp using
electrospraying. The particles were characterized using DLS and
FESEM and was found to have a diameter of around 175 nm with a
positive zeta potential of +20mV. The coating of starch on chnp are
described subsequently and the coated particles were characterized
using confocal microscopy to confirm the presence of a coating layer.
The second part of the chapter discusses the results on the evaluation
of the functionality of starch as a gastro protective coating by
comparing it with other commercial polymers. The chapter ends with
the results on the cellular uptake study of chnp.
________________
*This section has been published substantially as Kaarunya, S. and L.S.C. Joachim, Targeted
Gastrointestinal Delivery of Nutraceuticals with Polysaccharide‐Based Coatings. Macromolecular
Bioscience, 2018. 18(4): p. 1700363.

Carrier fabrication and characterization Chapter 4
58
4.1. Fabrication and characterization of chnp
Chnp, in this study, were fabricated using electrospraying as outlined in section 3.1 . The
basic working parameters were adapted from the work by Arya et.al, with the voltage set
at 25 kV, flow rate at 0.2 mL/h, the working distance at 7 cm, and needle gauge size as
25G [1]. Optimization was done for the acetic acid concentration, chitosan concentration
and collector solution. Since viscosity plays an important role in electrospraying, two
different concentrations of chitosan solutions at varying acetic acid concentrations, were
used for optimization studies. Above 2% (w/v) concentration, the solution was too viscous
to obtain nanoparticles, and below 1% (w/v) concentration, the formation of a stable jet
was impaired. As 2% (w/v) chitosan solution, led to the formation of particles larger than
500 nm, the chitosan concentration was subsequently fixed at 1% (w/v). At lower acetic
acid concentrations, the conductivity of the solution was very poor and the formation of a
stable jet was impaired. It was possible to electrospray only for concentrations above 10%
(v/v) acetic acid concentrations. At 10 and 30% (v/v) acetic acid concentration, the droplets
formed were not distinct, due to the lower surface charge, resulting in conjoined or
aggregated particles. At concentrations greater than 50% (v/v), i.e. at 70 and 90% (v/v), the
increased surface charge resulted in the formation of beaded fibers, leading to the formation
of polymer patches rather than nanoparticles on the collector. At a concentration of 50%
(v/v), the droplets were well defined and could be collected as individual beads on the
collector. The final acetic acid concentration was fixed at 50% (v/v).
The composition of the collector solution is an important determinant to get a powdered
sample, in the wet electrospraying method used here. The collector also acts as the cross-
linker for chitosan. The cross-linker used for chitosan was TPP. The zeta potential of the
particles was influenced by pH and concentration of the collector. Any concentration of
TPP above 1% (w/v), resulted in negative zeta potential of chnp due to complete coverage
of the amine groups on chitosan. Also electrospraying using this TPP concentration, led to
film formation due to its inherent surface tension. In order to overcome the surface tension
and disperse the particles while they were being sprayed, 0.5% (w/v) Tween 80 was added
to TPP. This resulted in well dispersed particles with a zeta potential of +20.8 mV and a

Carrier fabrication and characterization Chapter 4
59
hydrodynamic size of 175.8±37.4 nm (Table 4.1) with a polydispersity index of 0.205.
Figure 4.2 (a-d) shows the FESEM images of the chnp at different acetic acid
concentrations. Figure 4.2 (e & f) shows the FESEM images of particles obtained using the
optimized parameters as reflected in Figure 4.1.
Figure 4.1 Graphic showing the optimized parameters used for electrospraying of chnp.
The optimized parameters are indicated in bold fonts. Reproduced with permission from
John Wiley and Sons.

Carrier fabrication and characterization Chapter 4
60
Figure 4.2 Field-emission scanning electron microscopic images of chnp. Electrosprayed
chnp at different acetic acid concentrations: a) 30%, b) 50%, c) 70%, and d) 90%.
Electrosprayed chnp with optimized parameters collected on e) aluminum foil, f) 1% TPP
solution with 0.5% Tween 80. Particles were collected from solution by centrifugation at
15,000 rpm, freeze dried, and imaged by dispersing in ethanol and drop casting on silicon
wafer. Reproduced with permission from John Wiley and Sons.

Carrier fabrication and characterization Chapter 4
61
Table 4.1 Zeta potential and size of Chnp, C+S and C+RS measured using DLS
Zeta potential
[mV]
Hydrodynamic size - diameter
[nm]
Chnp +20.8±3.01 175.8±37.4
C+S -16.66±1.65 6534±1760
C+RS -7.15±1.87 5862±910
4.2. Starch coating on chnp and characterization
The electrostatic interaction between chnp and starch was used as basis to achieve a
polysaccharide coating on chnp. The starch granules in SS and RS has a negative charge
due to the presence of native phosphate groups [2] This was exploited to form a starch
coating on chnp. The formation of a coating layer was confirmed by the inversion of
positive zeta potential of chnp to a negative charge on the starch coated particles as shown
in Table 4.1 and also by an increase in particle size (Figure 4.3). The particles, as they are
made from hydrogels, tend to aggregate, and need to be sonicated to achieve individual
particles. The hydrodynamic size of the particles measured from DLS was 6534±1760 nm
for C+S and 5862±910 nm for C+RS. There was a variation in the size of the particles
when coated with starchFSS or RS, as clusters of chnp were coated with starch rather than
individual particle being coated separately. This was also evident in the size distribution of
the particles, with the polydispersity index ranging from 0.5 to 0.8.
The formation of a coating on chnp was confirmed by confocal microscopy using
fluorescently tagged polymers. However, the resolution of the optical microscope was
limited in visualizing the distinctive core shell morphology of the C+S or C+RS. Hence to
confirm the coating of starch on chitosan, chitosan microparticles coated with starch were
used. For this, chitosan microparticles were fabricated using the technique similar to that

Carrier fabrication and characterization Chapter 4
62
of chnp but varying the concentration of the chitosan solution alone and subsequently
coated with starch. Our rationale is that if the layers could be visualized on the
microparticles, then they should be similarly present on the nanoparticles that were also
fabricated by the same method. Figure 4.4 shows the distinctive presence of fluorescent
Rhodamine B tagged chitosan microparticles and a layer of FITC tagged starch hydrogel
surrounding the particle. Based on the collective data from DLS, FESEM and fluorescence
microscope, the starch coating on chitosan is conclusively evident.
Figure 4.3 Scanning electron microscopic images of (a) starch coated chnp (b) RS coated
chnp. Reproduced with permission from John Wiley and Sons.

Carrier fabrication and characterization Chapter 4
63
Figure 4.4 CLSM images of starch coated chnp showing the chitosan core and starch shell.
(a) C+S (b) C+RS. The left panel shows the rhodamine tagged chitosan, middle panel
shows the FITC tagged starch and the right panel shows the merge of the two. Reproduced
with permission from John Wiley and Sons.
4.3. Evaluation of starch as a protective coating
In order to evaluate the efficacy of starch as an enteric coating, films made of SS and RS
were prepared by casting them in a petri dish after dissolution and retrogradation. The films
were dried overnight at 370C. The starch films, were suspended in Simulated Gastric Fluid
(SGF), Simulated Intestinal Fluid (SIF) and Simulated Colonic Fluid (SCF) for 2, 4 and 6
h each and the % weight loss was calculated using the formula below:
% 𝑤𝑒𝑖𝑔ℎ𝑡 𝑙𝑜𝑠𝑠 =𝐼𝑛𝑖𝑡𝑖𝑎𝑙 𝑑𝑟𝑦 𝑤𝑡 𝑜𝑓 𝑡ℎ𝑒 𝑓𝑖𝑙𝑚 − 𝑓𝑖𝑛𝑎𝑙 𝑑𝑟𝑦 𝑤𝑡 𝑜𝑓 𝑡ℎ𝑒 𝑓𝑖𝑙𝑚
𝐼𝑛𝑖𝑡𝑖𝑎𝑙 𝑑𝑟𝑦 𝑤𝑡 𝑜𝑓 𝑡ℎ𝑒 𝑓𝑖𝑙𝑚∗ 100%

Carrier fabrication and characterization Chapter 4
64
The study was done to assess the ability of the starch films to withstand the conditions in
the stomach and to test its susceptibility to the conditions in the small and large intestines
over different time intervals, in comparison to the commercial enteric polymers. Films of
Eudragit L100 (EL100) and Eudragit S100 (ES100) were prepared by solvent casting and
was subject to the same treatment as that of the starch films in SGF, SIF and SCF for
different time intervals. The EL100 dissolves above pH 6.0 and was compared to SS.
ES100 dissolves above pH 7 and was compared to RS.
Based on the graph in Figure 4.5, it was observed that retrograded SS films, showed almost
no loss in weight in SGF for 2h and 4 h, and only less than 5% weight loss after 6 h. The
SS films, as expected, showed drastic weight loss with increasing time in SIF and 100%
weight loss was observed at 6 h. For the commercially available, non-polysaccharide-based
EL100 films, a similar trend was observed to that of SS (Figure 4.5(b)). It was observed
that there was no significant difference in the % weight loss observed in EL100 and SS
films in SGF even after six hours, while both dissolved in SIF. The RS films, resisted
degradation in both SGF and SIF with almost no weight loss in SGF, and with a less than
5% weight loss in SIF at 6 h. The RS films started showing signs of degradation only when
subjected to SCF which contained bacterial enzymes similar to that in the colon with an
increasing loss in weight with increasing time and a maximum of 60% weight loss observed
at 6 h as shown in Figure 4.5(c). When compared with ES100 films (Figure 4.5(d)), there
was no significant difference in the %weight loss observed in ES100 and RS films in SGF
and SIF even after six hours, while both dissolved in SCF. Thus, it was evidenced from
this study that both SS and RS possess the gastro protective ability and would release the
AI only at its target site, comparable to that of commercial synthetic enteric polymers.

Carrier fabrication and characterization Chapter 4
65
Figure 4.5 Comparison of degradation of commercial enteric coating polymers and starch
in simulated GIT fluids at various time points. (a&b) soluble starch and EL100 represent
coatings for small intestine targeted delivery (c&d) resistant starch and ES100 represent
coatings for large intestine targeted delivery *significantly different at P<0.001 using One-
way ANOVA, post-hoc tukey test, n=3.
4.4. Chnp toxicity and cell uptake studies
For studying the ability of chnp to be taken up by the cells in the GIT, the Caco2 cells have
been used as the in vitro model [3]. Cellular uptake was studied for 2, 4 and 6 h using chnp
loaded with coumarin 343, to enable detection by flow cytometry. Since chnp were non-
toxic to the cells within 6 h, and any cell uptake observed should be due to the active
endocytosis of the particles by live cells. Based on the analysis of flow cytometry data, as
seen in Figure 4.6(a), cellular uptake of chnp, peaked after 2 h incubation, which decreased
progressively with time. This could be due to the aggregation of the nanoparticles with

Carrier fabrication and characterization Chapter 4
66
time, which led to an increase in size thus retarding cell uptake. The cell uptake was also
visualized using confocal microscopy (Figure 4.6(b)) which clearly showed that chnp was
taken up by the Caco2 cells, indicated by the localization of fluorescent particles around
the nucleus inside the cells. The above results provide an indication that these chnp would
be able to enter the enterocytes through endosomal uptake, leading to the eventual release
of the AI into the systemic circulation owing to the pH encountered by chnp in the lysosome
as simulated in the release kinetic studies.
Figure 4.6 Cell uptake of chnp using flow cytometry and confocal microscopy. (a)
shows the quantification of cellular uptake using flow cytometry. * Significantly different
from the rest of the time points. P<0.05 using One-way ANOVA and post-hoc tukey test,
n=3 (b) the uptake fluorescent chnp into the caco2 cells and localized around the nucleus.

Carrier fabrication and characterization Chapter 4
67
4.5. Discussion
Chnp in this work, have been produced by electrospraying, which is a well-known
technique for making nanofibrous scaffolds with remarkable reproducibility [4], but
less prevalent for making micro/nanoparticles for delivery. The technique works on
the principle that a polymer solution, under the influence of an electric field is either
drawn into fibers or sprayed into particles, depending on the process parameters, which
are then attracted to the oppositely charged collector. It is highly versatile in the sense
that parameters such as voltage, flow rate, needle gauge size, concentration of the
polymer solution and the tip to target distance can be varied to achieve different sized
particles. The advantage of using this technique is that it is easily reproducible and
scale up is easy. In addition, this green synthesis technique does not utilize any organic
solvents. The concentration of chitosan and acetic acid were the major determinants of
the size of the electrosprayed particles. Consistent with previous reports, at low acetic
acid concentrations, the particles were large and aggregated [1] Hence an optimal
acetic acid concentration that resulted in discrete particles for 1% (W/V) chitosan
concentration was chosen. Chnp fabricated using these optimized chitosan and acetic
acid concentration, was found to be within the 200 nm range and shown to be taken up
by enterocytes as evident from Figure 4.6. These chnp thus form the core of the
delivery system that will house the AI.
Retrograded SS and RS have been investigated as a gastric protectant as well as for
targeted release functionality. Gelatinization of starch by moist-heat treatment led to
the breakdown of starch granules and leaching of amylose. This amylose when
subjected to a temperature of 2-40C for 24 h, undergoes retrogradation, which alters
the rate of starch digestion in the body [5] Starch, acquires crystallinity on
retrogradation which offers gastric protection [6] But depending on its native source,
it is converted to slowly digestible starch [5] which enables it to be digested in SIF
over time. Hylon VII which has a high amylose content, when modified in this manner
is converted to resistant starch that is degraded only by the colonic microbiome and
remains unaffected in the upper part of the GIT. Thus, subjecting two different types

Carrier fabrication and characterization Chapter 4
68
of starch to retrogradation, enables it to be protected in SGF, but selectively degraded
either by SIF or SCF depending on its native susceptibility. This hypothesis was
substantiated by the results shown in Figure 4.5, where retrograded SS and RS was
degraded selectively by SIF and SCF respectively. The performance of the starch films
was also found to be comparable to that of commercial enteric coating films.
The electrostatic complexation of biopolymers such as chitosan, alginate and
polyglutamic acid for use as a drug carrier has been studied previously [7, 8]. The
starch coating procedure adopted, capitalizes on the electrostatic interaction between
chnp and starch followed by cross linking the hydrogel. Hence, it eliminates the use of
any organic solvents and does not require any special equipment as compared to the
protective coatings on tablets formed using spray drying. This would significantly
reduce cost and time from an industrial application perspective. Previous work on RS
as food grade enteric coating was done by Dimantov et al. where glass beads were
used as a model to coat with starch. Though the coating performed well in enzyme
dissolution testes, it formed a cracked layer on drying [9]. Recently, Situ et al. tested
the possibility of coating insulin-loaded cellulose microparticles with resistant starch
and proved that the coating helped prevent the proteolytic cleavage of insulin in the
small intestine [10]. These works exemplify the feasibility of coating RS on
microparticles using a specialized equipment such as fluidized bed reactor or spray
coater. The current study focuses on achieving such coatings on nano particulate
carriers without the use of any specialized equipment. Besides, the RS (Hylon VII) can
not only act as the protective coating but also serves the purpose of a dietary
fiber/prebiotic and help promote the general health of the gut [11]. Thus, using a
polysaccharide coating holds potential for a dual functional carrier system, acting as a
prebiotic while targeting the delivery of the AI of interest.

Carrier fabrication and characterization Chapter 4
69
4.6. Summary
In this work, a nano carrier with the capability of encapsulating both hydrophobic and
hydrophilic AI was fabricated solely from food grade materials using a sustainable
approach. Since this delivery system uses only biopolymeric materials obtained from
food sources, it can be readily employed for the delivery of nutraceuticals as a food
additive. The performance of the carrier was evaluated under simulated GIT conditions
and the polysaccharide enteric coating was found to protect the nano carrier and retard
any release in the SGF. By using either SS or RS as coating onto chnp, it was found
that specific release of the encapsulated drug or nutraceutical can be achieved in the
small intestine or colon respectively. Chnp was also shown to be taken up by the Caco2
cells. This study holds promise for a nano-carrier that can be exploited for targeted
delivery of drugs or nutraceuticals to the GIT.
References
[1] Arya N, Chakraborty S, Dube N, Katti DS. Electrospraying: a facile technique for
synthesis of chitosan-based micro/nanospheres for drug delivery applications. Journal of
biomedical materials research Part B, Applied biomaterials 2009;88:17-31.
[2] Li C, Li Y, Sun P, Yang C. Pickering emulsions stabilized by native starch granules.
Colloids and Surfaces A: Physicochemical and Engineering Aspects 2013;431:142-9.
[3] Akbari A, Wu J. Cruciferin coating improves the stability of chitosan nanoparticles at
low pH. Journal of Materials Chemistry B 2016;4:4988-5001.
[4] Bhardwaj N, Kundu SC. Electrospinning: A fascinating fiber fabrication technique.
Biotechnology Advances 2010;28:325-47.
[5] Sajilata MG, Singhal RS, Kulkarni PR. Resistant Starch–A Review. Comprehensive
Reviews in Food Science and Food Safety 2006;5:1-17.
[6] Bagliotti Meneguin A, Stringhetti Ferreira Cury B, Evangelista RC. Films from
resistant starch-pectin dispersions intended for colonic drug delivery. Carbohydrate
polymers 2014;99:140-9.
Carrier fabrication and characterization Chapter 4
70
[7] Antunes JC, Pereira CL, Molinos M, Ferreira-da-Silva F, Dessı̀ M, Gloria A, et al.
Layer-by-Layer Self-Assembly of Chitosan and Poly(γ-glutamic acid) into Polyelectrolyte
Complexes. Biomacromolecules 2011;12:4183-95.
[8] Meng L, Ji B, Huang W, Wang D, Tong G, Su Y, et al. Preparation of
Pixantrone/Poly(γ-glutamic acid) Nanoparticles through Complex Self-Assembly for Oral
Chemotherapy. Macromolecular Bioscience 2012;12:1524-33.
[9] Dimantov A, Greenberg M, Kesselman E, Shimoni E. Study of high amylose corn
starch as food grade enteric coating in a microcapsule model system. Innovative Food
Science & Emerging Technologies 2004;5:93-100.
[10] Situ W, Chen L, Wang X, Li X. Resistant starch film-coated microparticles for an oral
colon-specific polypeptide delivery system and its release behaviors. Journal of
agricultural and food chemistry 2014;62:3599-609.
[11] Fuentes-Zaragoza E, Sánchez-Zapata E, Sendra E, Sayas E, Navarro C, Fernández-
López J, et al. Resistant starch as prebiotic: A review. Starch - Stärke 2011;63:406-15.

Coagulans as a nutraceutical candidate Chapter 5
71
Chapter 5
Coagulans as a nutraceutical candidate
The Indian medicinal plant Withania coagulans was chosen as a source to
extract the nutraceutical coagulans, because of its widely reported medicinal
properties as well its role it food processing. Two different fractions were
extracted from the plant source. The chapter outlines the results of
characterization of the extracts using FTIR, NMR and MALDI. The
characterization results, verify that the extract obtained, have a similar
structural backbone, to that of the ones reported previously. Following this,
the feasibility of loading the extracts (P2 and P4) into polymeric carrier was
investigated using PLGA microparticles system as a model. HPLC was used
as a means to quantify the extracts. Hence, the chapter also discusses the
method developed to quantify the extracts and this HPLC method was used to
study the release kinetics of the extracts from the PLGA microparticles. The
bioactivity of P2 and P4 was tested on three different cell lines to find out its
beneficial properties. Of these, the wound healing effect of the extracts is
explicated in this chapter, while the anti-diabetic and anti-cancer effects are
discussed in the subsequent chapters. The in vitro studies on HDF cells,
indicate promising results on the wound healing effect of the aqueous extract,
P4.

Coagulans as a nutraceutical candidate Chapter 5
72
5.1. Extraction and characterization of coagulans
Coagulans was extracted from Withania coagulans plant as outlined in section 3.3. The
crude extract (P1), the organic and aqueous fractions (P2 and P4) were characterized using
FTIR, NMR and MALDI to confirm for the presence of the steroidal lactones as outlined
in previous reports. The extraction efficiency, was calculated based on the yield of P2 and
P4 using Equation 5.1 and the values are listed in Table 5.1. It is evident from the extraction
efficiencies that proportion of water soluble components are higher in the fruits compared
to the organic soluble ones.
Equation 5.1 Formula for calculation of extraction efficiency
𝐸𝑥𝑡𝑟𝑎𝑐𝑡𝑖𝑜𝑛 𝑒𝑓𝑓𝑖𝑐𝑖𝑒𝑛𝑐𝑦 =𝑊𝑒𝑖𝑔ℎ𝑡 𝑜𝑓 𝑓𝑟𝑢𝑖𝑡𝑠 𝑢𝑠𝑒𝑑 𝑓𝑜𝑟 𝑒𝑥𝑡𝑟𝑎𝑐𝑡𝑖𝑜𝑛
𝑊𝑒𝑖𝑔ℎ𝑡 𝑜𝑓 𝑒𝑥𝑡𝑟𝑎𝑐𝑡 𝑜𝑏𝑡𝑎𝑖𝑛𝑒𝑑∗ 100
Table 5.1 Extraction efficiencies of P2 and P4
Extraction efficiency
(%)
P2 0.132
P4 3.13
FTIR
From the FTIR spectra of the crude extract, P2 and P4, represented in Figure 5.1, the
presence of characteristic cyclic ether of α-β unsaturated ketone peak at 1080 cm-1 and the
peak for δ lactone at 1660 cm-1, confirmed for the presence of withanolide like structure.
Other notable peaks confirming the withanolide structure, were observed at 3380 cm-1
attributed to the –OH stretch and at 1600 cm-1 and 2940 cm-1 corresponding to the aromatic
ring stretch, represented in Table 5.2. The presence of these characteristic peaks, provides

Coagulans as a nutraceutical candidate Chapter 5
73
a preliminary confirmation on the compounds present in the fractions, based on comparison
with previous reports [1].
33
44
55
66
4000 3500 3000 2500 2000 1500 1000 500
60
72
84
96
4000 3500 3000 2500 2000 1500 1000 500
0
15
30
45
P1
% T
ransm
itta
nce
P2
Wavenumber (cm-1)
P4
Figure 5.1 FTIR spectra of extracts from Withania coagulans: crude extract (P1), fractions
P2 and P4
Table 5.2 Characteristic groups of the extract observed from FTIR and their respective
wavenumbers
Functional group Wave number
obtained (cm-1)
Wave number reported
[2, 3] (cm-1)
-OH stretch 3380 3200-3600
Aromatic ring stretch 1600 and 2940 1580-1615
2950-3100
Cyclic ether 1080 1070-1140
α-β unsaturated ketone and δ
lactone 1657-1661 1663 and 1715
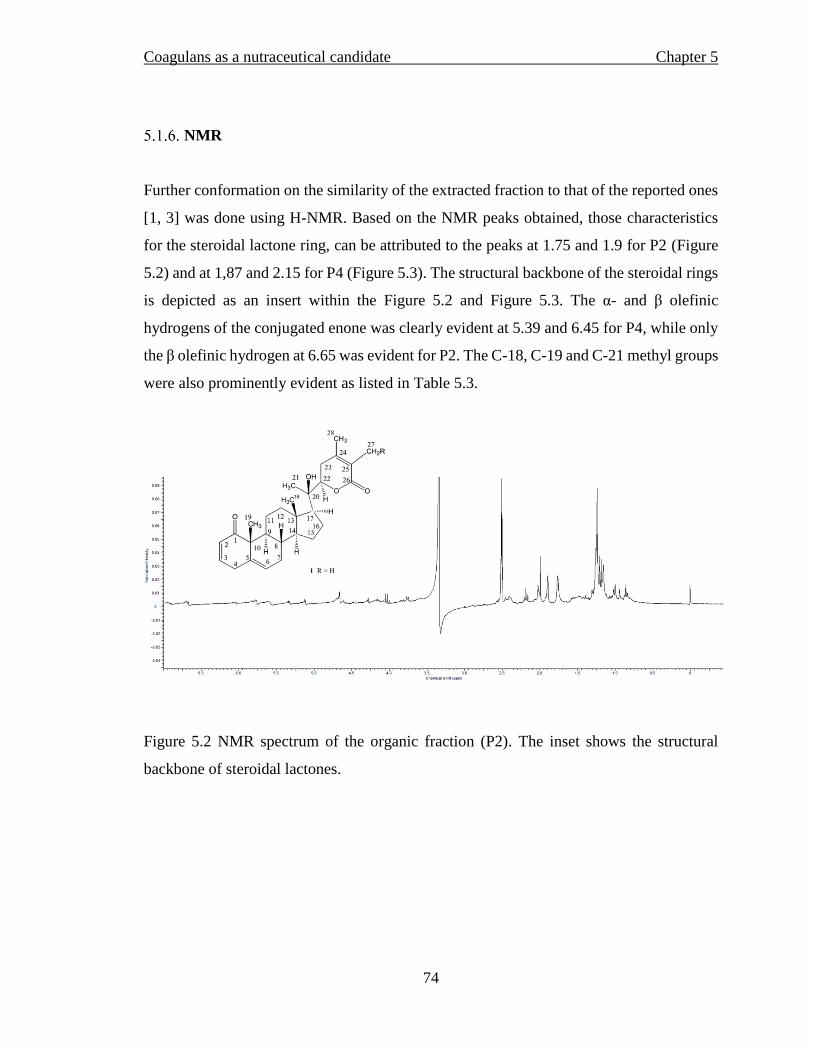
Coagulans as a nutraceutical candidate Chapter 5
74
NMR
Further conformation on the similarity of the extracted fraction to that of the reported ones
[1, 3] was done using H-NMR. Based on the NMR peaks obtained, those characteristics
for the steroidal lactone ring, can be attributed to the peaks at 1.75 and 1.9 for P2 (Figure
5.2) and at 1,87 and 2.15 for P4 (Figure 5.3). The structural backbone of the steroidal rings
is depicted as an insert within the Figure 5.2 and Figure 5.3. The α- and β olefinic
hydrogens of the conjugated enone was clearly evident at 5.39 and 6.45 for P4, while only
the β olefinic hydrogen at 6.65 was evident for P2. The C-18, C-19 and C-21 methyl groups
were also prominently evident as listed in Table 5.3.
Figure 5.2 NMR spectrum of the organic fraction (P2). The inset shows the structural
backbone of steroidal lactones.

Coagulans as a nutraceutical candidate Chapter 5
75
Figure 5.3 NMR spectra of aqueous fraction (P4). The inset shows the structural backbone
of steroidal lactones
Table 5.3 Characteristic peaks observed in the NMR spectra of the extract fractions P2 and
P4
Reported Fraction 1
(P2) Fraction 2
(P4)
C-18, C-19 and C-21 methyl groups 1.20, 1.17 and 1 .24
singlet 1.24, 1.20
1.12,1.14 and 1.09
Chemical shift of the deshielded C-21 methyl singlet and the appearance of the C-22 methine
double doublet at
4.67 5.1
Methyl groups attached to the conjugated lactone group
1.74 and 1.87
1.9 and 1.75
1.87 and 2.15
The a- and β olefinic hydrogens of the conjugated enone
5.62 and 6.55
respectively 6.65
6.45 and 5.39

Coagulans as a nutraceutical candidate Chapter 5
76
MALDI
Mass spectrometric analysis using MALDI-TOF equipment was used to identify the
molecular weight of the dominant compound. The fractions P2 or P4 in their respective
solvents was mixed with the matrix and analyzed. A dominant peak for P2 was obtained at
493.67 m/z, while other smaller peaks were also observed. The structure of the molecule
for the dominant peak in P2 was hypothesized to be similar to that of the insert in Figure
5.4, based on the similarity in molecular weights from previous reports [1, 2]. For P4, three
dominant peaks at, 491.06, 530.53 and 567.9 m/z were observed. The molecule at 567.9
was fragmented and lead to peaks at 265 and 303 m/z. The mixture of compounds, are
hypothesized to have the structures represented in the insert in Figure 5.5 [4].
HPLC was used for quantitative determination of the extracts, after being loaded into
polymeric carriers. As the fraction was not a pure compound, HPLC gave rise to more than
one peak. In order to decipher which peak matches closely with the starting material,
MALDI-TOF was used to analyze the samples. The sample collected at each retention time
which gives rise to a peak in HPLC, was analyzed using MALDI, for a strong single peak
493.6 m/z, which also gave an idea of the structure of the abundant compound reported
previously as shown in Figure 5.4. The same was repeated with samples at each peak
observed at specific time points. The retention time that could give rise to a strong single
peak at 493.67, was chosen as the retention time for P2. Similarly, for P4, the peak at
491m/z was the most abundant and the different peaks in HPLC was analyzed using
MALDI, to identify, which retention time peak would provide the strong signal at 491 m/z.

Coagulans as a nutraceutical candidate Chapter 5
77
Figure 5.4 Characterization of P2 using mass spectrometry
Figure 5.5 Characterization of P4 using mass spectrometry
Coagulans as a nutraceutical candidate Chapter 5
78
5.2. Encapsulation of the extracts in a model polymeric carrier system
In order to test the feasibility of loading the fractions P2 and P4 into polymeric carriers,
the fractions were loaded into PLGA microparticles as a model carrier system. This would
help understand if the extracts can be encapsulated which has never been done before and
also to have an idea of the release kinetics of the extracts from a well-established polymer
like PLGA which can later be translated into other polymeric carrier systems. For this,
PLGA microparticles were prepared as using the solvent evaporation technique [5] and
loaded with either P2 or P4. Both P2 and P4 loaded microspheres had a smooth spherical
morphology with an average size of 81.28µm and 67.13µm respectively as in Figure 5.6.
While the cross section of P2 microparticles, revealed a solid core, the P4 microparticles
had a hollow core. This hollow core can be attributed to the double emulsion technique that
was used to fabricate these particles. This difference in core morphology, besides their
solubility, influenced the release profile of the fractions from the microparticles. It is
inferred from the results that the extracts, both hydrophobic and hydrophilic can be
encapsulated into a polymeric carrier system.

Coagulans as a nutraceutical candidate Chapter 5
79
Figure 5.6 Coagulans extract encapsulated in PLGA microparticles (a&b) P2 loaded PLGA
microparticles and its cross section (c&d) P4 loaded microparticles and its cross section.
5.3. HPLC method development for studying release profiles of P2 and P4
The HPLC method, developed for the quantification of the extracts was validated using the
PLGA microparticle model carrier with P2 and P4 loaded into it and their release studied
using PBS as the release medium. The HPLC was also used to determine the encapsulation
efficiency of the extracts which was later used to calculate the cumulative release
percentage. The release profiles of P2 and P4 from PLGA microparticles is shown in Figure
5.7. The release pattern indicates that the kinetics of release depends on the core
morphology and the solubility of the drug in the polymer, with a substantial burst release
of the hydrophilic P4 and a cumulative release of up to 90 % in two weeks, being observed
from the hollow core P4 particles. The release of P2 from the solid core particles lags
behind, with a cumulative release of only up to 65% in the time frame studied. This

Coagulans as a nutraceutical candidate Chapter 5
80
experiment sets the platform for further studies where HPLC is being used as an important
tool to quantify the release of extracts from the carrier system.
0 2 4 6 8 10 12 14 16
0
20
40
60
80
100C
um
ula
tive r
ele
ase %
Time (days)
P2
P4
Figure 5.7 Release profiles of coagulans extract from PLGA microparticles measured using
HPLC. The release study was carried out at 370C, n=3.
5.4. Discussion
Withania coagulans, with its numerous touted beneficial properties, and proven previously
in a few studies, was chosen as the nutraceutical candidate to be encapsulated into the
carrier system developed in this work, thereby adding a new dimension of novelty to the
work. The encapsulation of this nutraceutical, has many advantages such as, protecting the
extract and releasing it only at the target site, in turn helping to improve the bioavailability,
taste masking and dosage reduction. The extraction was successfully carried out, keeping
the previous protocols as a basis, but refraining from complete purification to obtain single
compound extracts, as it was beyond the scope of this thesis. The extracts P2 and P4 are
theorized to be a mixture of compounds containing the steroidal lactone backbone,
confirmed by FTIR and NMR studies. The dominance of a particular molecular weight

Coagulans as a nutraceutical candidate Chapter 5
81
over other similarly structured, but different molecular weight compounds was confirmed
from MALDI-TOf studies. On comparison of the molecular weight obtained from MALDI,
to that of reported structures, the structure of the dominant compound has been predicted
and depicted in Figure 5.4 and Figure 5.5. HPLC, used as a tool for quantification of the
extracts, also revealed that the extracts are not pure compounds but a mixture of compounds
that are quite close in molecular weight. The MALDI peak was matched to that of the
retention times of the peaks in HPLC in order to do quantification studies. Though the
beneficial properties of the extracts are widely touted, an attempt to study the mechanisms
of action, systemically both in vitro and in vivo is lacking. This works aims to bridge the
gap by studying the effect of the extracts in vitro, in their respective cell lines. The
beneficial properties of coagulans extracts is addressed in the subsequent chapters.
As the extract from coagulans has never been encapsulated in a delivery system, as a
preliminary experiment, the extracts were loaded into the well-known PLGA microparticle
system, as this system is known for its ability to encapsulate both hydrophilic and
hydrophobic components before moving into the food based delivery system. It was indeed
possible to encapsulate the extracts into PLGA carrier system and its release profile from
the system was studied by optimizing HPLC methods for both P2 and P4, which forms the
platform for studying their release from chitosan and starch based carriers subsequently.
PLGA was solely chosen for its ease of handling and well established protocols for
fabrication and characterization.
5.5. Summary
The chosen nutraceutical, was extracted from the plant Withania coagulans as two different
fractions with different solubilities, essentially giving rise to a hydrophilic and hydrophobic
fraction to base further tests on. The extracts were characterized using standard techniques
such as FTIR, NMR and MALDI in order to deduce the structure of the compounds present
in the extract and their similarities to the previous reports. The extracts were loaded into a
model carrier system to evaluate their feasibility to be encapsulated and the release of the
extracts was studied using HPLC.

Coagulans as a nutraceutical candidate Chapter 5
82
References
[1] Yousaf M, Gul W, Qureshi S, Choudhary MI, Voelter W, Hoff A, et al. Five new
withanolides from Withania coagulans. Heterocycles 1998;9:1801-11.
[2] Ihsan ul H, Youn UJ, Chai X, Park E-J, Kondratyuk TP, Simmons CJ, et al. Biologically
Active Withanolides from Withania coagulans. Journal of Natural Products 2013;76:22-8.
[3] ur-Rahman A, Dur e S, Naz A, Choudhary MI. Withanolides from Withania coagulans.
Phytochemistry 2003;63:387-90.
[4] Maurya R, Akanksha, Jayendra. Chemistry and pharmacology of Withania coagulans:
an Ayurvedic remedy. Journal of pharmacy and pharmacology 2010;62:153-60.
[5] O'Donnell PB, McGinity JW. Preparation of microspheres by the solvent evaporation
technique. Advanced Drug Delivery Reviews 1997;28:25-42.

Coagulans loading in nano carrier-small intestine targeted delivery Chapter 6
83
Chapter 6
Coagulans loading in nano carrier-small intestine targeted
delivery
The functioning of the chnp coated with starch, as a small intestine targeted
delivery system is demonstrated in this chapter. For this, the anti-diabetic
effect of coagulans was chosen as an effect to exemplify the absorption of the
nutraceutical in the small intestine. The anti-diabetic effect of the extracts was
tested in vitro and in vivo, in order to determine the fraction that is non-toxic
and effective and also to understand the mechanism of action. The in vivo
results revealed P4 to be better than P2. This was also confirmed in vitro by
the ability of P4 to promote insulin secretion from beta cells. Following this,
P4 was loaded into the carrier system (C+S) and its release from the carrier
was studied in different simulated GIT fluids to confirm the working of the
starch coating and also to estimate the amount of P4 released in each segment
of the GIT. P4 loaded particles were also tested on their ability to promote
insulin secretion from beta cells, in order to access the bioactivity of P4
encapsulated into the particles. The working of the carrier was further
confirmed from in vivo studies of P4 loaded particles, proving that starch
coated particles are indeed able to lower the blood glucose of diabetic mice
better than uncoated chnp, substantiating that starch coating is able to target
to the small intestine for efficient systemic absorption.

Coagulans loading in nano carrier-small intestine targeted delivery Chapter 6
84
The chnp coated with starch, was developed as a carrier for nutraceutical molecules, to
achieve a targeted delivery of the active ingredient (AI) to the small intestine, with minimal
loss in the stomach. Of the widely reported therapeutic properties of coagulans, the anti-
diabetic effect was chosen as an effect that can be used to prove the small intestine targeting
ability of the carrier, as the AI needs to be absorbed in the small intestine to elicit a systemic
response i.e. lowering of blood glucose.
6.1. Anti-diabetic effect of coagulans
The anti-diabetic effect of coagulans was tested in vitro, to study its effect on beta cell
function and in vivo, to identify the effective fraction
In vitro studies on MIN6 cells
The effects of the extracts were studied simultaneously, in vitro, in order to assess the
mechanism by which the extracts facilitate their anti-diabetic effect. The most common
effect studied primarily would be the effect on beta cell function, to promote insulin
secretion [1]. Pancreatic beta cells (MIN6) was used for the in vitro tests. The working
concentration was estimated by studying the toxicity of P2 and P4 onMIN6 cells. The cells
were seeded in 96 well plates at a density of 2x10⁴ cells per well. Confluency was reached
after 24 hours and different concentrations of P2 and P4 as shown in Figure 6.1 were added
to the cells and incubated for 2 hours. Each concentration had five replicates. After 2 hours,
CCK8 assay was done and % cell viability was calculated based on Equation 3.3. For P2,
all concentration chosen, except for the 0.1µM concentration, displayed considerable
amount of toxicity on beta cells in 2 hours, discouraging further studies using the P2
fraction. P4 was relatively non-toxic to the cells even at high concentrations, within the 2
hours tested. Based on the toxicity studies, P4 was chosen to evaluate the beta cell function.

Coagulans loading in nano carrier-small intestine targeted delivery Chapter 6
85
Figure 6.1 Toxicity of different concentrations of (a) P4 and (b) P2 onMIN6 cells, studied
over 2 hours. *significantly different from 0.1, 0.5 and 1 µM concnetrations, P<0.05 using
One-way ANOVA, post-hoc Tukey test, n=5
Beta cell function was evaluated based on the insulin secretion response, using the GSIS
assay and quantified using the ELISA assay. For this study, cells were seeded on 6 well
plates at a density of 1x10⁵ cells per well. Confluency was reached after 48 hours. Based
on the toxicity studies, five different concentrations of P4 (0.1, 0.5, 1, 2 and 5µM) were
chosen to evaluate the insulin secretion ability using the GSIS assay. The amount of insulin
released is represented as fold change. The fold change in insulin was compared to that of
untreated cells. As in Figure 6.2, of the five concentrations chosen, though all
concentrations showed better insulin fold change than, the untreated, 1 µM showed a
significant surge in insulin secretion compared to all the other concentrations. Based on
this, 1µM was chosen for subsequent in vitro studies.

Coagulans loading in nano carrier-small intestine targeted delivery Chapter 6
86
Untreated 0.1µM 0.5µM 1µM 2µM 5µM
0.0
0.5
1.0
1.5
2.0
2.5
3.0
3.5
Insulin
fold
change
P4 Concentration
*
Figure 6.2 Insulin fold change observed for the mouse pancreatic beta cells (MIN6) on
treatment with different concentrations of P4. * Significantly different from all groups at
P<0.05 using One-Way ANOVA and post-hoc Tukey test, n=3.
In vivo studies of free extract
The extraction procedure for the extracts was followed based on reported protocols with
some modifications. Despite this fact, in order to confirm beyond doubt that the two
fractions, that were obtained, possess anti-diabetic effects and more importantly, their non-
toxicity, the fractions were tested in vivo on alloxan induced diabetic mouse model as
elaborated in section 3.5. The dosage of the fractions was fixed based on previous reports
[2] at 50mg/kg. The animals in the normal control group were fed DI water, P2 or P4 at the
chosen concentration, for 5 days and their glucose tolerance was measured using Oral
Glucose Tolerance Test (OGTT) on the 5th day. While both extracts were not toxic to the
animals, the group that received P4 every day, showed better glucose tolerance compared
to the group receiving DI water, as seen in Figure 6.3 from the difference in the area under
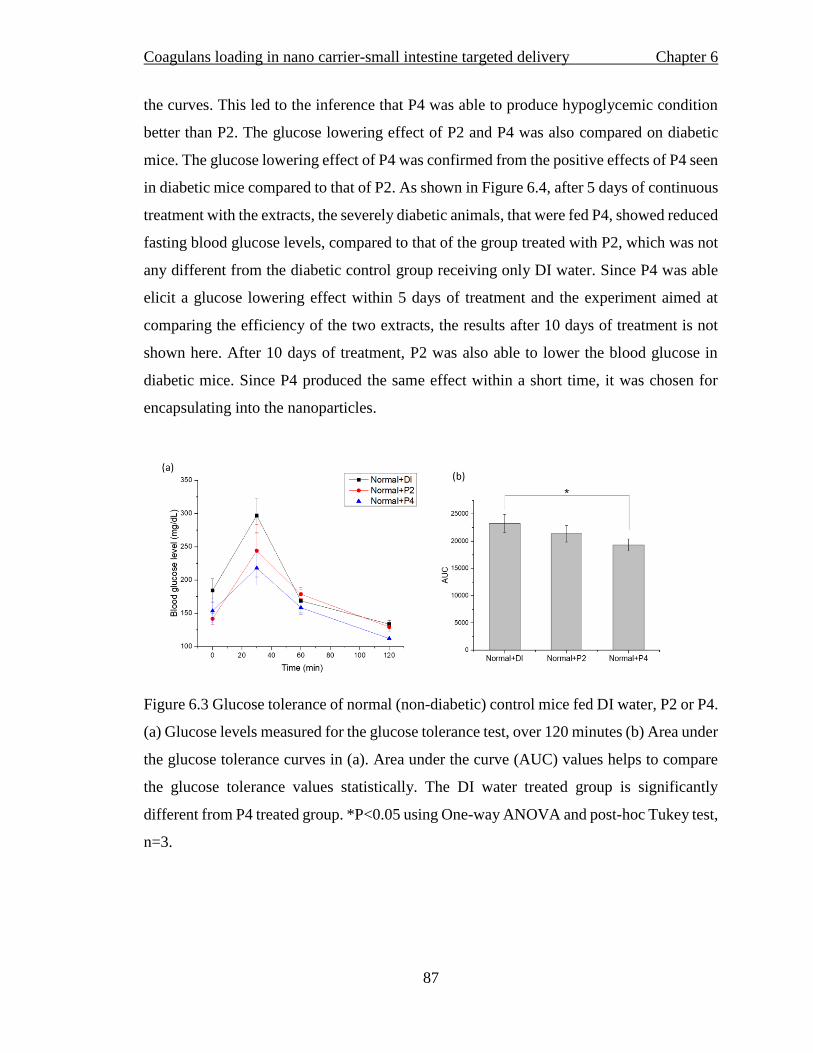
Coagulans loading in nano carrier-small intestine targeted delivery Chapter 6
87
the curves. This led to the inference that P4 was able to produce hypoglycemic condition
better than P2. The glucose lowering effect of P2 and P4 was also compared on diabetic
mice. The glucose lowering effect of P4 was confirmed from the positive effects of P4 seen
in diabetic mice compared to that of P2. As shown in Figure 6.4, after 5 days of continuous
treatment with the extracts, the severely diabetic animals, that were fed P4, showed reduced
fasting blood glucose levels, compared to that of the group treated with P2, which was not
any different from the diabetic control group receiving only DI water. Since P4 was able
elicit a glucose lowering effect within 5 days of treatment and the experiment aimed at
comparing the efficiency of the two extracts, the results after 10 days of treatment is not
shown here. After 10 days of treatment, P2 was also able to lower the blood glucose in
diabetic mice. Since P4 produced the same effect within a short time, it was chosen for
encapsulating into the nanoparticles.
Figure 6.3 Glucose tolerance of normal (non-diabetic) control mice fed DI water, P2 or P4.
(a) Glucose levels measured for the glucose tolerance test, over 120 minutes (b) Area under
the glucose tolerance curves in (a). Area under the curve (AUC) values helps to compare
the glucose tolerance values statistically. The DI water treated group is significantly
different from P4 treated group. *P<0.05 using One-way ANOVA and post-hoc Tukey test,
n=3.

Coagulans loading in nano carrier-small intestine targeted delivery Chapter 6
88
Day 0 Day 50
100
200
300
400
500
600*
Blo
od g
luco
se le
vel (
mg/
dL)
Normal +DI DM+DI DM+P2 DM+P4
*
Figure 6.4 Fasting blood glucose levels of the normal mice fed DI water and diabetic mice,
fed DI water, P2 or P4, depicted on day 0 and day 5. The treatment with the extracts was
compared against untreated diabetic mice. * P<0.05 using One-way ANOVA, post-hoc
Tukey test, n=3.
6.2. Encapsulation of P4 into the nano carrier
P4 was encapsulated into chnp during the electrospraying process itself by mixing P4 into
the chitosan solution to be electrosprayed. The EE was calculated from the concentration
of P4 obtained after collecting the chnp based on Equation 3.2 and was found to be 39±8%
Release study of P4 from Chnp and C+S
P4 was encapsulated into the food grade carrier system as a means of targeting the delivery
of P4 to the small intestine, where it can be taken up by the enterocytes to reach the
systemic circulation. Since the aim of the coating is to prevent enteric release and facilitate
release in the subsequent compartments of the GIT, sequential release of P4 was studied in

Coagulans loading in nano carrier-small intestine targeted delivery Chapter 6
89
SGF for 2 hours, followed by SIF for 3 hours and finally the release pattern was observed
in pH 4.4 medium as the final compartment. The pH 4.4 medium mimics the pH of the
lysosome, which would be the compartment inside the cell into which the nanoparticles
would end up after being taken up by the enterocytes of the small intestine. The uptake of
these chnp in the Caco2 model system has been demonstrated previously [3]. Based on the
sequential release study carried out for both the starch coated and uncoated chnp as a
comparison (Figure 6.5), the uncoated chnp released up to 40% of P4 in SGF within 2
hours, while the C+S particles released less than 20% of P4, indicating that the starch layer
is able to retard the release in SGF that mimics the low pH condition in the stomach. On
being transferred to SIF, the uncoated chnp that were swollen and releasing P4 in SGF,
continued to release P4 and up to 60% cumulative release was observed at the end of 5
hours. For the C+S particles, while the starch coating is digested in SIF, there were no
enzymes or conducive pH to trigger the release of P4 from chnp. Hence only 10% release
is observed in SIF for C+S particles. Once the particles were transferred to the pH 4.4
medium, the slightly acidic pH promotes the swelling of chnp and rapid release of P4 was
observed within the first few hours itself. On being transferred to pH 4.4 medium, it was
observed that the uncoated chnp released less than 7% of P4 in the first 2 hours, while more
than 20% P4 release is observed from the C+S particles. This can be attributed to the burst
release due to the swelling of chnp released from C+S particles on encountering an acidic
pH, while the uncoated chnp had already exhibited its burst release in SGF and such drastic
change is not observed. This vast difference in release in lysosome will give a leverage to
the better performance of the C+S particles as 70% of the encapsulated P4 is still intact
after passing through SIF and the burst release in pH 4.4 medium would help increase the
systemic absorption of P4 which in turn can help bring down the blood glucose more
gradually over a longer period of time.
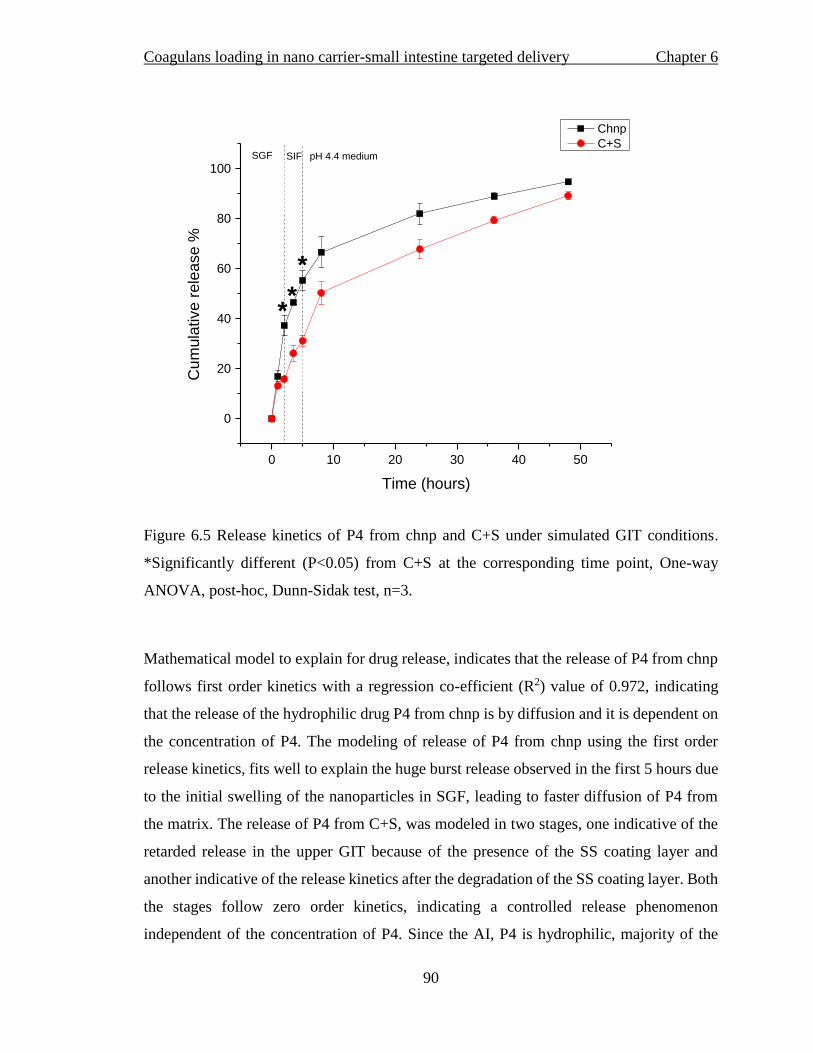
Coagulans loading in nano carrier-small intestine targeted delivery Chapter 6
90
0 10 20 30 40 50
0
20
40
60
80
100
*
*
pH 4.4 mediumSIF
Cum
ula
tive r
ele
ase %
Time (hours)
Chnp
C+SSGF
*
Figure 6.5 Release kinetics of P4 from chnp and C+S under simulated GIT conditions.
*Significantly different (P<0.05) from C+S at the corresponding time point, One-way
ANOVA, post-hoc, Dunn-Sidak test, n=3.
Mathematical model to explain for drug release, indicates that the release of P4 from chnp
follows first order kinetics with a regression co-efficient (R2) value of 0.972, indicating
that the release of the hydrophilic drug P4 from chnp is by diffusion and it is dependent on
the concentration of P4. The modeling of release of P4 from chnp using the first order
release kinetics, fits well to explain the huge burst release observed in the first 5 hours due
to the initial swelling of the nanoparticles in SGF, leading to faster diffusion of P4 from
the matrix. The release of P4 from C+S, was modeled in two stages, one indicative of the
retarded release in the upper GIT because of the presence of the SS coating layer and
another indicative of the release kinetics after the degradation of the SS coating layer. Both
the stages follow zero order kinetics, indicating a controlled release phenomenon
independent of the concentration of P4. Since the AI, P4 is hydrophilic, majority of the

Coagulans loading in nano carrier-small intestine targeted delivery Chapter 6
91
release happens by means of diffusion. The Korsmeyer-Peppas model (Power law) was
used to understand the mechanism of release, as it is a more comprehensive model,
developed based on the Higuchi model, to study the drug release from polymeric matrices,
mainly hydrogels [4]. The release data of P4 from C+S, showed good fit into the
Korsmeyer-Peppas model with an R2value of 0.97. Based on the n value of 0.512 (exponent
of release), obtained from the equation Figure 6.6, it follows an anomalous transport, with
the mechanism being governed equally by both diffusion and swelling (0.43< n < 0.85 for
spheres). Based on the n value, being close to 0.5, it could be postulated that, the first stage
of release in the upper GIT, is governed majorly by diffusion, as in the case of Fickian
model, while the later stage of release could be a combination of swelling, mainly due to
the degradation of the SS coating and diffusion in a time-dependent manner.
y = -0.0228x + 1.8169R² = 0.972
0
0.5
1
1.5
2
2.5
0 10 20 30 40
Log
Cu
mu
lati
ve %
dru
g re
mai
nin
g
Time (hours)
First order - chnp(a)
y = 4.7947x + 7.8761R² = 0.9753
y = 0.9765x + 43.469R² = 0.9957
0
20
40
60
80
100
0 10 20 30 40 50 60Cu
mu
lati
ve %
dru
g re
leas
ed
Time (hours)
Zero order - C+S(b)

Coagulans loading in nano carrier-small intestine targeted delivery Chapter 6
92
Figure 6.6 Mathematical modelling of the release kinetics of P4 from chnp and C+S. (a)
release profile from chnp fit to first order kinetics (b) release from C+S fit to zero-order
kinetics and (c) Korsmeyer-Peppas model
Effect of P4 release media on MIN6 cells
With the knowledge that the starch coating is able to retard the release of P4 in SGF and
might facilitate the release within the enterocytes itself, it is imperative to ensure and prove
that this P4 is bioactive to elicit its response. For this purpose, the release media collected
from the particles that were subjected to sequential release study-SGF, SIF and pH 4.4
medium, were added to the MIN6 cells and GSIS was carried out to measure for insulin
secretion on adding the release media. For this purpose, 3 different groups were selected.
One is the blank release media itself, to prove that the release media does not have any
inherent toxicity, leading to cell lysis and increased insulin being observed in the
supernatant. The next group is free P4 added to SIF or pH 4.4 medium, collecting the
sample after the respective treatment times in each compartment. The third group is the
C+S particles subjected to sequential release and release media collected from SIF and pH
4.4 at respective treatment times. The concentration of P4 in the release media for the 2nd
and 3rd group is chosen to match 1µM after dilution. Since the release of P4 in SGF, is not
desired as it would not promote effective absorption in the small intestine, the effect of
y = 0.5122x + 1.1256R² = 0.97
0
0.5
1
1.5
2
2.5
0 0.5 1 1.5 2
Log
Cu
mu
lati
ve %
dru
g re
leas
ed
Log Time
Korsmeyer - Peppas - C+S(c)
Coagulans loading in nano carrier-small intestine targeted delivery Chapter 6
93
SGF and that of P4 encapsulated into uncoated chnp on the bioactivity is overlooked. From
the results shown in Figure 6.7, it is evident that the blank release media itself does not
have any effect on the insulin secretion from MIN6 cells. The line indicated as untreated
baseline is the basal insulin secretion observed with just glucose stimulation only with no
treatment. And the line indicated as P4 in the graph, is the insulin fold change observed for
the treatment of 1µM on MIN6 cells. For free P4 in release media, while the SIF release
media does not promote insulin secretion, P4 in pH 4.4 media promotes insulin secretion,
though it does not touch the P4 line. This could lead to conclude two things: 1. The enzymes
in SIF alter P4 making it to lose its bioactivity. 2. Since P4 is free, there is partial loss of
bioactivity in pH 4.4. A similar trend of bioactivity loss in SIF, was observed for the P4
released from C+S particles, while P4 released in pH 4.4 from C+S had its bioactivity
completely preserved because of the encapsulation within C+S particles and P4 did not
have to encounter the SIF. This proves that the bioactivity of P4 is intact in the C+S
particles.

Coagulans loading in nano carrier-small intestine targeted delivery Chapter 6
94
Blk P4 C+S
0.0
0.5
1.0
1.5
2.0
2.5
3.0
Insulin
fold
change
SIF
pH 4.4
Untreated baseline
P4
Figure 6.7 Insulin fold change observed for the mouse pancreatic beta cells (MIN6) on
treatment with release media from C+S particles compared against free in the same release
media and blank release medium alone
In vivo studies of the nano carrier
While the in vitro study proves the bioactivity of P4 is intact after encapsulation into the
particles, the efficacy of these particles in vivo is a question. Hence uncoated chnp and
chnp coated with soluble starch were tested on diabetic animals. The test groups in this
study were diabetic animals that were fed by oral gavage, chnp and C+S as test
formulations, Glibenclemide and distilled water as controls. A non-diabetic control group,
fed Distilled water was also included. The amount of encapsulated P4 fed each day was
50mg/Kg. Based on the results, the group that received chnp treatment was similar to the
negative control group that received only distilled water. It is evident that the chnp does
not have any effect on the fasting blood glucose levels due to the preemptive release of P4
in the stomach and SIF leading to its loss of bioactivity, as observed in Figure 6.8. The
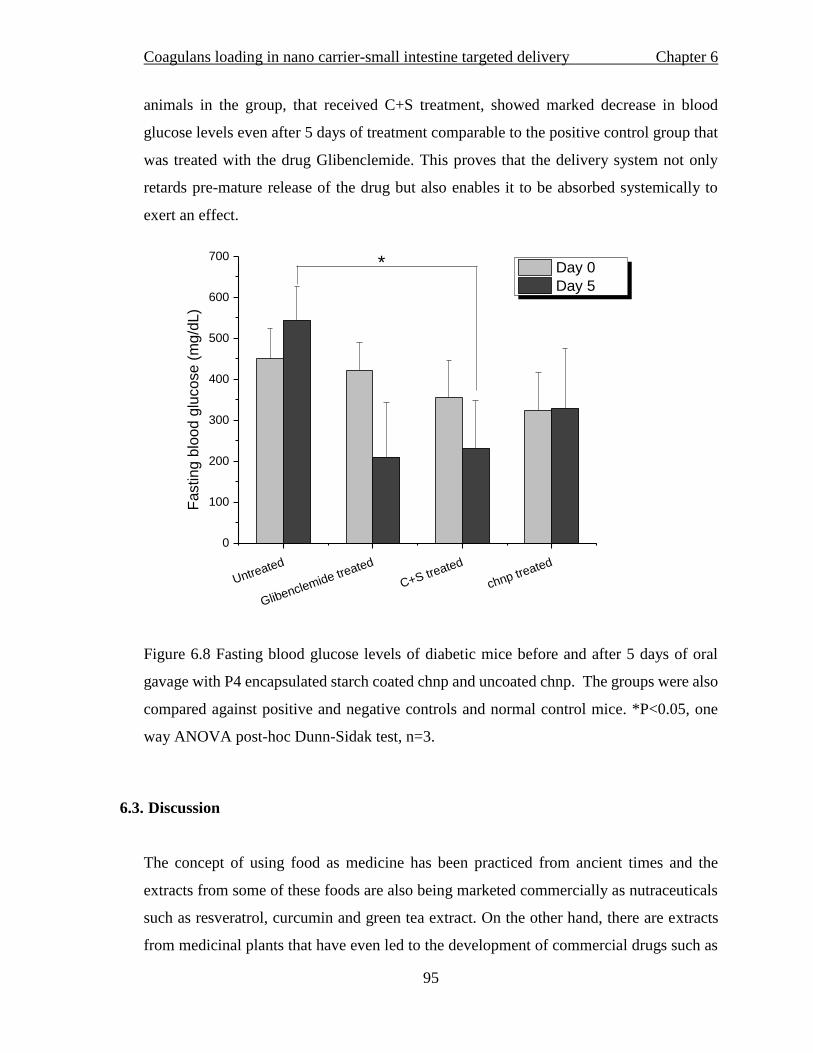
Coagulans loading in nano carrier-small intestine targeted delivery Chapter 6
95
animals in the group, that received C+S treatment, showed marked decrease in blood
glucose levels even after 5 days of treatment comparable to the positive control group that
was treated with the drug Glibenclemide. This proves that the delivery system not only
retards pre-mature release of the drug but also enables it to be absorbed systemically to
exert an effect.
Untreated
Glibenclemide treated
C+S treated
chnp treated
0
100
200
300
400
500
600
700
Fasting b
lood g
lucose (
mg/d
L)
Day 0
Day 5
*
Figure 6.8 Fasting blood glucose levels of diabetic mice before and after 5 days of oral
gavage with P4 encapsulated starch coated chnp and uncoated chnp. The groups were also
compared against positive and negative controls and normal control mice. *P<0.05, one
way ANOVA post-hoc Dunn-Sidak test, n=3.
6.3. Discussion
The concept of using food as medicine has been practiced from ancient times and the
extracts from some of these foods are also being marketed commercially as nutraceuticals
such as resveratrol, curcumin and green tea extract. On the other hand, there are extracts
from medicinal plants that have even led to the development of commercial drugs such as

Coagulans loading in nano carrier-small intestine targeted delivery Chapter 6
96
Digitoxin, Paclitaxel and Quinine. The renewed public interest towards such compounds
extracted from foods or medicinal and marketed as nutraceuticals, has led to the increased
consumption of such products that can be purchased off the counter, or sometimes even
added to food. In an effort to combine such alternative system of medicine with that of the
burgeoning field of encapsulation technology, extracts from the berries of Withania
coagulans have been encapsulated into a food based polymeric carrier, with two
converging aims: one is to provide a suitable delivery system for the extract for which no
such system exists and also to prove the small intestine targeting ability of the carrier in
vivo.
The basic characterization of the fractions P2 and P4, extracted from Withania coagulans,
was in agreement with previous reports [5]. Extensive characterization was not done as the
aim was not to extract a pure compound, but to study the combined effects of the
compounds. The basic characterization of the fractions using FTIR and NMR, ensured that
the compounds reported to have anti-diabetic effect are indeed present [6]. Hence the
structure of the compounds present can only be predicted to match that of the steroidal
lactone backbone reported for similar withanolides extracted from the plant, but the exact
structure could not be elucidated. Further, based on the mass spectrometric data of P4, it is
evident that it is not a pure compound and there could be more than one compound in P4.
The same was also observed in the HPLC chromatograms, which gave rise to multiple
peaks. The peak corresponding to the most abundant compound was used for the purpose
of quantification.
Any compound/drug that lowers blood glucose, exerts its action by three different ways:
One is by promoting insulin secretion from the pancreatic beta cells, or by sensitizing the
adipocytes to insulin, promoting glucose uptake or inhibiting gluconeogenesis from
hepatocytes. There is a dearth when it comes to the testing of the extracts from Withania
coagulans in vitro, which could largely help in the understanding of the mechanism of
action of the extract. Since most of the plant extracts that exert anti-diabetic effect, act by
promoting insulin secretion from beta cells, it was hypothesized that Withania coagulans
promotes insulin secretion by sensitizing or stimulating the beta cells through activation of
Ca2+ channels and in turn exocytosis of insulin from insulin containing granules [2]. This
hypothesis was confirmed by testing both P2 and P4 on mouse pancreatic beta cells at

Coagulans loading in nano carrier-small intestine targeted delivery Chapter 6
97
different concentrations and P4 was indeed found to promote insulin secretion at a certain
concentration, in agreement with in vivo results. This could be attributed to the presence of
saponins, flavonoids, tannins, alkaloids, terpenoids and sterols in the extract, previously
shown to be present in the extracts of Withania coagulans [7]. Such bioactive components
have been associated with hypoglycemic activity [8].
The in vivo testing of the free extracts showed that P4 was able to decrease fasting blood
glucose in diabetic animals, which is a key indicator on the level of the intensity of the
disease. While previous reports have shown that the compounds extracted from both the
aqueous and organic fraction were able to decrease FBG in diabetic mice over 30 days [2],
the same effect was observed within 5 days for P4 (Figure 6.4). P2 could not show any
effect within this 5-day period. There have been no reports so far discussing the decrease
in FBG within such short time frames. Besides, the fraction used in this study is not a pure
compound, hence the effect could not be directly compared to that of previous reports and
the effect observed might be a combined effect of more than one compound.
Alloxan is a glucose analog molecule that has selective toxicity towards the pancreatic beta
cells of rodents. The toxicity of the molecule is mediated by selective uptake and
accumulation in beta cells through the GLUT2 glucose transporter. Once inside the cells,
the molecule reacts with thiols forming reactive oxygen species and free radicals, leading
to cell kill [9]. The lowering of FBG in such alloxan induced diabetic models in the absence
of any insulin supplementation, could only mean that the few beta cells left behind in mouse
are either restored back or the remaining cells are induced to promote insulin secretion.
Since the insulin secreting ability of P4 from beta cells was proven in vitro (Figure 3.4), it
can be concluded that beta cells have been regenerated in the diabetic mice that led to the
decrease in FBG. The presence of these compounds has been reported to support the
regeneration of beta cells. In addition, the anti-oxidant property of coagulans [10], might
also be responsible for the regeneration of beta cells, as the main mechanism by which
alloxan causes diabetes is by generating ROS and free radicals. A study on the free radical
scavenging activity of Withania somnifera on STZ injected mice, was shown to restore β
cell function [11]. Since the Withanolides in both Withania somnifera and Withania

Coagulans loading in nano carrier-small intestine targeted delivery Chapter 6
98
coagulans possess the same structural backbone comprising that of steroidal lactones, the
study gives insight into the mechanism by which Withanolides are able restore the function
of β cells.
6.4. Summary
The ability of starch as a food grade enteric coating to retard the premature release of the
AI in the stomach was proven in diabetic animal model, by the reversal of diabetes upon
administering the starch coated nanoparticles containing the AI ingredient responsible for
causing the hypoglycemic effect. The work set the platform to ultimately prove the above
hypothesis by extracting a nutraceutical from a medicinal plant source and testing its
efficacy on diabetic animals as well as testing the mechanism as well as the bioactivity of
the encapsulated extract in vitro. Thus, the work advocates the feasibility of encapsulating
the extracts from Withania coagulans into a polymeric carrier and also the ability of the
food grade nano carrier to encapsulate a nutraceutical and deliver it at the target site.
References
[1] Oh YS. Plant-Derived Compounds Targeting Pancreatic Beta Cells for the Treatment
of Diabetes. Evidence-based Complementary and Alternative Medicine : eCAM
2015;2015:629863.
[2] Shukla K, Dikshit P, Shukla R, Gambhir JK. The aqueous extract of Withania coagulans
fruit partially reverses nicotinamide/streptozotocin-induced diabetes mellitus in rats.
Journal of medicinal food 2012;15:718-25.
[3] Kaarunya S, Joachim LSC. Targeted Gastrointestinal Delivery of Nutraceuticals with
Polysaccharide‐Based Coatings. Macromolecular Bioscience 2018;18:1700363.
[4] 5 - Mathematical models of drug release. In: Bruschi ML, editor. Strategies to Modify
the Drug Release from Pharmaceutical Systems: Woodhead Publishing; 2015. p. 63-86.
[5] Yousaf M, Gul W, Qureshi S, Choudhary MI, Voelter W, Hoff A, et al. Five new
withanolides from Withania coagulans. Heterocycles 1998;9:1801-11.

Coagulans loading in nano carrier-small intestine targeted delivery Chapter 6
99
[6] Maurya R, Singh AB, Srivastava AK. Coagulanolide, a withanolide from Withania
coagulans fruits and antihyperglycemic activity. Bioorganic & medicinal chemistry letters
2008;18:6534-7.
[7] Mathur D, Agrawal R, Shrivastava V. Phytochemical screening and determination of
antioxidant potential of fruits extracts of Withania coagulans. Recent Research in Science
and Technology 2011;3.
[8] Arika W, Nyamai D, Agyirifo D, Ngugi M, Njagi E. In vivo antidiabetic effect of
aqueous leaf extract of Azardirachta indica, A. juss in alloxan induced diabetic mice. J
Diabetic Complications Med 2016;1:2.
[9] Lenzen S. The mechanisms of alloxan- and streptozotocin-induced diabetes.
Diabetologia 2008;51:216-26.
[10] Shukla K, Dikshit P, Shukla R, Sharma S, Gambhir JK. Hypolipidemic and
antioxidant activity of aqueous extract of fruit of Withania coagulans (Stocks) Dunal in
cholesterol-fed hyperlipidemic rabbit model. Indian journal of experimental biology
2014;52:870-5.
[11] Anwer T, Sharma M, Pillai KK, Khan G. Protective effect of Withania somnifera
against oxidative stress and pancreatic beta-cell damage in type 2 diabetic rats. Acta
poloniae pharmaceutica 2012;69:1095-101.


Coagulans loading in nano carrier-small intestine targeted delivery Chapter 6
101

Coagulans loading in nano carrier-large intestine targeted delivery Chapter 7
102
Chapter 7
Coagulans loading in nano carrier-large intestine targeted
delivery
The functioning of the chnp coated with resistant starch, as a large intestine
targeted delivery system is demonstrated in this chapter. For this, the local
effect of the nutraceutical in the large intestine, needs to be demonstrated. The
anti-cancer effect of coagulans on colon cancer cell line was studied for both
the fractions P2 and P4. Simultaneously, the toxicity of the fractions was
tested against fibroblasts as well normal colon cells to elucidate how safe the
extracts were. Though both P2 and P4 were non-toxic to normal cells,
compared to standard anti-cancer drugs, P2 was able to elicit 50% cell kill at
a much lower concentration and lesser time with a SI of above 15. Based on
this, P2 was encapsulated into the carrier system (C+RS) and its release
profile was studied in different GIT fluids. The working of the coating was
confirmed by further evaluating the ability of P2 loaded particles to kill the
cancer cells. The in vitro studies showed that C+RS particles were able to kill
the cancer cells only after being subjected to SCF where RS would be broken
down to release the encapsulated P2 from chnp.

Coagulans loading in nano carrier-large intestine targeted delivery Chapter 7
103
The chnp coated with resistant starch, was developed as a carrier for nutraceutical
molecules, to achieve a targeted delivery of the active ingredient (AI) to the large intestine,
with minimal loss in the stomach and small intestine. The chemo preventive ability of
coagulans has been described previously [1]. Drawing from this the anti-cancer ability of
the extract was tested against colon cancer cells to prove the large intestine targeting ability
of the carrier, as the AI needs to be delivered locally in the large intestine to elicit a local
response i.e. killing of the cancerous cells.
7.1. Anti-cancer effect of coagulans
In vitro toxicity studies on colon cancer cell lines
The ability of the extracts P2 and P4 to kill colon cancer cells was evaluated against Caco2
cells based on the method outlined in section 3.4.1. Different concentrations of the extracts,
P2 and P4, were tested on Caco2 cells for 24 and 48 hours, to identify whether the extracts
had any toxic effects on Caco2 cells. The minimum concentration at which P2 was able to
kill 50% of the cells (IC50) is shown in Figure 7.1. It was observed that after 24 hours of
treatment, P2 exhibited two killing windows, one at a slightly lower concentration of 0.5-
2µM and another wide range at a higher concentration between 20-100µM. The exact value
for the IC 50 was obtained from the linear regression analysis performed on the viability
of Caco2 cells over a range of P2 concentrations 1.89±0.4µM was obtained as the IC 50
for the low concentration window and 81.96±8.5 µM was obtained as the IC50 for the
higher concentration window. This high concentration IC 50 window was neglected since
it was possible to achieve cell kill at a lower concentration of P2 itself. Also, linear
regression analysis was not performed for the cell viabilities obtained for 48-hour treatment,
as the extract is effective within 24 hours.
In the case of treatment with P4, Caco2 cells did not exhibit any cell death up to 24 hours
even at very high concentrations of P4. The extract was able to elicit its anti-cancer ability
only after 48 hours of treatment. As shown in Figure 7.2, P4 does not exhibit any toxic
effect against Caco2 cells up to 10µM and begins to show a concentration dependent toxic
effect beyond 10µM, achieving 50% cell kill around 250µM. The linear regression analysis

Coagulans loading in nano carrier-large intestine targeted delivery Chapter 7
104
of the cell viabilities against varying concentrations of P4 resulted in the IC50 value of
259.59±38.7 µM.
Figure 7.1 Effect of varying concentrations of P2 on the viability of Caco2 cells after 24
hours treatment. *P<0.05 using One-Way ANOVA, post-hoc Tukey test, n=5.
Figure 7.2 Effect of varying concentrations of P4 on the viability of Caco2 cells after 48
hours treatment. *P<0.05 using One-Way ANOVA, post-hoc Tukey test, n=5.

Coagulans loading in nano carrier-large intestine targeted delivery Chapter 7
105
IC50 and Selectivity Index (SI)
The selective ability of the extracts to kill cancer cells and remain safe on normal cells was
assessed by treating the Caco2 cell line and two normal cell lines – HDFa and CRL 1831
with various concentrations of P2 and P4 over specific time points. The IC 50 was
determined for all cell lines and the SI was calculated as the ratio of IC50 of normal cells
to that of the IC50 of Caco2 cells [2]. Based on the results shown in Table 7.1 and Table
7.2, it is evident that both P2 and P4 are able to selectively kill only the cancer cells. Also,
the SI of both P2 and P4 were much higher compared to the commercial drugs Doxorubicin
(DOX) and 5-Fluorouracil (5FU). 5FU is commonly used in the treatment of colon cancer
and used as the hydrophobic model drug to compare against the extract. DOX is a
hydrophilic drug and is not preferred for the treatment of colon cancer due to its severe
cardiotoxicity. It has been used in the study as a model hydrophilic drug to compare with
the extract. While P4 did not exhibit cytotoxicity within 24 hours, P2 elicited its response
during this time. Hence P2 was chosen as the active compound for further studies.
Table 7.1 Comparison of IC 50 and selectivity of P2 on cancerous and normal cell lines
Cell line IC 50 (µM) SI
P2 DOX 5 FU P2 DOX 5 FU
Caco2 1.89±0.4 51.3±13.4 106.94±24.27 - - -
HDFa 29.79±6.7 5.76±2.25 41.81±13.8 15.76 0.1 0.39
CRL1831 35.95±12.7 66.34±4.41 148.5±20.7 19.02 1.29 1.38
Table 7.2 Comparison of IC 50 and selectivity of P4 on cancerous and normal cell lines
Cell line IC 50 (µM) SI
P4 DOX 5 FU P4 DOX 5 FU
Caco2 259.59±38.7 16.3±7.7 53.92±5.87 - - -
HDFa 1218±178.3 1.69±0.64 29.87±4.032 4.69 0.1 0.55
CRL1831 5000±127.2 12.08±1.2 93.59±1.97 19.23 0.74 1.73

Coagulans loading in nano carrier-large intestine targeted delivery Chapter 7
106
7.2. Encapsulation of P2 into the nano carrier
P2 was encapsulated into chnp during the fabrication process itself. Being hydrophobic, P2
loaded chnp, were prepared using βCD as the solubilizing agent [3] Briefly, βCD at a
concentration of 5 mg/mL was dissolved in chitosan solution. P2, was then mixed with this
βCD chitosan solution at a rate of 2 mg/mL. The presence of βCD solubilized the
hydrophobic nutraceutical within its core. This chitosan solution was then electrosprayed
under the same conditions as mentioned in section 3.1.1. The amount of P2 encapsulated
in the particles was determined using an indirect method by measuring the amount of P2
in the supernatant from which the particles were collected. Concentration of P2 in the
supernatant and the encapsulation efficiency was evaluated using HPLC as outlined in
section 3.3.4. The EE was found to be 55±8%.
7.2.1. Release study of P2 from chnp and C+RS
The release kinetics of P2 was studied in different simulated gastric fluids as mentioned in
section 3.3.5. As shown in Figure 7.3, the release kinetics of P2 from chnp was compared
to that of C+RS in order to ascertain the ability of the RS coating to retard the release of
the nutraceutical in the upper GIT. While uncoated chnp displayed a burst release of up to
40% within 2hours in the SGF, the RS coating, restricted the release to less than 20% during
the first 2 hours in SGF. Sequential transfer to SIF, further triggered the release of another
20% from the uncoated chnp, leading to loss of 60% of the encapsulated P2 within 5 hours
in the upper part of the GIT. The same was not true for the RS coated chnp which continued
to delay the premature release of P2 resulting in the cumulative release of nearly 25% P2
in 5 hours in the upper GIT, preserving 75% of P2 for release in the colon. On transfer to
SCF, chnp continued to release P2 and nearly 100% cumulative release was observed in
48 hours. The release of P2 from RS coated chnp, was triggered on contact with SCF and
a steady release was observed up to 48 hours, cumulating to 80% total release within this
time.

Coagulans loading in nano carrier-large intestine targeted delivery Chapter 7
107
0 10 20 30 40 50
0
20
40
60
80
100
*
**
SCFSGF
Cum
ula
tive r
ele
ase %
Time (hours)
Chnp
C+RS
SIF
*
Figure 7.3 Release kinetics of P2 from chnp and C+RS sequentially in different GIT fluids.
*Significantly different (P<0.05) from C+RS at the corresponding time point, One-way
ANOVA, post-hoc, Dunn-Sidak test, n=3.
The release of P2 from chnp was found to follow first order kinetics as observed from
Figure 7.4 (a) with an R2 value of 0.9227. This concentration dependent release pattern of
P2 from uncoated chnp could be attributed to the swelling of chnp in SGF and the
subsequent release of the AI. P2, being hydrophobic, the release was also controlled by the
dissolution of the AI in the release media. Similar to SS coated chnp, the release of P2 from
RS coated particles also exhibited zero order release kinetics in two stages. The minimal
release observed in the upper part of the GIT, fitted well with the zero-order kinetic model
with an R2 value of 0.9743 and the second stage of P2 release in the colon, had an R2 value
of 0.939. Similar to P4, the release mechanism of P2 from C+RS was studied using the
Korsmeyer-Peppas model, which exhibited good fit to the release data with an R2 value of
0.9814. With the n value being 0.5268, the release of P2 from C+RS was attributed to an

Coagulans loading in nano carrier-large intestine targeted delivery Chapter 7
108
anomalous transport mechanism, following a combination of diffusion and swelling. The
swelling in this case happens mainly by the degradation of polymers in the colonic enzymes.
y = -0.017x + 1.751R² = 0.9227
0
0.5
1
1.5
2
-2 8 18 28 38 48
Log
cum
ula
tive
% d
rug
rem
ain
ing
Time (hours)
First order - chnp
y = 4.3463x + 7.226R² = 0.9743
y = 1.1895x + 31.846R² = 0.939
0
20
40
60
80
100
0 10 20 30 40Cu
mu
lati
ve %
dru
g re
leas
ed
Time (hours)
Zero order - C+RS
(a)
(b)

Coagulans loading in nano carrier-large intestine targeted delivery Chapter 7
109
Figure 7.4 Mathematical modelling of the release kinetics of P2 from chnp and C+RS. (a)
release profile from chnp fit to first order kinetics (b) release from C+RS fit to zero-order
kinetics and (c) Korsmeyer-Peppas model
Effect of release media on Caco2 cells
Caco 2 cells were cultured in the media mentioned under table 3.1 and the once the cells
reached 80% confluency, cells were seeded in 96 well plate at the rate of 1x10⁴ cells per
well. The cells reached confluency after 48 hours and were used for testing. P2 loaded chnp
we prepared following the procedure outlined in section. The particles were then coated
with RS as they were intended to target to the large intestine.
The amount of chnp were taken such that the IC 50 concentration is met, with the % of P2
released in 2hrs in SGF alone, with the % of P2 released in 3hrs in SIF alone and with the %
of P2 released in 24hrs in SCF alone, after being diluted 40 times. Release samples cannot
be added directly to the cells as they contain enzymes and low pH in the case of SGF.
Particles cannot be added directly to the cells as they need the enzymatic conditions to be
simulated.
This was matched in weight and coated with RS. The rationale behind this is to test the
hypothesis that the amount of P2 released from equal amounts of chnp would be different
depending on the presence or absence of coating. Hence similar amounts of chnp, both
y = 0.5268x + 1.0671R² = 0.9814
0
0.5
1
1.5
2
2.5
0 0.5 1 1.5 2Log
cum
ula
tive
% d
rug
rele
ased
Log time
Korsmeyer-Peppas - C+RS(c)

Coagulans loading in nano carrier-large intestine targeted delivery Chapter 7
110
coated with RS and uncoated are subject to SGF, SIF and SCF individually, and the ability
of the coating to retard the release was ascertained in vitro.
The test groups were:
1. Blk – Blk SGF, SIF or SCF diluted 40 times.
2. P2 – Free P2 in SGF, SIF or SCF in 2h, 3h or 24h respectively in
concentration to match IC 50 after 40 times dilution.
3. Chnp – Uncoated chnp loaded with P2
4. C+RS – Chnp coated with RS.
From the results, it is evident that the release media itself does not have an effect on the
cells. Free P2 and chnp groups in SGF displays cytotoxicity whereas C+RS does not kill
the cells (* C+RS significantly different from P2 and chnp at p<0.05). This proves that the
coating is able to effectively retard the release of P2 in SGF. A similar trend is observed in
SIF for C+RS. But the free P2 and chnp groups also do not display any cytotoxicity in SIF.
This could be because P2 is being degraded in SIF (an aspect observed for P4 in SIF). In
SCF, due to the degradation of RS by the bacterial amylase, P2 is released which in turn is
reflected as the killing of caco2 cells.

Coagulans loading in nano carrier-large intestine targeted delivery Chapter 7
111
SGF SIF SCF
0
20
40
60
80
100
120***
*
% c
ell
via
bili
ty
Blk
P2
Chnp
C+RS*
Figure 7.5 Effect of the release media from P2 encapsulated chnp and C+RS on the viability
of Caco2 cells, compared against free P2 and blank release media. Free P2, P2
encapsulated chnp and P2 encapsulated C+RS were subject to each of the release medium
individually, and the ability of the RS coating to retard the release of P4 was compared and
evaluated based on the viability of Caco2 cells. Decrease in cell viability indicates release
of P2. *P<0.05, One-way ANOVA, post-hoc Tukey test, n=4.
7.3. Discussion
Colon cancer is the third leading cancer type in both men and women, after prostrate/breast
and lung cancers, where new cases are estimated to occur as of 2018, compared to previous
years [4]. With the increasing incidence of drug resistance being observed, the focus is
shifting towards natural compounds extracted from plant or food sources that have cancer
cell killing or mitigating properties [5]. The synergistic use of such compounds in order to
overcome drug resistance or lessen the drug concentration is also being considered [6]. The

Coagulans loading in nano carrier-large intestine targeted delivery Chapter 7
112
anti-cancer effect of the organic fraction, P2 extracted from the plant Withania coagulans
has been considered in this chapter as a means to exemplify the large intestine targeting
ability of the oral delivery system developed.
The Caco2 cell line, derived from the human epithelial colorectal adenocarcinoma cells,
have been used as a colon cancer model to study the ability of the extract in killing colon
cancer cells. The in vitro studies of the pure extracts revealed its ability to kill Caco2 cells.
In order to access the safety of the extracts when treated on normal cells, two normal cells
lines-dermal fibroblasts (HDFa) and normal colon cells (CRL 1831), were subjected to
varying concentrations of the extracts. The study revealed the selective ability of the
extracts, both P2 and P4 to kill only the Caco2 cells, while leaving the HDFa and CRL1831
unharmed. Based on the concentration and time required to elicit a response, P2 was chosen
as the active compound with shorter response time (24 hours). The SI of two commercial
drugs, 5-Fluorouracil and Doxorubicin were also compared as a control. The low
selectivity indices observed for the two drugs is in agreement with previous reports. A
study by Shahin et al., exemplifies the poor SI of Doxorubicin when breast cancer cell lines
(MCF 7 and MDA-MB-435) were compared against non-cancerous MCF10A cells [7].
Similarly, low SI of 5FU against various colon cancer cell lines compared to that of mouse
fibroblasts has been observed [8]. The high SI observed for P2 compared to that of the
commercial drugs, used to treat colon cancer, strengthens the functionality of the extract
as a potential anti-cancer agent, opening avenues for further research into its
commercialization.
It is imperative to understand the mechanism by which P2 elicits its selective anti-cancer
effect, before putting it to functional use. Though, studying the mechanism of action of P2
is beyond the scope of this thesis, the mechanism of action is hypothesized based on
literature evidence, which could provide a good starting point.
The anti-cancer effect of such plant derived molecules are usually attributed to the
secondary metabolites such as flavonoids and alkaloids [9]. The anticancer activity of
steroidal lactones, extracted from Withania somnifera, with similar structural backbones to

Coagulans loading in nano carrier-large intestine targeted delivery Chapter 7
113
that P2, have been reported previously [10]. These reports, attribute that the anti-cancer
effect of the extracts from Withania somnifera could be linked any of the following
mechanisms individually or in combination: (i) reinforcement of cellular detoxification
system (ii) selective inhibition of tumor cell proliferation and induction of apoptosis (iii)
suppression of tumor angiogenesis; (iv) blockade of metastasis (v) alteration of tumor cell
metabolism or (vi) eradication of cancer stem cells [11]. A study on the cancer chemo
preventive ability of the compounds extracted from Withania coagulans, by Haq et al,
showed that the compounds were able to suppress tumor necrosis factor-α (TNF-α)-
induced nuclear factor-kappa B (NF-κB) activation in murine macrophages, which is
responsible for the uncontrolled proliferation of tumor cells [12]. This could also be one of
the responses happening at the cellular level to suppress tumor.
P2 was encapsulated into the delivery system in order to protect its bioactivity and deliver
it locally in the large intestine. RS, with its ability to resist digestion by the intestinal
amylase, protected the release of P2 in SGF and SIF as seen in Figure 7.3. The simulated
condition in SCF, containing bacterial amylase, mimicking the colon, helped to degrade
the RS coating and release P2 at its intended location. In vitro studies of P2 encapsulated
chnp and C+RS, revealed the ability of the coating layer to not only retard the undesired
release of AI in the upper GIT but also preserve the bioactivity of the encapsulated AI, as
observed from Figure 7.5. An additional observation worth discussing is the inability of
the RS coated chnp, encapsulated with P4, to lower blood glucose levels in diabetic mice,
as seen in Figure 6.8. The in ability of the C+RS particles, to reduce blood glucose, helps
conclude that RS does not degrade in the stomach or small intestine, as the degradation of
the coating, would have caused the release of P4 in the small intestine, thereby eliciting a
response.
7.4. Summary
The ability of RS as a food grade enteric coating to retard the premature release of the AI
in the upper GIT was investigated in this chapter. The anti-cancer property of P2 and P4
were tested on Caco2 cell model and P2 was found to be better than P4 with a higher SI

Coagulans loading in nano carrier-large intestine targeted delivery Chapter 7
114
and shorter treatment time. The hypothesis that the food grade coating can help to target to
large intestine was tested by encapsulating P2 into the delivery system and studying its
release profile, followed by testing the ability of the P2 encapsulated particles to act only
in the presence of colonic enzymes.
References
[1] Youn UJ, Chai X, Park E-J, Kondratyuk TP, Simmons CJ, Borris RP, et al. Biologically
active withanolides from Withania coagulans. Journal of natural products 2013;76:22-8.
[2] Rashidi M, Seghatoleslam A, Namavari M, Amiri A, Fahmidehkar MA, Ramezani A,
et al. Selective Cytotoxicity and Apoptosis-Induction of Cyrtopodion scabrum Extract
Against Digestive Cancer Cell Lines. Int J Cancer Manag 2017;10:e8633.
[3] Yuan Z, Ye Y, Gao F, Yuan H, Lan M, Lou K, et al. Chitosan-graft-β-cyclodextrin
nanoparticles as a carrier for controlled drug release. International Journal of
Pharmaceutics 2013;446:191-8.
[4] L. SR, D. MK, Ahmedin J. Cancer statistics, 2018. CA: A Cancer Journal for Clinicians
2018;68:7-30.
[5] Hu T, Li Z, Gao C-Y, Cho CH. Mechanisms of drug resistance in colon cancer and its
therapeutic strategies. World Journal of Gastroenterology 2016;22:6876-89.
[6] Yang N, Sampathkumar K, Loo SCJ. Recent advances in complementary and
replacement therapy with nutraceuticals in combating gastrointestinal illnesses. Clinical
Nutrition 2017;36:968-79.
[7] Shahin M, Soudy R, Aliabadi HM, Kneteman N, Kaur K, Lavasanifar A. Engineered
breast tumor targeting peptide ligand modified liposomal doxorubicin and the effect of
peptide density on anticancer activity. Biomaterials 2013;34:4089-97.
[8] Flis S, SPŁAWIŃSKI J. Inhibitory Effects of 5-Fluorouracil and Oxaliplatin on Human
Colorectal Cancer Cell Survival Are Synergistically Enhanced by Sulindac Sulfide.
Anticancer Research 2009;29:435-41.

Coagulans loading in nano carrier-large intestine targeted delivery Chapter 7
115
[9] Iqbal J, Abbasi BA, Mahmood T, Kanwal S, Ali B, Shah SA, et al. Plant-derived
anticancer agents: A green anticancer approach. Asian Pacific Journal of Tropical
Biomedicine 2017;7:1129-50.
[10] Machin RP, Veleiro AS, Nicotra VE, Oberti JC, Padron JM. Antiproliferative activity
of withanolides against human breast cancer cell lines. J Nat Prod 2010;73:966-8.
[11] Lee I-C, Choi B. Withaferin-A—A Natural Anticancer Agent with Pleitropic
Mechanisms of Action. International Journal of Molecular Sciences 2016;17:290.
[12] Ihsan ul H, Youn UJ, Chai X, Park E-J, Kondratyuk TP, Simmons CJ, et al.
Biologically Active Withanolides from Withania coagulans. Journal of Natural Products
2013;76:22-8.


Conclusions and future recommendations Chapter 8
117
Chapter 8
Conclusions and future recommendations
This chapter draws together the discussions and conclusions from
different results presented in Chapters 4-7 as a means to understand how
these results encompass the main hypothesis and objectives. The
conclusions drawn also help to understand to what extent the aim of this
thesis has been fulfilled in developing an oral delivery system targeting to
different parts of the GIT using food grade materials. Following this, the
protractive direction of the thesis is also discussed. The detailed
investigation of the chnp uptake using a triculture model, and the
biokinetics study of chnp using a GIT simulator would help understand
the fate of the nanoparticles in an environment better representative of
what is in vivo. This forms a bridging study before moving into animal
models to test the biokinetics of chnp. Purification and isolation of the
extracts P2 and P4 in order to identify single molecule compounds
responsible for the anti-cancer and anti-diabetic effect is also
recommended as another important step towards standardizing these
nutraceuticals. The last part of the chapter discusses some reconnaissance
work done on the wound healing properties of the extract, done as a part
of screening the extracts for the presence of bioactive properties.

Conclusions and future recommendations Chapter 8
118
8.1. Conclusions
The work for this thesis was inducted with the primary aim to develop an oral delivery
system for targeted delivery to the small or large intestine using food grade polymers, so
that it can be used to encapsulate nutraceuticals, intended to be used an additive in fortified
or functional foods, thereby protecting the bioactivity and enhancing the bioavailability of
the nutraceutical. The lack of a delivery system that could perform such diverse functions,
formed the motivation for this thesis. Hence, it was hypothesized that a food grade polymer
could be modified effectively to target to different parts of the GIT. In order to test this
hypothesis, four main objectives were outlined.
The primary objective was to design and develop a delivery platform using
biopolymers/food grade materials using mild techniques that do not use any toxic solvents.
After extensive literature survey, chitosan and starch were chosen as the materials to be
used in the fabrication of the delivery system. Chitosan was chosen for its mucoadhesive
property and starch, for its selective digestibility depending on its source. The design of
the delivery system was laid out in a way to maximize the interaction of the carrier with
the cells lining the GIT, to allow increased residence times and better cellular uptake for
systemic absorption. This was facilitated by incorporating a nano sized core into the design
of the carrier. Naturally, chitosan was the core material to take advantage of its
mucoadhesive and transient tight junction opening properties, while starch, with its
selective digestibility, was to be used as the coating material. In addition, starch was
rendered gastro protective by means of retrogradation.
With this design in place, the delivery system was developed by a two-step fabrication
process. Chnp were fabricated by means of electrospraying, as a reproducible technique
without the use of harsh chemicals. The prepared chnp were characterized extensively and
was found to be in the desired size range to facilitate uptake by the enterocytes of the GIT.
Following this, the chnp were coated with two different types of retrograded starch,
depending on its intended target, the small or large intestine. The coating was by means of
electrostatic interactions followed by using a food grade cross linker. The formation of a

Conclusions and future recommendations Chapter 8
119
coating layer of starch on chnp was verified successfully by means of zeta potential
measurements, which indicated charge inversion and the presence of a core shell
morphology was visualized using confocal microscopy. The next important step in
fulfilling the first objective was to compare the selective degrading ability of the starch
coating in different simulated intestinal fluids to that of commercially available non-food
grade synthetic polymers. The performance of the two different retrograded starches was
comparable to that of the commercial Eudragit polymers, with the soluble starch resisting
degradation in the SGF and degrading in SIF and the RS resisting degradation in SGF and
SIF and degrading in SCF. The ability of chnp to be taken up by the enterocytes was studied
using Caco2 cell monolayer as a model and the nanoparticles were indeed able to localize
within the cells after 2 hours of incubation. These results, provided substantial evidence on
the successful development of a delivery platform.
The second objective was to choose a suitable nutraceutical to be loaded into the delivery
system, such that the nutraceutical can be used to exemplify the targeting ability of the
delivery system. Based on its numerous therapeutic properties reported, Withania
coagulans was chosen as the nutraceutical, and the anti-diabetic and anti-cancer properties
of the extracts were chosen to exemplify the small intestine and large intestine targeting
ability of the delivery system. In this regard, two different fractions – aqueous (P4) and
organic (P2) were extracted from the fruits of the plant. The extracted fractions were
characterized to identify the structure of the compounds present and the basic structural
backbone of the compounds in P2 and P4 were found to be similar to that of the compounds
reported previously. It was also deduced that the fractions obtained were not pure
compounds and was a mixture of more than one compound. The fractions were not further
purified as the combined therapeutic effect was intended to be studied and the purification
and isolation of a single compound with therapeutic effect was beyond the scope of this
work. The feasibility of encapsulating the selected nutraceutical within a well-known
polymeric carrier was also tested as a preliminary study before being encapsulated into the
actual carrier itself.

Conclusions and future recommendations Chapter 8
120
The last two objectives, focuses on testing the targeting ability of the delivery system. The
third objective was to test the small intestine targeting ability of the extract by means of
the anti-diabetic effect of the AI. The anti-diabetic effect of the extracts was confirmed in
vivo using diabetic mouse model. P4 was found to be more effective than P2 and was
chosen as the fraction to be loaded into the delivery system. The in vitro testing of P4 on
beta cells, led to the confirmation of the hypothesis that the preliminary mechanism of
action could be the promotion of insulin secretion from beta cells. With these information,
P4 was encapsulated into the delivery system made of chitosan and starch and its working
was tested in vitro, by a sequential release study in simulated gastric fluids. The results
were supportive of the selective degrading and gastro protective property of starch,
manifested by a retarded release of P4 in SGF, slow release in SIF and the rate of release
picking up subsequently. It was also observed from in vitro studies, that the encapsulation
prevented the AI from being degraded and preserved the bioactivity of the AI to be utilized
at the intended site of action. The working of the P4 loaded delivery system was tested in
vivo and the preliminary results were indicative of the successful small intestine targeting
ability of the starch coated chnp.
The last objective, to verify the hypothesis, was to prove the large intestine targeting ability
of the delivery system. The reported anti-cancer effect of the extract was used to exemplify
this property. The effect of the extracts P2 and P4 on colon cancer cell line was studied and
based on the time required to elicit the response, concentration and SI, P2 was found to
have potent, selective toxicity against colon cancer cells compared to P4. While
investigating the mechanism of action against cancer cells was beyond the scope of this
thesis, some of the possible routes of mediating tumor cell toxicity were hypothesized.
Following this, P2 was encapsulated into the delivery system suitable for large intestine
targeting and the release profile indicated the ability of RS coating to retard the release of
P2 in SGF and SIF. In vitro studies on delivery systems encapsulated with P2, further
confirmed the ability of the carrier to release the AI only in the presence of bacterial
amylases and also its ability to protect the bioactivity of the encapsulated AI.

Conclusions and future recommendations Chapter 8
121
Thus, by fulfillment of the four main objectives outlined above, led to the verification of
hypothesis that food grade materials could be used as excellent delivery vehicles and can
be used as a means of GIT targeting. The food grade coating stands out from commercial
enteric or stimuli-responsive coatings in that the currently available coatings can only be
used at the macroscale for coating microparticles. Also, these commercial non-GRAS
materials are used only as film coatings on pharmaceutical tablets and are required to be
spray-coated onto tablets at specific inlet and outlet air temperatures, which would
adversely affect the sensitive nature of the AI. Hence, the use of food grade materials such
as starch and chitosan serves as a good basis in developing food grade, GIT-targeting
nanoparticles for drug and nutraceutical delivery. The final nano-carrier is composed of
GRAS materials that are approved to be used as a direct food additive.
8.2. Future recommendations
Some of the studies listed below, helps to add on to the scientific knowledge and better
understand the nutraceutical loaded delivery system, as a step towards developing a robust
system, intended for use in foods.
8.2.1. Evaluation of cellular uptake using triculture model
The triculture model developed by DeLoid et al, mimics the intestinal epithelial barrier,
using three different types of cells [1]. Caco2 cells form the enterocyte monolayer, HT29-
MTX cells differentiate into goblet cells and Caco2 cells in the presence of soluble factors
from Raji B cells, differentiate into M cell. The three cell types are representative of the
cells found in the human intestine. The cells are cultures on a Transwell membrane as
shown in Figure 8.1. for 21 days to allow for the differentiation into the particular cell type.
Following this, a preliminary toxicity study would be carried out to assess the safe
concentration to work on. The lactate dehydrogenase and presto blue assays would be used
as the endpoint analysis to quantify the cytotoxicity. Fluorescent chnp at the chosen
concentration, would be added to the apical compartment and its ability to pass through the

Conclusions and future recommendations Chapter 8
122
monolayer into the basolateral compartment would be evaluated over different time points.
At each time point, the media from the basolateral compartment would be checked to
quantify the number of particles that can cross over. A qualitative study on the cellular
uptake can be done by visualizing the cellular monolayer using confocal microscopy.
Figure 8.1 Triculture model to study nanoparticle uptake in GIT [1]. Reproduced with
permission from ACS publications.
Biokinetics study using the GIT simulator
The fate of the starch coated delivery system under a dynamic condition, would give an
idea of how the system would behave in vivo. The GIT simulator developed by DeLoid et
al, at Harvard would serve this purpose comprehensively. The simulator, as shown in
Figure 8.2, comprises of three phases to mimic the digestion in the mouth, stomach and
small intestine by matching the time, composition and dynamic environments in each of
these phases. The simulator allows for collection of sample at each phase for analysis. Drug
or fluorescent dye loaded chnp can be used to assess the amount of encapsulated material
released at each phase of the simulator. This would help assess the functioning of the starch
coating. The digesta from the last small intestine phase, can be added to the triculture model,
described above to simulate the ability of chnp to be up taken, after going through he GIT
simulator.

Conclusions and future recommendations Chapter 8
123
Figure 8.2 Schematic of the GIT simulator [1]. Reproduced with permission from ACS
publications.
Purification of the extracts P2 and P4
The therapeutic effects of the extracts P2 and P4 have been demonstrated in vitro in this
work. Since the extracts are not pure compounds, the next step would be to purify the
fractions, with the aim of isolating a single molecule compound that is responsible for the
therapeutic properties. This would involve, rigorous purification using chromatographic
columns and extensive characterization to elucidate the structure. Following this, the
purified compounds could then be screened using the in vitro assays mentioned in sections
3.4.1, Error! Reference source not found. and 3.4.2 to identify the compound with the

Conclusions and future recommendations Chapter 8
124
ost potent therapeutic effect. Subsequently the mechanism of action of these compounds
could be elucidated using pancreatic islet cell model or cancer cell lines.
In vivo studies
In order to further strengthen the preliminary in vivo data obtained in section, 6.2.3, the
experiment would be repeated to increase the number of animals in each group. This
increased number of animals can then be used to compute the statistics. Similarly, in vivo
studies using cancer mouse model could be done to prove beyond doubt the large intestine
targeting ability of the delivery system.
8.3. Reconnaissance studies
In an attempt to understand and hypothesize the mechanisms involved in the beneficial
effects of the coagulans extracts, three different effects of the extracts: wound-healing
effect, anti-diabetic effect and anti-cancer effect were evaluated in vitro. While the anti-
diabetic and anti-cancer effects, have been discussed in chapters 6 and 7, as a means to
exemplify the targeting ability of the delivery system, the observed results for the wound
healing property of the extracts, does not warrant a place in these chapters. Hence these
results are explained here as findings observed while investigating the various therapeutic
effects of coagulans in vitro
8.3.1. Wound healing effect
The toxicity of the extracts, at a range of concentrations, for both P2 and P4 were tested on
HDF cells, in order to determine the working concentration for the wound healing studies.
The cells were seeded at the concentration of 2x10⁴ cells per well in 96 well plates. After
24 hours, the cells reached confluency and different concentrations of P2 and P4 dissolved
in DMSO and water respectively, were added to the cells. Each concentration had five
replicates. CCK 8 was used to assess the viability of cells and % cell viability was
calculated based on Equation 3.3. As in Figure 8.3, all the four concentrations of P2

Conclusions and future recommendations Chapter 8
125
evaluated, showed potent toxic effects after 48 hours treatment on the cells, while P4, even
at higher concentrations, showed only minimal toxicity even after 48 hours treatment. At
low concertation, P4 was essentially non-toxic to the cells and also promoted cell
proliferation. Hence this concentration was chosen for the subsequent studies.
Figure 8.3 Effect of (a) P2 and (b) P4 on the viability of HDF cells
Scratch wound assay
(a)
(b)

Conclusions and future recommendations Chapter 8
126
The scratch wound assay is a standard technique used to study rate of cell migration in the
presence or absence of a particular molecule or compound. Briefly, HDF cells were seeded
onto 25 mm cell culture dishes at a density of 1x10⁵ cells. Once the cells reached
confluency after 24 hours, a scratch was made running through the diameter of the dish
using a sterile 1000 µL pipette tip. The resulting cell debris was washed off using PBS and
fresh media was added, to which the samples were added. The experiment was repeated
three times to obtain replicates. Once the samples were added, the dishes were viewed
under light microscope and photographed at five different points along the scratch, which
were also marked to enable subsequent follow up for 48 hours. At every 12-hour interval,
the dishes were photographed using the software attached to the microscope at the pre-
marked points. The images were then analyzed using ImageJ to determine the open wound
area and the wound closure rate was calculated based on Equation 8.1.
Equation 8.1 Formula for % wound closure calculation
% 𝑤𝑜𝑢𝑛𝑑 𝑐𝑙𝑜𝑠𝑢𝑟𝑒 = (100 −𝐴𝑟𝑒𝑎 𝑜𝑓 𝑠𝑐𝑟𝑎𝑡𝑐ℎ 𝑑𝑒𝑣𝑜𝑖𝑑 𝑜𝑓 𝑐𝑒𝑙𝑙𝑠 𝑇𝑛
𝐴𝑟𝑒𝑎 𝑜𝑓 𝑠𝑐𝑟𝑎𝑡𝑐ℎ 𝑑𝑒𝑣𝑜𝑖𝑑 𝑜𝑓 𝑐𝑒𝑙𝑙𝑠 𝑎𝑡 𝑇0) ∗ 100
Where, Tn refers to the different time points at 0, 12, 24, 36 or 48.
As shown in Figure 8.4, the experiment involved four test groups. Untreated cells (group
1-untreated) were the negative control. A positive drug control was not included as the
mechanism of action of P4 is not known, which would severely hamper the choice of a
right control. The concentration of free P4 (group 2-P4-1µg/mL) was chosen based on the
toxicity studies as elaborated in section 8.3.1. The same concentration was matched in P4
encapsulated in PLGA (group 3-P4 PLGA) to be release over 48 hours and for the P4 added
in parts group, P4 added every 12 hours (group 4-P4-1µg/mL added in parts) such as to
match the 1µg/mL concentration over 48 hours. All the test groups except group 1, showed
complete wound closure at 48 hours, proving that P4 is in fact able to promote wound
closure and was significantly different from group 1 at all-time points. In order compare
the effect of encapsulating P4 and releasing it in a controlled sustained manner, to that of
adding free P4, P4 was added every 12 hours to mimic sustained release. This is seen in

Conclusions and future recommendations Chapter 8
127
the groups 3 and 4 showing statistically significant faster wound closure than group 2 after
12 and 36 hours, the time points at which fresh P4 is added.
12 24 36 48
0
20
40
60
80
100*
**
***
***
*
Time (hours)
% w
ou
nd
clo
sure
Untreated P4-1ug/ml P4 PLGA P4-1ug/ml(added in parts)
Figure 8.4 Wound healing effect of free P4 and P4 encapsulated in PLGA microparticles
compared against untreated control and free P4 added in parts at specific time intervals on
HDF cells over 48 hours. * P<0.05 One-Way ANOVA, post-hoc Tukey test, n=3.
The wound healing effect stems from the toxicity studies of P2 and P4 on HDF. From the
studies, it was inferred that P2 is not only toxic to the cells but may also not possess the
compounds that promote wound healing activity. On the other hand, at low concentrations,
P4 was able to promote cell proliferation and almost double the cells compared to untreated
cells after 48 hours. This led to the inference that P4 would certainly contain compounds
essential for wound healing as proliferation of fibroblasts is an important step in wound
healing. A study of wound healing effect of coagulans on mice, also orients towards the
increased proliferation of fibroblasts as the mechanism of action [2]. While the molecular
processes and signaling pathways underlying proliferation and migration of the fibroblasts

Conclusions and future recommendations Chapter 8
128
needs to be evaluated to support the migration of fibroblasts at the wound site, it could be
hypothesized that the anti-oxidant property of coagulans could be one of the reasons for
the wound healing property. When there is a wound, hydrogen peroxide causes injury to
fibroblasts and damages its migrative ability by inhibition of epidermal growth factor
receptor internalization [3]. Coagulans with its known anti-oxidant property [4], could help
control oxidative damage, thereby promoting fibroblast migration.
References
[1] DeLoid GM, Wang Y, Kapronezai K, Lorente LR, Zhang R, Pyrgiotakis G, et al. An
integrated methodology for assessing the impact of food matrix and gastrointestinal effects
on the biokinetics and cellular toxicity of ingested engineered nanomaterials. Particle and
Fibre Toxicology 2017;14:40.
[2] Prasad SK, Kumar R, Patel DK, Hemalatha S. Wound healing activity of Withania
coagulans in streptozotocin-induced diabetic rats. Pharmaceutical biology 2010;48:1397-
404.
[3] Khosravitabar F, Abrishamchi P, Bahrami AR, Moghaddam Matin M, Ejtehadi H,
Varasteh Kojourian M. Enhanced Cutaneous Wound Healing by the Leaf Extract of
Achillea eriophora DC Using the In Vitro Scratch Assay. Journal of Sciences, Islamic
Republic of Iran 2017;28.
[4] Ihsan ul H, Youn UJ, Chai X, Park E-J, Kondratyuk TP, Simmons CJ, et al. Biologically
Active Withanolides from Withania coagulans. Journal of Natural Products 2013;76:22-8.

Appendix
129
Appendix
Linear regression analysis
The regression analysis was done by plotting the % cell viability observed vs log
concentration (µM). IC 50 was calculated form the equation obtained by fitting the data
points to a linear trendline. An R2 value of above 0.95 was considered to be best fit. Of the
samples tested, one representative graph for each condition is shown.
P2
As mentioned in section 7.1.1, cell kill was observed at a lower concentration of P2, within
a narrow window also the higher concentrations. This gave rise to two trends in the cell
kill as observed in the graph above. Based on the equation obtained from the linear
regression graph in the lower concentration window,
𝐶𝑜𝑛𝑐𝑒𝑛𝑡𝑟𝑎𝑡𝑖𝑜𝑛 𝑜𝑓 𝑃2 𝑟𝑒𝑞𝑢𝑖𝑟𝑒𝑑 𝑡𝑜 𝑘𝑖𝑙𝑙 50% 𝑐𝑒𝑙𝑙𝑠(𝐼𝐶50) = 𝐴𝑛𝑡𝑖𝑙𝑜𝑔 [50−52.576
−0.9906]
IC 50 = 1.418 µM
y = -16.96x + 52.576R² = 0.9906 y = -22.463x + 92.959
R² = 0.9725
0
10
20
30
40
50
60
70
80
90
100
-2.5 -2 -1.5 -1 -0.5 0 0.5 1 1.5 2 2.5 3
% c
ell v
iab
ility
Log concentration (µM)
P2 - Caco2

Appendix
130
From the equation obtained from the linear regression graph,
𝐶𝑜𝑛𝑐𝑒𝑛𝑡𝑟𝑎𝑡𝑖𝑜𝑛 𝑜𝑓 𝑃2 𝑟𝑒𝑞𝑢𝑖𝑟𝑒𝑑 𝑡𝑜 𝑘𝑖𝑙𝑙 50% 𝑐𝑒𝑙𝑙𝑠(𝐼𝐶50) = 𝐴𝑛𝑡𝑖𝑙𝑜𝑔 [50−116.29
−46.55]
IC 50 = 26.54 µM
From the equation obtained from the linear regression graph,
𝐶𝑜𝑛𝑐𝑒𝑛𝑡𝑟𝑎𝑡𝑖𝑜𝑛 𝑜𝑓 𝑃2 𝑟𝑒𝑞𝑢𝑖𝑟𝑒𝑑 𝑡𝑜 𝑘𝑖𝑙𝑙 50% 𝑐𝑒𝑙𝑙𝑠(𝐼𝐶50) = 𝐴𝑛𝑡𝑖𝑙𝑜𝑔 [50−112.84
−43.503]
IC 50 = 27.82 µM
y = -46.558x + 116.29R² = 0.9638
0
20
40
60
80
100
120
0 0.5 1 1.5 2 2.5
% c
ell v
iab
ility
Log concentration (µM)
P2 - HDFa
y = -43.503x + 112.84R² = 0.9616
0
20
40
60
80
100
120
0 0.5 1 1.5 2 2.5
% c
ell v
iab
ility
Log concentration (µM)
P2 - CRL1831

Appendix
131
DOX
From the equation obtained from the linear regression graph,
𝐶𝑜𝑛𝑐𝑒𝑛𝑡𝑟𝑎𝑡𝑖𝑜𝑛 𝑜𝑓 𝑃2 𝑟𝑒𝑞𝑢𝑖𝑟𝑒𝑑 𝑡𝑜 𝑘𝑖𝑙𝑙 50% 𝑐𝑒𝑙𝑙𝑠(𝐼𝐶50) = 𝐴𝑛𝑡𝑖𝑙𝑜𝑔 [50−63.052
−8.014]
IC 50 = 42.60 µM
From the equation obtained from the linear regression graph,
y = -8.014x + 63.052R² = 0.9508
0
10
20
30
40
50
60
70
80
90
100
0 0.5 1 1.5 2 2.5
% c
ell v
iab
ility
Log concentration (µM)
Dox-Caco2
y = -22.111x + 64.403R² = 0.9648
0
10
20
30
40
50
60
70
80
90
100
0 0.5 1 1.5 2 2.5
% c
ell v
iab
ility
Log concentration (µM)
DOX - HDFa
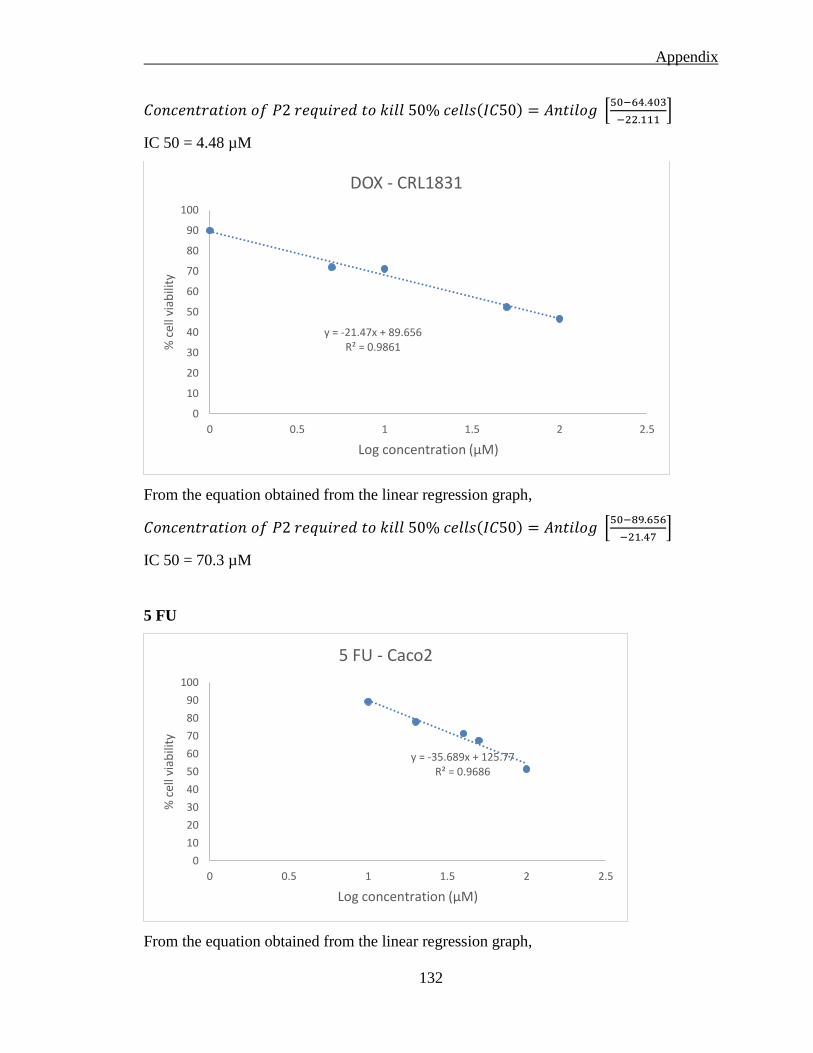
Appendix
132
𝐶𝑜𝑛𝑐𝑒𝑛𝑡𝑟𝑎𝑡𝑖𝑜𝑛 𝑜𝑓 𝑃2 𝑟𝑒𝑞𝑢𝑖𝑟𝑒𝑑 𝑡𝑜 𝑘𝑖𝑙𝑙 50% 𝑐𝑒𝑙𝑙𝑠(𝐼𝐶50) = 𝐴𝑛𝑡𝑖𝑙𝑜𝑔 [50−64.403
−22.111]
IC 50 = 4.48 µM
From the equation obtained from the linear regression graph,
𝐶𝑜𝑛𝑐𝑒𝑛𝑡𝑟𝑎𝑡𝑖𝑜𝑛 𝑜𝑓 𝑃2 𝑟𝑒𝑞𝑢𝑖𝑟𝑒𝑑 𝑡𝑜 𝑘𝑖𝑙𝑙 50% 𝑐𝑒𝑙𝑙𝑠(𝐼𝐶50) = 𝐴𝑛𝑡𝑖𝑙𝑜𝑔 [50−89.656
−21.47]
IC 50 = 70.3 µM
5 FU
From the equation obtained from the linear regression graph,
y = -21.47x + 89.656R² = 0.9861
0
10
20
30
40
50
60
70
80
90
100
0 0.5 1 1.5 2 2.5
% c
ell v
iab
ility
Log concentration (µM)
DOX - CRL1831
y = -35.689x + 125.77R² = 0.9686
0
10
20
30
40
50
60
70
80
90
100
0 0.5 1 1.5 2 2.5
% c
ell v
iab
ility
Log concentration (µM)
5 FU - Caco2

Appendix
133
𝐶𝑜𝑛𝑐𝑒𝑛𝑡𝑟𝑎𝑡𝑖𝑜𝑛 𝑜𝑓 𝑃2 𝑟𝑒𝑞𝑢𝑖𝑟𝑒𝑑 𝑡𝑜 𝑘𝑖𝑙𝑙 50% 𝑐𝑒𝑙𝑙𝑠(𝐼𝐶50) = 𝐴𝑛𝑡𝑖𝑙𝑜𝑔 [50−125.77
−35.68]
IC 50 = 132.75 µM
From the equation obtained from the linear regression graph,
𝐶𝑜𝑛𝑐𝑒𝑛𝑡𝑟𝑎𝑡𝑖𝑜𝑛 𝑜𝑓 𝑃2 𝑟𝑒𝑞𝑢𝑖𝑟𝑒𝑑 𝑡𝑜 𝑘𝑖𝑙𝑙 50% 𝑐𝑒𝑙𝑙𝑠(𝐼𝐶50) = 𝐴𝑛𝑡𝑖𝑙𝑜𝑔 [50−98.286
−30.98]
IC 50 = 36.19 µM
From the equation obtained from the linear regression graph,
𝐶𝑜𝑛𝑐𝑒𝑛𝑡𝑟𝑎𝑡𝑖𝑜𝑛 𝑜𝑓 𝑃2 𝑟𝑒𝑞𝑢𝑖𝑟𝑒𝑑 𝑡𝑜 𝑘𝑖𝑙𝑙 50% 𝑐𝑒𝑙𝑙𝑠(𝐼𝐶50) = 𝐴𝑛𝑡𝑖𝑙𝑜𝑔 [50−125.91
−34.698]
IC 50 = 154.07 µM
y = -30.98x + 98.286R² = 0.9666
0
10
20
30
40
50
60
70
80
0 0.5 1 1.5 2 2.5
% c
ell v
iab
ility
Log concentration (µM)
5FU - HDFa
y = -34.698x + 125.91R² = 0.9563
0
10
20
30
40
50
60
70
80
90
100
0 0.5 1 1.5 2 2.5
% c
ell v
iab
ility
Log concentration (µM)
5FU - CRL1831

Appendix
134
P4-48 hours
From the equation obtained from the linear regression graph,
𝐶𝑜𝑛𝑐𝑒𝑛𝑡𝑟𝑎𝑡𝑖𝑜𝑛 𝑜𝑓 𝑃2 𝑟𝑒𝑞𝑢𝑖𝑟𝑒𝑑 𝑡𝑜 𝑘𝑖𝑙𝑙 50% 𝑐𝑒𝑙𝑙𝑠(𝐼𝐶50) = 𝐴𝑛𝑡𝑖𝑙𝑜𝑔 [50−117.57
−28.653]
IC 50 = 238.64 µM
From the equation obtained from the linear regression graph,
𝐶𝑜𝑛𝑐𝑒𝑛𝑡𝑟𝑎𝑡𝑖𝑜𝑛 𝑜𝑓 𝑃2 𝑟𝑒𝑞𝑢𝑖𝑟𝑒𝑑 𝑡𝑜 𝑘𝑖𝑙𝑙 50% 𝑐𝑒𝑙𝑙𝑠(𝐼𝐶50) = 𝐴𝑛𝑡𝑖𝑙𝑜𝑔 [50−233.2
−58.101]
IC 50 = 1422.75 µM
y = -28.653x + 117.57R² = 0.988
0
20
40
60
80
100
120
0 0.5 1 1.5 2 2.5 3 3.5
% c
ell v
iab
ility
Log concentration (µM)
P4 - Caco2
y = -58.101x + 233.2R² = 0.9875
0
20
40
60
80
100
120
0 0.5 1 1.5 2 2.5 3 3.5 4
% c
ell v
iab
ility
Log concentration (µM)
P4 - HDFa

Appendix
135
From the equation obtained from the linear regression graph,
𝐶𝑜𝑛𝑐𝑒𝑛𝑡𝑟𝑎𝑡𝑖𝑜𝑛 𝑜𝑓 𝑃2 𝑟𝑒𝑞𝑢𝑖𝑟𝑒𝑑 𝑡𝑜 𝑘𝑖𝑙𝑙 50% 𝑐𝑒𝑙𝑙𝑠(𝐼𝐶50) = 𝐴𝑛𝑡𝑖𝑙𝑜𝑔 [50−368.81
−85.654]
IC 50 = 5273.12 µM
DOX
From the equation obtained from the linear regression graph,
𝐶𝑜𝑛𝑐𝑒𝑛𝑡𝑟𝑎𝑡𝑖𝑜𝑛 𝑜𝑓 𝑃2 𝑟𝑒𝑞𝑢𝑖𝑟𝑒𝑑 𝑡𝑜 𝑘𝑖𝑙𝑙 50% 𝑐𝑒𝑙𝑙𝑠(𝐼𝐶50) = 𝐴𝑛𝑡𝑖𝑙𝑜𝑔 [50−79.877
−25.466 ]
IC 50 = 14.90 µM
y = -85.654x + 368.81R² = 0.9774
0
20
40
60
80
100
120
0 0.5 1 1.5 2 2.5 3 3.5 4
% c
ell v
iab
ility
Log concentration (µM)
P4 - CRL 1831
y = -25.466x + 79.877R² = 0.9889
0
10
20
30
40
50
60
70
80
90
0 0.5 1 1.5 2 2.5
% c
ell v
iab
ility
Log concentration (µM)
DOX - Caco2

Appendix
136
From the equation obtained from the linear regression graph,
𝐶𝑜𝑛𝑐𝑒𝑛𝑡𝑟𝑎𝑡𝑖𝑜𝑛 𝑜𝑓 𝑃2 𝑟𝑒𝑞𝑢𝑖𝑟𝑒𝑑 𝑡𝑜 𝑘𝑖𝑙𝑙 50% 𝑐𝑒𝑙𝑙𝑠(𝐼𝐶50) = 𝐴𝑛𝑡𝑖𝑙𝑜𝑔 [50−55.409
−16.598 ]
IC 50 = 2.1 µM
From the equation obtained from the linear regression graph,
𝐶𝑜𝑛𝑐𝑒𝑛𝑡𝑟𝑎𝑡𝑖𝑜𝑛 𝑜𝑓 𝑃2 𝑟𝑒𝑞𝑢𝑖𝑟𝑒𝑑 𝑡𝑜 𝑘𝑖𝑙𝑙 50% 𝑐𝑒𝑙𝑙𝑠(𝐼𝐶50) = 𝐴𝑛𝑡𝑖𝑙𝑜𝑔 [50−64.923
−13.942]
IC 50 = 11.75 µM
y = -16.598x + 55.409R² = 0.9571
0
10
20
30
40
50
60
0 0.5 1 1.5 2 2.5
% c
ell v
iab
ility
Log concentration (µM)
DOX - HDFa
y = -13.942x + 64.923R² = 0.9896
0
10
20
30
40
50
60
70
0 0.5 1 1.5 2 2.5
% c
ell v
iab
ility
Log concentration (µM)
DOX - CRL 1831
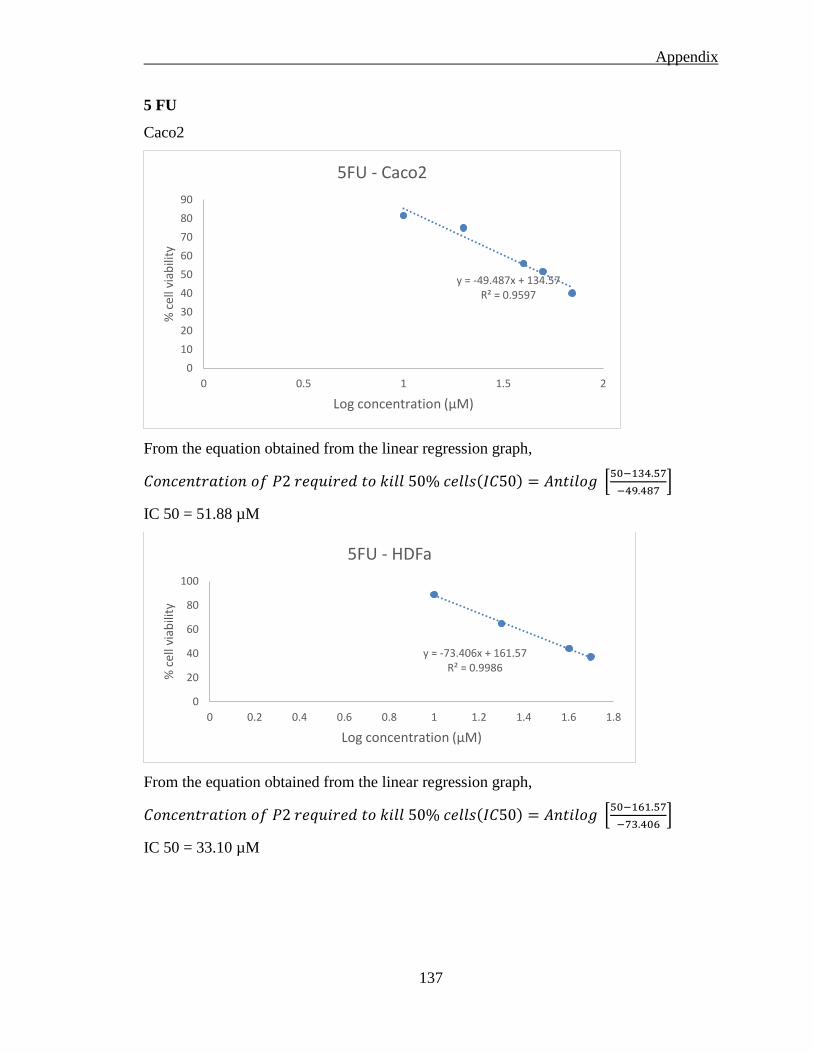
Appendix
137
5 FU
Caco2
From the equation obtained from the linear regression graph,
𝐶𝑜𝑛𝑐𝑒𝑛𝑡𝑟𝑎𝑡𝑖𝑜𝑛 𝑜𝑓 𝑃2 𝑟𝑒𝑞𝑢𝑖𝑟𝑒𝑑 𝑡𝑜 𝑘𝑖𝑙𝑙 50% 𝑐𝑒𝑙𝑙𝑠(𝐼𝐶50) = 𝐴𝑛𝑡𝑖𝑙𝑜𝑔 [50−134.57
−49.487]
IC 50 = 51.88 µM
From the equation obtained from the linear regression graph,
𝐶𝑜𝑛𝑐𝑒𝑛𝑡𝑟𝑎𝑡𝑖𝑜𝑛 𝑜𝑓 𝑃2 𝑟𝑒𝑞𝑢𝑖𝑟𝑒𝑑 𝑡𝑜 𝑘𝑖𝑙𝑙 50% 𝑐𝑒𝑙𝑙𝑠(𝐼𝐶50) = 𝐴𝑛𝑡𝑖𝑙𝑜𝑔 [50−161.57
−73.406]
IC 50 = 33.10 µM
y = -49.487x + 134.57R² = 0.9597
0
10
20
30
40
50
60
70
80
90
0 0.5 1 1.5 2
% c
ell v
iab
ility
Log concentration (µM)
5FU - Caco2
y = -73.406x + 161.57R² = 0.9986
0
20
40
60
80
100
0 0.2 0.4 0.6 0.8 1 1.2 1.4 1.6 1.8
% c
ell v
iab
ility
Log concentration (µM)
5FU - HDFa

Appendix
138
From the equation obtained from the linear regression graph,
𝐶𝑜𝑛𝑐𝑒𝑛𝑡𝑟𝑎𝑡𝑖𝑜𝑛 𝑜𝑓 𝑃2 𝑟𝑒𝑞𝑢𝑖𝑟𝑒𝑑 𝑡𝑜 𝑘𝑖𝑙𝑙 50% 𝑐𝑒𝑙𝑙𝑠(𝐼𝐶50) = 𝐴𝑛𝑡𝑖𝑙𝑜𝑔 [50−144.7
−48.193]
IC 50 = 92.26 µM
y = -48.193x + 144.7R² = 0.9762
0
10
20
30
40
50
60
70
80
90
0 0.5 1 1.5 2 2.5
% c
ell v
iab
ility
Log concentration (µM)
5FU - CRL1831