development of functional beverage from barley
TRANSCRIPT
DEVELOPMENT OF FUNCTIONAL BEVERAGE FROM BARLEY
By
AHMAD DIN MSc (Hons) Food Technology
Thesis submitted in partial fulfillment of requirements for the degree of
DOCTOR OF PHILOSOPHY IN
FOOD TECHNOLOGY
NATIONAL INSTITUTE OF FOOD SCIENCE AND TECHNOLOGY UNIVERSITY OF AGRICULTURE FAISALABAD
PAKISTAN
2009
Dedicated
to my Beloved Parents
ACKNOWLEDGMENTS
All praises and thanks are for Almighty Allah the Merciful the only creator of
the universe and source of all knowledge and wisdom who blessed me with health
thoughts talented teachers helping friends and opportunity to complete this study I
offer my humblest thanks to Holy Prophet Hazrat Muhammad (Peace be Upon Him)
whose moral and spiritual teachings enlightened my heart mind and flourished my
thoughts towards achieving high ideals of life
I am grateful to my supervisor Professor Dr Faqir Muhammad Anjum Director
General National Institute of Food Science and Technology University of Agriculture
Faisalabad for his supervision in planning execution and scholarly ideas that beautified
the scientific nature of the research work presented in this manuscript He always
directed to enlighten the ways of life as well
I am thankful to the members of my supervisory committee Dr Tahir Zahoor
Associate Professor National Institute of Food Science and Technology and Dr Haq
Nawaz Institute of Animal Nutrition and Feed Technology for their kind help and
constructive criticism during the course of study for the accomplishment of this piece of
work
I am also very grateful to all my teachers of the National Institute of Food Science
and Technology University of Agriculture Faisalabad for their technical guidance
moral support and prayers to accomplish this study
My sincere gratitude is to all my friends especially Moazzam Rafiq Khan Dr
Muhammad Saeed Dr Shahzad Hussain Dr Umair Arshad and rest of the Ph D club
and juniors especially Muhammad Nadeem who always helped me to complete my
work I feel it incomplete if I do not extend my fervent thanks and heartiest compliments
to my father and mother aunties brothers and sisters bhabis cousins nephews and
nieces for remembering me in their prayers and whose act always enforced me to update
my knowledge
(AHMAD DIN)
CC OO NN TT EE NN TT SS
CHAPTER TITLE PAGE
ABSTRACT
1 INTRODUCTION 1
2 REVIEW OF LITERATURE 6
3 MATERIALS AND METHODS 39
4 RESULTS AND DISCUSSION 56
5 SUMMARY 131
CONCLUSIONS 136
RECOMMENDATIONS 137
LITERATURE CITED 138
APPENDICES 162
List of Tables
Table Title Page
31 Treatment plan 46 32 Different treatments used in the biological study 54 41 Chemical composition of barley flour 57 42 Chemical Analysis of β-glucan 59 43 Mean sum of squares for color values (L a b) of stored β-glucan
beverages 62
44 Effect of treatments and storage intervals on the L-value of stored β-glucan beverages
63
45 Effect of treatments and storage intervals on the a-value of stored β-glucan beverages
66
46 Effect of treatments and storage intervals on the b-value of stored β-glucan beverages
68
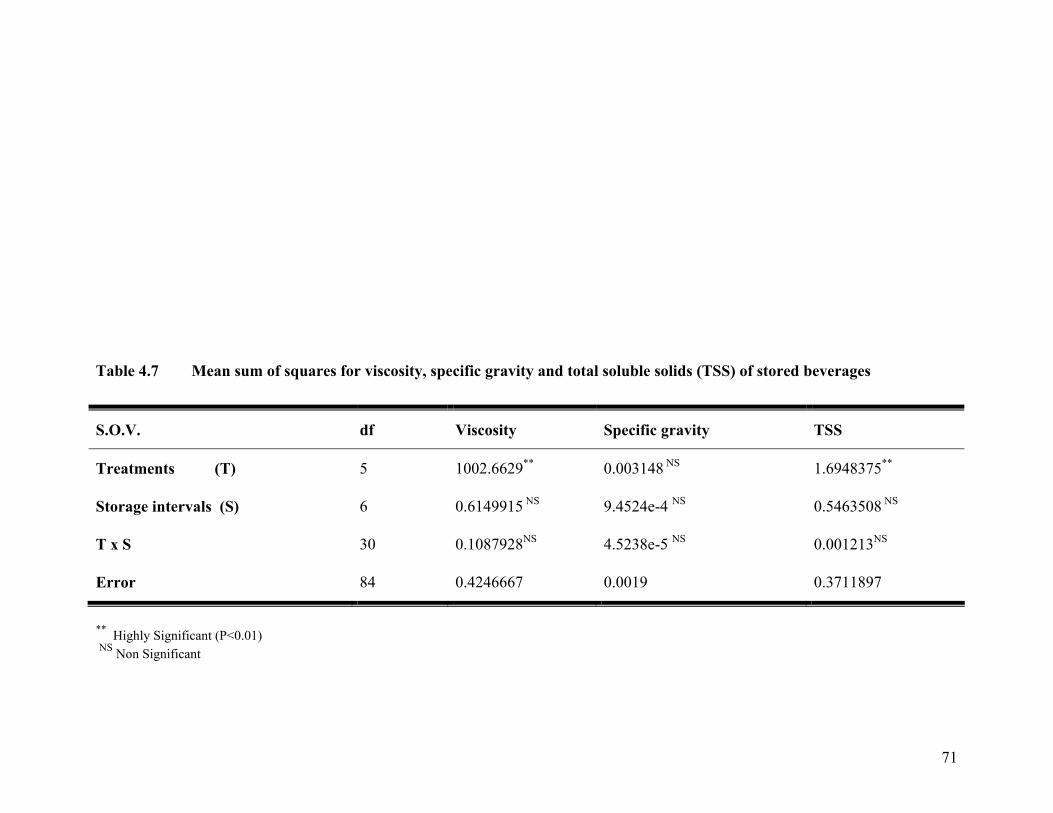
47 Mean sum of squares for viscosity specific gravity and total soluble solids (TSS) of stored beverages
71
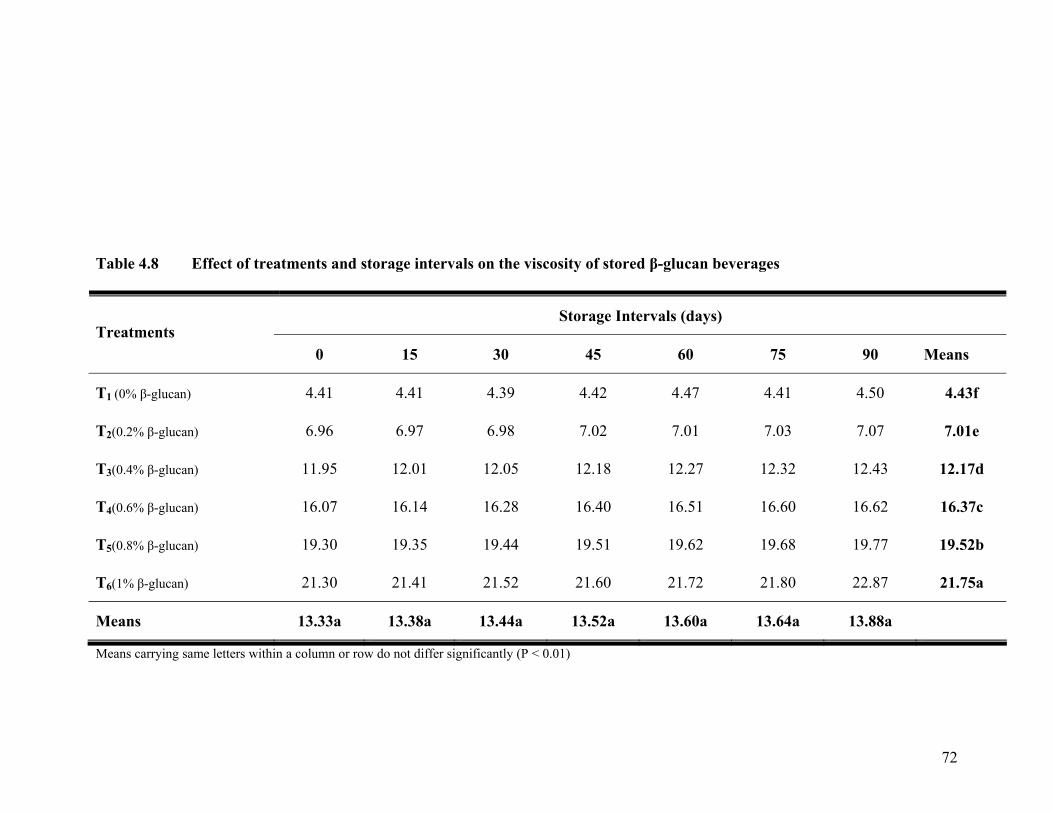
48 Effect of treatments and storage intervals on the viscosity of stored β-glucan beverages
72
49 Effect of treatments and storage intervals on the specific gravity of stored β-glucan beverages
75
410 Effect of treatments and storage intervals on the total soluble solids of stored β-glucan beverages
76
411 Mean sum of squares for pH acidity and ascorbic acid content of stored beverages
78
412 Effect of treatments and storage intervals on the pH of stored β-glucan beverages
79
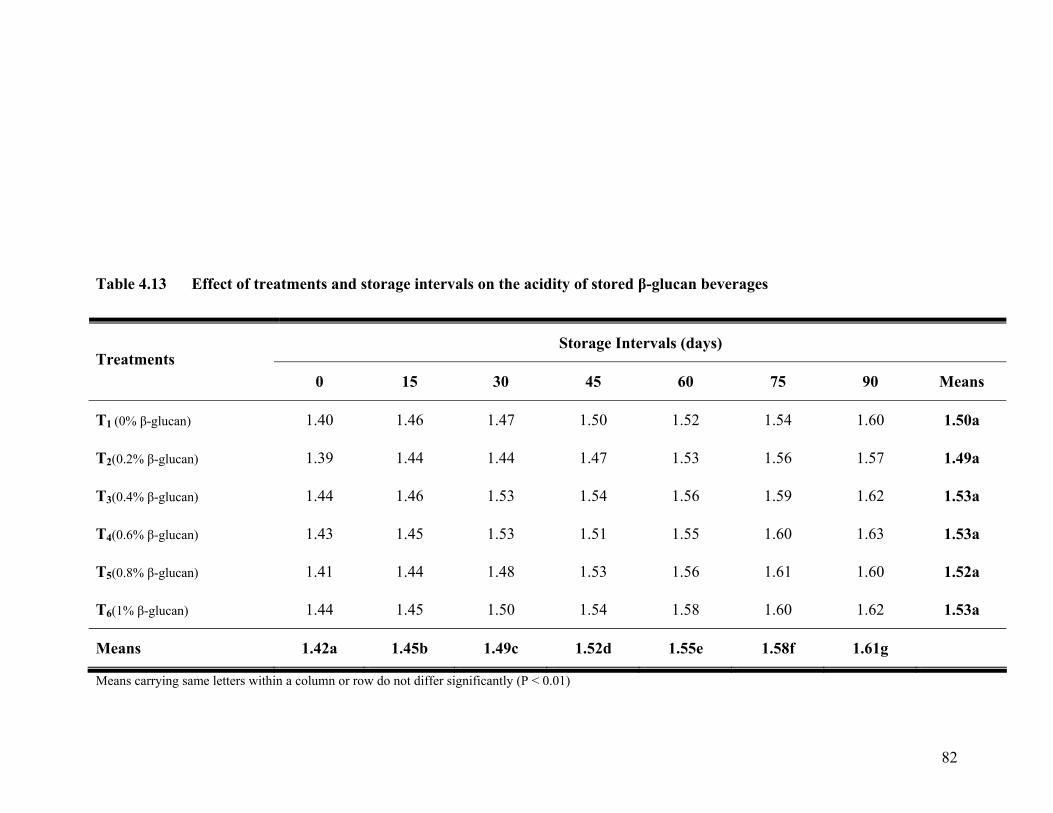
413 Effect of treatments and storage intervals on the acidity of stored β-glucan beverages
82
414 Effect of treatments and storage intervals on the ascorbic acid contents of stored β-glucan beverages
84
415 Mean sum of squares for reducing non reducing and total sugar content of stored beverages
87
416 Effect of treatments and storage intervals on the reducing sugars of stored β-glucan beverages
88
417 Effect of treatments and storage intervals on the non reducing sugars of stored β-glucan beverages
90
418 Effect of treatments and storage intervals on the total sugars of stored β-glucan beverages
92
Table Title Page
419 Effect of treatments and storage intervals on the total plate count
(CFUml) of stored β-glucan beverages 94
420 Mean sum of squares for sensory evaluation of stored beverages 96 421 Effect of treatments and storage intervals on the color score of
stored β-glucan beverages 97
422 Effect of treatments and storage intervals on the flavor score of stored β-glucan beverages
100
423 Effect of treatments and storage intervals on the sweetness score of stored β-glucan beverages
103
424 Effect of treatments and storage intervals and on the sourness score of stored β-glucan beverages
105
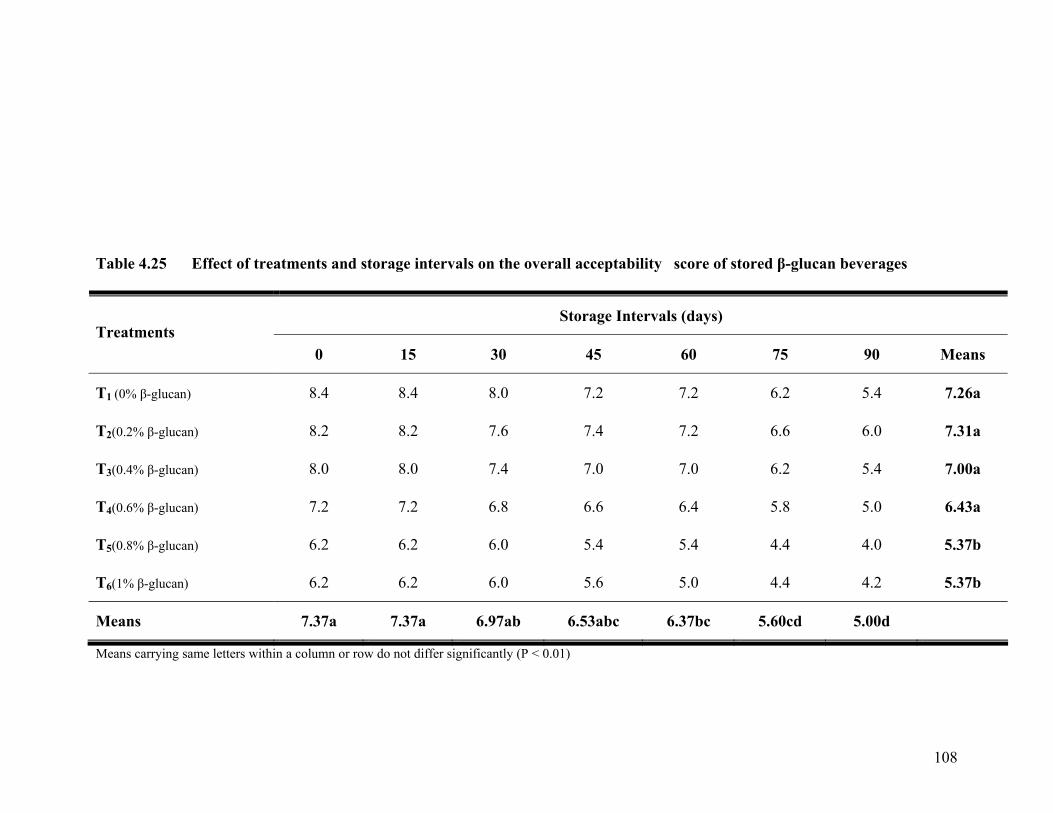
425 Effect of storage intervals and treatments on the overall acceptability score of stored β-glucan beverages
108
426 Mean sum of squares for blood lipid profile of volunteers 110 427 Effect of β-glucan supplemented beverage on serum total
cholesterol content (mgdl) of healthy subjects 111
428 Effect of β-glucan supplemented beverage on serum Triglycerides content (mgdl) of healthy subjects
115
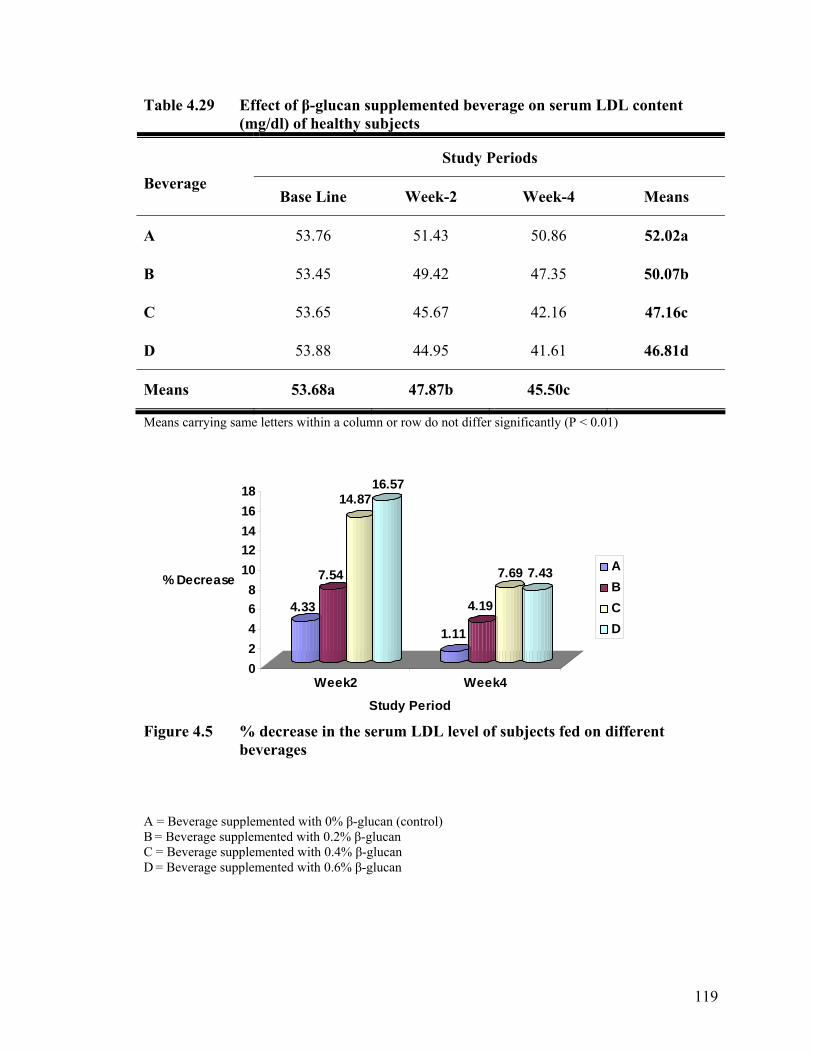
429 Effect of β-glucan supplemented beverage on serum LDL content (mgdl) of healthy subjects
119
430 Effect of β-glucan supplemented beverage on serum HDL content (mgdl) of healthy subjects
123
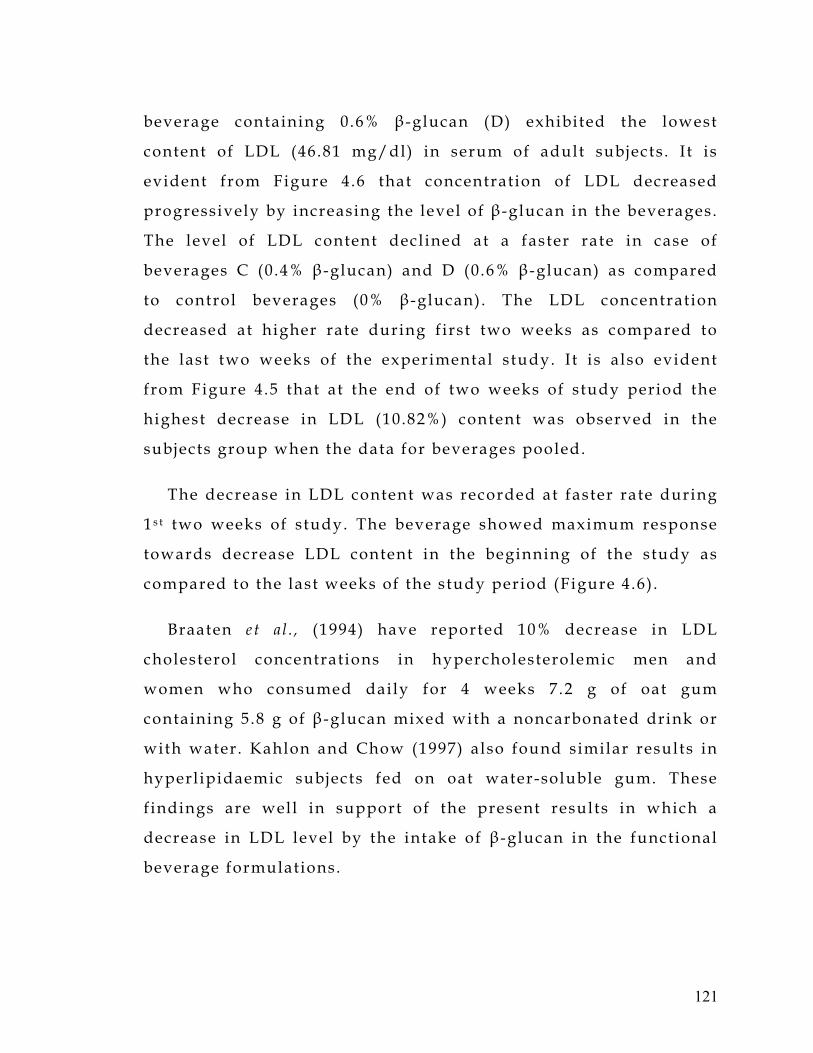
431 Mean sum of squares for blood glucose contents of volunteers 127 432 Effect of β-glucan beverage on blood glucose (mgdl) content of
with different time intervals 127
433 Interactive effect of diets and time scale intervals on the blood glucose contents (mgdl) of volunteers
127
434 Interactive effect of diets and study duration on the blood glucose contents (mgdl) of volunteers
128
List of Figures
Fig Title Page
31 Preparation of β -glucan beverage 47 41 Percent decrease in the serum total cholesterol level of subjects fed
on different beverages 111
42 Effect of β-glucan beverage on Total Cholesterol (mgdl) content of healthy volunteers
112
43 Percent decrease in the serum triglycerides level of subjects fed on different beverages
115
44 Effect of β-glucan beverage on Triglyceride (mgdl) content of healthy volunteers
116
45 Percent decrease in the serum LDL level of subjects fed on different beverages
119
46 Effect of β-glucan beverage on LDL (mgdl) content of healthy volunteers
120
47 Percent increase in the serum HDL level of subjects fed on different beverages
123
48 Effect of β-glucan beverage on HDL (mgdl) content of healthy volunteers
124
49 Effect of β-glucan beverage on blood glucose (mgdl) content of healthy volunteers
128
List of Appendices
Appendix Title Page
I Composit ion of functional beverage 162
II 9 Point Hedonic Scale 163
III Food frequency questionnaire 164
IV Demographic information performa (subjects) 165
ABSTRACT
The research project was carried out to explore the health
benefi ts of barley β -glucan in beverage Beverages were prepared
with different levels of β -glucan and then analyzed for various
quali ty attr ibutes during storage The L a and b value for color of
beverages increased signif icantly by increasing the level of β -glucan
The highest viscosity (2175 mPa-s) and total soluble sol ids
(1042ordmbrix) were found in T6beverage containing 1 β -glucanThe
pH decreased signif icantly in al l beverages throughout the storage
period Total acidity and ascorbic acid varied signif icantly as a
function of storage The reducing sugars increased from 372 to 4 31
from 0 to 90 days of storage respectively The total plate count of
beverages decreased from 129 times 10 4 to 1 17 times 10 4 at the end of the
storage The scores assigned to al l the sensory parameters of
beverages affected signif icantly with the variat ion in the levels of β -
glucan and decreased signif icantly during storage intervals The
treatments T2 T3 and T4 got containing 0 2 0 4 and 06 β -glucan
got highest scores for sensory evaluation Total cholesterol glucose
LDL-C and tr iglyceride contents in serum of adult humans fed on
beverages decreased signif icantly whereas concentrat ion of HDL
improved due to incorporation of β -glucan in beverages The
beverage with 0 6 β -glucan contributed to reduce the serum
glucose of human subjects by 1018 cholesterol by 8 26
tr iglycerides by 1099 and LDL by 1082 The present study
suggests that β -glucan is a funct ional ingredient and can be used to
prevent cardiovascular diseases and also to control diabetes
1
CHAPTER-1
INTRODUCTION
Cereals are considered one of the most important economic
and food commodities in the world The cereals grains are
harvested over 1 bi l l ion tones annually The barley (Hordeum
vulgare L ) accounts for 12 of the worlds total cereal production
and occupies fourth posit ion with respect to grain production
after wheat r ice and corn (Jadhav et a l 1998) The barley grain
was produced 13747 mil l ion metric tones in the world during the
crop year 2006-2007(FAS 2008) The leading barley producing
countries in the world are EU countries (5165 mil l ion tones)
fol lowed by the Russian Federat ion (2501 mil l ion tones) and
Canada (1317 mil l ion tones) (Brennan and Cleary 2005) In
Pakistan production of barley grain was 98000 tones harvested
from an area of 92000 hectares during the crop year 2007-08
(GOP 2007-08) In world approximately 81 of annual barley
production is used for feed 9 for seed 8 for malt and alcohol
production and only 2 is used for human consumption (AERI
1986) Like other countries this crop is also mainly goes for
feeding the animals and its human consumption is very l imited in
Pakistan The variet ies such as Jau-83 Jau-87 Haider-93 and some
promising hulless l ines of barley developed are being cult ivated
commercial ly in Pakistan
Barley is gett ing renewed interest as an ingredient in the
production of functional foods due to i ts higher content of
bioactive compounds Barley possesses high amount of dietary
2
f iber (DF) with high proportion of soluble viscous components
offering more suitabil i ty among cereal grains in the human diet
(Bjorck et a l 1990) The barley in the world is used mainly as an
animals feed in the form of barley meal and as grain for malting
and brewing for manufacturing of beer and whisky The research
has been focussed mainly on assessing the role of endospermic
components in relation to malting potential of barley grain
(Molina-Cano et a l 2002) However the barley grain has been
relatively under-uti l ized with respect to i ts potential use as a
human food The potential use of β -glucan extracted from barley
and other cereal grains as a functional ingredient in different
foods has received more attention in the recent years (Malkki
2004) There are some new waxy hulless barley variet ies l ike
Prowashonupana have also been developed which possess unique
macronutrient composit ion with higher content of f iber and
protein and lower amount of starch as compared to other common
cereal grains The barley can potential ly be used to develop and
formulate products with improved health benefits and a variety of
health c laims This particular barley grains can be used to
enhance the f lavor texture appearance and nutrit ional
composit ion for a variety of food product applications including
hot cereals cookies crackers breads tort i l las granola bars fruit-
f i l led cereal bars extruded snacks and pastas The functional
f lexibil i ty of barley al lows it to be used in foods that span across
meal occasions including muffins and ready-to eat cereals for
breakfast soup vegetarian patt ies and pizza crackers and
extruded chips for snacks and cookies and toppings for dessert
and development of different beverages ( Arndt 2006)
3
The barley contains substantial ly higher amounts of
functional ingredient i e β -glucan but oat and some fungi and
moulds also possess good amount of β -glucans The use of β -
glucan extracted from barley as a human food due to i ts posit ive
role in human health has received a growing attention The cel l
wall of barley and oat contains β -glucan a non starch
polysaccharide composed of β - (1-4)- l inked glucose units
separated every two to three units by a single β - (1-3)ndashl inked
glucose and referred to as a mixed l inkage β -glucan (Carpita
1996)
In human diet the health promoting properties of β-glucan
have been demonstrated High-serum cholesterol one of the
important r isk factor for coronary heart disease (Anderson 1986)
is reduced by the intake of β -glucan which wil l ult imately the
risk of cardiovascular diseases The soluble dietary f iber
component may assist in regulation of blood glucose and lowering
of serum cholesterol (Anderson 1980) The β -glucan a soluble
f iber extracted from oat or consumed as oat porridge reduced
postprandial blood glucose (Wood et at 1990) β -glucan delays
glucose absorption which regulates the level of blood glucose
(Wood et a l 1994) The viscous nature of β -glucan physically
slows glucose absorption in the gut This property of β -glucan
may be useful in the formulation of food products targeting
management of diabetes
In recent years human health has received an unprecedented
important status The interests in nutrit ion f i tness and beauty
have main concerns over diet and human health in todayrsquos l iving
style The foods which should provide additional physiological
4
benefits such as preventing or delaying onset of chronic diseases
besides meeting basic nutrit ional requirements are known as
functional foods (Nicoli et a l 1999) Functional foods including
functional beverages are important for their role in health
promotion and disease prevention The functional foods are not
intended only to satisfy hunger but also provid necessary
nutrients to human for prevention of nutrit ion-related diseases
(Menrad et a l 2000) The growing interest in new functional
foods with special characterist ics and health benefits has led to
the development of new functional beverages The global market
of functional food has been estimated to be at least 33 bi l l ion US$
(Hil l iam 2000)
The functional beverages can play an important role in
health promotion and disease prevention They provide means to
reduce the increasing burden on the health care system by a
continuous preventive mechanism (Shahidi 2004) The functional
beverages not only provide taste and refreshment satisfaction but
can also provide necessary nutrients to prevent nutrit ion-related
diseases (Menrad et a l 2000) Beverages are considered to be an
excellent medium for the supplementation of nutraceutical
components for enrichment (Kuhn 1998) such as soluble f iber or
herbal extract (Swientek 1998)
The functional beverage may enrich the diet and improve
health of human because of i t ease of consumption along with a
usual meal Barley β -glucan assume to be well suited for such an
functional application being capable of imparting a smooth
mouth feel to beverage products and providing an excellent
source of soluble dietary f iber A barley β -glucan gum with
5
similar functional properties could potential ly serve as an
alternative to tradit ional beverage thickeners such as alginates
pectin xanthan and carboxymethylcel lulose (Giese 1992)
Barley tea is a common drink in Japan especial ly during the
summer This non-caffeinated non-tannin drink is valued for i ts
high percentage of β - glucan (polysaccharides) and the presence
of antioxidant compounds (Etoh et a l 2004 Tsunagi et a l 2003)
The use of β -glucan due to i ts good viscosity forming properties
offer potential alternatives as thickening agents in different food
applications e g ice creams sauces and salad dressings (Wood
1986) The uti l ization of barley β -glucan as an ingredient in the
production of a functional beverage has not been fully exploited
so far
The nutrit ional and functional benefits of β -glucan including
thickening stabil izing emulsif ication and gelation revealed that
β -glucan from barley can be used for the preparation of functional
beverage Therefore this study was planned to extract the β -
glucan from Pakistani barley variety (Haider-93) and its
uti l ization for the development of functional beverage Therefore
the mandate of the present study was as under
bull To develop a suitable formulation and processing procedure for a functional beverage with incorporation of barley β- glucan
bull To evaluate quality parameters and acceptabil i ty of functional beverage
bull To examine the shelf stabil i ty of β -glucan beverage using instrumental techniques
bull To evaluate the effect of β -glucan beverage on the glucose level and l ipid profi le of human volunteers
6
CHAPTER-2
REVIEW
OF
LITERATURE
Cereal β -glucan is a soluble dietary f iber and offers
potential for food products The beverages are one of the best
media for incorporation of β -glucan The characterist ic properties
desired in the beverage such as color f lavor and mouth feel make
the barley β -glucan an ideal grain over other cereals such as
sorghum and wheat (Bamforth and Barclay 1993) I t also exhibits
some health benef its such as lowering of blood glucose level and
prevention of cardiovascular diseases By manipulating the β -
glucan and protein contents of barley numerous types of malt
(beer) and other beverages are l ikely to satisfy various human
tastes (Munk 1981)
The l i terature pertaining to different aspects of the present
study is reviewed under fol lowing headings
2 1 Barley History composit ion and types
22 Role of dietary f iber
23 β -glucan Sources and occurrence
2 4 β -glucan extraction
7
25 Health benefits of β -glucan
26 Functional properties of β -glucan
27 Uti l ization of β -glucan in food products
28 Physico-chemical characterist ics of beverages
21 Barley History composition and types
The cereals are defined as edible seeds of the grass family
Gramineae (Bender and Bender 1999) The cereals are cult ivated
for their nutrit ious edible seeds often referred as grains and
used as staple food for the human consumption and l ivestock feed
since the early civi l ization (BNF 1994) Cereal grains contribute
signif icant amounts of energy protein and micronutrients to the
human diet and contain a large number of biologically active
substances including antioxidants dietary f iber phytoestrogens
and l ignans (Hil l and Path 1998)
Barley (Hordeum vulgare L ) competes with wheat regarding
the most ancient cereal crop I t referred as the original ancient
cereal grains consumed around the world throughout the history
Barley has been recorded as being cult ivated along the Nile River
thousands of years ago dating back to Egyptian t imes (Wendorf et
a l 1979) Barley is an old crop and its cult ivation mentioned in
the Bible Due to i ts cold drought alkali and salt tolerance i t is
grown at 70degN lati tude in Norway as well as in regions close to
the equator at high alt i tudes (Poehlman 1985) With respect to
world cereal grain production barley ranks fourth fol lowed by
wheat r ice and corn (Nilan and Ullrich 1993) Barley is a major
crop for malt ing brewing and for food production industries in
8
the developed countries and it is uti l ize as fodder crop in the less
developed and developing countries (Kent and Evers 1994)
Barley is a typical cereal grain composed primarily of starch
protein f iber l ipids and minerals The typical composit ion of
barley is outl ined in Table 21 (MacGregor and Fincher 1993)
Barley is a source of protein typically contains 10-12 in the
whole grain containing more of the essential amino acids
particularly lysine which is the f irst l imiting amino acid in the
wheat (Chung and Pomeranz 1985) Barley proteins can be
grouped as storage and non-storage proteins Storage proteins
include the prolamins (hordeins) and globulins as defined by
Osborne protein classif ication (Shewry 1993) Being high
molecular weight water soluble polymers they have unique
properties with both nutri t ional and technological s ignif icance
They are not digested by mono gastric animal which is one reason
for the low use of barley as poultry feed (Wood 1984) I t has
recently been rediscovered as a nutrit ious food grain for the
human diet and is expected to see some increase in food
applications in the near future The starch portion of the grain is a
good source of digestible carbohydrate necessary for energy
(MacGregor and Fincher 1993)
There are generally two types of barley hulled and hull- less
barley Hull- less barley contains more protein starch and β -
glucan than hulled barley I t is a good source of f iber in general
and of soluble f iber such as β -glucan in particular (Bhatty 1999)
Most of the barley used in the world today is covered (Hulled) as
covered barley is preferred in brewing industry Naked barley is
therefore advantageous to use in food production since no hull
9
needs to be removed and thus al l nutrients are retained In
addition using naked barley for malting has previously been
shown to produce malt with a composit ion and enzyme activit ies
comparable to that of normal malts (Bhatty 1996)
Table 21 Typical chemical composition of barley grain
Component Percent Component Percent
Starch 63-65 Lipids 2-3
Sucrose 1-2 Albumins and globulins 35
Other sugars 1 Hordeins 3-4
Water soluble polysaccharides 1-15 Glutel ins 3-4
Alkali soluble polysaccharides 8-10 Nucleic acids 02-03
Cellulose 4-5 Minerals 2
Adapted from MacGregor and Fincher (1993)
In a study two cult ivars of hull- less barley Scout ( two-
rowed) and Tupper (six-rowed) were uti l ized to prepare f lour and
similarly ground fine-pearled and the pearled grain These three
fractions were used to evaluate physiochemical and functional
(bread making) properties The fractions contained 133-189
10
protein 1 1-21 ash and 08-16 fiber palmitic (160) oleic
(181) and l inoleic (182) were the major fatty acids (Bhatty 1986)
Kiryluk et a l (2000) mil led barley to produce the end-
products f ine and coarse-grained f lours middlings and f ine grits
These products differed in their average contents of β -glucan
total dietary f iber ash and protein This product with a weight
yield of 186 contained 672 β -glucan 2512 total dietary
f iber 2 19 ash and 1583 protein All these values were at
about 50 72 55 and 24 respectively higher than in
dehulled barley
Holtekjolen et a l (2006) observed a strong posit ive
correlation between the β -glucan and the amount of soluble non-
starch polysaccharides (NSP) as well as β -glucan and protein
contents The analyzed hull- less and a typical amylose variety
seem suitable for human consumption where high soluble f iber
and nutrit ive contents are desirable These variet ies contained
high contents of β -glucan soluble NSP protein and lower starch
content and could therefore also be suitable for functional food
products aimed at health benefits and cancer prevention
22 Role of dietary fiber
Different countries and research groups have adopted
different definit ions for dietary f iber which has led to
inconsistent results Therefore a committee was formulated by the
American Association of Cereal Chemists (AACC) to evaluate the
definit ions and methodologies used An updated definit ion was
prepared by this committee in 2001 which concluded that ldquoDietary
f iber is the edible parts of plants or analogous carbohydrates that
11
are resistant to digestion and absorption in the human small
intestine with complete or partial fermentation in the large
intestinerdquo (DeVries 2001)
Dietary f iber includes polysaccharides ol igosaccharides
l ignin and associated plant substances and the data regarding the
beneficial effects of dietary f iber more than two decades have
been recorded According to Schneeman (2001) dietary f iber
regulates the rate of nutrient digestion and absorption serves as a
substrate for the microflora of the gut and promotes laxation The
dietary f iber to foods is usually added for improving their
nutrit ional characterist ics (Brennan and Cleary 2005) However
dietary f iber have both physiological and technological
properties and its addition wil l also alter processing and
handling of foods as well as their texture color f lavor and taste
Many reports demonstrating the role and physiological
functioning of dietary f iber in human health and are involved in
reduction in cardiovascular diseases colorectal cancer and blood
cholesterol and glucose level
Intake of total dietary f iber especial ly from cereal and grain
products (Bingham e t a l 2003 Jansen et a l 1999) can act as a
shield against diabetes (Maier et a l 2000 Schulze et a l 2004) I t
also helps in smooth bowl movement (Sanjoaquin et a l 2004) and
it is effective against constipation (Dohnalek et a l 2004) The
foods r ich in dietary f ibre provide low energy to the body and
interfere with absorption of harmful compounds There dietary
f iber also showed to decrease the serum cholesterol levels (Brown
et a l 1999)
12
Water-retention capacity is another important function of
dietary f iber According to their water solubil i ty dietary f iber can
be classif ied in to two grouprsquos i e soluble and insoluble f ibers
Soluble f ibers include mainly gums pectin and mucilage while the
insoluble f ibers include cel lulose hemicelluloses and l ignin
(Izydorczyk et a l 2002) Barley β -glucan which is soluble dietary
f iber can successfully be used in food system
23 β -glucan Sources and occurrence
The term β - (1rarr3)-D-glucan includes a very large number of
polysaccharides from bacterial fungal and vegetable sources
Their structures have a common backbone of β - (1rarr3) l inked
glucopyranosyl units but the polysaccharidic chain can be β-(1rarr6)
branched with glucose or integrate some β -(1rarr4) l inked
glucopyranosyl units in the main chain (Brennan and Cleary
2005)
The barley crop is used for human consumption due to the
presence of i ts functional ingredients Among al l the cereals
barley and oat are famous for β-glucan Mixed-l inkage (1rarr3)-
(1rarr4)-β-D-glucan or β -glucan is the most abundant component
of the soluble dietary f iber in both oats and barley I t is a l inear
and partial ly water soluble polysaccharide that consists only of
glucose I t is a soluble f iber component found predominantly in
other cereal crops The (1rarr3)-(1rarr4)-β -D-glucan is cel l wall
polysaccharide of cereal endosperm and aleuronic cel ls
Environmental conditions seem to exert a signif icant effect on the
β -glucan content of the cereal grain (Aastrup 1979)
13
β -glucan is one of the minor constituents in barley grains I t is
primarily associated with genotype and is s ignif icantly affected
by the environmental conditions There is a variation in barley β -
glucan content between different locations as documented by
Aman et a l (1989) Zhang et a l (2002) determined and extracted
β -glucan content of barley cult ivars collected from various areas
of China as well as from Canada and Australia by an enzymatic
method For 164 cult ivars originating from China β -glucan
content ranged from 298 (Sumei 21) to 862 (QB25) with a
mean of 4 58 Ragaee et a l (2001) also demonstrated that the
primary sources of β -glucan in the human diet are oats barley
rye and wheat The levels of β -glucan in dehulled or naked oats
and most dehulled or naked barleys range mostly from about 3
to 7 (Lee et a l 1997) in rye about 2 and in wheat less than
05 (Beresford and Stone 1983)
The structures of β -glucan in barley and oat are different
(Wood 1994) Barley β -glucan was found to contain one quarter β -
(1rarr3) l inked units whereas oat β -glucan contained
approximately one third The oat β -glucan structure therefore
contains more β -(1rarr3) l inkages than barley β -glucan (MacGregor
and Fincher 1993) The oligosaccharide with DP3 i e 3-O-β -
cel lobiosyl-D-glucose is the main product and DP4 i e 3-O-β -
cel lotriosyl-D-glucose comes second These two constitute over
90 of the total β -glucan content (Wood et a l 1994) For
structural differences of β-glucan often DP3DP4 ratio is used as
indicator (Izydorczyk et a l 1998a) According to many authors
this ratio is lower for oat than for barley β -glucan Structural
differences have also been reported to exist between soluble and
14
insoluble β -glucans with the ratio DP3DP4 being higher for
insoluble than for soluble β-glucans (Izydorczyk et a l 1998b)
24 Extraction of β -glucan
Various techniques for the isolation of βndashglucan have been
developed β -glucan from barley and oat could be isolated by dry
mill ing and solvent extraction (Wu et al 1994 Dawkins and
Nnanna 1993 Saulnier et al 1994) Among both isolation
methods about 89 βndashglucan could be recovered by solvent
extraction and only 31 by dry mill ing and air classif ication (Wu
et al 1994) from barley and oat However 41-81 βndashglucan on
dry matter basis could be extracted by using neutral or an alkaline
medium (Burkus and Temell i 1998) Furthermore more than 90
extraction could be achieved by hot water extraction (Morgan et
al 1998)
Bhatty (1995) compared different solvents for the extraction
of β -glucan from one sample of hull- less barley bran and revealed
that sodium hydroxide was the most eff icient solvent for
extraction The extraction with sodium hydroxide removed 84 of
the β -glucan compared to 72 by sodium carbonate solution and
only 61 by sequential extraction with water at 40 65 and 95degC
The amount of β -glucan is an important factor in considering
health ef fects In the isolation processes some β -glucan may be
lost Thus the total β -glucan content can not be determined from
the isolated β -glucan (Rimsten et a l 2003) The most frequently
used method for β -glucan determination is i l lustrated by
Association of Official Analytical Chemists (AOAC 1995) This
method involves the dissolution of β -glucan in a buffer
15
hydrolysis with the l ichenase enzyme to ol igosaccharides and
with β -glucanase to glucose Glucose is then analysed
spectrophotometrical ly as a colored substance obtained with an
oxidaseperoxidase reagent (Lambo et a l 2005)
Burkus and Temeil i (1998) have reported that extraction
conditions such as pH and temperature profoundly affect the
viscosity of solutions prepared with β -glucan concentrates I f a
higher concentrat ion of β -glucan is desired in a product low
viscosity extracts may be uti l ized (Burkus 1996)
Carr (1990) explored an improved method for the
determination of (1rarr3)-(1rarr4)-β -D-glucan in cereals and their
products The method includes refluxing of 80 (vv) ethanol to
remove sugars and inactivate of enzymes prior to extraction with
water at 100ordmC for soluble β -glucan determination For several
different food products soluble β -glucan content ranged from
049 to 390 whereas total β -glucan content ranged from 058 to
886 (dry weight basis) The dietary f iber ranged from 48 to
220 for the products
Extraction conditions also determine the properties of
extracted β -glucan Wood et al (1977) extracted the β -glucan gum
pellets through alkali extraction method from oats (Avena sat iva
L) The researchers found that various condit ions such as
temperature pH and ionic strength of the extraction media
affected the β -glucan yields βndashglucan could also be extracted by
using dist i l led water and 4 sodium hydroxide All treatments
differ in their yield and physiochemical properties Extracted
conditions have a great bearing on viscosity properties of β -
16
glucan excessive boil ing during extraction resulted in low
viscosity β -glucan Stable barley β -glucan gum with high viscosity
can be obtained using suitable combination with high pH
(Johansson et al 2000) Recently another method was developed
by Izydorczyk et al (1998) for the extraction of β -glucan through
sequential extraction with water Ba(OH)2 Ba(OH)2H2O and
NaOH In this method each barley sample was extracted 2ndash3 t imes
and the isolated material was combined
The βndashglucan extraction methods for pilot plant levels have
been developed that includes refluxing with 75 ethanol for four
hours prior to extraction-deactivated glucan The pilot plant
extracted gum has less viscosity than bench gum this is due to
high shear rates enzyme activity of fungi and bacteria in pilot
plant conditions (Wood et al 1989) The foods containing βndash
glucan needs viscosity stabil i ty for increased shelf l i fe In another
study i t is found that i f 1N sodium hydroxide is used for βndash
glucan extraction from barley and oat i t affect βndashglucan activity
(Bhatty 1995) The enzymes (glucanase) present naturally or
produce from microorganisms and it is investigated that
enzymatic hydrolysis create problem during production and food
application Scientists noticed higher activity of endo (1rarr3) β -D-
glucanase than endo (1rarr3) (1rarr4) β-D-glucanase (Brunswick et al
1987) Similarly steaming and kilning inactivate l ipases of barley
microbial enzyme are more heat stable than the endogenous
glucanases (Balance and Meredith 1976 Wood et al 1989)
Similarly a method of pure β -glucan extraction has been
provided by Westerlund et a l (1993) and this method involves
defatt ing with propan-2-ol ( isopropanol IPA) and petroleum
17
ether dissolution in water at 96 degC and hydrolysis of starch with
heat-resistant α -amylase The polysaccharides are precipitated
with 60 ethanol at 4 degC and the precipitate is dissolved in water
The solution is treated with 30 (NH4)2SO4 which specif ical ly
precipitates β -glucan but leaves arabinoxylans in solution The
precipitate is dissolved in water and dialyzed against water at
room temperature
25 Health benefits of β -glucan
Barley grain bas been shown to be an excellent source of
both soluble and insoluble f iber and according to dieti t ians and
health professionals i t should be extensively used in diets to
improve health (Oscarsson et a l 1996) During the last 10 years
studies have identif ied a low glycemic-index (GI) diet as
beneficial in relation to the insulin-resistance syndrome Several
semi-long-term dietary interventions are available for healthy
subjects and for subjects with metabolic diseases With a few
exceptions these studies have shown that a low-GI diet not only
improves certain metabolic consequences of insulin resistance but
also reduces insulin resistance per se (Del Prato et a l 1994) In
addition to improvements in glucose and l ipid metabolism
(Jenkins et a l 1987 Brand et a l 1991 Jarvi et a l 1999) there are
indications of improvements in the f ibrinolytic activity (Jaumlrvi et
a l 1999) suggesting a beneficial role in diabetes and
cardiovascular disease I t has been est imated that a 3 85 unit
reduction in GI can be perceived per gram of β -glucan f iber in a
50 g carbohydrate portion of food The viscosity of the f iber
relates posit ively to the degree of f lattening of postprandial
glycemia (Wood et a l 1994 Jenkins et a l 1978)
18
The potential physiological mechanisms behind the eff icacy
of β -glucan are suggested to be i ts abil i ty to retard the absorption
rate of food in the intestine due to increased viscosity in this way
balancing the post-prandial glucose and insulin response (Wursch
and Pi-Sunyer 1997 Wood et a l 2000) In addition some
investigators (Gallaher and Hassel 1995 Jal i l i et a l 2000) has
reported an increased viscosity in the small intestine which may
interferes with cholesterol absorption or re-absorption in this
way affecting the cholesterol balance and synthesis in the body
Therefore i t would be interesting to investigate what kind of
effect could be achieved with general information about the
dietary f iber content (Stone and Clark 1992)
Another physiological aspect with reference to β -glucan was
experienced in intestinal tract that i t s low down glucose
absorption and therefore regulate blood glucose (Wood et a l
1990 Wood et a l 1994) The viscous nature of β -glucan physically
slows glucose absorption in the gut This property may be useful
in the formulation of products targeting management of diabetes
The mechanism by which β -glucan lowers blood glucose and
cholesterol levels may be related to i ts viscosity bi le salt binding
capacity or ferment abil i ty (Davidson and McDonald 1998
Marlett et a l 1994) The enrichment technique and water
extractionfreeze drying technique could enable the use of barley
as a source of a high-value f iber for reducing the glycemic index
of tradit ional wheat-based foods such as bread without affecting
their sensory characterist ics (Cavallero 2002)
β -glucan incorporated functional food tends to reduce
glycemic indices while maintaining palatabil i ty (Jenkins et a l
19
2002) β -glucan containing food bars have an intermediate
glycemic index of 78 (Foster-Powell and Miller 1994) Enrichment
with additional β -glucan is required in order to produce a low
glycemic index barley product (Tappy et a l 1996) which could
also have an increased hypocholesterolemic effect (McIntosh et a l
1991)
Dongowski et a l (2002) reported that diets containing more
soluble macromolecular dietary f ibers such as β -glucan affected
the excretion of bi le acids and neutral sterols the most whereas
the fermentation of dietary f iber including resistant starch
influenced the steroids in feces I t has been hypothesized that
upon ingestion β -glucan increases small intest inal viscosity due
to i ts lower molecular weight and its tendency to form viscous
gummy solutions result ing in reduced bile acid and cholesterol or
tr iglyceride absorption thus lowering plasma cholesterol as well
as altering digestive enzyme activity
More research is in progress to determine the effect of β -
glucan and phytosterols into low-fat spreads and non-fat
phytosterol formulations (Moreau et a l 2002) The cholesterol-
lowering potential of β -glucan and phytosterols may thus depend
upon previous dispersion into a fat matrix and on the physical
nature of the food I t is reported that these compounds have a
capacity to reduce plasma cholesterol concentrations when
consumed in different food matrices but their effect iveness in
non-fat or low-fat beverages has not been established (Jones et
a l 2003) Two mechanisms for serum cholesterol level have been
elucidated in the scientif ic l i terature one deals with the viscous
nature of β -glucan provides a physical barrier that slows down or
20
inhibits the absorption of cholesterol and other l ipid constituents
and second mechanism is about binding of the bi le acids in the
gut The unabsorbed and bound components then proceed to the
large intestine and are excreted from the body Some of the β -
glucan that reaches the colon wil l also undergo fermentation by
colonic microorganisms (Wood and Beer 1998 Casterl ine et a l
1997 Bell et a l 1999) Short chain fatty acids are produced as a
result of fermentation of β -glucan in large intestine
β -glucan have cholesterol lowering action in human body
The cholesterol lowering mechanism involved the suppression of
intestinal cholesterol absorption while partial ly suppressing
cholesterol biosynthesis ( Jones et a l 2000 Plat and Mensick 2001)
only a small part of these are absorbed through intestinal micelle
into blood circulation phytosterol solubil i ty and incorporation
into intestinal micelles is found an important aspect of
phytosterol cholesterol lowering eff icacy Most recent studies
conducted to examine the l ipid-lowering potential of β -glucan
incorporated them into a fat matrix margarine butter or
dressing Results from these tr ials have shown that β -glucan
consumption decreases total cholesterol and LDL- cholesterol
concentrations by 34 to 116 for total cholesterol and 54 to
155 for LDL cholesterol ( Jones et al 2000 Hall ikainen et al
2000 Mussner et al 2002) Oat bran is r ich in β -glucan f iber and
has been shown to lower cholesterol (Anderson et al 1990) This
is bel ieved and found that barley and oat lowers the blood
cholesterol and attenuates postprandial glucose response due to
soluble dietary f iber cal led (1rarr3) (1rarr4)-β -D-glucan also referred
to as β -glucan (Ripsin et a l 1992 Tappy et a l 1996 Drzikova
21
2005) Oat bran reduced total serum cholesterol in
hypercholesterolemic subjects by as much as 23 with no change
in high density l ipoprotein (HDL) cholesterol Since oat bran was
enriched in β -glucan (Wood 1986 Wood et a l 1989) the authors
reported an inverse correlation between serum cholesterol levels
and β -glucan intake Barley and oats are a r ich source of the
soluble f ibre β -glucan which has been shown to signif icantly
lower LDL-cholesterol ( Joseph et a l 2007)
Oat bran providing 73 g β -glucan in a breakfast cereal or 6 2
g in a bar gave signif icantly lower postprandial glucose responses
in NIDDM subjects than an oat bran breakfast cereal providing 37
g and it was calculated that the glycemic index was lowered 4
units for every gram of β -glucan (Jenkins et a l 2002)
In a study different breads were made one from hull- less
barley f lour and the other from two (1rarr3 1rarr4)-β -glucan enriched
fractions The remaining two from a sieved fraction (SF) and a
water-extracted fraction (WF) were produced and evaluated for
sensory evaluation For eff icacy study eight adultsrsquo subjects were
fed test meals of each of the four breads containing the same
amount (50 g) of available carbohydrate and glycemic indices
calculated from finger-prick capil lary blood samples A l inear
decrease in glycemic index was found for increasing (1rarr3) (1rarr4)-
β -glucan content This research confirms the effectiveness of
viscous (1rarr3) (1rarr4)-β -glucan in reducing postprandial blood
glucose levels even in foods with a high glycemic index
(Cavallero et a l 2002)
22
The abil i ty to detect a signif icant effect on glycemic
response related to the dose of β -glucan In a study of the effect of
an oat bran highly enriched in β -glucan (15 dwb) incorporated
into an extruded breakfast cereal subjects with non-insulin-
dependent diabetes mell i tus consumed meals with 4 6 and 86 g
of β -glucan All 3 breakfasts signif icantly decreased the peak and
the average increases in glucose and insulin compared to a
control There was a signif icant relationship between plasma
glucose peak and area under the glucose curve and the amount of
β -glucan in the cereals (Tappy et a l 1996) Wood et a l (1990)
showed that both oat gum and guar gum signif icantly decreased
the postprandial glucose rise Scientists conducted a study and
showed that whole meal bran and f lour from three barley
genotypes which contained graded levels of soluble f iber were
compared with similar commercial fractions of oats for their effect
on cholesterol tr iglycerides high-density l ipoprotein (HDL)
cholesterol and l iver cholesterol ( test model using
hypercholesterolemic rats) Whole meals of the three barley
genotypes contained 30 5 2 or 6 8 soluble f iber oatmeal
contained 30 In meal-fed rats barley genotypes did not show a
favorable blood or l iver l ipid response compared with oats
However in bran- and f lour-fed rats the data showed that
barley exerted a profound blood and l iver cholesterol- lowering
effect compared with oat bran or f lour (blood triglyceride levels
were minimally affected) Blood HDL-cholesterol levels were
appreciably elevated in rats fed barley bran or f lour compared
with oat bran or f lour These results suggested that barley and its
major fractions (bran and f lour) may evoke different l ipidemic
23
responses and that barley bran and f lour have a more favorable
effect on blood l ipids than do oat bran and f lour (Ranhotra et a l
1991)
Wallace et a l (1997) developed product containing high-
fiber high-carbohydrate diets including foods with low glycemic
index have been associated with prevention and treatment of
diseases such as coronary heart disease and diabetes β -glucan a
soluble viscous polymer found in oat and barley endosperm cell
wall was incorporated into pasta test meals Five fasted adult
subjects were fed test meals of barley and durum wheat blend
pasta containing 100 g of available carbohydrate 30 g of total
dietary f iber (TDF) and 12 g of β -glucan or al l durum wheat pasta
containing the same amount of available carbohydrate 5 g of TDF
and negligible β -glucan The β -glucan and durum wheat pasta
resulted in a lower glycemic response as measured by average
total area and maximum increment of the blood glucose curves
Lower insulin response to the β -glucan and durum wheat pasta
was also indicated by lower average area and increment
characterist ics of the insulin curves Barley β -glucan may be an
economical and palatable ingredient for processed food products
formulated to modify glycemic and insulin response
Lia et a l (1995) studied the effect of β -glucan on the
excretion of bi le acids using breads baked with oat bran oat bran
with β -glucanase barley or wheat in the diet of i leostomy
subjects They showed that the excretion of bi le acids was 53
higher with the oat bran bread than with the bread containing oat
bran and β -glucanase and also signif icantly higher than with
barley and wheat bread The excretion of cholesterol was higher
24
for barley bread than for wheat or oat bran-β -glucanase bread In
one of the few studies that have reported MW values a drink
containing 5 g β -glucan of MW 70000 extracted from oat bran
signif icantly lowered postprandial glucose and insulin levels
relative to a r ice drink control whereas a similar drink containing
barley β-glucan of MW 40000 was without signif icant effect
(Biorklund et a l 2005)
A study was further conducted to est imate the glucose
insulin and glucagon responses after consumption of high-soluble
β -glucan compounds from oats and barley The study includes 11
men and 11 women non diabetics between 35-57 years old
subjects Different tests (blood and urine) performed to analyze
the glucose responses The prel iminary results showed the
signif icant decrease in oats barley and both extracts than glucose
solution High-soluble barley f iber is more effective than standard
oats Oat and barley carbohydrate-based fat substitutes can
provide a useful addition to control plasma glucose responses
(Hallfr isch et a l 2003)
Investigations are further continued to f ind the cholesterol-
lowering activit ies of oats and barley In this study the anti
atherogenic properties of β -glucan concentrates from oats and
barley were evaluated in Syrian golden F1B hamsters by
consuming a semi purif ied hypercholesterolemic diet (HCD)
containing cholesterol (0 15 g100 g) hydrogenated coconut oi l
(20 g100 g) and cel lulose (15 g100 g) The experimental diet HCD
formulated with different levels of β -glucan (2 4 or 8 g100 g)
from oat and barley instead of cel lulose In agreement with
previously proposed mechanisms total fecal neutral sterol
25
concentrations were signif icantly increased in hamsters
consuming 8 g100 g barley or oat β -glucan Aortic cholesterol
ester concentrations were signif icantly reduced in hamsters fed 8
g100 g β -glucan from barley or oats From this observational
study found that the cholesterol- lowering potency of β -glucan is
approximately identical whether i ts origin was oats or barley
(Delaney et a l 2003)
26 Functional properties of β-glucan
Other than nutri t ional benefits obtained from β ndashglucan i t
also have valuable functional properties such as thickening
stabil izing emulsif ication and gelation which make β -glucan
suitable for incorporation in soups sauces beverages and other
food products (Dawkins and Nnanna 1993 Burkus and Temell i
1999) Such functional properties are very important for new food
applications However proper knowledge on thermodynamic
properties of βndashglucan in a food system with other food
components is necessary to exploit full benefits (Burkus 1996)
Gelation is associated with cross l inking of long chain of
polymer to form three dimensional continuous networks this
structure traps and immobil izes the l iquid and become thick
enough to f low under pressure (Glicksman 1982) βndashglucan is a
long chain of glucose units counts for 3-7 of total grain weight
which make i t more viscous Both amylose and βndashglucan are
straight chain of glucose I t has been found that amylose chains
al ign themselves and form gel while βndashglucan form gel through
interrupted regions of β -(1rarr3) l inkages (Buliga et al 1986) Due
to presence of glucose bond between (1rarr3) (1rarr4) l inkages that
26
make barley βndashglucan a soluble f iber β -glucan provides excellent
viscosity forming properties and used as thickening agents in
different food applications e g salad dressings sauces and ice
creams (Wood 1986) Thus addition of barley β -glucan into foods
not only to give better nutrit ional enhancement but also help to
improve quality parameters such as processing behavior and
shelf- l i fe or stabil i ty ( Klamczynski and Czuchajowska 1999)
Thammakiti et a l (2004) determined and evaluated that β -
glucans obtained from spent brewers yeast and its potential food
applications The objective of the study was to evaluate the effect
of homogenization on the rheological properties chemical
composit ion and functional properties of β -glucan In case of
homogenized cel l walls higher β -glucan content and apparent
viscosity has been observed than those which had not been
homogenized due to the breakup of cel l walls This extracted β -
glucans has shown higher apparent viscosity water-holding
capacity and emulsion stabil izing capacity but very similar oi l -
binding capacity when compared with commercial β -glucans from
bakers yeast
Dawkins and Nnanna (1995) reported that β -glucan viscosity
and stabil i ty showed diverse behavior when maintained different
pH-temperature-time combinations during processing and
decrease stabil i ty of food systems such as salad dressings i f β -
glucan is used as a stabil izer The presence of other food
ingredients can affect properties of hydrocolloids Sweeteners
alter the solution properties such as sucrose in low to mild
concentrations increased viscosity of oat β -glucan while higher
concentrations lowered viscosity Similarly Beer et a l (1997) has
27
substantiated that processing may affect solubil i ty of β -glucan
and decrease the molecular weight of β -glucan I t is obvious that
when β -glucan is used in bread making signif icant
depolymerization of l inear bond of this polysaccharide was
caused (Andersson et a l 2004)
Lyly et a l (2004) conducted a research study on two
different β -glucan sources and found that the sensory
characterist ics of soups prepared from barley β -glucan were
different compared to oat β -glucans Freezing had no remarkable
effect on the molecular weight of β -glucan or on the sensory
attr ibute of the soups The researchers visualized that barley β -
glucan addition resulted in alterations of a foods functional
properties such as viscosity More stable foams and emulsions
were obtained with incorporation barley β -glucan than oat β -
glucan Morgan et al (1998) also observed that βndashglucan from
barley makes soft gel on cooling at more than 05 concentrations
βndashglucan stabil i ty is dependent on t ime temperature and pH
values and these factors affects both viscosity and stabil i ty when
used in foods as stabil izers (Burkus and Temell i 1999) There are
reports by researchers showing that viscosity is a function of
molecular weight I t is important to determine precise molecular
weight to est imate βndashglucan characterist ics for potential
applications into food products Among cereals barley and oat
showing high concentrations of β ndashglucan this unique property
differentiate them from others (Burkus 1996) I t is well known
that barley and oat β -glucan is very similar in structure As for as
viscosity is concerned it has been observed that oat β - glucan has
high viscosity than barley due to long molecular chains (Beer et
28
al 1997) Temperature is responsible for changes in viscosity and
according to observations found that oat β ndashglucan gum viscosity
r ises from 25-370C and start decreases from 610C and maximum
reduces at 1000C when compare with control treatment at 250C
(Dawkins and Nnanna 1995) Furtehrmore barley βndashglucan
imparts a smooth mouth feel to beverage products while also
making the beverage an excellent source of soluble dietary f iber
In beverage formulations i t can provide similar functionality l ike
other thickeners β -glucan gums have shown such types of results
that are comparable with other thickners such as alginates pectin
xanthan and carboxymethylcel lulose (Giese 1992)
27 Utilization of β -glucan in food products
Food industry has a major focus on the production of foods
containing health-enhancing components that wil l improve
consumer health beyond meeting basic nutrit ional requirements
(Sloan 1999) Currently functional and nutraceutical ingredients
are used to exploit their health benefits and it has been found that
beverages provide excellent medium for their addit ion (Kuhn
1995) Barley is suitable for a range of food applications and it can
be processed into a number of palatable and nutrit ious food
products As other polysaccharides β -(1rarr3)-D-glucans have
found a very large range of possible applications in various
industries and especial ly in foods cosmetic agronomy
therapeutic and other In food industry beside typical
applications of polysaccharides as thickening agent and
stabil izers β - (1rarr3)-D-glucans have an increasing interest in the
areas of edible f i lm and wide application into feed for domestic
animals and low calorie food as chemical additives are not famous
29
among the consumers Barley gives r ise poor baking quality and
also not having good taste and appearance aspects which have
l imited i ts use in human foods However in current years there
has been an increasing research interest for the exploitation of
barley in a wide range of food applications (Bhatty 1999)
During the last few years functional drinks sector has been
strong and expected to continue Growth in future (Potter 2001
Sloan 2002) Industry analyst predict and saying continuous
growth and latest research has focused on the use of soluble
dietary f ibre and in particular cereal β -glucans as stabil izers in
the manufacture of low-fat products such as salad dressings
(Kontogiorgos 2004) ice creams yoghurts (Brennan 2002) cheese
and many other food products The use of β-glucans preparation
to partial ly substitute vegetable oi l in the formulation and is
found that give us many advantages in the food system Barley β -
glucan is a compound which as attractive thickening properties
and does not reveal deteriorative changes during processing and
storage periods I t gives r ise good thick solution properties when
added into water I t is suggested that β -glucan gum can be used
as thickener in different food application i e in ice cream sauces
and salad dressing (Carr et al 2002) Furthermore no bad effect on
sensory properties was reported There is an est imate and
predictions by industry analyst that functional drink wil l make a
good share in food section (Sloan 2002)
Erkan et a l (2005) produced tarhana (fermented cereal
product) samples from hulless and hulled barley with relatively
high β -glucans content Chemical and sensory properties of the
tarhana samples were examined and evaluated with the
30
tradit ional wheat tarhana During fermentation some of the β -
glucans may be destroyed however the results indicated that
barley f lours can be uti l ized to produce tarhana with relatively
high β -glucans content Effect of tarhana production on the
electrophoretic properties of proteins was est imated in this study
by using SDS PAGE Relative band intensit ies of tarhana samples
were generally less intense than those of respective f lour samples
perhaps due to the hydrolysis of proteins during fermentation
However the overall sensory attributes showed that uti l ization of
barley f lours in tarhana formulation resulted in acceptable soup
properties in terms of most of the sensory properties
Another product where Barley has been effectively
incorporated by (Sidhu et a l 1990) and made single layer f lat
breads including chapatis and Turkish bazlama bread by Basman
amp Koksel (1999) A further study conducted by Berglund et a l
(1992) and he has successfully used hull- less barley f lour in
chemically leavened products such as biscuits pancakes muffins
and cookies Such yeast- leavened bread made with hull- less
barley f lour is also being a good dietary source of (1rarr3) (1rarr4) β -
glucan Tradit ionally barley is not often used in bread products
because i t is deficient in gluten and has poor sensory qualit ies
Izydorczyk et a l (2001) showed that barley might replace up to
20 of wheat f lour without causing too much disturbance to the
overall dough quality
Similarly Morin et a l (2002) established that addition of
barley β -glucan gum (762 purity) into reduced-fat breakfast
sausages to such an extant that i t provides 03ndash07 β -glucan in
31
the manufactured goods gave better water binding and at a level
of 0 3 having no signif icant effects on product texture or f lavor
A study performed by Volikakis et a l (2004) in which he
used elevated level of β -glucan in cheese A commercial
concentrate of oat β -glucan (222 β-glucan content) has been also
incorporated into low-fat white-brined cheese from bovine milk
(70 fat reduction) at two levels 0 7 and 14 (ww) This
product showed in an increased yield greater proteolysis and
higher levels of short chain fatty acids ( lactic acetic and butyric)
as well as with improved texture compared to i ts low-fat (β -
glucan-free) counterpart However the product made with the
high level of β -glucan has shown signif icantly inferior impression
scores for colour f lavour than those of a typical white-brined
cheese product
28 Physico-chemical characteristics of beverage
Among functional foods beverages have excellent
opportunit ies for the incorporation of nutraceutical ingredients
Giese (1992) stated that the new formulations of beverages are
rapidly changing The market shelves are full of different
beverages with not only soda pop juices and dairy beverages
There is huge number of food products taken as beverages such as
iced teas and coffees sports drinks herbal teas frozen carbonated
beverages mint blends vegetable juices smoothies Soft drinks
have tradit ionally remarkable share in the market However in
current years consumers have not been choice for tradit ional
drinks but also have more exotic beverages such as the teas iced
coffees isotonic or sports drinks and non-carbonated beverages
32
and ready-to-drink iced herbal teas are also gaining popularity
(Swientek 1998)
Beverages not only provide taste and refreshment
satisfaction but can also offer a ready and unique delivery system
for protein vitamins minerals and other food ingredients such as
dietary f iber A major challenge to develop a nutraceutical
beverage is to preserve i ts nutrients and to make i t taste good
Another challenge involves the processing of these beverages with
minimum losses of f lavor vitamins and color Barley β -glucan is
being used frequently in cereal products According to FDA new
types of foods containing β -glucan are need to promote in which
3g of β -glucanday should be used this is the amount defined
amount to get the potential health effects Beverages showed
suitable category for new product development containing β -
glucan as functional ingredient
FDA has recommended consumption of 3 g β -glucan per day
to achieve such health benefits This claim was amended later on
and includes oat extracts containing up to 10 βndashglucan (FDA
2002) Some studies showed that consumers want to pay more for
foods having functional benefits ( Jonas and Beckmann 1998)
Processing condit ion for extraction of β -glucan is important
because i t may affect physiological molecular weight and
solubil i ty of barley βndashglucan (Beer et al 1997) and therefore has
influence on i ts physiological eff icacy and products development
High molecular weight β -glucan is particularly sensit ive to
processing Freezing has not been found to affect the molecular
weight of β ndashglucan (Suortt i et al 2000 Kerckhoffs et al 2003)
but i t decreases the solubil i ty of βndashglucan (Beer et al 1997) On
33
the other hand heating makes β-glucan more soluble (Bhatty
1992 Jaskari et al 1995) and enhances i ts physiological eff icacy
The beverage prepared at high temperature had a sl ightly
higher apparent viscosity than the pulse electric f ield (PEF)
treated beverage and developed sedimentation problem in the
container during storage The PEF processed beverage maintained
its natural orange juice l ike color was better than the heat treated
beverage which developed a sl ightly whitish color However the
PEF treated product was less microbiological ly stable at
refrigeration temperature compared with the heat treated product
which was stable for more than 12 month (Sharma et a l 1998)
Temell i e t a l (2004) prepared an orange-flavored barley β -
glucan beverage with different β -glucan levels and compared with
same level pectin beverage and analyzed for different sensory
parameters and the trained panelists found peely and fruity
orange aroma and sweetness intensity to be similar for al l
beverages tested Beverage sourness intensity differed among
beverages Panelists evaluated beverages containing 03
hydrocolloid as similar whereas beverages with 05 and 07 β -
glucan were more viscous than those with pectin at these levels
Acceptabil i ty of beverages was similar according to the consumer
panel During the f irst week of storage Colorimeter values of
beverages decreased mostly stabil izing thereafter With an
increase in concentration β -glucan beverages became l ighter in
color and cloudier but these attr ibutes for pectin beverages were
not affected During the f irst three weeks of storage β -glucan
beverages exhibited cloud loss
34
Barley β -glucan has revealed beneficial nutrit ional and
physical functionality characterist ics that are required for
beverage making (Temell i et al 2004) β -glucan can be used in
combination with whey protein isolate (WPI) for functional
beverage development This beverage has shown good results for
quality overall acceptabil i ty and remained acceptable for 8-week
storage Non-signif icant results for other quality parameters such
as sweetness sourness and f lavor intensity was observed Many
researchers have attempted the use of βndashglucan in beverage
(Holsinger et al 1974 Pendergast 1985) Whey protein in
combination with βndashglucan is successfully using in other food
systems due to nutrit ional and functional properties Different
diseases can be prevented with the help of barley βndashglucan and
whey protein isolates when used in foods (Temell i et al 2004) βndash
glucan is extracted from oats and oat porridge is made after
consumption it was demonstrated that product has reduce
postprandial blood glucose level (Wood et al 1990 Wood et al
1994) These developments led top the approval of a health claim
for oats by the Food and Drug Administration (FDA) in the United
States indicating that oatmeal whole oats and oat products
containing 075 g of β -glucan per serving may reduce the risk of
heart disease FDA 1999) Kulkarni et al 2008 made a barley tea-
l ike extract that is a popular summer drink in Japan and explained
the effects of various temperatures between 1500C and 2800C
during sub crit ical water extraction of barley Each barley extract
was carried out for antioxidative activity amount of residual
matter and sensory properties that were found at 2050C I t was
found that 5-Hydroxymethyl-2-furaldehyde is the most important
antioxidative component of the extract at 205oC
35
Many researchers worked on soft drinks and beverages and
conducted different analysis on quality parameters as DrsquoHeureux-
Calix and Badrie (2005) observed the color and microbial aspect of
puree during storage At pH 23 an intense red color is achieved
There were no signif icant changes observed for physicochemical
parameters except consistency and hue angle for color The puree
contained the total soluble solids in the range of 410ndash435degBrix
and pH was 262 There are reports for the development of new
formulations and then undergo sensory evaluation process to test
their consumer acceptance Maestri et a l 2000 added the ethylene
diamine tetra acetic acid (EDTA) in soy bean and proposed a new
method to attain a soybean with improved f lavor characterist ics
and found that a waterbean ratio of 4 5 1 has given better
results and provided the best protein (422 g 100 ml- 1 ) and total
sol ids (880 g 100 ml- 1 ) contents The soybean was evaluated for
pH viscosity and density as well as for protein compare with
soybean beverage
In the same way Singh and Nath (2004) test i fy different
composit ions for beverage and used denatured whey protein
concentrate (WPC) in the presence of pectin and carboxy
methylcel lulose (CMC) The formulation of beverage was 25 bael
fruit pulp 16degBrix and pH 39 and was fort i f ied with 175 2 75
and 375 level of WPC-polysaccharide complex Among al l
combinations he rated foodstuffs with 175 protein level of
pectin-WPC complex and 175 and 275 protein level of CMC-
WPC complex Moreover 1 75 whey protein level of CMC-WPC
complex was assigned maximum scores for al l sensory aspects
36
Lakshmi et a l (2005) optimized the conditions for beverage
formulations They used mixture of enzymes varying pH
temperature etc under controlled conditions The carbonated
beverage having 125 juice 16degB total soluble solids (TSS) and
04 acidity was suitable for storage During storage beverage
tends to retain i ts quality attr ibutes l ike taste and f lavor up to 2
months Refrigeration of the produce could be imperative in
enhancing the shelf l i fe of the produce Refrigeration at colder
temperatures also favors the retention of active components as
Prati et a l 2004 revealed ascorbic acid content maintained their
level during storage with a loss of only 20 in relation to the
concentration added
Different combinations used by Suh et al 2003 including
barley sprouting and sweet potato The mixture of barley sprouts
and sweet potato was uti l ized in the ratio (11) to increase the
industrial applications of sweet potato and rice beverage I t was
also established that the heat stabil i ty of amylase in sweet potato
is higher than that in barley Reducing sugar content in the
mixture of barley sprouts and sweet potato was higher than in
either barley sprouts or sweet potato alone Sahu et a l 2005 used
lemon grass in beverage formulations and observed that fresh
beverage having 152degB total soluble solids (TSS) pH 435 2329
total sugars 4 53 reducing sugars 0 19 acidity and 15 lemon
grass dist i l late obtained the average sensory score of 8 58 which
was highest among the other beverages prepared with different
concentrations of lemon grass dist i l late At small scale barley and
pectin beverage can be produce by adding water in steam jacket
kett le then mix βndashglucan or pectin and boil for one minute
37
sucrose is premix in water This whole mixture is cool down to 70 oC Add High fructose corn syrup and orange f lavour then
homogenize at 2000 psi shift mixture into steam kett le and add
ascorbic acid ci tr ic acid and βndashglucan The mixture is Pasteurize
at 90oC for half minute At the end bott les are hot f i l led and
placed at refrigerator temperature (Temell i et al 2004)
Barley (Hordeum vulgare L) is mainly used for brewing in
developed countries and as animal feed in less developed
countries However barley has great potential due to soluble f iber
content for human consumption and industr ial uses The cel l walls
of barley grain contain more βndashglucan as compared to aleurone
cel l walls The addition of βndashglucan in water wil l enhance the
viscosity and used as a thickening agent in beverages The action
of this soluble dietary f ibre is just l ike a typical visco-elastic
polysaccharide l ike pectin guar gum carboxymethylcel lulose
(CMC) and xanthan when used in different food products In
recent era the application of βndashglucan in food matrix play a key
role as a functional dietary f ibre
The development of functional beverages by incorporating
βndashglucan show excellent results as a nutraceutical ingredients
Barley βndashglucan gum is stable in low pH conditions and in
refrigerated storage The purity of βndashglucan depends upon
extraction and isolation method used The unpurif ied samples of
βndashglucan causes problem when added in to the food systems The
increasing trend of viscosity due to βndashglucan is considered to be
an important factor in lowering the postprandial blood glucose
levels and cholesterol
38
Distinctive research is mandatory to est imate the effect of
various process parameters on the rheological characterist ics and
molecular weight profi les of βndashglucan extracts and determine how
processing affects the eff icacy of incorporated βndashglucan Such
research would widen our perceptive to know how βndashglucan may
affect the nutrit ional properties of foods by altering their texture
structure and viscosity
39
CHAPTER-3
MATERIALS
AND
METHODS
31 Procurement of raw material
Barley variety (Haider-93) was procured from wheat
research insti tute Ayub Agricultural Research Insti tute (AARI)
Faisalabad
32 Preparation of barley flour
The barley f lour was prepared by grinding barley grains
through UDY cyclone mill (mesh size 20 mm)
33 Analysis of raw materials
The barley f lour was analyzed for proximate composit ion by
fol lowing their respective methods as described below
331 Moisture content
The moisture content of barley f lour was determined in an
oven through drying method (at 105degC) according to the
procedure described in AACC (2000) Method No 44-15A The
moisture content of barley f lour was determined by weighing 2 g
of sample into a pre weighed china dish and drying it in an air
40
forced draft oven at a temperature of 105plusmn5degC t i l l the constant
weight of dry matter was obtained The moisture content in the
sample was determined as given below
332 Crude protein
The barley f lour was tested for crude protein content according
to the Kjeldahlrsquos method as described in AACC (2000) Method No
46-30 Two gram of barley f lour sample was taken into the
digestion tube Twenty mill i l i ters of 98 concentrated sulphuric
acid and 2 tablets of digestion mixture (as catalyst) were added
into the digestion tube The digestion was carried out through
digestion unit t i l l transparent residue contents were obtained and
then after cooling 50ml dist i l led water was added The mixture
was neutral ized with 70 ml of 40 NaOH solution in order to
release gaseous ammonia The neutral ized solution was then
dist i l led through Kjeldahlrsquos dist i l lat ion apparatus The ammonia
l iberated was trapped in 4 boric acid solution containing
indicators (methyl red and ethylene blue) The amount of
ammonia collected was then t i trated against 0 1N sulphuric acid
to a purple end point A blank determination was carried out
fol lowing similar procedure without the test sample The
percentage protein was calculated according to formula given
below
Crude protein () = Nitrogen () x 625
Wt of original flour sample ndash Wt of dried flour sample Moisture () = -------------------------------------------------- x 100
Wt of original flour sample
41
333 Crude fat
The crude fat in each such sample was determined by running
sample through Soxhlet apparatus according to the procedure
given in AACC (2000) Method No 30-25 A sample (3 g) was
weighed into an extraction thimble and extraction carried out in
soxhlet appartus with petroleum ether for 2 hours the previously
heated dried cooled and weighed receive f lask containing oil
were dried in a hot air oven cooled in a desiccator and weighed
The fat content was the difference in weight between the empty
receive f lask and the residual oi l expressed as a percentage of the
sample weight
3 3 4 Crude fiber
The crude f iber content in each sample was est imated
by digesting the fat free samples of barley f lour in 125 H2SO4
fol lowed by 125 NaOH solution as described in AACC (2000)
Method No 32-10 After digestion the sample residue was ignited
by placing in a muffle furnace maintained for 3-5 hours at
temperature of 550-650 degC t i l l grey or white ash was obtained The
percentage of crude f iber was calculated after according to the
expression given below
335 Ash content
Ash is a inorganic residue remaining after the material has
been completely burnt at a temperature of 550degC in a muffle
furnace I t is the aggregate of al l non volati le inorganic elements
Weight loss on ignition Crude fiber () = ---------------------------------- x 100 Weight of flour sample
42
present in a material as i ts oxides The ash content of the barley
f lour was determined according to AACC (2000) Method No 08-
01 The f lour Sample (5 g) was weighed into a previously heated
dried cooled and weighed crucible The sample was charred over
a Bunsen f lame unti l no more smoke was given off and then
transferred into a muffle furnace and heated at a temperature of
550degC unti l i t turned to a completely grey material The ash
content was then cooled in a desicator and weighed The
difference in weight between the empty crucible and crucible with
ash residue expressed as a percentage of the original sample
weight and recorded as ash content
336 Nitrogen free extract (NFE)
The NFE was calculated according to the fol lowing expression
NFE = 100 ndash ( moisture + crude protein + crude fat +
crude f iber + ash)
34 Extraction and purification of β -glucan
β -glucan gum was extracted from barley variety (Haider-93)
by fol lowing the method described by Wood et a l (1978) with
some modifications The barley f lour (50 g) was suspended in 500
ml water pH was adjusted to 10 with Na2 CO3 (20 vw) and
st irred vigorously for 30 minutes at a temperature of 45ordmC The
mixture was centrifuged (Model 3K30 Sigma Germany) at 15000 x
g at 4ordmC for 15 minutes The supernatant was adjusted to pH 45
with 2 M HCL and centrifuged again (20 minutes at 21000 x g
4ordmC) to separate precipitated protein which was discarded The β -
glucan was precipitated by the addition of an equal volume of
43
ethanol (999) to the supernatant with slowly st irring The
precipitate was recovered by centrifugation at 3300 x g for 10
minutes I t was al lowed to sett le overnight at a temperature of 4ordmC
in a refrigerator and the sample was dried in a vacuum drier
(Model DZF 6020 R-A-alpha M) The extracted β -glucan was
stored as pellets in high density polyethylene bags at 50C for
further studies
35 Analysis of β -glucan
The purif ied β -glucan pellets were analyzed for different
chemical parameters as described below
351 Proximate composition
β -glucan pellets were analyzed for moisture crude protein
crude fat crude f iber ash and NFE content according to their
respective methods as described in section 33
3 5 1 Total Dietary Fiber (TDF)
The β -glucan pellets were analyzed for total dietary f iber
contents according to method described in AACC (2000) Method
No32-05 The pellets were dispersed in a buffer solution and
incubated with heat-stable α -amylase at a temperature of 95-100
degC for 35 minutes After cooling the samples (gum pellets) up to
60degC incubated at 60degC for 30 minutes by adding of 100 microl
protease solution Finally these contents were incubated with
amyloglucosidase at 60degC for 30 minutes The f iber contents were
precipitated by the addition of alcohol in 1 4 ratio The contents
were f i l tered and washed with alcohol and acetone A blank was
44
run through entire procedure along with test samples to calculate
any contribution from reagents to residue
352 Soluble Dietary Fiber (SDF)
The soluble dietary f iber content in β -glucan pellets were
determined according to the method as mentioned in AACC (2000)
Method No 32-07 by employing Megazyme Assay Kit The
samples were dispersed in buffer solution and incubated with
heat-stable α -amylase at 95-100degC for 35 minutes After cooling
the samples to 60degC and contents by adding 100 microl protease
solution were incubated at 60ordmC for 30 minutes Finally the
contents by adding amyloglucosidase were incubated at a
temperature of 60degC for 30 minutes The residue after f i l tration
was washed and rinsed with 10 ml water The f i l trate and water
washing was weighed and soluble dietary f iber was precipitated
with four volume of ethyl alcohol The contents were f i l tered and
dried and corrected for ash and protein contents A blank was also
run simultaneously through entire procedure along with test
samples to calculate any contribution from reagents to the
residue
353 In-Soluble Dietary Fiber (IDF)
The soluble dietary f iber (IDF) contents in β -glucan pellets
were determined according to the procedure described in AACC
(2000) Method No 32-20 The samples were dispersed in a buffer
solution and incubated with heat-stable α -amylase at a
temperature of 95-100degC for 35 minutes The samples (gum
pellets) after cooling up to 60 degC incubated by adding 100microl
protease solutions at 60 degC for 30 minutes and then the contents
45
were incubated by adding amyloglucosidase at 60degC for 30
minutes The residue after f i l trat ion was washed and rinsed with
10 ml water The resultant residue was weighed and in soluble
dietary f iber was precipitated with four volume of ethyl alcohol
The contents were f i l tered dried and corrected for ash and
protein contents A blank was also run simultaneously through
entire procedure to calculate any contribution from reagents to
residue
354 Pentosans
The pentosans of β -glucan pellets were determined by the
method as described by Hashimoto et a l (1987) The powdered β -
glucan pellets were hydrolyzed with HCl (2N) at a temperature of
100 oC Then after cooling and neutral ization sugars were
removed by incubating through the addition of yeast for 2 hours
and centrifuged at 1000g A mixture of supernatant (2 ml) water
(1 ml) FeCl3 (3 ml) and orcinol (0 3 ml) was vortexed and then
heated for 30 minutes and cooled The absorbance was measured
through spectrophotometer (IREMCO Model 2020 Germany) at
670 nm
3 5 5 Starch
The starch content in β -glucan pellets was determined
according to method described in AACC (2000) Method No76-11
The f inely ground pellet samples were moistened with ethanol
(80) to aid dispersion Thermo-stable ά -amylase was added and
st irred vigorously on vortex mixer The mixture was incubated for
6 minutes at a temperature of 50oC with occasional shaking
Sodium acetate buffer and amyloglucosidase were added and the
46
mixture was st irred and incubated at 50 o C for 30 minutes The
contents were transferred from the tube to 100 ml volumetric f lask
and adjusted the volume by disti l led water The al iquot of this
solution was centrifuged at 3000g for 10 minutes Transferred
duplicate al iquots (01 ml) of the diluted solution to the bottom of
tubes GOPOD (glucose oxidase peroxidase) reagent was added to
sample mixture and blank and incubated these contents at a
temperature of 50oC for 20 minutes The absorbance of test
samples glucose control and blank was measured through
spectrophotometer (IREMCO Model 2020 Germany) at 510 nm
36 Utilization of β -glucan in beverage
The purif ied β -glucan was uti l ized in different formulations
for the preparation of functional beverages The formulation of
treatments is presented in Table 31
Table 31 Treatment plan
Treatments β -glucan ()
T1 0 control (0 2 pectin)
T2 02
T3 04
T4 06
T5 08
T6 10
47
37 Preparation of Barley Beverage
The β -glucan beverage was prepared with some
modifications in the formulation given by Temell i et a l (2004)
The actual composit ion of beverage is given in Appendix I The
f low diagram of beverage preparation is given as under
Fig 31 Preparation of β -glucan
Heat water to 90 o C
Add slowly β -glucan in solution form
Mix by using high speed mixer
Add remaining ingredients according to Formulation
Adjust pH to 32 with acidulant
Thermally processed and f i l l ing in pre steri l ized bott les
Storage at 5oC
38 Analysis of beverage
The β -glucan beverage was analyzed for different
physicochemical microbiological and sensoric attr ibutes
according to their respective methods during three months
storage at 5oC on fortnightly basis The description of methods is
given below
48
381 Color
The color values of β-glucan beverage samples were
measured according to method of Yu et a l (2003) by using the L
a b color space (CIELAB Space) with Color Tech-PCM (USA)
The L Value indicates l ightness the a and b values are the
chromaticity coordinates (a from red to green b from yellow to
blue)
382 Acidity
The acidity of beverage samples was determined by
fol lowing the method given in AOAC (1990) A sample of 5 mL
from each treatment was t i trated against 0 1 N sodium hydroxide
solution to a persistent pink color end point by using two or three
drops of phenolphthalein indicator The results are expressed as
percent citr ic acid and calculated by the fol lowing formula
mL of NaOH times normality of NaOH times eq wt of acid Acidity () = - - - - - - - - - - - - - - - - -- - - - - - - - - - - - -- - - - - - - - - - - - - -- - - - - - - - - - Volume of sample times 10
383 pH
The pH of beverage samples was estimated according to the
method described in AOAC (1990) The samples were taken in a
neat and clean 50 mL beakers and pH was directly recorded by
using a cal ibrated pH meter ( inoLab pH 720 Germany)
384 Total soluble solids
Total soluble solids of functional beverage were recorded by
using hand refractometer equipped with a percent scale and the
results were expressed as percent soluble solids o Brix
49
385 Specific gravity
The specif ic gravity was determined by fol lowing the
method given in AOAC (1990) Empty pycnometer was weighed
and f i l led with water at 20 oC and again weighed Then washed the
pycnometer and dried in oven and weighed again Now it was
f i l led with test beverage sample and weighed At the end specif ic
gravity was calculated by the formula given under
S - E Density of sample = W - E
Where
S = Weight of sample f i l led pycnometer
E = Weight of empty pycnometer
W = Weight of water f i l led pycnometer
386 Viscosity
The viscosity of functional beverages was measured by
fol lowing the procedure of AACC (2000) through Rion viscometer
(Rion Tech USA) after every fortnight interval during the storage
of three months
387 Sugars (Reducing and Non-reducing)
The total sugars (Total sugars reducing sugars and non
reducing sugars) in the beverage samples were est imated by using
the method of Lane and Eynon as described by Ruck (1963)
Fehlingrsquos solution was made by mixing CuSO4 and alkaline
tartrate solution in equal volumes The pure sucrose sample
prepared in HCl was f i l led into the burette and run into the f lask
50
containing 10 ml Fehlingrsquos solution almost whole volume of the
sample as calculated in the incremental method so that less than
05 ml or more than 1 ml was needed to complete the t i tration The
contents in t i tration f lask were boiled after addition of 2 drops of
methylene blue indicator upto brick red end point The 10 ml
Fehlingrsquos solution equivalent was derived in terms of invert sugar
content and found to be 0505g 25 ml beverage sample was taken
into a 400 ml beaker to which 100 ml water was added and
neutral ized with 1 N NaOH The volume was made up with
dist i l led water up to 250 ml and f i l tered with Whatman fi l ter
paper 2 ml of lead acetate solution was added shaken well and
after 10 minutes 21 ml potassium oxalate solution was added and
f i l tered (f i l terate a)
3871 Reducing sugar
The f i l trate (a) was employed for determination of reducing
sugars by standard method of t i tration as described above The
reducing sugars were calculated according to the expression given
below
Fehlingrsquos solution factor x 100 x dilution Reducing Sugars = ----- - -- - - - - - - - - - - - - -- - - - - - - - - - - - - -- - - - - - - - - - - Volume of sample used
3872 Total sugars
50 ml f i l trate (a) was taken into a 250 ml f lask 5 g citr ic acid
and 50 ml water were added The solution was boiled gently for
10 minutes to invert the sucrose and cooled I t was transferred to
a 250 ml volumetric f lask and neutral ized using phenolphthalein
as an indicator NaOH (20) was added unti l solution turned to
51
pink then 1N HCl was added unti l pink color disappeared The
total sugars were calculated using the fol lowing formula
Fehlingrsquos solution factor x 100 x dilution Total sugars () = - - - - - - - - - - -- - - - - - - - - - - - - -- - - - - - - - - - - - - -- - - - - - - - - Volume of sample used
3873 Non-Reducing Sugar
Non reducing sugars were determined according to the
formula given below
Non reducing sugars ()= ( Total sugars()- Reducing
sugars()times 095
39 Total plate count of beverage samples
Total account of microorganisms in beverage was carried out
fortnightly during storage of three months by adopting the
method of (Lateef et a l 2004) as given bellow
391 Preparation of media
Amount of media to be prepared was determined by
deciding on number and frequency of tests and frequency of
making media 23g powdered nutrient agar was added to 1000 ml
of dist i l led water and heated to prepare nutrient agar media
While Sabouraud dextrose agar media was prepared by mixing
dextrose 40 g peptone 10 g and agar 35 g in 1000 ml dist i l led
water and heated
392 Sterilization and incubation of media
The media were steri l ized in autoclave at 15 to 20 Ib
pressure for 15 minutes then these were stored in refrigerator The
52
prepared media were poured in petri dishes and 15 ml of molten
media was also poured in each dish Dilution and media were
mixed by swirl ing the pteri dishes to and forth and al lowed to
solidify and then Petri dishes were inverted to avoid condensation
of moisture inside the cover These petri dishes were incubated at
37oC for 48 hours After incubation period colonies developed in
Petri dishes were counted through Qubec colony counter
310 Sensory evaluation
The functional beverages were organoleptical ly evaluated
for sensory parameters such as colour taste f lavour and overall
acceptabil i ty by a panel of f ive judges The nine point hedonic
scale was employed for the evaluation of samples stored in
refrigerated conditions as suggested by Harry and Hildegarde
(1998)
The beverage samples (250 mL) were presented to the
trained sensory panel in capped glass jars at 5degC Samples were
kept in a cold water bath to maintain serving temperature
Samples were presented according to a random order balanced
design and room temperature dist i l led water for r insing a napkin
and score sheet on an off-white f iberglass tray Penelists
evaluated samples in standard sensory panel booths containingan
attribute definit ion sheet stop watch and pencil Panelists were
rewarded for participation after each session The coded samples
were presented to the judges in a randomized order twice a day
The evaluation performa were provided to judges for scoring as
given in appendix II
53
311 Selection of the best treatments
The functional beverages were subjected to sensory
evaluation on the basis of judges opinion based on sensory
evaluation the treatments T1 (0 β-glucan) T2 (02 β -glucan)
T3 (04 β -glucan) and T4 (06 β -glucan) were selected These
four treatments along with control (0 β -glucan) were selected for
further biological assay In control treatment pectin was used at a
concentration of 0 2 because i t is used in beverage products
very extensively
312 Efficacy studies
3121 Selection and orientation of subjects
El igibi l i ty in the program required wil l ingness and abil i ty to
adhere to the research protocol and absence of other chronic
diseases 25 healthy volunteers were selected in the program
Participation entailed both direct solicitat ion methods and
culturally tai lored efforts Direct sol ici tat ion method included
presentations face to face invitations and giving handouts that
described the study After potential participants expressed an
interest in the study they were scheduled for an orientation
Process measures included a participatory rapid appraisal a
consent form demographic questions form (including age gender
race culture income and education) and medication
questionnaire (Appendices IV) The participants were divided into
f ive groups (f ive in each) The best selected beverages were
provided to the specif ic groups in 3 replicates as mentioned in
treatment plan (Table 32) Each subject was given about 250 ml
(twice a day) of beverage every t ime
54
Table 32 Treatments used in the biological study Group Treatment (beverage)
A 0β -glucan02Pectin (Control)
B 02 β -glucan
C 04 β -glucan
D 06 β -glucan
The blood sampling of participants was carried out after
every 0 15 and 30 days of study and serum was collected through
centrifugation for analysis of different biochemical parameters in
serum
31211 Glucose level
The blood assay of the participants was carried out to
determine the blood glucose concentration Blood was taken in the
morning to determine the fasting (10-12 hrs) level of glucose and
again 1 and 2 hours after ingestion of specif ic treatment Analysis
of serum glucose was performed through Microlab-300 (Merck)
31212 Total cholesterol
The total cholesterol in the collected serum of individual
subjects of al l groups was measured by l iquid cholesterol CHODndash
PAP method as described by Stockbridge et a l (1989)
3 1213 Low density lipoprotein (LDL)
55
The low density l ipoprotein (LDL) in the serum of each
individual was measured by fol lowing the procedure of
McNamara et a l (1990)
31214 High density lipoprotein (HDL)
The serum high density l ipoprotein (HDL) was measured by
HDL cholesterol precipitant method as described by Assmann
(1979) to f ind out the impact of prepared beverages on the HDL
level of specif ied groups of participants
31215 Triglycerides (TG)
Total tr iglycerides in the collected serum of individual
participant were measured by l iquid triglycerides GPO - PAP
method as described by Annoni et a l (1982)
3 12 Statistical analysis
The data were subjected to analysis of variance (ANOVA) using
CoStat-2003 software package as described by Steel et a l (1997)
The Duncun Multiple Range (DMR) was used to determine the
level of s ignif icance between samples
56
CHAPTER- 4
RESULTS
AND
DISCUSSION
41 Chemical Composition of Barley Flour
The barley grains were cleaned and ground through Udy
cyclone sample mill and the flour was tested for different
chemical characteristics i e moisture crude fat crude protein
crude fiber ash and NFE soluble dietary fiber insoluble dietary
fiber total dietary fiber pentosans and β-glucan contents
The chemical characteristics of barley flour presented in
Table 41 indicated that the barley flour contained 1165 231
675 222 and 7707 crude protein crude fat crude fiber ash
and nitrogen free extract (NFE) respectively The results of the
present study for proximate composition of barley f lour are in line
with the earlier f indings reported for Canadian varieties by (Li et
al 2001) Helm and Francisco (2004) also concluded that Brazilian
barley varieties showed crude protein content from 1155 to
1592 crude fat 291 to 400 ash 151 to 227 and crude fiber
595 to 712 and the result of the present study fall with in the
ranges reported by these scientists Kiryluk et al (2000) have also
found crude protein content in hulled barley flour as high as
1583 and the ash content of 219 and these results also
57
Table 41 Chemical composition of barley flour
Component () on dry weight basis Crude protein 1165plusmn110
Crude fat 231plusmn021
Crude fiber 675plusmn059
Ash 222plusmn019
NFE 7707plusmn550
Soluble dietary fiber 411plusmn 039
Insoluble dietary fiber 737plusmn065
Total dietary fiber 1148plusmn109
Pentosans 303plusmn026
β-glucan 487plusmn039
58
Support to the f indings of the present study for ash content but
differed for protein content which might be due to the variation in
genetic material as well as agronomic and environmental
conditions experienced by the tested material
The results regarding chemical composit ion of barley f lour
presented in Table 41 also substantiated that barley f lour
contained higher amounts of crude f iber (675) The dietary f iber
of barley f lour in the present study was found 411 soluble
7 37 insoluble and 1148 total dietary f iber In earl ier studies
the variations in total dietary f iber soluble dietary f iber and
insoluble dietary f iber content of barley f lour have been reported
ranging from 75 to 168 56 to 64 and 19 to 104
respectively in barley (Helm and Francisco 2004 Vasanthan et a l
2002) which are very close to results found for various type of
total dietary f ibers found in the present study The results
presented in Table 41 further showed that barley f lour possessed
β -glucan 487 and pentosans 303 The results for β -glucan and
pentosans content of barley f lour in the present study are within
the ranges reported by the research workers (Papageorgiou et a l
2005 and Bhatty et a l 1991) The β -glucan is a soluble dietary
f iber component and is present in the highest amounts in the
endosperm of barley
42 Analysis of β-glucan
The β -glucan is found to be the most abundant component of the
soluble dietary f ibre in oats and barley I t is partial ly water
soluble and a l inear polysaccharide comprising only glucose units
The results regarding β -glucan given in Table 42
59
Table 42 Chemical Analysis of β-glucan
Component ()
Moisture 355plusmn029
Crude protein 996plusmn089
Crude fat 117plusmn008
Crude fiber 722plusmn055
Ash 172plusmn014
NFE 7638plusmn699
Soluble dietary fiber 7505plusmn588
Insoluble dietary fiber 1025plusmn102
Total dietary fiber 8530plusmn679
Pentosans 263plusmn019
Starch 190plusmn017
β-glucan 487plusmn039
60
indicated that β -glucan possessed 996 117 722 172 and
7638 of crude protein crude fat crude f iber ash and nitrogen
free extract (NFE) respectively
The present results regarding chemical composit ion β -glucan
are also in close agreement with the f indings reported by Bhatty
(1993) who demonstrated 33 ash content of β -glucan extracted
from barley bran The ash content (Table 42) found in the present
study is also in close conformity with the previous work of
Burkus and Temell i (2005) who reported ash content up to 4 in
β -glucan gum The pentosans contents in the present study are
also inl ine with the results reported by Burkus and Temell i (2005)
The fat content in the β -glucan was found higher as
compared to reported by Faraj et a l (2006) who found 005
lipids in high purity β -glucan concentrate which might be due to
less impurity of β -glucan extracted in the present study The
contents of starch soluble dietary f iber insoluble dietary f iber
and total dietary f iber recorded during the present study are also
in consistent with the earl ier f indings of Faraj et a l 2006) who
found variation from 04- 1 43 in starch content of β -glucan in
soluble dietary f iber (SDF) range from 7181ndash7575 and the in
insoluble dietary f iber (IDF) content of β -glucan gum pellets in
the range of (8 77-173) Symons and Brennan (2004) reported
range of 848 to 9162 for total dietary f iber (TDF) of β -glucan
which also support the results obtained for this parameter in this
present study Lambo et a l (2005) reported that barley f iber
concentrate contained 798 of total dietary f iber which is very
close to the results obtained for total dietary f iber
61
43 Analysis of β-glucan beverage
431 Color
4 3 11 L-value
The statist ical results regarding L-value measured through
colorimeter of different beverages prepared by incorporation of β -
glucan at different levels are shown in Table 43 I t is obvious
from the statist ical results that both treatments and storage
intervals exhibited signif icant effect on the L-value of different
beverages The interaction between the both the variables was
found to be non signif icant for this value of color
The color index of different beverages shown in Table 44
indicated that L-value of beverages increased as the level of β -
glucan increased in the formulation of different beverages The
results revealed signif icantly the highest L-value (2128) for
beverages of T6 containing 10 β -glucan which decreased as the
β -glucan level was reduced in the beverages and 1969 L-value
was recorded for control beverage (without β -glucan) The results
(Table 44) further showed that beverage of T5 containing 08 β -
glucan and T6 beverage containing 10 β -glucan fal l stat ist ical ly
in the same group with respect to this color values Similarly non
signif icant differences existed among beverages T2 (02 β -
glucan) T3 (04 β -glucan) and T4 (06 β -glucan) for L-value
for color
The effect of storage on the L-value of different beverages
containing different levels of β -glucan is shown in Table 44
62
Table 43 Mean sum of squares for color values (L a b) of stored β-glucan beverages
SOV df L-value a-value b-value
Treatments (T) 5 8640 48371 4088
Storage intervals (S) 6 16546 8071 17226
T x S 30 0084NS 0027NS 0964NS
Error 84 0052 0048 0164
Highly Significant (Plt001)
NS Non Significant
63
Table 44 Effect of treatments and storage intervals on the L-value of stored β-glucan beverages
Means carrying same letters within a column or row do not differ significantly (P lt 001)
Storage Intervals (days) Treatments
0 15 30 45 60 75 90 Mean
T1 (0 β-glucan) 2160 1997 1963 1950 1933 1897 1880 1969c
T2(02 β-glucan) 2213 2043 2040 1983 1973 1920 1913 2012b
T3(04 β-glucan) 2240 2073 2020 1993 1973 1950 1933 2026b
T4(06 β-glucan) 2270 2077 2030 2027 1990 1970 1940 2043b
T5(08 β-glucan) 2337 2140 2117 2120 2070 2120 1980 2126a
T6(1 β-glucan) 2263 2130 2130 2143 2080 2077 2074 2128a
Mean 2247a 2077b 2050bc 2036cd 2003de 1989ef 1953f
64
It is evident from the results that L-value of β-glucan beverages
declined significantly as a function of storage The fresh beverage
possessed the highest L-value (2257) that reduced to 2036 and
1953 when tested after 45 and 90 days of storage
It is important to note that with the increase of level of β-
glucan in the beverages affected significantly the L-value or
brightness of beverage The present study indicated that
incorporation of β-glucan resulted in improvement of beverages
color as compared to the control beverage which was prepared by
the addition of 02pectin without addition of β-glucan More L-
value by the addition of β-glucan obtained in the present study is
in consistent with the previous f indings of Bensema (2000) who
found similar pattern for increasing in L-value due to
supplementation of β-glucan However decline in L-value during
storage may be attributed to the cloud loss in the beverage
containing with β-glucan as reported by Cortes et al (2008) The
decrease in L-value was more persistent during first two weeks
but a bit stabilized after third week of storage A small amount of
precipitate was visible at the bottom of the β-glucan beverage
which is due to insoluble protein and fiber components present in
the β-glucan at low levels The precipitation of this material in case
of β-glucan supplemented beverage might be a cause of higher L-
value for these treatments of beverage as reported by Temelli et al
(2004) who prepared orange flavoured barley β-glucan beverages
and showed changes during twelve weeks storage intervals
65
4312 a-value
The analysis of variance pertaining to the a-value of
different beverages prepared by incorporation of β-glucan at
different levels indicated that both treatments and storage
intervals showed signif icant effect on the a-value of different
beverages (Table 43) However the interaction between both
variables was found non signif icantly different for a-value
The a-values of different beverages presented in Table 45
revealed that signif icantly the highest a-value (227) was
observed in beverage of T1 control beverage (without β -glucan)
while the lowest a-value (128) was possessed by T4(04 β -
glucan) I t is obvious from the results that a-value of beverages
showed upword trend as the level of β -glucan increased in the
beverage formulations This indicated decrease in the intensity of
red color in the beverages as a result of β -glucan addition in the
beverages The results further substantiated that beverages of T4
(06 β -glucan) and T6 (10 β -glucan) fal l stat ist ical ly in the
same group with respect to a color value
The results for a-value of different beverages prepared by
the incorporation of β -glucan shown in Table 45 indicated that
a-value of β -glucan beverages decreased signif icantly by
increasing the storage intervals The beverage prepared fresh got
the highest a-value (290) which declined to 144 and 099 after 45
66
Table 45 Effect of treatments and storage intervals on the a-value of stored β- glucan beverages
Storage Intervals (days) Treatments
0 15 30 45 60 75 90 Means
T1 (0 β-glucan) 278 277 253 250 226 207 101 227a
T2(02 β-glucan) 267 143 120 120 113 110 107 140cd
T3(04 β-glucan) 299 155 139 130 110 099 098 147bc
T4(06 β-glucan) 280 133 127 100 090 083 083 128e
T5(08 β-glucan) 320 160 150 143 137 123 121 165b
T6(1 β-glucan) 300 130 126 118 103 085 084 135de
Means 290a 166b 153bc 144bcd 130cd 118d 099e
Means carrying same letters within a column or row do not differ significantly (P lt 001)
67
and 90 days of storage intervals respectively A decrease in the a-
value indicated that beverage became less reddish intensity with
progress in storage periods Moreover a maximum change in the
red intensity was recorded during the f irst week of storage as
compared to the upcoming storage weeks Sa acute nchez-Moreno et a l
(2005) have reported a decl ine in a-value in pasteurize orange
juice during storage which supports to our f indings
In the present study a-value decreased signif icantly by
increasing the level of β -glucan in the beverages which indicated
that increased β -glucan concentration resulted in a less reddish
product as compared to the control beverage The results of
present study are not incormity with the f indins of Bensema
(2000) who reported increasing trend of a-value in case of β -
glucan incorporation into barley β -glucan beverage with whey
protein Isolate and found shelfstabil i ty within twelve weeks
storage at refrigeration temperature A decrease in a-value was
more persistent during f irst three weeks but a bit stabil ized after
third week
4313 b-value
The statist ical results showed that b-value of the color
index of beverages containing β -glucan at different levels was
signif icantly affected due to treatments and storage intervals
(Table 43) However the interaction between treatments and
storage intervals was found to be non signif icant for this attr ibute
of color
The beverages prepared from control treatment T1 with
02 pectin gave the highest b-value (1080) fol lowed by
68
Table 46 Effect of treatments and storage intervals on the b-value of stored β-glucan beverages
Storage Intervals (days) Treatments
0 15 30 45 60 75 90 Means
T1 (0 β-glucan) 1050 1077 1100 1070 1080 1080 1100 1080a
T2(02 β-glucan) 1200 960 920 920 913 900 920 962c
T3(04 β-glucan) 1240 980 960 940 930 940 900 984c
T4(06 β-glucan) 1277 1020 960 980 930 927 960 1008bc
T5(08 β-glucan) 1300 983 940 950 960 950 940 1003bc
T6(1 β-glucan) 1337 1060 1020 1007 987 997 980 1055ab
Means 1234a 1013b 983b 978b 967b 966b 967b
Means carrying same letters within a column or row do not differ significantly (P lt 001)
69
beverage T6 (1 β -glucan) The lowest b-value was recorded in
beverage T2 (02 β -glucan) I t is obvious from the results that
incorporation of β -glucan in the beverage formulations exerted
signif icant response towards b-value of beverages when added at
1
The results in Table 46 also indicated that b-value of
different beverages decreased signif icantly as a function of
storage The freshly prepared beverages got the highest b-value
(1234) which declined to 976 after 45 days and to 967 at the
expiry of the experiment (90days) The beverages containing β -
glucan yielded more yellowish color I t is also obvious from Table
46 that decrease in b-value of beverages was more persistent
with signif icantly reduced during f irst two weeks of the storage
and beyond this period insignif icant change in b-value was
recorded up to expiry of the study i e 90 days of storage The
results of present study are in close agreement with the previous
f inding of Rodrigo et a l (2003) who showed a signif icant
decrease of b-value on pasteurized orangendashcarrot juices when
processed at 77 0C and stored at 100C stable for a period of 32
days
The addition of β -glucan at a level of 1 beverage showed
signif icant effect on b-value However b-value of different
beverages decreased as storage periods progressed This decrease
was more during the f irst two weeks of storage The decline in b-
value observed during the f irst two weeks may be due to the
precipitation of insoluble material present in the beverages or
changes in the β -glucan colorant Bensema (2000) substantiated
that b-value of beverage was reduced from 124 to 94 during the
70
refrigerated storage of 12 weeks which is in l ine with the present
results as similar reducing trend of b-value of beverages
observed in the present study The values measured as L a and
b through colorimeter represent brightness red to green and
yellow to blue color components respectively which decrease
signif icantly during the f irst two weeks of storage for al l
beverages and stabil ized later on The decrease in color values
during f irst two weeks may be attr ibuted to precipitation of
insoluble material present in beverages or change in β -carotine
colorant as reported by Temell i et al (2004) who also explained
that these precipitate are made from insoluble protein and fiber components
present in the β-glucan gum pellets at low levels during extraction procedure
432 Viscosity
The statist ical results in Table 47 showed signif icant effect
of treatments on viscosity of beverages prepared from different
concentrations of β -glucan However the storage intervals and
interaction of these two variables exhibited non signif icant effect
on viscosity of different beverages
The results in Table 48 showed that beverage prepared from
1 β -glucan incorporation (T6) possessed signif icantly the highest
viscosity (2175 mPa-s) fol lowed by T5 beverage containing (08
β -glucan) The lowest viscosity was recorded in T1 (0 β -glucan)
I t is also evident from the results in Table 48 that viscosity of
beverages increased progressively by increasing the level of β -
glucan in the formulation of beverages
I t was observed that incorporation of β -glucan showed
improvement in viscosity of beverage which might be due to the
71
Table 47 Mean sum of squares for viscosity specific gravity and total soluble solids (TSS) of stored beverages
SOV df Viscosity Specific gravity TSS
Treatments (T) 5 10026629 0003148 NS 16948375
Storage intervals (S) 6 06149915 NS 94524e-4 NS 05463508 NS
T x S 30 01087928NS 45238e-5 NS 0001213NS
Error 84 04246667 00019 03711897
Highly Significant (Plt001) NS Non Significant
72
Table 48 Effect of treatments and storage intervals on the viscosity of stored β-glucan beverages
Storage Intervals (days) Treatments
0 15 30 45 60 75 90 Means
T1 (0 β-glucan) 441 441 439 442 447 441 450 443f
T2(02 β-glucan) 696 697 698 702 701 703 707 701e
T3(04 β-glucan) 1195 1201 1205 1218 1227 1232 1243 1217d
T4(06 β-glucan) 1607 1614 1628 1640 1651 1660 1662 1637c
T5(08 β-glucan) 1930 1935 1944 1951 1962 1968 1977 1952b
T6(1 β-glucan) 2130 2141 2152 2160 2172 2180 2287 2175a
Means 1333a 1338a 1344a 1352a 1360a 1364a 1388a
Means carrying same letters within a column or row do not differ significantly (P lt 001)
73
presence of polysaccharides (1rarr3 1rarr4 β -glucan l inkages) The
addition of β -glucan to water also results in the formation of a
viscous hydrocolloid solution (Dawkins and Nnanna 1995
Burkus 1996) which might be one of the reasons towards increase
in the viscosity of beverages The polysaccharides hydroxyl
groups are available to form hydrogen bonds with water which
makes the polymer water-soluble Similarly Glicksman (1982) also
demonstrated that presence of the polymers in solution creates a
random network which increases the internal fr ict ion within the
solution This results in an inhibit ion to internal f low and thus
increases the viscosity of the solution by the incorporation of β -
glucan in the beverage Therefore β -glucan offers various
applications l ike beverages where other thickeners stabil izers or
gell ing agents such as pectin carrageenan guar and xanthan gum
may be replaced The results of the present study are in l ine with
the previous f indings of Bensema (2000) who observed similar
increase in viscosity of beverage by the addition of β -glucan
Thus i t may be inferred from the present results that the
thickening and stabil ization properties of barley β -glucan may be
advantageous in a beverage formulation Temell i et a l (2004)
have reported a sl ight decrease in viscosity in some beverages
containing higher hydrocolloids content (07) and found stable
viscosity in al l other beverages They also found stabil i ty of β -
glucan within the low pH in beverage formulations These
f indings support the results found in the present study
74
433 Specific gravity
The statist ical analysis pertaining to the specif ic gravity of
different beverages prepared by incorporation of β -glucan at
different levels is shown in Table 47 I t is evident from the
results that treatments storage intervals and interaction between
treatments and storage intervals showed non signif icant effect on
specif ic gravity of different beverages
The specif ic gravity of different beverages shown in Table
49 varied from 103 to 106 gL among different beverages
Mugula et a l (2001) observed sl ight decrease in specif ic gravity
in pasteurized and unpasteurize togwa samples These f indings
support the present study as non signif icant trend for this
parameter
The study of Tiisekwa et a l (2000) also showed small
variation in specif ic gravity in Tanzanian fermented beverages
when stored at ambient temperature that also supports the
present study
434 Total Soluble Solids (TSS)
The statist ical results presented in Table 47 indicated that
total soluble solids of different beverages were signif icantly
affected by treatments however storage intervals and interaction
between storage and treatments showed non signif icant effect on
TSS of different beverages
The results in Table 410 showed that the beverage
containing the highest level of β-glucan 1 (T6) possessed the
highest contents of total soluble solids (1042ordmbrix) fol lowed by
T5 beverage containing 08 β -glucan The lowest total soluble
75
Table 49 Effect of treatments and storage intervals on the specific gravity of stored β-glucan beverages
Storage Intervals (days) Treatments
0 15 30 45 60 75 90 Means
T1 (0 β-glucan) 102 102 102 102 103 103 104 103a
T2(02 β-glucan) 102 102 103 103 103 103 104 103a
T3(04 β-glucan) 103 103 103 103 104 104 105 104a
T4(06 β-glucan) 103 104 104 105 105 106 106 105a
T5(08 β-glucan) 104 104 105 105 105 106 106 105a
T6(1 β-glucan) 105 105 105 106 106 106 106 106a
Means 103a 103a 104a 104a 104a 105a 105a Means carrying same letters within a column or row do not differ significantly (P lt 001)
76
Table 410 Effect of treatments and storage intervals on the total soluble solids of stored β-glucan beverages
Storage Intervals (days) Treatments
0 15 30 45 60 75 90 Means
T1 (0 β-glucan) 951 954 960 968 975 986 994 970c
T2(02 β-glucan) 950 957 960 971 980 991 1003 973c
T3(04 β-glucan) 972 977 981 988 996 1004 1013 990bc
T4(06 β-glucan) 989 992 995 1006 1016 1026 1037 1009abc
T5(08 β-glucan) 1001 1005 1009 1017 1027 1039 1048 1021ab
T6(1 β-glucan) 1019 1026 1031 1042 1052 1060 1067 1042a
Means 980a 985a 989a 999a 1008a 1018a 1027a
Means carrying same letters within a column or row do not differ significantly (P lt 001)
77
solids (970ordmbrix) were yielded by the beverage of T1 (0 β -
glucan) I t is obvious from the results that total soluble solids of
beverages increased progressively by increasing the level of β -
glucan in beverage formulations
The total soluble sol ids in different beverage did not differ
signif icantly as a function of storage The total soluble solids in
the freshly prepared β -glucan beverages were found 980 ordmbrix
and total soluble solids 1027ordmbrix were recorded in the beverages
tested of the experiment (day 90) The present study is supported
by the f indings of Mugula et a l (2001) who explained that TSS
decreased in unpasteurized and pasteurized beverage prepared
from sorghum The f indings of present study are also in l ine with
the observations of Tiisekwa et a l (2000) In other study Akubor
(2003) also repoted similar results in melon-banana beverage
during ambient temperature storage
435 pH
The results regarding pH of different β -glucan supplemented
beverages presented in Table 411showed that pH of the
beverages was not affected by the treatments and interaction
between treatments and storage intervals The pH of different
beverage was signif icantly affected by the storage intervals
The results regarding pH of the beverages given in Table 412
indicated non signif icant changes in pH due to different levels of
β -glucan supplementation
78
Table 411 Mean sum of squares for pH acidity and ascorbic acid content of stored β-glucan beverages
SOV df pH Acidity Ascorbic acid
Treatments (T) 5 0014 0084 111646
Storage intervals (S) 6 0227 0008 2447942
T x S 30 0001NS 00001NS 13116NS
Error 84 0004 00002 30928
Highly Significant (Plt001) NS Non Significant Significant (Plt001)
79
Table 412 Effect of treatments and storage intervals on the pH of stored β-glucan beverages
Storage Intervals (days) Treatments
0 15 30 45 60 75 90 Means
T1 (0 β-glucan) 301 294 288 284 279 276 271 285a
T2(02 β-glucan) 297 291 285 280 274 271 268 281a
T3(04 β-glucan) 303 298 292 288 281 274 273 287a
T4(06 β-glucan) 303 296 293 287 283 276 274 287a
T5(08 β-glucan) 296 292 288 281 277 273 269 282a
T6(1 β-glucan) 305 301 288 284 281 273 265 285a
Means 301a 295ab 289bc 284cd 279cde 274de 270e
Means carrying same letters within a column or row do not differ significantly (P lt 001)
80
The results in Table 412 showed a signif icant effect of storage
intervals on the pH value of different beverages The pH value of
freshly prepared beverages (0 day) was found signif icantly higher
301 which decreased to 270 when beverages tested after (90
days) The pH values decreased signif icantly in al l the beverages
progressively throughout the storage period The results of the
present study with respect to storage studies are in concordance
with the f indings of (Miguel et a l 2004 and Falade et a l 2003) who
found a decreasing trend of pH in beverages during storage Ziena
(2000) reported a gradual decline in pH and showed a percent
decrease in pH values range from 11 to 87 in refrigerated and
freeze l ime juices samples High acid and low pH may be due to
production of acetic acid and lactic acid during storage Such
types of changes in pH vales have been demonstrated by (Souci et
a l 1987 Kaanane et a l 1988 Martin et a l 1995) The results are
in consistent with the f indings of Akubor (2003) who also
reported drop in pH with storage period in melon-banana
beverage
Fasoyiro et a l (2005) have founded a decrease in pH during
storage at 50C The Roselle beverage containing three different
fruits (orange apple and pineapple) was prepared They found
decrease in pH from 354 to 280 during two weeks storage at
refrigeration temperature The reduction in pH may be due to the
decomposit ion of fermentable polysaccharides i e β -glucan
sucrose and high fructose corn syrup which are present in
beverages This sl ight decrease in pH is a function of refrigeration
temperature storage which slows down the rate of growth of
microorganisms during entire period of cold storage
81
436 Acidity
The statistical results regarding acidity of beverages
prepared from different levels of β-glucan presented in Table 411
indicated that acidity of beverages was significantly affected by the
storage intervals however treatments and interaction between
storage treatments showed non significant effect on the acidity of
different beverages
The results in Table 413 further substantiated a non
significant effect due to different levels of β-glucan for different
beverages The acidity of different beverages differed significantly
which was found 160 in the fresh beverages The acidity was
increase linearly as the storage progressed which reaches 161 at
the end of experiment (three months) during storage period
Alessandra et al (2004) also reported similar results which
supports the present findings for increase in acidity during
storage The acidity increased significantly as a function of storage
of orange juice stored at 4 0C (137 g100g) and at 10 0C
(136g100g) after 4 and 3 weeks of storage respectively (Esteve et
al 2005)
During two weeks change in acidity was recorded from
190 to 225 in Roselle orange drink (Fasoyiro et al 2005) which
also supports the results of present study The gradual increase in
acidity was due to refrigeration temperature The decrease in pH
and increase in acidity during storage might be due to degradation
of sucrose high fructose corn syrup and β-glucan by the action of
microorganisms which causes production of acids in beverages
82
Table 413 Effect of treatments and storage intervals on the acidity of stored β-glucan beverages
Storage Intervals (days) Treatments
0 15 30 45 60 75 90 Means
T1 (0 β-glucan) 140 146 147 150 152 154 160 150a
T2(02 β-glucan) 139 144 144 147 153 156 157 149a
T3(04 β-glucan) 144 146 153 154 156 159 162 153a
T4(06 β-glucan) 143 145 153 151 155 160 163 153a
T5(08 β-glucan) 141 144 148 153 156 161 160 152a
T6(1 β-glucan) 144 145 150 154 158 160 162 153a
Means 142a 145b 149c 152d 155e 158f 161g
Means carrying same letters within a column or row do not differ significantly (P lt 001)
83
437 Ascorbic acid
The results regarding analysis of variance for ascorbic acid
content of different beverages prepared from different levels of β -
glucan have been presented in Table 411 The statist ical results
indicated that ascorbic acid content of different beverages was
affected signif icantly due to storage intervals but differed non
signif icantly due to treatments and interaction between
treatments and storage intervals
The results in Table 412 showed non signif icant change in
ascorbic acid content due to incorporation of β -glucan
The ascorbic acid content was found higher a (29406 mgkg)
in fresh beverage which declined signif icantly to 27933 mgkg
and 26211 mgkg after 45 and 90 days storage of beverages
respectively I t is also evident from results that ascorbic acid
content of beverages decreased consistently as storage period
increased
The f indings of the present study is in l ine with the work
reported by different researchers Crandall et a l (1987) and Maria
et a l (2003) who observed a signif icant loss of ascorbic acid (25 to
26) during storage In the present study the ascorbic acid
content decreased with the increase in storage periods This
decrease might be due to the factors such as storage temperature
oxidative enzymes processing techniques metal contamination
and the presence of atmospheric oxygen in the head space
Kabasakalis et a l (2000) studied the ascorbic acid content of
commercial fruit juices and observed that the loss of ascorbic acid
84
Table 414 Effect of treatments and storage intervals on the ascorbic acid contents of stored β-glucan beverages
Storage Intervals (days) Treatments
0 15 30 45 60 75 90 Means
T1 (0 β-glucan) 29333 29033 28333 28067 27667 27067 26400 27986
T2(02 β-glucan) 29733 29133 28300 27900 27133 26333 25767 27757
T3(04 β-glucan) 29167 28733 28600 28100 27133 26767 26100 27800
T4(06 β-glucan) 29300 28867 28267 27367 27167 26400 25900 27610
T5(08 β-glucan) 29600 29400 28967 28300 27500 27300 26867 28276
T6(1 β-glucan) 29300 28767 28300 27867 27400 26900 26233 27824
Means 29406a 28989ab 28461bc 27933cd 27333de 26794ef 26211f
Means carrying same letters within a column or row do not differ significantly (P lt 001)
85
was 29-41 in commercial fruit juices stored in closed container
at room temperature for 4 months Similar results reported by
Otta (1984) who described gradual decrease in ascorbic acid at
refrigeration temperature due to prolong storage Since in the
present study the beverages were stored at refrigeration
temperature therefore the loss in ascorbic acid is in conformity
with the results of Otta (1984)
86
438 Reducing Sugars
The statistical results regarding reducing sugars of beverages
presented in Table 415 indicated that the reducing sugars of
beverages were affected significantly by the storage intervals
However the treatments and the interaction between treatments
and storage intervals showed non significant effect on the reducing
sugars of different beverages
The results for the reducing sugars of beverages prepared
from different treatments of β-glucan are presented in Table 416
which indicated that reducing sugars of beverages did not differed
significantly due to the incorporation of β-glucan in different
beverages
The reducing sugars it increased significantly from 372 to
431 during 0 to 90 days of storage respectively (Table 416) In
fresh beverage samples the reducing sugar content was found 372
mg which increased to 402 and 431 mg after 45 and 90 days of
storage respectively The results showed that reducing sugar
contents of beverage increased slowly in the first 15 days of
storage but increased consistently and rapidly as the storage
period increased indicating more production of reducing sugars in
the beverage samples in the later stages of storage periods
Babsky et al (1986) studied storage effect on the composition
of clarif ied apple juice concentrate and reported that reducing
sugars increased from 0286 to 0329 moles per 100 grams and
sucrose decreased from 0039 to 0015 moles per 100 grams after
111 days of storage The reducing sugars were formed by the
inversion of sucrose hydrolysis effect of temperature as described
87
Table 415 Mean sum of squares for reducing non reducing and total sugar content of stored β-glucan beverages
SOV df Reducing Sugars Non Reducing Sugars Total sugars
Treatments (T) 5 00092NS 0004NS 00087265NS
Storage intervals (S) 6 0837 0357 01086119 NS
T x S 30 0001NS 0001NS 8954e-4 NS
Error 84 0003 0004 01528365
Highly Significant (Plt001) NS Non Significant
88
Table 416 Effect of treatments and storage intervals on the reducing sugars of stored β-glucan beverages
Storage Intervals (days) Treatments
0 15 30 45 60 75 90 Means
T1 (0 β-glucan) 371 380 391 402 412 421 431 401
T2(02 β-glucan) 373 383 390 400 409 419 427 400
T3(04 β-glucan) 371 379 389 402 413 421 434 401
T4(06 β-glucan) 368 380 392 402 414 424 432 402
T5(08 β-glucan) 375 382 394 408 417 427 435 405
T6(1 β-glucan) 372 382 389 400 409 417 427 399
Means 372f 381ef 391de 402cd 412bc 422ab 431a
Means carrying same letters within a column or row do not differ significantly (P lt 001)
89
by Ranote and Bains (1982) and Stein et al (1986) Increases in
total sugars have also been observed by Godara and Pareek (1985)
in date palm juice during storage at room temperature
The increase in reducing sugars have also been reported by a
number of research workers and the reason shown to increase in
this parameter has been due to conversion of non reducing sugars
to reducing sugars with the increased storage duration as reported
by Purthi et al (1984) He also reported an increase in reducing
sugars from 136 to 238 per cent and a decrease in non-reducing
sugars from 296 to 230 per cent at room temperature during
storage in juices of four commercial varieties of malta and orange
The results are in close confirmatory with the finding of (Fuleki et
al 1994) who also reported increases in fructose from 412 to 676
and glucose from 070 to 227 in fruit juices during storage
439 Non Reducing Sugars
Non reducing sugars of beverages stored for a period of
three months was not affected significantly by the treatments
(Table 415) The storage intervals showed significantly effect on
non reducing sugars of different beverages The interaction
between treatments and storage intervals possessed non significant
effect on non reducing sugars of different beverages
The contents of non reducing sugars of different beverages
were not significantly changed due to incorporation of different
levels of β-glucan
The results in Table 417 revealed that non reducing sugars
decreased significantly as a function of storage The non reducing
sugars were found significantly the highest content (514) in fresh
90
Table 417 Effect of treatments and storage intervals on the non reducing sugars of stored β-glucan beverages
Storage Intervals (days) Treatments
0 15 30 45 60 75 90 Means
T1 (0 β-glucan) 514 508 501 493 487 481 476 494a
T2(02 β-glucan) 515 509 504 497 490 483 478 497a
T3(04 β-glucan) 513 507 501 494 487 482 475 494a
T4(06 β-glucan) 517 511 503 496 490 482 477 497a
T5(08 β-glucan) 512 507 501 493 486 480 474 493a
T6(1 β-glucan) 513 506 502 493 486 481 476 494a
Means 514a 508ab 502bc 495cd 488de 482ef 476f
Means carrying same letters within a column or row do not differ significantly (P lt 001)
91
beverages which reduced to 495 and 476 after 45 and 90 days of
storage respectively
The f indings of the present study are well supported by
Singh et a l (2007) who found that with increase in storage t ime
non-reducing sugars decreased The results are also in l ine with
the f indings of Chowdhury et a l (2008) who studied the six
months storage effect on the shelf l i fe of mixed juice and
signif icant decrease in non reducing sugars due to breakdown of
non reducing sugars (sucrose) with the reaction of acids
4310 Total Sugars
The analysis of variance regarding total sugars of beverages
showed that total sugars were non signif icantly affected due to
treatments and storage intervals as well as the interaction
between treatments and storage intervals (Table 415)
The results for total sugars of different beverages
presented in Table 418 substantiated that the total sugars content
in al l the treatments fel l stat ist ical ly the same group and total
sugars remained unchanged by the incorporat ion of β -glucan in
the beverages The total sugar content of β -glucan supplemented
beverages s tored for a period of 3 months indicated a lso showed
non s ignif icant var iat ion between the freshly prepared β -g lucan
beverages and beverages evaluated af ter 90 days of s torage
studies The results are wel l in agreement with the observations
92
Table 418 Effect of treatments and storage intervals on the total sugars of stored β-glucan beverages
Storage Intervals (days) Treatments
0 15 30 45 60 75 90 Means
T1 (0 β-glucan) 885 888 892 895 899 902 907 895a
T2(02 β-glucan) 888 892 894 897 899 902 905 897a
T3(04 β-glucan) 884 886 890 896 900 903 909 895a
T4(06 β-glucan) 885 891 895 898 904 906 909 898a
T5(08 β-glucan) 887 889 895 901 903 907 909 899a
T6(1 β-glucan) 885 888 891 893 895 898 903 893a
Means 886a 889a 893a 897a 900a 903a 907a
Means carrying same letters within a column or row do not differ significantly (P lt 001)
93
of Chowdhury et a l (2008) who reported non signif icant increase
in total sugars up to six months storage at 28 0C in juices
4 4 Total Plate Count (TPC) of the beverage samples
The results in Table 419 indicated that storage intervals
showed decline in total plate count (TPC) of β -glucan beverage
The TPC value of freshly prepared beverage (0 day) was higher
129 times 104 - 4 46 times 104 which decreased to 117 times 104 - 4 32 times 104 at
the end of the experimental study (90 day) Similar counts of TPC
have been reported for some juices and drinks in Egypt (Daw et a l
1994) These results are also in agreement with those of Hancioglu
amp Karapiner (1997) reported for Turkish boza beverages The
contamination by these microorganisms in the beverages could
have occurred during processing and packaging as most of the
people involved in the production and packaging do not take
necessary precautions Contamination of food items may largely
be due to the presence of these organisms and their entrance into
the food or beverage as a result of poor hygiene and sanitation
conditions (Bibek 2001)
The results indicated that the TPC values decreased in al l
the beverages containing throughout the storage period The
results of the present study with respect to storage period are in
consistent with the f indings of other researchers who reported
similar results for some tradit ional beverages and drinks (Daw et
a l 1994) The TPC values decrease gradually during storage
intervals are this might be due to
94
Table 419 Effect of treatments and storage intervals on the total plate count (CFUml) of stored β-glucan beverages
Storage intervals (days) Treatments
0 15 30 45 60 75 90
T1 (0 β-glucan) 187 x 104 187 x 104 184 x 104 179 x 104 172 x 104 169 x 104 166 x 104
T2(02 β-glucan) 252 x 104 247 x 104 247x 104 239 x 104 239 x 104 233 x 104 233 x 104
T3(04 β-glucan) 366 x 104 363 x 104 360 x 104 357 x 104 357 x 104 352 x 104 348 x 104
T4(06 β-glucan) 318 x 104 316 x 104 315 x 104 315 x 104 312 x 104 310 x 104 308 x 104
T5(08 β-glucan) 446 x 104 443 x 104 442 x 104 441 x 104 439 x 104 439 x 104 432 x 104
T6(1 β-glucan) 129 x 104 129 x 104 125 x 104 123 x 104 119 x 104 119 x 104 117 x 104
95
increase in acidity which may cause a concomitant decrease in pH
value which may help to decrease TPC in the beverages (Kaanane
et a l 1988 Martin et a l 1995) The total bacterial counts obtained
in this study fal l between 10 x 102 - 1 0 x 105 CFUml which fal l
within the range of earl ier works done by Hatcher et a l (1992)
45 Sensory evaluation of β -glucan beverages
451 Color
The analysis of variance pertaining to the color scores
assigned to different treatments of beverages by the panelist
indicated that color of beverages differed signif icantly due to the
treatments and storage intervals (Table 420) However the
interaction between treatment and storage intervals showed non
signif icant effect on this sensory attribute
The scores assigned to the color of different beverages
prepared by incorporation of β -glucan presented in Table 421
revealed that the beverage prepared by the incorporation of 0 2
β -glucan got signif icantly the highest color scores (684) fol lowed
by the control beverage (02 pectin) The panelists assigned the
lowest scores (494) to the color of T6 beverage (10 β -glucan) I t
is evident from the results (Table 421) that the beverages of
treatments T1 (control) T2 (02 β -glucan) T3 (04 β -glucan)
and T4 (06 β -glucan) fel l stat ist ical ly in the same group with
respect to color scores The results also indicated non signif icant
differences in color scores between beverages T5 (08 β -glucan)
and T6 (10 β -glucan) The beverages containing β -glucan level
up to 06 remained acceptable by the panelists however further
96
Table 420 Mean sum of squares for sensory evaluation of stored β-glucan beverages
SOV df Color Flavor Sweetness Sourness Overall acceptability
Treatments (T) 5 24686 18760 18873 9970 34811
Storage intervals (S) 6 13933 27297 59231 22338 62242
T x S 30 0526NS 0283NS 0169NS 0987NS 0125NS
Error 108 0436 0383 0388 1936 0626
Highly Significant (Plt001)
NS Non Significant
97
Table 421 Effect of treatments and storage intervals on the color score of stored β-glucan beverages
Storage Intervals (days) Treatments
0 15 30 45 60 75 90 Means
T1 (0 β-glucan) 74 72 70 68 68 60 52 663a
T2(02 β-glucan) 80 74 72 68 66 62 56 683a
T3(04 β-glucan) 78 72 70 70 68 54 48 657a
T4(06 β-glucan) 72 66 64 60 56 54 50 603a
T5(08 β-glucan) 58 52 50 46 50 48 46 500b
T6(1 β-glucan) 54 54 52 50 48 46 42 494b
Means 693a 650ab 630ab 603bc 593bc 540cd 490d
Means carrying same letters within a column or row do not differ significantly (P lt 001)
98
increase in the β -glucan level in beverages resulted decrease in
assigning scores to color I t is obvious that freshly prepared β -
glucan beverage got maximum scores for color (693) which
reduced to 490 scores when evaluated at the end of the
experiment (90 days) The results showed that the panelists l iked
more the color of fresh beverages and this l iking reduced of
beverages stored (Table 421)
Colour of any food product is an important criterion for the
acceptabil i ty of any food product I t is one of the characterist ics
perceived by the senses and a mean for the rapid identif ication
and ult imately governs the acceptance or re jection of the food
product The results obtained in the present study for color score
are in l ine with the f indings of Anjum et a l (2006) who observed
signif icant effect (p lt 0001) on color parameters during different
storage conditions Thus the beverages of different treatments got
signif icant variation in gett ing score for their color yet the score
assigned to the color after 90 days under refrigerated storage
remained acceptable The change in color parameter may be due to
the mail lard reaction between reducing sugars and amino acids
(Gonzalez amp Leeson 2000) The results are in close agreement
with the f indings of Granzer (1982) who also reported similar
results for color of beverages at different storage periods
99
452 Flavor
The statist ical results for the scores assigned to f lavor of
beverages prepared from different β -glucan levels indicated that
f lavor score varied signif icantly due to differences (β -glucan
levels) in treatments as well as storage intervals (Table 420) The
interaction between treatments and storage intervals showed non
signif icant effect on the scores given to f lavor of different
beverage
The panelists assigned the signif icantly highest scores to the
f lavour of beverages containing 04 β -glucan (T3) (Table 422)
However the beverage treatment T6 (10 β -glucan) was ranked
at the bottom for f lavor scores (586) by the panelists The
beverages containing 06 β -glucan and control (T1) got
statist ical ly similar scores for f lavour The beverages containing
more than 06 β -glucan got lower scores for f lavor
The effect of storage on the f lavor of beverages stored for a
period of three months showed that there was signif icant decrease
in assigning the scores to the f lavour beverages as a function of
storage The fresh beverages got signif icantly the highest scores
(833) while the beverages tested after 90 days storage got the
lowest score (510) by the panelists I t is evident from the results
(Table 422) that scores assigned to f lavor of beverages decreased
as storage progressed three months
A decrease in the scores assigned to f lavor of different
beverages may be attr ibuted to the increase in acidity of beverage
which noticed during storage as reported in the earl ier section
This increase in acidity may enhance the sourness and wil l
100
Table 422 Effect of treatments and storage intervals on the flavor score of stored β-glucan beverages
Storage Intervals (days) Treatments
0 15 30 45 60 75 90 Means
T1 86 82 76 74 74 62 56 729ab
T2 86 84 78 74 72 66 56 737ab
T3 92 86 80 72 74 64 60 754a
T4 80 76 68 62 64 60 52 660bc
T5 70 68 64 58 58 56 46 600c
T6 72 66 60 54 56 52 50 586c
Means 810a 770ab 710bc 657cd 663cd 600de 533e
Means carrying same letters within a column or row do not differ significantly (P lt 001)
101
depress the f lavor of beverage with the passage of t ime during
storage
A gradual decrease in f lavor during storage may also be due
to degradation of f lavour due to storage of product at refrigerator
temperature and due to heat treatment applied during processing
and such reasons for decrease in f lavor have been reported by
Pruthi et a l (1981) Hassan (1976) The change in f lavour as a
function of storage may be due to the degradation of ascorbic acid
and furfural production (Shimoda amp Osaj ima 1981 Perez amp Sanz
2001)
The productrsquos physico-chemical changes may alter f lavor
during storage The present study is well supported by the results
of Anjum et a l (2004) who described that effect of process heat
treatment and storage temperature are well correlated with the
production of off f lavoring compounds due to browning reaction
and furfural production
453 Sweetness
The scores assigned to sweetness of different beverages
differed signif icantly among treatments and storage intervals
(Table 420) However the interaction between treatments and
storage intervals showed non signif icant effect on this sensory
attr ibute
The scores assigned to sweetness of different beverages in
Table 423 revealed that the control beverage containing 02
pectin got the highest scores for sweetness (674) fol lowed the
beverage 02 β -glucan The beveraged of T6 containing 10 β -
102
glucan got the lowest scores (503) for sweetness The beverage T1
(control) and T2 (02 β -glucan) were place statist ical ly at same
level for scores given to sweetness Non signif icant differences
existed for sweetness score between beverages of T5 (08 β -
glucan) and T6 (10 β -glucan) The results also demonstrated
that the beverages containing β -glucan up to 06 got acceptable
scores however further increase in addition of β -glucan levels in
the beverages got lower scores by the panelists
The results also indicated that fresh beverages got higher
scores (700) which were reduced to 570 scores when evaluated
after 45 days of storage and to 507 scores tested after 90 days of
storage The results of the present study showed that as the
storage t ime increase the sweetness score decreasedThese
observations are well supported by the f indings of Esteve et a l
(2005) and Fasoyiro et a l (2005) who found that during storage
period pH decreases and acidity increases of juices and drinks
due to the degradation of carbohydrates by the action of
microorganisms
103
Table 423 Effect of treatments and storage intervals on the sweetness score of stored β-glucan beverages
Storage Intervals (days) Treatments
0 15 30 45 60 75 90 Means
T1 (0 β-glucan) 80 78 72 66 60 60 56 674a
T2(02 β-glucan) 80 74 70 68 60 58 58 669a
T3(04 β-glucan) 72 70 62 58 56 60 54 617ab
T4(06 β-glucan) 68 66 60 54 56 58 50 589b
T5(08 β-glucan) 58 56 50 46 50 52 46 511c
T6(1 β-glucan) 62 56 54 50 50 40 40 503c
Means 700a 667ab 613bc 570cd 553cd 547cd 507d
Means carrying same letters within a column or row do not differ significantly (P lt 001)
104
454 Sourness
The statist ical results for the scores given to sourness of
beverages prepared by different levels of β -glucan (Table 420)
indicated that sourness scores varied signif icantly due to
differences in treatments as well as storage intervals The
interaction between treatments and storage intervals showed non
signif icant effect on the scores given to sourness of different
beverages
The scores assigned to the sourness of different beverages
given in Table 424 revealed that the highest scores (643) were
given to beverages of control treatment (T1) fol lowed by beverage
of T2 (02 β -glucan) but non signif icant differences existed
between these two beverages The beverage of treatment T6 (10
β -glucan) got the lowest scores (511) for sourness The beverage
containing 06 β -glucan and control beverage got statist ical ly
similar scores The incorporation of β -glucan more than 06
showed a declining trend in gett ing the scores for the sourness
The fresh beverages got the highest scores (697) for
sourness while the beverages tested at the expiry of study i e 90
days of storage got the s ignif icantly lowest scores for sourness
(460) I t is evident from the results (Table 424) that scores given
to sourness of beverages decreased l inearly throughout the
storage period of three months
The present study indicated that control beverage was
sl ightly sourer than the beverages containing different level of β -
glucan but the differences in scores (pectin) of sourness were not
105
Table 424 Effect of treatments and storage intervals on the sourness score of stored β-glucan beverages
Storage Intervals (days) Treatments
0 15 30 45 60 75 90 Means
T1 (0 β-glucan) 74 72 70 66 64 56 48 643a
T2(02 β-glucan) 72 70 70 66 64 56 50 640a
T3(04 β-glucan) 76 72 72 68 62 50 46 637a
T4(06 β-glucan) 70 68 68 64 60 54 46 614a
T5(08 β-glucan) 64 62 58 56 50 50 46 551b
T6(1 β-glucan) 62 58 56 52 40 50 40 511b
Means 697a 670a 657a 620ab 567ab 527ab 460b
Means carrying same letters within a column or row do not differ significantly (P lt 001)
106
s ignif icant with beverages containing up to 06 β-glucan This
indicated that β -glucan does not contribute to beverage sourness
intensity However there was a sl ight decl ine in sourness
intensity in the beverage with β -glucan beyond 06 Bensema
(2000) who also observed that addition of β -glucan may contribute
towards sl ight alkaline environment which reduces the sourness
The results of the present study are also in agreement with the
f indings of Pangborn et a l (1973) who showed that sourness
declined by increasing the hydrocolloid concentration in the
beverages The sensory evaluation of beverages regarding
sourness with storage got lower scores The decrease in pH may
cause increase in acidity as a function of storage which made the
beverage sourer The results obtained from the present study are
in l ine with the f indings of Fasoyiro et a l (2005) and Akubor
(2003) who recorded sl ight increase in acidity during refrigeration
storage of Roselle orange drink An increase in acidity resulted in
sourness in beverages
455 Overall Acceptability
The statist ical results for the score given to overall
acceptabil i ty of beverages (Table 420) indicated that treatments
and storage intervals s ignif icantly affected the overall
acceptabil i ty scores The interaction between treatments and
storage intervals were found non signif icant for overall
acceptabil i ty scores
The beverage prepared from the control treatment (T2) got
the highest overall acceptibi l i ty scores (731) fol lowed by
107
beverage of T1 (02 pectin) but both these beverages possessed
non signif icant differences for overall acceptibi l i ty scores The
beverages of T3 (04 β -glucan) and T4 (06 β -glucan) treatments
got statist ical ly overall acceptabil i ty scores The beverages of
treatments T5 (08 β -glucan) and T6 (1 β -glucan) got the lowest
scores (511) by the panelists for overall acceptabil i ty scores I t is
obvious from the results (Table 425) that overall acceptabil i ty
scores got by beverages containing up to 06 β -glucan
incorporation and control got stat ist ical ly similar scores The
beverages containing more than 06 β -glucan got lower scores
for overall acceptabil i ty
The scores for overall acceptabil i ty of beverages decreased
during storage The fresh beverages got the highest scores (737)
while the beverages tested after 90 days of storage got the lowest
overall acceptabil i ty scores
The β -glucan has been found to be stable within the acidic
environment of an orange-flavored beverage during processing
and refrigerated storage β -glucans abil i ty to increase viscosity
upon addition to water makes i t an excellent thickener for
beverage applications These characterist ics provided more appeal
to the panelists for making the decision about the overall
acceptabil i ty of beverages The results of the present study are in
l ine with the f indings of Renuka et a l (2009) who prepared fruit
juice beverages with fort i f ied fructo-oligosaccharide and noted
the quality characterist ics with six months storage period There
was negligible change in overall quality that ranges from 90 to
60 for different beverages at refrigeration temperature with
references to hedonic scale evaluation
108
Table 425 Effect of treatments and storage intervals on the overall acceptability score of stored β-glucan beverages
Storage Intervals (days) Treatments
0 15 30 45 60 75 90 Means
T1 (0 β-glucan) 84 84 80 72 72 62 54 726a
T2(02 β-glucan) 82 82 76 74 72 66 60 731a
T3(04 β-glucan) 80 80 74 70 70 62 54 700a
T4(06 β-glucan) 72 72 68 66 64 58 50 643a
T5(08 β-glucan) 62 62 60 54 54 44 40 537b
T6(1 β-glucan) 62 62 60 56 50 44 42 537b
Means 737a 737a 697ab 653abc 637bc 560cd 500d
Means carrying same letters within a column or row do not differ significantly (P lt 001)
109
Selection of best treatments
After sensory evaluation best treatments were selected for
further studies The beverages containing different levels of β -
glucan gett ing maximum scores by the judges during entire
storage period were selected Three best beverages were selected
for eff icacy study containing 02 0 4 and 06 β -glucan levels
along with control beverage containing 02 pectin as i t is
commonly used in beverages preparation
46 Efficacy studies of β -glucan beverages
461 Total cholesterol
The statist ical results regarding total serum cholesterol of
healthy subjects fed with various levels of β -glucan supplemented
beverages are presented in Table 426 The results indicated that
total serum cholesterol was signif icantly affected due to variation
in beverage formulations and study periods The interaction
between these both variables was found non signif icant for total
serum cholesterol
I t is obvious from the results given in Table 427 and
i l lustrated in Figure 41 that the highest concentration of total
cholesterol (13953 mgdl) was observed in the control group
which was fed on beverage prepared without any addition of β -
glucan The subject group fed on beverage containing 06 β -
glucan (D) possessed the lowest content of total cholesterol
(13230 mgdl) in serum of healthy subjects at the end of study I t
is evident from Figure 41 that there was signif icant and
progressive decline in the total serum cholesterol by increasing
110
Table 426 Mean sum of squares for blood lipid profile of volunteers
SOV df Total Cholesterol Triglycerides LDL HDL
Beverages (B) 3 107368 37570 55266 28197
Study Periods (S) 2 422014 398238 212944 63649
B x S 6 30566 12210 15847 7837
Error 24 0069 0031 0010 0012
Highly Significant (Plt001) NS Non Significant
111
210297
673
826
145
276
517456
0123456789
Decrease
Week2 Week3
Study Period
ABCD
210297
673
826
145
276
517456
0123456789
Decrease
Week2 Week4
Study Period
ABCD
Table 427 Effect of β-glucan supplemented beverage on serum total cholesterol
content (mgdl) of healthy subjects
Study Periods Beverage
Base Line Week-2 Week-4 Means
A 14220 13921 13719 13953a
B 14174 13753 13374 13767b
C 14198 13242 12557 13332c
D 14211 13037 12442 13230d
Means 14201a 13488b 13023c
Means carrying same letters within a column or row do not differ significantly (P lt 001)
Figure 41 decrease in the serum total cholesterol level of subjects fed on
different beverages A = Beverage supplemented with 0 β-glucan (control) B = Beverage supplemented with 02 β-glucan C = Beverage supplemented with 04 β-glucan D = Beverage supplemented with 06 β-glucan
112
137191337513246
12557
1422013921
14178
13757
141951421
12442
13035
115
120
125
130
135
140
145
Base Line Week-2 Week-4
Weeks
Tota
l Cho
lest
erol
(mg
dl)
A B C D
Figure 42 Effect of β-glucan beverage on Total Cholesterol (mgdl) content of
healthy volunteers A = Beverage supplemented with 0 β-glucan (control) B = Beverage supplemented with 02 β-glucan C = Beverage supplemented with 04 β-glucan D = Beverage supplemented with 06 β-glucan
113
the level of β-glucan in the beverage formulations There was a
decrease in total cholesterol content when the subjects were fed on
beverages C (04 β-glucan) and D (06 β-glucan) The results in
Figure 42 also showed that total cholesterol of healthy subjects
decreased at a faster rate during first two weeks as compared to the
last two weeks of the experimental study The highest decrease in
total cholesterol (826) content was observed in the group of
subjects fed on 06 β-glucan supplemented beverage (D) followed
by the group fed on beverage C (04 β-glucan) and the lowest
decrease in the serum cholesterol was observed in the group fed on
control beverage (0 β-glucan) both when tested at week 2 and
week 4 However Figure 42 also depicted that maximum decrease
in total cholesterol content was shown by the beverage C (04 β-
glucan) when subjects were tested after four weeks
A significant decrease in the total serum cholesterol of test
subjects was found in the present study which might be due to
different factors including the presence of β-glucan soluble dietary
fiber and tocopherol content of barley β-glucan supplemented in
beverage It is well documented that β-glucan has the ability to
reduce the blood serum total cholesterol content of different
subjects (Uusitupa et al 1992) β-glucan is a soluble dietary fiber
portion of barley and possess the ability to decrease the total
cholesterol Ornish et al (1998) have shown reduction in plasma
cholesterol concentrations due to contents of dietary fiber Brown et
al (1999) also reported that 1g of soluble fiber can lower total
cholesterol by about 0045mmolL It has been recommended by
FDA that at least 3 gday of β-glucan from barley should be
consumed to achieve a clinically relevant reduction in serum total
114
cholesterol concentrations (FDA 1996) Soluble dietary fibers may
increase the binding of bile acids in the intestinal lumen which
leads to a decreased enterohepatic circulation of bile acids and a
subsequent increase in the hepatic conversion of cholesterol to bile
acids (Bell et al 1999) Another suggested mechanism is that the
increased viscosity of the food mass in the small intestine because of
soluble fibers leads to the formation of a thick unstirred water layer
adjacent to the mucosa This layer may act as a physical barrier to
reduce the absorption of nutrients and bile acids (Beer et al 1995)
Thus these properties of β-glucan have shown a significant decline
in total cholesterol due to intake of different beverages containing
different levels of β-glucan
462 Triglycerides
The analysis of variance showed significant effect of
functional beverages and study periods on triglyceride content of
adult subjects (Table 426) The interaction between functional
beverages and study periods was found non significant for this
biochemical parameter
The results i l lustrated in Figure 44 and Table 428 indicated
the functional beverages showed different response towards level
of serum triglycerides in different adult groups I t is evident from
Figure 44 that level of serum triglyceride was higher in the
subject group fed on control beverage (0 β -glucan) while the
level of tr iglyceride content was recorded maximum in the group
fed on beverage D (06 β -glucan)It is also obvious from Figure
43 that
115
369 447
10431099
497
672767 757
0
2
4
6
8
10
12
Decrease
Week2 Week4
Study Period
ABCD
369 447
10431099
497
672767 757
0
2
4
6
8
10
12
Decrease
Week2 Week4
Study Period
ABCD
369 447
10431099
497
672767 757
0
2
4
6
8
10
12
Decrease
Week2 Week4
Study Period
ABCD
369 447
10431099
497
672767 757
0
2
4
6
8
10
12
Decrease
Week2 Week4
Study Period
ABCD
Table 428 Effect of β-glucan supplemented beverage on serum Triglycerides content (mgdl) of healthy subjects
Study Periods Beverage
Base Line Week-2 Week-4 Means
A 8668 8348 7933 8316a
B 8547 8165 7616 8109b
C 8747 7835 7234 7939c
D 8611 7665 7085 7854d
Means 8643a 8028b 7492c
Means carrying same letters within a column or row do not differ significantly (P lt 001)
Figure 43 decrease in the serum triglycerides level of subjects fed on different
beverages
A = Beverage supplemented with 0 β-glucan (control) B = Beverage supplemented with 02 β-glucan C = Beverage supplemented with 04 β-glucan D = Beverage supplemented with 06 β-glucan
116
79337616
7234
8668
83488547
81657835
87478611
7765
7185
60
65
70
75
80
85
90
Base Line Week-2 Week-4
Weeks
Trig
lyce
ride
s (m
gdl
)
A B C D
Figure 44 Effect of β-glucan beverage on Triglyceride (mgdl) content of healthy
volunteers A = Beverage supplemented with 0 β-glucan (control) B = Beverage supplemented with 02 β-glucan C = Beverage supplemented with 04 β-glucan D = Beverage supplemented with 06 β-glucan
117
reduction in the tr iglyceride contents increased by increasing the
level of β -glucan in different the beverages
The tr iglyceride content of subjects fed on different
functional beverages decreased at higher rate during the
beginning of days of the experiment There was maximum
decrease in tr iglyceride content (1099) in subject group fed on
the beverage D (06 β -glucan) when tested after week-2 while
the lowest decrease in tr iglycerides was recorded in the group fed
on beverage A (control) The rate of reduction in tr iglyceride
content was at a lower rate after 2 weeks of storage study The
beverage C (04 β -glucan) showed more pronounced effect on the
content of tr iglycerides during the last fortnight of the experiment
as compared to al l other beverages
The results regarding triglyceride contents presented in Table
428 indicated the tr iglyceride content of healthy subjects differed
signif icantly as a function of storage
The results of the present study are in agreement with the
f indings of Delaney et a l (2003a) who found a decrease in serum
triglyceride content of rats as compared to control by
administration of β -glucan in the feed The study demonstrated
that tr iglyceride content reduced progressively as the level of β -
glucan increased in the beverage and the highest reduction was
achieved by the supplementation of 0 6 β -glucan in the beverage
formulation The decrease in tr iglyceride content may be
attributed to the level of β -glucan content has the abil i ty to
reduce tr iglyceride content
118
I t is evident from the previous studies that the level of
tr iglyceride content reduced by the β -glucan incorporation in
different food products Biorklund et a l (2005) observed changes
in serum lipids and reported a total reduction of 0 14mmoll with
a diet containing 5g β -glucan from oat for a period of f ive weeks
study Similar decrease in tr iglycerides has been reported
observed by Naumann et a l (2006) who incorporated β -glucan in
to fruit drink and found a total 1 26 decrease in subjects of β -
glucan group for a period of f ives weeks I t may be concluded
from the present study that by intake of β -glucan in beverage
formulation can help to reduce the tr iglycerides content in human
subjects to a signif icant level
463 Low Density Lipoproteins (LDL)
The statist ical results regarding LDL content of adult subjects
fed on beverages supplemented with various levels of β -glucan
are shown in Table 426 The results indicated that LDL was
affected signif icantly by the variation in beverage formulations as
well as study periods The interaction between beverages and
study periods was found to be non signif icant for LDL content of
different subjects
The highest concentration of LDL (5202 mgdl) was
recorded in the subject group fed on beverage (control) without
addition of β -glucan (Table 429 and Fig 4 6) The subject group
fed on
119
433
754
14871657
111
419
769 743
02468
1012141618
Decrease
Week2 Week4
Study Period
ABCD
Table 429 Effect of β-glucan supplemented beverage on serum LDL content (mgdl) of healthy subjects
Study Periods Beverage
Base Line Week-2 Week-4 Means
A 5376 5143 5086 5202a
B 5345 4942 4735 5007b
C 5365 4567 4216 4716c
D 5388 4495 4161 4681d
Means 5368a 4787b 4550c
Means carrying same letters within a column or row do not differ significantly (P lt 001)
Figure 45 decrease in the serum LDL level of subjects fed on different beverages
A = Beverage supplemented with 0 β-glucan (control) B = Beverage supplemented with 02 β-glucan C = Beverage supplemented with 04 β-glucan D = Beverage supplemented with 06 β-glucan
120
50864735
4216
537651435345
49424567
53655388
41614495
30
35
40
45
50
55
60
Base Line Week-2 Week-4
Weeks
LDL
(mg
dl)
A B C D
Figure 46 Effect of β-glucan beverage on LDL (mgdl) content of healthy
volunteers A = Beverage supplemented with 0 β-glucan (control) B = Beverage supplemented with 02 β-glucan C = Beverage supplemented with 04 β-glucan D = Beverage supplemented with 06 β-glucan
121
beverage containing 06 β -glucan (D) exhibited the lowest
content of LDL (4681 mgdl) in serum of adult subjects I t is
evident from Figure 46 that concentration of LDL decreased
progressively by increasing the level of β -glucan in the beverages
The level of LDL content decl ined at a faster rate in case of
beverages C (04 β -glucan) and D (06 β -glucan) as compared
to control beverages (0 β -glucan) The LDL concentration
decreased at higher rate during f irst two weeks as compared to
the last two weeks of the experimental study I t is also evident
from Figure 45 that at the end of two weeks of study period the
highest decrease in LDL (1082) content was observed in the
subjects group when the data for beverages pooled
The decrease in LDL content was recorded at faster rate during
1s t two weeks of study The beverage showed maximum response
towards decrease LDL content in the beginning of the study as
compared to the last weeks of the study period (Figure 46)
Braaten et a l (1994) have reported 10 decrease in LDL
cholesterol concentrations in hypercholesterolemic men and
women who consumed daily for 4 weeks 72 g of oat gum
containing 58 g of β -glucan mixed with a noncarbonated drink or
with water Kahlon and Chow (1997) also found similar results in
hyperl ipidaemic subjects fed on oat water-soluble gum These
f indings are well in support of the present results in which a
decrease in LDL level by the intake of β -glucan in the functional
beverage formulations
122
464 High Density Lipoproteins (HDL)
The analysis of variance regarding serum HDL level of adult
subjects showed signif icant effect of beverages and study periods
on HDL content (Table 426) The interaction between beverages
and study periods was observed to be non signif icant for this HDL
content of serum
The results i l lustrated in Figure 48 and Table 430 showed a
variable response by different functional beverages towards level
of HDL in different groups of people The serum HDL content was
recorded higher in the subjects fed on D beverage (06 β -glucan)
while the lowest HDL content was recorded in the group fed on
control beverage (0 β -glucan) (Fig48) I t is also evident from
Figure 47 that higher increase in level of tr iglyceride was
observed by the increasing level of β -glucan in the formulation of
different beverages
The HDL content increased at a faster rate during f irst two
weeks while the rate of increase was less at the end of the
experimental study The highest increase in the HDL content was
observed in the group fed on the beverage D (06 β -glucan) when
tested at the end of week 2 while the lowest increase was
observed in the group consuming control beverage The increase
in HDL content of test subjects was lower after fol lowing f irst two
weeks of study
123
Week2Week4
135
532
9931069
005025034 0310
123456789
1011
In
crea
se
Study Period
ABCD
Table 430 Effect of β-glucan supplemented beverage on serum HDL content (mgdl) of healthy subjects
Study Periods Beverage
Base Line Week-2 Week-4 Means
A 6237 6321 6324 6261d
B 6184 6513 6529 6398c
C 6206 6822 6845 6608b
D 6214 6878 6899 6632a
Means 6210c 6634a 6580b
Means carrying same letters within a column or row do not differ significantly (P lt 001)
Figure 47 increase in the serum HDL level of subjects fed on different beverages
A = Beverage supplemented with 0 β-glucan (control) B = Beverage supplemented with 02 β-glucan C = Beverage supplemented with 04 β-glucan D = Beverage supplemented with 06 β-glucan
124
62246184
6497
6237 6321
65136206
67956822 6803
6214
6878
58
60
62
64
66
68
70
Base Line Week-2 Week-4
Weeks
HDL
(mg
dl)
A B C D
Figure 48 Effect of β-glucan beverage on HDL (mgdl) content of healthy
volunteers A = Beverage supplemented with 0 β-glucan (control) B = Beverage supplemented with 02 β-glucan C = Beverage supplemented with 04 β-glucan D = Beverage supplemented with 06 β-glucan
125
The study period showed a signif icant effect on the HDL
content of test subjects The maximum increase in HDL was
observed in the f irst f i f teen days (two week) while the lower
response was observed following the next f i f teen days upto the
expiry of the experiment (Table 430) The results of the present
study are well supported by Kalra and Jood (2000) who observed a
higher HDL content of rats with the consumption of barley β -
glucan gum as compared to control group of rats The results from
such type of studies demonstrated that every 1 rise in HDL by
the uti l ization of medicine there is a 3 reduction chance in
coronary heart diseases (Frick et a l 1987) The results of the
present study are also in l ine with the f indings of Naumann et a l
(2006) who incorporated β -glucan into fruit drink and observed
274 percent increase in HDL during f ive weeks study period in
human subjects They suggested that in order to overcome and
reduce cardiovascular diseases i t is better to use β-glucan in our
daily diet because low HDL heightened risk for heart disease The
results of the present study showed that intake of β -glucan in
beverage signif icantly reduced serum cholesterol and LDL while
signif icantly increased HDL level This study demonstrates that
beverage containing β-glucan can help to reduce risk of coronary
heart disease
465 Blood Glucose concentarion
The statist ical results regarding blood glucose level of adult
volunteers showed signif icant effect of β -glucan treatment
feeding intervals and study periods on blood glucose level (Table
432) The interactive effect of intervals and treatments also
126
possessed signif icant effect on the blood glucose of adult
volunteers subjects All interactions among these three variables
were found to be non signif icant for blood glucose level
The results presented in Table 433 showed different
response towards level of blood glucose by different beverages I t
is evident from the results (Table 432) that higher blood glucose
level (10017 mgdl) was observed in the adults fed on control
beverage i e A (0 β -glucan) fol lowed by beverage B (02 β -
glucan) The lowest blood glucose content (9755 mgdl) was
recorded in the group fed with D beverage (06 β -glucan) i t is
also obvious from the results shown in Figure 49 that higher
reduction in blood glucose level of adult subjects was observed by
increasing the level of β -glucan in the beverage formulation The
level of blood glucose increased in al l beverages t i l l f irst hour of
study and then started declining after one hour The results
indicated (Table 433) that rate of reduction in the concentration
of blood glucose was signif icantly different among different
beverages The adult subjects fed on beverages D (06 β -glucan
beverage) showed higher reduction in blood glucose level than
groups fed on al l other treatments The blood glucose level of the
adults fed with beverage D reduced from 9339 mgdl to 8135
mgdl from 0 to 60 minutes of the study
The blood glucose level varied signif icantly during different
study periods I t is evident from Table 432 that blood glucose
was found the highest (9510 mgdl) at the beginning of the study
(0 day) when the data for beverage and study period were pooled
but i t reduced signif icantly from 9324 mgdl to 9192 mgdl
127
Table 431 Mean sum of squares for blood glucose contents of volunteers SOV df MSS Intervals (A) 5 12929373 Diets (B) 3 19069863 Days (C) 2 17178671 A x B 15 94341233 A x C 10 26435555NS B x C 6 15218384 NS A x B x C 30 13125518 NS Error 144 18758931 Total 215
Table 432 Effect of β-glucan beverage on blood glucose (mgdl)content
with different time intervals Beverage Days 0 Min 30 Min 60 Min 90 Min 120 Min 180 Min
day0 8533 10132 11045 10875 10533 10141 day15 8401 9813 10833 10629 10348 9841
A day30 8246 9927 10637 10426 10217 9725
day0 8499 9862 10662 10330 10034 9430 day15 8360 9860 10432 10020 9730 9355 B
day30 8219 9823 10414 9766 9650 9212 day0 8518 9220 9643 9445 9149 8445
day15 8363 9273 9520 9336 8880 8319 C day30 8250 9026 9461 9242 8727 8267
day0 8520 9202 9502 9288 8977 8261 day15 8374 9051 9319 8846 8732 8152 D day30 8215 8921 9212 8684 8350 7993
Table 433 Interactive effect of diets and time scale intervals on the blood glucose
contents (mgdl) of volunteers Time scale intervals Beverage 0 Min 30 Min 60 Min 90 Min 120 Min 180 Min Means
A 8393 9957 10838 10643 10366 9903 10017a B 8359 9848 10503 10039 9805 9333 9648b C 8377 9173 9541 9341 8919 8344 8949c D 8370 9058 9344 8939 8686 8135 8755d
Means 8375e 9509c 10057a 9741b 9444c 8929d 0 Min = fasting
128
Effect of different beverages on the blood glucose level of subjects
60
70
80
90
100
110
120
0 Min 30 Min 60 Min 90 Min 120 Min 180 Min
Time (Minutes)
mg
dl
Diet A
Diet B
Diet C
Diet D
Figure 49 Effect of β-glucan beverage on blood glucose (mgdl) content of
healthy volunteers Table 434 Interactive effect of diets and study duration on the blood glucose
contents (mgdl) of volunteers Beverage Study Periods
0 Days 15 Days 30 Days Means
A 10210 9978 9863 10017a B 9803 9626 9514 9648b C 9070 8949 8829 8949c D 8958 8746 8562 8755d
Means 9510a 9324b 9192c A = Beverage supplemented with 0 β-glucan (control) B = Beverage supplemented with 02 β-glucan C = Beverage supplemented with 04 β-glucan D = Beverage supplemented with 06 β-glucan
129
when blood glucose level was observed after 15 and 30 days
respectively
The interactive effect of diets (beverages) and study t ime
(Table 432) indicated that the control beverage (0 β -glucan)
possessed the highest blood glucose level of adults when tested
f irst t ime however the lowest blood glucose level was observed
in the adult subjects who were fed on diet D (06 β -glucan
beverage) when tested after 30 days (Table 432)
The results indicated that level of blood glucose was
signif icantly affected by the difference in beverages and t ime
intervals The beverages supplemented with β -glucan showed
pronounced effect on the reduction of blood glucose level
whereas the control diet did not signif icantly affect the level of
blood glucose in the adult subjects The reduction in blood
glucose level was more when level of β -glucan in the beverage
formulations was increased I t is true due to the assumption that
complex carbohydrates were digested and absorbed more slowly
than simple sugars result ing in a f lattened glucose response
curve The fal lacy was revealed when researchers discovered that
blood glucose and insulin responses varied greatly independent
of diet c lassif ication as simple or complex carbohydrate
(Schauberger et a l 1977 Jenkins et a l 1983)
The β -glucan has abil i ty to retard the absorption rate of food
in the intest ine due to increased viscosity thus balancing the
post-prandial glucose and insulin response (Wursch and Sunyer
1997 Wood et a l 2000) The viscous nature of β -glucan physically
slows glucose absorption in the gut This property is useful in the
130
formulation of products targeting management of diabetes Wood
et a l (1990 and 1994) also reported similar results who prepared
porridge from βndashglucan and after consumption demonstrated that
product has reduced postprandial blood glucose level Jenkins et
a l (2002) showed that a food in which β -glucan is incorporated as
a functional ingredient tends to reduce glycemic indices of that
particular food addition of β -glucan predictably reduces the GI
while maintaining palatabil i ty Foster-Pwer and Miller (1994) also
observed similar reduction in blood glucose level by the β -glucan
containing food bars Thus the reduction of blood glucose in the
present study by intake of beverages containing β -glucan is in l ine
with the f indings reported above I t may be concluded from the
present study that diabetic patient may use beverages in which β -
glucan is incorporated which wil l help to reduce the level of
blood glucose
131
CHAPTER-5
SUMMARY
Barley (Hordeum vulgare L) is one of the f irst ancient plant
species I t is r ich in dietary f ibre and possessing mixed-l inkage
(1rarr3) (1rarr4)-β -D-glucans a soluble f iber component The
nutrit ional and functional properties of β -glucan make it suitable
ingriedient to use in functional foods The β -glucan was used for
the development of functional beverages and the results are
summarised as follow
The barley f lour contained crude protein crude fat crude
f iber ash and nitrogen free extract (NFE) 1165 231 675
222 and 7707 respectively The barley f lour possessed total
dietary f ibre (TDF) and β -glucan content 1148 and 487
respectively The crude protein crude fat crude f iber ash and
nitrogen free extract (NFE) in β -glucan was found 9 96 117
722 172 and 7638 respectively The β -glucan contained
soluble dietary f iber (SDF) insoluble dietary f iber (IDF) and a
total dietary f iber (TDF) 7505 1025 and 8530 respectively
The β -glucan possessed 263 pentosans The crude fat and ash
contents in β -glucan gum pellets were found 117 and 172
respectively
The L-value (color index) of functional beverages increased
signif icantly as the level of β -glucan increased in the formulation
of different beverages The beverage of T6 containing 10 β -
132
glucan showed the highest L-value (2128) and fol lowed by
control beverage (without β -glucan) which got L-value 1969 L-
value of functional beverages declined signif icantly as the storage
period increased
The beverage of T5 containing 08 β -glucan gave the
highest a-value (165) and the lowest a-value (-227) was given
by T1 control beverage (without β -glucan) a-value of functional
beverages decreased signif icantly by increasing in storage
intervals b-value was signif icantly affected by treatments as well
as storage intervals The beverage T1 contains 02 pectin
possessed the highest b-value (1080) fol lowed by the beverage
T6 contains 1 β -glucan and signif icantly the lowest b-value was
recorded in the beverage of T2 (02 β -glucan)
The viscosity of beverages improved signif icantly due to the
incorporation of β -glucan in beverages The highest viscosity
(2175 mPa-s) was found in beverages of T6 containing 1 β -
glucan fol lowed by T5 beverage containing 08 β-glucan The
lowest viscosity was recorded in beverage of T1 (0 β -glucan)
The total soluble solids were signif icantly affected by the levels of
β -glucan in beverages The highest of total soluble solids
(1042ordmbrix) were yielded by the the beverages of T6 containing 1
β -glucan fol lowed by beverage of T5 containing 08 β -glucan T1
(0 β-glucan) gave the lowest total soluble solids (TSS) The pH
of different beverages differed signif icantly due to storage
intervals The pH decreased signif icantly in al l beverages
throughout the storage period Total acidity and ascorbic acid
varied signif icantly as a function of storage The ascorbic acid
content was higher (29406 mgkg) in fresh beverage which
133
declined signif icantly to 27933 mgkg and 26211 mgkg after 45
and 90 days of storage respectively Reducing sugars showed non
signif icant change due to incorporation of β -glucan in different
beverage The reducing sugars increased from 372 to 431 from 0
to 90 days of storage respectively The non reducing sugars
differed signif icantly among different beveragesThe total plate
count (TPC) values decreased in al l beverages during the storage
periods The TPC value of freshly prepared beverages (0 day) was
higher 129 times 104 - 4 46 times 104 which decreased to 117 times 104 - 4 32 times
104 at the end of the storage
The color scores differed signif icantly due to treatments and
storage intervals among beverages The beverage containing 02
β -glucan got the highest color scores (684) fol lowed by the
control (0 2 pectin) while beverage of (1 0 β -glucan) got the
lowest scores (494) The scores of f lavor varied signif icantly due
to differences (β -glucan levels) in treatments as well as storage
intervals The beverage of T3 containing 04 β -glucan got
signif icantly the highest scores for f lavor The highest scores for
sweetness (674) were given to control beverage fol lowed by
beverage containing 02 β -glucan The lowest scores (503) was
given to the sourness of T6 beverage (10 β -glucan) The scores
given to sourness of beverages decreased as a function of storage
period
The beverage prepared from the control treatment T2 (02
Pectin) got the highest total scores (731) The beverage containing
more than 06 of β -glucan got mimimum total scores for overall
acceptabil i ty Total scores among beverages decreased
signif icantly among storage periods
134
Total serum cholesterol of the test subjects was affected
signif icantly due to variation in beverage formulations and study
periods Maximum total cholesterol (13953 mgdl) was recorded
in the control group and the lowest content of total cholesterol
(13230 mgdl) in serum of adult subjects was observed when
human subjects were fed on 06 β -glucan The contents of total
serum cholesterol decreased signif icantly by increasing the level
of β -glucan in the beverages Minimum decrease decrease in the
serum cholesterol was measured in the test group fed on control
beverage (0 β -glucan)
The level of serum triglyceride was found higher in the human
subject fed on control beverage (0 β -glucan) and the lowest
tr iglyceride content was observed in the subjects fed on beverage
D (06 β -glucan) Higher reduction in the tr iglyceride content
was found by increasing the level of β -glucan in the beverage
formulations Maximum decrease in tr iglyceride content (1099)
was recorded in the subject group fed on the beverage D (06 β -
glucan)
The highest concentration of LDL (5202 mgdl) was found
in the human subject group fed on control beverage The beverage
containing 06 β -glucan (D) exhibited the lowest content of LDL
(4681 mgdl) in serum of the test subjects The LDL decreased
progressively by increasing the level of β -glucan in the beverage
formulations The serum HDL content was observed higher in the
human subjects fed on D beverage (06 β -glucan) while the
lowest HDL content was recorded in the human fed on control
beverage (0 β -glucan)
135
The blood glucose level of human subjects was affected
signif icantly by treatments feeding intervals and study periods
Higher blood glucose level (10017 mgdl) was observed in the
adults fed on control beverage i e A (0 β -glucan) and fed on
beverage B (02 β -glucan) The lowest blood glucose content
(9755 mgdl) was measured in the human subject group fed on D
beverage (06 β -glucan) Higher reduction in blood glucose level
was observed by increasing the level of β -glucan in the beverage
formulations The rate of reduction in the concentrat ion of blood
glucose was signif icantly different for different functional
beverages The human subjects fed on beverage D (06 β -glucan
beverage) showed higher reduction in level of blood glucose than
groups fed on al l other beverages The blood glucose level of the
adults fed on beverage D reduced from 9339 mgdl to 8135
mgdl during 0 to 60 minutes of the study
I t is evident from the present study that (1rarr3) (1rarr4) - β -D-
glucan is a dominant soluble f iber component in barley During
three months refrigerated storage barley β -glucan was found to be
stable at low pH conditions in beverages system and showed shelf
stabil i ty Consumption of foods rich in β -glucan (soluble f iber)
may reduce the risk of chronic diseases and such foods exhibited
decrease in serum cholesterol levels and postprandial blood
glucose levels in adult subjects This study suggested the use of β -
glucan in beverages can help to reduce riskes of coronary heart
disease and diabetes
136
Conclusions
Concentration of β -glucan had a signif icant effect on the
sensory parameters of beverage
Beverage formulate with the incorporation of β -glucan exert
i ts effect on physicochemical characterist ics of beverage
β -glucan improved most of the sensory characterist ics of the
beverage
The beverages below 08 containing β -glucan were found to
be acceptable during the three month refrigerated storage
period
The different formulated functional beverages showed no
phase separation very minute quantity of impurit ies such as
protein and starch content founded at the bottom of bott les
All levels of β -glucan decrease the total cholesterol LDL
cholesterol and triglycerides in healthy subjects
Further research is needed to know the thermal stabil i ty of
β -glucan and its behavior with other food ingredients in
beverages application to make stable foods
137
Recommendations
All local and indigenous sources for β -glucan isolation should be exploited
The relationship between molecular weight of β -glucan with respect to physiological functional i ty has to be kept in mind
Clinical studies are needed to investigate the physiological effects of β -glucan preparations differing in molecular weight and viscosity
Studies should be carried out to explore the molecular weight of β -glucan to proper understanding of functional properties of β -glucan
Consumer studies are needed to explore the acceptabil i ty of food products having β -glucan along with the substitution of β -glucan enriched barley f lour for some wheat f lour and dairy products
There is need to develop new foods with the addition of soluble dietary f iber from barley source with enhanced health properties by keeping in mind shelf stabil i ty
Structural differences which are present in the soluble and insoluble dietary f ibre of β -glucan should also be investigated for indigenous variet ies
The Genes responsible for the synthesis of β -glucan should be characterized and identif ied in cereal crops and strains of microorganisms
The role of β -glucan in increasing immune system should also be discovered
138
LITERATURE CITED
AACC 2000 Approved Methods of American Association of Cereal Chemists The American Association of Cereal Chemists Inc St Paul Minnesota USA
Aastrup S 1979a The effect of rain on β -glucan content in barley grains Carlsberg esearch Communications 44381-393
Aditya K T Yokota S Suzuki and H Etoh 2008 Sub crit ical Water Extraction of Barley to Produce a Functional Drink
Biosci Biotechnol Biochem 72(1)236-239
AERI 1896 The Agricultural Economics Research Institute Balance Sheet for Food Commodities Finland 1985 The Insti tute Helsinki
Akubor PI 2003 Influence of storage on the physicochemical microbiological and sensory properties of heat and chemically treated melon-banana beverage Plant Foods for Human Nutri 58 1ndash10
Alessandra DC P Antonio V Vincenzo A Mario 2004 Changes of f lavonoids vitamin C and antioxidant capacity in minimally processed citrus segments and juices during storage Food Chem 84 99-105
Aman P H Graham AC Til ly 1989 Content and solubil i ty of mixed-l inked (1-3) (1-4)- β -D-glucan in barley and oats during kernel development and storage J Cereal Sci 1045-50
Anderson J W 1980 Dietary f iber and diabetes in Medical Aspects of Dietry Fiber G A spil ler and R M Key eds Plenum Medical Book Company New York
Anderson J W and J Tieyen-clark 1986 Dietary f iber Hyperlipidemiahypertension and coronary heart disease Am J Gastroenterol 81907-919
Anderson J W DB Spencer CC Hamilton SF Smith and J Tietyen CA Bryant P Oeltgen 1990 Oat-bran cereal lowers serum total and LDL cholesterol in hypercholesterolemic men Am J Clin Nutri 52 495-499
139
Andersson AAM E Armo E Grangeon H Fredrikssonm RA Andersson P Man 2004 Molecular weight and structure units of (1- 3 1-4)- β -glucans in dough and bread made from hull- less barley mil l ing fractions J Cereal Sci 40195ndash204
Annoni G BM Botasso D Ciaci MF Donato and A Tripodi 1982 Liquid tr iglycerides (GPO-PAP) Medi Diagnostic I taly Lab J Res Lab Med 9 115-116
AOAC 2000 Official Methods of Analysis The Association of the Official Analytical Chemists 20 t h Ed Arlington USA
Arndt EA 2006 Whole-grain barley for todays health and wellness needs ConAgra Foods Inc Omaha NE 51(1) 20-22
Assmann G 1979 HDL-cholesterol precipitant Randox Labs Ltd CrumLin Co Antrim N Ireland Internist 20559-567
Babsky NE J L Toribio and J E Lozano 1986 Influence of storage on the composit ion of clarif ied apple juice concentrate J Food Sci 51 (3) 564-67
Ballance GM WOS Meredith 1976 Purif ication and partial characterization of an endo- β -13-glucanase from green malt J Inst Brew 8264-67
Bamforth CW and AHP Barclay 1993 Malting technology and the uses of malt In Barley Chemistry and Technology (eds AW MacGregor and RS Bhatty) by Am Assoc Cereal Chem St Paul USA pp 297-354
Bansema C 2000 Development of a barley P-glucan beverage with and without whey protein Isolate MSc thesis Edmonton Alberta Canada
Basman A and HK Ksel 1999 Properties and composit ion of Turkish f lat bread (bazlama) supplemented with barley f lour and wheat bran Cereal Chem 76506ndash511
Beer MU E Arrigoni and R Amado 1995 Effect of oat gum on blood cholesterol levels in healthy young men Europ J Clin Nutri 49517ndash522
140
Beer MU PJ Wood J Weisz N Fi l l ion 1997 Effect of cooking and storage on the amount and molecular weight of (1rarr3) (1rarr4) - β -D-glucan extracted from oat products by an in vitro digestion system Cereal Chem 74 705-709
Bell S VM Goldman BR Bistrian AH Arnold G Ostroff R Forse 1999 Effect of β -glucan from oats and yeast on serum lipids Crit Rev Food Sci Nutri 39(2) 189ndash202
Bell S VM Goldman BR Bistrian AH Arnold G Ostroff R Forse 1999 A Effect of β -glucan from oats and yeast on serum lipids Crit Rev Food Sci Nutri 39(2) 189ndash202
Bender DA and AE Bender 1999 Bendersrsquo Dictionary of Nutrit ion and Food Technology 7 t h ed Woodhead Publishing Abington
Beneke ES 1962 Medical Mycology Lab Manual Burgess Pub Co Minneapolis Minnisota USA
Berglund PT CE Fastnaught ET Holm 1992 Food uses of waxy hull- less barley Cereal Foods World 37707ndash714
Bhatty R S 1999 The potential of hull- less barley Cereal Chem 76(5) 589ndash599
Bhatty RS 1992 Total and extractable β -glucan contents of oats and their relationship to viscosity J Cer Sci 15185-192
Bhatty RS 1995 Laboratory and pilot plant extraction and purif ication of b-glucans from hull- less barley and oat bran J Cer Sci 22163ndash170
Bhatty RS 1996 Production of food malt from hull- less barley Cereal Chem 73(1) 75-80
Bhatty RS AW MacGregor and BG Rossnagel 1991 Total and acid-soluble β -glucan content of hulless barley and its relationship to acid-extract viscosity Cereal Chem 68221-227
Bhatty RS1986 Physiochemical and Functional (Breadmaking) Properties of Hull- less Barley Fractions Cereal Chem 6331-35
141
Bibek R 2001 Fundamental Food Microbiology 2nd edn The CRC press Ltd Washington DC pp 56-90
Bingham SA NE Day R Luben P Ferrari N Sl imani T Norat F Lavel E Kesse A Nieters H Boeing A Tjoslashnneland K Overvad C Martinez M Dorrensoro CA Gonzalez TJ Key A Trichopoulou A Naska P Vineis R Tumino V Krogh HB Bueno-de-Mesquita PHM Peeters G Berglung G Hallmans E Lund G Skele R Kaaks and E Riboli 2003 Dietary f ibre in food and protection against colorectal cancer in the European Prospective Investigation into Cancer and Nutrit ion (EPIC) an observational study Lancet 3611496-501
Bioumlrklund M A van Rees RP Mensink and G Oumlnning 2005 Changes in serum lipids and postprandial glucose and insulin concentrations after consumption of beverages with β -glucans from oats and barley a randomised dose-controlled tr ial Eur J Clin Nutri 591272-1281
Biorklund M Rees A van RP Mensink and G Onning 2005 Changes in serum lipids and postprandial glucose and insulin concentrations after consumption of beverages with β -glucan from oat or barley a randomized dose-controlled tr ial Eur J Clin Nutri 591272-1281
Bjorck I AC Eliasson A Drews M Gudmundsson and R Karlsson 1990 some nutrit ional properties of starch and dietary f iber in barley genotypes containing different levels of amylose Cereal Chem 67 327
BNF (Brit ish Nutrit ion Foundation) 1994 Starchy Foods in the Diet BNF London
Braaten J T PJ Wood FW Scott MS Wolynetz MK Lowe P Bradleywhite MW Coll ins 1994 Oat β -glucan reduces blood cholesterol concentration in hypercholesterolemic subjects Eur J Clin Nutri 48465ndash474
Brand J S Colagiuri S Crossman A Allen D Roberts and S Truswell 1991 Low-glycemic index foods improve long term glycemic control in NIDDM Diabetes Care 14 95ndash101
142
Brennan C S and LJ Cleary 2005 The potential use of cereal (13 14)-b-D-glucans as functional food ingredients J CerSci 421ndash13
Brennan CS and LJ Cleary 2005 The potential use of cereal (1314)- β -D-glucans as functional food ingredients J Cer Sci 421ndash13
Brennan CS CM Tudorica V Kuri 2002 Soluble and insoluble dietary f ibres (non-starch polysaccharides) and their effects on food structure and nutrit ion F Ind J 5 261-272
Brown L B Rosner W Willet and FM Sacks 1999 Cholesterol lowering effects of dietary f iber a meta analysis Am J Clin Nutri 69 (1) 30 42
Brunswick P DJ Manner and J K Stark 1987 Development of β -D-glucanases during germination of barley and the effect of ki lning on individual isoenzymes J Inst Brew 93181-186
Bryan D J Robert AT Wilson T Carlson S Frazer GH Zheng 2003 β -Glucan Fractions from Barley and Oats Are Similarly Antiatherogenic in Hypercholesterolemic Syrian Golden Hamsters The American Society for Nutrit ional Sciences J Nutri Metabolism 133468-475
Buliga GS DA Brant and GB Fincher 1986 The sequence statist ics and solution configration of barley (1rarr3) (1rarr4) - β -D-glucan Carbohydr Res 57139-156
Burkus Z 1996 Barley P-Glucan Extraction Functional Properties and Interactions with Food Components MSc thesis Edmonton AlbertaCanda
Glicksman M 1982 Functional properties of hydrocolloids Ch 3 in Food Hydrocolloid F Glicksman M (Ed) p 49-93 CRC Press Inc Boca Raton
Burkus Z 1996 Barley β -glucan Extraction Functional properties and interaction with food components MSc Thesis Dept of Agricultural Food and Nutrit ional Science Univ of Alberta Edmonton Canada
143
Burkus Z and F Temeil i 1998 Effect of extraction conditions on yield composit ion and viscosity stabil i ty of barley P-glucan gum Cer Chem 75 805-809
Burkus Z and F Temell i 1999 Glucan concentrate J Food Sci 64198-201 Glicksman M 1982 Functional properties of hydrocolloids Ch 3 in Food Hydrocolloidr Glicksman M (Ed) p 49-93 CRC Press hc Boca Raton FL
Burkus Z and F Temell i 2005 Rheological properties of barley β -glucan Carbohydr Polym 59 459ndash465
Burkus Z F Temell i 1999 Gelation of barley β -glucan - concentrate J Food Sci 64198-201
Calix FD and N Bardrie 2004 Consumer acceptance and physicochemical quality of processed red sorrelroselle (Hibiscus sabdar i f fa L) sauces from enzymatic extracted calyces 4 141-148
Carpita NC 1996 Structure and biogenesis of cel l walls of grasses Annual Rev Plant Physiol Plat Molecular Biol 47445-476
Carr J M S Glatter J L Jeraci and B A Lewis 1990 Enzymes Determination of Beta-Glucan in Cereal-Based Food Products Cereal Chem 67226-229
Casterl ine J L CJ Oles and Y Ku 1997 In vitro fermentation of various food f iber reactions J Agric Food Chem 452463ndash2467
Cavallero S F Empill i Brighenti and A M Stanca 2002 High (1rarr31rarr4)-_-Glucan Barley Fractions in Bread Making and their Effects on Human Glycemic Response J Cere Sci 36 59ndash66
Chowdhury MGF MN Islam MS Is lam T Is lam and MS Hossain 2008 Study on Preparation and Shelf-Life of Mixed Juice Based on Wood Apple and Papaya J Soil Nature 2(3) 50-60
Chung OK and Y Pomeranz 1985 Amino acids in cereal proteins and protein fractions Ch 5 in Digesfibi l i~ and
144
Amino Acid Availabil i ty in Cereals andOilseeds J W Finley and DT Hopkins (Eds) pp 169-232 AACC St Paul MN
Clara C J Mar ıacutea Esteve and Ana Fr ıacutegola 2008 Color of orange juice treated by High Intensity Pulsed Electric Fields during refrigerated storage and comparison with pasteurized juice Food Control 19 151ndash158
Crandall PG CS Chen and KC Davis 1987 Preparation and storage of 72 brix orange juice concentration J Food Sci 52 (3) 381
Davidson MH andm A McDonald 1998 Fiber forms and functions Nutri Res 18 617ndash624
Daw ZY YSA El-Gizaw and AMB Said 1994 Microbiological evaluation of some local juices and drinks Chemie Mikrobiologie Technologie der Lebensmittel 168ndash15
Dawkins N L and I D Nnanna 1995 Composit ion molecular 4)-3 1A 1995 Studies on oat gum [(1 weight est imation and rheological properties Food Hydrocol 9 1-7
Dawkins NL I A Nnanna 1993 Studies on oat gum [(1rarr31rarr4)- β-D-glucan] Composit ion molecular weight est imation and rheological properties Food Hydrocol 9 1-7
Del PS F Leonett i DC Simonson P Sheehan M Matsuda and RA DeFronzo 1994 Effect of sustained physiologic hyperinsulinaemia and hyperglycaemia on insulin secretion and insulin sensit ivity in man Diabetologia 371025ndash1035
Delaney B RJ Nicolosi TA Wilson T Carlson S Frazer GH Zheng R Hess K Ostergren J Haworth and N Knutson 2003 The American Society for Nutrit ional Sciences J Nutri 133468-475
DeVries J W 2001 AACC report The definit ion of dietary f iber Cereal Foods World 46(3) 112-126
Dohnalek MH 2004 The role of f ibre in cl inical nutrit ion In Van der Kamp JW Asp NG Miller J J Schaafsma G (Ed) Dietary f ibre bioactive carbohydrates for food and feed Wageningen Academic Publishers Wageningen pp 271294
145
Dongowski G M Huth E Gebhardt and W Flamme 2002 Dietary f iber-rich barley products beneficial ly affect the intestinal tract of rats J Nutri 132(12) 3704-14
Drzikova B G Dongowski E Gebhardt and A Habel 2005 The composit ion of dietary f ibre-rich extradites from oat affects bi le acid binding and fermentation in vitro Food Chem 90 181-192
Estevea MJ A Fr ıgola C Rodrigob and D Rodrigo 2005 Effect of storage period under variable conditions on the chemical and physical composit ion and colour of Spanish refrigerated orange juices Food and Chemical Toxicol 431413ndash1422
Etoh H K Murakami T Yogoh H Ishikawa Y Fukuyama and H Tanaka 2004 Antioxidative compounds in barley tea Biosci Biotechnol Biochem 682616-2618
Falade OS OR Sowunmi A Oladipo A Tobosun and SRA Adewusi 2003 The level of organic acids in some Nigerian fruit and their effect on mineral availabil i ty in composite diet Pak J Nutri 2(2) 82-83
Faraj A T Vasanthan R Hoover 2006 The influence of a-amylase-hydrolysed barley starch fractions on the viscosity of low and high purity barley b-glucan concentrates Food Chem 9656ndash65
Fasoyiro S B OA Ashaye A Adeola and FO Samuel 2005 Chemical and Storabil i ty of Fruit-Flavoured (Hibiscus sabdariffa) Drinks World J Agric Sci 1(2) 165-168
FDA 1996 Food labeling Health claims oats and coronary heart disease Federal Register 61 (3) January 4
Foster-Powell K J B Mil ler 1994 International tables of glycaemic index Am J Clin Nutr 59 66ndash 69
Frazier WC and EM Foster 1958 Laboratory Manual for Food Microbiology Burgess Pub Co Minneapolis Minnisota USA
Frick MH O Elo and K Haapa 1987 Helsiniki heart study Primary prevention tr ial with germfibrozil in middle aged men with dyslipidemia N Eng J Med 3171237-45
146
Fuleki T E Pelayo and RB Palabay 1994 Sugar composit ion of varietal juices produce from fresh and stored apple J Agric Food Chem 42 1266-75
Gallaher DD CA Hassel 1995 The role of viscosity in the cholesterol lowering effect of dietary f iber In Kritchevsky D Bonfield C editors Dietary f iber in health and disease Minnesota Eagan Press 106-114
Gasiorowski H H Chalcarz A Aniola J I Nahrung 2000 Mil l ing of barley to obtain beta-glucan enriched products Aug 44(4) 238-41
Giese J H 1992 Hitt ing the spot Beverages and beverage technology Food Technol 4670-72 74-75 78-80
Godara RK and OP Pareek 1985 Effect of temperature in storage of ready to serve date juice beverages indian j agric Sci 55 (5) 347-349 (FSTA 18 (4) 78 1986)
Gonzalez ER and S Leeson 2000 An investigation on the preservation of kununndashzaki an African fermented cereal based food drink Acta Alimentaria 29 385ndash92
GOP 2008 Government of Pakistan Finance Division Economic Advisor s Wing Islamabad Pakistan
Granzer R 1982 changes in fruit juices in consumer packs during extended storage Verpackungs-Rundschau 33(6) 35-4
Hallfr isch J DJ Schofield KM Behall 2003 Physiological responses of men and women to barley and oat extracts (NutrimX) I I Comparison of glucose and insulin responses Cereal Chem 8080ndash83
Hall ikainen MA ES Sarkkinen MI J Uusitupa 2000 Plant stanol esters affect serum cholesterol concentrations of hypercholesterolemic men and women in a dose-dependent manner J Nutri 30 767ndash776
Hancioglu O and M Karapinar 1997 Microflora of boza a tradit ional fermented Turkish beverage Int J Food Microbiol 35271ndash274
147
Handan E S Celik B Bi lgi and H Koksel 2005 A new approach for the uti l ization of barley in food products Food Chemistry1-7 Received 6 December 2004received in revised form 7 March 2005accepted 7 March 2005
Lawless HT and H heymann Sensory evaluation of food Principles and Practices Gaithersburg MD Aspen Publishers ISSN 1572-0330) Oorspr uitg New York [etc ] Chapman amp Hall 1998
Hashimoto S MD Shogren Y Pomeranz 1987 Cereal Pentosans Their est imation and signif icance I Pentosans in wheat and milled wheat products Cereal Chem 64(1) 30-34
Hassan SA 1976 Effect of storage on physico-chemical characterist ics of carbonated orange juice Msc thesis Food Tech Deptt WPAU Lyallpur
Hatcher WSJ R J L Weihe DF Split tstoesser EC Hil l and ME Parish 1992 Fruit Beverages In Compendium of methods for the microbiological examination of foods Vanderzant C Split tstoesser DF (eds) American Public Health Association Washington DC
Helm CV and A Francisco 2004 Chemical characterization of Brazil ian hulless barley variet ies f lour fractionation and protein concentration Scientia Agricola 61593-97
Hil l M J and FR Path 1998 Cereals dietary f iber and cancer Nutri Res 18563ndash659
Hil l iam M 2000 Functional foodndashndashHow big is the market The World of Food Ingredients 12 50ndash2
Holsinger V H LP Posati and ED DeVilbiss 1974 Whey beverages a review J Dairy Sci 57(7) 849ndash859
Holtekjolen AK AK Uhlen E Brathen E Brathen S Sahlstrom and SH Khnutesen 2006 Contents of starch and non-starch polysaccharides in barley variet ies of different origin Food Chem 94348 -358
Izydorczyk M S J Symons and J E Dexter 2002 Fractionation of wheat and barley In L Marquart J L Slavin amp R G Fulcher (Eds) Whole grain foods in health and disease (pp
148
47ndash82) St Paul MN USA American Association of Cereal Chemists
Izydorczyk MS A Hussain AW MacGregor 2001 Effect of barley and barley components on rheological properties of wheat dough J Cer Sci 34251ndash260
Izydorczyk MS LJ Macri AW MacGregor 1998a Structure and physicochemical properties of barley non-starch polysaccharides-I Water-extractable beta-glucans and arabinoxylans Carbo Poly 35249ndash258
Izydorczyk MS LJ Macri AW MacGregor 1998b Structure and physicochemical properties of barley non-starch polysaccharides-II Alkali-extractable beta-glucans and arabinoxylans Carbo Poly 35 259ndash269
Jadhav SJ S E Lutz VM Ghorpade and DK Salunkhe 1998 Barley chemistry and value-added processing Crit ical Rev Food Sci 3823ndash171
Jal i l i T REC Wildman DM Medeiros 2000 Nutraceutical roles of dietary f iber J Nutraceutical functional and Medi foods 2 19-34
Jansen MC HB Bueno-de-Mesquita R Buzina F Fidanza A Menotti H Blackburn AM Nissinen FJ Kok D Kromhout 1999 Dietary f iber and plant foods in relation to colorectal cancer mortal i ty The Seven Countries Study Inter J Canc 81 174-179
Jaumlrvi AE BE Karlstroumlm YE Granfeldt I ME Bjoumlrck NG Asp and BOH Vessby 1999 Improved glycemic control and l ipid profi le and normalized f ibrinolytic activity on a lowglycemic index diet in type 2 diabetic patients Diabetes Care 2210ndash18
Jaskari J K Henriksson A Nieminen T Suortt i H Salovaara K Poutanen 1995 Effect of hydrothermal and enzymic treatments on the viscous behaviour of dry- and wet-milled oat barns Cereal Chem 72625-631
Jenkins AL DJ Jenkins U Zdravkovic P Wursch and V Vuksan 2002 Depression of the glycemic index by high
149
levels of β -glucan f iber in two functional foods tested in type 2 diabetes Eur J Clin Nutri 56 622-628
Jenkins D J A TMS Wolever AR Leeds MA Gassull P Haisman and J B Dilawari DV Goff GL Metz KG Alberti 1978 Dietary f ibres f ibre analogues and glucose tolerance importance of viscosity Brit ish Medi J 1 1392 ndash 1394
Jenkins DJ TM Wolever AL Jenkins MJ Thorne R Lee J Kalmusky R Reichert and GS Wong 1983 The glycaemic index of foods tested in diabetic patients a new basis for carbohydrate exchange favoring the use of legumes Diabetologia 24257ndash264
Jenkins DJ TM Wolever J Kalmusky S Guidici C Giordano R Patten GS Wong J N Bird M Hall G Buckley A Csima and J A Litt le 1987 Low-glycemic index diet in hyperlipidemia use of tradit ional starchy foods Am J Clin Nutri 46 66ndash71
Johansson L L Virkki S Maunu M Lehto P Ekholm and P Varo 2000 Structural characterization of water-soluble β -glucan of oat bran Carbohydrate Polymers 4214-148
Jones P J H CA Vanstone M Raeini-Sar jaz MP St-Onge Phytosterols in low- and nonfat beverages as part of a controlled diet fai l to lower plasma l ipid levels J Lip Res 441713-1719
Jones P J M Raeini-Sarjaz FY Ntanios CA Vanstone J Y Feng WE Parsons 2000 Modulation of plasma l ipid levels and cholesterol kinetics by phytosterol versus phytostanol esters J Lipid Res 41697ndash705
Joseph MK M Goulson T Shamliyan N Knutson L Kolberg and L Curry 2007 The effects of concentrated barley beta-glucan on blood l ipids in a population of hypercholesterolaemic men and women Brit J Nutri 97(6) 1162-1168
Kaanane A D Kane TP Labuza 1988 Time and temperature effect on stabil i ty of Moroccan processed orange juice during storage J Food Sci 531470ndash1489
150
Kabasakalis V D Siopidou and E Moshatou 2000 Ascorbic acid content of commercial fruit juices and its rate of loss upon storage J Food Chem 70325-28
Kahlon TS and FI Chow 1997 Hypocholesterolemic effects of oat r ice and barley dietary f ibers and fractions Cereal Foods World 4286-92
Kalra S and S Jood 2000 Effect of dietary β -glucan on cholesterol and l ipoprotein fractions in rats J Cereal Sci 31 141-145
Kent NL and AD Evers 1994 Kentrsquos Technology of Cereals 4th edn Elsevier Oxford
Kerckhoffs DAJ M G Hornstra RP Mensink 2003 Cholesterol lowering effect of β -glucan from oat bran in mildly hyper cholesterolemic subjects may decrease when β -glucan is incorporated into bread and cookies Am J Clin Nutri 78 221-227
Kiryluk J A Kawka H Gasiorowski A Chalcarz J Anio 2000 Mill ing of barley to obtain β -glucan enriched products Molecular Nutri Food Res 44 (4) 238-241
Klamczynski AP and Z Czuchajowska 1999 Quality of f lours from waxy and non-waxy barley for production of baked products Cereal Chem 76530ndash535
Kontogiorgos V CG Bil iaderis V Kiosseoglou G Doxastakis 2004 Stabil i ty and rheology of egg-yolk-stabil ized concentrated emulsions containing cereal β -glucans of varying molecular size Food Hydrocoll 18 987-998
Kuhn M E 1998 Functional food overdose Food Proc 5 21ndash4 27ndash8 30
Morin LA F Temell i and L McMullen 2002 Physical and sensory characterist ics of reduced-fat breakfast sausages formulated with barley β -glucan J Food Sci 672391ndash2396
Lakshmi K AKv Kumar LJ Rao and MM Naidu 2005 Quality evaluation of f lavoured RTS beverage and beverage concentrate from tamarind pulp J Food Sci Technol (Mysore) 42(5)411-415
151
Lambo AM R Oste and MEG Nyman 2005 Dietary f ibre in fermented oat and barley b-glucan rich concentrates Food Chem 89 283ndash293
Lateef A J K Oloke EB Gueguim-Kana 2004 Antimicrobial resistance of bacterial strains isolated from orange juice products Afr J Biotechnol 3 (6) 334-338
Lee CJ RD Horsley FA Manthey PB Schwarz 1997 Comparisons of b-glucan content of barley and oat Cereal Chem 74571ndash575
LI J H T Vasanthan B Rossnagel and R Hoover 2004 Starch from hull- less barley I Granule morphology composit ion and amylopectin structure Food Chem 74395-405
Lia A G Hallmans AS Sandberg B Sundberg P Aringman and H Andersson 1995 Oat beta-glucan increases bi le acid excretion and a f iber-rich barely fraction increases cholesterol excretion in i leostomy subjects Am J Clin Nutri 621245-1251
MacGregor AW and GB Fincher 1993 Carbohydrates of the barley grain Ch 3 in Barley Chemistry and Technology AW MacGregor and RS Bhatty (Eds) p 73-130 AACC St Paul MN
Maier S M ND Turner J R Lupton 2000 Serum lipids in hypercholesterolemic men and women consuming oat bran and amaranth products Cereal Chem 77 297-302
Malkki Y 2004 Trends in dietary f ibre research and development Acta Alimentaria 3339ndash62
Maria COC Geraldo AM WDF Raimundo SF Men de Sa Moreira de and MB Isabella 2003 Storage stabil i ty of cashew apple juice preserved by hot f i l l and aseptic processes Ceinc Tecnol Aliment Campinas 23(supl) 106-9
Marika L M Salmenkall io M T Suortt i K Autio K Poutanen L Lahteenmaki 2004 The sensory characterist ics and rheological properties of soups containing oat and barley β -
152
glucan before and after freezing Lebensm-Wiss u-Technol 37749ndash761
Marlett J A KB Hosig NW Vollendorf and FL Shinnick 1994 Mechanism of serum cholesterol reduction by oat bran Hepatol 201450ndash1457
Mart ın J J E Solanes E Bota and J Sancho 1995 Chemical and organoleptic changes in pasteurised orange juice Alimentaria 26159ndash63
McIntosh GH GO Regester RK LeLeu and PJ Royle GW Smithers 1995 Dairy proteins protect against dimethylhydrazine-induced intestinal cancers in rats J Nutri 125809ndash816
McIntosh GH J Whyte R McArthur and PJ Nestel 1991 Barley and wheat foods influence on plasma cholesterol concentrations in hypercholesterolemic men Am J Clin Nutri 53 1205ndash1209
McNamara J R J S Cohn PW Wilson and EJ Schaefer 1990 Calculated values for low-density l ipoprotein cholesterol in the assessment of l ipid abnormalit ies and coronary disease r isk Clin Chem 3636-42
Menrad K 2000 Markt und Marketing von funktionellen Lebensmitteln Agrarwirtschaft 49(8) 295ndash302
Menrad M B Husing K Menrad T Reib S Beer-Borst and CA Zenger 2000 Functional food TA 372000 Bern Schweizerischer Wissenschafts und Technologierat
Miguel G S Dandlen D Antunes A Neves and D Martins 2004 The effect of two methods of pomegranate (punica granatum) juice extraction on quality during storage at 4degC J Biomed Biotechnol 5 332ndash7
Molina-Cano J L A Sopena J P Polo C Bergareche MA Moralejo J S Swanston and Glidewell 2002 Relationship between barley hordeins and malting quality in a mutant of cv Triumph II Genetic and environmental effects of water uptake J Cer Sci 36 39ndash50
153
Moreau RA BD Whitaker KB Hicks 2002 Phytosterols phytostanols and their conjugates in foods structural diversity quantitat ive analysis and health-promoting uses Prog Lipid Res 41457ndash500
Morett i PP RH Cardello HMAR Gandara and ALN Gandara 2004 Shelf- l i fe study of a beverage developed by blending of partial ly clarif ied-stabil ized sugar-cane juice and natural passion fruit juice Boletim do Centro de Pesquisa e Processamento de Alimentos 22295-310
Morgan KR and DJ Ofman 1998 Glucagel a gell ing β -glucan from barley Cereal Chem 75879-881
Mugulal J I S AM KO1 and T Sorhaug 2001 Changes in quality attr ibutes during storage of togwa a lactic acid fermented gruel J Food Safety 21181-194
Munk L 1981 Barley for food feed and industry Pages 427-459 in Cereals A Renewable Resource Theory and Practical Y Pomeranz and L Munckeds Am Assoc Cereal Chem St Paul MN
Murtaza MA N Huma J Javaid MA Shabbir G Mueen-ud-Din and S Mahmood 2004 Studies on Stabil i ty of Strawberry Drink Stored at Different Temperatures Int J Agri Biol 6(1) 58-60
Mussner MJ K G Parhofer K Von Bergmann P Schwandt and U Broedl and C Otto 2002 Effects of phytosterol ester-enriched margarine on plasma l ipoproteins in mild to moderately hypercholesterolemics are relative to basal cholesterol and fat intake Metabolism 51189ndash194
Naumann E AB Van Rees G Onning R Oste M Wydra and RP Mensink 2005 Beta glucan incorporated into a fruit drink effectively lowers serum LDLndashcholesterol concentration Am J Clin Nutri 83 601-5
Nicoli MC M Anese and M Parpinel 1999 Influence of processing on the antioxidant properties of fruits and vegetables Trend Food Sci Technol 1094-100
154
Nilan RA and SE Ullr ich 1993 Barley Taxonomy origin distribution production genetics and breeding Ch I in Barley Chemistry and Technology AW MacGregor and RS Bhatty (Eds) p 1-29 AACC St Paul MN
Ornish D LL Rudel GW Strain WE Connor SL Connor MB Katan S Grundy and WC Willett 1998 Low-Fat Diets NEJM 338127-129
Oscarsson M R Andersson AC Salomonsson and P Amam 1996 Chemical composit ion of barley samples focusing on dietary f ibre components J Cereal Sci 161-170
Otta K 1984 Minimum shelf l i fe of fruit juices Flussinges abst 51 570 574-590
Pangborn RM I Trabue and A Szczesniak 1973 Effect of hydrocolloid on oral viscosity and basic taste intensit ies J texture studies 4 224241
Papageorgiou M N Lakhdara A Lazaridou CG Bil iaderisd and MS Izydorczyk 2005 Water extractable (1rarr3) (1rarr4)- β -D-glucans from barley and oats An intervarietal study on their structural features and rheological behaviour J Cereal Sci 42 213ndash224
Pendergast K 1985 Whey drinksmdashtechnology processing and marketing J Soc Dairy Tech 8(4) 10ndash5
Perez AG and C Sanz 2001 Effect of high oxygen and high carbonndashdioxide atmospheres on strawberry f lavour and other quality traits J Agric Food Chem 49 2921ndash30
Plat J and RP Mensick 2001 Effects of plant sterols and stanols on l ipid metabolism and cardiovascular r isk Nutr Metab CardiovascDis 1131ndash40
Poehlman J M 1985 Adaptation and distribution In Barley DC Rasmusson (Ed) p 2-17 American Society of Agronomy Madison WI
Potter D 2001Functional drinks can show us the way EUR Food drink Rew333-41
155
Purthi J S J K Manna MS Tectia S G Radhakriahna WE Eipeson S Saroja and Chikkappaji 1984 Studies on the uti l ization of kinnow and malta orange J Food Sci and Technol India 21(3) 121-27
Ragaee S GL Campbell GJ Scoles J G McLeod and RT Tyler 2001 Studies on rye (Secale cereale L) Lines exhibit ing a range of extract viscosit ies 1 Composit ion molecular weight distribution of water
Ranhotra GS J A Gelrotch K Astroth and RS Bhatty 1991 Relative l ipidemic responses in rats fed barley and oat meals and their fractions Cereal Chem 68548ndash55
Ranote PS and GS Bains1982 Juice of kinnow fruit Indian food packer 36(5) 23-33 (FSTA 16(6) 6H 1250 1984)
Renuka AB S G Kulkarnib P Vi jayanandb SG Prapulla 2009 Fructooligosaccharide fort if ication of selected fruit juice beveragesEffect on the quality characterist ics Food Sci Technol pp1ndash3
Rimsten L T Stenberg R Andersson A Andersson and P Aringman 2003 Determination of β -glucan molecular weight using SEC with Calcofluor detection in cereal extracts CerChem 80485-490
Ripsin CM J M Keenan DR Jacobs PJ Elmer RR Welch and L Van Horn 1992 Oat products and l ipid lowering A meta-analysis JAMA 2673317-3325
Rodrigo D J I Arranz S Koch A Fr ı acute gola MC Rodrigo and MJ Esteve 2003 Physicochemical characterist ics and quality of refrigerated spanish orangendashcarrot juices and influence of storage conditions J Food Sci 68(6) 2111ndash2116
Ruck J A 1963 chemical method for analysis of fruit and vegetable products Canadian Deptt Agri PubNo1154
Sa acute nchez MC L Plaza P Elez-Mart ı acute nez B de Ancos O Mart ı acute n-Belloso and MP Cano 2005 Impact of high pressure and pulsed electric f ields on bioactive compounds and antioxidant activity of orange juice in comparison with
156
tradit ional thermal processing J Agric Food Chem 53 4403ndash4409
Sanjoaquin MA PN Appleby EA Spencer and TJ Key 2004 Nutrit ion and l i festyle in relation to bowel movement frequency a cross-sectional study of 20 630 men and women in EPIC-Oxford Pub Health Nutri 7 77-83
Saulnier L S Gevaudan and J F Thibault 1994 Extraction and partial characterization of β -glucan from the endosperms of two barley cult ivars J Cereal Sci 19171ndash178
Schauberger G U C Brink G Guldner R Spaethe L Niklas and H Otto 1977 Diabetes 26 246 Wald A VanThiel D H Hoechstetter L Gavaler J S Egler K M Verm R Scott L and R Lester 1981 Gastroenterol 801497-1 500
Schneeman BO 2001 Dietary f ibre and gastrointestinal function In Advanced Dietary Fibre Technology McCleary BV Prosky L (eds) Blackwell Science Oxford p 168-173
Schulze MB S Liu EB Rimm J E Manson WC Willett FB Hu 2004 Glycemic index glycemic load and dietary f iber intake and incidence of type 2 diabetes in younger and middle-aged women Am J Clin Nutri 80 348-356
Shahidi F 2004 Functional foods Their role in health promotion and disease prevention J Food Sci 69(5) 146-149
Sharma SK QH Zhang and GW Chism 1998 Development of a protein fort i f ied fruit beverage andiIts quality when processed with pulsed electric f ield treatment J Food Quality 21459 -473
Shewry PR 1993 Barley seed proteins Ch 4 in Barley Chemistry and Technology AW MacGregor and RS Bhatty (Eds) p 131-197 AACC St Paul MN
Shimoda M and Y Osaj ima 1981 Studies on offndashflavour formed during storage of Satsuma mandarin juice J Agric Chem Soc Of Japan 55 319ndash24 (Food Sci Technol Abst 14 1194 1982)
157
Sidhu J S K Harinder A Kaur and MB Ram 1990 Functional and chapati making properties of hull- less barley supplemented wheat f lour J Food Sci Technol 27 311ndash313
Singh A K and N Nath 2004 Development and evaluation of whey protein enriched bael fruit (Aegle marmelos) beverage Journal of Food Science and Technology (Mysore) 41 432-436
Singh P A Shukla R Singh and K Singh 2007 Uti l ization of guava juice by value addit ion through blended BEVERAGES Acta Hort ( ISHS) international guava symposium 735639-645
Sloan AE 1999 Top ten trends to watch and work on for the mil lennium Food Technol 53(8) 40-424446485 l -S254-5860
Sloan AE 2002 The top 10 functional food trends The next generation Food Technol 56 32-57
Souci S W Fachmann W Kraut 1987 Food Composit ion and Nutrit ion Tables 198687 Wissenschaft l iche Verlagsgesellschaft Stuttgart
Steel RGD J H Torrie and DA Dickey 1997 Principles and procedures of stat ist ics - a biometrical approach (3r d edit ion) McGraw Hill Book Co Inc New York USA
Stein ER HE Brown and WF Mxclure 1986 Seasonal and storage effects on colour of red f leshed grape fruit juice J Food Sci 51(3) 574-76
Stockbridge H and A Glueck 1989 Photometric determination of cholesterol (CHOD-PAP method) Ecolinereg 2S Merck KGaA 64271 Darmstadt Germany J Lab Clin Med 114(2) 142-151
Stone BAand AE Clark 1992 Chemistry and Biology of (1rarr3) β -glucan Trobe University Press Victoria Austral ia LA
Suh HJ J M Kim and YM Choi 2003 The incorporation of sweet potato application in the preparation of a r ice beverage Int J Food Sci Technol 38(2) 145ndash151
158
Suortt i T L Johansson K Autio 2000 Effect of heating and freezing on molecular weight of oat β -glucan Abstract No 2 2000 American Association of Cereal Chemists Annual Meeting 2000
Swientek B 1998 Toasts of the town Prep Foods pp21-22 24 26
Tappy L E Gugolz P Wursch 1996 Effects of breakfast cereals containing various amounts of beta-glucan f ibers on plasma glucose and insulin responses in NIDDM subjects Diab Care 19 831ndash834
Temell i F CB Bansema KS Stobbe 2004 Development of an orange f lavored barley β -glucan beverage Cereal Chem 81 499503
Temell i F CB Bansema and KS Stobbe 2004 Development of an orange-flavored barley β -glucan Beverage with added whey protein isolate J Food Sci 69(7) 237-242
Tharmmakiti S M Suphantharika T Phaesuwan and C Verdyn 2004 Preparation of spent brewerrsquos yeast b-glucans for potential applications in the food industry Int J Food Sci Technol 3921- 29
Ti isekwa B TCE Mosha HS LASWAI and EE TOWO 2000 Tradit ional alcoholic beverages of Tanzania production quality and changes in quality during storage Intern J Food Sci Nutri 51135-143
Tsunagi K H Sugiyama and Y Shoji 2003 Barley B-glucan and its physiological function Arerugi no Rinsho 23949-953
Uusitupa MI J E Ruuskanen E Maumlkinen 1992 A controlled study on the effect of beta-glucan-rich oat bran on serum lipids in hypercholesterolemic subjects relat ion to apolipoprotein E phenotype J Am Coll Nutri 11651ndash9
Vasanthan T J Gaosong J Yeung and J Li 2002 Dietary f iber profi le of barley as affected by extrusion cooking Food Chem 77 35-40
Volikakis P CG Bil iaderis C Vamvakas and GK Zerfir idis Effects of a commercial oat β -glucan concentrate on the
159
chemical physico-chemical and sensory attr ibutes of a low-fat white-brined cheese product Food Res Int 37 83ndash94
Wallace H Yokoyama A Carol Hudson and BE Knuckles 1997 Effect of Barley beta-Glucan in Durum Wheat Pasta on Human Glycemic Response 0407-06R
Wendorf F R Schild NE Hadidi AE Close M Kobusiewicz H Wieckowska B Issawi and H Haas 1979 Use of barley in the Egyptian late Paleoli thic Sci 205 1341-1347
Westerlund E R Andersson and P Aman 1993 Isolation and chemical characterization of water-soluble mixed-l inked b-glucans and arabinoxylans in oat mil l ing fractions Carbo Poly 20115ndash12
Wood P J 1986 Oat b-glucan Structure location and properties In F H Webster (Ed) Oats Chemistry and technology (pp 121ndash152) Minnesota American Association of Cereal Chemists Inc
Wood P J J T Braaten WS Fraser D Riedel and L Poste 1990 Comparisons of the viscous properties of oat gum and guar gum and the effects of these and oat bran on glycemic index J Agric Food Chem 38753ndash7
Wood PJ D Paton I R Siddiqui 1977 Determination of β -glucan in oats and barley Cer Chem 54524ndash533
Wood PJ F W Braaten FW Scott KD Riedel MS Wolynetz and MW Coll ins 1994 Effect of dose and modification of viscous properties of oat gum on plasma glucose and insulin fol lowing an oral glucose load Br J Nutr 72731ndash743
Wood PJ I R Siddiqui and D Paton 1978 Extraction of High-Viscosity Gums from Oats 1978 Cereal Chem 551038 - 1049
Wood PJ I R Siddiqui and D Paton 1989 Extraction of High-Viscosity Gums from Oats Cereal Chem 55108-1049
Wood PJ J Weisz and BA Blackwell 1994a Structural studies of (1rarr3) (1rarr4)-β-D- glucans by 13C-nuclear magnetic resonance spectroscopy and by rapid analysis of cel lulose-l ike regions using high-performance anion-exchange
160
chromatography of ol igosaccharides released by l ichenase Cereal Chem 71 301-307
Wood PJ J Weisz P Fedec VD Burrows 1989 Large scale preparation and properties of oat fractions enriched in (13) (14)- β -D-glucan Cereal Chem 6697ndash103
Wood PJ J T Braaten FW Scott KD Riedel MS Wolynetz MW Coll ins 1994a Effect of dose and modification of viscous properties of oat gum on plasma glucose and insulin fol lowing an oral glucose load Brit ish J Nutri 72731ndash743
Wood PJ J T Braaten WS Fraser D Riede and LM Poste 1990 Comparisons of viscous properties of oat and guar gum and the effects of these and oat bran on glycemic index J Agric Food chem 38753-757
Wood PJ MU Beer G Butler 2000 Evaluation of role of concentration and molecular weight of oat β -glucan in determining effect of viscosity on plasma on plasma glucose and insulin fol lowing an oral glucose load Brit J Nutr 8419-23
Wood PJ MU Beer 1998 Functional oat products In Mazza G editor Functional Foods Biochemical and Processing Aspects Technomic Publishing Co Lancaster PA p 1ndash37
Wu YV GE Stringfel low 1994 Protein and β -glucan enriched fractions from high protein high β -glucan barleys by sieving and air classif ication Cereal Chem 71(3) 220-223
Wursch P F X Pi-Sunyer 1997 The role of viscous soluble f iber in the metabolic control of diabetes A review with special emphasis on cereals r ich in beta-glucan Diab Care 20 1774 ndash 1780
Wursch P F X Pi-Sunyer 1997 The role of viscous soluble f ibre in the metabolic control of diabetesmdasha review with special emphasis on cereals r ich in beta-glucan Diabetes Care 201774ndash1780
Yu L J Perret M Harris J Wilson and S Haley 2003 Antioxidant properties of bran extracts from Akron wheat grown at different locations J Agric And Food Chem 51 1566-1570
161
ZhangG W Junmei C J inxin 2002 Analysis of b glucan content in barley cult ivars from different locations of China Food Chemi 79 251- 254
Ziena HMS 2000 Quality attr ibutes of Bearss Seedless l ime (Citrus lat i fol ia Tan) juice during storage Food Chem 71167-172
162
APPENDIX I
COMPOSITION OF FUNCTIONAL BEVERAGE
Ingredients Concentration (ww)
Water 890
β -Glucan or Pectin 02 0 4 0 6 0 8 and 10
Sucrose 50
High fructose corn syrup 50
Citric acid 027
Ascorbic acid 003
Β -Carotene 10ppm
Natural orange f lavor 001
Terpeneless orange peel oi l 0 0005
163
APPENDIX II
9 POINT HEDONIC SCALE PRODUCT FUNCTIONAL BEVERAGE DATE __________ NAME OF JUDGE __________________________
SAMPLE NAME Color Flavor Sweetness Sourness Overall acceptability T1 T2 T3 T4 T5 T6
REMARKS (IF ANY) _________________________________________ _________________________________________ __________________________________________ KEY FOR RANKING Dislike extremely 1 Dislike very much 2 Dislike moderately 3 Dislike slightly 4 Neither dislikes nor like 5 Like slightly 6 Like moderately 7 Like very much 8 Like extremely 9
164
APPENDIX III
UNIVERSITY OF AGRICULTURE FAISALABAD
National Institute of Food Science and Technology
Name of the Project
Development of Functional Beverage from Barley
I have been explained in detail the purpose and rationale of the above
mentioned component of the Barley Functional Beverage I understand that
this project is of national significance and my full commitment and dedication
with it will be of paramount importance I am volunteering for it I have had a
chance to ask questions and answered them I undertake that I will abide by
all the instructions given by the investigators and will use the same Barley
Functional Beverage given to me in the designated period Further I am
bound to fill the questionnaire at the end of the week to best of my
knowledge
Name amp Signature of the Subject Dated
Name amp Signature of the Person obtaining consent Dated
Name amp Signature of the Researcher Dated
Name amp Signature of the Principal Investigator Dated
165
APPENDIX IV DEMOGRAPHIC INFORMATION PERFORMA (SUBJECTS)
Group A = Control (0 β -g lucan)
No Name Age (y ) Locat ion
1 Muhammad Umair Arshad 28 195-A Gul i s tan Colony 2 Fa isa labad Pak is tan
2 Moazzam Raf iq Khan 33 290-A Ghulam Muhammadabad Fa isa labad Pak is tan
3 Shahzad Hussa in 29 12-B Chakwal Pakis tan
4 Mian Anjum Murtaza 30 123-C Peoples Colnoy 2 Fa isa labad Pak is tan
5 Tauseef Sul tan 29 Room 32-D Hashmi Hal l UAF Fa isa labad Pak is tan
Group B = (0 2 β -g lucan)
1 I ssa Khan 31 Room 3 -W Afzal Hal l Uaf Faisa labad Pak is tan
2 Muhammad Nasi r 30 29-B Peoples Colony 2 Faisa labad Pak is tan
3 Muhammad Ibrar 31 146-A Samnabad Fa isa labad Pakis tan
4 Muhamamd Saeed 35 280 E Si r Syed Town Faisa labad Pakis tan
5 Tahir Nadeem 30 Room 4 -W Qazzafi Hal l UAF Faisa labad Pak is tan
Group C = (0 4 β -g lucan)
1 Ghulam Mueen ud din 36 116-F Nisar Colony Faisa labad Pakis tan
2 Mubashar Hussain 30 111-B gul is tan colony 2 Fa isa labad Pak is tan
3 Muhammad Asim Shabbir 31 P-55 Afshan Colony Fa isa labad Pakis tan
4 Muhammad Faisa l 34 111-B gul is tan colony 2 Fa isa labad Pak is tan
5 Muhammad Nadeem 26 Room 23-D Ayub Hal l UAF Faisa labad Pak is tan
Group D = (0 6 β -g lucan)
1 Imran Pasha 36 54 -C Lasani Town Fa isa labad Pakis tan
2 Dr Nuzhat Huma 48 Hous 6 Universi ty Residence UAF Fa isa labad Pakis tan
3 Asim Ehsan 35 80-A Si tara Sapna City Faisa labad Pak is tan
4 Farhan Ahmad 27 Room 24 Ayub Hal l UAF Faisa labad Pak is tan
5 Muhammad Imran 27 21-K Gul is tan Colony 1 Faisa labad Pak is tan
- TITLE PAGEdoc
-
- ACKNOWLEDGMENTS
-
- CONTENTS
- ABSTRACT
- INTRODUCTION
- 1
- 2
- R
- 6
- 3
- M
- 3
- 4
- R
- 5
- 5
- S
- 1
- C
- 1
- R
- 1
- L
- 1
-
- FINAL THESISdoc
-
- LITERATURE CITED
- AACC 2000 Approved Methods of American Association of Cereal Chemists The American Association of Cereal Chemists Inc St Paul Minnesota USA
-
- Bryan D J Robert AT Wilson T Carlson S Frazer GH Zheng 2003 β-Glucan Fractions from Barley and Oats Are Similarly Antiatherogenic in Hypercholesterolemic Syrian Golden Hamsters The American Society for Nutritional Sciences J Nutri Metabolism 133468-475
- Ruck JA 1963 chemical method for analysis of fruit and vegetable products Canadian Deptt Agri PubNo1154
-
- Suh HJ JM Kim and YM Choi 2003 The incorporation of sweet potato application in the preparation of a rice beverage Int J Food Sci Technol 38(2)145ndash151
-
- Tharmmakiti S M Suphantharika T Phaesuwan and C Verdyn 2004 Preparation of spent brewerrsquos yeast b-glucans for potential applications in the food industry Int J Food Sci Technol 3921- 29
-
- ZhangG W Junmei C Jinxin 2002 Analysis of b glucan content in barley cultivars from different locations of China Food Chemi 79 251- 254
-

Dedicated
to my Beloved Parents
ACKNOWLEDGMENTS
All praises and thanks are for Almighty Allah the Merciful the only creator of
the universe and source of all knowledge and wisdom who blessed me with health
thoughts talented teachers helping friends and opportunity to complete this study I
offer my humblest thanks to Holy Prophet Hazrat Muhammad (Peace be Upon Him)
whose moral and spiritual teachings enlightened my heart mind and flourished my
thoughts towards achieving high ideals of life
I am grateful to my supervisor Professor Dr Faqir Muhammad Anjum Director
General National Institute of Food Science and Technology University of Agriculture
Faisalabad for his supervision in planning execution and scholarly ideas that beautified
the scientific nature of the research work presented in this manuscript He always
directed to enlighten the ways of life as well
I am thankful to the members of my supervisory committee Dr Tahir Zahoor
Associate Professor National Institute of Food Science and Technology and Dr Haq
Nawaz Institute of Animal Nutrition and Feed Technology for their kind help and
constructive criticism during the course of study for the accomplishment of this piece of
work
I am also very grateful to all my teachers of the National Institute of Food Science
and Technology University of Agriculture Faisalabad for their technical guidance
moral support and prayers to accomplish this study
My sincere gratitude is to all my friends especially Moazzam Rafiq Khan Dr
Muhammad Saeed Dr Shahzad Hussain Dr Umair Arshad and rest of the Ph D club
and juniors especially Muhammad Nadeem who always helped me to complete my
work I feel it incomplete if I do not extend my fervent thanks and heartiest compliments
to my father and mother aunties brothers and sisters bhabis cousins nephews and
nieces for remembering me in their prayers and whose act always enforced me to update
my knowledge
(AHMAD DIN)
CC OO NN TT EE NN TT SS
CHAPTER TITLE PAGE
ABSTRACT
1 INTRODUCTION 1
2 REVIEW OF LITERATURE 6
3 MATERIALS AND METHODS 39
4 RESULTS AND DISCUSSION 56
5 SUMMARY 131
CONCLUSIONS 136
RECOMMENDATIONS 137
LITERATURE CITED 138
APPENDICES 162
List of Tables
Table Title Page
31 Treatment plan 46 32 Different treatments used in the biological study 54 41 Chemical composition of barley flour 57 42 Chemical Analysis of β-glucan 59 43 Mean sum of squares for color values (L a b) of stored β-glucan
beverages 62
44 Effect of treatments and storage intervals on the L-value of stored β-glucan beverages
63
45 Effect of treatments and storage intervals on the a-value of stored β-glucan beverages
66
46 Effect of treatments and storage intervals on the b-value of stored β-glucan beverages
68
47 Mean sum of squares for viscosity specific gravity and total soluble solids (TSS) of stored beverages
71
48 Effect of treatments and storage intervals on the viscosity of stored β-glucan beverages
72
49 Effect of treatments and storage intervals on the specific gravity of stored β-glucan beverages
75
410 Effect of treatments and storage intervals on the total soluble solids of stored β-glucan beverages
76
411 Mean sum of squares for pH acidity and ascorbic acid content of stored beverages
78
412 Effect of treatments and storage intervals on the pH of stored β-glucan beverages
79
413 Effect of treatments and storage intervals on the acidity of stored β-glucan beverages
82
414 Effect of treatments and storage intervals on the ascorbic acid contents of stored β-glucan beverages
84
415 Mean sum of squares for reducing non reducing and total sugar content of stored beverages
87
416 Effect of treatments and storage intervals on the reducing sugars of stored β-glucan beverages
88
417 Effect of treatments and storage intervals on the non reducing sugars of stored β-glucan beverages
90
418 Effect of treatments and storage intervals on the total sugars of stored β-glucan beverages
92
Table Title Page
419 Effect of treatments and storage intervals on the total plate count
(CFUml) of stored β-glucan beverages 94
420 Mean sum of squares for sensory evaluation of stored beverages 96 421 Effect of treatments and storage intervals on the color score of
stored β-glucan beverages 97
422 Effect of treatments and storage intervals on the flavor score of stored β-glucan beverages
100
423 Effect of treatments and storage intervals on the sweetness score of stored β-glucan beverages
103
424 Effect of treatments and storage intervals and on the sourness score of stored β-glucan beverages
105
425 Effect of storage intervals and treatments on the overall acceptability score of stored β-glucan beverages
108
426 Mean sum of squares for blood lipid profile of volunteers 110 427 Effect of β-glucan supplemented beverage on serum total
cholesterol content (mgdl) of healthy subjects 111
428 Effect of β-glucan supplemented beverage on serum Triglycerides content (mgdl) of healthy subjects
115
429 Effect of β-glucan supplemented beverage on serum LDL content (mgdl) of healthy subjects
119
430 Effect of β-glucan supplemented beverage on serum HDL content (mgdl) of healthy subjects
123
431 Mean sum of squares for blood glucose contents of volunteers 127 432 Effect of β-glucan beverage on blood glucose (mgdl) content of
with different time intervals 127
433 Interactive effect of diets and time scale intervals on the blood glucose contents (mgdl) of volunteers
127
434 Interactive effect of diets and study duration on the blood glucose contents (mgdl) of volunteers
128
List of Figures
Fig Title Page
31 Preparation of β -glucan beverage 47 41 Percent decrease in the serum total cholesterol level of subjects fed
on different beverages 111
42 Effect of β-glucan beverage on Total Cholesterol (mgdl) content of healthy volunteers
112
43 Percent decrease in the serum triglycerides level of subjects fed on different beverages
115
44 Effect of β-glucan beverage on Triglyceride (mgdl) content of healthy volunteers
116
45 Percent decrease in the serum LDL level of subjects fed on different beverages
119
46 Effect of β-glucan beverage on LDL (mgdl) content of healthy volunteers
120
47 Percent increase in the serum HDL level of subjects fed on different beverages
123
48 Effect of β-glucan beverage on HDL (mgdl) content of healthy volunteers
124
49 Effect of β-glucan beverage on blood glucose (mgdl) content of healthy volunteers
128
List of Appendices
Appendix Title Page
I Composit ion of functional beverage 162
II 9 Point Hedonic Scale 163
III Food frequency questionnaire 164
IV Demographic information performa (subjects) 165
ABSTRACT
The research project was carried out to explore the health
benefi ts of barley β -glucan in beverage Beverages were prepared
with different levels of β -glucan and then analyzed for various
quali ty attr ibutes during storage The L a and b value for color of
beverages increased signif icantly by increasing the level of β -glucan
The highest viscosity (2175 mPa-s) and total soluble sol ids
(1042ordmbrix) were found in T6beverage containing 1 β -glucanThe
pH decreased signif icantly in al l beverages throughout the storage
period Total acidity and ascorbic acid varied signif icantly as a
function of storage The reducing sugars increased from 372 to 4 31
from 0 to 90 days of storage respectively The total plate count of
beverages decreased from 129 times 10 4 to 1 17 times 10 4 at the end of the
storage The scores assigned to al l the sensory parameters of
beverages affected signif icantly with the variat ion in the levels of β -
glucan and decreased signif icantly during storage intervals The
treatments T2 T3 and T4 got containing 0 2 0 4 and 06 β -glucan
got highest scores for sensory evaluation Total cholesterol glucose
LDL-C and tr iglyceride contents in serum of adult humans fed on
beverages decreased signif icantly whereas concentrat ion of HDL
improved due to incorporation of β -glucan in beverages The
beverage with 0 6 β -glucan contributed to reduce the serum
glucose of human subjects by 1018 cholesterol by 8 26
tr iglycerides by 1099 and LDL by 1082 The present study
suggests that β -glucan is a funct ional ingredient and can be used to
prevent cardiovascular diseases and also to control diabetes
1
CHAPTER-1
INTRODUCTION
Cereals are considered one of the most important economic
and food commodities in the world The cereals grains are
harvested over 1 bi l l ion tones annually The barley (Hordeum
vulgare L ) accounts for 12 of the worlds total cereal production
and occupies fourth posit ion with respect to grain production
after wheat r ice and corn (Jadhav et a l 1998) The barley grain
was produced 13747 mil l ion metric tones in the world during the
crop year 2006-2007(FAS 2008) The leading barley producing
countries in the world are EU countries (5165 mil l ion tones)
fol lowed by the Russian Federat ion (2501 mil l ion tones) and
Canada (1317 mil l ion tones) (Brennan and Cleary 2005) In
Pakistan production of barley grain was 98000 tones harvested
from an area of 92000 hectares during the crop year 2007-08
(GOP 2007-08) In world approximately 81 of annual barley
production is used for feed 9 for seed 8 for malt and alcohol
production and only 2 is used for human consumption (AERI
1986) Like other countries this crop is also mainly goes for
feeding the animals and its human consumption is very l imited in
Pakistan The variet ies such as Jau-83 Jau-87 Haider-93 and some
promising hulless l ines of barley developed are being cult ivated
commercial ly in Pakistan
Barley is gett ing renewed interest as an ingredient in the
production of functional foods due to i ts higher content of
bioactive compounds Barley possesses high amount of dietary
2
f iber (DF) with high proportion of soluble viscous components
offering more suitabil i ty among cereal grains in the human diet
(Bjorck et a l 1990) The barley in the world is used mainly as an
animals feed in the form of barley meal and as grain for malting
and brewing for manufacturing of beer and whisky The research
has been focussed mainly on assessing the role of endospermic
components in relation to malting potential of barley grain
(Molina-Cano et a l 2002) However the barley grain has been
relatively under-uti l ized with respect to i ts potential use as a
human food The potential use of β -glucan extracted from barley
and other cereal grains as a functional ingredient in different
foods has received more attention in the recent years (Malkki
2004) There are some new waxy hulless barley variet ies l ike
Prowashonupana have also been developed which possess unique
macronutrient composit ion with higher content of f iber and
protein and lower amount of starch as compared to other common
cereal grains The barley can potential ly be used to develop and
formulate products with improved health benefits and a variety of
health c laims This particular barley grains can be used to
enhance the f lavor texture appearance and nutrit ional
composit ion for a variety of food product applications including
hot cereals cookies crackers breads tort i l las granola bars fruit-
f i l led cereal bars extruded snacks and pastas The functional
f lexibil i ty of barley al lows it to be used in foods that span across
meal occasions including muffins and ready-to eat cereals for
breakfast soup vegetarian patt ies and pizza crackers and
extruded chips for snacks and cookies and toppings for dessert
and development of different beverages ( Arndt 2006)
3
The barley contains substantial ly higher amounts of
functional ingredient i e β -glucan but oat and some fungi and
moulds also possess good amount of β -glucans The use of β -
glucan extracted from barley as a human food due to i ts posit ive
role in human health has received a growing attention The cel l
wall of barley and oat contains β -glucan a non starch
polysaccharide composed of β - (1-4)- l inked glucose units
separated every two to three units by a single β - (1-3)ndashl inked
glucose and referred to as a mixed l inkage β -glucan (Carpita
1996)
In human diet the health promoting properties of β-glucan
have been demonstrated High-serum cholesterol one of the
important r isk factor for coronary heart disease (Anderson 1986)
is reduced by the intake of β -glucan which wil l ult imately the
risk of cardiovascular diseases The soluble dietary f iber
component may assist in regulation of blood glucose and lowering
of serum cholesterol (Anderson 1980) The β -glucan a soluble
f iber extracted from oat or consumed as oat porridge reduced
postprandial blood glucose (Wood et at 1990) β -glucan delays
glucose absorption which regulates the level of blood glucose
(Wood et a l 1994) The viscous nature of β -glucan physically
slows glucose absorption in the gut This property of β -glucan
may be useful in the formulation of food products targeting
management of diabetes
In recent years human health has received an unprecedented
important status The interests in nutrit ion f i tness and beauty
have main concerns over diet and human health in todayrsquos l iving
style The foods which should provide additional physiological
4
benefits such as preventing or delaying onset of chronic diseases
besides meeting basic nutrit ional requirements are known as
functional foods (Nicoli et a l 1999) Functional foods including
functional beverages are important for their role in health
promotion and disease prevention The functional foods are not
intended only to satisfy hunger but also provid necessary
nutrients to human for prevention of nutrit ion-related diseases
(Menrad et a l 2000) The growing interest in new functional
foods with special characterist ics and health benefits has led to
the development of new functional beverages The global market
of functional food has been estimated to be at least 33 bi l l ion US$
(Hil l iam 2000)
The functional beverages can play an important role in
health promotion and disease prevention They provide means to
reduce the increasing burden on the health care system by a
continuous preventive mechanism (Shahidi 2004) The functional
beverages not only provide taste and refreshment satisfaction but
can also provide necessary nutrients to prevent nutrit ion-related
diseases (Menrad et a l 2000) Beverages are considered to be an
excellent medium for the supplementation of nutraceutical
components for enrichment (Kuhn 1998) such as soluble f iber or
herbal extract (Swientek 1998)
The functional beverage may enrich the diet and improve
health of human because of i t ease of consumption along with a
usual meal Barley β -glucan assume to be well suited for such an
functional application being capable of imparting a smooth
mouth feel to beverage products and providing an excellent
source of soluble dietary f iber A barley β -glucan gum with
5
similar functional properties could potential ly serve as an
alternative to tradit ional beverage thickeners such as alginates
pectin xanthan and carboxymethylcel lulose (Giese 1992)
Barley tea is a common drink in Japan especial ly during the
summer This non-caffeinated non-tannin drink is valued for i ts
high percentage of β - glucan (polysaccharides) and the presence
of antioxidant compounds (Etoh et a l 2004 Tsunagi et a l 2003)
The use of β -glucan due to i ts good viscosity forming properties
offer potential alternatives as thickening agents in different food
applications e g ice creams sauces and salad dressings (Wood
1986) The uti l ization of barley β -glucan as an ingredient in the
production of a functional beverage has not been fully exploited
so far
The nutrit ional and functional benefits of β -glucan including
thickening stabil izing emulsif ication and gelation revealed that
β -glucan from barley can be used for the preparation of functional
beverage Therefore this study was planned to extract the β -
glucan from Pakistani barley variety (Haider-93) and its
uti l ization for the development of functional beverage Therefore
the mandate of the present study was as under
bull To develop a suitable formulation and processing procedure for a functional beverage with incorporation of barley β- glucan
bull To evaluate quality parameters and acceptabil i ty of functional beverage
bull To examine the shelf stabil i ty of β -glucan beverage using instrumental techniques
bull To evaluate the effect of β -glucan beverage on the glucose level and l ipid profi le of human volunteers
6
CHAPTER-2
REVIEW
OF
LITERATURE
Cereal β -glucan is a soluble dietary f iber and offers
potential for food products The beverages are one of the best
media for incorporation of β -glucan The characterist ic properties
desired in the beverage such as color f lavor and mouth feel make
the barley β -glucan an ideal grain over other cereals such as
sorghum and wheat (Bamforth and Barclay 1993) I t also exhibits
some health benef its such as lowering of blood glucose level and
prevention of cardiovascular diseases By manipulating the β -
glucan and protein contents of barley numerous types of malt
(beer) and other beverages are l ikely to satisfy various human
tastes (Munk 1981)
The l i terature pertaining to different aspects of the present
study is reviewed under fol lowing headings
2 1 Barley History composit ion and types
22 Role of dietary f iber
23 β -glucan Sources and occurrence
2 4 β -glucan extraction
7
25 Health benefits of β -glucan
26 Functional properties of β -glucan
27 Uti l ization of β -glucan in food products
28 Physico-chemical characterist ics of beverages
21 Barley History composition and types
The cereals are defined as edible seeds of the grass family
Gramineae (Bender and Bender 1999) The cereals are cult ivated
for their nutrit ious edible seeds often referred as grains and
used as staple food for the human consumption and l ivestock feed
since the early civi l ization (BNF 1994) Cereal grains contribute
signif icant amounts of energy protein and micronutrients to the
human diet and contain a large number of biologically active
substances including antioxidants dietary f iber phytoestrogens
and l ignans (Hil l and Path 1998)
Barley (Hordeum vulgare L ) competes with wheat regarding
the most ancient cereal crop I t referred as the original ancient
cereal grains consumed around the world throughout the history
Barley has been recorded as being cult ivated along the Nile River
thousands of years ago dating back to Egyptian t imes (Wendorf et
a l 1979) Barley is an old crop and its cult ivation mentioned in
the Bible Due to i ts cold drought alkali and salt tolerance i t is
grown at 70degN lati tude in Norway as well as in regions close to
the equator at high alt i tudes (Poehlman 1985) With respect to
world cereal grain production barley ranks fourth fol lowed by
wheat r ice and corn (Nilan and Ullrich 1993) Barley is a major
crop for malt ing brewing and for food production industries in
8
the developed countries and it is uti l ize as fodder crop in the less
developed and developing countries (Kent and Evers 1994)
Barley is a typical cereal grain composed primarily of starch
protein f iber l ipids and minerals The typical composit ion of
barley is outl ined in Table 21 (MacGregor and Fincher 1993)
Barley is a source of protein typically contains 10-12 in the
whole grain containing more of the essential amino acids
particularly lysine which is the f irst l imiting amino acid in the
wheat (Chung and Pomeranz 1985) Barley proteins can be
grouped as storage and non-storage proteins Storage proteins
include the prolamins (hordeins) and globulins as defined by
Osborne protein classif ication (Shewry 1993) Being high
molecular weight water soluble polymers they have unique
properties with both nutri t ional and technological s ignif icance
They are not digested by mono gastric animal which is one reason
for the low use of barley as poultry feed (Wood 1984) I t has
recently been rediscovered as a nutrit ious food grain for the
human diet and is expected to see some increase in food
applications in the near future The starch portion of the grain is a
good source of digestible carbohydrate necessary for energy
(MacGregor and Fincher 1993)
There are generally two types of barley hulled and hull- less
barley Hull- less barley contains more protein starch and β -
glucan than hulled barley I t is a good source of f iber in general
and of soluble f iber such as β -glucan in particular (Bhatty 1999)
Most of the barley used in the world today is covered (Hulled) as
covered barley is preferred in brewing industry Naked barley is
therefore advantageous to use in food production since no hull
9
needs to be removed and thus al l nutrients are retained In
addition using naked barley for malting has previously been
shown to produce malt with a composit ion and enzyme activit ies
comparable to that of normal malts (Bhatty 1996)
Table 21 Typical chemical composition of barley grain
Component Percent Component Percent
Starch 63-65 Lipids 2-3
Sucrose 1-2 Albumins and globulins 35
Other sugars 1 Hordeins 3-4
Water soluble polysaccharides 1-15 Glutel ins 3-4
Alkali soluble polysaccharides 8-10 Nucleic acids 02-03
Cellulose 4-5 Minerals 2
Adapted from MacGregor and Fincher (1993)
In a study two cult ivars of hull- less barley Scout ( two-
rowed) and Tupper (six-rowed) were uti l ized to prepare f lour and
similarly ground fine-pearled and the pearled grain These three
fractions were used to evaluate physiochemical and functional
(bread making) properties The fractions contained 133-189
10
protein 1 1-21 ash and 08-16 fiber palmitic (160) oleic
(181) and l inoleic (182) were the major fatty acids (Bhatty 1986)
Kiryluk et a l (2000) mil led barley to produce the end-
products f ine and coarse-grained f lours middlings and f ine grits
These products differed in their average contents of β -glucan
total dietary f iber ash and protein This product with a weight
yield of 186 contained 672 β -glucan 2512 total dietary
f iber 2 19 ash and 1583 protein All these values were at
about 50 72 55 and 24 respectively higher than in
dehulled barley
Holtekjolen et a l (2006) observed a strong posit ive
correlation between the β -glucan and the amount of soluble non-
starch polysaccharides (NSP) as well as β -glucan and protein
contents The analyzed hull- less and a typical amylose variety
seem suitable for human consumption where high soluble f iber
and nutrit ive contents are desirable These variet ies contained
high contents of β -glucan soluble NSP protein and lower starch
content and could therefore also be suitable for functional food
products aimed at health benefits and cancer prevention
22 Role of dietary fiber
Different countries and research groups have adopted
different definit ions for dietary f iber which has led to
inconsistent results Therefore a committee was formulated by the
American Association of Cereal Chemists (AACC) to evaluate the
definit ions and methodologies used An updated definit ion was
prepared by this committee in 2001 which concluded that ldquoDietary
f iber is the edible parts of plants or analogous carbohydrates that
11
are resistant to digestion and absorption in the human small
intestine with complete or partial fermentation in the large
intestinerdquo (DeVries 2001)
Dietary f iber includes polysaccharides ol igosaccharides
l ignin and associated plant substances and the data regarding the
beneficial effects of dietary f iber more than two decades have
been recorded According to Schneeman (2001) dietary f iber
regulates the rate of nutrient digestion and absorption serves as a
substrate for the microflora of the gut and promotes laxation The
dietary f iber to foods is usually added for improving their
nutrit ional characterist ics (Brennan and Cleary 2005) However
dietary f iber have both physiological and technological
properties and its addition wil l also alter processing and
handling of foods as well as their texture color f lavor and taste
Many reports demonstrating the role and physiological
functioning of dietary f iber in human health and are involved in
reduction in cardiovascular diseases colorectal cancer and blood
cholesterol and glucose level
Intake of total dietary f iber especial ly from cereal and grain
products (Bingham e t a l 2003 Jansen et a l 1999) can act as a
shield against diabetes (Maier et a l 2000 Schulze et a l 2004) I t
also helps in smooth bowl movement (Sanjoaquin et a l 2004) and
it is effective against constipation (Dohnalek et a l 2004) The
foods r ich in dietary f ibre provide low energy to the body and
interfere with absorption of harmful compounds There dietary
f iber also showed to decrease the serum cholesterol levels (Brown
et a l 1999)
12
Water-retention capacity is another important function of
dietary f iber According to their water solubil i ty dietary f iber can
be classif ied in to two grouprsquos i e soluble and insoluble f ibers
Soluble f ibers include mainly gums pectin and mucilage while the
insoluble f ibers include cel lulose hemicelluloses and l ignin
(Izydorczyk et a l 2002) Barley β -glucan which is soluble dietary
f iber can successfully be used in food system
23 β -glucan Sources and occurrence
The term β - (1rarr3)-D-glucan includes a very large number of
polysaccharides from bacterial fungal and vegetable sources
Their structures have a common backbone of β - (1rarr3) l inked
glucopyranosyl units but the polysaccharidic chain can be β-(1rarr6)
branched with glucose or integrate some β -(1rarr4) l inked
glucopyranosyl units in the main chain (Brennan and Cleary
2005)
The barley crop is used for human consumption due to the
presence of i ts functional ingredients Among al l the cereals
barley and oat are famous for β-glucan Mixed-l inkage (1rarr3)-
(1rarr4)-β-D-glucan or β -glucan is the most abundant component
of the soluble dietary f iber in both oats and barley I t is a l inear
and partial ly water soluble polysaccharide that consists only of
glucose I t is a soluble f iber component found predominantly in
other cereal crops The (1rarr3)-(1rarr4)-β -D-glucan is cel l wall
polysaccharide of cereal endosperm and aleuronic cel ls
Environmental conditions seem to exert a signif icant effect on the
β -glucan content of the cereal grain (Aastrup 1979)
13
β -glucan is one of the minor constituents in barley grains I t is
primarily associated with genotype and is s ignif icantly affected
by the environmental conditions There is a variation in barley β -
glucan content between different locations as documented by
Aman et a l (1989) Zhang et a l (2002) determined and extracted
β -glucan content of barley cult ivars collected from various areas
of China as well as from Canada and Australia by an enzymatic
method For 164 cult ivars originating from China β -glucan
content ranged from 298 (Sumei 21) to 862 (QB25) with a
mean of 4 58 Ragaee et a l (2001) also demonstrated that the
primary sources of β -glucan in the human diet are oats barley
rye and wheat The levels of β -glucan in dehulled or naked oats
and most dehulled or naked barleys range mostly from about 3
to 7 (Lee et a l 1997) in rye about 2 and in wheat less than
05 (Beresford and Stone 1983)
The structures of β -glucan in barley and oat are different
(Wood 1994) Barley β -glucan was found to contain one quarter β -
(1rarr3) l inked units whereas oat β -glucan contained
approximately one third The oat β -glucan structure therefore
contains more β -(1rarr3) l inkages than barley β -glucan (MacGregor
and Fincher 1993) The oligosaccharide with DP3 i e 3-O-β -
cel lobiosyl-D-glucose is the main product and DP4 i e 3-O-β -
cel lotriosyl-D-glucose comes second These two constitute over
90 of the total β -glucan content (Wood et a l 1994) For
structural differences of β-glucan often DP3DP4 ratio is used as
indicator (Izydorczyk et a l 1998a) According to many authors
this ratio is lower for oat than for barley β -glucan Structural
differences have also been reported to exist between soluble and
14
insoluble β -glucans with the ratio DP3DP4 being higher for
insoluble than for soluble β-glucans (Izydorczyk et a l 1998b)
24 Extraction of β -glucan
Various techniques for the isolation of βndashglucan have been
developed β -glucan from barley and oat could be isolated by dry
mill ing and solvent extraction (Wu et al 1994 Dawkins and
Nnanna 1993 Saulnier et al 1994) Among both isolation
methods about 89 βndashglucan could be recovered by solvent
extraction and only 31 by dry mill ing and air classif ication (Wu
et al 1994) from barley and oat However 41-81 βndashglucan on
dry matter basis could be extracted by using neutral or an alkaline
medium (Burkus and Temell i 1998) Furthermore more than 90
extraction could be achieved by hot water extraction (Morgan et
al 1998)
Bhatty (1995) compared different solvents for the extraction
of β -glucan from one sample of hull- less barley bran and revealed
that sodium hydroxide was the most eff icient solvent for
extraction The extraction with sodium hydroxide removed 84 of
the β -glucan compared to 72 by sodium carbonate solution and
only 61 by sequential extraction with water at 40 65 and 95degC
The amount of β -glucan is an important factor in considering
health ef fects In the isolation processes some β -glucan may be
lost Thus the total β -glucan content can not be determined from
the isolated β -glucan (Rimsten et a l 2003) The most frequently
used method for β -glucan determination is i l lustrated by
Association of Official Analytical Chemists (AOAC 1995) This
method involves the dissolution of β -glucan in a buffer
15
hydrolysis with the l ichenase enzyme to ol igosaccharides and
with β -glucanase to glucose Glucose is then analysed
spectrophotometrical ly as a colored substance obtained with an
oxidaseperoxidase reagent (Lambo et a l 2005)
Burkus and Temeil i (1998) have reported that extraction
conditions such as pH and temperature profoundly affect the
viscosity of solutions prepared with β -glucan concentrates I f a
higher concentrat ion of β -glucan is desired in a product low
viscosity extracts may be uti l ized (Burkus 1996)
Carr (1990) explored an improved method for the
determination of (1rarr3)-(1rarr4)-β -D-glucan in cereals and their
products The method includes refluxing of 80 (vv) ethanol to
remove sugars and inactivate of enzymes prior to extraction with
water at 100ordmC for soluble β -glucan determination For several
different food products soluble β -glucan content ranged from
049 to 390 whereas total β -glucan content ranged from 058 to
886 (dry weight basis) The dietary f iber ranged from 48 to
220 for the products
Extraction conditions also determine the properties of
extracted β -glucan Wood et al (1977) extracted the β -glucan gum
pellets through alkali extraction method from oats (Avena sat iva
L) The researchers found that various condit ions such as
temperature pH and ionic strength of the extraction media
affected the β -glucan yields βndashglucan could also be extracted by
using dist i l led water and 4 sodium hydroxide All treatments
differ in their yield and physiochemical properties Extracted
conditions have a great bearing on viscosity properties of β -
16
glucan excessive boil ing during extraction resulted in low
viscosity β -glucan Stable barley β -glucan gum with high viscosity
can be obtained using suitable combination with high pH
(Johansson et al 2000) Recently another method was developed
by Izydorczyk et al (1998) for the extraction of β -glucan through
sequential extraction with water Ba(OH)2 Ba(OH)2H2O and
NaOH In this method each barley sample was extracted 2ndash3 t imes
and the isolated material was combined
The βndashglucan extraction methods for pilot plant levels have
been developed that includes refluxing with 75 ethanol for four
hours prior to extraction-deactivated glucan The pilot plant
extracted gum has less viscosity than bench gum this is due to
high shear rates enzyme activity of fungi and bacteria in pilot
plant conditions (Wood et al 1989) The foods containing βndash
glucan needs viscosity stabil i ty for increased shelf l i fe In another
study i t is found that i f 1N sodium hydroxide is used for βndash
glucan extraction from barley and oat i t affect βndashglucan activity
(Bhatty 1995) The enzymes (glucanase) present naturally or
produce from microorganisms and it is investigated that
enzymatic hydrolysis create problem during production and food
application Scientists noticed higher activity of endo (1rarr3) β -D-
glucanase than endo (1rarr3) (1rarr4) β-D-glucanase (Brunswick et al
1987) Similarly steaming and kilning inactivate l ipases of barley
microbial enzyme are more heat stable than the endogenous
glucanases (Balance and Meredith 1976 Wood et al 1989)
Similarly a method of pure β -glucan extraction has been
provided by Westerlund et a l (1993) and this method involves
defatt ing with propan-2-ol ( isopropanol IPA) and petroleum
17
ether dissolution in water at 96 degC and hydrolysis of starch with
heat-resistant α -amylase The polysaccharides are precipitated
with 60 ethanol at 4 degC and the precipitate is dissolved in water
The solution is treated with 30 (NH4)2SO4 which specif ical ly
precipitates β -glucan but leaves arabinoxylans in solution The
precipitate is dissolved in water and dialyzed against water at
room temperature
25 Health benefits of β -glucan
Barley grain bas been shown to be an excellent source of
both soluble and insoluble f iber and according to dieti t ians and
health professionals i t should be extensively used in diets to
improve health (Oscarsson et a l 1996) During the last 10 years
studies have identif ied a low glycemic-index (GI) diet as
beneficial in relation to the insulin-resistance syndrome Several
semi-long-term dietary interventions are available for healthy
subjects and for subjects with metabolic diseases With a few
exceptions these studies have shown that a low-GI diet not only
improves certain metabolic consequences of insulin resistance but
also reduces insulin resistance per se (Del Prato et a l 1994) In
addition to improvements in glucose and l ipid metabolism
(Jenkins et a l 1987 Brand et a l 1991 Jarvi et a l 1999) there are
indications of improvements in the f ibrinolytic activity (Jaumlrvi et
a l 1999) suggesting a beneficial role in diabetes and
cardiovascular disease I t has been est imated that a 3 85 unit
reduction in GI can be perceived per gram of β -glucan f iber in a
50 g carbohydrate portion of food The viscosity of the f iber
relates posit ively to the degree of f lattening of postprandial
glycemia (Wood et a l 1994 Jenkins et a l 1978)
18
The potential physiological mechanisms behind the eff icacy
of β -glucan are suggested to be i ts abil i ty to retard the absorption
rate of food in the intestine due to increased viscosity in this way
balancing the post-prandial glucose and insulin response (Wursch
and Pi-Sunyer 1997 Wood et a l 2000) In addition some
investigators (Gallaher and Hassel 1995 Jal i l i et a l 2000) has
reported an increased viscosity in the small intestine which may
interferes with cholesterol absorption or re-absorption in this
way affecting the cholesterol balance and synthesis in the body
Therefore i t would be interesting to investigate what kind of
effect could be achieved with general information about the
dietary f iber content (Stone and Clark 1992)
Another physiological aspect with reference to β -glucan was
experienced in intestinal tract that i t s low down glucose
absorption and therefore regulate blood glucose (Wood et a l
1990 Wood et a l 1994) The viscous nature of β -glucan physically
slows glucose absorption in the gut This property may be useful
in the formulation of products targeting management of diabetes
The mechanism by which β -glucan lowers blood glucose and
cholesterol levels may be related to i ts viscosity bi le salt binding
capacity or ferment abil i ty (Davidson and McDonald 1998
Marlett et a l 1994) The enrichment technique and water
extractionfreeze drying technique could enable the use of barley
as a source of a high-value f iber for reducing the glycemic index
of tradit ional wheat-based foods such as bread without affecting
their sensory characterist ics (Cavallero 2002)
β -glucan incorporated functional food tends to reduce
glycemic indices while maintaining palatabil i ty (Jenkins et a l
19
2002) β -glucan containing food bars have an intermediate
glycemic index of 78 (Foster-Powell and Miller 1994) Enrichment
with additional β -glucan is required in order to produce a low
glycemic index barley product (Tappy et a l 1996) which could
also have an increased hypocholesterolemic effect (McIntosh et a l
1991)
Dongowski et a l (2002) reported that diets containing more
soluble macromolecular dietary f ibers such as β -glucan affected
the excretion of bi le acids and neutral sterols the most whereas
the fermentation of dietary f iber including resistant starch
influenced the steroids in feces I t has been hypothesized that
upon ingestion β -glucan increases small intest inal viscosity due
to i ts lower molecular weight and its tendency to form viscous
gummy solutions result ing in reduced bile acid and cholesterol or
tr iglyceride absorption thus lowering plasma cholesterol as well
as altering digestive enzyme activity
More research is in progress to determine the effect of β -
glucan and phytosterols into low-fat spreads and non-fat
phytosterol formulations (Moreau et a l 2002) The cholesterol-
lowering potential of β -glucan and phytosterols may thus depend
upon previous dispersion into a fat matrix and on the physical
nature of the food I t is reported that these compounds have a
capacity to reduce plasma cholesterol concentrations when
consumed in different food matrices but their effect iveness in
non-fat or low-fat beverages has not been established (Jones et
a l 2003) Two mechanisms for serum cholesterol level have been
elucidated in the scientif ic l i terature one deals with the viscous
nature of β -glucan provides a physical barrier that slows down or
20
inhibits the absorption of cholesterol and other l ipid constituents
and second mechanism is about binding of the bi le acids in the
gut The unabsorbed and bound components then proceed to the
large intestine and are excreted from the body Some of the β -
glucan that reaches the colon wil l also undergo fermentation by
colonic microorganisms (Wood and Beer 1998 Casterl ine et a l
1997 Bell et a l 1999) Short chain fatty acids are produced as a
result of fermentation of β -glucan in large intestine
β -glucan have cholesterol lowering action in human body
The cholesterol lowering mechanism involved the suppression of
intestinal cholesterol absorption while partial ly suppressing
cholesterol biosynthesis ( Jones et a l 2000 Plat and Mensick 2001)
only a small part of these are absorbed through intestinal micelle
into blood circulation phytosterol solubil i ty and incorporation
into intestinal micelles is found an important aspect of
phytosterol cholesterol lowering eff icacy Most recent studies
conducted to examine the l ipid-lowering potential of β -glucan
incorporated them into a fat matrix margarine butter or
dressing Results from these tr ials have shown that β -glucan
consumption decreases total cholesterol and LDL- cholesterol
concentrations by 34 to 116 for total cholesterol and 54 to
155 for LDL cholesterol ( Jones et al 2000 Hall ikainen et al
2000 Mussner et al 2002) Oat bran is r ich in β -glucan f iber and
has been shown to lower cholesterol (Anderson et al 1990) This
is bel ieved and found that barley and oat lowers the blood
cholesterol and attenuates postprandial glucose response due to
soluble dietary f iber cal led (1rarr3) (1rarr4)-β -D-glucan also referred
to as β -glucan (Ripsin et a l 1992 Tappy et a l 1996 Drzikova
21
2005) Oat bran reduced total serum cholesterol in
hypercholesterolemic subjects by as much as 23 with no change
in high density l ipoprotein (HDL) cholesterol Since oat bran was
enriched in β -glucan (Wood 1986 Wood et a l 1989) the authors
reported an inverse correlation between serum cholesterol levels
and β -glucan intake Barley and oats are a r ich source of the
soluble f ibre β -glucan which has been shown to signif icantly
lower LDL-cholesterol ( Joseph et a l 2007)
Oat bran providing 73 g β -glucan in a breakfast cereal or 6 2
g in a bar gave signif icantly lower postprandial glucose responses
in NIDDM subjects than an oat bran breakfast cereal providing 37
g and it was calculated that the glycemic index was lowered 4
units for every gram of β -glucan (Jenkins et a l 2002)
In a study different breads were made one from hull- less
barley f lour and the other from two (1rarr3 1rarr4)-β -glucan enriched
fractions The remaining two from a sieved fraction (SF) and a
water-extracted fraction (WF) were produced and evaluated for
sensory evaluation For eff icacy study eight adultsrsquo subjects were
fed test meals of each of the four breads containing the same
amount (50 g) of available carbohydrate and glycemic indices
calculated from finger-prick capil lary blood samples A l inear
decrease in glycemic index was found for increasing (1rarr3) (1rarr4)-
β -glucan content This research confirms the effectiveness of
viscous (1rarr3) (1rarr4)-β -glucan in reducing postprandial blood
glucose levels even in foods with a high glycemic index
(Cavallero et a l 2002)
22
The abil i ty to detect a signif icant effect on glycemic
response related to the dose of β -glucan In a study of the effect of
an oat bran highly enriched in β -glucan (15 dwb) incorporated
into an extruded breakfast cereal subjects with non-insulin-
dependent diabetes mell i tus consumed meals with 4 6 and 86 g
of β -glucan All 3 breakfasts signif icantly decreased the peak and
the average increases in glucose and insulin compared to a
control There was a signif icant relationship between plasma
glucose peak and area under the glucose curve and the amount of
β -glucan in the cereals (Tappy et a l 1996) Wood et a l (1990)
showed that both oat gum and guar gum signif icantly decreased
the postprandial glucose rise Scientists conducted a study and
showed that whole meal bran and f lour from three barley
genotypes which contained graded levels of soluble f iber were
compared with similar commercial fractions of oats for their effect
on cholesterol tr iglycerides high-density l ipoprotein (HDL)
cholesterol and l iver cholesterol ( test model using
hypercholesterolemic rats) Whole meals of the three barley
genotypes contained 30 5 2 or 6 8 soluble f iber oatmeal
contained 30 In meal-fed rats barley genotypes did not show a
favorable blood or l iver l ipid response compared with oats
However in bran- and f lour-fed rats the data showed that
barley exerted a profound blood and l iver cholesterol- lowering
effect compared with oat bran or f lour (blood triglyceride levels
were minimally affected) Blood HDL-cholesterol levels were
appreciably elevated in rats fed barley bran or f lour compared
with oat bran or f lour These results suggested that barley and its
major fractions (bran and f lour) may evoke different l ipidemic
23
responses and that barley bran and f lour have a more favorable
effect on blood l ipids than do oat bran and f lour (Ranhotra et a l
1991)
Wallace et a l (1997) developed product containing high-
fiber high-carbohydrate diets including foods with low glycemic
index have been associated with prevention and treatment of
diseases such as coronary heart disease and diabetes β -glucan a
soluble viscous polymer found in oat and barley endosperm cell
wall was incorporated into pasta test meals Five fasted adult
subjects were fed test meals of barley and durum wheat blend
pasta containing 100 g of available carbohydrate 30 g of total
dietary f iber (TDF) and 12 g of β -glucan or al l durum wheat pasta
containing the same amount of available carbohydrate 5 g of TDF
and negligible β -glucan The β -glucan and durum wheat pasta
resulted in a lower glycemic response as measured by average
total area and maximum increment of the blood glucose curves
Lower insulin response to the β -glucan and durum wheat pasta
was also indicated by lower average area and increment
characterist ics of the insulin curves Barley β -glucan may be an
economical and palatable ingredient for processed food products
formulated to modify glycemic and insulin response
Lia et a l (1995) studied the effect of β -glucan on the
excretion of bi le acids using breads baked with oat bran oat bran
with β -glucanase barley or wheat in the diet of i leostomy
subjects They showed that the excretion of bi le acids was 53
higher with the oat bran bread than with the bread containing oat
bran and β -glucanase and also signif icantly higher than with
barley and wheat bread The excretion of cholesterol was higher
24
for barley bread than for wheat or oat bran-β -glucanase bread In
one of the few studies that have reported MW values a drink
containing 5 g β -glucan of MW 70000 extracted from oat bran
signif icantly lowered postprandial glucose and insulin levels
relative to a r ice drink control whereas a similar drink containing
barley β-glucan of MW 40000 was without signif icant effect
(Biorklund et a l 2005)
A study was further conducted to est imate the glucose
insulin and glucagon responses after consumption of high-soluble
β -glucan compounds from oats and barley The study includes 11
men and 11 women non diabetics between 35-57 years old
subjects Different tests (blood and urine) performed to analyze
the glucose responses The prel iminary results showed the
signif icant decrease in oats barley and both extracts than glucose
solution High-soluble barley f iber is more effective than standard
oats Oat and barley carbohydrate-based fat substitutes can
provide a useful addition to control plasma glucose responses
(Hallfr isch et a l 2003)
Investigations are further continued to f ind the cholesterol-
lowering activit ies of oats and barley In this study the anti
atherogenic properties of β -glucan concentrates from oats and
barley were evaluated in Syrian golden F1B hamsters by
consuming a semi purif ied hypercholesterolemic diet (HCD)
containing cholesterol (0 15 g100 g) hydrogenated coconut oi l
(20 g100 g) and cel lulose (15 g100 g) The experimental diet HCD
formulated with different levels of β -glucan (2 4 or 8 g100 g)
from oat and barley instead of cel lulose In agreement with
previously proposed mechanisms total fecal neutral sterol
25
concentrations were signif icantly increased in hamsters
consuming 8 g100 g barley or oat β -glucan Aortic cholesterol
ester concentrations were signif icantly reduced in hamsters fed 8
g100 g β -glucan from barley or oats From this observational
study found that the cholesterol- lowering potency of β -glucan is
approximately identical whether i ts origin was oats or barley
(Delaney et a l 2003)
26 Functional properties of β-glucan
Other than nutri t ional benefits obtained from β ndashglucan i t
also have valuable functional properties such as thickening
stabil izing emulsif ication and gelation which make β -glucan
suitable for incorporation in soups sauces beverages and other
food products (Dawkins and Nnanna 1993 Burkus and Temell i
1999) Such functional properties are very important for new food
applications However proper knowledge on thermodynamic
properties of βndashglucan in a food system with other food
components is necessary to exploit full benefits (Burkus 1996)
Gelation is associated with cross l inking of long chain of
polymer to form three dimensional continuous networks this
structure traps and immobil izes the l iquid and become thick
enough to f low under pressure (Glicksman 1982) βndashglucan is a
long chain of glucose units counts for 3-7 of total grain weight
which make i t more viscous Both amylose and βndashglucan are
straight chain of glucose I t has been found that amylose chains
al ign themselves and form gel while βndashglucan form gel through
interrupted regions of β -(1rarr3) l inkages (Buliga et al 1986) Due
to presence of glucose bond between (1rarr3) (1rarr4) l inkages that
26
make barley βndashglucan a soluble f iber β -glucan provides excellent
viscosity forming properties and used as thickening agents in
different food applications e g salad dressings sauces and ice
creams (Wood 1986) Thus addition of barley β -glucan into foods
not only to give better nutrit ional enhancement but also help to
improve quality parameters such as processing behavior and
shelf- l i fe or stabil i ty ( Klamczynski and Czuchajowska 1999)
Thammakiti et a l (2004) determined and evaluated that β -
glucans obtained from spent brewers yeast and its potential food
applications The objective of the study was to evaluate the effect
of homogenization on the rheological properties chemical
composit ion and functional properties of β -glucan In case of
homogenized cel l walls higher β -glucan content and apparent
viscosity has been observed than those which had not been
homogenized due to the breakup of cel l walls This extracted β -
glucans has shown higher apparent viscosity water-holding
capacity and emulsion stabil izing capacity but very similar oi l -
binding capacity when compared with commercial β -glucans from
bakers yeast
Dawkins and Nnanna (1995) reported that β -glucan viscosity
and stabil i ty showed diverse behavior when maintained different
pH-temperature-time combinations during processing and
decrease stabil i ty of food systems such as salad dressings i f β -
glucan is used as a stabil izer The presence of other food
ingredients can affect properties of hydrocolloids Sweeteners
alter the solution properties such as sucrose in low to mild
concentrations increased viscosity of oat β -glucan while higher
concentrations lowered viscosity Similarly Beer et a l (1997) has
27
substantiated that processing may affect solubil i ty of β -glucan
and decrease the molecular weight of β -glucan I t is obvious that
when β -glucan is used in bread making signif icant
depolymerization of l inear bond of this polysaccharide was
caused (Andersson et a l 2004)
Lyly et a l (2004) conducted a research study on two
different β -glucan sources and found that the sensory
characterist ics of soups prepared from barley β -glucan were
different compared to oat β -glucans Freezing had no remarkable
effect on the molecular weight of β -glucan or on the sensory
attr ibute of the soups The researchers visualized that barley β -
glucan addition resulted in alterations of a foods functional
properties such as viscosity More stable foams and emulsions
were obtained with incorporation barley β -glucan than oat β -
glucan Morgan et al (1998) also observed that βndashglucan from
barley makes soft gel on cooling at more than 05 concentrations
βndashglucan stabil i ty is dependent on t ime temperature and pH
values and these factors affects both viscosity and stabil i ty when
used in foods as stabil izers (Burkus and Temell i 1999) There are
reports by researchers showing that viscosity is a function of
molecular weight I t is important to determine precise molecular
weight to est imate βndashglucan characterist ics for potential
applications into food products Among cereals barley and oat
showing high concentrations of β ndashglucan this unique property
differentiate them from others (Burkus 1996) I t is well known
that barley and oat β -glucan is very similar in structure As for as
viscosity is concerned it has been observed that oat β - glucan has
high viscosity than barley due to long molecular chains (Beer et
28
al 1997) Temperature is responsible for changes in viscosity and
according to observations found that oat β ndashglucan gum viscosity
r ises from 25-370C and start decreases from 610C and maximum
reduces at 1000C when compare with control treatment at 250C
(Dawkins and Nnanna 1995) Furtehrmore barley βndashglucan
imparts a smooth mouth feel to beverage products while also
making the beverage an excellent source of soluble dietary f iber
In beverage formulations i t can provide similar functionality l ike
other thickeners β -glucan gums have shown such types of results
that are comparable with other thickners such as alginates pectin
xanthan and carboxymethylcel lulose (Giese 1992)
27 Utilization of β -glucan in food products
Food industry has a major focus on the production of foods
containing health-enhancing components that wil l improve
consumer health beyond meeting basic nutrit ional requirements
(Sloan 1999) Currently functional and nutraceutical ingredients
are used to exploit their health benefits and it has been found that
beverages provide excellent medium for their addit ion (Kuhn
1995) Barley is suitable for a range of food applications and it can
be processed into a number of palatable and nutrit ious food
products As other polysaccharides β -(1rarr3)-D-glucans have
found a very large range of possible applications in various
industries and especial ly in foods cosmetic agronomy
therapeutic and other In food industry beside typical
applications of polysaccharides as thickening agent and
stabil izers β - (1rarr3)-D-glucans have an increasing interest in the
areas of edible f i lm and wide application into feed for domestic
animals and low calorie food as chemical additives are not famous
29
among the consumers Barley gives r ise poor baking quality and
also not having good taste and appearance aspects which have
l imited i ts use in human foods However in current years there
has been an increasing research interest for the exploitation of
barley in a wide range of food applications (Bhatty 1999)
During the last few years functional drinks sector has been
strong and expected to continue Growth in future (Potter 2001
Sloan 2002) Industry analyst predict and saying continuous
growth and latest research has focused on the use of soluble
dietary f ibre and in particular cereal β -glucans as stabil izers in
the manufacture of low-fat products such as salad dressings
(Kontogiorgos 2004) ice creams yoghurts (Brennan 2002) cheese
and many other food products The use of β-glucans preparation
to partial ly substitute vegetable oi l in the formulation and is
found that give us many advantages in the food system Barley β -
glucan is a compound which as attractive thickening properties
and does not reveal deteriorative changes during processing and
storage periods I t gives r ise good thick solution properties when
added into water I t is suggested that β -glucan gum can be used
as thickener in different food application i e in ice cream sauces
and salad dressing (Carr et al 2002) Furthermore no bad effect on
sensory properties was reported There is an est imate and
predictions by industry analyst that functional drink wil l make a
good share in food section (Sloan 2002)
Erkan et a l (2005) produced tarhana (fermented cereal
product) samples from hulless and hulled barley with relatively
high β -glucans content Chemical and sensory properties of the
tarhana samples were examined and evaluated with the
30
tradit ional wheat tarhana During fermentation some of the β -
glucans may be destroyed however the results indicated that
barley f lours can be uti l ized to produce tarhana with relatively
high β -glucans content Effect of tarhana production on the
electrophoretic properties of proteins was est imated in this study
by using SDS PAGE Relative band intensit ies of tarhana samples
were generally less intense than those of respective f lour samples
perhaps due to the hydrolysis of proteins during fermentation
However the overall sensory attributes showed that uti l ization of
barley f lours in tarhana formulation resulted in acceptable soup
properties in terms of most of the sensory properties
Another product where Barley has been effectively
incorporated by (Sidhu et a l 1990) and made single layer f lat
breads including chapatis and Turkish bazlama bread by Basman
amp Koksel (1999) A further study conducted by Berglund et a l
(1992) and he has successfully used hull- less barley f lour in
chemically leavened products such as biscuits pancakes muffins
and cookies Such yeast- leavened bread made with hull- less
barley f lour is also being a good dietary source of (1rarr3) (1rarr4) β -
glucan Tradit ionally barley is not often used in bread products
because i t is deficient in gluten and has poor sensory qualit ies
Izydorczyk et a l (2001) showed that barley might replace up to
20 of wheat f lour without causing too much disturbance to the
overall dough quality
Similarly Morin et a l (2002) established that addition of
barley β -glucan gum (762 purity) into reduced-fat breakfast
sausages to such an extant that i t provides 03ndash07 β -glucan in
31
the manufactured goods gave better water binding and at a level
of 0 3 having no signif icant effects on product texture or f lavor
A study performed by Volikakis et a l (2004) in which he
used elevated level of β -glucan in cheese A commercial
concentrate of oat β -glucan (222 β-glucan content) has been also
incorporated into low-fat white-brined cheese from bovine milk
(70 fat reduction) at two levels 0 7 and 14 (ww) This
product showed in an increased yield greater proteolysis and
higher levels of short chain fatty acids ( lactic acetic and butyric)
as well as with improved texture compared to i ts low-fat (β -
glucan-free) counterpart However the product made with the
high level of β -glucan has shown signif icantly inferior impression
scores for colour f lavour than those of a typical white-brined
cheese product
28 Physico-chemical characteristics of beverage
Among functional foods beverages have excellent
opportunit ies for the incorporation of nutraceutical ingredients
Giese (1992) stated that the new formulations of beverages are
rapidly changing The market shelves are full of different
beverages with not only soda pop juices and dairy beverages
There is huge number of food products taken as beverages such as
iced teas and coffees sports drinks herbal teas frozen carbonated
beverages mint blends vegetable juices smoothies Soft drinks
have tradit ionally remarkable share in the market However in
current years consumers have not been choice for tradit ional
drinks but also have more exotic beverages such as the teas iced
coffees isotonic or sports drinks and non-carbonated beverages
32
and ready-to-drink iced herbal teas are also gaining popularity
(Swientek 1998)
Beverages not only provide taste and refreshment
satisfaction but can also offer a ready and unique delivery system
for protein vitamins minerals and other food ingredients such as
dietary f iber A major challenge to develop a nutraceutical
beverage is to preserve i ts nutrients and to make i t taste good
Another challenge involves the processing of these beverages with
minimum losses of f lavor vitamins and color Barley β -glucan is
being used frequently in cereal products According to FDA new
types of foods containing β -glucan are need to promote in which
3g of β -glucanday should be used this is the amount defined
amount to get the potential health effects Beverages showed
suitable category for new product development containing β -
glucan as functional ingredient
FDA has recommended consumption of 3 g β -glucan per day
to achieve such health benefits This claim was amended later on
and includes oat extracts containing up to 10 βndashglucan (FDA
2002) Some studies showed that consumers want to pay more for
foods having functional benefits ( Jonas and Beckmann 1998)
Processing condit ion for extraction of β -glucan is important
because i t may affect physiological molecular weight and
solubil i ty of barley βndashglucan (Beer et al 1997) and therefore has
influence on i ts physiological eff icacy and products development
High molecular weight β -glucan is particularly sensit ive to
processing Freezing has not been found to affect the molecular
weight of β ndashglucan (Suortt i et al 2000 Kerckhoffs et al 2003)
but i t decreases the solubil i ty of βndashglucan (Beer et al 1997) On
33
the other hand heating makes β-glucan more soluble (Bhatty
1992 Jaskari et al 1995) and enhances i ts physiological eff icacy
The beverage prepared at high temperature had a sl ightly
higher apparent viscosity than the pulse electric f ield (PEF)
treated beverage and developed sedimentation problem in the
container during storage The PEF processed beverage maintained
its natural orange juice l ike color was better than the heat treated
beverage which developed a sl ightly whitish color However the
PEF treated product was less microbiological ly stable at
refrigeration temperature compared with the heat treated product
which was stable for more than 12 month (Sharma et a l 1998)
Temell i e t a l (2004) prepared an orange-flavored barley β -
glucan beverage with different β -glucan levels and compared with
same level pectin beverage and analyzed for different sensory
parameters and the trained panelists found peely and fruity
orange aroma and sweetness intensity to be similar for al l
beverages tested Beverage sourness intensity differed among
beverages Panelists evaluated beverages containing 03
hydrocolloid as similar whereas beverages with 05 and 07 β -
glucan were more viscous than those with pectin at these levels
Acceptabil i ty of beverages was similar according to the consumer
panel During the f irst week of storage Colorimeter values of
beverages decreased mostly stabil izing thereafter With an
increase in concentration β -glucan beverages became l ighter in
color and cloudier but these attr ibutes for pectin beverages were
not affected During the f irst three weeks of storage β -glucan
beverages exhibited cloud loss
34
Barley β -glucan has revealed beneficial nutrit ional and
physical functionality characterist ics that are required for
beverage making (Temell i et al 2004) β -glucan can be used in
combination with whey protein isolate (WPI) for functional
beverage development This beverage has shown good results for
quality overall acceptabil i ty and remained acceptable for 8-week
storage Non-signif icant results for other quality parameters such
as sweetness sourness and f lavor intensity was observed Many
researchers have attempted the use of βndashglucan in beverage
(Holsinger et al 1974 Pendergast 1985) Whey protein in
combination with βndashglucan is successfully using in other food
systems due to nutrit ional and functional properties Different
diseases can be prevented with the help of barley βndashglucan and
whey protein isolates when used in foods (Temell i et al 2004) βndash
glucan is extracted from oats and oat porridge is made after
consumption it was demonstrated that product has reduce
postprandial blood glucose level (Wood et al 1990 Wood et al
1994) These developments led top the approval of a health claim
for oats by the Food and Drug Administration (FDA) in the United
States indicating that oatmeal whole oats and oat products
containing 075 g of β -glucan per serving may reduce the risk of
heart disease FDA 1999) Kulkarni et al 2008 made a barley tea-
l ike extract that is a popular summer drink in Japan and explained
the effects of various temperatures between 1500C and 2800C
during sub crit ical water extraction of barley Each barley extract
was carried out for antioxidative activity amount of residual
matter and sensory properties that were found at 2050C I t was
found that 5-Hydroxymethyl-2-furaldehyde is the most important
antioxidative component of the extract at 205oC
35
Many researchers worked on soft drinks and beverages and
conducted different analysis on quality parameters as DrsquoHeureux-
Calix and Badrie (2005) observed the color and microbial aspect of
puree during storage At pH 23 an intense red color is achieved
There were no signif icant changes observed for physicochemical
parameters except consistency and hue angle for color The puree
contained the total soluble solids in the range of 410ndash435degBrix
and pH was 262 There are reports for the development of new
formulations and then undergo sensory evaluation process to test
their consumer acceptance Maestri et a l 2000 added the ethylene
diamine tetra acetic acid (EDTA) in soy bean and proposed a new
method to attain a soybean with improved f lavor characterist ics
and found that a waterbean ratio of 4 5 1 has given better
results and provided the best protein (422 g 100 ml- 1 ) and total
sol ids (880 g 100 ml- 1 ) contents The soybean was evaluated for
pH viscosity and density as well as for protein compare with
soybean beverage
In the same way Singh and Nath (2004) test i fy different
composit ions for beverage and used denatured whey protein
concentrate (WPC) in the presence of pectin and carboxy
methylcel lulose (CMC) The formulation of beverage was 25 bael
fruit pulp 16degBrix and pH 39 and was fort i f ied with 175 2 75
and 375 level of WPC-polysaccharide complex Among al l
combinations he rated foodstuffs with 175 protein level of
pectin-WPC complex and 175 and 275 protein level of CMC-
WPC complex Moreover 1 75 whey protein level of CMC-WPC
complex was assigned maximum scores for al l sensory aspects
36
Lakshmi et a l (2005) optimized the conditions for beverage
formulations They used mixture of enzymes varying pH
temperature etc under controlled conditions The carbonated
beverage having 125 juice 16degB total soluble solids (TSS) and
04 acidity was suitable for storage During storage beverage
tends to retain i ts quality attr ibutes l ike taste and f lavor up to 2
months Refrigeration of the produce could be imperative in
enhancing the shelf l i fe of the produce Refrigeration at colder
temperatures also favors the retention of active components as
Prati et a l 2004 revealed ascorbic acid content maintained their
level during storage with a loss of only 20 in relation to the
concentration added
Different combinations used by Suh et al 2003 including
barley sprouting and sweet potato The mixture of barley sprouts
and sweet potato was uti l ized in the ratio (11) to increase the
industrial applications of sweet potato and rice beverage I t was
also established that the heat stabil i ty of amylase in sweet potato
is higher than that in barley Reducing sugar content in the
mixture of barley sprouts and sweet potato was higher than in
either barley sprouts or sweet potato alone Sahu et a l 2005 used
lemon grass in beverage formulations and observed that fresh
beverage having 152degB total soluble solids (TSS) pH 435 2329
total sugars 4 53 reducing sugars 0 19 acidity and 15 lemon
grass dist i l late obtained the average sensory score of 8 58 which
was highest among the other beverages prepared with different
concentrations of lemon grass dist i l late At small scale barley and
pectin beverage can be produce by adding water in steam jacket
kett le then mix βndashglucan or pectin and boil for one minute
37
sucrose is premix in water This whole mixture is cool down to 70 oC Add High fructose corn syrup and orange f lavour then
homogenize at 2000 psi shift mixture into steam kett le and add
ascorbic acid ci tr ic acid and βndashglucan The mixture is Pasteurize
at 90oC for half minute At the end bott les are hot f i l led and
placed at refrigerator temperature (Temell i et al 2004)
Barley (Hordeum vulgare L) is mainly used for brewing in
developed countries and as animal feed in less developed
countries However barley has great potential due to soluble f iber
content for human consumption and industr ial uses The cel l walls
of barley grain contain more βndashglucan as compared to aleurone
cel l walls The addition of βndashglucan in water wil l enhance the
viscosity and used as a thickening agent in beverages The action
of this soluble dietary f ibre is just l ike a typical visco-elastic
polysaccharide l ike pectin guar gum carboxymethylcel lulose
(CMC) and xanthan when used in different food products In
recent era the application of βndashglucan in food matrix play a key
role as a functional dietary f ibre
The development of functional beverages by incorporating
βndashglucan show excellent results as a nutraceutical ingredients
Barley βndashglucan gum is stable in low pH conditions and in
refrigerated storage The purity of βndashglucan depends upon
extraction and isolation method used The unpurif ied samples of
βndashglucan causes problem when added in to the food systems The
increasing trend of viscosity due to βndashglucan is considered to be
an important factor in lowering the postprandial blood glucose
levels and cholesterol
38
Distinctive research is mandatory to est imate the effect of
various process parameters on the rheological characterist ics and
molecular weight profi les of βndashglucan extracts and determine how
processing affects the eff icacy of incorporated βndashglucan Such
research would widen our perceptive to know how βndashglucan may
affect the nutrit ional properties of foods by altering their texture
structure and viscosity
39
CHAPTER-3
MATERIALS
AND
METHODS
31 Procurement of raw material
Barley variety (Haider-93) was procured from wheat
research insti tute Ayub Agricultural Research Insti tute (AARI)
Faisalabad
32 Preparation of barley flour
The barley f lour was prepared by grinding barley grains
through UDY cyclone mill (mesh size 20 mm)
33 Analysis of raw materials
The barley f lour was analyzed for proximate composit ion by
fol lowing their respective methods as described below
331 Moisture content
The moisture content of barley f lour was determined in an
oven through drying method (at 105degC) according to the
procedure described in AACC (2000) Method No 44-15A The
moisture content of barley f lour was determined by weighing 2 g
of sample into a pre weighed china dish and drying it in an air
40
forced draft oven at a temperature of 105plusmn5degC t i l l the constant
weight of dry matter was obtained The moisture content in the
sample was determined as given below
332 Crude protein
The barley f lour was tested for crude protein content according
to the Kjeldahlrsquos method as described in AACC (2000) Method No
46-30 Two gram of barley f lour sample was taken into the
digestion tube Twenty mill i l i ters of 98 concentrated sulphuric
acid and 2 tablets of digestion mixture (as catalyst) were added
into the digestion tube The digestion was carried out through
digestion unit t i l l transparent residue contents were obtained and
then after cooling 50ml dist i l led water was added The mixture
was neutral ized with 70 ml of 40 NaOH solution in order to
release gaseous ammonia The neutral ized solution was then
dist i l led through Kjeldahlrsquos dist i l lat ion apparatus The ammonia
l iberated was trapped in 4 boric acid solution containing
indicators (methyl red and ethylene blue) The amount of
ammonia collected was then t i trated against 0 1N sulphuric acid
to a purple end point A blank determination was carried out
fol lowing similar procedure without the test sample The
percentage protein was calculated according to formula given
below
Crude protein () = Nitrogen () x 625
Wt of original flour sample ndash Wt of dried flour sample Moisture () = -------------------------------------------------- x 100
Wt of original flour sample
41
333 Crude fat
The crude fat in each such sample was determined by running
sample through Soxhlet apparatus according to the procedure
given in AACC (2000) Method No 30-25 A sample (3 g) was
weighed into an extraction thimble and extraction carried out in
soxhlet appartus with petroleum ether for 2 hours the previously
heated dried cooled and weighed receive f lask containing oil
were dried in a hot air oven cooled in a desiccator and weighed
The fat content was the difference in weight between the empty
receive f lask and the residual oi l expressed as a percentage of the
sample weight
3 3 4 Crude fiber
The crude f iber content in each sample was est imated
by digesting the fat free samples of barley f lour in 125 H2SO4
fol lowed by 125 NaOH solution as described in AACC (2000)
Method No 32-10 After digestion the sample residue was ignited
by placing in a muffle furnace maintained for 3-5 hours at
temperature of 550-650 degC t i l l grey or white ash was obtained The
percentage of crude f iber was calculated after according to the
expression given below
335 Ash content
Ash is a inorganic residue remaining after the material has
been completely burnt at a temperature of 550degC in a muffle
furnace I t is the aggregate of al l non volati le inorganic elements
Weight loss on ignition Crude fiber () = ---------------------------------- x 100 Weight of flour sample
42
present in a material as i ts oxides The ash content of the barley
f lour was determined according to AACC (2000) Method No 08-
01 The f lour Sample (5 g) was weighed into a previously heated
dried cooled and weighed crucible The sample was charred over
a Bunsen f lame unti l no more smoke was given off and then
transferred into a muffle furnace and heated at a temperature of
550degC unti l i t turned to a completely grey material The ash
content was then cooled in a desicator and weighed The
difference in weight between the empty crucible and crucible with
ash residue expressed as a percentage of the original sample
weight and recorded as ash content
336 Nitrogen free extract (NFE)
The NFE was calculated according to the fol lowing expression
NFE = 100 ndash ( moisture + crude protein + crude fat +
crude f iber + ash)
34 Extraction and purification of β -glucan
β -glucan gum was extracted from barley variety (Haider-93)
by fol lowing the method described by Wood et a l (1978) with
some modifications The barley f lour (50 g) was suspended in 500
ml water pH was adjusted to 10 with Na2 CO3 (20 vw) and
st irred vigorously for 30 minutes at a temperature of 45ordmC The
mixture was centrifuged (Model 3K30 Sigma Germany) at 15000 x
g at 4ordmC for 15 minutes The supernatant was adjusted to pH 45
with 2 M HCL and centrifuged again (20 minutes at 21000 x g
4ordmC) to separate precipitated protein which was discarded The β -
glucan was precipitated by the addition of an equal volume of
43
ethanol (999) to the supernatant with slowly st irring The
precipitate was recovered by centrifugation at 3300 x g for 10
minutes I t was al lowed to sett le overnight at a temperature of 4ordmC
in a refrigerator and the sample was dried in a vacuum drier
(Model DZF 6020 R-A-alpha M) The extracted β -glucan was
stored as pellets in high density polyethylene bags at 50C for
further studies
35 Analysis of β -glucan
The purif ied β -glucan pellets were analyzed for different
chemical parameters as described below
351 Proximate composition
β -glucan pellets were analyzed for moisture crude protein
crude fat crude f iber ash and NFE content according to their
respective methods as described in section 33
3 5 1 Total Dietary Fiber (TDF)
The β -glucan pellets were analyzed for total dietary f iber
contents according to method described in AACC (2000) Method
No32-05 The pellets were dispersed in a buffer solution and
incubated with heat-stable α -amylase at a temperature of 95-100
degC for 35 minutes After cooling the samples (gum pellets) up to
60degC incubated at 60degC for 30 minutes by adding of 100 microl
protease solution Finally these contents were incubated with
amyloglucosidase at 60degC for 30 minutes The f iber contents were
precipitated by the addition of alcohol in 1 4 ratio The contents
were f i l tered and washed with alcohol and acetone A blank was
44
run through entire procedure along with test samples to calculate
any contribution from reagents to residue
352 Soluble Dietary Fiber (SDF)
The soluble dietary f iber content in β -glucan pellets were
determined according to the method as mentioned in AACC (2000)
Method No 32-07 by employing Megazyme Assay Kit The
samples were dispersed in buffer solution and incubated with
heat-stable α -amylase at 95-100degC for 35 minutes After cooling
the samples to 60degC and contents by adding 100 microl protease
solution were incubated at 60ordmC for 30 minutes Finally the
contents by adding amyloglucosidase were incubated at a
temperature of 60degC for 30 minutes The residue after f i l tration
was washed and rinsed with 10 ml water The f i l trate and water
washing was weighed and soluble dietary f iber was precipitated
with four volume of ethyl alcohol The contents were f i l tered and
dried and corrected for ash and protein contents A blank was also
run simultaneously through entire procedure along with test
samples to calculate any contribution from reagents to the
residue
353 In-Soluble Dietary Fiber (IDF)
The soluble dietary f iber (IDF) contents in β -glucan pellets
were determined according to the procedure described in AACC
(2000) Method No 32-20 The samples were dispersed in a buffer
solution and incubated with heat-stable α -amylase at a
temperature of 95-100degC for 35 minutes The samples (gum
pellets) after cooling up to 60 degC incubated by adding 100microl
protease solutions at 60 degC for 30 minutes and then the contents
45
were incubated by adding amyloglucosidase at 60degC for 30
minutes The residue after f i l trat ion was washed and rinsed with
10 ml water The resultant residue was weighed and in soluble
dietary f iber was precipitated with four volume of ethyl alcohol
The contents were f i l tered dried and corrected for ash and
protein contents A blank was also run simultaneously through
entire procedure to calculate any contribution from reagents to
residue
354 Pentosans
The pentosans of β -glucan pellets were determined by the
method as described by Hashimoto et a l (1987) The powdered β -
glucan pellets were hydrolyzed with HCl (2N) at a temperature of
100 oC Then after cooling and neutral ization sugars were
removed by incubating through the addition of yeast for 2 hours
and centrifuged at 1000g A mixture of supernatant (2 ml) water
(1 ml) FeCl3 (3 ml) and orcinol (0 3 ml) was vortexed and then
heated for 30 minutes and cooled The absorbance was measured
through spectrophotometer (IREMCO Model 2020 Germany) at
670 nm
3 5 5 Starch
The starch content in β -glucan pellets was determined
according to method described in AACC (2000) Method No76-11
The f inely ground pellet samples were moistened with ethanol
(80) to aid dispersion Thermo-stable ά -amylase was added and
st irred vigorously on vortex mixer The mixture was incubated for
6 minutes at a temperature of 50oC with occasional shaking
Sodium acetate buffer and amyloglucosidase were added and the
46
mixture was st irred and incubated at 50 o C for 30 minutes The
contents were transferred from the tube to 100 ml volumetric f lask
and adjusted the volume by disti l led water The al iquot of this
solution was centrifuged at 3000g for 10 minutes Transferred
duplicate al iquots (01 ml) of the diluted solution to the bottom of
tubes GOPOD (glucose oxidase peroxidase) reagent was added to
sample mixture and blank and incubated these contents at a
temperature of 50oC for 20 minutes The absorbance of test
samples glucose control and blank was measured through
spectrophotometer (IREMCO Model 2020 Germany) at 510 nm
36 Utilization of β -glucan in beverage
The purif ied β -glucan was uti l ized in different formulations
for the preparation of functional beverages The formulation of
treatments is presented in Table 31
Table 31 Treatment plan
Treatments β -glucan ()
T1 0 control (0 2 pectin)
T2 02
T3 04
T4 06
T5 08
T6 10
47
37 Preparation of Barley Beverage
The β -glucan beverage was prepared with some
modifications in the formulation given by Temell i et a l (2004)
The actual composit ion of beverage is given in Appendix I The
f low diagram of beverage preparation is given as under
Fig 31 Preparation of β -glucan
Heat water to 90 o C
Add slowly β -glucan in solution form
Mix by using high speed mixer
Add remaining ingredients according to Formulation
Adjust pH to 32 with acidulant
Thermally processed and f i l l ing in pre steri l ized bott les
Storage at 5oC
38 Analysis of beverage
The β -glucan beverage was analyzed for different
physicochemical microbiological and sensoric attr ibutes
according to their respective methods during three months
storage at 5oC on fortnightly basis The description of methods is
given below
48
381 Color
The color values of β-glucan beverage samples were
measured according to method of Yu et a l (2003) by using the L
a b color space (CIELAB Space) with Color Tech-PCM (USA)
The L Value indicates l ightness the a and b values are the
chromaticity coordinates (a from red to green b from yellow to
blue)
382 Acidity
The acidity of beverage samples was determined by
fol lowing the method given in AOAC (1990) A sample of 5 mL
from each treatment was t i trated against 0 1 N sodium hydroxide
solution to a persistent pink color end point by using two or three
drops of phenolphthalein indicator The results are expressed as
percent citr ic acid and calculated by the fol lowing formula
mL of NaOH times normality of NaOH times eq wt of acid Acidity () = - - - - - - - - - - - - - - - - -- - - - - - - - - - - - -- - - - - - - - - - - - - -- - - - - - - - - - Volume of sample times 10
383 pH
The pH of beverage samples was estimated according to the
method described in AOAC (1990) The samples were taken in a
neat and clean 50 mL beakers and pH was directly recorded by
using a cal ibrated pH meter ( inoLab pH 720 Germany)
384 Total soluble solids
Total soluble solids of functional beverage were recorded by
using hand refractometer equipped with a percent scale and the
results were expressed as percent soluble solids o Brix
49
385 Specific gravity
The specif ic gravity was determined by fol lowing the
method given in AOAC (1990) Empty pycnometer was weighed
and f i l led with water at 20 oC and again weighed Then washed the
pycnometer and dried in oven and weighed again Now it was
f i l led with test beverage sample and weighed At the end specif ic
gravity was calculated by the formula given under
S - E Density of sample = W - E
Where
S = Weight of sample f i l led pycnometer
E = Weight of empty pycnometer
W = Weight of water f i l led pycnometer
386 Viscosity
The viscosity of functional beverages was measured by
fol lowing the procedure of AACC (2000) through Rion viscometer
(Rion Tech USA) after every fortnight interval during the storage
of three months
387 Sugars (Reducing and Non-reducing)
The total sugars (Total sugars reducing sugars and non
reducing sugars) in the beverage samples were est imated by using
the method of Lane and Eynon as described by Ruck (1963)
Fehlingrsquos solution was made by mixing CuSO4 and alkaline
tartrate solution in equal volumes The pure sucrose sample
prepared in HCl was f i l led into the burette and run into the f lask
50
containing 10 ml Fehlingrsquos solution almost whole volume of the
sample as calculated in the incremental method so that less than
05 ml or more than 1 ml was needed to complete the t i tration The
contents in t i tration f lask were boiled after addition of 2 drops of
methylene blue indicator upto brick red end point The 10 ml
Fehlingrsquos solution equivalent was derived in terms of invert sugar
content and found to be 0505g 25 ml beverage sample was taken
into a 400 ml beaker to which 100 ml water was added and
neutral ized with 1 N NaOH The volume was made up with
dist i l led water up to 250 ml and f i l tered with Whatman fi l ter
paper 2 ml of lead acetate solution was added shaken well and
after 10 minutes 21 ml potassium oxalate solution was added and
f i l tered (f i l terate a)
3871 Reducing sugar
The f i l trate (a) was employed for determination of reducing
sugars by standard method of t i tration as described above The
reducing sugars were calculated according to the expression given
below
Fehlingrsquos solution factor x 100 x dilution Reducing Sugars = ----- - -- - - - - - - - - - - - - -- - - - - - - - - - - - - -- - - - - - - - - - - Volume of sample used
3872 Total sugars
50 ml f i l trate (a) was taken into a 250 ml f lask 5 g citr ic acid
and 50 ml water were added The solution was boiled gently for
10 minutes to invert the sucrose and cooled I t was transferred to
a 250 ml volumetric f lask and neutral ized using phenolphthalein
as an indicator NaOH (20) was added unti l solution turned to
51
pink then 1N HCl was added unti l pink color disappeared The
total sugars were calculated using the fol lowing formula
Fehlingrsquos solution factor x 100 x dilution Total sugars () = - - - - - - - - - - -- - - - - - - - - - - - - -- - - - - - - - - - - - - -- - - - - - - - - Volume of sample used
3873 Non-Reducing Sugar
Non reducing sugars were determined according to the
formula given below
Non reducing sugars ()= ( Total sugars()- Reducing
sugars()times 095
39 Total plate count of beverage samples
Total account of microorganisms in beverage was carried out
fortnightly during storage of three months by adopting the
method of (Lateef et a l 2004) as given bellow
391 Preparation of media
Amount of media to be prepared was determined by
deciding on number and frequency of tests and frequency of
making media 23g powdered nutrient agar was added to 1000 ml
of dist i l led water and heated to prepare nutrient agar media
While Sabouraud dextrose agar media was prepared by mixing
dextrose 40 g peptone 10 g and agar 35 g in 1000 ml dist i l led
water and heated
392 Sterilization and incubation of media
The media were steri l ized in autoclave at 15 to 20 Ib
pressure for 15 minutes then these were stored in refrigerator The
52
prepared media were poured in petri dishes and 15 ml of molten
media was also poured in each dish Dilution and media were
mixed by swirl ing the pteri dishes to and forth and al lowed to
solidify and then Petri dishes were inverted to avoid condensation
of moisture inside the cover These petri dishes were incubated at
37oC for 48 hours After incubation period colonies developed in
Petri dishes were counted through Qubec colony counter
310 Sensory evaluation
The functional beverages were organoleptical ly evaluated
for sensory parameters such as colour taste f lavour and overall
acceptabil i ty by a panel of f ive judges The nine point hedonic
scale was employed for the evaluation of samples stored in
refrigerated conditions as suggested by Harry and Hildegarde
(1998)
The beverage samples (250 mL) were presented to the
trained sensory panel in capped glass jars at 5degC Samples were
kept in a cold water bath to maintain serving temperature
Samples were presented according to a random order balanced
design and room temperature dist i l led water for r insing a napkin
and score sheet on an off-white f iberglass tray Penelists
evaluated samples in standard sensory panel booths containingan
attribute definit ion sheet stop watch and pencil Panelists were
rewarded for participation after each session The coded samples
were presented to the judges in a randomized order twice a day
The evaluation performa were provided to judges for scoring as
given in appendix II
53
311 Selection of the best treatments
The functional beverages were subjected to sensory
evaluation on the basis of judges opinion based on sensory
evaluation the treatments T1 (0 β-glucan) T2 (02 β -glucan)
T3 (04 β -glucan) and T4 (06 β -glucan) were selected These
four treatments along with control (0 β -glucan) were selected for
further biological assay In control treatment pectin was used at a
concentration of 0 2 because i t is used in beverage products
very extensively
312 Efficacy studies
3121 Selection and orientation of subjects
El igibi l i ty in the program required wil l ingness and abil i ty to
adhere to the research protocol and absence of other chronic
diseases 25 healthy volunteers were selected in the program
Participation entailed both direct solicitat ion methods and
culturally tai lored efforts Direct sol ici tat ion method included
presentations face to face invitations and giving handouts that
described the study After potential participants expressed an
interest in the study they were scheduled for an orientation
Process measures included a participatory rapid appraisal a
consent form demographic questions form (including age gender
race culture income and education) and medication
questionnaire (Appendices IV) The participants were divided into
f ive groups (f ive in each) The best selected beverages were
provided to the specif ic groups in 3 replicates as mentioned in
treatment plan (Table 32) Each subject was given about 250 ml
(twice a day) of beverage every t ime
54
Table 32 Treatments used in the biological study Group Treatment (beverage)
A 0β -glucan02Pectin (Control)
B 02 β -glucan
C 04 β -glucan
D 06 β -glucan
The blood sampling of participants was carried out after
every 0 15 and 30 days of study and serum was collected through
centrifugation for analysis of different biochemical parameters in
serum
31211 Glucose level
The blood assay of the participants was carried out to
determine the blood glucose concentration Blood was taken in the
morning to determine the fasting (10-12 hrs) level of glucose and
again 1 and 2 hours after ingestion of specif ic treatment Analysis
of serum glucose was performed through Microlab-300 (Merck)
31212 Total cholesterol
The total cholesterol in the collected serum of individual
subjects of al l groups was measured by l iquid cholesterol CHODndash
PAP method as described by Stockbridge et a l (1989)
3 1213 Low density lipoprotein (LDL)
55
The low density l ipoprotein (LDL) in the serum of each
individual was measured by fol lowing the procedure of
McNamara et a l (1990)
31214 High density lipoprotein (HDL)
The serum high density l ipoprotein (HDL) was measured by
HDL cholesterol precipitant method as described by Assmann
(1979) to f ind out the impact of prepared beverages on the HDL
level of specif ied groups of participants
31215 Triglycerides (TG)
Total tr iglycerides in the collected serum of individual
participant were measured by l iquid triglycerides GPO - PAP
method as described by Annoni et a l (1982)
3 12 Statistical analysis
The data were subjected to analysis of variance (ANOVA) using
CoStat-2003 software package as described by Steel et a l (1997)
The Duncun Multiple Range (DMR) was used to determine the
level of s ignif icance between samples
56
CHAPTER- 4
RESULTS
AND
DISCUSSION
41 Chemical Composition of Barley Flour
The barley grains were cleaned and ground through Udy
cyclone sample mill and the flour was tested for different
chemical characteristics i e moisture crude fat crude protein
crude fiber ash and NFE soluble dietary fiber insoluble dietary
fiber total dietary fiber pentosans and β-glucan contents
The chemical characteristics of barley flour presented in
Table 41 indicated that the barley flour contained 1165 231
675 222 and 7707 crude protein crude fat crude fiber ash
and nitrogen free extract (NFE) respectively The results of the
present study for proximate composition of barley f lour are in line
with the earlier f indings reported for Canadian varieties by (Li et
al 2001) Helm and Francisco (2004) also concluded that Brazilian
barley varieties showed crude protein content from 1155 to
1592 crude fat 291 to 400 ash 151 to 227 and crude fiber
595 to 712 and the result of the present study fall with in the
ranges reported by these scientists Kiryluk et al (2000) have also
found crude protein content in hulled barley flour as high as
1583 and the ash content of 219 and these results also
57
Table 41 Chemical composition of barley flour
Component () on dry weight basis Crude protein 1165plusmn110
Crude fat 231plusmn021
Crude fiber 675plusmn059
Ash 222plusmn019
NFE 7707plusmn550
Soluble dietary fiber 411plusmn 039
Insoluble dietary fiber 737plusmn065
Total dietary fiber 1148plusmn109
Pentosans 303plusmn026
β-glucan 487plusmn039
58
Support to the f indings of the present study for ash content but
differed for protein content which might be due to the variation in
genetic material as well as agronomic and environmental
conditions experienced by the tested material
The results regarding chemical composit ion of barley f lour
presented in Table 41 also substantiated that barley f lour
contained higher amounts of crude f iber (675) The dietary f iber
of barley f lour in the present study was found 411 soluble
7 37 insoluble and 1148 total dietary f iber In earl ier studies
the variations in total dietary f iber soluble dietary f iber and
insoluble dietary f iber content of barley f lour have been reported
ranging from 75 to 168 56 to 64 and 19 to 104
respectively in barley (Helm and Francisco 2004 Vasanthan et a l
2002) which are very close to results found for various type of
total dietary f ibers found in the present study The results
presented in Table 41 further showed that barley f lour possessed
β -glucan 487 and pentosans 303 The results for β -glucan and
pentosans content of barley f lour in the present study are within
the ranges reported by the research workers (Papageorgiou et a l
2005 and Bhatty et a l 1991) The β -glucan is a soluble dietary
f iber component and is present in the highest amounts in the
endosperm of barley
42 Analysis of β-glucan
The β -glucan is found to be the most abundant component of the
soluble dietary f ibre in oats and barley I t is partial ly water
soluble and a l inear polysaccharide comprising only glucose units
The results regarding β -glucan given in Table 42
59
Table 42 Chemical Analysis of β-glucan
Component ()
Moisture 355plusmn029
Crude protein 996plusmn089
Crude fat 117plusmn008
Crude fiber 722plusmn055
Ash 172plusmn014
NFE 7638plusmn699
Soluble dietary fiber 7505plusmn588
Insoluble dietary fiber 1025plusmn102
Total dietary fiber 8530plusmn679
Pentosans 263plusmn019
Starch 190plusmn017
β-glucan 487plusmn039
60
indicated that β -glucan possessed 996 117 722 172 and
7638 of crude protein crude fat crude f iber ash and nitrogen
free extract (NFE) respectively
The present results regarding chemical composit ion β -glucan
are also in close agreement with the f indings reported by Bhatty
(1993) who demonstrated 33 ash content of β -glucan extracted
from barley bran The ash content (Table 42) found in the present
study is also in close conformity with the previous work of
Burkus and Temell i (2005) who reported ash content up to 4 in
β -glucan gum The pentosans contents in the present study are
also inl ine with the results reported by Burkus and Temell i (2005)
The fat content in the β -glucan was found higher as
compared to reported by Faraj et a l (2006) who found 005
lipids in high purity β -glucan concentrate which might be due to
less impurity of β -glucan extracted in the present study The
contents of starch soluble dietary f iber insoluble dietary f iber
and total dietary f iber recorded during the present study are also
in consistent with the earl ier f indings of Faraj et a l 2006) who
found variation from 04- 1 43 in starch content of β -glucan in
soluble dietary f iber (SDF) range from 7181ndash7575 and the in
insoluble dietary f iber (IDF) content of β -glucan gum pellets in
the range of (8 77-173) Symons and Brennan (2004) reported
range of 848 to 9162 for total dietary f iber (TDF) of β -glucan
which also support the results obtained for this parameter in this
present study Lambo et a l (2005) reported that barley f iber
concentrate contained 798 of total dietary f iber which is very
close to the results obtained for total dietary f iber
61
43 Analysis of β-glucan beverage
431 Color
4 3 11 L-value
The statist ical results regarding L-value measured through
colorimeter of different beverages prepared by incorporation of β -
glucan at different levels are shown in Table 43 I t is obvious
from the statist ical results that both treatments and storage
intervals exhibited signif icant effect on the L-value of different
beverages The interaction between the both the variables was
found to be non signif icant for this value of color
The color index of different beverages shown in Table 44
indicated that L-value of beverages increased as the level of β -
glucan increased in the formulation of different beverages The
results revealed signif icantly the highest L-value (2128) for
beverages of T6 containing 10 β -glucan which decreased as the
β -glucan level was reduced in the beverages and 1969 L-value
was recorded for control beverage (without β -glucan) The results
(Table 44) further showed that beverage of T5 containing 08 β -
glucan and T6 beverage containing 10 β -glucan fal l stat ist ical ly
in the same group with respect to this color values Similarly non
signif icant differences existed among beverages T2 (02 β -
glucan) T3 (04 β -glucan) and T4 (06 β -glucan) for L-value
for color
The effect of storage on the L-value of different beverages
containing different levels of β -glucan is shown in Table 44
62
Table 43 Mean sum of squares for color values (L a b) of stored β-glucan beverages
SOV df L-value a-value b-value
Treatments (T) 5 8640 48371 4088
Storage intervals (S) 6 16546 8071 17226
T x S 30 0084NS 0027NS 0964NS
Error 84 0052 0048 0164
Highly Significant (Plt001)
NS Non Significant
63
Table 44 Effect of treatments and storage intervals on the L-value of stored β-glucan beverages
Means carrying same letters within a column or row do not differ significantly (P lt 001)
Storage Intervals (days) Treatments
0 15 30 45 60 75 90 Mean
T1 (0 β-glucan) 2160 1997 1963 1950 1933 1897 1880 1969c
T2(02 β-glucan) 2213 2043 2040 1983 1973 1920 1913 2012b
T3(04 β-glucan) 2240 2073 2020 1993 1973 1950 1933 2026b
T4(06 β-glucan) 2270 2077 2030 2027 1990 1970 1940 2043b
T5(08 β-glucan) 2337 2140 2117 2120 2070 2120 1980 2126a
T6(1 β-glucan) 2263 2130 2130 2143 2080 2077 2074 2128a
Mean 2247a 2077b 2050bc 2036cd 2003de 1989ef 1953f
64
It is evident from the results that L-value of β-glucan beverages
declined significantly as a function of storage The fresh beverage
possessed the highest L-value (2257) that reduced to 2036 and
1953 when tested after 45 and 90 days of storage
It is important to note that with the increase of level of β-
glucan in the beverages affected significantly the L-value or
brightness of beverage The present study indicated that
incorporation of β-glucan resulted in improvement of beverages
color as compared to the control beverage which was prepared by
the addition of 02pectin without addition of β-glucan More L-
value by the addition of β-glucan obtained in the present study is
in consistent with the previous f indings of Bensema (2000) who
found similar pattern for increasing in L-value due to
supplementation of β-glucan However decline in L-value during
storage may be attributed to the cloud loss in the beverage
containing with β-glucan as reported by Cortes et al (2008) The
decrease in L-value was more persistent during first two weeks
but a bit stabilized after third week of storage A small amount of
precipitate was visible at the bottom of the β-glucan beverage
which is due to insoluble protein and fiber components present in
the β-glucan at low levels The precipitation of this material in case
of β-glucan supplemented beverage might be a cause of higher L-
value for these treatments of beverage as reported by Temelli et al
(2004) who prepared orange flavoured barley β-glucan beverages
and showed changes during twelve weeks storage intervals
65
4312 a-value
The analysis of variance pertaining to the a-value of
different beverages prepared by incorporation of β-glucan at
different levels indicated that both treatments and storage
intervals showed signif icant effect on the a-value of different
beverages (Table 43) However the interaction between both
variables was found non signif icantly different for a-value
The a-values of different beverages presented in Table 45
revealed that signif icantly the highest a-value (227) was
observed in beverage of T1 control beverage (without β -glucan)
while the lowest a-value (128) was possessed by T4(04 β -
glucan) I t is obvious from the results that a-value of beverages
showed upword trend as the level of β -glucan increased in the
beverage formulations This indicated decrease in the intensity of
red color in the beverages as a result of β -glucan addition in the
beverages The results further substantiated that beverages of T4
(06 β -glucan) and T6 (10 β -glucan) fal l stat ist ical ly in the
same group with respect to a color value
The results for a-value of different beverages prepared by
the incorporation of β -glucan shown in Table 45 indicated that
a-value of β -glucan beverages decreased signif icantly by
increasing the storage intervals The beverage prepared fresh got
the highest a-value (290) which declined to 144 and 099 after 45
66
Table 45 Effect of treatments and storage intervals on the a-value of stored β- glucan beverages
Storage Intervals (days) Treatments
0 15 30 45 60 75 90 Means
T1 (0 β-glucan) 278 277 253 250 226 207 101 227a
T2(02 β-glucan) 267 143 120 120 113 110 107 140cd
T3(04 β-glucan) 299 155 139 130 110 099 098 147bc
T4(06 β-glucan) 280 133 127 100 090 083 083 128e
T5(08 β-glucan) 320 160 150 143 137 123 121 165b
T6(1 β-glucan) 300 130 126 118 103 085 084 135de
Means 290a 166b 153bc 144bcd 130cd 118d 099e
Means carrying same letters within a column or row do not differ significantly (P lt 001)
67
and 90 days of storage intervals respectively A decrease in the a-
value indicated that beverage became less reddish intensity with
progress in storage periods Moreover a maximum change in the
red intensity was recorded during the f irst week of storage as
compared to the upcoming storage weeks Sa acute nchez-Moreno et a l
(2005) have reported a decl ine in a-value in pasteurize orange
juice during storage which supports to our f indings
In the present study a-value decreased signif icantly by
increasing the level of β -glucan in the beverages which indicated
that increased β -glucan concentration resulted in a less reddish
product as compared to the control beverage The results of
present study are not incormity with the f indins of Bensema
(2000) who reported increasing trend of a-value in case of β -
glucan incorporation into barley β -glucan beverage with whey
protein Isolate and found shelfstabil i ty within twelve weeks
storage at refrigeration temperature A decrease in a-value was
more persistent during f irst three weeks but a bit stabil ized after
third week
4313 b-value
The statist ical results showed that b-value of the color
index of beverages containing β -glucan at different levels was
signif icantly affected due to treatments and storage intervals
(Table 43) However the interaction between treatments and
storage intervals was found to be non signif icant for this attr ibute
of color
The beverages prepared from control treatment T1 with
02 pectin gave the highest b-value (1080) fol lowed by
68
Table 46 Effect of treatments and storage intervals on the b-value of stored β-glucan beverages
Storage Intervals (days) Treatments
0 15 30 45 60 75 90 Means
T1 (0 β-glucan) 1050 1077 1100 1070 1080 1080 1100 1080a
T2(02 β-glucan) 1200 960 920 920 913 900 920 962c
T3(04 β-glucan) 1240 980 960 940 930 940 900 984c
T4(06 β-glucan) 1277 1020 960 980 930 927 960 1008bc
T5(08 β-glucan) 1300 983 940 950 960 950 940 1003bc
T6(1 β-glucan) 1337 1060 1020 1007 987 997 980 1055ab
Means 1234a 1013b 983b 978b 967b 966b 967b
Means carrying same letters within a column or row do not differ significantly (P lt 001)
69
beverage T6 (1 β -glucan) The lowest b-value was recorded in
beverage T2 (02 β -glucan) I t is obvious from the results that
incorporation of β -glucan in the beverage formulations exerted
signif icant response towards b-value of beverages when added at
1
The results in Table 46 also indicated that b-value of
different beverages decreased signif icantly as a function of
storage The freshly prepared beverages got the highest b-value
(1234) which declined to 976 after 45 days and to 967 at the
expiry of the experiment (90days) The beverages containing β -
glucan yielded more yellowish color I t is also obvious from Table
46 that decrease in b-value of beverages was more persistent
with signif icantly reduced during f irst two weeks of the storage
and beyond this period insignif icant change in b-value was
recorded up to expiry of the study i e 90 days of storage The
results of present study are in close agreement with the previous
f inding of Rodrigo et a l (2003) who showed a signif icant
decrease of b-value on pasteurized orangendashcarrot juices when
processed at 77 0C and stored at 100C stable for a period of 32
days
The addition of β -glucan at a level of 1 beverage showed
signif icant effect on b-value However b-value of different
beverages decreased as storage periods progressed This decrease
was more during the f irst two weeks of storage The decline in b-
value observed during the f irst two weeks may be due to the
precipitation of insoluble material present in the beverages or
changes in the β -glucan colorant Bensema (2000) substantiated
that b-value of beverage was reduced from 124 to 94 during the
70
refrigerated storage of 12 weeks which is in l ine with the present
results as similar reducing trend of b-value of beverages
observed in the present study The values measured as L a and
b through colorimeter represent brightness red to green and
yellow to blue color components respectively which decrease
signif icantly during the f irst two weeks of storage for al l
beverages and stabil ized later on The decrease in color values
during f irst two weeks may be attr ibuted to precipitation of
insoluble material present in beverages or change in β -carotine
colorant as reported by Temell i et al (2004) who also explained
that these precipitate are made from insoluble protein and fiber components
present in the β-glucan gum pellets at low levels during extraction procedure
432 Viscosity
The statist ical results in Table 47 showed signif icant effect
of treatments on viscosity of beverages prepared from different
concentrations of β -glucan However the storage intervals and
interaction of these two variables exhibited non signif icant effect
on viscosity of different beverages
The results in Table 48 showed that beverage prepared from
1 β -glucan incorporation (T6) possessed signif icantly the highest
viscosity (2175 mPa-s) fol lowed by T5 beverage containing (08
β -glucan) The lowest viscosity was recorded in T1 (0 β -glucan)
I t is also evident from the results in Table 48 that viscosity of
beverages increased progressively by increasing the level of β -
glucan in the formulation of beverages
I t was observed that incorporation of β -glucan showed
improvement in viscosity of beverage which might be due to the
71
Table 47 Mean sum of squares for viscosity specific gravity and total soluble solids (TSS) of stored beverages
SOV df Viscosity Specific gravity TSS
Treatments (T) 5 10026629 0003148 NS 16948375
Storage intervals (S) 6 06149915 NS 94524e-4 NS 05463508 NS
T x S 30 01087928NS 45238e-5 NS 0001213NS
Error 84 04246667 00019 03711897
Highly Significant (Plt001) NS Non Significant
72
Table 48 Effect of treatments and storage intervals on the viscosity of stored β-glucan beverages
Storage Intervals (days) Treatments
0 15 30 45 60 75 90 Means
T1 (0 β-glucan) 441 441 439 442 447 441 450 443f
T2(02 β-glucan) 696 697 698 702 701 703 707 701e
T3(04 β-glucan) 1195 1201 1205 1218 1227 1232 1243 1217d
T4(06 β-glucan) 1607 1614 1628 1640 1651 1660 1662 1637c
T5(08 β-glucan) 1930 1935 1944 1951 1962 1968 1977 1952b
T6(1 β-glucan) 2130 2141 2152 2160 2172 2180 2287 2175a
Means 1333a 1338a 1344a 1352a 1360a 1364a 1388a
Means carrying same letters within a column or row do not differ significantly (P lt 001)
73
presence of polysaccharides (1rarr3 1rarr4 β -glucan l inkages) The
addition of β -glucan to water also results in the formation of a
viscous hydrocolloid solution (Dawkins and Nnanna 1995
Burkus 1996) which might be one of the reasons towards increase
in the viscosity of beverages The polysaccharides hydroxyl
groups are available to form hydrogen bonds with water which
makes the polymer water-soluble Similarly Glicksman (1982) also
demonstrated that presence of the polymers in solution creates a
random network which increases the internal fr ict ion within the
solution This results in an inhibit ion to internal f low and thus
increases the viscosity of the solution by the incorporation of β -
glucan in the beverage Therefore β -glucan offers various
applications l ike beverages where other thickeners stabil izers or
gell ing agents such as pectin carrageenan guar and xanthan gum
may be replaced The results of the present study are in l ine with
the previous f indings of Bensema (2000) who observed similar
increase in viscosity of beverage by the addition of β -glucan
Thus i t may be inferred from the present results that the
thickening and stabil ization properties of barley β -glucan may be
advantageous in a beverage formulation Temell i et a l (2004)
have reported a sl ight decrease in viscosity in some beverages
containing higher hydrocolloids content (07) and found stable
viscosity in al l other beverages They also found stabil i ty of β -
glucan within the low pH in beverage formulations These
f indings support the results found in the present study
74
433 Specific gravity
The statist ical analysis pertaining to the specif ic gravity of
different beverages prepared by incorporation of β -glucan at
different levels is shown in Table 47 I t is evident from the
results that treatments storage intervals and interaction between
treatments and storage intervals showed non signif icant effect on
specif ic gravity of different beverages
The specif ic gravity of different beverages shown in Table
49 varied from 103 to 106 gL among different beverages
Mugula et a l (2001) observed sl ight decrease in specif ic gravity
in pasteurized and unpasteurize togwa samples These f indings
support the present study as non signif icant trend for this
parameter
The study of Tiisekwa et a l (2000) also showed small
variation in specif ic gravity in Tanzanian fermented beverages
when stored at ambient temperature that also supports the
present study
434 Total Soluble Solids (TSS)
The statist ical results presented in Table 47 indicated that
total soluble solids of different beverages were signif icantly
affected by treatments however storage intervals and interaction
between storage and treatments showed non signif icant effect on
TSS of different beverages
The results in Table 410 showed that the beverage
containing the highest level of β-glucan 1 (T6) possessed the
highest contents of total soluble solids (1042ordmbrix) fol lowed by
T5 beverage containing 08 β -glucan The lowest total soluble
75
Table 49 Effect of treatments and storage intervals on the specific gravity of stored β-glucan beverages
Storage Intervals (days) Treatments
0 15 30 45 60 75 90 Means
T1 (0 β-glucan) 102 102 102 102 103 103 104 103a
T2(02 β-glucan) 102 102 103 103 103 103 104 103a
T3(04 β-glucan) 103 103 103 103 104 104 105 104a
T4(06 β-glucan) 103 104 104 105 105 106 106 105a
T5(08 β-glucan) 104 104 105 105 105 106 106 105a
T6(1 β-glucan) 105 105 105 106 106 106 106 106a
Means 103a 103a 104a 104a 104a 105a 105a Means carrying same letters within a column or row do not differ significantly (P lt 001)
76
Table 410 Effect of treatments and storage intervals on the total soluble solids of stored β-glucan beverages
Storage Intervals (days) Treatments
0 15 30 45 60 75 90 Means
T1 (0 β-glucan) 951 954 960 968 975 986 994 970c
T2(02 β-glucan) 950 957 960 971 980 991 1003 973c
T3(04 β-glucan) 972 977 981 988 996 1004 1013 990bc
T4(06 β-glucan) 989 992 995 1006 1016 1026 1037 1009abc
T5(08 β-glucan) 1001 1005 1009 1017 1027 1039 1048 1021ab
T6(1 β-glucan) 1019 1026 1031 1042 1052 1060 1067 1042a
Means 980a 985a 989a 999a 1008a 1018a 1027a
Means carrying same letters within a column or row do not differ significantly (P lt 001)
77
solids (970ordmbrix) were yielded by the beverage of T1 (0 β -
glucan) I t is obvious from the results that total soluble solids of
beverages increased progressively by increasing the level of β -
glucan in beverage formulations
The total soluble sol ids in different beverage did not differ
signif icantly as a function of storage The total soluble solids in
the freshly prepared β -glucan beverages were found 980 ordmbrix
and total soluble solids 1027ordmbrix were recorded in the beverages
tested of the experiment (day 90) The present study is supported
by the f indings of Mugula et a l (2001) who explained that TSS
decreased in unpasteurized and pasteurized beverage prepared
from sorghum The f indings of present study are also in l ine with
the observations of Tiisekwa et a l (2000) In other study Akubor
(2003) also repoted similar results in melon-banana beverage
during ambient temperature storage
435 pH
The results regarding pH of different β -glucan supplemented
beverages presented in Table 411showed that pH of the
beverages was not affected by the treatments and interaction
between treatments and storage intervals The pH of different
beverage was signif icantly affected by the storage intervals
The results regarding pH of the beverages given in Table 412
indicated non signif icant changes in pH due to different levels of
β -glucan supplementation
78
Table 411 Mean sum of squares for pH acidity and ascorbic acid content of stored β-glucan beverages
SOV df pH Acidity Ascorbic acid
Treatments (T) 5 0014 0084 111646
Storage intervals (S) 6 0227 0008 2447942
T x S 30 0001NS 00001NS 13116NS
Error 84 0004 00002 30928
Highly Significant (Plt001) NS Non Significant Significant (Plt001)
79
Table 412 Effect of treatments and storage intervals on the pH of stored β-glucan beverages
Storage Intervals (days) Treatments
0 15 30 45 60 75 90 Means
T1 (0 β-glucan) 301 294 288 284 279 276 271 285a
T2(02 β-glucan) 297 291 285 280 274 271 268 281a
T3(04 β-glucan) 303 298 292 288 281 274 273 287a
T4(06 β-glucan) 303 296 293 287 283 276 274 287a
T5(08 β-glucan) 296 292 288 281 277 273 269 282a
T6(1 β-glucan) 305 301 288 284 281 273 265 285a
Means 301a 295ab 289bc 284cd 279cde 274de 270e
Means carrying same letters within a column or row do not differ significantly (P lt 001)
80
The results in Table 412 showed a signif icant effect of storage
intervals on the pH value of different beverages The pH value of
freshly prepared beverages (0 day) was found signif icantly higher
301 which decreased to 270 when beverages tested after (90
days) The pH values decreased signif icantly in al l the beverages
progressively throughout the storage period The results of the
present study with respect to storage studies are in concordance
with the f indings of (Miguel et a l 2004 and Falade et a l 2003) who
found a decreasing trend of pH in beverages during storage Ziena
(2000) reported a gradual decline in pH and showed a percent
decrease in pH values range from 11 to 87 in refrigerated and
freeze l ime juices samples High acid and low pH may be due to
production of acetic acid and lactic acid during storage Such
types of changes in pH vales have been demonstrated by (Souci et
a l 1987 Kaanane et a l 1988 Martin et a l 1995) The results are
in consistent with the f indings of Akubor (2003) who also
reported drop in pH with storage period in melon-banana
beverage
Fasoyiro et a l (2005) have founded a decrease in pH during
storage at 50C The Roselle beverage containing three different
fruits (orange apple and pineapple) was prepared They found
decrease in pH from 354 to 280 during two weeks storage at
refrigeration temperature The reduction in pH may be due to the
decomposit ion of fermentable polysaccharides i e β -glucan
sucrose and high fructose corn syrup which are present in
beverages This sl ight decrease in pH is a function of refrigeration
temperature storage which slows down the rate of growth of
microorganisms during entire period of cold storage
81
436 Acidity
The statistical results regarding acidity of beverages
prepared from different levels of β-glucan presented in Table 411
indicated that acidity of beverages was significantly affected by the
storage intervals however treatments and interaction between
storage treatments showed non significant effect on the acidity of
different beverages
The results in Table 413 further substantiated a non
significant effect due to different levels of β-glucan for different
beverages The acidity of different beverages differed significantly
which was found 160 in the fresh beverages The acidity was
increase linearly as the storage progressed which reaches 161 at
the end of experiment (three months) during storage period
Alessandra et al (2004) also reported similar results which
supports the present findings for increase in acidity during
storage The acidity increased significantly as a function of storage
of orange juice stored at 4 0C (137 g100g) and at 10 0C
(136g100g) after 4 and 3 weeks of storage respectively (Esteve et
al 2005)
During two weeks change in acidity was recorded from
190 to 225 in Roselle orange drink (Fasoyiro et al 2005) which
also supports the results of present study The gradual increase in
acidity was due to refrigeration temperature The decrease in pH
and increase in acidity during storage might be due to degradation
of sucrose high fructose corn syrup and β-glucan by the action of
microorganisms which causes production of acids in beverages
82
Table 413 Effect of treatments and storage intervals on the acidity of stored β-glucan beverages
Storage Intervals (days) Treatments
0 15 30 45 60 75 90 Means
T1 (0 β-glucan) 140 146 147 150 152 154 160 150a
T2(02 β-glucan) 139 144 144 147 153 156 157 149a
T3(04 β-glucan) 144 146 153 154 156 159 162 153a
T4(06 β-glucan) 143 145 153 151 155 160 163 153a
T5(08 β-glucan) 141 144 148 153 156 161 160 152a
T6(1 β-glucan) 144 145 150 154 158 160 162 153a
Means 142a 145b 149c 152d 155e 158f 161g
Means carrying same letters within a column or row do not differ significantly (P lt 001)
83
437 Ascorbic acid
The results regarding analysis of variance for ascorbic acid
content of different beverages prepared from different levels of β -
glucan have been presented in Table 411 The statist ical results
indicated that ascorbic acid content of different beverages was
affected signif icantly due to storage intervals but differed non
signif icantly due to treatments and interaction between
treatments and storage intervals
The results in Table 412 showed non signif icant change in
ascorbic acid content due to incorporation of β -glucan
The ascorbic acid content was found higher a (29406 mgkg)
in fresh beverage which declined signif icantly to 27933 mgkg
and 26211 mgkg after 45 and 90 days storage of beverages
respectively I t is also evident from results that ascorbic acid
content of beverages decreased consistently as storage period
increased
The f indings of the present study is in l ine with the work
reported by different researchers Crandall et a l (1987) and Maria
et a l (2003) who observed a signif icant loss of ascorbic acid (25 to
26) during storage In the present study the ascorbic acid
content decreased with the increase in storage periods This
decrease might be due to the factors such as storage temperature
oxidative enzymes processing techniques metal contamination
and the presence of atmospheric oxygen in the head space
Kabasakalis et a l (2000) studied the ascorbic acid content of
commercial fruit juices and observed that the loss of ascorbic acid
84
Table 414 Effect of treatments and storage intervals on the ascorbic acid contents of stored β-glucan beverages
Storage Intervals (days) Treatments
0 15 30 45 60 75 90 Means
T1 (0 β-glucan) 29333 29033 28333 28067 27667 27067 26400 27986
T2(02 β-glucan) 29733 29133 28300 27900 27133 26333 25767 27757
T3(04 β-glucan) 29167 28733 28600 28100 27133 26767 26100 27800
T4(06 β-glucan) 29300 28867 28267 27367 27167 26400 25900 27610
T5(08 β-glucan) 29600 29400 28967 28300 27500 27300 26867 28276
T6(1 β-glucan) 29300 28767 28300 27867 27400 26900 26233 27824
Means 29406a 28989ab 28461bc 27933cd 27333de 26794ef 26211f
Means carrying same letters within a column or row do not differ significantly (P lt 001)
85
was 29-41 in commercial fruit juices stored in closed container
at room temperature for 4 months Similar results reported by
Otta (1984) who described gradual decrease in ascorbic acid at
refrigeration temperature due to prolong storage Since in the
present study the beverages were stored at refrigeration
temperature therefore the loss in ascorbic acid is in conformity
with the results of Otta (1984)
86
438 Reducing Sugars
The statistical results regarding reducing sugars of beverages
presented in Table 415 indicated that the reducing sugars of
beverages were affected significantly by the storage intervals
However the treatments and the interaction between treatments
and storage intervals showed non significant effect on the reducing
sugars of different beverages
The results for the reducing sugars of beverages prepared
from different treatments of β-glucan are presented in Table 416
which indicated that reducing sugars of beverages did not differed
significantly due to the incorporation of β-glucan in different
beverages
The reducing sugars it increased significantly from 372 to
431 during 0 to 90 days of storage respectively (Table 416) In
fresh beverage samples the reducing sugar content was found 372
mg which increased to 402 and 431 mg after 45 and 90 days of
storage respectively The results showed that reducing sugar
contents of beverage increased slowly in the first 15 days of
storage but increased consistently and rapidly as the storage
period increased indicating more production of reducing sugars in
the beverage samples in the later stages of storage periods
Babsky et al (1986) studied storage effect on the composition
of clarif ied apple juice concentrate and reported that reducing
sugars increased from 0286 to 0329 moles per 100 grams and
sucrose decreased from 0039 to 0015 moles per 100 grams after
111 days of storage The reducing sugars were formed by the
inversion of sucrose hydrolysis effect of temperature as described
87
Table 415 Mean sum of squares for reducing non reducing and total sugar content of stored β-glucan beverages
SOV df Reducing Sugars Non Reducing Sugars Total sugars
Treatments (T) 5 00092NS 0004NS 00087265NS
Storage intervals (S) 6 0837 0357 01086119 NS
T x S 30 0001NS 0001NS 8954e-4 NS
Error 84 0003 0004 01528365
Highly Significant (Plt001) NS Non Significant
88
Table 416 Effect of treatments and storage intervals on the reducing sugars of stored β-glucan beverages
Storage Intervals (days) Treatments
0 15 30 45 60 75 90 Means
T1 (0 β-glucan) 371 380 391 402 412 421 431 401
T2(02 β-glucan) 373 383 390 400 409 419 427 400
T3(04 β-glucan) 371 379 389 402 413 421 434 401
T4(06 β-glucan) 368 380 392 402 414 424 432 402
T5(08 β-glucan) 375 382 394 408 417 427 435 405
T6(1 β-glucan) 372 382 389 400 409 417 427 399
Means 372f 381ef 391de 402cd 412bc 422ab 431a
Means carrying same letters within a column or row do not differ significantly (P lt 001)
89
by Ranote and Bains (1982) and Stein et al (1986) Increases in
total sugars have also been observed by Godara and Pareek (1985)
in date palm juice during storage at room temperature
The increase in reducing sugars have also been reported by a
number of research workers and the reason shown to increase in
this parameter has been due to conversion of non reducing sugars
to reducing sugars with the increased storage duration as reported
by Purthi et al (1984) He also reported an increase in reducing
sugars from 136 to 238 per cent and a decrease in non-reducing
sugars from 296 to 230 per cent at room temperature during
storage in juices of four commercial varieties of malta and orange
The results are in close confirmatory with the finding of (Fuleki et
al 1994) who also reported increases in fructose from 412 to 676
and glucose from 070 to 227 in fruit juices during storage
439 Non Reducing Sugars
Non reducing sugars of beverages stored for a period of
three months was not affected significantly by the treatments
(Table 415) The storage intervals showed significantly effect on
non reducing sugars of different beverages The interaction
between treatments and storage intervals possessed non significant
effect on non reducing sugars of different beverages
The contents of non reducing sugars of different beverages
were not significantly changed due to incorporation of different
levels of β-glucan
The results in Table 417 revealed that non reducing sugars
decreased significantly as a function of storage The non reducing
sugars were found significantly the highest content (514) in fresh
90
Table 417 Effect of treatments and storage intervals on the non reducing sugars of stored β-glucan beverages
Storage Intervals (days) Treatments
0 15 30 45 60 75 90 Means
T1 (0 β-glucan) 514 508 501 493 487 481 476 494a
T2(02 β-glucan) 515 509 504 497 490 483 478 497a
T3(04 β-glucan) 513 507 501 494 487 482 475 494a
T4(06 β-glucan) 517 511 503 496 490 482 477 497a
T5(08 β-glucan) 512 507 501 493 486 480 474 493a
T6(1 β-glucan) 513 506 502 493 486 481 476 494a
Means 514a 508ab 502bc 495cd 488de 482ef 476f
Means carrying same letters within a column or row do not differ significantly (P lt 001)
91
beverages which reduced to 495 and 476 after 45 and 90 days of
storage respectively
The f indings of the present study are well supported by
Singh et a l (2007) who found that with increase in storage t ime
non-reducing sugars decreased The results are also in l ine with
the f indings of Chowdhury et a l (2008) who studied the six
months storage effect on the shelf l i fe of mixed juice and
signif icant decrease in non reducing sugars due to breakdown of
non reducing sugars (sucrose) with the reaction of acids
4310 Total Sugars
The analysis of variance regarding total sugars of beverages
showed that total sugars were non signif icantly affected due to
treatments and storage intervals as well as the interaction
between treatments and storage intervals (Table 415)
The results for total sugars of different beverages
presented in Table 418 substantiated that the total sugars content
in al l the treatments fel l stat ist ical ly the same group and total
sugars remained unchanged by the incorporat ion of β -glucan in
the beverages The total sugar content of β -glucan supplemented
beverages s tored for a period of 3 months indicated a lso showed
non s ignif icant var iat ion between the freshly prepared β -g lucan
beverages and beverages evaluated af ter 90 days of s torage
studies The results are wel l in agreement with the observations
92
Table 418 Effect of treatments and storage intervals on the total sugars of stored β-glucan beverages
Storage Intervals (days) Treatments
0 15 30 45 60 75 90 Means
T1 (0 β-glucan) 885 888 892 895 899 902 907 895a
T2(02 β-glucan) 888 892 894 897 899 902 905 897a
T3(04 β-glucan) 884 886 890 896 900 903 909 895a
T4(06 β-glucan) 885 891 895 898 904 906 909 898a
T5(08 β-glucan) 887 889 895 901 903 907 909 899a
T6(1 β-glucan) 885 888 891 893 895 898 903 893a
Means 886a 889a 893a 897a 900a 903a 907a
Means carrying same letters within a column or row do not differ significantly (P lt 001)
93
of Chowdhury et a l (2008) who reported non signif icant increase
in total sugars up to six months storage at 28 0C in juices
4 4 Total Plate Count (TPC) of the beverage samples
The results in Table 419 indicated that storage intervals
showed decline in total plate count (TPC) of β -glucan beverage
The TPC value of freshly prepared beverage (0 day) was higher
129 times 104 - 4 46 times 104 which decreased to 117 times 104 - 4 32 times 104 at
the end of the experimental study (90 day) Similar counts of TPC
have been reported for some juices and drinks in Egypt (Daw et a l
1994) These results are also in agreement with those of Hancioglu
amp Karapiner (1997) reported for Turkish boza beverages The
contamination by these microorganisms in the beverages could
have occurred during processing and packaging as most of the
people involved in the production and packaging do not take
necessary precautions Contamination of food items may largely
be due to the presence of these organisms and their entrance into
the food or beverage as a result of poor hygiene and sanitation
conditions (Bibek 2001)
The results indicated that the TPC values decreased in al l
the beverages containing throughout the storage period The
results of the present study with respect to storage period are in
consistent with the f indings of other researchers who reported
similar results for some tradit ional beverages and drinks (Daw et
a l 1994) The TPC values decrease gradually during storage
intervals are this might be due to
94
Table 419 Effect of treatments and storage intervals on the total plate count (CFUml) of stored β-glucan beverages
Storage intervals (days) Treatments
0 15 30 45 60 75 90
T1 (0 β-glucan) 187 x 104 187 x 104 184 x 104 179 x 104 172 x 104 169 x 104 166 x 104
T2(02 β-glucan) 252 x 104 247 x 104 247x 104 239 x 104 239 x 104 233 x 104 233 x 104
T3(04 β-glucan) 366 x 104 363 x 104 360 x 104 357 x 104 357 x 104 352 x 104 348 x 104
T4(06 β-glucan) 318 x 104 316 x 104 315 x 104 315 x 104 312 x 104 310 x 104 308 x 104
T5(08 β-glucan) 446 x 104 443 x 104 442 x 104 441 x 104 439 x 104 439 x 104 432 x 104
T6(1 β-glucan) 129 x 104 129 x 104 125 x 104 123 x 104 119 x 104 119 x 104 117 x 104
95
increase in acidity which may cause a concomitant decrease in pH
value which may help to decrease TPC in the beverages (Kaanane
et a l 1988 Martin et a l 1995) The total bacterial counts obtained
in this study fal l between 10 x 102 - 1 0 x 105 CFUml which fal l
within the range of earl ier works done by Hatcher et a l (1992)
45 Sensory evaluation of β -glucan beverages
451 Color
The analysis of variance pertaining to the color scores
assigned to different treatments of beverages by the panelist
indicated that color of beverages differed signif icantly due to the
treatments and storage intervals (Table 420) However the
interaction between treatment and storage intervals showed non
signif icant effect on this sensory attribute
The scores assigned to the color of different beverages
prepared by incorporation of β -glucan presented in Table 421
revealed that the beverage prepared by the incorporation of 0 2
β -glucan got signif icantly the highest color scores (684) fol lowed
by the control beverage (02 pectin) The panelists assigned the
lowest scores (494) to the color of T6 beverage (10 β -glucan) I t
is evident from the results (Table 421) that the beverages of
treatments T1 (control) T2 (02 β -glucan) T3 (04 β -glucan)
and T4 (06 β -glucan) fel l stat ist ical ly in the same group with
respect to color scores The results also indicated non signif icant
differences in color scores between beverages T5 (08 β -glucan)
and T6 (10 β -glucan) The beverages containing β -glucan level
up to 06 remained acceptable by the panelists however further
96
Table 420 Mean sum of squares for sensory evaluation of stored β-glucan beverages
SOV df Color Flavor Sweetness Sourness Overall acceptability
Treatments (T) 5 24686 18760 18873 9970 34811
Storage intervals (S) 6 13933 27297 59231 22338 62242
T x S 30 0526NS 0283NS 0169NS 0987NS 0125NS
Error 108 0436 0383 0388 1936 0626
Highly Significant (Plt001)
NS Non Significant
97
Table 421 Effect of treatments and storage intervals on the color score of stored β-glucan beverages
Storage Intervals (days) Treatments
0 15 30 45 60 75 90 Means
T1 (0 β-glucan) 74 72 70 68 68 60 52 663a
T2(02 β-glucan) 80 74 72 68 66 62 56 683a
T3(04 β-glucan) 78 72 70 70 68 54 48 657a
T4(06 β-glucan) 72 66 64 60 56 54 50 603a
T5(08 β-glucan) 58 52 50 46 50 48 46 500b
T6(1 β-glucan) 54 54 52 50 48 46 42 494b
Means 693a 650ab 630ab 603bc 593bc 540cd 490d
Means carrying same letters within a column or row do not differ significantly (P lt 001)
98
increase in the β -glucan level in beverages resulted decrease in
assigning scores to color I t is obvious that freshly prepared β -
glucan beverage got maximum scores for color (693) which
reduced to 490 scores when evaluated at the end of the
experiment (90 days) The results showed that the panelists l iked
more the color of fresh beverages and this l iking reduced of
beverages stored (Table 421)
Colour of any food product is an important criterion for the
acceptabil i ty of any food product I t is one of the characterist ics
perceived by the senses and a mean for the rapid identif ication
and ult imately governs the acceptance or re jection of the food
product The results obtained in the present study for color score
are in l ine with the f indings of Anjum et a l (2006) who observed
signif icant effect (p lt 0001) on color parameters during different
storage conditions Thus the beverages of different treatments got
signif icant variation in gett ing score for their color yet the score
assigned to the color after 90 days under refrigerated storage
remained acceptable The change in color parameter may be due to
the mail lard reaction between reducing sugars and amino acids
(Gonzalez amp Leeson 2000) The results are in close agreement
with the f indings of Granzer (1982) who also reported similar
results for color of beverages at different storage periods
99
452 Flavor
The statist ical results for the scores assigned to f lavor of
beverages prepared from different β -glucan levels indicated that
f lavor score varied signif icantly due to differences (β -glucan
levels) in treatments as well as storage intervals (Table 420) The
interaction between treatments and storage intervals showed non
signif icant effect on the scores given to f lavor of different
beverage
The panelists assigned the signif icantly highest scores to the
f lavour of beverages containing 04 β -glucan (T3) (Table 422)
However the beverage treatment T6 (10 β -glucan) was ranked
at the bottom for f lavor scores (586) by the panelists The
beverages containing 06 β -glucan and control (T1) got
statist ical ly similar scores for f lavour The beverages containing
more than 06 β -glucan got lower scores for f lavor
The effect of storage on the f lavor of beverages stored for a
period of three months showed that there was signif icant decrease
in assigning the scores to the f lavour beverages as a function of
storage The fresh beverages got signif icantly the highest scores
(833) while the beverages tested after 90 days storage got the
lowest score (510) by the panelists I t is evident from the results
(Table 422) that scores assigned to f lavor of beverages decreased
as storage progressed three months
A decrease in the scores assigned to f lavor of different
beverages may be attr ibuted to the increase in acidity of beverage
which noticed during storage as reported in the earl ier section
This increase in acidity may enhance the sourness and wil l
100
Table 422 Effect of treatments and storage intervals on the flavor score of stored β-glucan beverages
Storage Intervals (days) Treatments
0 15 30 45 60 75 90 Means
T1 86 82 76 74 74 62 56 729ab
T2 86 84 78 74 72 66 56 737ab
T3 92 86 80 72 74 64 60 754a
T4 80 76 68 62 64 60 52 660bc
T5 70 68 64 58 58 56 46 600c
T6 72 66 60 54 56 52 50 586c
Means 810a 770ab 710bc 657cd 663cd 600de 533e
Means carrying same letters within a column or row do not differ significantly (P lt 001)
101
depress the f lavor of beverage with the passage of t ime during
storage
A gradual decrease in f lavor during storage may also be due
to degradation of f lavour due to storage of product at refrigerator
temperature and due to heat treatment applied during processing
and such reasons for decrease in f lavor have been reported by
Pruthi et a l (1981) Hassan (1976) The change in f lavour as a
function of storage may be due to the degradation of ascorbic acid
and furfural production (Shimoda amp Osaj ima 1981 Perez amp Sanz
2001)
The productrsquos physico-chemical changes may alter f lavor
during storage The present study is well supported by the results
of Anjum et a l (2004) who described that effect of process heat
treatment and storage temperature are well correlated with the
production of off f lavoring compounds due to browning reaction
and furfural production
453 Sweetness
The scores assigned to sweetness of different beverages
differed signif icantly among treatments and storage intervals
(Table 420) However the interaction between treatments and
storage intervals showed non signif icant effect on this sensory
attr ibute
The scores assigned to sweetness of different beverages in
Table 423 revealed that the control beverage containing 02
pectin got the highest scores for sweetness (674) fol lowed the
beverage 02 β -glucan The beveraged of T6 containing 10 β -
102
glucan got the lowest scores (503) for sweetness The beverage T1
(control) and T2 (02 β -glucan) were place statist ical ly at same
level for scores given to sweetness Non signif icant differences
existed for sweetness score between beverages of T5 (08 β -
glucan) and T6 (10 β -glucan) The results also demonstrated
that the beverages containing β -glucan up to 06 got acceptable
scores however further increase in addition of β -glucan levels in
the beverages got lower scores by the panelists
The results also indicated that fresh beverages got higher
scores (700) which were reduced to 570 scores when evaluated
after 45 days of storage and to 507 scores tested after 90 days of
storage The results of the present study showed that as the
storage t ime increase the sweetness score decreasedThese
observations are well supported by the f indings of Esteve et a l
(2005) and Fasoyiro et a l (2005) who found that during storage
period pH decreases and acidity increases of juices and drinks
due to the degradation of carbohydrates by the action of
microorganisms
103
Table 423 Effect of treatments and storage intervals on the sweetness score of stored β-glucan beverages
Storage Intervals (days) Treatments
0 15 30 45 60 75 90 Means
T1 (0 β-glucan) 80 78 72 66 60 60 56 674a
T2(02 β-glucan) 80 74 70 68 60 58 58 669a
T3(04 β-glucan) 72 70 62 58 56 60 54 617ab
T4(06 β-glucan) 68 66 60 54 56 58 50 589b
T5(08 β-glucan) 58 56 50 46 50 52 46 511c
T6(1 β-glucan) 62 56 54 50 50 40 40 503c
Means 700a 667ab 613bc 570cd 553cd 547cd 507d
Means carrying same letters within a column or row do not differ significantly (P lt 001)
104
454 Sourness
The statist ical results for the scores given to sourness of
beverages prepared by different levels of β -glucan (Table 420)
indicated that sourness scores varied signif icantly due to
differences in treatments as well as storage intervals The
interaction between treatments and storage intervals showed non
signif icant effect on the scores given to sourness of different
beverages
The scores assigned to the sourness of different beverages
given in Table 424 revealed that the highest scores (643) were
given to beverages of control treatment (T1) fol lowed by beverage
of T2 (02 β -glucan) but non signif icant differences existed
between these two beverages The beverage of treatment T6 (10
β -glucan) got the lowest scores (511) for sourness The beverage
containing 06 β -glucan and control beverage got statist ical ly
similar scores The incorporation of β -glucan more than 06
showed a declining trend in gett ing the scores for the sourness
The fresh beverages got the highest scores (697) for
sourness while the beverages tested at the expiry of study i e 90
days of storage got the s ignif icantly lowest scores for sourness
(460) I t is evident from the results (Table 424) that scores given
to sourness of beverages decreased l inearly throughout the
storage period of three months
The present study indicated that control beverage was
sl ightly sourer than the beverages containing different level of β -
glucan but the differences in scores (pectin) of sourness were not
105
Table 424 Effect of treatments and storage intervals on the sourness score of stored β-glucan beverages
Storage Intervals (days) Treatments
0 15 30 45 60 75 90 Means
T1 (0 β-glucan) 74 72 70 66 64 56 48 643a
T2(02 β-glucan) 72 70 70 66 64 56 50 640a
T3(04 β-glucan) 76 72 72 68 62 50 46 637a
T4(06 β-glucan) 70 68 68 64 60 54 46 614a
T5(08 β-glucan) 64 62 58 56 50 50 46 551b
T6(1 β-glucan) 62 58 56 52 40 50 40 511b
Means 697a 670a 657a 620ab 567ab 527ab 460b
Means carrying same letters within a column or row do not differ significantly (P lt 001)
106
s ignif icant with beverages containing up to 06 β-glucan This
indicated that β -glucan does not contribute to beverage sourness
intensity However there was a sl ight decl ine in sourness
intensity in the beverage with β -glucan beyond 06 Bensema
(2000) who also observed that addition of β -glucan may contribute
towards sl ight alkaline environment which reduces the sourness
The results of the present study are also in agreement with the
f indings of Pangborn et a l (1973) who showed that sourness
declined by increasing the hydrocolloid concentration in the
beverages The sensory evaluation of beverages regarding
sourness with storage got lower scores The decrease in pH may
cause increase in acidity as a function of storage which made the
beverage sourer The results obtained from the present study are
in l ine with the f indings of Fasoyiro et a l (2005) and Akubor
(2003) who recorded sl ight increase in acidity during refrigeration
storage of Roselle orange drink An increase in acidity resulted in
sourness in beverages
455 Overall Acceptability
The statist ical results for the score given to overall
acceptabil i ty of beverages (Table 420) indicated that treatments
and storage intervals s ignif icantly affected the overall
acceptabil i ty scores The interaction between treatments and
storage intervals were found non signif icant for overall
acceptabil i ty scores
The beverage prepared from the control treatment (T2) got
the highest overall acceptibi l i ty scores (731) fol lowed by
107
beverage of T1 (02 pectin) but both these beverages possessed
non signif icant differences for overall acceptibi l i ty scores The
beverages of T3 (04 β -glucan) and T4 (06 β -glucan) treatments
got statist ical ly overall acceptabil i ty scores The beverages of
treatments T5 (08 β -glucan) and T6 (1 β -glucan) got the lowest
scores (511) by the panelists for overall acceptabil i ty scores I t is
obvious from the results (Table 425) that overall acceptabil i ty
scores got by beverages containing up to 06 β -glucan
incorporation and control got stat ist ical ly similar scores The
beverages containing more than 06 β -glucan got lower scores
for overall acceptabil i ty
The scores for overall acceptabil i ty of beverages decreased
during storage The fresh beverages got the highest scores (737)
while the beverages tested after 90 days of storage got the lowest
overall acceptabil i ty scores
The β -glucan has been found to be stable within the acidic
environment of an orange-flavored beverage during processing
and refrigerated storage β -glucans abil i ty to increase viscosity
upon addition to water makes i t an excellent thickener for
beverage applications These characterist ics provided more appeal
to the panelists for making the decision about the overall
acceptabil i ty of beverages The results of the present study are in
l ine with the f indings of Renuka et a l (2009) who prepared fruit
juice beverages with fort i f ied fructo-oligosaccharide and noted
the quality characterist ics with six months storage period There
was negligible change in overall quality that ranges from 90 to
60 for different beverages at refrigeration temperature with
references to hedonic scale evaluation
108
Table 425 Effect of treatments and storage intervals on the overall acceptability score of stored β-glucan beverages
Storage Intervals (days) Treatments
0 15 30 45 60 75 90 Means
T1 (0 β-glucan) 84 84 80 72 72 62 54 726a
T2(02 β-glucan) 82 82 76 74 72 66 60 731a
T3(04 β-glucan) 80 80 74 70 70 62 54 700a
T4(06 β-glucan) 72 72 68 66 64 58 50 643a
T5(08 β-glucan) 62 62 60 54 54 44 40 537b
T6(1 β-glucan) 62 62 60 56 50 44 42 537b
Means 737a 737a 697ab 653abc 637bc 560cd 500d
Means carrying same letters within a column or row do not differ significantly (P lt 001)
109
Selection of best treatments
After sensory evaluation best treatments were selected for
further studies The beverages containing different levels of β -
glucan gett ing maximum scores by the judges during entire
storage period were selected Three best beverages were selected
for eff icacy study containing 02 0 4 and 06 β -glucan levels
along with control beverage containing 02 pectin as i t is
commonly used in beverages preparation
46 Efficacy studies of β -glucan beverages
461 Total cholesterol
The statist ical results regarding total serum cholesterol of
healthy subjects fed with various levels of β -glucan supplemented
beverages are presented in Table 426 The results indicated that
total serum cholesterol was signif icantly affected due to variation
in beverage formulations and study periods The interaction
between these both variables was found non signif icant for total
serum cholesterol
I t is obvious from the results given in Table 427 and
i l lustrated in Figure 41 that the highest concentration of total
cholesterol (13953 mgdl) was observed in the control group
which was fed on beverage prepared without any addition of β -
glucan The subject group fed on beverage containing 06 β -
glucan (D) possessed the lowest content of total cholesterol
(13230 mgdl) in serum of healthy subjects at the end of study I t
is evident from Figure 41 that there was signif icant and
progressive decline in the total serum cholesterol by increasing
110
Table 426 Mean sum of squares for blood lipid profile of volunteers
SOV df Total Cholesterol Triglycerides LDL HDL
Beverages (B) 3 107368 37570 55266 28197
Study Periods (S) 2 422014 398238 212944 63649
B x S 6 30566 12210 15847 7837
Error 24 0069 0031 0010 0012
Highly Significant (Plt001) NS Non Significant
111
210297
673
826
145
276
517456
0123456789
Decrease
Week2 Week3
Study Period
ABCD
210297
673
826
145
276
517456
0123456789
Decrease
Week2 Week4
Study Period
ABCD
Table 427 Effect of β-glucan supplemented beverage on serum total cholesterol
content (mgdl) of healthy subjects
Study Periods Beverage
Base Line Week-2 Week-4 Means
A 14220 13921 13719 13953a
B 14174 13753 13374 13767b
C 14198 13242 12557 13332c
D 14211 13037 12442 13230d
Means 14201a 13488b 13023c
Means carrying same letters within a column or row do not differ significantly (P lt 001)
Figure 41 decrease in the serum total cholesterol level of subjects fed on
different beverages A = Beverage supplemented with 0 β-glucan (control) B = Beverage supplemented with 02 β-glucan C = Beverage supplemented with 04 β-glucan D = Beverage supplemented with 06 β-glucan
112
137191337513246
12557
1422013921
14178
13757
141951421
12442
13035
115
120
125
130
135
140
145
Base Line Week-2 Week-4
Weeks
Tota
l Cho
lest
erol
(mg
dl)
A B C D
Figure 42 Effect of β-glucan beverage on Total Cholesterol (mgdl) content of
healthy volunteers A = Beverage supplemented with 0 β-glucan (control) B = Beverage supplemented with 02 β-glucan C = Beverage supplemented with 04 β-glucan D = Beverage supplemented with 06 β-glucan
113
the level of β-glucan in the beverage formulations There was a
decrease in total cholesterol content when the subjects were fed on
beverages C (04 β-glucan) and D (06 β-glucan) The results in
Figure 42 also showed that total cholesterol of healthy subjects
decreased at a faster rate during first two weeks as compared to the
last two weeks of the experimental study The highest decrease in
total cholesterol (826) content was observed in the group of
subjects fed on 06 β-glucan supplemented beverage (D) followed
by the group fed on beverage C (04 β-glucan) and the lowest
decrease in the serum cholesterol was observed in the group fed on
control beverage (0 β-glucan) both when tested at week 2 and
week 4 However Figure 42 also depicted that maximum decrease
in total cholesterol content was shown by the beverage C (04 β-
glucan) when subjects were tested after four weeks
A significant decrease in the total serum cholesterol of test
subjects was found in the present study which might be due to
different factors including the presence of β-glucan soluble dietary
fiber and tocopherol content of barley β-glucan supplemented in
beverage It is well documented that β-glucan has the ability to
reduce the blood serum total cholesterol content of different
subjects (Uusitupa et al 1992) β-glucan is a soluble dietary fiber
portion of barley and possess the ability to decrease the total
cholesterol Ornish et al (1998) have shown reduction in plasma
cholesterol concentrations due to contents of dietary fiber Brown et
al (1999) also reported that 1g of soluble fiber can lower total
cholesterol by about 0045mmolL It has been recommended by
FDA that at least 3 gday of β-glucan from barley should be
consumed to achieve a clinically relevant reduction in serum total
114
cholesterol concentrations (FDA 1996) Soluble dietary fibers may
increase the binding of bile acids in the intestinal lumen which
leads to a decreased enterohepatic circulation of bile acids and a
subsequent increase in the hepatic conversion of cholesterol to bile
acids (Bell et al 1999) Another suggested mechanism is that the
increased viscosity of the food mass in the small intestine because of
soluble fibers leads to the formation of a thick unstirred water layer
adjacent to the mucosa This layer may act as a physical barrier to
reduce the absorption of nutrients and bile acids (Beer et al 1995)
Thus these properties of β-glucan have shown a significant decline
in total cholesterol due to intake of different beverages containing
different levels of β-glucan
462 Triglycerides
The analysis of variance showed significant effect of
functional beverages and study periods on triglyceride content of
adult subjects (Table 426) The interaction between functional
beverages and study periods was found non significant for this
biochemical parameter
The results i l lustrated in Figure 44 and Table 428 indicated
the functional beverages showed different response towards level
of serum triglycerides in different adult groups I t is evident from
Figure 44 that level of serum triglyceride was higher in the
subject group fed on control beverage (0 β -glucan) while the
level of tr iglyceride content was recorded maximum in the group
fed on beverage D (06 β -glucan)It is also obvious from Figure
43 that
115
369 447
10431099
497
672767 757
0
2
4
6
8
10
12
Decrease
Week2 Week4
Study Period
ABCD
369 447
10431099
497
672767 757
0
2
4
6
8
10
12
Decrease
Week2 Week4
Study Period
ABCD
369 447
10431099
497
672767 757
0
2
4
6
8
10
12
Decrease
Week2 Week4
Study Period
ABCD
369 447
10431099
497
672767 757
0
2
4
6
8
10
12
Decrease
Week2 Week4
Study Period
ABCD
Table 428 Effect of β-glucan supplemented beverage on serum Triglycerides content (mgdl) of healthy subjects
Study Periods Beverage
Base Line Week-2 Week-4 Means
A 8668 8348 7933 8316a
B 8547 8165 7616 8109b
C 8747 7835 7234 7939c
D 8611 7665 7085 7854d
Means 8643a 8028b 7492c
Means carrying same letters within a column or row do not differ significantly (P lt 001)
Figure 43 decrease in the serum triglycerides level of subjects fed on different
beverages
A = Beverage supplemented with 0 β-glucan (control) B = Beverage supplemented with 02 β-glucan C = Beverage supplemented with 04 β-glucan D = Beverage supplemented with 06 β-glucan
116
79337616
7234
8668
83488547
81657835
87478611
7765
7185
60
65
70
75
80
85
90
Base Line Week-2 Week-4
Weeks
Trig
lyce
ride
s (m
gdl
)
A B C D
Figure 44 Effect of β-glucan beverage on Triglyceride (mgdl) content of healthy
volunteers A = Beverage supplemented with 0 β-glucan (control) B = Beverage supplemented with 02 β-glucan C = Beverage supplemented with 04 β-glucan D = Beverage supplemented with 06 β-glucan
117
reduction in the tr iglyceride contents increased by increasing the
level of β -glucan in different the beverages
The tr iglyceride content of subjects fed on different
functional beverages decreased at higher rate during the
beginning of days of the experiment There was maximum
decrease in tr iglyceride content (1099) in subject group fed on
the beverage D (06 β -glucan) when tested after week-2 while
the lowest decrease in tr iglycerides was recorded in the group fed
on beverage A (control) The rate of reduction in tr iglyceride
content was at a lower rate after 2 weeks of storage study The
beverage C (04 β -glucan) showed more pronounced effect on the
content of tr iglycerides during the last fortnight of the experiment
as compared to al l other beverages
The results regarding triglyceride contents presented in Table
428 indicated the tr iglyceride content of healthy subjects differed
signif icantly as a function of storage
The results of the present study are in agreement with the
f indings of Delaney et a l (2003a) who found a decrease in serum
triglyceride content of rats as compared to control by
administration of β -glucan in the feed The study demonstrated
that tr iglyceride content reduced progressively as the level of β -
glucan increased in the beverage and the highest reduction was
achieved by the supplementation of 0 6 β -glucan in the beverage
formulation The decrease in tr iglyceride content may be
attributed to the level of β -glucan content has the abil i ty to
reduce tr iglyceride content
118
I t is evident from the previous studies that the level of
tr iglyceride content reduced by the β -glucan incorporation in
different food products Biorklund et a l (2005) observed changes
in serum lipids and reported a total reduction of 0 14mmoll with
a diet containing 5g β -glucan from oat for a period of f ive weeks
study Similar decrease in tr iglycerides has been reported
observed by Naumann et a l (2006) who incorporated β -glucan in
to fruit drink and found a total 1 26 decrease in subjects of β -
glucan group for a period of f ives weeks I t may be concluded
from the present study that by intake of β -glucan in beverage
formulation can help to reduce the tr iglycerides content in human
subjects to a signif icant level
463 Low Density Lipoproteins (LDL)
The statist ical results regarding LDL content of adult subjects
fed on beverages supplemented with various levels of β -glucan
are shown in Table 426 The results indicated that LDL was
affected signif icantly by the variation in beverage formulations as
well as study periods The interaction between beverages and
study periods was found to be non signif icant for LDL content of
different subjects
The highest concentration of LDL (5202 mgdl) was
recorded in the subject group fed on beverage (control) without
addition of β -glucan (Table 429 and Fig 4 6) The subject group
fed on
119
433
754
14871657
111
419
769 743
02468
1012141618
Decrease
Week2 Week4
Study Period
ABCD
Table 429 Effect of β-glucan supplemented beverage on serum LDL content (mgdl) of healthy subjects
Study Periods Beverage
Base Line Week-2 Week-4 Means
A 5376 5143 5086 5202a
B 5345 4942 4735 5007b
C 5365 4567 4216 4716c
D 5388 4495 4161 4681d
Means 5368a 4787b 4550c
Means carrying same letters within a column or row do not differ significantly (P lt 001)
Figure 45 decrease in the serum LDL level of subjects fed on different beverages
A = Beverage supplemented with 0 β-glucan (control) B = Beverage supplemented with 02 β-glucan C = Beverage supplemented with 04 β-glucan D = Beverage supplemented with 06 β-glucan
120
50864735
4216
537651435345
49424567
53655388
41614495
30
35
40
45
50
55
60
Base Line Week-2 Week-4
Weeks
LDL
(mg
dl)
A B C D
Figure 46 Effect of β-glucan beverage on LDL (mgdl) content of healthy
volunteers A = Beverage supplemented with 0 β-glucan (control) B = Beverage supplemented with 02 β-glucan C = Beverage supplemented with 04 β-glucan D = Beverage supplemented with 06 β-glucan
121
beverage containing 06 β -glucan (D) exhibited the lowest
content of LDL (4681 mgdl) in serum of adult subjects I t is
evident from Figure 46 that concentration of LDL decreased
progressively by increasing the level of β -glucan in the beverages
The level of LDL content decl ined at a faster rate in case of
beverages C (04 β -glucan) and D (06 β -glucan) as compared
to control beverages (0 β -glucan) The LDL concentration
decreased at higher rate during f irst two weeks as compared to
the last two weeks of the experimental study I t is also evident
from Figure 45 that at the end of two weeks of study period the
highest decrease in LDL (1082) content was observed in the
subjects group when the data for beverages pooled
The decrease in LDL content was recorded at faster rate during
1s t two weeks of study The beverage showed maximum response
towards decrease LDL content in the beginning of the study as
compared to the last weeks of the study period (Figure 46)
Braaten et a l (1994) have reported 10 decrease in LDL
cholesterol concentrations in hypercholesterolemic men and
women who consumed daily for 4 weeks 72 g of oat gum
containing 58 g of β -glucan mixed with a noncarbonated drink or
with water Kahlon and Chow (1997) also found similar results in
hyperl ipidaemic subjects fed on oat water-soluble gum These
f indings are well in support of the present results in which a
decrease in LDL level by the intake of β -glucan in the functional
beverage formulations
122
464 High Density Lipoproteins (HDL)
The analysis of variance regarding serum HDL level of adult
subjects showed signif icant effect of beverages and study periods
on HDL content (Table 426) The interaction between beverages
and study periods was observed to be non signif icant for this HDL
content of serum
The results i l lustrated in Figure 48 and Table 430 showed a
variable response by different functional beverages towards level
of HDL in different groups of people The serum HDL content was
recorded higher in the subjects fed on D beverage (06 β -glucan)
while the lowest HDL content was recorded in the group fed on
control beverage (0 β -glucan) (Fig48) I t is also evident from
Figure 47 that higher increase in level of tr iglyceride was
observed by the increasing level of β -glucan in the formulation of
different beverages
The HDL content increased at a faster rate during f irst two
weeks while the rate of increase was less at the end of the
experimental study The highest increase in the HDL content was
observed in the group fed on the beverage D (06 β -glucan) when
tested at the end of week 2 while the lowest increase was
observed in the group consuming control beverage The increase
in HDL content of test subjects was lower after fol lowing f irst two
weeks of study
123
Week2Week4
135
532
9931069
005025034 0310
123456789
1011
In
crea
se
Study Period
ABCD
Table 430 Effect of β-glucan supplemented beverage on serum HDL content (mgdl) of healthy subjects
Study Periods Beverage
Base Line Week-2 Week-4 Means
A 6237 6321 6324 6261d
B 6184 6513 6529 6398c
C 6206 6822 6845 6608b
D 6214 6878 6899 6632a
Means 6210c 6634a 6580b
Means carrying same letters within a column or row do not differ significantly (P lt 001)
Figure 47 increase in the serum HDL level of subjects fed on different beverages
A = Beverage supplemented with 0 β-glucan (control) B = Beverage supplemented with 02 β-glucan C = Beverage supplemented with 04 β-glucan D = Beverage supplemented with 06 β-glucan
124
62246184
6497
6237 6321
65136206
67956822 6803
6214
6878
58
60
62
64
66
68
70
Base Line Week-2 Week-4
Weeks
HDL
(mg
dl)
A B C D
Figure 48 Effect of β-glucan beverage on HDL (mgdl) content of healthy
volunteers A = Beverage supplemented with 0 β-glucan (control) B = Beverage supplemented with 02 β-glucan C = Beverage supplemented with 04 β-glucan D = Beverage supplemented with 06 β-glucan
125
The study period showed a signif icant effect on the HDL
content of test subjects The maximum increase in HDL was
observed in the f irst f i f teen days (two week) while the lower
response was observed following the next f i f teen days upto the
expiry of the experiment (Table 430) The results of the present
study are well supported by Kalra and Jood (2000) who observed a
higher HDL content of rats with the consumption of barley β -
glucan gum as compared to control group of rats The results from
such type of studies demonstrated that every 1 rise in HDL by
the uti l ization of medicine there is a 3 reduction chance in
coronary heart diseases (Frick et a l 1987) The results of the
present study are also in l ine with the f indings of Naumann et a l
(2006) who incorporated β -glucan into fruit drink and observed
274 percent increase in HDL during f ive weeks study period in
human subjects They suggested that in order to overcome and
reduce cardiovascular diseases i t is better to use β-glucan in our
daily diet because low HDL heightened risk for heart disease The
results of the present study showed that intake of β -glucan in
beverage signif icantly reduced serum cholesterol and LDL while
signif icantly increased HDL level This study demonstrates that
beverage containing β-glucan can help to reduce risk of coronary
heart disease
465 Blood Glucose concentarion
The statist ical results regarding blood glucose level of adult
volunteers showed signif icant effect of β -glucan treatment
feeding intervals and study periods on blood glucose level (Table
432) The interactive effect of intervals and treatments also
126
possessed signif icant effect on the blood glucose of adult
volunteers subjects All interactions among these three variables
were found to be non signif icant for blood glucose level
The results presented in Table 433 showed different
response towards level of blood glucose by different beverages I t
is evident from the results (Table 432) that higher blood glucose
level (10017 mgdl) was observed in the adults fed on control
beverage i e A (0 β -glucan) fol lowed by beverage B (02 β -
glucan) The lowest blood glucose content (9755 mgdl) was
recorded in the group fed with D beverage (06 β -glucan) i t is
also obvious from the results shown in Figure 49 that higher
reduction in blood glucose level of adult subjects was observed by
increasing the level of β -glucan in the beverage formulation The
level of blood glucose increased in al l beverages t i l l f irst hour of
study and then started declining after one hour The results
indicated (Table 433) that rate of reduction in the concentration
of blood glucose was signif icantly different among different
beverages The adult subjects fed on beverages D (06 β -glucan
beverage) showed higher reduction in blood glucose level than
groups fed on al l other treatments The blood glucose level of the
adults fed with beverage D reduced from 9339 mgdl to 8135
mgdl from 0 to 60 minutes of the study
The blood glucose level varied signif icantly during different
study periods I t is evident from Table 432 that blood glucose
was found the highest (9510 mgdl) at the beginning of the study
(0 day) when the data for beverage and study period were pooled
but i t reduced signif icantly from 9324 mgdl to 9192 mgdl
127
Table 431 Mean sum of squares for blood glucose contents of volunteers SOV df MSS Intervals (A) 5 12929373 Diets (B) 3 19069863 Days (C) 2 17178671 A x B 15 94341233 A x C 10 26435555NS B x C 6 15218384 NS A x B x C 30 13125518 NS Error 144 18758931 Total 215
Table 432 Effect of β-glucan beverage on blood glucose (mgdl)content
with different time intervals Beverage Days 0 Min 30 Min 60 Min 90 Min 120 Min 180 Min
day0 8533 10132 11045 10875 10533 10141 day15 8401 9813 10833 10629 10348 9841
A day30 8246 9927 10637 10426 10217 9725
day0 8499 9862 10662 10330 10034 9430 day15 8360 9860 10432 10020 9730 9355 B
day30 8219 9823 10414 9766 9650 9212 day0 8518 9220 9643 9445 9149 8445
day15 8363 9273 9520 9336 8880 8319 C day30 8250 9026 9461 9242 8727 8267
day0 8520 9202 9502 9288 8977 8261 day15 8374 9051 9319 8846 8732 8152 D day30 8215 8921 9212 8684 8350 7993
Table 433 Interactive effect of diets and time scale intervals on the blood glucose
contents (mgdl) of volunteers Time scale intervals Beverage 0 Min 30 Min 60 Min 90 Min 120 Min 180 Min Means
A 8393 9957 10838 10643 10366 9903 10017a B 8359 9848 10503 10039 9805 9333 9648b C 8377 9173 9541 9341 8919 8344 8949c D 8370 9058 9344 8939 8686 8135 8755d
Means 8375e 9509c 10057a 9741b 9444c 8929d 0 Min = fasting
128
Effect of different beverages on the blood glucose level of subjects
60
70
80
90
100
110
120
0 Min 30 Min 60 Min 90 Min 120 Min 180 Min
Time (Minutes)
mg
dl
Diet A
Diet B
Diet C
Diet D
Figure 49 Effect of β-glucan beverage on blood glucose (mgdl) content of
healthy volunteers Table 434 Interactive effect of diets and study duration on the blood glucose
contents (mgdl) of volunteers Beverage Study Periods
0 Days 15 Days 30 Days Means
A 10210 9978 9863 10017a B 9803 9626 9514 9648b C 9070 8949 8829 8949c D 8958 8746 8562 8755d
Means 9510a 9324b 9192c A = Beverage supplemented with 0 β-glucan (control) B = Beverage supplemented with 02 β-glucan C = Beverage supplemented with 04 β-glucan D = Beverage supplemented with 06 β-glucan
129
when blood glucose level was observed after 15 and 30 days
respectively
The interactive effect of diets (beverages) and study t ime
(Table 432) indicated that the control beverage (0 β -glucan)
possessed the highest blood glucose level of adults when tested
f irst t ime however the lowest blood glucose level was observed
in the adult subjects who were fed on diet D (06 β -glucan
beverage) when tested after 30 days (Table 432)
The results indicated that level of blood glucose was
signif icantly affected by the difference in beverages and t ime
intervals The beverages supplemented with β -glucan showed
pronounced effect on the reduction of blood glucose level
whereas the control diet did not signif icantly affect the level of
blood glucose in the adult subjects The reduction in blood
glucose level was more when level of β -glucan in the beverage
formulations was increased I t is true due to the assumption that
complex carbohydrates were digested and absorbed more slowly
than simple sugars result ing in a f lattened glucose response
curve The fal lacy was revealed when researchers discovered that
blood glucose and insulin responses varied greatly independent
of diet c lassif ication as simple or complex carbohydrate
(Schauberger et a l 1977 Jenkins et a l 1983)
The β -glucan has abil i ty to retard the absorption rate of food
in the intest ine due to increased viscosity thus balancing the
post-prandial glucose and insulin response (Wursch and Sunyer
1997 Wood et a l 2000) The viscous nature of β -glucan physically
slows glucose absorption in the gut This property is useful in the
130
formulation of products targeting management of diabetes Wood
et a l (1990 and 1994) also reported similar results who prepared
porridge from βndashglucan and after consumption demonstrated that
product has reduced postprandial blood glucose level Jenkins et
a l (2002) showed that a food in which β -glucan is incorporated as
a functional ingredient tends to reduce glycemic indices of that
particular food addition of β -glucan predictably reduces the GI
while maintaining palatabil i ty Foster-Pwer and Miller (1994) also
observed similar reduction in blood glucose level by the β -glucan
containing food bars Thus the reduction of blood glucose in the
present study by intake of beverages containing β -glucan is in l ine
with the f indings reported above I t may be concluded from the
present study that diabetic patient may use beverages in which β -
glucan is incorporated which wil l help to reduce the level of
blood glucose
131
CHAPTER-5
SUMMARY
Barley (Hordeum vulgare L) is one of the f irst ancient plant
species I t is r ich in dietary f ibre and possessing mixed-l inkage
(1rarr3) (1rarr4)-β -D-glucans a soluble f iber component The
nutrit ional and functional properties of β -glucan make it suitable
ingriedient to use in functional foods The β -glucan was used for
the development of functional beverages and the results are
summarised as follow
The barley f lour contained crude protein crude fat crude
f iber ash and nitrogen free extract (NFE) 1165 231 675
222 and 7707 respectively The barley f lour possessed total
dietary f ibre (TDF) and β -glucan content 1148 and 487
respectively The crude protein crude fat crude f iber ash and
nitrogen free extract (NFE) in β -glucan was found 9 96 117
722 172 and 7638 respectively The β -glucan contained
soluble dietary f iber (SDF) insoluble dietary f iber (IDF) and a
total dietary f iber (TDF) 7505 1025 and 8530 respectively
The β -glucan possessed 263 pentosans The crude fat and ash
contents in β -glucan gum pellets were found 117 and 172
respectively
The L-value (color index) of functional beverages increased
signif icantly as the level of β -glucan increased in the formulation
of different beverages The beverage of T6 containing 10 β -
132
glucan showed the highest L-value (2128) and fol lowed by
control beverage (without β -glucan) which got L-value 1969 L-
value of functional beverages declined signif icantly as the storage
period increased
The beverage of T5 containing 08 β -glucan gave the
highest a-value (165) and the lowest a-value (-227) was given
by T1 control beverage (without β -glucan) a-value of functional
beverages decreased signif icantly by increasing in storage
intervals b-value was signif icantly affected by treatments as well
as storage intervals The beverage T1 contains 02 pectin
possessed the highest b-value (1080) fol lowed by the beverage
T6 contains 1 β -glucan and signif icantly the lowest b-value was
recorded in the beverage of T2 (02 β -glucan)
The viscosity of beverages improved signif icantly due to the
incorporation of β -glucan in beverages The highest viscosity
(2175 mPa-s) was found in beverages of T6 containing 1 β -
glucan fol lowed by T5 beverage containing 08 β-glucan The
lowest viscosity was recorded in beverage of T1 (0 β -glucan)
The total soluble solids were signif icantly affected by the levels of
β -glucan in beverages The highest of total soluble solids
(1042ordmbrix) were yielded by the the beverages of T6 containing 1
β -glucan fol lowed by beverage of T5 containing 08 β -glucan T1
(0 β-glucan) gave the lowest total soluble solids (TSS) The pH
of different beverages differed signif icantly due to storage
intervals The pH decreased signif icantly in al l beverages
throughout the storage period Total acidity and ascorbic acid
varied signif icantly as a function of storage The ascorbic acid
content was higher (29406 mgkg) in fresh beverage which
133
declined signif icantly to 27933 mgkg and 26211 mgkg after 45
and 90 days of storage respectively Reducing sugars showed non
signif icant change due to incorporation of β -glucan in different
beverage The reducing sugars increased from 372 to 431 from 0
to 90 days of storage respectively The non reducing sugars
differed signif icantly among different beveragesThe total plate
count (TPC) values decreased in al l beverages during the storage
periods The TPC value of freshly prepared beverages (0 day) was
higher 129 times 104 - 4 46 times 104 which decreased to 117 times 104 - 4 32 times
104 at the end of the storage
The color scores differed signif icantly due to treatments and
storage intervals among beverages The beverage containing 02
β -glucan got the highest color scores (684) fol lowed by the
control (0 2 pectin) while beverage of (1 0 β -glucan) got the
lowest scores (494) The scores of f lavor varied signif icantly due
to differences (β -glucan levels) in treatments as well as storage
intervals The beverage of T3 containing 04 β -glucan got
signif icantly the highest scores for f lavor The highest scores for
sweetness (674) were given to control beverage fol lowed by
beverage containing 02 β -glucan The lowest scores (503) was
given to the sourness of T6 beverage (10 β -glucan) The scores
given to sourness of beverages decreased as a function of storage
period
The beverage prepared from the control treatment T2 (02
Pectin) got the highest total scores (731) The beverage containing
more than 06 of β -glucan got mimimum total scores for overall
acceptabil i ty Total scores among beverages decreased
signif icantly among storage periods
134
Total serum cholesterol of the test subjects was affected
signif icantly due to variation in beverage formulations and study
periods Maximum total cholesterol (13953 mgdl) was recorded
in the control group and the lowest content of total cholesterol
(13230 mgdl) in serum of adult subjects was observed when
human subjects were fed on 06 β -glucan The contents of total
serum cholesterol decreased signif icantly by increasing the level
of β -glucan in the beverages Minimum decrease decrease in the
serum cholesterol was measured in the test group fed on control
beverage (0 β -glucan)
The level of serum triglyceride was found higher in the human
subject fed on control beverage (0 β -glucan) and the lowest
tr iglyceride content was observed in the subjects fed on beverage
D (06 β -glucan) Higher reduction in the tr iglyceride content
was found by increasing the level of β -glucan in the beverage
formulations Maximum decrease in tr iglyceride content (1099)
was recorded in the subject group fed on the beverage D (06 β -
glucan)
The highest concentration of LDL (5202 mgdl) was found
in the human subject group fed on control beverage The beverage
containing 06 β -glucan (D) exhibited the lowest content of LDL
(4681 mgdl) in serum of the test subjects The LDL decreased
progressively by increasing the level of β -glucan in the beverage
formulations The serum HDL content was observed higher in the
human subjects fed on D beverage (06 β -glucan) while the
lowest HDL content was recorded in the human fed on control
beverage (0 β -glucan)
135
The blood glucose level of human subjects was affected
signif icantly by treatments feeding intervals and study periods
Higher blood glucose level (10017 mgdl) was observed in the
adults fed on control beverage i e A (0 β -glucan) and fed on
beverage B (02 β -glucan) The lowest blood glucose content
(9755 mgdl) was measured in the human subject group fed on D
beverage (06 β -glucan) Higher reduction in blood glucose level
was observed by increasing the level of β -glucan in the beverage
formulations The rate of reduction in the concentrat ion of blood
glucose was signif icantly different for different functional
beverages The human subjects fed on beverage D (06 β -glucan
beverage) showed higher reduction in level of blood glucose than
groups fed on al l other beverages The blood glucose level of the
adults fed on beverage D reduced from 9339 mgdl to 8135
mgdl during 0 to 60 minutes of the study
I t is evident from the present study that (1rarr3) (1rarr4) - β -D-
glucan is a dominant soluble f iber component in barley During
three months refrigerated storage barley β -glucan was found to be
stable at low pH conditions in beverages system and showed shelf
stabil i ty Consumption of foods rich in β -glucan (soluble f iber)
may reduce the risk of chronic diseases and such foods exhibited
decrease in serum cholesterol levels and postprandial blood
glucose levels in adult subjects This study suggested the use of β -
glucan in beverages can help to reduce riskes of coronary heart
disease and diabetes
136
Conclusions
Concentration of β -glucan had a signif icant effect on the
sensory parameters of beverage
Beverage formulate with the incorporation of β -glucan exert
i ts effect on physicochemical characterist ics of beverage
β -glucan improved most of the sensory characterist ics of the
beverage
The beverages below 08 containing β -glucan were found to
be acceptable during the three month refrigerated storage
period
The different formulated functional beverages showed no
phase separation very minute quantity of impurit ies such as
protein and starch content founded at the bottom of bott les
All levels of β -glucan decrease the total cholesterol LDL
cholesterol and triglycerides in healthy subjects
Further research is needed to know the thermal stabil i ty of
β -glucan and its behavior with other food ingredients in
beverages application to make stable foods
137
Recommendations
All local and indigenous sources for β -glucan isolation should be exploited
The relationship between molecular weight of β -glucan with respect to physiological functional i ty has to be kept in mind
Clinical studies are needed to investigate the physiological effects of β -glucan preparations differing in molecular weight and viscosity
Studies should be carried out to explore the molecular weight of β -glucan to proper understanding of functional properties of β -glucan
Consumer studies are needed to explore the acceptabil i ty of food products having β -glucan along with the substitution of β -glucan enriched barley f lour for some wheat f lour and dairy products
There is need to develop new foods with the addition of soluble dietary f iber from barley source with enhanced health properties by keeping in mind shelf stabil i ty
Structural differences which are present in the soluble and insoluble dietary f ibre of β -glucan should also be investigated for indigenous variet ies
The Genes responsible for the synthesis of β -glucan should be characterized and identif ied in cereal crops and strains of microorganisms
The role of β -glucan in increasing immune system should also be discovered
138
LITERATURE CITED
AACC 2000 Approved Methods of American Association of Cereal Chemists The American Association of Cereal Chemists Inc St Paul Minnesota USA
Aastrup S 1979a The effect of rain on β -glucan content in barley grains Carlsberg esearch Communications 44381-393
Aditya K T Yokota S Suzuki and H Etoh 2008 Sub crit ical Water Extraction of Barley to Produce a Functional Drink
Biosci Biotechnol Biochem 72(1)236-239
AERI 1896 The Agricultural Economics Research Institute Balance Sheet for Food Commodities Finland 1985 The Insti tute Helsinki
Akubor PI 2003 Influence of storage on the physicochemical microbiological and sensory properties of heat and chemically treated melon-banana beverage Plant Foods for Human Nutri 58 1ndash10
Alessandra DC P Antonio V Vincenzo A Mario 2004 Changes of f lavonoids vitamin C and antioxidant capacity in minimally processed citrus segments and juices during storage Food Chem 84 99-105
Aman P H Graham AC Til ly 1989 Content and solubil i ty of mixed-l inked (1-3) (1-4)- β -D-glucan in barley and oats during kernel development and storage J Cereal Sci 1045-50
Anderson J W 1980 Dietary f iber and diabetes in Medical Aspects of Dietry Fiber G A spil ler and R M Key eds Plenum Medical Book Company New York
Anderson J W and J Tieyen-clark 1986 Dietary f iber Hyperlipidemiahypertension and coronary heart disease Am J Gastroenterol 81907-919
Anderson J W DB Spencer CC Hamilton SF Smith and J Tietyen CA Bryant P Oeltgen 1990 Oat-bran cereal lowers serum total and LDL cholesterol in hypercholesterolemic men Am J Clin Nutri 52 495-499
139
Andersson AAM E Armo E Grangeon H Fredrikssonm RA Andersson P Man 2004 Molecular weight and structure units of (1- 3 1-4)- β -glucans in dough and bread made from hull- less barley mil l ing fractions J Cereal Sci 40195ndash204
Annoni G BM Botasso D Ciaci MF Donato and A Tripodi 1982 Liquid tr iglycerides (GPO-PAP) Medi Diagnostic I taly Lab J Res Lab Med 9 115-116
AOAC 2000 Official Methods of Analysis The Association of the Official Analytical Chemists 20 t h Ed Arlington USA
Arndt EA 2006 Whole-grain barley for todays health and wellness needs ConAgra Foods Inc Omaha NE 51(1) 20-22
Assmann G 1979 HDL-cholesterol precipitant Randox Labs Ltd CrumLin Co Antrim N Ireland Internist 20559-567
Babsky NE J L Toribio and J E Lozano 1986 Influence of storage on the composit ion of clarif ied apple juice concentrate J Food Sci 51 (3) 564-67
Ballance GM WOS Meredith 1976 Purif ication and partial characterization of an endo- β -13-glucanase from green malt J Inst Brew 8264-67
Bamforth CW and AHP Barclay 1993 Malting technology and the uses of malt In Barley Chemistry and Technology (eds AW MacGregor and RS Bhatty) by Am Assoc Cereal Chem St Paul USA pp 297-354
Bansema C 2000 Development of a barley P-glucan beverage with and without whey protein Isolate MSc thesis Edmonton Alberta Canada
Basman A and HK Ksel 1999 Properties and composit ion of Turkish f lat bread (bazlama) supplemented with barley f lour and wheat bran Cereal Chem 76506ndash511
Beer MU E Arrigoni and R Amado 1995 Effect of oat gum on blood cholesterol levels in healthy young men Europ J Clin Nutri 49517ndash522
140
Beer MU PJ Wood J Weisz N Fi l l ion 1997 Effect of cooking and storage on the amount and molecular weight of (1rarr3) (1rarr4) - β -D-glucan extracted from oat products by an in vitro digestion system Cereal Chem 74 705-709
Bell S VM Goldman BR Bistrian AH Arnold G Ostroff R Forse 1999 Effect of β -glucan from oats and yeast on serum lipids Crit Rev Food Sci Nutri 39(2) 189ndash202
Bell S VM Goldman BR Bistrian AH Arnold G Ostroff R Forse 1999 A Effect of β -glucan from oats and yeast on serum lipids Crit Rev Food Sci Nutri 39(2) 189ndash202
Bender DA and AE Bender 1999 Bendersrsquo Dictionary of Nutrit ion and Food Technology 7 t h ed Woodhead Publishing Abington
Beneke ES 1962 Medical Mycology Lab Manual Burgess Pub Co Minneapolis Minnisota USA
Berglund PT CE Fastnaught ET Holm 1992 Food uses of waxy hull- less barley Cereal Foods World 37707ndash714
Bhatty R S 1999 The potential of hull- less barley Cereal Chem 76(5) 589ndash599
Bhatty RS 1992 Total and extractable β -glucan contents of oats and their relationship to viscosity J Cer Sci 15185-192
Bhatty RS 1995 Laboratory and pilot plant extraction and purif ication of b-glucans from hull- less barley and oat bran J Cer Sci 22163ndash170
Bhatty RS 1996 Production of food malt from hull- less barley Cereal Chem 73(1) 75-80
Bhatty RS AW MacGregor and BG Rossnagel 1991 Total and acid-soluble β -glucan content of hulless barley and its relationship to acid-extract viscosity Cereal Chem 68221-227
Bhatty RS1986 Physiochemical and Functional (Breadmaking) Properties of Hull- less Barley Fractions Cereal Chem 6331-35
141
Bibek R 2001 Fundamental Food Microbiology 2nd edn The CRC press Ltd Washington DC pp 56-90
Bingham SA NE Day R Luben P Ferrari N Sl imani T Norat F Lavel E Kesse A Nieters H Boeing A Tjoslashnneland K Overvad C Martinez M Dorrensoro CA Gonzalez TJ Key A Trichopoulou A Naska P Vineis R Tumino V Krogh HB Bueno-de-Mesquita PHM Peeters G Berglung G Hallmans E Lund G Skele R Kaaks and E Riboli 2003 Dietary f ibre in food and protection against colorectal cancer in the European Prospective Investigation into Cancer and Nutrit ion (EPIC) an observational study Lancet 3611496-501
Bioumlrklund M A van Rees RP Mensink and G Oumlnning 2005 Changes in serum lipids and postprandial glucose and insulin concentrations after consumption of beverages with β -glucans from oats and barley a randomised dose-controlled tr ial Eur J Clin Nutri 591272-1281
Biorklund M Rees A van RP Mensink and G Onning 2005 Changes in serum lipids and postprandial glucose and insulin concentrations after consumption of beverages with β -glucan from oat or barley a randomized dose-controlled tr ial Eur J Clin Nutri 591272-1281
Bjorck I AC Eliasson A Drews M Gudmundsson and R Karlsson 1990 some nutrit ional properties of starch and dietary f iber in barley genotypes containing different levels of amylose Cereal Chem 67 327
BNF (Brit ish Nutrit ion Foundation) 1994 Starchy Foods in the Diet BNF London
Braaten J T PJ Wood FW Scott MS Wolynetz MK Lowe P Bradleywhite MW Coll ins 1994 Oat β -glucan reduces blood cholesterol concentration in hypercholesterolemic subjects Eur J Clin Nutri 48465ndash474
Brand J S Colagiuri S Crossman A Allen D Roberts and S Truswell 1991 Low-glycemic index foods improve long term glycemic control in NIDDM Diabetes Care 14 95ndash101
142
Brennan C S and LJ Cleary 2005 The potential use of cereal (13 14)-b-D-glucans as functional food ingredients J CerSci 421ndash13
Brennan CS and LJ Cleary 2005 The potential use of cereal (1314)- β -D-glucans as functional food ingredients J Cer Sci 421ndash13
Brennan CS CM Tudorica V Kuri 2002 Soluble and insoluble dietary f ibres (non-starch polysaccharides) and their effects on food structure and nutrit ion F Ind J 5 261-272
Brown L B Rosner W Willet and FM Sacks 1999 Cholesterol lowering effects of dietary f iber a meta analysis Am J Clin Nutri 69 (1) 30 42
Brunswick P DJ Manner and J K Stark 1987 Development of β -D-glucanases during germination of barley and the effect of ki lning on individual isoenzymes J Inst Brew 93181-186
Bryan D J Robert AT Wilson T Carlson S Frazer GH Zheng 2003 β -Glucan Fractions from Barley and Oats Are Similarly Antiatherogenic in Hypercholesterolemic Syrian Golden Hamsters The American Society for Nutrit ional Sciences J Nutri Metabolism 133468-475
Buliga GS DA Brant and GB Fincher 1986 The sequence statist ics and solution configration of barley (1rarr3) (1rarr4) - β -D-glucan Carbohydr Res 57139-156
Burkus Z 1996 Barley P-Glucan Extraction Functional Properties and Interactions with Food Components MSc thesis Edmonton AlbertaCanda
Glicksman M 1982 Functional properties of hydrocolloids Ch 3 in Food Hydrocolloid F Glicksman M (Ed) p 49-93 CRC Press Inc Boca Raton
Burkus Z 1996 Barley β -glucan Extraction Functional properties and interaction with food components MSc Thesis Dept of Agricultural Food and Nutrit ional Science Univ of Alberta Edmonton Canada
143
Burkus Z and F Temeil i 1998 Effect of extraction conditions on yield composit ion and viscosity stabil i ty of barley P-glucan gum Cer Chem 75 805-809
Burkus Z and F Temell i 1999 Glucan concentrate J Food Sci 64198-201 Glicksman M 1982 Functional properties of hydrocolloids Ch 3 in Food Hydrocolloidr Glicksman M (Ed) p 49-93 CRC Press hc Boca Raton FL
Burkus Z and F Temell i 2005 Rheological properties of barley β -glucan Carbohydr Polym 59 459ndash465
Burkus Z F Temell i 1999 Gelation of barley β -glucan - concentrate J Food Sci 64198-201
Calix FD and N Bardrie 2004 Consumer acceptance and physicochemical quality of processed red sorrelroselle (Hibiscus sabdar i f fa L) sauces from enzymatic extracted calyces 4 141-148
Carpita NC 1996 Structure and biogenesis of cel l walls of grasses Annual Rev Plant Physiol Plat Molecular Biol 47445-476
Carr J M S Glatter J L Jeraci and B A Lewis 1990 Enzymes Determination of Beta-Glucan in Cereal-Based Food Products Cereal Chem 67226-229
Casterl ine J L CJ Oles and Y Ku 1997 In vitro fermentation of various food f iber reactions J Agric Food Chem 452463ndash2467
Cavallero S F Empill i Brighenti and A M Stanca 2002 High (1rarr31rarr4)-_-Glucan Barley Fractions in Bread Making and their Effects on Human Glycemic Response J Cere Sci 36 59ndash66
Chowdhury MGF MN Islam MS Is lam T Is lam and MS Hossain 2008 Study on Preparation and Shelf-Life of Mixed Juice Based on Wood Apple and Papaya J Soil Nature 2(3) 50-60
Chung OK and Y Pomeranz 1985 Amino acids in cereal proteins and protein fractions Ch 5 in Digesfibi l i~ and
144
Amino Acid Availabil i ty in Cereals andOilseeds J W Finley and DT Hopkins (Eds) pp 169-232 AACC St Paul MN
Clara C J Mar ıacutea Esteve and Ana Fr ıacutegola 2008 Color of orange juice treated by High Intensity Pulsed Electric Fields during refrigerated storage and comparison with pasteurized juice Food Control 19 151ndash158
Crandall PG CS Chen and KC Davis 1987 Preparation and storage of 72 brix orange juice concentration J Food Sci 52 (3) 381
Davidson MH andm A McDonald 1998 Fiber forms and functions Nutri Res 18 617ndash624
Daw ZY YSA El-Gizaw and AMB Said 1994 Microbiological evaluation of some local juices and drinks Chemie Mikrobiologie Technologie der Lebensmittel 168ndash15
Dawkins N L and I D Nnanna 1995 Composit ion molecular 4)-3 1A 1995 Studies on oat gum [(1 weight est imation and rheological properties Food Hydrocol 9 1-7
Dawkins NL I A Nnanna 1993 Studies on oat gum [(1rarr31rarr4)- β-D-glucan] Composit ion molecular weight est imation and rheological properties Food Hydrocol 9 1-7
Del PS F Leonett i DC Simonson P Sheehan M Matsuda and RA DeFronzo 1994 Effect of sustained physiologic hyperinsulinaemia and hyperglycaemia on insulin secretion and insulin sensit ivity in man Diabetologia 371025ndash1035
Delaney B RJ Nicolosi TA Wilson T Carlson S Frazer GH Zheng R Hess K Ostergren J Haworth and N Knutson 2003 The American Society for Nutrit ional Sciences J Nutri 133468-475
DeVries J W 2001 AACC report The definit ion of dietary f iber Cereal Foods World 46(3) 112-126
Dohnalek MH 2004 The role of f ibre in cl inical nutrit ion In Van der Kamp JW Asp NG Miller J J Schaafsma G (Ed) Dietary f ibre bioactive carbohydrates for food and feed Wageningen Academic Publishers Wageningen pp 271294
145
Dongowski G M Huth E Gebhardt and W Flamme 2002 Dietary f iber-rich barley products beneficial ly affect the intestinal tract of rats J Nutri 132(12) 3704-14
Drzikova B G Dongowski E Gebhardt and A Habel 2005 The composit ion of dietary f ibre-rich extradites from oat affects bi le acid binding and fermentation in vitro Food Chem 90 181-192
Estevea MJ A Fr ıgola C Rodrigob and D Rodrigo 2005 Effect of storage period under variable conditions on the chemical and physical composit ion and colour of Spanish refrigerated orange juices Food and Chemical Toxicol 431413ndash1422
Etoh H K Murakami T Yogoh H Ishikawa Y Fukuyama and H Tanaka 2004 Antioxidative compounds in barley tea Biosci Biotechnol Biochem 682616-2618
Falade OS OR Sowunmi A Oladipo A Tobosun and SRA Adewusi 2003 The level of organic acids in some Nigerian fruit and their effect on mineral availabil i ty in composite diet Pak J Nutri 2(2) 82-83
Faraj A T Vasanthan R Hoover 2006 The influence of a-amylase-hydrolysed barley starch fractions on the viscosity of low and high purity barley b-glucan concentrates Food Chem 9656ndash65
Fasoyiro S B OA Ashaye A Adeola and FO Samuel 2005 Chemical and Storabil i ty of Fruit-Flavoured (Hibiscus sabdariffa) Drinks World J Agric Sci 1(2) 165-168
FDA 1996 Food labeling Health claims oats and coronary heart disease Federal Register 61 (3) January 4
Foster-Powell K J B Mil ler 1994 International tables of glycaemic index Am J Clin Nutr 59 66ndash 69
Frazier WC and EM Foster 1958 Laboratory Manual for Food Microbiology Burgess Pub Co Minneapolis Minnisota USA
Frick MH O Elo and K Haapa 1987 Helsiniki heart study Primary prevention tr ial with germfibrozil in middle aged men with dyslipidemia N Eng J Med 3171237-45
146
Fuleki T E Pelayo and RB Palabay 1994 Sugar composit ion of varietal juices produce from fresh and stored apple J Agric Food Chem 42 1266-75
Gallaher DD CA Hassel 1995 The role of viscosity in the cholesterol lowering effect of dietary f iber In Kritchevsky D Bonfield C editors Dietary f iber in health and disease Minnesota Eagan Press 106-114
Gasiorowski H H Chalcarz A Aniola J I Nahrung 2000 Mil l ing of barley to obtain beta-glucan enriched products Aug 44(4) 238-41
Giese J H 1992 Hitt ing the spot Beverages and beverage technology Food Technol 4670-72 74-75 78-80
Godara RK and OP Pareek 1985 Effect of temperature in storage of ready to serve date juice beverages indian j agric Sci 55 (5) 347-349 (FSTA 18 (4) 78 1986)
Gonzalez ER and S Leeson 2000 An investigation on the preservation of kununndashzaki an African fermented cereal based food drink Acta Alimentaria 29 385ndash92
GOP 2008 Government of Pakistan Finance Division Economic Advisor s Wing Islamabad Pakistan
Granzer R 1982 changes in fruit juices in consumer packs during extended storage Verpackungs-Rundschau 33(6) 35-4
Hallfr isch J DJ Schofield KM Behall 2003 Physiological responses of men and women to barley and oat extracts (NutrimX) I I Comparison of glucose and insulin responses Cereal Chem 8080ndash83
Hall ikainen MA ES Sarkkinen MI J Uusitupa 2000 Plant stanol esters affect serum cholesterol concentrations of hypercholesterolemic men and women in a dose-dependent manner J Nutri 30 767ndash776
Hancioglu O and M Karapinar 1997 Microflora of boza a tradit ional fermented Turkish beverage Int J Food Microbiol 35271ndash274
147
Handan E S Celik B Bi lgi and H Koksel 2005 A new approach for the uti l ization of barley in food products Food Chemistry1-7 Received 6 December 2004received in revised form 7 March 2005accepted 7 March 2005
Lawless HT and H heymann Sensory evaluation of food Principles and Practices Gaithersburg MD Aspen Publishers ISSN 1572-0330) Oorspr uitg New York [etc ] Chapman amp Hall 1998
Hashimoto S MD Shogren Y Pomeranz 1987 Cereal Pentosans Their est imation and signif icance I Pentosans in wheat and milled wheat products Cereal Chem 64(1) 30-34
Hassan SA 1976 Effect of storage on physico-chemical characterist ics of carbonated orange juice Msc thesis Food Tech Deptt WPAU Lyallpur
Hatcher WSJ R J L Weihe DF Split tstoesser EC Hil l and ME Parish 1992 Fruit Beverages In Compendium of methods for the microbiological examination of foods Vanderzant C Split tstoesser DF (eds) American Public Health Association Washington DC
Helm CV and A Francisco 2004 Chemical characterization of Brazil ian hulless barley variet ies f lour fractionation and protein concentration Scientia Agricola 61593-97
Hil l M J and FR Path 1998 Cereals dietary f iber and cancer Nutri Res 18563ndash659
Hil l iam M 2000 Functional foodndashndashHow big is the market The World of Food Ingredients 12 50ndash2
Holsinger V H LP Posati and ED DeVilbiss 1974 Whey beverages a review J Dairy Sci 57(7) 849ndash859
Holtekjolen AK AK Uhlen E Brathen E Brathen S Sahlstrom and SH Khnutesen 2006 Contents of starch and non-starch polysaccharides in barley variet ies of different origin Food Chem 94348 -358
Izydorczyk M S J Symons and J E Dexter 2002 Fractionation of wheat and barley In L Marquart J L Slavin amp R G Fulcher (Eds) Whole grain foods in health and disease (pp
148
47ndash82) St Paul MN USA American Association of Cereal Chemists
Izydorczyk MS A Hussain AW MacGregor 2001 Effect of barley and barley components on rheological properties of wheat dough J Cer Sci 34251ndash260
Izydorczyk MS LJ Macri AW MacGregor 1998a Structure and physicochemical properties of barley non-starch polysaccharides-I Water-extractable beta-glucans and arabinoxylans Carbo Poly 35249ndash258
Izydorczyk MS LJ Macri AW MacGregor 1998b Structure and physicochemical properties of barley non-starch polysaccharides-II Alkali-extractable beta-glucans and arabinoxylans Carbo Poly 35 259ndash269
Jadhav SJ S E Lutz VM Ghorpade and DK Salunkhe 1998 Barley chemistry and value-added processing Crit ical Rev Food Sci 3823ndash171
Jal i l i T REC Wildman DM Medeiros 2000 Nutraceutical roles of dietary f iber J Nutraceutical functional and Medi foods 2 19-34
Jansen MC HB Bueno-de-Mesquita R Buzina F Fidanza A Menotti H Blackburn AM Nissinen FJ Kok D Kromhout 1999 Dietary f iber and plant foods in relation to colorectal cancer mortal i ty The Seven Countries Study Inter J Canc 81 174-179
Jaumlrvi AE BE Karlstroumlm YE Granfeldt I ME Bjoumlrck NG Asp and BOH Vessby 1999 Improved glycemic control and l ipid profi le and normalized f ibrinolytic activity on a lowglycemic index diet in type 2 diabetic patients Diabetes Care 2210ndash18
Jaskari J K Henriksson A Nieminen T Suortt i H Salovaara K Poutanen 1995 Effect of hydrothermal and enzymic treatments on the viscous behaviour of dry- and wet-milled oat barns Cereal Chem 72625-631
Jenkins AL DJ Jenkins U Zdravkovic P Wursch and V Vuksan 2002 Depression of the glycemic index by high
149
levels of β -glucan f iber in two functional foods tested in type 2 diabetes Eur J Clin Nutri 56 622-628
Jenkins D J A TMS Wolever AR Leeds MA Gassull P Haisman and J B Dilawari DV Goff GL Metz KG Alberti 1978 Dietary f ibres f ibre analogues and glucose tolerance importance of viscosity Brit ish Medi J 1 1392 ndash 1394
Jenkins DJ TM Wolever AL Jenkins MJ Thorne R Lee J Kalmusky R Reichert and GS Wong 1983 The glycaemic index of foods tested in diabetic patients a new basis for carbohydrate exchange favoring the use of legumes Diabetologia 24257ndash264
Jenkins DJ TM Wolever J Kalmusky S Guidici C Giordano R Patten GS Wong J N Bird M Hall G Buckley A Csima and J A Litt le 1987 Low-glycemic index diet in hyperlipidemia use of tradit ional starchy foods Am J Clin Nutri 46 66ndash71
Johansson L L Virkki S Maunu M Lehto P Ekholm and P Varo 2000 Structural characterization of water-soluble β -glucan of oat bran Carbohydrate Polymers 4214-148
Jones P J H CA Vanstone M Raeini-Sar jaz MP St-Onge Phytosterols in low- and nonfat beverages as part of a controlled diet fai l to lower plasma l ipid levels J Lip Res 441713-1719
Jones P J M Raeini-Sarjaz FY Ntanios CA Vanstone J Y Feng WE Parsons 2000 Modulation of plasma l ipid levels and cholesterol kinetics by phytosterol versus phytostanol esters J Lipid Res 41697ndash705
Joseph MK M Goulson T Shamliyan N Knutson L Kolberg and L Curry 2007 The effects of concentrated barley beta-glucan on blood l ipids in a population of hypercholesterolaemic men and women Brit J Nutri 97(6) 1162-1168
Kaanane A D Kane TP Labuza 1988 Time and temperature effect on stabil i ty of Moroccan processed orange juice during storage J Food Sci 531470ndash1489
150
Kabasakalis V D Siopidou and E Moshatou 2000 Ascorbic acid content of commercial fruit juices and its rate of loss upon storage J Food Chem 70325-28
Kahlon TS and FI Chow 1997 Hypocholesterolemic effects of oat r ice and barley dietary f ibers and fractions Cereal Foods World 4286-92
Kalra S and S Jood 2000 Effect of dietary β -glucan on cholesterol and l ipoprotein fractions in rats J Cereal Sci 31 141-145
Kent NL and AD Evers 1994 Kentrsquos Technology of Cereals 4th edn Elsevier Oxford
Kerckhoffs DAJ M G Hornstra RP Mensink 2003 Cholesterol lowering effect of β -glucan from oat bran in mildly hyper cholesterolemic subjects may decrease when β -glucan is incorporated into bread and cookies Am J Clin Nutri 78 221-227
Kiryluk J A Kawka H Gasiorowski A Chalcarz J Anio 2000 Mill ing of barley to obtain β -glucan enriched products Molecular Nutri Food Res 44 (4) 238-241
Klamczynski AP and Z Czuchajowska 1999 Quality of f lours from waxy and non-waxy barley for production of baked products Cereal Chem 76530ndash535
Kontogiorgos V CG Bil iaderis V Kiosseoglou G Doxastakis 2004 Stabil i ty and rheology of egg-yolk-stabil ized concentrated emulsions containing cereal β -glucans of varying molecular size Food Hydrocoll 18 987-998
Kuhn M E 1998 Functional food overdose Food Proc 5 21ndash4 27ndash8 30
Morin LA F Temell i and L McMullen 2002 Physical and sensory characterist ics of reduced-fat breakfast sausages formulated with barley β -glucan J Food Sci 672391ndash2396
Lakshmi K AKv Kumar LJ Rao and MM Naidu 2005 Quality evaluation of f lavoured RTS beverage and beverage concentrate from tamarind pulp J Food Sci Technol (Mysore) 42(5)411-415
151
Lambo AM R Oste and MEG Nyman 2005 Dietary f ibre in fermented oat and barley b-glucan rich concentrates Food Chem 89 283ndash293
Lateef A J K Oloke EB Gueguim-Kana 2004 Antimicrobial resistance of bacterial strains isolated from orange juice products Afr J Biotechnol 3 (6) 334-338
Lee CJ RD Horsley FA Manthey PB Schwarz 1997 Comparisons of b-glucan content of barley and oat Cereal Chem 74571ndash575
LI J H T Vasanthan B Rossnagel and R Hoover 2004 Starch from hull- less barley I Granule morphology composit ion and amylopectin structure Food Chem 74395-405
Lia A G Hallmans AS Sandberg B Sundberg P Aringman and H Andersson 1995 Oat beta-glucan increases bi le acid excretion and a f iber-rich barely fraction increases cholesterol excretion in i leostomy subjects Am J Clin Nutri 621245-1251
MacGregor AW and GB Fincher 1993 Carbohydrates of the barley grain Ch 3 in Barley Chemistry and Technology AW MacGregor and RS Bhatty (Eds) p 73-130 AACC St Paul MN
Maier S M ND Turner J R Lupton 2000 Serum lipids in hypercholesterolemic men and women consuming oat bran and amaranth products Cereal Chem 77 297-302
Malkki Y 2004 Trends in dietary f ibre research and development Acta Alimentaria 3339ndash62
Maria COC Geraldo AM WDF Raimundo SF Men de Sa Moreira de and MB Isabella 2003 Storage stabil i ty of cashew apple juice preserved by hot f i l l and aseptic processes Ceinc Tecnol Aliment Campinas 23(supl) 106-9
Marika L M Salmenkall io M T Suortt i K Autio K Poutanen L Lahteenmaki 2004 The sensory characterist ics and rheological properties of soups containing oat and barley β -
152
glucan before and after freezing Lebensm-Wiss u-Technol 37749ndash761
Marlett J A KB Hosig NW Vollendorf and FL Shinnick 1994 Mechanism of serum cholesterol reduction by oat bran Hepatol 201450ndash1457
Mart ın J J E Solanes E Bota and J Sancho 1995 Chemical and organoleptic changes in pasteurised orange juice Alimentaria 26159ndash63
McIntosh GH GO Regester RK LeLeu and PJ Royle GW Smithers 1995 Dairy proteins protect against dimethylhydrazine-induced intestinal cancers in rats J Nutri 125809ndash816
McIntosh GH J Whyte R McArthur and PJ Nestel 1991 Barley and wheat foods influence on plasma cholesterol concentrations in hypercholesterolemic men Am J Clin Nutri 53 1205ndash1209
McNamara J R J S Cohn PW Wilson and EJ Schaefer 1990 Calculated values for low-density l ipoprotein cholesterol in the assessment of l ipid abnormalit ies and coronary disease r isk Clin Chem 3636-42
Menrad K 2000 Markt und Marketing von funktionellen Lebensmitteln Agrarwirtschaft 49(8) 295ndash302
Menrad M B Husing K Menrad T Reib S Beer-Borst and CA Zenger 2000 Functional food TA 372000 Bern Schweizerischer Wissenschafts und Technologierat
Miguel G S Dandlen D Antunes A Neves and D Martins 2004 The effect of two methods of pomegranate (punica granatum) juice extraction on quality during storage at 4degC J Biomed Biotechnol 5 332ndash7
Molina-Cano J L A Sopena J P Polo C Bergareche MA Moralejo J S Swanston and Glidewell 2002 Relationship between barley hordeins and malting quality in a mutant of cv Triumph II Genetic and environmental effects of water uptake J Cer Sci 36 39ndash50
153
Moreau RA BD Whitaker KB Hicks 2002 Phytosterols phytostanols and their conjugates in foods structural diversity quantitat ive analysis and health-promoting uses Prog Lipid Res 41457ndash500
Morett i PP RH Cardello HMAR Gandara and ALN Gandara 2004 Shelf- l i fe study of a beverage developed by blending of partial ly clarif ied-stabil ized sugar-cane juice and natural passion fruit juice Boletim do Centro de Pesquisa e Processamento de Alimentos 22295-310
Morgan KR and DJ Ofman 1998 Glucagel a gell ing β -glucan from barley Cereal Chem 75879-881
Mugulal J I S AM KO1 and T Sorhaug 2001 Changes in quality attr ibutes during storage of togwa a lactic acid fermented gruel J Food Safety 21181-194
Munk L 1981 Barley for food feed and industry Pages 427-459 in Cereals A Renewable Resource Theory and Practical Y Pomeranz and L Munckeds Am Assoc Cereal Chem St Paul MN
Murtaza MA N Huma J Javaid MA Shabbir G Mueen-ud-Din and S Mahmood 2004 Studies on Stabil i ty of Strawberry Drink Stored at Different Temperatures Int J Agri Biol 6(1) 58-60
Mussner MJ K G Parhofer K Von Bergmann P Schwandt and U Broedl and C Otto 2002 Effects of phytosterol ester-enriched margarine on plasma l ipoproteins in mild to moderately hypercholesterolemics are relative to basal cholesterol and fat intake Metabolism 51189ndash194
Naumann E AB Van Rees G Onning R Oste M Wydra and RP Mensink 2005 Beta glucan incorporated into a fruit drink effectively lowers serum LDLndashcholesterol concentration Am J Clin Nutri 83 601-5
Nicoli MC M Anese and M Parpinel 1999 Influence of processing on the antioxidant properties of fruits and vegetables Trend Food Sci Technol 1094-100
154
Nilan RA and SE Ullr ich 1993 Barley Taxonomy origin distribution production genetics and breeding Ch I in Barley Chemistry and Technology AW MacGregor and RS Bhatty (Eds) p 1-29 AACC St Paul MN
Ornish D LL Rudel GW Strain WE Connor SL Connor MB Katan S Grundy and WC Willett 1998 Low-Fat Diets NEJM 338127-129
Oscarsson M R Andersson AC Salomonsson and P Amam 1996 Chemical composit ion of barley samples focusing on dietary f ibre components J Cereal Sci 161-170
Otta K 1984 Minimum shelf l i fe of fruit juices Flussinges abst 51 570 574-590
Pangborn RM I Trabue and A Szczesniak 1973 Effect of hydrocolloid on oral viscosity and basic taste intensit ies J texture studies 4 224241
Papageorgiou M N Lakhdara A Lazaridou CG Bil iaderisd and MS Izydorczyk 2005 Water extractable (1rarr3) (1rarr4)- β -D-glucans from barley and oats An intervarietal study on their structural features and rheological behaviour J Cereal Sci 42 213ndash224
Pendergast K 1985 Whey drinksmdashtechnology processing and marketing J Soc Dairy Tech 8(4) 10ndash5
Perez AG and C Sanz 2001 Effect of high oxygen and high carbonndashdioxide atmospheres on strawberry f lavour and other quality traits J Agric Food Chem 49 2921ndash30
Plat J and RP Mensick 2001 Effects of plant sterols and stanols on l ipid metabolism and cardiovascular r isk Nutr Metab CardiovascDis 1131ndash40
Poehlman J M 1985 Adaptation and distribution In Barley DC Rasmusson (Ed) p 2-17 American Society of Agronomy Madison WI
Potter D 2001Functional drinks can show us the way EUR Food drink Rew333-41
155
Purthi J S J K Manna MS Tectia S G Radhakriahna WE Eipeson S Saroja and Chikkappaji 1984 Studies on the uti l ization of kinnow and malta orange J Food Sci and Technol India 21(3) 121-27
Ragaee S GL Campbell GJ Scoles J G McLeod and RT Tyler 2001 Studies on rye (Secale cereale L) Lines exhibit ing a range of extract viscosit ies 1 Composit ion molecular weight distribution of water
Ranhotra GS J A Gelrotch K Astroth and RS Bhatty 1991 Relative l ipidemic responses in rats fed barley and oat meals and their fractions Cereal Chem 68548ndash55
Ranote PS and GS Bains1982 Juice of kinnow fruit Indian food packer 36(5) 23-33 (FSTA 16(6) 6H 1250 1984)
Renuka AB S G Kulkarnib P Vi jayanandb SG Prapulla 2009 Fructooligosaccharide fort if ication of selected fruit juice beveragesEffect on the quality characterist ics Food Sci Technol pp1ndash3
Rimsten L T Stenberg R Andersson A Andersson and P Aringman 2003 Determination of β -glucan molecular weight using SEC with Calcofluor detection in cereal extracts CerChem 80485-490
Ripsin CM J M Keenan DR Jacobs PJ Elmer RR Welch and L Van Horn 1992 Oat products and l ipid lowering A meta-analysis JAMA 2673317-3325
Rodrigo D J I Arranz S Koch A Fr ı acute gola MC Rodrigo and MJ Esteve 2003 Physicochemical characterist ics and quality of refrigerated spanish orangendashcarrot juices and influence of storage conditions J Food Sci 68(6) 2111ndash2116
Ruck J A 1963 chemical method for analysis of fruit and vegetable products Canadian Deptt Agri PubNo1154
Sa acute nchez MC L Plaza P Elez-Mart ı acute nez B de Ancos O Mart ı acute n-Belloso and MP Cano 2005 Impact of high pressure and pulsed electric f ields on bioactive compounds and antioxidant activity of orange juice in comparison with
156
tradit ional thermal processing J Agric Food Chem 53 4403ndash4409
Sanjoaquin MA PN Appleby EA Spencer and TJ Key 2004 Nutrit ion and l i festyle in relation to bowel movement frequency a cross-sectional study of 20 630 men and women in EPIC-Oxford Pub Health Nutri 7 77-83
Saulnier L S Gevaudan and J F Thibault 1994 Extraction and partial characterization of β -glucan from the endosperms of two barley cult ivars J Cereal Sci 19171ndash178
Schauberger G U C Brink G Guldner R Spaethe L Niklas and H Otto 1977 Diabetes 26 246 Wald A VanThiel D H Hoechstetter L Gavaler J S Egler K M Verm R Scott L and R Lester 1981 Gastroenterol 801497-1 500
Schneeman BO 2001 Dietary f ibre and gastrointestinal function In Advanced Dietary Fibre Technology McCleary BV Prosky L (eds) Blackwell Science Oxford p 168-173
Schulze MB S Liu EB Rimm J E Manson WC Willett FB Hu 2004 Glycemic index glycemic load and dietary f iber intake and incidence of type 2 diabetes in younger and middle-aged women Am J Clin Nutri 80 348-356
Shahidi F 2004 Functional foods Their role in health promotion and disease prevention J Food Sci 69(5) 146-149
Sharma SK QH Zhang and GW Chism 1998 Development of a protein fort i f ied fruit beverage andiIts quality when processed with pulsed electric f ield treatment J Food Quality 21459 -473
Shewry PR 1993 Barley seed proteins Ch 4 in Barley Chemistry and Technology AW MacGregor and RS Bhatty (Eds) p 131-197 AACC St Paul MN
Shimoda M and Y Osaj ima 1981 Studies on offndashflavour formed during storage of Satsuma mandarin juice J Agric Chem Soc Of Japan 55 319ndash24 (Food Sci Technol Abst 14 1194 1982)
157
Sidhu J S K Harinder A Kaur and MB Ram 1990 Functional and chapati making properties of hull- less barley supplemented wheat f lour J Food Sci Technol 27 311ndash313
Singh A K and N Nath 2004 Development and evaluation of whey protein enriched bael fruit (Aegle marmelos) beverage Journal of Food Science and Technology (Mysore) 41 432-436
Singh P A Shukla R Singh and K Singh 2007 Uti l ization of guava juice by value addit ion through blended BEVERAGES Acta Hort ( ISHS) international guava symposium 735639-645
Sloan AE 1999 Top ten trends to watch and work on for the mil lennium Food Technol 53(8) 40-424446485 l -S254-5860
Sloan AE 2002 The top 10 functional food trends The next generation Food Technol 56 32-57
Souci S W Fachmann W Kraut 1987 Food Composit ion and Nutrit ion Tables 198687 Wissenschaft l iche Verlagsgesellschaft Stuttgart
Steel RGD J H Torrie and DA Dickey 1997 Principles and procedures of stat ist ics - a biometrical approach (3r d edit ion) McGraw Hill Book Co Inc New York USA
Stein ER HE Brown and WF Mxclure 1986 Seasonal and storage effects on colour of red f leshed grape fruit juice J Food Sci 51(3) 574-76
Stockbridge H and A Glueck 1989 Photometric determination of cholesterol (CHOD-PAP method) Ecolinereg 2S Merck KGaA 64271 Darmstadt Germany J Lab Clin Med 114(2) 142-151
Stone BAand AE Clark 1992 Chemistry and Biology of (1rarr3) β -glucan Trobe University Press Victoria Austral ia LA
Suh HJ J M Kim and YM Choi 2003 The incorporation of sweet potato application in the preparation of a r ice beverage Int J Food Sci Technol 38(2) 145ndash151
158
Suortt i T L Johansson K Autio 2000 Effect of heating and freezing on molecular weight of oat β -glucan Abstract No 2 2000 American Association of Cereal Chemists Annual Meeting 2000
Swientek B 1998 Toasts of the town Prep Foods pp21-22 24 26
Tappy L E Gugolz P Wursch 1996 Effects of breakfast cereals containing various amounts of beta-glucan f ibers on plasma glucose and insulin responses in NIDDM subjects Diab Care 19 831ndash834
Temell i F CB Bansema KS Stobbe 2004 Development of an orange f lavored barley β -glucan beverage Cereal Chem 81 499503
Temell i F CB Bansema and KS Stobbe 2004 Development of an orange-flavored barley β -glucan Beverage with added whey protein isolate J Food Sci 69(7) 237-242
Tharmmakiti S M Suphantharika T Phaesuwan and C Verdyn 2004 Preparation of spent brewerrsquos yeast b-glucans for potential applications in the food industry Int J Food Sci Technol 3921- 29
Ti isekwa B TCE Mosha HS LASWAI and EE TOWO 2000 Tradit ional alcoholic beverages of Tanzania production quality and changes in quality during storage Intern J Food Sci Nutri 51135-143
Tsunagi K H Sugiyama and Y Shoji 2003 Barley B-glucan and its physiological function Arerugi no Rinsho 23949-953
Uusitupa MI J E Ruuskanen E Maumlkinen 1992 A controlled study on the effect of beta-glucan-rich oat bran on serum lipids in hypercholesterolemic subjects relat ion to apolipoprotein E phenotype J Am Coll Nutri 11651ndash9
Vasanthan T J Gaosong J Yeung and J Li 2002 Dietary f iber profi le of barley as affected by extrusion cooking Food Chem 77 35-40
Volikakis P CG Bil iaderis C Vamvakas and GK Zerfir idis Effects of a commercial oat β -glucan concentrate on the
159
chemical physico-chemical and sensory attr ibutes of a low-fat white-brined cheese product Food Res Int 37 83ndash94
Wallace H Yokoyama A Carol Hudson and BE Knuckles 1997 Effect of Barley beta-Glucan in Durum Wheat Pasta on Human Glycemic Response 0407-06R
Wendorf F R Schild NE Hadidi AE Close M Kobusiewicz H Wieckowska B Issawi and H Haas 1979 Use of barley in the Egyptian late Paleoli thic Sci 205 1341-1347
Westerlund E R Andersson and P Aman 1993 Isolation and chemical characterization of water-soluble mixed-l inked b-glucans and arabinoxylans in oat mil l ing fractions Carbo Poly 20115ndash12
Wood P J 1986 Oat b-glucan Structure location and properties In F H Webster (Ed) Oats Chemistry and technology (pp 121ndash152) Minnesota American Association of Cereal Chemists Inc
Wood P J J T Braaten WS Fraser D Riedel and L Poste 1990 Comparisons of the viscous properties of oat gum and guar gum and the effects of these and oat bran on glycemic index J Agric Food Chem 38753ndash7
Wood PJ D Paton I R Siddiqui 1977 Determination of β -glucan in oats and barley Cer Chem 54524ndash533
Wood PJ F W Braaten FW Scott KD Riedel MS Wolynetz and MW Coll ins 1994 Effect of dose and modification of viscous properties of oat gum on plasma glucose and insulin fol lowing an oral glucose load Br J Nutr 72731ndash743
Wood PJ I R Siddiqui and D Paton 1978 Extraction of High-Viscosity Gums from Oats 1978 Cereal Chem 551038 - 1049
Wood PJ I R Siddiqui and D Paton 1989 Extraction of High-Viscosity Gums from Oats Cereal Chem 55108-1049
Wood PJ J Weisz and BA Blackwell 1994a Structural studies of (1rarr3) (1rarr4)-β-D- glucans by 13C-nuclear magnetic resonance spectroscopy and by rapid analysis of cel lulose-l ike regions using high-performance anion-exchange
160
chromatography of ol igosaccharides released by l ichenase Cereal Chem 71 301-307
Wood PJ J Weisz P Fedec VD Burrows 1989 Large scale preparation and properties of oat fractions enriched in (13) (14)- β -D-glucan Cereal Chem 6697ndash103
Wood PJ J T Braaten FW Scott KD Riedel MS Wolynetz MW Coll ins 1994a Effect of dose and modification of viscous properties of oat gum on plasma glucose and insulin fol lowing an oral glucose load Brit ish J Nutri 72731ndash743
Wood PJ J T Braaten WS Fraser D Riede and LM Poste 1990 Comparisons of viscous properties of oat and guar gum and the effects of these and oat bran on glycemic index J Agric Food chem 38753-757
Wood PJ MU Beer G Butler 2000 Evaluation of role of concentration and molecular weight of oat β -glucan in determining effect of viscosity on plasma on plasma glucose and insulin fol lowing an oral glucose load Brit J Nutr 8419-23
Wood PJ MU Beer 1998 Functional oat products In Mazza G editor Functional Foods Biochemical and Processing Aspects Technomic Publishing Co Lancaster PA p 1ndash37
Wu YV GE Stringfel low 1994 Protein and β -glucan enriched fractions from high protein high β -glucan barleys by sieving and air classif ication Cereal Chem 71(3) 220-223
Wursch P F X Pi-Sunyer 1997 The role of viscous soluble f iber in the metabolic control of diabetes A review with special emphasis on cereals r ich in beta-glucan Diab Care 20 1774 ndash 1780
Wursch P F X Pi-Sunyer 1997 The role of viscous soluble f ibre in the metabolic control of diabetesmdasha review with special emphasis on cereals r ich in beta-glucan Diabetes Care 201774ndash1780
Yu L J Perret M Harris J Wilson and S Haley 2003 Antioxidant properties of bran extracts from Akron wheat grown at different locations J Agric And Food Chem 51 1566-1570
161
ZhangG W Junmei C J inxin 2002 Analysis of b glucan content in barley cult ivars from different locations of China Food Chemi 79 251- 254
Ziena HMS 2000 Quality attr ibutes of Bearss Seedless l ime (Citrus lat i fol ia Tan) juice during storage Food Chem 71167-172
162
APPENDIX I
COMPOSITION OF FUNCTIONAL BEVERAGE
Ingredients Concentration (ww)
Water 890
β -Glucan or Pectin 02 0 4 0 6 0 8 and 10
Sucrose 50
High fructose corn syrup 50
Citric acid 027
Ascorbic acid 003
Β -Carotene 10ppm
Natural orange f lavor 001
Terpeneless orange peel oi l 0 0005
163
APPENDIX II
9 POINT HEDONIC SCALE PRODUCT FUNCTIONAL BEVERAGE DATE __________ NAME OF JUDGE __________________________
SAMPLE NAME Color Flavor Sweetness Sourness Overall acceptability T1 T2 T3 T4 T5 T6
REMARKS (IF ANY) _________________________________________ _________________________________________ __________________________________________ KEY FOR RANKING Dislike extremely 1 Dislike very much 2 Dislike moderately 3 Dislike slightly 4 Neither dislikes nor like 5 Like slightly 6 Like moderately 7 Like very much 8 Like extremely 9
164
APPENDIX III
UNIVERSITY OF AGRICULTURE FAISALABAD
National Institute of Food Science and Technology
Name of the Project
Development of Functional Beverage from Barley
I have been explained in detail the purpose and rationale of the above
mentioned component of the Barley Functional Beverage I understand that
this project is of national significance and my full commitment and dedication
with it will be of paramount importance I am volunteering for it I have had a
chance to ask questions and answered them I undertake that I will abide by
all the instructions given by the investigators and will use the same Barley
Functional Beverage given to me in the designated period Further I am
bound to fill the questionnaire at the end of the week to best of my
knowledge
Name amp Signature of the Subject Dated
Name amp Signature of the Person obtaining consent Dated
Name amp Signature of the Researcher Dated
Name amp Signature of the Principal Investigator Dated
165
APPENDIX IV DEMOGRAPHIC INFORMATION PERFORMA (SUBJECTS)
Group A = Control (0 β -g lucan)
No Name Age (y ) Locat ion
1 Muhammad Umair Arshad 28 195-A Gul i s tan Colony 2 Fa isa labad Pak is tan
2 Moazzam Raf iq Khan 33 290-A Ghulam Muhammadabad Fa isa labad Pak is tan
3 Shahzad Hussa in 29 12-B Chakwal Pakis tan
4 Mian Anjum Murtaza 30 123-C Peoples Colnoy 2 Fa isa labad Pak is tan
5 Tauseef Sul tan 29 Room 32-D Hashmi Hal l UAF Fa isa labad Pak is tan
Group B = (0 2 β -g lucan)
1 I ssa Khan 31 Room 3 -W Afzal Hal l Uaf Faisa labad Pak is tan
2 Muhammad Nasi r 30 29-B Peoples Colony 2 Faisa labad Pak is tan
3 Muhammad Ibrar 31 146-A Samnabad Fa isa labad Pakis tan
4 Muhamamd Saeed 35 280 E Si r Syed Town Faisa labad Pakis tan
5 Tahir Nadeem 30 Room 4 -W Qazzafi Hal l UAF Faisa labad Pak is tan
Group C = (0 4 β -g lucan)
1 Ghulam Mueen ud din 36 116-F Nisar Colony Faisa labad Pakis tan
2 Mubashar Hussain 30 111-B gul is tan colony 2 Fa isa labad Pak is tan
3 Muhammad Asim Shabbir 31 P-55 Afshan Colony Fa isa labad Pakis tan
4 Muhammad Faisa l 34 111-B gul is tan colony 2 Fa isa labad Pak is tan
5 Muhammad Nadeem 26 Room 23-D Ayub Hal l UAF Faisa labad Pak is tan
Group D = (0 6 β -g lucan)
1 Imran Pasha 36 54 -C Lasani Town Fa isa labad Pakis tan
2 Dr Nuzhat Huma 48 Hous 6 Universi ty Residence UAF Fa isa labad Pakis tan
3 Asim Ehsan 35 80-A Si tara Sapna City Faisa labad Pak is tan
4 Farhan Ahmad 27 Room 24 Ayub Hal l UAF Faisa labad Pak is tan
5 Muhammad Imran 27 21-K Gul is tan Colony 1 Faisa labad Pak is tan
- TITLE PAGEdoc
-
- ACKNOWLEDGMENTS
-
- CONTENTS
- ABSTRACT
- INTRODUCTION
- 1
- 2
- R
- 6
- 3
- M
- 3
- 4
- R
- 5
- 5
- S
- 1
- C
- 1
- R
- 1
- L
- 1
-
- FINAL THESISdoc
-
- LITERATURE CITED
- AACC 2000 Approved Methods of American Association of Cereal Chemists The American Association of Cereal Chemists Inc St Paul Minnesota USA
-
- Bryan D J Robert AT Wilson T Carlson S Frazer GH Zheng 2003 β-Glucan Fractions from Barley and Oats Are Similarly Antiatherogenic in Hypercholesterolemic Syrian Golden Hamsters The American Society for Nutritional Sciences J Nutri Metabolism 133468-475
- Ruck JA 1963 chemical method for analysis of fruit and vegetable products Canadian Deptt Agri PubNo1154
-
- Suh HJ JM Kim and YM Choi 2003 The incorporation of sweet potato application in the preparation of a rice beverage Int J Food Sci Technol 38(2)145ndash151
-
- Tharmmakiti S M Suphantharika T Phaesuwan and C Verdyn 2004 Preparation of spent brewerrsquos yeast b-glucans for potential applications in the food industry Int J Food Sci Technol 3921- 29
-
- ZhangG W Junmei C Jinxin 2002 Analysis of b glucan content in barley cultivars from different locations of China Food Chemi 79 251- 254
-
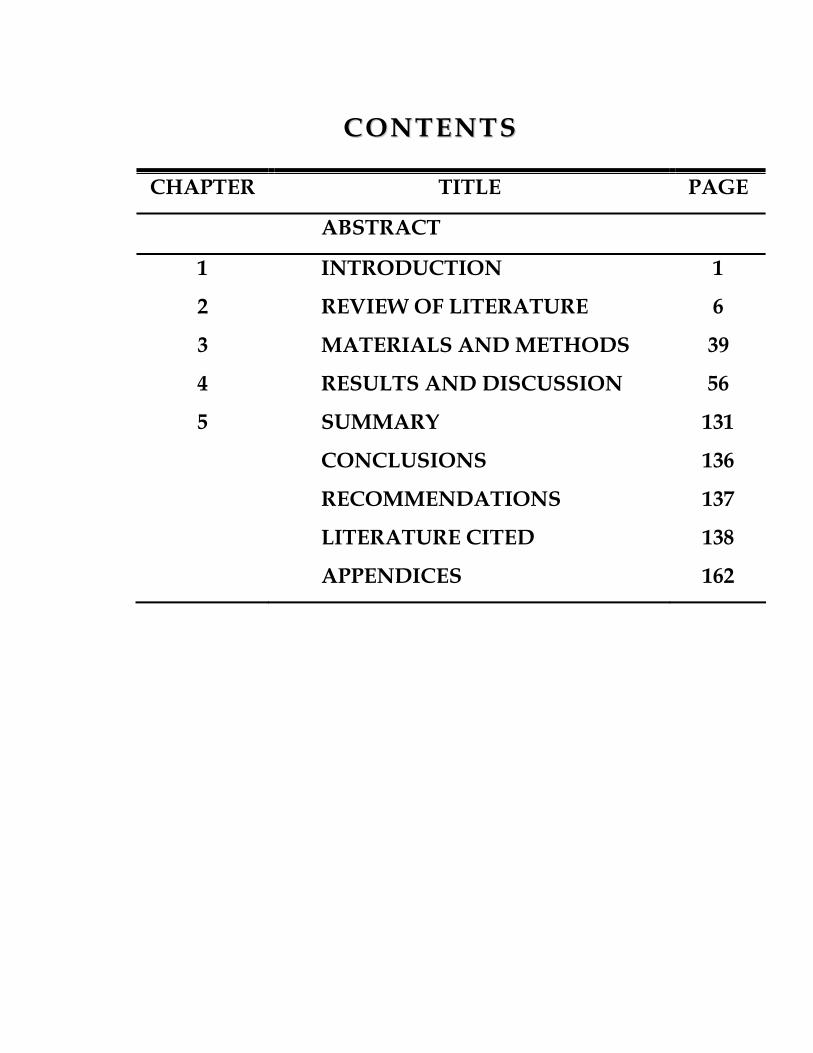
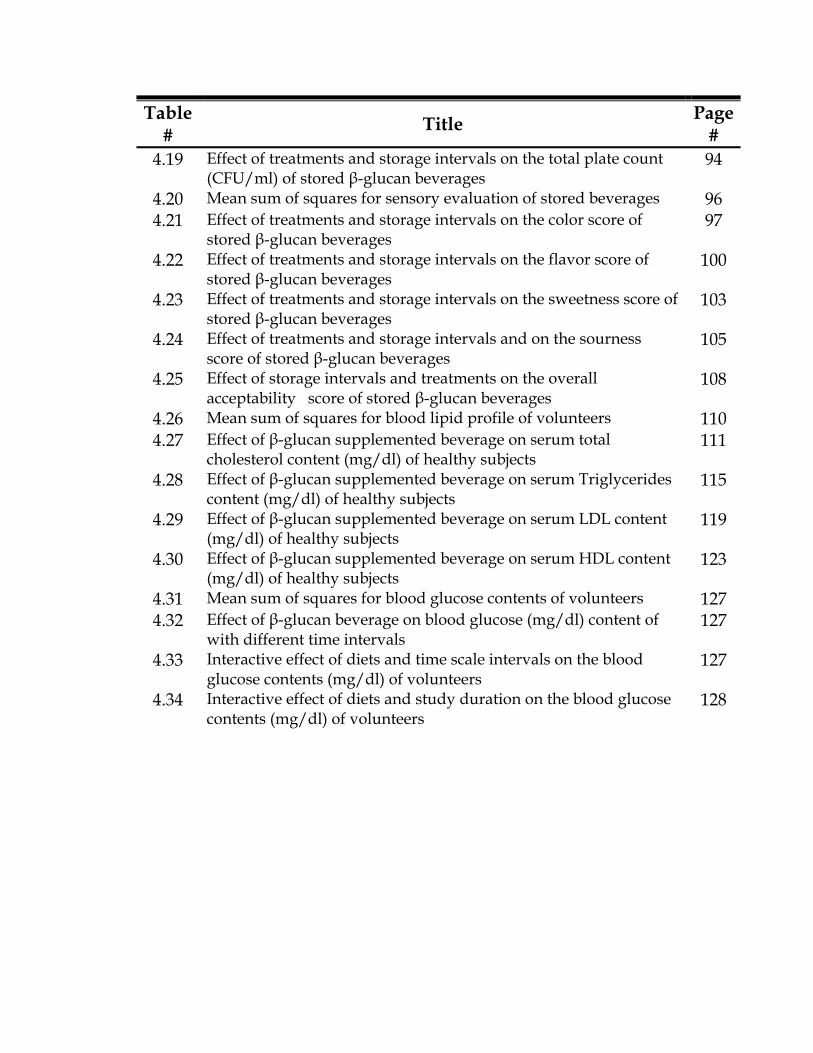