development of a viable corn stover market: impacts … of a viable corn stover market: impacts on...
TRANSCRIPT
PURDUE EXTENSIONRE-6-W
Fueling and Feeding America Through Renewable Resources
RenewableEnergyDevelopment of a Viable Corn Stover Market:
Impacts on Corn and Soybean MarketsJulie Fiegel, Farzad Taheripour, and Wallace E. Tyner
Department of Agricultural EconomicsPurdue University
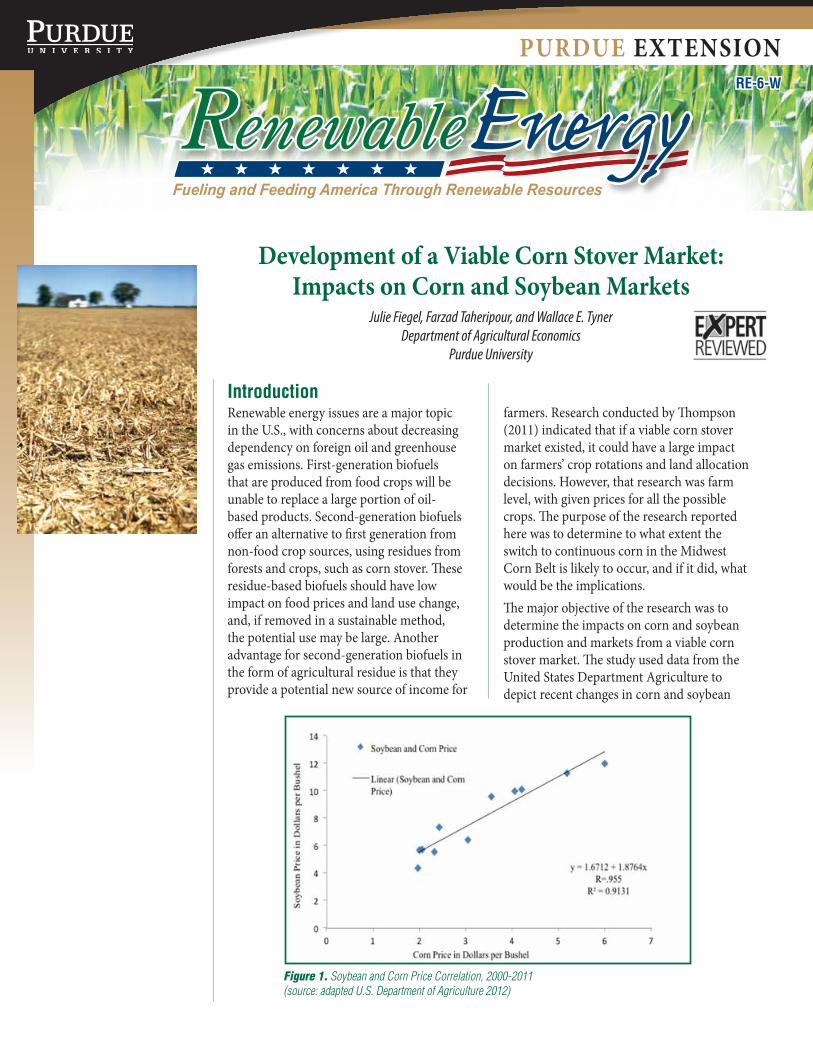
Figure 1. Soybean and Corn Price Correlation, 2000-2011 (source: adapted U.S. Department of Agriculture 2012)
IntroductionRenewable energy issues are a major topic in the U.S., with concerns about decreasing dependency on foreign oil and greenhouse gas emissions. First-generation biofuels that are produced from food crops will be unable to replace a large portion of oil-based products. Second-generation biofuels offer an alternative to first generation from non-food crop sources, using residues from forests and crops, such as corn stover. These residue-based biofuels should have low impact on food prices and land use change, and, if removed in a sustainable method, the potential use may be large. Another advantage for second-generation biofuels in the form of agricultural residue is that they provide a potential new source of income for
farmers. Research conducted by Thompson (2011) indicated that if a viable corn stover market existed, it could have a large impact on farmers’ crop rotations and land allocation decisions. However, that research was farm level, with given prices for all the possible crops. The purpose of the research reported here was to determine to what extent the switch to continuous corn in the Midwest Corn Belt is likely to occur, and if it did, what would be the implications.The major objective of the research was to determine the impacts on corn and soybean production and markets from a viable corn stover market. The study used data from the United States Department Agriculture to depict recent changes in corn and soybean
2
Development of a Viable Corn Stover Market: Impacts on Corn and Soybean Markets • RE-6-W
Fueling and Feeding America Through Renewable Resources
RenewableEnergy
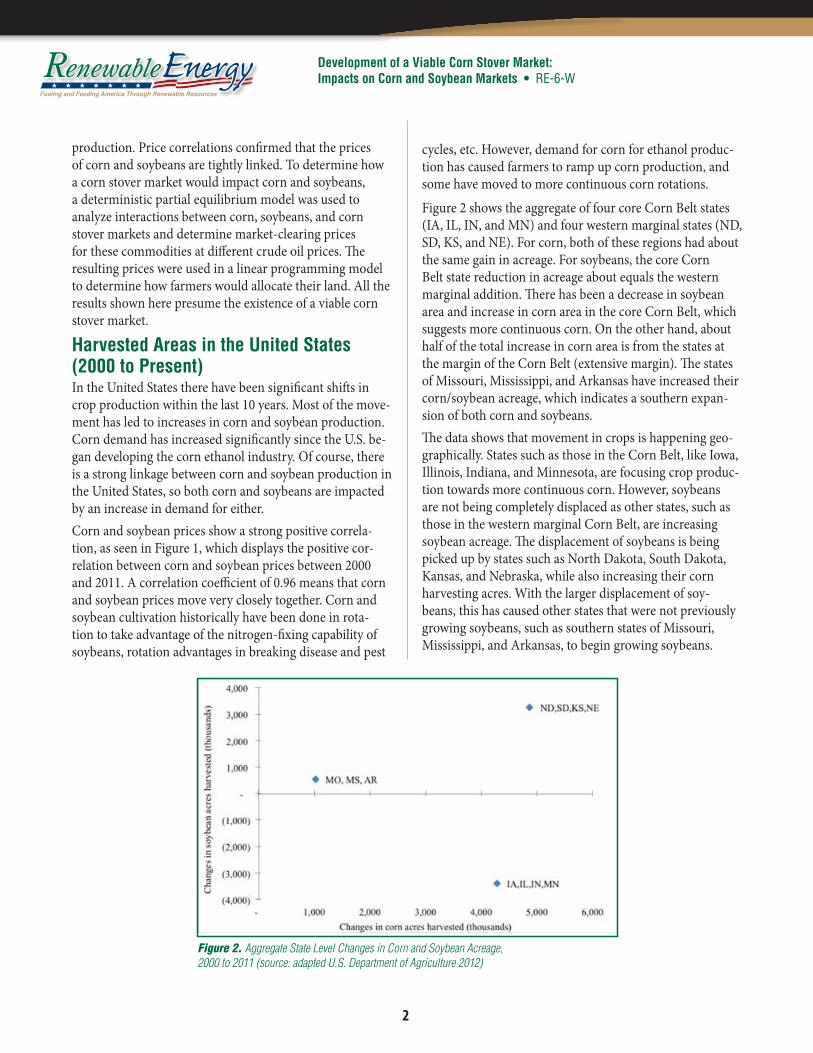
Figure 2. Aggregate State Level Changes in Corn and Soybean Acreage, 2000 to 2011 (source: adapted U.S. Department of Agriculture 2012)
production. Price correlations confirmed that the prices of corn and soybeans are tightly linked. To determine how a corn stover market would impact corn and soybeans, a deterministic partial equilibrium model was used to analyze interactions between corn, soybeans, and corn stover markets and determine market-clearing prices for these commodities at different crude oil prices. The resulting prices were used in a linear programming model to determine how farmers would allocate their land. All the results shown here presume the existence of a viable corn stover market.
Harvested Areas in the United States (2000 to Present)In the United States there have been significant shifts in crop production within the last 10 years. Most of the move-ment has led to increases in corn and soybean production. Corn demand has increased significantly since the U.S. be-gan developing the corn ethanol industry. Of course, there is a strong linkage between corn and soybean production in the United States, so both corn and soybeans are impacted by an increase in demand for either.Corn and soybean prices show a strong positive correla-tion, as seen in Figure 1, which displays the positive cor-relation between corn and soybean prices between 2000 and 2011. A correlation coefficient of 0.96 means that corn and soybean prices move very closely together. Corn and soybean cultivation historically have been done in rota-tion to take advantage of the nitrogen-fixing capability of soybeans, rotation advantages in breaking disease and pest
cycles, etc. However, demand for corn for ethanol produc-tion has caused farmers to ramp up corn production, and some have moved to more continuous corn rotations.
Figure 2 shows the aggregate of four core Corn Belt states (IA, IL, IN, and MN) and four western marginal states (ND, SD, KS, and NE). For corn, both of these regions had about the same gain in acreage. For soybeans, the core Corn Belt state reduction in acreage about equals the western marginal addition. There has been a decrease in soybean area and increase in corn area in the core Corn Belt, which suggests more continuous corn. On the other hand, about half of the total increase in corn area is from the states at the margin of the Corn Belt (extensive margin). The states of Missouri, Mississippi, and Arkansas have increased their corn/soybean acreage, which indicates a southern expan-sion of both corn and soybeans.The data shows that movement in crops is happening geo-graphically. States such as those in the Corn Belt, like Iowa, Illinois, Indiana, and Minnesota, are focusing crop produc-tion towards more continuous corn. However, soybeans are not being completely displaced as other states, such as those in the western marginal Corn Belt, are increasing soybean acreage. The displacement of soybeans is being picked up by states such as North Dakota, South Dakota, Kansas, and Nebraska, while also increasing their corn harvesting acres. With the larger displacement of soy-beans, this has caused other states that were not previously growing soybeans, such as southern states of Missouri, Mississippi, and Arkansas, to begin growing soybeans.
PURDUE EXTENSION
3
Development of a Viable Corn Stover Market: Impacts on Corn and Soybean Markets • RE-6-W
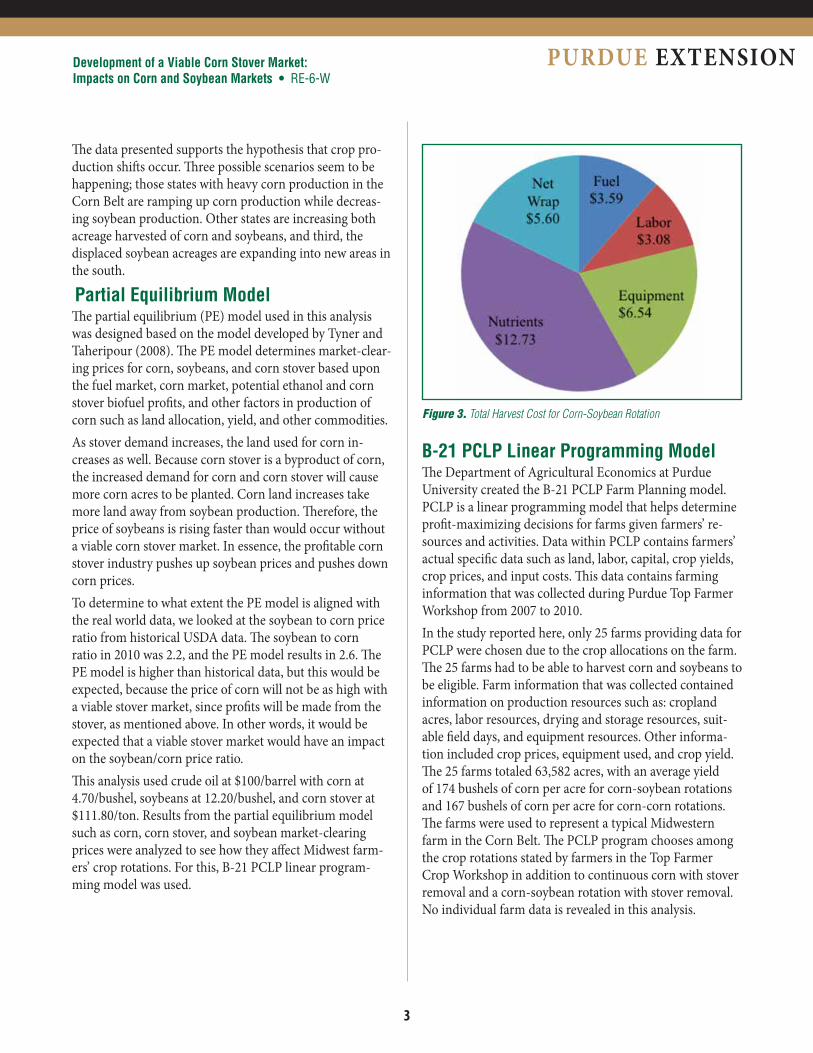
Figure 3. Total Harvest Cost for Corn-Soybean Rotation
The data presented supports the hypothesis that crop pro-duction shifts occur. Three possible scenarios seem to be happening; those states with heavy corn production in the Corn Belt are ramping up corn production while decreas-ing soybean production. Other states are increasing both acreage harvested of corn and soybeans, and third, the displaced soybean acreages are expanding into new areas in the south.
Partial Equilibrium Model The partial equilibrium (PE) model used in this analysis was designed based on the model developed by Tyner and Taheripour (2008). The PE model determines market-clear-ing prices for corn, soybeans, and corn stover based upon the fuel market, corn market, potential ethanol and corn stover biofuel profits, and other factors in production of corn such as land allocation, yield, and other commodities.As stover demand increases, the land used for corn in-creases as well. Because corn stover is a byproduct of corn, the increased demand for corn and corn stover will cause more corn acres to be planted. Corn land increases take more land away from soybean production. Therefore, the price of soybeans is rising faster than would occur without a viable corn stover market. In essence, the profitable corn stover industry pushes up soybean prices and pushes down corn prices.To determine to what extent the PE model is aligned with the real world data, we looked at the soybean to corn price ratio from historical USDA data. The soybean to corn ratio in 2010 was 2.2, and the PE model results in 2.6. The PE model is higher than historical data, but this would be expected, because the price of corn will not be as high with a viable stover market, since profits will be made from the stover, as mentioned above. In other words, it would be expected that a viable stover market would have an impact on the soybean/corn price ratio.This analysis used crude oil at $100/barrel with corn at 4.70/bushel, soybeans at 12.20/bushel, and corn stover at $111.80/ton. Results from the partial equilibrium model such as corn, corn stover, and soybean market-clearing prices were analyzed to see how they affect Midwest farm-ers’ crop rotations. For this, B-21 PCLP linear program-ming model was used.
B-21 PCLP Linear Programming ModelThe Department of Agricultural Economics at Purdue University created the B-21 PCLP Farm Planning model. PCLP is a linear programming model that helps determine profit-maximizing decisions for farms given farmers’ re-sources and activities. Data within PCLP contains farmers’ actual specific data such as land, labor, capital, crop yields, crop prices, and input costs. This data contains farming information that was collected during Purdue Top Farmer Workshop from 2007 to 2010.In the study reported here, only 25 farms providing data for PCLP were chosen due to the crop allocations on the farm. The 25 farms had to be able to harvest corn and soybeans to be eligible. Farm information that was collected contained information on production resources such as: cropland acres, labor resources, drying and storage resources, suit-able field days, and equipment resources. Other informa-tion included crop prices, equipment used, and crop yield. The 25 farms totaled 63,582 acres, with an average yield of 174 bushels of corn per acre for corn-soybean rotations and 167 bushels of corn per acre for corn-corn rotations. The farms were used to represent a typical Midwestern farm in the Corn Belt. The PCLP program chooses among the crop rotations stated by farmers in the Top Farmer Crop Workshop in addition to continuous corn with stover removal and a corn-soybean rotation with stover removal. No individual farm data is revealed in this analysis.
4
Development of a Viable Corn Stover Market: Impacts on Corn and Soybean Markets • RE-6-W
Fueling and Feeding America Through Renewable Resources
RenewableEnergy
Table 1. Bale Grades, Penalties, and Probabilities
Category Moisture Ash Penalty ProbabilityGrade 1 <20% <10% $0/ton 61.44%Grade 2 ≥20% and <28% <15% $8/ton 29.20%Grade 3 ≥28% and <36% <15% $17/ton 0.83%Grade 4 ≥36% >15% 100% of price 8.52%
(source: Thompson 2011)
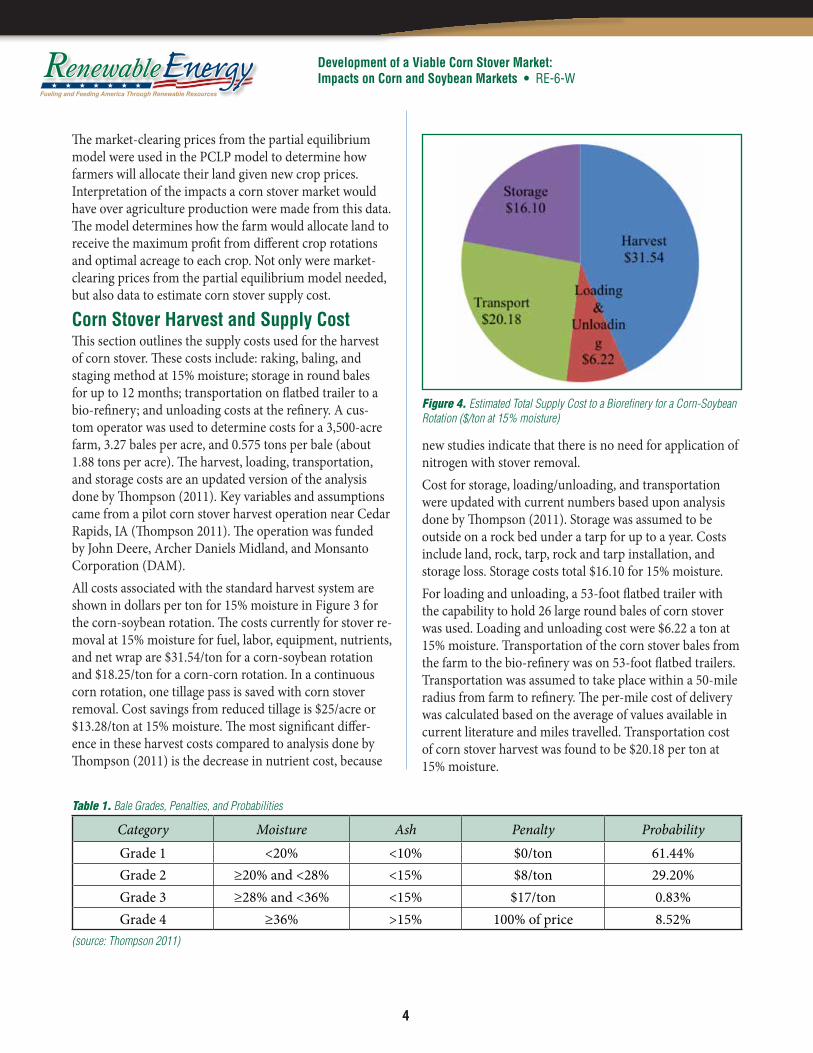
Figure 4. Estimated Total Supply Cost to a Biorefinery for a Corn-Soybean Rotation ($/ton at 15% moisture)
The market-clearing prices from the partial equilibrium model were used in the PCLP model to determine how farmers will allocate their land given new crop prices. Interpretation of the impacts a corn stover market would have over agriculture production were made from this data. The model determines how the farm would allocate land to receive the maximum profit from different crop rotations and optimal acreage to each crop. Not only were market-clearing prices from the partial equilibrium model needed, but also data to estimate corn stover supply cost.
Corn Stover Harvest and Supply CostThis section outlines the supply costs used for the harvest of corn stover. These costs include: raking, baling, and staging method at 15% moisture; storage in round bales for up to 12 months; transportation on flatbed trailer to a bio-refinery; and unloading costs at the refinery. A cus-tom operator was used to determine costs for a 3,500-acre farm, 3.27 bales per acre, and 0.575 tons per bale (about 1.88 tons per acre). The harvest, loading, transportation, and storage costs are an updated version of the analysis done by Thompson (2011). Key variables and assumptions came from a pilot corn stover harvest operation near Cedar Rapids, IA (Thompson 2011). The operation was funded by John Deere, Archer Daniels Midland, and Monsanto Corporation (DAM).All costs associated with the standard harvest system are shown in dollars per ton for 15% moisture in Figure 3 for the corn-soybean rotation. The costs currently for stover re-moval at 15% moisture for fuel, labor, equipment, nutrients, and net wrap are $31.54/ton for a corn-soybean rotation and $18.25/ton for a corn-corn rotation. In a continuous corn rotation, one tillage pass is saved with corn stover removal. Cost savings from reduced tillage is $25/acre or $13.28/ton at 15% moisture. The most significant differ-ence in these harvest costs compared to analysis done by Thompson (2011) is the decrease in nutrient cost, because
new studies indicate that there is no need for application of nitrogen with stover removal.Cost for storage, loading/unloading, and transportation were updated with current numbers based upon analysis done by Thompson (2011). Storage was assumed to be outside on a rock bed under a tarp for up to a year. Costs include land, rock, tarp, rock and tarp installation, and storage loss. Storage costs total $16.10 for 15% moisture.For loading and unloading, a 53-foot flatbed trailer with the capability to hold 26 large round bales of corn stover was used. Loading and unloading cost were $6.22 a ton at 15% moisture. Transportation of the corn stover bales from the farm to the bio-refinery was on 53-foot flatbed trailers. Transportation was assumed to take place within a 50-mile radius from farm to refinery. The per-mile cost of delivery was calculated based on the average of values available in current literature and miles travelled. Transportation cost of corn stover harvest was found to be $20.18 per ton at 15% moisture.
PURDUE EXTENSION
5
Development of a Viable Corn Stover Market: Impacts on Corn and Soybean Markets • RE-6-W
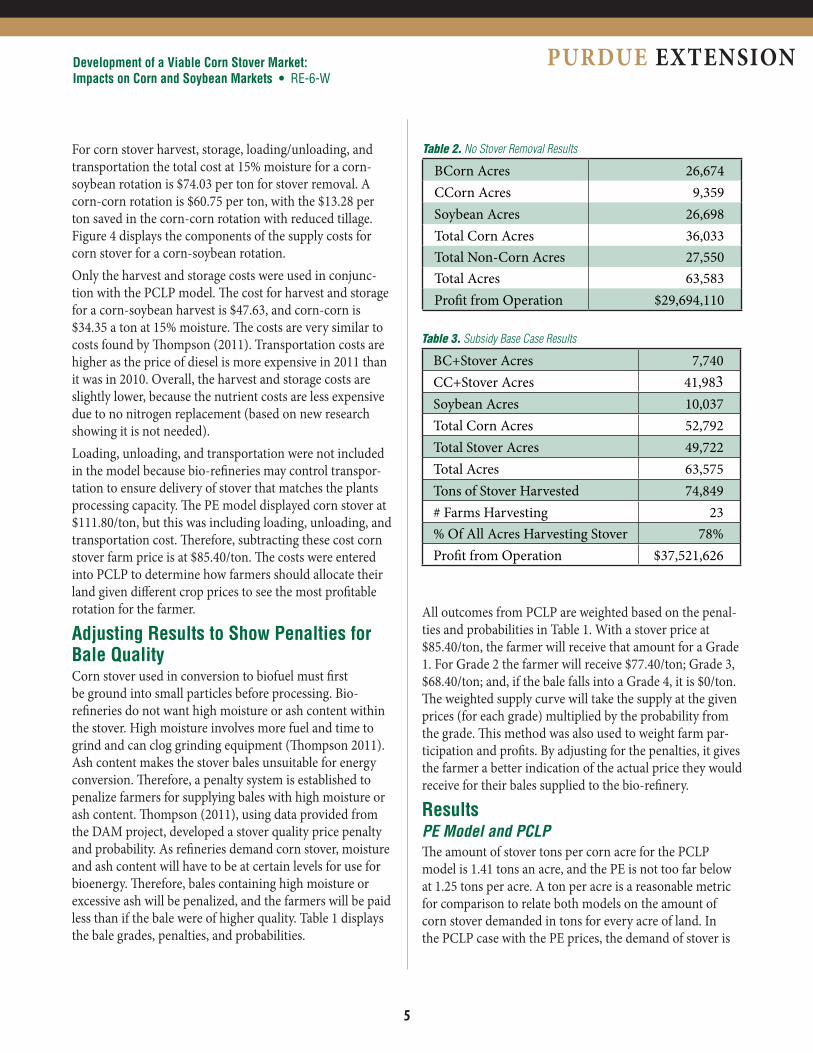
Table 2. No Stover Removal Results
BCorn Acres 26,674 CCorn Acres 9,359 Soybean Acres 26,698 Total Corn Acres 36,033 Total Non-Corn Acres 27,550 Total Acres 63,583 Profit from Operation $29,694,110
Table 3. Subsidy Base Case Results
BC+Stover Acres 7,740 CC+Stover Acres 41,983 Soybean Acres 10,037 Total Corn Acres 52,792 Total Stover Acres 49,722 Total Acres 63,575 Tons of Stover Harvested 74,849 # Farms Harvesting 23 % Of All Acres Harvesting Stover 78%Profit from Operation $37,521,626
For corn stover harvest, storage, loading/unloading, and transportation the total cost at 15% moisture for a corn-soybean rotation is $74.03 per ton for stover removal. A corn-corn rotation is $60.75 per ton, with the $13.28 per ton saved in the corn-corn rotation with reduced tillage. Figure 4 displays the components of the supply costs for corn stover for a corn-soybean rotation.Only the harvest and storage costs were used in conjunc-tion with the PCLP model. The cost for harvest and storage for a corn-soybean harvest is $47.63, and corn-corn is $34.35 a ton at 15% moisture. The costs are very similar to costs found by Thompson (2011). Transportation costs are higher as the price of diesel is more expensive in 2011 than it was in 2010. Overall, the harvest and storage costs are slightly lower, because the nutrient costs are less expensive due to no nitrogen replacement (based on new research showing it is not needed). Loading, unloading, and transportation were not included in the model because bio-refineries may control transpor-tation to ensure delivery of stover that matches the plants processing capacity. The PE model displayed corn stover at $111.80/ton, but this was including loading, unloading, and transportation cost. Therefore, subtracting these cost corn stover farm price is at $85.40/ton. The costs were entered into PCLP to determine how farmers should allocate their land given different crop prices to see the most profitable rotation for the farmer.
Adjusting Results to Show Penalties for Bale QualityCorn stover used in conversion to biofuel must first be ground into small particles before processing. Bio-refineries do not want high moisture or ash content within the stover. High moisture involves more fuel and time to grind and can clog grinding equipment (Thompson 2011). Ash content makes the stover bales unsuitable for energy conversion. Therefore, a penalty system is established to penalize farmers for supplying bales with high moisture or ash content. Thompson (2011), using data provided from the DAM project, developed a stover quality price penalty and probability. As refineries demand corn stover, moisture and ash content will have to be at certain levels for use for bioenergy. Therefore, bales containing high moisture or excessive ash will be penalized, and the farmers will be paid less than if the bale were of higher quality. Table 1 displays the bale grades, penalties, and probabilities.
All outcomes from PCLP are weighted based on the penal-ties and probabilities in Table 1. With a stover price at $85.40/ton, the farmer will receive that amount for a Grade 1. For Grade 2 the farmer will receive $77.40/ton; Grade 3, $68.40/ton; and, if the bale falls into a Grade 4, it is $0/ton. The weighted supply curve will take the supply at the given prices (for each grade) multiplied by the probability from the grade. This method was also used to weight farm par-ticipation and profits. By adjusting for the penalties, it gives the farmer a better indication of the actual price they would receive for their bales supplied to the bio-refinery.
ResultsPE Model and PCLPThe amount of stover tons per corn acre for the PCLP model is 1.41 tons an acre, and the PE is not too far below at 1.25 tons per acre. A ton per acre is a reasonable metric for comparison to relate both models on the amount of corn stover demanded in tons for every acre of land. In the PCLP case with the PE prices, the demand of stover is
6
Development of a Viable Corn Stover Market: Impacts on Corn and Soybean Markets • RE-6-W
Fueling and Feeding America Through Renewable Resources
RenewableEnergyhigher than in the PE model. The PCLP model also shows a smaller fraction of soybeans to corn. As discussed earlier, the fact that this is representative of a core Corn Belt pro-ducing area, with the capabilities of harvesting continuous corn, could mean that this area is producing a large portion of the stover demand compared to other states. Other states would not need to produce as much stover as the Corn Belt states and could focus more on soybean production.No Stover Removal and Base CaseBy leaving all market prices the same, except stover at $0/ton, the no stover removal case demonstrates how farms would allocate their land with no stover market. This case represents the status quo. Having this case validates that by removing stover there is an increase in profit for the farm. The profit from this operation is used in compari-son to the base and all sensitivity cases to see how profits differ with corn stover removal. The base case with corn at $4.70/bushel, soybeans $12.20/bushel, and custom harvest price of 47.63/ton (corn-soybean rotation) and $34.35/ton (corn-corn rotation) is used. Table 2 displays results with no stover removal. BCorn is corn production in rotation, CCorn is continuous corn, and soybeans is soybean corn rotation in soybeans.The results of the no stover removal case show that at the high relative price of soybeans ($12.20/bushel) farm-ers chose to profit with more soybean production. The continuous corn acres are significantly smaller than acres allocated towards soybean production. The base case is presented in Table 3. Stover is priced at $85.40/ton, corn $4.70/bushel, soybeans $12.20/bushel, and custom harvest price of $47.63/ton (corn-soybean rotation) and $34.35/ton (corn-corn rotation) are used. The base case has over 78% of all acres harvested dedicated to stover. Out of 25 farms, 23 of the farms chose to participate in harvest-ing stover. The base case shows an increase in profits of 26% from the no stover removal case. At the high corn stover price, 23 farms chose to harvest, with over 78% of all acres harvesting stover. There is a large decrease of around 68% in the amount of acres allocated to soybean production. The amount of total corn acres increased 47%. PCLP Sensitivity AnalysisThere were five sensitivity cases examined from the PCLP model with respect to changes in some key assumptions used in this research. In particular, the following sensitivity tests are performed:
Elimination of tillage saving costs• Yield drag• Reduction in stover price• New harvest technology• New harvest technology with elimination of tillage savingIn these analyses we considered changes in the PCLP results discussed in the base. Corn and soybean prices are $4.70, and $12.20 and corn stover is $85.40/ton when the crude oil price is about $100 per barrel.All sections describe modifications to the harvest of stover and how it affected the profit and corn stover harvest compared to the base case. Profits are compared to the no stover removal case to see if stover removal was profitable for all scenarios. All cases contain the outputs from PCLP and the adjustment for moisture and ash penalties. Elimination of Tillage SavingsEach farm has different harvest and management prac-tices for how corn stover will be harvested and removed. Therefore, tillage activities will differ, and not all farms may have the $25/acre reduction in tillage. This case will add back in the $25/acre for the continuous corn rotation, mak-ing both rotations have harvest and storage costs of $47.63/ton. With the corn rotation, stover profits will only be made every other year, unlike the continuous corn, which will have stover profits yearly.The results from the reduction in tillage savings show a 16% decrease in the amount of acres harvesting stover compared to the base case results. The $25/acre savings in tillage gives farmers an incentive to harvest stover; tak-ing it away decreases the appeal of stover harvest. The amount of continuous corn with stover removal acres has declined almost in half, to around 18,000 acres. Those acres have been given to corn-soybean with stover removal and soybean acres, as both the amount of acres for these crop rotation choices have almost doubled. Total corn acres de-clined 15%. Profit from operation from the base case to the no tillage has fallen 6%. Profits compared to the no stover removal case have increased over 18%.Yield DragWith continuous corn rotations, agronomist argue the yield is less than with a corn-soybean rotation. Agronomists have found with rotated corn there is a smaller amount of dis-ease and insect buildup, a reduced amount of crop residue, and nitrogen fertilizer application is less (The Ohio State
PURDUE EXTENSION
7
Development of a Viable Corn Stover Market: Impacts on Corn and Soybean Markets • RE-6-W
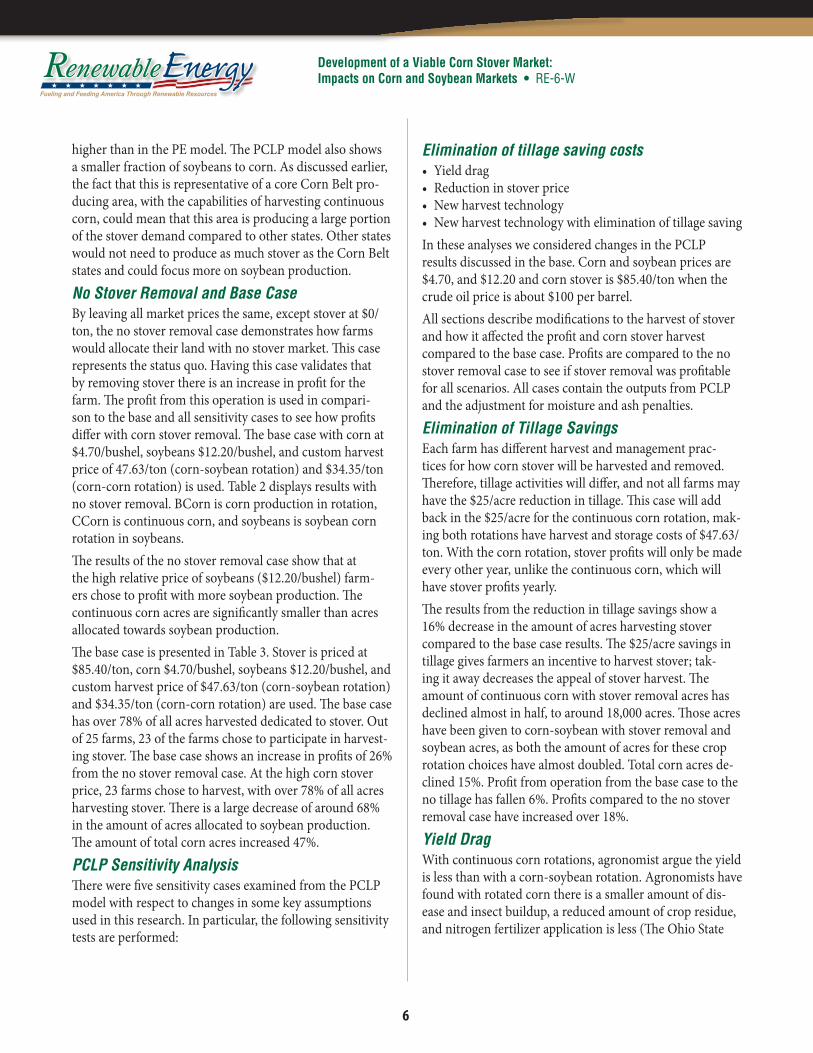
Figure 5. Allocation of Acres for Each Scenario
University 2011). As a result, in this sensitivity analysis, a corn yield drag was levied for continuous corn rotation and continuous corn with stover removal.Within this study, it was concluded that 18 of the 25 farms indicated yield drag from farmer inputs. For the remain-ing seven farms, continuous corn yield is equivalent to or larger than yield with rotated corn. By adding a yield drag on all continuous corn rotations, we got results consistently reflecting the yield drag. Continuous corn yield was taken as a percentage of the reported rotated corn yield. Crop budget publications from Purdue University, University of Illinois, and Iowa State University were used to make adjustment by taking yield drag observations each year.For the yield drag case, the percent of acres harvesting sto-ver is equal to the base case at 78%. The amount of stover acres difference from base to yield drag case is less than 1%. Overall, the yield drag results does not differ significantly from the base case, but profits are down in the yield drag results by 3%. Tons of stover harvested does decrease in the yield drag case around 2,000 tons. Since this case decreases the yields of the continuous corn harvest, it is expected that stover tons and profit will be lower. Profits for the yield drag case are 22% higher than in the no stover removal case. Since the new yield drag is not drastically lower than the average from the base case, the profits do not change drastically. In other words, most farmers already had some degree of yield drag built into their expectations.
Reduction in Corn Stover PriceThis sensitivity analysis decreased the price of corn stover by 20 percent. Corn stover farmer price of $85.40/ton and delivery price of $111.80/ton may be an unreasonable price for stover, rendering conversion technologies uneconomic. Therefore, leaving all other prices as before and lowering the price of corn stover, we can see how farmers will react to the lower price. Corn stover will be $89.44/ton with delivery or farm price of $63.40/ton. Harvest, storage, and nutrient costs are the same as the base case.A 20% decrease in the price of stover increases the corn-soybean with stover removal and soybean acres compared to the base case. Stover acres harvested decrease by around 8,500 acres, with tons of stover harvested decreased by 16%. Twenty-one out of the 25 farmers are willing to harvest sto-ver at this price. The return for stover is not has high as the base case so fewer farms are willing to harvest the stover for the decreased return. Profits from the stover price decrease are down 13% from the base case. Profits are still higher than in the no stover removal case, over a 10% increase in profit from when there is no stover removal.New Harvest TechnologyIn this section we introduce a new harvest technology called the “Cornrower.” The Cornrower eliminates the need to rake the stover after harvesting the corn; the Cornrower places the stover in windrowed piles to be picked up for
8
Development of a Viable Corn Stover Market: Impacts on Corn and Soybean Markets • RE-6-W
Fueling and Feeding America Through Renewable Resources
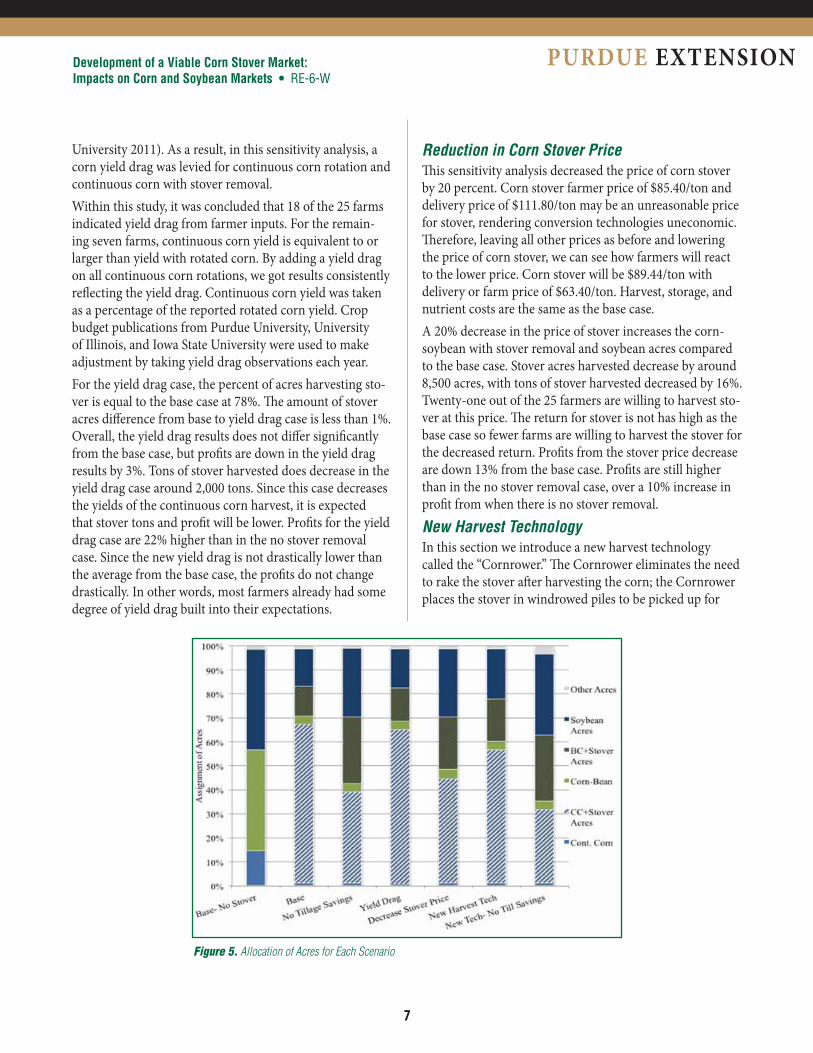
RenewableEnergyTable 4. No Stover Removal, Base, and Sensitivity Analysis Results
Subsidy - No Stover Removal
Base No Tillage Savings Yield Drag
Reduction in Stover Price
New Harvest Technology
New Harvest Tech - No Till Savings
Farms Participating — 23 23 23 21 23 23
% BC + Stover Acres — 12.17% 27.86% 13.85% 21.53% 18.23% 27.40%
% CC + Stover Acres — 66.04% 37.75% 64.21% 43.22% 53.91% 30.54%
Stover Harvest Acres — 49,722 41,713 49,623 41,170 45,863 36,832
Tons of Stover — 74,849 64,194 72,981 63,133 122,922 99,518
Harvest Rate - (Stover tons/Total acres — 1.18 1.01 1.15 0.99 1.93 1.57
Profit ($) 29,694,110 37,521,626 35,120,752 36,239,539 32,692,324 36,797,984 35,576,781
Return to Resources with Stover ($) — 7,827,516 5,426,642 6,939,662 2,998,214 7,103,874 5,882,671
% Increase in Profit due to Stover — 26.36% 18.28% 22.04% 10.10% 23.92% 19.81%
baling. While rake costs are eliminated, there are addi-tional costs for fuel and labor needed for harvest with the Cornrower. Custom harvest costs for the Cornrower were done at 2,000 acres, which is comparable to the rake and bale system at 3,500 acres (Jim Straeter, personal communi-cation, May 31, 2012). There is an assumption of 4.67 bales/acre, 0.706 tons/bale, and 3.29 tons/ acre at 15% moisture. With the new technology harvesting at 3.29 ton/acre and the base case at 1.88 ton/acre, the new harvest technology has a 58% removal rate compared to the base at 33%.Total harvest costs for the Cornrower system at 15% mois-ture are $29.62/ton for corn-soybean rotation, and with a reduction in tillage of $7.59/ton with corn-corn rotation, they are $22.03/ton. Total harvest and storage costs for continuous corn are $45.71/ton, and corn-soybean rotation are $38.12/ton.There is a higher yield of stover per acre in this case compared to the base. The change in tons of stover har-vested is 66% more than the base, about 50,000 tons more. Compared to the base case, there is a decrease in the amount of continuous corn with stover removal acres as farmers switched to corn-soybean with stover removal rotation. The savings from reduced tillage is not as high as the base, giving less incentive for continuous corn than
with corn-soybean harvest. The savings in reduced tillage is only $7.59/ton (compared to base at $13.28/ton). However, farms still chose to profit from the continuous stover re-moval with the continuous corn with stover removal acres, even though it was more expensive to harvest compared to the base case. Profits are almost equal to the base as the harvest costs are less for the corn-soybean harvest, and the corn-corn harvest costs is only a little higher at $22.03/ton (base at $18.25/ton). Profits from the new harvest technol-ogy are about the same as the base case, less than 2% lower. Compared to the no stover removal, the new technology case increases profits for the farm by around 24%. New Harvest Technology with Elimination of Tillage SavingNew harvest technology with no tillage savings assump-tions is the same as in the rake and bale system case, except the harvest cost are estimated from the Cornrower system. Custom harvest cost and storage was estimated at $45.71/ton for both rotations as the $25/acre for the continuous corn rotation will be removed.The new harvest technology with no tillage reduction decreases profits by 6% from the original rake and bale harvest technology. This scenario profit is 3% less than the new harvest technology. Out of all the sensitively analysis,
PURDUE EXTENSION
9
Development of a Viable Corn Stover Market: Impacts on Corn and Soybean Markets • RE-6-W
this case shows the least amount of all acres harvesting stover at 58%. As for the new harvest technology, this case is also harvesting a large amount of stover at 99,518 tons due to increased yield from the new technology. With the tillage savings eliminated, the incentive to harvest stover is not as high. Farmers are producing the most soybeans from any case. The profit compared to the no stover removal has increased over 19%, still making stover harvest profitable for farms even with the savings in tillage eliminated.
ConclusionsWith a viable corn stover market and stover at a farm price of $85.40/ton, the large majority of farmers found it profit-able to harvest stover in the base case. The sensitivity cases demonstrated how farmer behavior might change under different assumptions. We recognize, of course, that every farm is different, with different soil types, management, equipment, etc. Clearly, PCLP captures some but not all of these differences.The corn stover price used in the PE model includes har-vest, storage, loading, unloading, and transportation costs, but loading, unloading, and transportation costs items were excluded in the PCLP analysis. Those costs sum to $26.40/ton. Stover at farm price of $85.4/ton with loading, unload-ing, and transportation added back is $111.8/ton delivery price from the PE model. For the case that reduced the stover price by 20%, farm price was $63.04/ton. Including loading, unloading, and transportation added back, deliv-ery price is $89.44/ton.Figure 5 displays the allocation of acres for each scenario. In the graph, “BC+Stover” is acres allocated towards corn-soybean rotation with stover removal, “Corn-Bean” is acres with corn-soybean rotation without stover removal, “CC+Stover” is acres allocated to continuous corn rotation with stover removal, “Cont. Corn” is acres with continuous corn rotation without stover removal, “Soybean” is acres producing soybeans, and “Other” represents land allocated towards producing other crops than corn and soybeans (such as wheat or milo). The figure shows that most farms chose to profit from continuous corn rotation with stover removal. Only in the cases of reduced tillage savings and decrease in stover price does corn-soybean with stover removal and soybean production increase.Table 4 displays the results for the base case and the five sensitivity cases. Twenty-three of 25 representative Midwest
farms harvest stover. Twenty-three farms also would harvest stover for all given sensitivity cases except in the reduced stover price, where 21 found it profitable with the new price. The added moisture content and ash penalties decreased the amount of farms willing to participate in the harvesting of corn stover. Overall, Table 4 and Figure 5 demonstrate that by remov-ing stover there is an increase in profitability for farms. Harvesting corn stover added significant profit to farm revenues. The majority of land for all cases was allocated towards a continuous corn rotation with stover removal. With soybeans at a high price, it did pull some farmers into harvesting soybeans. The most profitable scenarios for corn stover came from the rake and bale harvesting in the base case and the yield drag scenario, as well as the new harvest technology; these cases are harvesting the most corn stover tons per acre. Return to resources from stover supply was calculated by the difference between return to resources at $0/ton and return to resources at the given corn stover price for each scenario.The PE model used in this analysis does have limitations. Since it includes only corn and soybeans, the interaction of these crops with other crops is not included. The recent historical data indicated this interaction is important, so the PE model must be viewed as if it were a short-run model. Largely, the results suggest that the represented Midwest farms given the prices for corn, soybean, corn stover, and harvest cost would allocate the majority of their land towards continuous corn and stover harvest. If these farms were to allocate their land towards continuous corn harvest, there would be a displacement of soybeans. If farmers in the core Corn Belt begin to supply a majority of corn, then the supply of soybeans would decrease there and increase elsewhere. We have seen this pattern in recent years. With current high demand of corn due to ethanol and bio-fuel policies, the data is showing a movement towards more continuous corn production. USDA data shows that there are shifts in crop production occurring geographically. Therefore, in the long-term, farmers will pick up displaced crops due to price incentives.The amount of total land allocation towards crop pro-duction fluctuates yearly. Historical data does not show agriculture land growing drastically from year to year. Namely, if there is a high demand of one crop, another crop
10
Development of a Viable Corn Stover Market: Impacts on Corn and Soybean Markets • RE-6-W
Fueling and Feeding America Through Renewable Resources
RenewableEnergydeclines, as shown in the instance of corn. As this is hap-pening, there seem to be shifts, not in increased acreage, but geographically as farmers are finding the crop that best fits their soil, climate, equipment, and consumer demands. Sections of the U.S. are becoming more predominantly corn growers in places like Indiana, Illinois, Iowa, and Minnesota, while other places are picking up displaced soybeans.If an economically viable corn stover market were to come into existence, our results suggest that the Midwest would move more towards continuous corn. Perhaps it would begin with a movement towards corn-corn-soybean rota-tion. As the Midwest moved towards more corn, soybean production would increase elsewhere.
This research was partially funded by the Indiana Corn Marketing Council.
ReferencesKarlen, D. L., G. E. Varvel, J. M. F. Johnson, J. M. Baker, S.
L. Osborne, J. M. Novak, P. R. Adler, G. W. Roth, and S. J. Birrell. (2011). “Monitoring Soil Quality to Assess the Sustainability of Harvesting Corn Stover.” Agrononmy Journal 103(1): 288–295.
Straeter, J. E (2011). Cornrower System of Stover Harvest. Written for 2011 ASABE Annual International Meeting August 7-10, 2011.
Thompson, J., (2011). Corn Stover for Bioenergy Production: Cost Estimates and Farmer Supply Response. Agriculture Economics. Purdue University, Lafayette, IN.
Tyner, W. E. and F. Taheripour, (2008). Policy Analysis for Integrated Energy and Agricultural Markets in a Partial Equilibrium Framework. Retrieved January 19 2012 from http://farmfoundation.org/news/articlefiles/378-Atlan-ta%20final.pdf
The University of Ohio State. (2011). “Managing Risks in Continuous Corn.” C.O.R.N. Newsletter, February 2011. Retrieved June 20, 2012 from http://corn.osu.edu/news-letters/2011/2011-02/managing-risks-in-continuous-corn
U.S. Department of Agriculture (2012). National Agricultural Statistics Service: Quick Stats Database, Crop Production Summaries. Retrieved March 31, 2012 from http://www.nass.usda.gov/QuickStats/index2.jsp
Shinners, K. J., A. D. Wepner, R. E. Muck, and P. J. Weimer. (2011). “Aerobic and Anaerobic Storage of Single-pass, Chopped Corn Stover.” Bioenergy Research 4:61–75.
PURDUE EXTENSION
11
Development of a Viable Corn Stover Market: Impacts on Corn and Soybean Markets • RE-6-W
Notes
12
Development of a Viable Corn Stover Market: Impacts on Corn and Soybean Markets • RE-6-W
Fueling and Feeding America Through Renewable Resources
RenewableEnergy
It is the policy of the Purdue University Cooperative Extension Service that all persons have equal opportunity and access to its educational programs, services, activities, and facilities without regard to race, religion, color, sex, age, national origin or ancestry, marital status, parental status, sexual orientation, disability or status as a veteran.
Purdue University is an Affirmative Action institution. This material may be available in alternative formats.
PURDUE AGRICULTURE 5/13
Order or download materials at the Purdue Extension Education Store • www.the-education-store.com
Visit <www.extension.purdue.edu/renewable-energy> for free, downloadable copies of all of the publications in the Purdue Extension Renewable Energy series.