nutrient removal as a function of corn stover cutting height and
TRANSCRIPT
1 23
BioEnergy Research ISSN 1939-1234Volume 3Number 4 Bioenerg. Res. (2010)3:342-352DOI 10.1007/s12155-010-9093-3
Nutrient Removal as a Function of CornStover Cutting Height and Cob Harvest

1 23
Your article is protected by copyright and all
rights are held exclusively by US Government.
This e-offprint is for personal use only
and shall not be self-archived in electronic
repositories. If you wish to self-archive your
work, please use the accepted author’s
version for posting to your own website or
your institution’s repository. You may further
deposit the accepted author’s version on
a funder’s repository at a funder’s request,
provided it is not made publicly available until
12 months after publication.
Nutrient Removal as a Function of Corn Stover CuttingHeight and Cob Harvest
Jane M. F. Johnson & Wally W. Wilhelm & Douglas L. Karlen & David W. Archer &
Brian Wienhold & David T. Lightle & David Laird & John Baker & Tyson E. Ochsner &
Jeff M. Novak & Ardell D. Halvorson & Francisco Arriaga & Nancy Barbour
Published online: 15 April 2010# US Government 2010
Abstract One-pass harvest equipment has been developed tocollect corn (Zea mays L.) grain, stover, and cobs that can beused as bioenergy feedstock. Nutrients removed in thesefeedstocks have soil fertility implication and affect feedstockquality. The study objectives were to quantify nutrientconcentrations and potential removal as a function of cuttingheight, plant organ, and physiological stage. Plant sampleswere collected in 10-cm increments at seven diverse
geographic locations at two maturities and analyzed formultiple elements. At grain harvest, nutrient concentrationaveraged 5.5 gN kg−1, 0.5 gP kg−1, and 6.2 gK kg−1 in cobs,7.5 gN kg−1, 1.2 gP kg−1, and 8.7 gK kg−1 in the above-earstover fraction, and 6.4 gN kg−1, 1.0 gP kg−1, and 10.7 gK kg−1 in the below-ear stover fraction (stover fractionsexclude cobs). The average collective cost to replace N, P,and K was $11.66 Mg−1 for cobs, $17.59 Mg−1 for above-ear
Wally W. Wilhelm deceased.
The US Department of Agriculture offers its programs to all eligiblepersons regardless of race, color, age, sex, or national origin and is anequal opportunity employer.
The use of trade, firm, or corporation names in this publication is forthe information and convenience of the reader. Such use does notconstitute an official endorsement or approval by the US Departmentof Agriculture or the Agricultural Research Service of any product orservice to the exclusion of others that may be suitable.
Electronic supplementary material The online version of this article(doi:10.1007/s12155-010-9093-3) contains supplementary material,which is available to authorized users.
J. M. F. Johnson (*) :N. BarbourNorth Central Soil Conservation Research Laboratory,USDA-Agricultural Research Service,803 Iowa Ave.,Morris, MN 56267, USAe-mail: [email protected]
N. Barboure-mail: [email protected]
W. W. Wilhelm :B. WienholdAgroecosystems Management Research Unit,USDA-Agricultural Research Service,279 Plant Science, UNL,Lincoln, NE 68583, USA
B. Wienholde-mail: [email protected]
D. L. Karlen :D. LairdNational Laboratory for Agriculture and the Environment,USDA-Agricultural Research Service,2110 University Boulevard,Ames, IA 50011, USA
D. L. Karlene-mail: [email protected]
D. Lairde-mail: [email protected]
D. W. ArcherNorthern Great Plains Research Laboratory,USDA-Agricultural Research Service,PO Box 459, Mandan, ND 58554, USAe-mail: [email protected]
Bioenerg. Res. (2010) 3:342–352DOI 10.1007/s12155-010-9093-3
Author's personal copy

stover, and $18.11 Mg−1 for below-ear stover. If 3 Mg ha−1
of above-ear stover fraction plus 1 Mg of cobs are harvested,an average N, P, and K replacement cost was estimated at$64 ha−1. Collecting cobs or above-ear stover fraction mayprovide a higher quality feedstock while removing fewernutrients compared to whole stover removal. This informa-tion will enable producers to balance soil fertility byadjusting fertilizer rates and to sustain soil quality bypredicting C removal for different harvest scenarios. It alsoprovides elemental information to the bioenergy industry.
Keywords Corn cobs . Corn stover . Plant nutrition .
Soil fertility . Biofuel feedstock
AbbreviationsBON Bonferroni minimum significant differenceGLM General linear modelICP-OES Inductively coupled plasma-optical emission
spectroscopyLSD Least significant differenceMDL Minimum detection limitSOC Soil organic carbon
Introduction
An estimated 218 million Mg of dry feedstock per year willbe needed to meet the 76 billion liters of second-generation(non-food source) renewable fuels target for 2022 in theUSA [8]. Multiple, regionally specific lignocellulosicmaterials will be used to achieve this goal, but one of themost important in Midwestern USA will be corn (Zea mays
L.) stover. Other potential feedstock materials include othercrop residues such as wheat (Triticum aestivum L.),dedicated annual and perennial energy crops (e.g., switch-grass (Panicum virgatum L.), sorghum (Sorghum bicolorL.), miscanthus (Miscanthus), or sugarcane (Saccharumofficinarum L.) bagasse)), and woody species such aspoplar (Poplar ssp.) and pine (Pinus ssp.) [8]. Additionalfeedstock biomass will be needed to meet demands forproducing biopower [6] and bioproducts [29].
Corn stover refers to the aboveground, non-grain plantparts including the cob, leaves, and stalk. Currently, stoveris collected primarily using several field operations follow-ing corn grain harvest, in which the stover is cut,windrowed, baled, and hauled to a storage site [33]. Theseoperations increase the number trips across the field, oftenduring a time of year when rainfall or snowfall can limitharvest time and create soil conditions that are susceptibleto compaction. To reduce the number of field operationsand cost of feedstock collection, one-pass harvest equip-ment that can collect corn grain as well as stover and/orcobs is being developed [34] but is not yet commerciallyavailable. Initial one-pass harvest studies have been con-ducted to assess various harvest scenarios for collectingcorn stover and cobs [18, 34]. A study in Iowa concludedthat harvesting grain and stover in one-pass with a 40-cmcutting height could save time and fuel and provide higherquality feedstock for ethanol fermentation than a multi-passbaling operation [18]. Another study suggested feedstockfractionation could reduce ethanol production costs byminimizing pretreatment and hydrolysis requirements [10].For example, husk and cobs released more glucan andproduced more ethanol compared to stalk bottoms whenusing the same pretreatment and hydrolysis treatment
D. T. LightleUSDA-NRCS National Soil Survey Center,100 Centennial Mall N., Rm 152,Lincoln, NE 68508-3866, USAe-mail: [email protected]
J. Baker : T. E. OchsnerSoil and Water Management Research Unit,USDA-Agricultural Research Service,439 Borlaug Hall, 1991 Upper Buford Circle,St. Paul, MN 55108, USA
J. Bakere-mail: [email protected]
T. E. Ochsnere-mail: [email protected]
J. M. NovakCoastal Plains Research Center,USDA-Agricultural Research Service,2611 W. Lucas St.,Florence, SC 29501, USAe-mail: [email protected]
A. D. HalvorsonUSDA-Agricultural Research Service,2150 Centre Ave., Bldg. D. Suite 100,Fort Collins, CO 80526, USAe-mail: [email protected]
F. ArriagaNational Soil Dynamics Research Laboratory,USDA-Agricultural Research Service,411 S. Donahue Dr.,Auburn, AL 36832, USAe-mail: [email protected]
Present Address:T. E. OchsnerDepartment of Plant and Soil Sciences,Oklahoma State University,Stillwater, OK 74078, USA
Bioenerg. Res. (2010) 3:342–352 343
Author's personal copy
even though the stalk contained a comparable amount ofglucan [10].
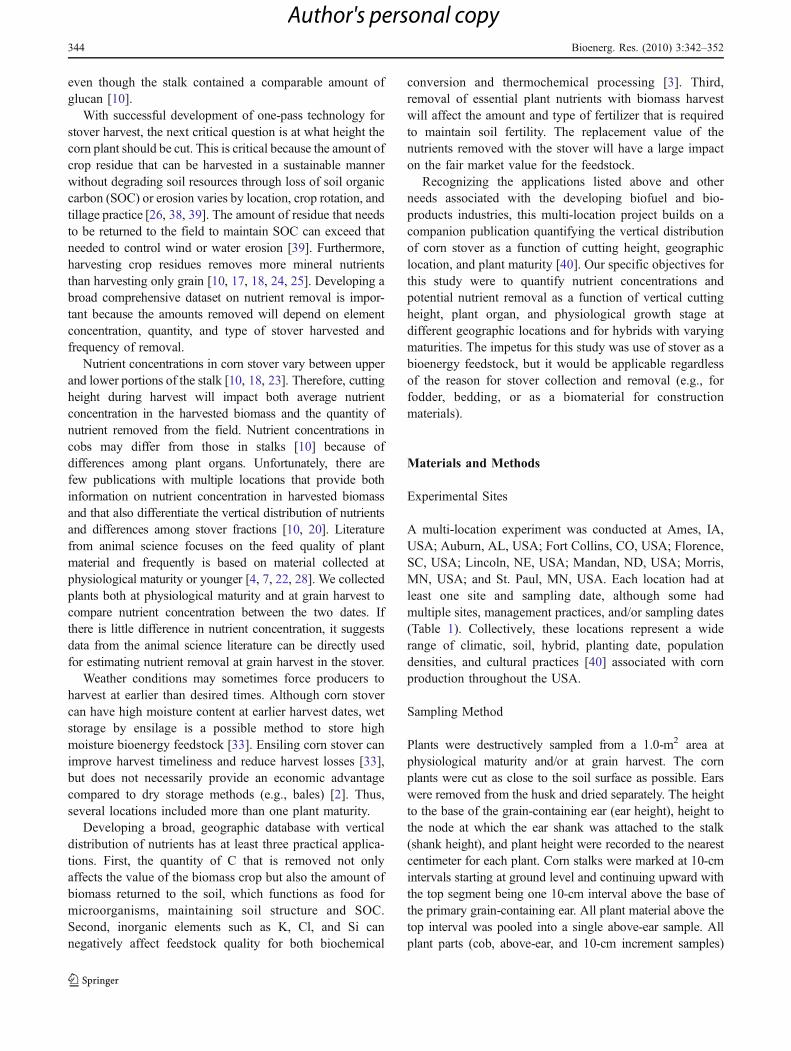
With successful development of one-pass technology forstover harvest, the next critical question is at what height thecorn plant should be cut. This is critical because the amount ofcrop residue that can be harvested in a sustainable mannerwithout degrading soil resources through loss of soil organiccarbon (SOC) or erosion varies by location, crop rotation, andtillage practice [26, 38, 39]. The amount of residue that needsto be returned to the field to maintain SOC can exceed thatneeded to control wind or water erosion [39]. Furthermore,harvesting crop residues removes more mineral nutrientsthan harvesting only grain [10, 17, 18, 24, 25]. Developing abroad comprehensive dataset on nutrient removal is impor-tant because the amounts removed will depend on elementconcentration, quantity, and type of stover harvested andfrequency of removal.
Nutrient concentrations in corn stover vary between upperand lower portions of the stalk [10, 18, 23]. Therefore, cuttingheight during harvest will impact both average nutrientconcentration in the harvested biomass and the quantity ofnutrient removed from the field. Nutrient concentrations incobs may differ from those in stalks [10] because ofdifferences among plant organs. Unfortunately, there arefew publications with multiple locations that provide bothinformation on nutrient concentration in harvested biomassand that also differentiate the vertical distribution of nutrientsand differences among stover fractions [10, 20]. Literaturefrom animal science focuses on the feed quality of plantmaterial and frequently is based on material collected atphysiological maturity or younger [4, 7, 22, 28]. We collectedplants both at physiological maturity and at grain harvest tocompare nutrient concentration between the two dates. Ifthere is little difference in nutrient concentration, it suggestsdata from the animal science literature can be directly usedfor estimating nutrient removal at grain harvest in the stover.
Weather conditions may sometimes force producers toharvest at earlier than desired times. Although corn stovercan have high moisture content at earlier harvest dates, wetstorage by ensilage is a possible method to store highmoisture bioenergy feedstock [33]. Ensiling corn stover canimprove harvest timeliness and reduce harvest losses [33],but does not necessarily provide an economic advantagecompared to dry storage methods (e.g., bales) [2]. Thus,several locations included more than one plant maturity.
Developing a broad, geographic database with verticaldistribution of nutrients has at least three practical applica-tions. First, the quantity of C that is removed not onlyaffects the value of the biomass crop but also the amount ofbiomass returned to the soil, which functions as food formicroorganisms, maintaining soil structure and SOC.Second, inorganic elements such as K, Cl, and Si cannegatively affect feedstock quality for both biochemical
conversion and thermochemical processing [3]. Third,removal of essential plant nutrients with biomass harvestwill affect the amount and type of fertilizer that is requiredto maintain soil fertility. The replacement value of thenutrients removed with the stover will have a large impacton the fair market value for the feedstock.
Recognizing the applications listed above and otherneeds associated with the developing biofuel and bio-products industries, this multi-location project builds on acompanion publication quantifying the vertical distributionof corn stover as a function of cutting height, geographiclocation, and plant maturity [40]. Our specific objectives forthis study were to quantify nutrient concentrations andpotential nutrient removal as a function of vertical cuttingheight, plant organ, and physiological growth stage atdifferent geographic locations and for hybrids with varyingmaturities. The impetus for this study was use of stover as abioenergy feedstock, but it would be applicable regardlessof the reason for stover collection and removal (e.g., forfodder, bedding, or as a biomaterial for constructionmaterials).
Materials and Methods
Experimental Sites
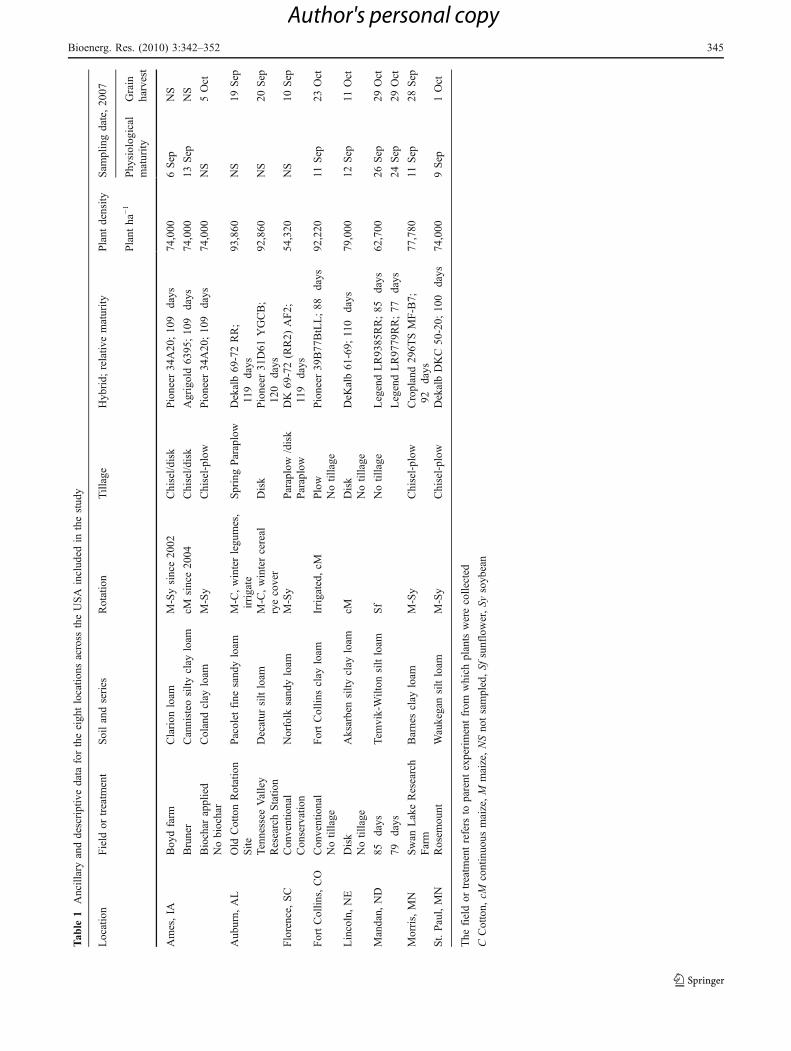
A multi-location experiment was conducted at Ames, IA,USA; Auburn, AL, USA; Fort Collins, CO, USA; Florence,SC, USA; Lincoln, NE, USA; Mandan, ND, USA; Morris,MN, USA; and St. Paul, MN, USA. Each location had atleast one site and sampling date, although some hadmultiple sites, management practices, and/or sampling dates(Table 1). Collectively, these locations represent a widerange of climatic, soil, hybrid, planting date, populationdensities, and cultural practices [40] associated with cornproduction throughout the USA.
Sampling Method
Plants were destructively sampled from a 1.0-m2 area atphysiological maturity and/or at grain harvest. The cornplants were cut as close to the soil surface as possible. Earswere removed from the husk and dried separately. The heightto the base of the grain-containing ear (ear height), height tothe node at which the ear shank was attached to the stalk(shank height), and plant height were recorded to the nearestcentimeter for each plant. Corn stalks were marked at 10-cmintervals starting at ground level and continuing upward withthe top segment being one 10-cm interval above the base ofthe primary grain-containing ear. All plant material above thetop interval was pooled into a single above-ear sample. Allplant parts (cob, above-ear, and 10-cm increment samples)
344 Bioenerg. Res. (2010) 3:342–352
Author's personal copy
Tab
le1
Ancillaryanddescriptivedata
fortheeigh
tlocatio
nsacross
theUSA
includ
edin
thestud
y
Location
Field
ortreatm
ent
Soilandseries
Rotation
Tillage
Hyb
rid;
relativ
ematurity
Plant
density
Sam
plingdate,20
07
Plant
ha−1
Phy
siolog
ical
maturity
Grain
harvest
Ames,IA
Boy
dfarm
Clarion
loam
M-Sysince20
02Chisel/d
isk
Pioneer
34A20
;10
9days
74,000
6Sep
NS
Bruner
Cannisteo
silty
clay
loam
cMsince20
04Chisel/d
isk
Agrigold63
95;10
9days
74,000
13Sep
NS
Biochar
applied
Colandclay
loam
M-Sy
Chisel-plow
Pioneer
34A20
;10
9days
74,000
NS
5Oct
Nobiochar
Aub
urn,
AL
Old
CottonRotation
Site
Pacolet
fine
sand
yloam
M-C,winterlegu
mes,
irrigate
SpringParaplow
Dekalb69
-72RR;
119
days
93,860
NS
19Sep
Tennessee
Valley
ResearchStatio
nDecatur
siltloam
M-C,wintercereal
ryecover
Disk
Pioneer
31D61
YGCB;
120
days
92,860
NS
20Sep
Florence,
SC
Con
ventional
Norfolk
sand
yloam
M-Sy
Paraplow
/disk
DK
69-72(RR2)
AF2;
119
days
54,320
NS
10Sep
Con
servation
Paraplow
FortCollin
s,CO
Con
ventional
FortCollin
sclay
loam
Irrigated,
cMPlow
Pioneer
39B77
BtLL;88
days
92,220
11Sep
23Oct
Notillage
Notillage
Lincoln,NE
Disk
Aksarbensilty
clay
loam
cMDisk
DeK
alb61
-69;
110
days
79,000
12Sep
11Oct
Notillage
Notillage
Mandan,
ND
85days
Tem
vik-Wilton
siltloam
Sf
Notillage
LegendLR93
85RR;85
days
62,700
26Sep
29Oct
79days
LegendLR97
79RR;77
days
24Sep
29Oct
Morris,MN
Swan
LakeResearch
Farm
Barnesclay
loam
M-Sy
Chisel-plow
Cropland29
6TSMF-B7;
92days
77,780
11Sep
28Sep
St.Paul,MN
Rosem
ount
Waukegansiltloam
M-Sy
Chisel-plow
DekalbDKC
50-20;
100
days
74,000
9Sep
1Oct
The
fieldor
treatm
entrefers
toparent
experimentfrom
which
plantswerecollected
CCotton,
cMcontinuo
usmaize,M
maize,NSno
tsampled,Sf
sunflower,Sy
soyb
ean
Bioenerg. Res. (2010) 3:342–352 345
Author's personal copy

were oven-dried at 60°C to a constant weight. Grain wasremoved from cob prior to determining dry cob weight.
Our rationale for this sampling approach was to mimic aone-pass harvest system that could collect grain and cobs, orgrain and stover. A high-cut (18) one-pass treatment would atleast collect everything at and above the ear, while a low cuttreatment would collect everything above a stubble height of10 cm. The 10-cm sampling increments were to helpinterpolate between the low- and high-cut treatments.
Segment samples from multiple plants (within a replicationat each site) were pooled to provide sufficient plant material forchemical analysis. Typically, segments were combined fromfive to ten plants, depending on plant population (Table 1). Cand N analyses for all locations were conducted at the ARS-Agroecosystems Research Unit in Lincoln, NE, USA. All theCl, microwave digestion, and inductively coupled plasma-optical emission spectroscopy (ICP-OES) analyses were doneat the ARS-North Central Soil Conservation ResearchLaboratory in Morris, MN, USA. Total C and total N in theplant tissue were determined by combustion (900°C) with aCarlo Erba combustion analyzer (Thermo Scientific, Wal-tham, MA, USA). Chloride was extracted by shaking in0.01 M CaSO4, and the Cl concentration was determined byflow injection analysis using the mercury (II) thiocyanatecolorimetric method measured on a Technicon AutoAnalyzerII (ALPKEM, Clackamas, OR, USA) at 480 nm with aminimum detection limit (MDL) of 1 µg mL−1 [13, 35]. Allother nutrients were determined by ICP-OES on a VarianVista-Pro CCD simultaneous ICP-OES (Varian Incorp., PaloAlto, CA, USA) following a concentrated HNO3 acidmicrowave digestion procedure using a Mars Xpress Micro-wave Digester (CEM Corp., Mathews, NC, USA) based onUSEPA 3051 and USEPA 3051A methods and manufac-
turer's recommendations [37]. Elements of interest as plantnutrient or as fouling agents had the following MDL inµg mL−1: 0.4, Al; 0.0.007, B; 0.006, Ca; 0.006, Cu; 0.012,Fe; 0.129, K; 0.003, Mg; 0.001, Mn; 0.13, P; 0.175, S; 0.028,Si; and 0.06, Zn, based on HNO3 acid background matrixfollowing the manufacturer's recommendation for this ICO-OES instrument.
Statistical Analysis
This study was designed to primarily provide information onthe vertical distribution of nutrient concentrations from plantsharvested at physiological maturity and/or just prior tocombine harvest at several locations throughout the USA.The study was not designed to delineate causal relationshipsor to examine differences associated with location, soilresource, management practices, and/or hybrid selection.The multi-location intent was to include a range of hybrids,relative maturities, and climatic conditions, thus providing ageneral survey of how nutrient concentration varied verticallywithin corn plants at or approximately 3 weeks afterphysiological maturity.
A general linear model using SAS software, version 9.1(SAS Institute, Gary, NC, USA) [32] was used to determine ifthere were statistically significant differences in nutrientconcentration. Stover fraction or segments were treated asrandom variables, and variability due to location andlocation-specific factors (e.g., management practice andhybrid) was included in the error term. Mean comparisonsof nutrient concentration among three stover fractions (i.e.,above-ear without cob, below-ear, and cob) were made usinga protected least significant difference (LSD; p≤0.05) [32].The number of cob observations was used to calculate
Table 2 Average concentration of several plant elements (g kg−1) based on all fields and treatments within and across locations for above ear(without cob), below ear, and cob
Physiological maturity Grain harvest
Above ear (gkg−1) Below ear (gkg−1) Cob (gkg−1) LSDa (gkg−1) Above ear (gkg−1) Below ear (gkg−1) Cob (gkg−1) LSD (gkg−1)N 18 18 12 26 26 20
C 428 435 450 7.26 433 428 450 7.23
N 7.44 5.48 4.35 1.36 7.45 6.41 5.46 0.79
P 0.80 0.62 0.40 0.42 1.24 1.01 0.50 0.44
K 10.84 12.17 5.35 4.77 8.66 10.71 6.25 2.44
S 0.61 0.41 0.15 0.20 0.62 0.51 0.28 0.11
Ca 4.17 2.99 ND 0.59 2.96 3.51 ND 0.49
Cl 3.03 4.17 1.73 1.68 1.99 2.57 2.19 1.10
Si 1.17 0.93 0.19 0.25 0.98 0.86 0.19 0.30
Some locations were only sampled at one maturity date (Table 1); also, some locations did not save cobs for analysis
LSD least significant difference, ND not detecteda LSD (p≤0.05) to compare among segments within a maturity, calculated using the number of cob observations
346 Bioenerg. Res. (2010) 3:342–352
Author's personal copy
protected LSDs, which are a conservative approach as therewere fewer cob observations than stover observations.Differences among nutrient concentrations in the 10-cmsegments below the ear were compared using Bonferroniminimum significant difference (p≤0.05), as there weremore than six means [32].
A subset of five locations that was sampled from the samefields and treatments at both physiological and grain harvestwas used to determine if nutrient concentration changedbetween the two sample dates. Cob data was not availablefrom two of the locations. General linear model analysis wasrun separately for the three stover fractions. Sample time wastreated as a random variable, and variability due to locationand location-specific factors (e.g., management and hybrid)was included in the error term. Significant differences arereported at p≤0.05.
Additional descriptive statistics (arithmetic means, stan-dard errors, and number of observations) were calculatedwithin locations for all elements for the three corn stoverfractions at both sample dates (Supplemental Tables 1–4).
At Fort Collins, multiple plants were harvested, but therewas only one replication for each maturity, so a standarderror for the Fort Collins location was not calculated. AtMandan, there were two replications for each maturity, butplant materials from each replication were insufficient foranalysis, so materials from the two replications werepooled. At other sites, there were at least two samplingareas or replications. Standard errors were reported as anindicator of variability.
Results
Stover Fraction Nutrient Concentrations
Stover nutrient concentrations above and below the ear andwithin the cobs were determined at all locations for at leastone and sometimes two sampling dates. At physiologicalmaturity (Table 2), cobs had lower N, K, S, Ca, Cl, and Siconcentrations but higher C content than the stover
Table 3 Comparison of element concentration in the above-ear corn stover fraction at two sampling dates, using data only from locations thatsampled at both physiological maturity and grain harvest, n=12
C (gkg−1) N (gkg−1) P (gkg−1) K (gkg−1) S (gkg−1) Ca (gkg−1) Cl (gkg−1) Si (gkg−1)
Physiological maturity 425 8.16 0.75 12.2 0.72 4.33 2.59 1.16
Grain harvest 432 6.77 0.71 8.4 0.53 2.91 1.86 1.13
Significance –** –* NS NS –* –*** NS NS
NS not significant at p≤0.05*Significant at 0.05 probability level
**Significant at 0.01 probability level
***Significant at 0.001 probability level
Cl g kg-12 4 6 8
2 4 6 8
Pla
nt
hei
gh
t(c
m)
K g kg-15 10 15 20
5 10 15 20
C g kg-1420 440 460
420 440 460
Pla
nt
hei
gh
t (c
m)
0
20
40
60
80
100
120
N g kg-14 8 12
4 8 12
P g kg-10.4 0.8 1.2
0.4 0.8 1.2
BON
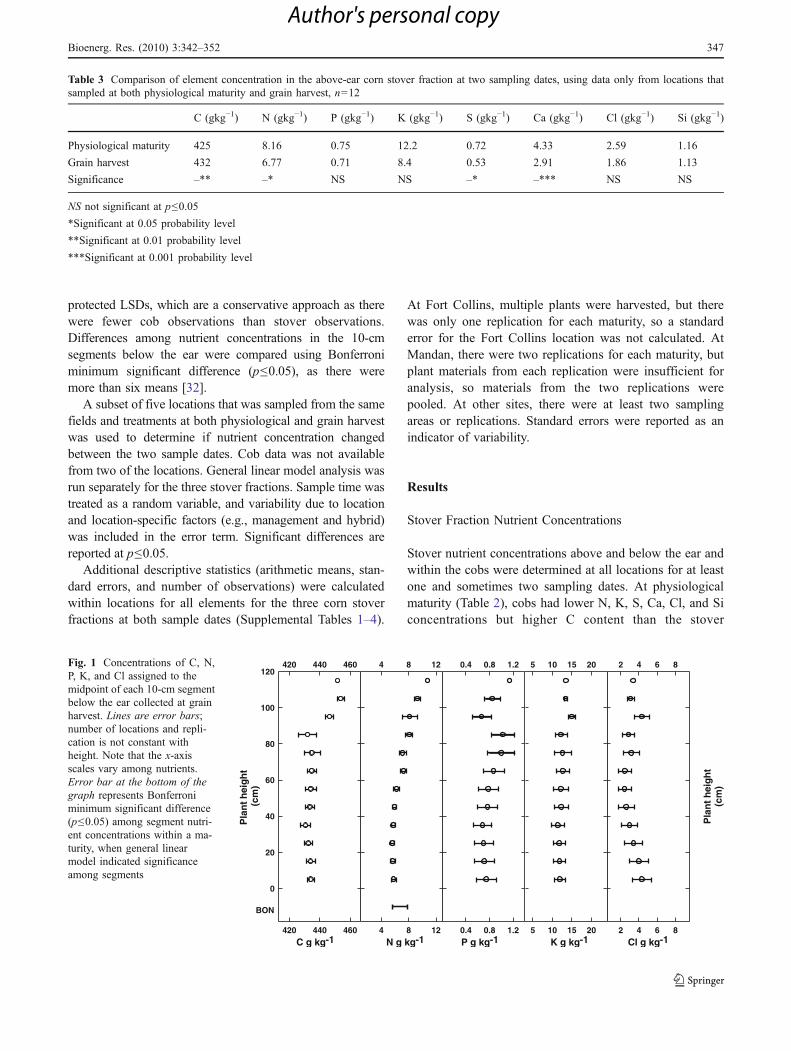
Fig. 1 Concentrations of C, N,P, K, and Cl assigned to themidpoint of each 10-cm segmentbelow the ear collected at grainharvest. Lines are error bars;number of locations and repli-cation is not constant withheight. Note that the x-axisscales vary among nutrients.Error bar at the bottom of thegraph represents Bonferroniminimum significant difference(p≤0.05) among segment nutri-ent concentrations within a ma-turity, when general linearmodel indicated significanceamong segments
Bioenerg. Res. (2010) 3:342–352 347
Author's personal copy
fractions. At grain harvest, the P concentration was alsosignificantly lower in cobs compared to either stoverfraction. At both sampling dates, the concentration of Cain cobs was below the MDL. The concentration of N, S,and Ca in the above-ear stover fraction exceeded that belowthe ear at physiological maturity. At grain harvest, theabove-ear stover fraction had 16% higher N and 21%higher S concentrations than the below-ear stover fraction.
The concentration of C, N, P, K, S, Ca, Cl, and Si incobs or in the below-ear stover fraction did not change
significantly between the two sample dates (data notshown). The concentration did decrease 17% for N, 26%for S, and 32% for Ca between physiological maturity andgrain harvest in the above-ear stover fraction (Table 3). Theconcentration of N, S, and Ca were greater in the above-earstover compared to the below-ear fraction, while Pconcentration did differ significantly between the twofractions (Table 2), such that losing above-ear stover wouldresult in harvesting a greater portion of material with lowerconcentrations of N, S, and Ca.
Zn mg kg-1
0 30 60 90
0 30 60 90
Al mg kg-10 150 300 450
0 150 300 450
Pla
nt
hei
gh
t (c
m)
0
20
40
60
80
100
120
Mn mg kg-10 30 60 90
0 30 60 90
B mg kg-10 3 6 9
0 3 6 9
Cu mg kg-10 3 6 9
0 3 6 9
Pla
nt
hei
gh
t(c
m)
0
20
40
60
80
100
120
BON
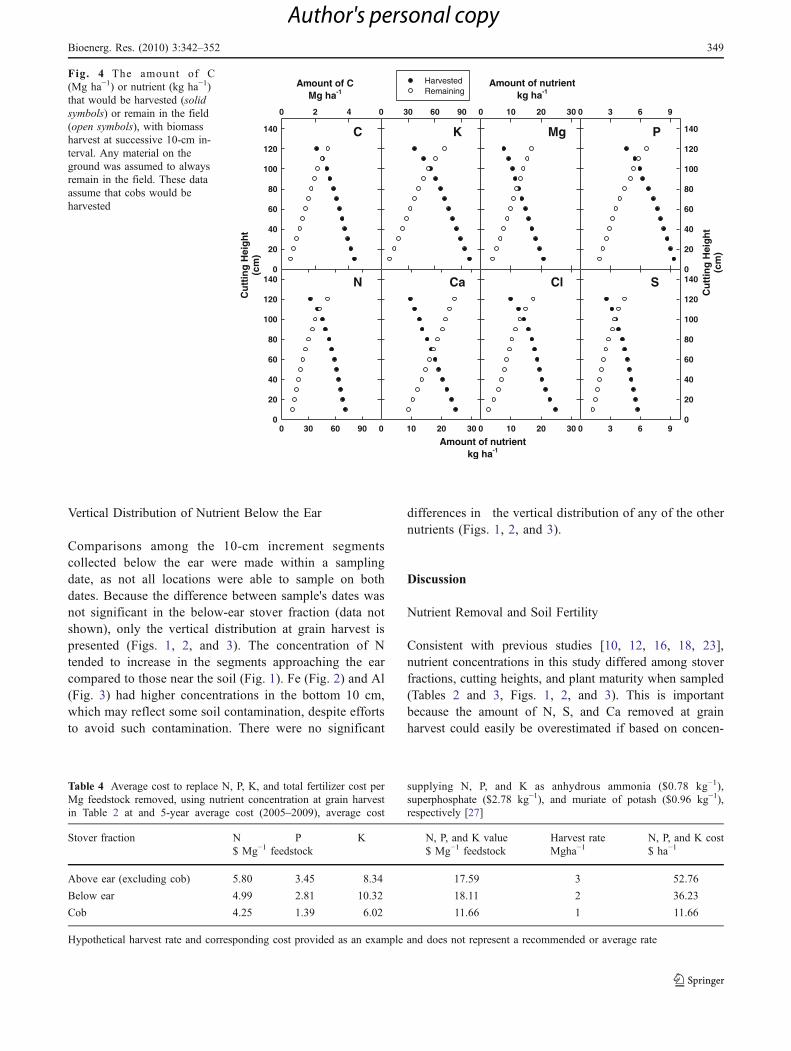
Fig. 3 Concentration of Al, Mn, Zn, B, and Cu assigned to themidpoint of each 10-cm segment below the ear collected at grainharvest. Lines are error bars; number of locations and replication isnot constant with height. Note that the x-axis scales vary among
nutrients. Error bar at the bottom of graph represents Bonferroniminimum significant difference (p≤0.05) among segment nutrientconcentrations when general linear model indicated significanceamong segments
Ca g kg-10 2 4 6
0 2 4 6
Pla
nt
hei
gh
t (
cm)
0
20
40
60
80
100
120
Mg g kg-10 2 4 6
0 2 4 6
S g kg-10.4 0.8 1.2
0.4 0.8 1.2
Si g kg-10.0 0.4 0.8 1.2
0.0 0.4 0.8 1.2
Pla
nt
hei
gh
t(c
m)
0
20
40
60
80
100
120
Fe g kg-10.0 0.2 0.4
0.0 0.2 0.4
BON
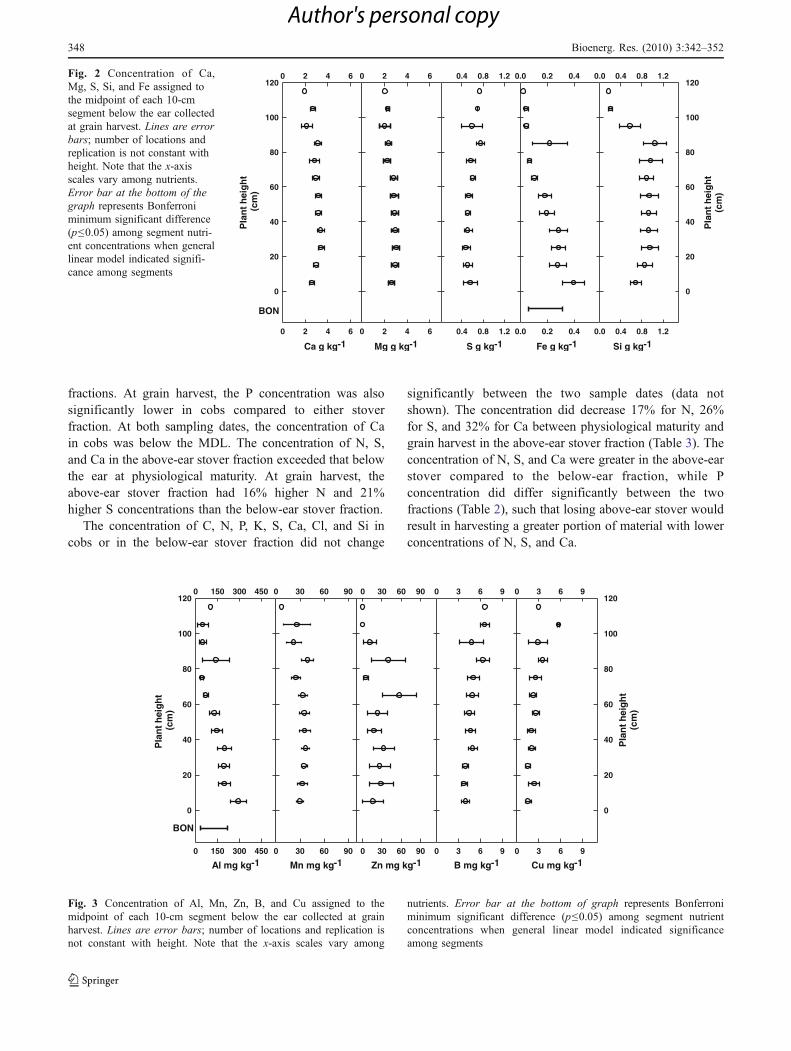
Fig. 2 Concentration of Ca,Mg, S, Si, and Fe assigned tothe midpoint of each 10-cmsegment below the ear collectedat grain harvest. Lines are errorbars; number of locations andreplication is not constant withheight. Note that the x-axisscales vary among nutrients.Error bar at the bottom of thegraph represents Bonferroniminimum significant difference(p≤0.05) among segment nutri-ent concentrations when generallinear model indicated signifi-cance among segments
348 Bioenerg. Res. (2010) 3:342–352
Author's personal copy
Vertical Distribution of Nutrient Below the Ear
Comparisons among the 10-cm increment segmentscollected below the ear were made within a samplingdate, as not all locations were able to sample on bothdates. Because the difference between sample's dates wasnot significant in the below-ear stover fraction (data notshown), only the vertical distribution at grain harvest ispresented (Figs. 1, 2, and 3). The concentration of Ntended to increase in the segments approaching the earcompared to those near the soil (Fig. 1). Fe (Fig. 2) and Al(Fig. 3) had higher concentrations in the bottom 10 cm,which may reflect some soil contamination, despite effortsto avoid such contamination. There were no significant
differences in the vertical distribution of any of the othernutrients (Figs. 1, 2, and 3).
Discussion
Nutrient Removal and Soil Fertility
Consistent with previous studies [10, 12, 16, 18, 23],nutrient concentrations in this study differed among stoverfractions, cutting heights, and plant maturity when sampled(Tables 2 and 3, Figs. 1, 2, and 3). This is importantbecause the amount of N, S, and Ca removed at grainharvest could easily be overestimated if based on concen-
C
0 2 4
0
20
40
60
80
100
120
140
HarvestedRemaining
N
0 30 60 90
Cu
ttin
g H
eig
ht
(cm
)
0
20
40
60
80
100
120
140
K
0 30 60 90
Ca
0 10 20 30
Mg
0 10 20 30
Cl
0 10 20 30
P
0 3 6 9
0
20
40
60
80
100
120
140
S
Amount of nutrientkg ha-1
0 3 6 90
20
40
60
80
100
120
140
Amount of nutrientkg ha-1
Amount of CMg ha-1
Cu
ttin
g H
eig
ht
(cm
)
Fig. 4 The amount of C(Mg ha−1) or nutrient (kg ha−1)that would be harvested (solidsymbols) or remain in the field(open symbols), with biomassharvest at successive 10-cm in-terval. Any material on theground was assumed to alwaysremain in the field. These dataassume that cobs would beharvested
Table 4 Average cost to replace N, P, K, and total fertilizer cost perMg feedstock removed, using nutrient concentration at grain harvestin Table 2 at and 5-year average cost (2005–2009), average cost
supplying N, P, and K as anhydrous ammonia ($0.78 kg−1),superphosphate ($2.78 kg−1), and muriate of potash ($0.96 kg−1),respectively [27]
Stover fraction N P K N, P, and K value Harvest rate N, P, and K cost$ Mg−1 feedstock $ Mg−1 feedstock Mgha−1 $ ha−1
Above ear (excluding cob) 5.80 3.45 8.34 17.59 3 52.76
Below ear 4.99 2.81 10.32 18.11 2 36.23
Cob 4.25 1.39 6.02 11.66 1 11.66
Hypothetical harvest rate and corresponding cost provided as an example and does not represent a recommended or average rate
Bioenerg. Res. (2010) 3:342–352 349
Author's personal copy
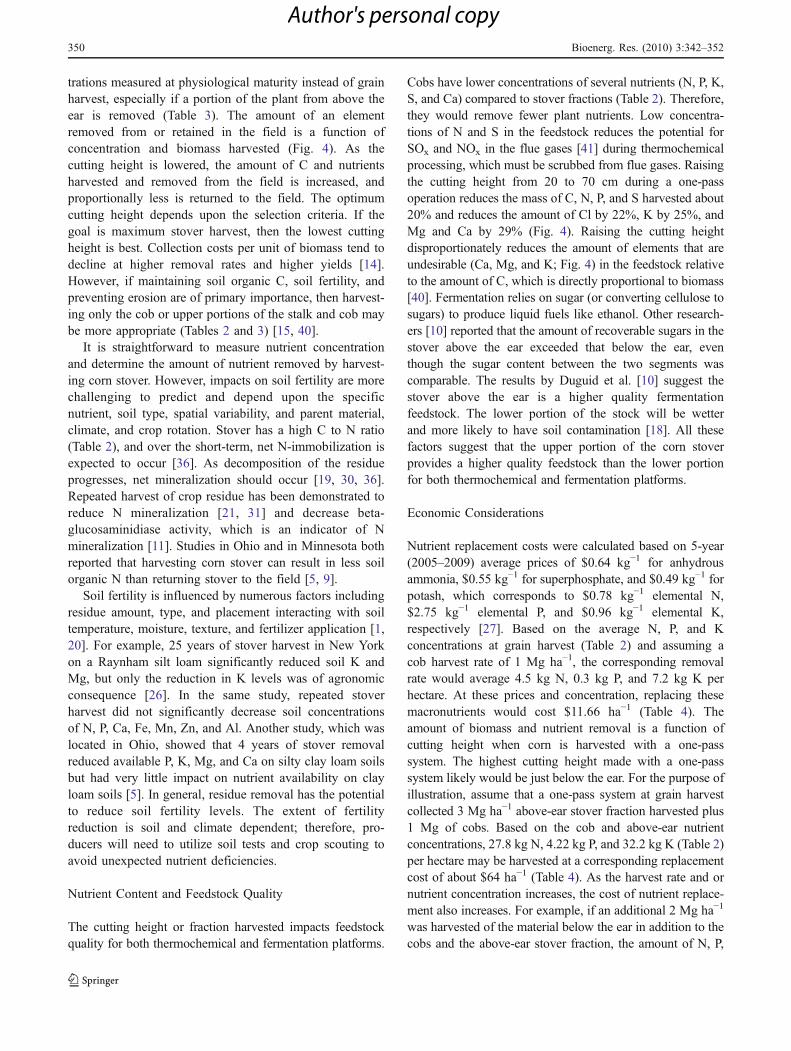
trations measured at physiological maturity instead of grainharvest, especially if a portion of the plant from above theear is removed (Table 3). The amount of an elementremoved from or retained in the field is a function ofconcentration and biomass harvested (Fig. 4). As thecutting height is lowered, the amount of C and nutrientsharvested and removed from the field is increased, andproportionally less is returned to the field. The optimumcutting height depends upon the selection criteria. If thegoal is maximum stover harvest, then the lowest cuttingheight is best. Collection costs per unit of biomass tend todecline at higher removal rates and higher yields [14].However, if maintaining soil organic C, soil fertility, andpreventing erosion are of primary importance, then harvest-ing only the cob or upper portions of the stalk and cob maybe more appropriate (Tables 2 and 3) [15, 40].
It is straightforward to measure nutrient concentrationand determine the amount of nutrient removed by harvest-ing corn stover. However, impacts on soil fertility are morechallenging to predict and depend upon the specificnutrient, soil type, spatial variability, and parent material,climate, and crop rotation. Stover has a high C to N ratio(Table 2), and over the short-term, net N-immobilization isexpected to occur [36]. As decomposition of the residueprogresses, net mineralization should occur [19, 30, 36].Repeated harvest of crop residue has been demonstrated toreduce N mineralization [21, 31] and decrease beta-glucosaminidiase activity, which is an indicator of Nmineralization [11]. Studies in Ohio and in Minnesota bothreported that harvesting corn stover can result in less soilorganic N than returning stover to the field [5, 9].
Soil fertility is influenced by numerous factors includingresidue amount, type, and placement interacting with soiltemperature, moisture, texture, and fertilizer application [1,20]. For example, 25 years of stover harvest in New Yorkon a Raynham silt loam significantly reduced soil K andMg, but only the reduction in K levels was of agronomicconsequence [26]. In the same study, repeated stoverharvest did not significantly decrease soil concentrationsof N, P, Ca, Fe, Mn, Zn, and Al. Another study, which waslocated in Ohio, showed that 4 years of stover removalreduced available P, K, Mg, and Ca on silty clay loam soilsbut had very little impact on nutrient availability on clayloam soils [5]. In general, residue removal has the potentialto reduce soil fertility levels. The extent of fertilityreduction is soil and climate dependent; therefore, pro-ducers will need to utilize soil tests and crop scouting toavoid unexpected nutrient deficiencies.
Nutrient Content and Feedstock Quality
The cutting height or fraction harvested impacts feedstockquality for both thermochemical and fermentation platforms.
Cobs have lower concentrations of several nutrients (N, P, K,S, and Ca) compared to stover fractions (Table 2). Therefore,they would remove fewer plant nutrients. Low concentra-tions of N and S in the feedstock reduces the potential forSOx and NOx in the flue gases [41] during thermochemicalprocessing, which must be scrubbed from flue gases. Raisingthe cutting height from 20 to 70 cm during a one-passoperation reduces the mass of C, N, P, and S harvested about20% and reduces the amount of Cl by 22%, K by 25%, andMg and Ca by 29% (Fig. 4). Raising the cutting heightdisproportionately reduces the amount of elements that areundesirable (Ca, Mg, and K; Fig. 4) in the feedstock relativeto the amount of C, which is directly proportional to biomass[40]. Fermentation relies on sugar (or converting cellulose tosugars) to produce liquid fuels like ethanol. Other research-ers [10] reported that the amount of recoverable sugars in thestover above the ear exceeded that below the ear, eventhough the sugar content between the two segments wascomparable. The results by Duguid et al. [10] suggest thestover above the ear is a higher quality fermentationfeedstock. The lower portion of the stock will be wetterand more likely to have soil contamination [18]. All thesefactors suggest that the upper portion of the corn stoverprovides a higher quality feedstock than the lower portionfor both thermochemical and fermentation platforms.
Economic Considerations
Nutrient replacement costs were calculated based on 5-year(2005–2009) average prices of $0.64 kg−1 for anhydrousammonia, $0.55 kg−1 for superphosphate, and $0.49 kg−1 forpotash, which corresponds to $0.78 kg−1 elemental N,$2.75 kg−1 elemental P, and $0.96 kg−1 elemental K,respectively [27]. Based on the average N, P, and Kconcentrations at grain harvest (Table 2) and assuming acob harvest rate of 1 Mg ha−1, the corresponding removalrate would average 4.5 kg N, 0.3 kg P, and 7.2 kg K perhectare. At these prices and concentration, replacing thesemacronutrients would cost $11.66 ha−1 (Table 4). Theamount of biomass and nutrient removal is a function ofcutting height when corn is harvested with a one-passsystem. The highest cutting height made with a one-passsystem likely would be just below the ear. For the purpose ofillustration, assume that a one-pass system at grain harvestcollected 3 Mg ha−1 above-ear stover fraction harvested plus1 Mg of cobs. Based on the cob and above-ear nutrientconcentrations, 27.8 kg N, 4.22 kg P, and 32.2 kg K (Table 2)per hectare may be harvested at a corresponding replacementcost of about $64 ha−1 (Table 4). As the harvest rate and ornutrient concentration increases, the cost of nutrient replace-ment also increases. For example, if an additional 2 Mg ha−1
was harvested of the material below the ear in addition to thecobs and the above-ear stover fraction, the amount of N, P,
350 Bioenerg. Res. (2010) 3:342–352
Author's personal copy
and K removed could exceed $100 ha−1 (Table 4). Calcu-lation of the minimum payment necessary for biomassharvest to be profitable would need to include nutrientreplacement costs: harvest, transportation, and storage costs,as well as any impacts on future crop productivity.
We presented detailed information on the vertical distribu-tion of C and mineral elements in corncobs and stover. Thisinformation allows for an estimation of the amount of nutrientsremoved during stover or cob harvest. It also providesinformation on the concentration of elements that negativelyimpact feedstock quality. Harvesting only cobs or cutting justbelow the ear improves the feedstock quality and reduces theimpact of nutrient removal. Because of the relationshipbetween residue removal and its nutrient content, producersharvesting cobs and or stover are advised to utilize soil testsand monitor crops for signs of nutrient deficiency and modifytheir fertilizer management accordingly. Short- and long-termfertility risks, together with the risks of erosion and loss ofSOC, must be considered in making the decisions concerningresidue harvest including if, what, and how often to harvest.
Acknowledgements The authors dedicate this publication to Dr.Wally Wilhelm. We thank B. Burmeister for proofreading, but we takefull responsibility for any errors. We also thank the reviewers and Dr.Michael Casler for insightful and constructive suggestions forimprovements. We acknowledge the efforts of technical and studenthelpers for sampling and processing plant tissue samples. This workcontributes to the USDA-Agricultural Research Service, cross-location–Renewable Energy Assessment Project (REAP). Publicationcosts were covered by funding from the North Central Regional SunGrant Center at South Dakota State University through a grantprovided by the US Department of Energy Office of BiomassPrograms under award number DE-FC36-05GO85041.
References
1. Andraski TW, Bundy LG (2008) Corn residue and nitrogen sourceeffects on nitrogen availability in no-till corn. Agron J 100:1274–1279
2. Aristos A, Schechinger T, Birrell SJ, Euken J (2007) Collection,commercial processing, and utilization of corn stover. Final technicalreport. DOE scientific and technical information. Available via http://www.osti.gov/bridge/product.biblio.jsp?osti_id=917000. doi:10.2172/917000. Cited 29 Jan 2010
3. Arvelakis S, Koukios EG (2002) Physicochemical upgrading ofagroresidues as feedstocks for energy production via thermo-chemical conversion methods. Biomass Bioe 22:331–348
4. Bernard JK, West JW, Trammell DS, Cross GH (2004) Influenceof corn variety and cutting height on nutritive value of silage fedto lactating dairy cows. J Dairy Sci 87:2172–2176
5. Blanco-Canqui H, Lal R (2009) Corn stover removal for expandeduses reduces soil fertility and structural stability. Soil Sci Soc AmJ 73:418–426
6. Campbell JE, Lobell DB, Field CB (2009) Greater transportationenergy and GHG offsets from bioelectricity than ethanol. Science324:1055–1057
7. Cummins DG (1970) Quality and yield of corn plants andcomponent parts when harvested for silage at different maturitystages. Agron J 62:781–784
8. Biomass Research and Development Board (2008) Increasingfeedstock production for biofuels: economic drivers, environmen-tal implications, and the role of research. Biomass Research andDevelopment Board. Available via http://www.brdisolutions.com/Site%20Docs/Increasing%20Feedstock_revised.pdf. Cited 8 Dec2008
9. Dolan MS, Clapp CE, Allmaras RR, Baker JM, Molina JAE (2006)Soil organic carbon and nitrogen in a Minnesota soil as related totillage, residue and nitrogenmanagement. Soil Tillage Res 89:221–231
10. Duguid KB, Montross MD, Radtke CW, Crofcheck CL, WendtLM, Shearer SA (2009) Effect of anatomical fractionation on theenzymatic hydrolysis of acid and alkaline pretreated corn stover.Bioresour Technol 100:5189–5195
11. Ekenler M, Tabatabai MA (2002) Beta-glucosaminidase activityof soils: effect of cropping systems and its relationship to nitrogenmineralization. Biol Fertil Soils 36:367–376
12. Fageria NK (2004) Dry matter yield and shoot nutrient concen-trations of upland rice, common bean, corn, and soybean grown inrotation on an Oxisol. Commun Soil Sci Plant Anal 35:961–974
13. Gavlak RG, Horneck DA, Miller RO (1994) Soil and plant tissuereference methods for the Western region. Western regionalpublication. WREP 125. University of Alaska, Fairbanks
14. Graham RL, Nelson R, Sheehan J, Perlack RD, Wright LL (2007)Current and potential U.S. corn stover supplies. Agron J 99:1–11
15. Halvorson AD, Johnson JMF (2009) Corn cob characteristics inirrigated central Great Plains studies. Agron J 101:390–399
16. Hanway JJ (1962) Corn growth and composition in relation to soilfertility: I. Growth of different plant parts and relation betweenleaf weight and grain yield. Agron J 54:145–148
17. Heggenstaller AH, Anex RP, Liebman M, Sundberg DN, GibsonLR (2008) Productivity and nutrient dynamics in bioenergydouble-cropping systems. Agron J 100:1740–1748
18. Hoskinson RL, Karlen DL, Birrell SJ, Radtke CW, Wilhelm WW(2007) Engineering, nutrient removal, and feedstock conversionevaluations of four corn stover harvest scenarios. Biomass Bioe31:126–136
19. Johnson JMF, Barbour NW, Weyers SL (2007) Chemicalcomposition of crop biomass impacts its decomposition. Soil SciSoc Am J 71:155–162
20. Johnson JMF, Papiernik SK, Mikha MM, Spokas K, Tomer MD,Weyers SL (2009) Soil processes and residue harvest management.In: Lal R, Steward B (eds) Carbon management, fuels, and soilquality. Taylor and Francis, LLC, New York, pp 1–44
21. Kapkiyai JJ, Karanja NK, Qureshi JN, Smithson PC, Woomer PL(1999) Soil organic matter and nutrient dynamics in a KenyanNitisol under long-term fertilizer and organic input management.Soil Bio Biochem 31:1773–1782
22. Kung L Jr, Moulder BM, Mulrooney CM, Teller RS, Schmidt RJ(2008) The effect of silage cutting height on the nutritive value ofa normal corn silage hybrid compared with brown midrib cornsilage fed to lactating cows. J Dairy Sci 91:1451–1457
23. Lewis AL, Cox WJ, Cherney JH (2004) Hybrid, maturity, andcutting height interactions on corn forage yield and quality. AgronJ 96:267–274
24. Li BY, Zhou DM, Cang L, Zhang HL, Fan XH, Qin SW (2007)Soil micronutrient availability to crops as affected by long-terminorganic and organic fertilizer applications. Soil Tillage Res96:166–173
25. Lindstrom MJ, Gupta SC, Onstad CA, Holt RF, Larson WE(1981) Crop residue removal and tillage—effects of soil erosionand nutrient loss in the Corn Belt. US Department of Agriculture,Ag Info. Bull. No. 442
26. Moebius-Clune BN, Van Es HM, Idowu OJ, Schindelbeck RR,Moebius-Clune DJ, Wolfe DW et al (2008) Long-term effects ofharvesting maize stover and tillage on soil quality. Soil Sci SocAm J 72:960–969
Bioenerg. Res. (2010) 3:342–352 351
Author's personal copy
27. NASS (2009) Quick stats. USDA National Agricultural StatisticService, Washington, Available via http://www.nass.usda.gov/.Cited 10 Feb 2010
28. Neylon JM, Kung L Jr (2003) Effects of cutting height andmaturity on the nutritive value of corn silage for lactating cows. JDairy Sci 86:2163–2169
29. Ng TK, Busche RM, McDonald CC, Hardy RWF (1983)Production of feedstock chemicals. Science 219:733–740
30. Paul EA, Clark FE (1996) Soil microbiology and biochemistry.Academic, San Diego
31. Salinas-Garcia JR, Baez-Gonzalez AD, Tiscareno-Lopez M,Rosales-Robles E (2001) Residue removal and tillage interactioneffects on soil properties under rain-fed corn production in centralMexico. Soil Tillage Res 59:67–79
32. SAS (2002) SAS version 9.1. SAS Institute Inc, Cary33. Shinners KJ, Binversie BN, Muck RE, Weimer PJ (2007)
Comparison of wet and dry corn stover harvest and storage.Biomass Bioe 31:211–221
34. Shinners KJ, Boettcher GC, Hoffman DS, Munk JT, Muck RE,Weimer PJ (2009) Single-pass harvest of corn grain and stover:performance of three harvester configurations. TransASABE52:51–60
35. Technicon (1973) Technicon industrial method AA. ii no. 99-70w. Sept. 1973. Chloride in water and waste water. TechniconInstrument Corporation, Tarrytown
36. Tisdall JM, Nelson WL, Beaton JD (1986) Soil fertility andfertilizers. Macmillan Publishing Company, New York
37. US-EPA (2007) Method 3051a: microwave assisted acid digestionof sediments, sludges, soils, and oils Available via http://www.epa.gov/epawaste/hazard/testmethods/sw846/pdfs/3051a.pdf. Cit-ed 22 Oct 2008
38. Wilhelm WW, Johnson JMF, Hatfield JL, Voorhees WB, LindenDR (2004) Crop and soil productivity response to corn residueremoval: a literature review. Agron J 96:1–17
39. Wilhelm WW, Johnson JMF, Karlen DL, Lightle DT (2007) Cornstover to sustain soil organic carbon further constrains biomasssupply. Agron J 99:1665–1667
40. Wilhelm WW, Johnson JMF, Lightle D, Barbour NW, KarlenDL, Laird DA et al (2010) Vertical distribution of corn stoverdry mass grown at several U.S. locations. BioEnergy Res (inpress)
41. Yu F, Ruan R, Steele P (2008) Consecutive reaction model for thepyrolysis of corn cob. Trans ASABE 51:1023–1028
352 Bioenerg. Res. (2010) 3:342–352
Author's personal copy