development of a notational analysis system for selected
TRANSCRIPT

Brigham Young University Brigham Young University
BYU ScholarsArchive BYU ScholarsArchive
Theses and Dissertations
2006-07-19
Development of a Notational Analysis System for Selected Soccer Development of a Notational Analysis System for Selected Soccer
Skills of a Women's College Team Skills of a Women's College Team
Camille Thomas Brigham Young University - Provo
Follow this and additional works at: https://scholarsarchive.byu.edu/etd
Part of the Exercise Science Commons
BYU ScholarsArchive Citation BYU ScholarsArchive Citation Thomas, Camille, "Development of a Notational Analysis System for Selected Soccer Skills of a Women's College Team" (2006). Theses and Dissertations. 502. https://scholarsarchive.byu.edu/etd/502
This Dissertation is brought to you for free and open access by BYU ScholarsArchive. It has been accepted for inclusion in Theses and Dissertations by an authorized administrator of BYU ScholarsArchive. For more information, please contact [email protected], [email protected].

DEVELOPMENT OF A NOTATIONAL ANALYSIS SYSTEM FOR
SELECTED SOCCER SKILLS OF A WOMEN’S COLLEGE TEAM
by
Camille Thomas
A dissertation submitted to the faculty of
Brigham Young University
in partial fulfillment of the requirements for the degree of
Doctor of Philosophy
Department of Exercise Sciences
Brigham Young University
August 2006

Copyright © 2006 Camille Thomas
All Rights Reserved

BRIGHAM YOUNG UNIVERSITY
GRADUATE COMMITTEE APPROVAL
of a dissertation submitted by
Camille Thomas
This dissertation has been read by each member of the following graduate committee and by majority vote has been found to be satisfactory. Date Pat R. Vehrs, Chair Date Gilbert W. Fellingham Date Philip E. Allsen Date Gary W. Mack Date Iain Hunter

BRIGHAM YOUNG UNIVERSITY
As chair of the candidate’s graduate committee, I have read the dissertation of Camille Thomas in its final form and have found that (1) its format, citations, and bibliographical style are consistent and acceptable and fulfill university and department style requirements; (2) its illustrative materials including figures, tables, and charts are in place; and (3) the final manuscript is satisfactory to the graduate committee and is ready for submission to the university library. Date Pat R. Vehrs Chair, Graduate Committee Accepted for the Department Larry T. Hall Chair, Department of Exercise Sciences Accepted for the College Gordon B. Lindsay, Associate Dean College of Health and Human Performance

ABSTRACT
DEVELOPMENT OF A NOTATIONAL ANALYSIS SYSTEM FOR
SELECTED SOCCER SKILLS OF A WOMEN’S COLLEGE TEAM
Camille Thomas
Department of Exercise Sciences
Doctor of Philosophy
The purposes of this study were to develop a notational system to evaluate
passing, dribbling, first touch, and individual defensive skills as they relate to success
during women’s soccer games and to develop a statistical model to weight the importance
of each skill on creating scoring opportunities. Sequences of skills in 10 Division I
intercollegiate women’s soccer games were coded using well defined performance scores
and outcomes. The notational analysis system was highly reliable as demonstrated by
high test-retest Spearman’s correlations (>0.98) between the first and second notation of
3 games for all four skills. The importance scores calculated from a Bayesian model
demonstrated that dribbling (0.0127) was the most important skill on creating scoring
opportunities, followed by first touch (0.0079), passing (0.0075), and individual defense
(0.0050). The notational system developed by this study provides coaches with reliable
and objective information in order to improve the specificity of practices and to prepare
individuals for optimal performance.

ACKNOWLEDGMENTS
I would like to thank my colleagues Cindy Seiger and Janette Olsen for their
valuable input and support. Finally, I would like to thank my parents Kent and Carolyn
Thomas, who share in this accomplishment.

viii
Table of Contents
List of Tables .....................................................................................................................x List of Figures .................................................................................................................. xi Development of a notational analysis system for selected soccer skills of a women’s
college team
Abstract ..................................................................................................................2 Introduction............................................................................................................3 Methods..................................................................................................................4 Results..................................................................................................................10 Discussion............................................................................................................12 References............................................................................................................20 Appendix A Prospectus....................................................................................................31 Introduction..........................................................................................................32 Review of Literature ............................................................................................41 Methods................................................................................................................71 References............................................................................................................83 Appendix B Additional Methods .....................................................................................87 Appendix C Additional Results .......................................................................................89 Frequencies per game for pass ratings by position ..............................................90 Frequencies per game for dribble ratings by position..........................................95 Frequencies per game for first touch ratings by position.....................................98 Frequencies per game for individual defense ratings by position......................101 Frequencies per game for shots off target, on target, and goals by position......106

ix
Mean performance scores for passing by position.............................................109 Mean performance scores for dribbling by position ..........................................109 Mean performance scores for first touch by position ........................................110 Mean performance scores for individual defense by position ...........................110 Appendix D Suggestions for Future Research.............................................................111

x
List of Tables
Table Page
1 Performance scores based on the effect of the pass….................................... 22 2 Performance scores based on the effect of the dribble ................................... 23 3 Performance scores based on the effect of the first touch .............................. 24 4 Performance scores based on the effect of individual defensive tactics......... 25
5 Average frequency of performance scores for each skill per game................ 26
6 Mean performance scores per game for the home team and opponents ......... 27
7 Average per game occurrences of shots during the game per team................ 28
8 Point estimates for the model parameters ........................................................29

xi
List of Figures
Figure Page 1 Posterior density plots of the importance scores for the four skills................ 30
Notational Analysis 1 Running Head: NOTATIONAL ANALYSIS FOR SOCCER GAMES
Development of a Notational Analysis System for Selected
Soccer Skills of a Women’s College Team
Camille Thomas, Gilbert Fellingham, and Pat Vehrs
Brigham Young University
Address Correspondence to: Camille Thomas 874 N 1760 W Provo, UT 84604 [email protected] (801) 368-5218

2 Notational Analysis
Abstract
The purposes of this study were to develop a notational system to evaluate
passing, dribbling, first touch, and individual defensive skills as they relate to success
during women’s soccer games and to develop a statistical model to weight the importance
of each skill on creating scoring opportunities. Sequences of skills in 10 Division I
intercollegiate women’s soccer games were coded using well defined performance scores
and outcomes. The notational analysis system was highly reliable as demonstrated by
high test-retest Spearman’s correlations (>0.98) between the first and second notation of
3 games for all four skills. The importance scores calculated from a Bayesian model
demonstrated that dribbling (0.0127) was the most important skill on creating scoring
opportunities, followed by first touch (0.0079), passing (0.0075), and individual defense
(0.0050). The notational system developed by this study provides coaches with reliable
and objective information in order to improve the specificity of practices and to prepare
individuals for optimal performance.
Key words: Sport, Performance Indicators, Match Analysis, Skill importance, Statistical
Model

Notational Analysis 3
Introduction
Notational analysis systems are used to gain insights into characteristics of
performance during a game or match (Hodges & Franks, 2002; Hughes & Bartlett, 2002).
Notational analysis usually uses specially prepared grids of the field or court of play and
various codes to mark and create a detailed map of each action as it happens.
Traditionally, notational analyses for soccer have focused on the analysis of movement
and different patterns of play during the game (Harris & Reilly, 1988; Reep & Benjamin,
1968; Reilly & Thomas, 1976). However, only a few studies have addressed specific
soccer tactics in order to change the game or practice strategy (Bate, 1988; Hughes &
Franks, 2005).
A notational analysis model has yet to be developed to evaluate the technical and
tactical skill of a player in order to determine its importance in scoring goals during a
soccer game. In fact, the traditional method of assessing skill and its importance in a
game has been for an observer, usually the coach, to watch a game and make subjective
conclusions about the individuals’ or team’s performance. The coach would then decide
how to divide practice time among various skills or tactics. This system of game analysis
and subsequent planning of practice time is limited by the coach’s knowledge,
experience, and perspective. Even with the introduction of video recording and the ability
to subsequently view games, most coaches still rely on subjective evaluation for
allocating practice time. This traditional method of game analysis does not present an
objective measure to determine which skill is the most important for creating scoring
opportunities in soccer. If the most important skills could be objectively determined, then
a coach could devote appropriate individualized and/or team practice time to the

4 Notational Analysis improvement of that skill. Furthermore, all the data reported by the previous studies have
been collected from men’s soccer games. Therefore, there is a great need for data to be
collected on women soccer players and different aspects of the women’s game.
The purpose of this study was to develop an applicable notational analysis system
that can be used to reliably evaluate passing, dribbling, first touch, and individual
defensive performance as they relate to scoring during women’s soccer games. In
addition, this study defined a statistical model to weight the importance of these skills on
creating scoring opportunities.
Methods
Developing a Notational Analysis System
This project developed a notational analysis model specifically designed to
evaluate passing, dribbling, first touch and individual defensive skills in women’s soccer.
The performance scoring system developed by Coleman (1975) for volleyball was used
as a template for developing the current notational system. A panel of experts consisting
of collegiate, high school, and local club coaches as well as fellow researchers aided in
the development and ranking of performance scores for the effects of each skill as it is
performed during the game. The list of effect for each skill and performance scores are
shown in Tables 1 through 4.
Performance scores were assigned based on the effectiveness of each skill in
creating a scoring opportunity. The pass was evaluated according to the result, such as if
the other team intercepted the pass or it resulted in a scoring opportunity. The dribble
was evaluated according to the result and direction of the dribble, such as dribbling the
ball towards your own goal, square, or towards the opponent’s goal. The first touch was

Notational Analysis 5 evaluated according to the result and direction, much like the dribble. Individual defense
was rated according to the United States Soccer Federation’s (USSF) principle of defense
tactics (2001) and the players’ ability to win back possession.
Data Collection
Using this notational system, data were collected from previously taped Division I
conference and nonconference 2005 home games of the women’s collegiate soccer team.
Ten home games were filmed with a digital camcorder from a fixed position
approximately 25 m high and about 10 m from the centerline. The camera was position
so the entire field of play could be seen. Only home games were filmed and analyzed to
keep the play terrain and field dimensions constant, as these confounding factors can
affect individual and team performance.
The principle investigator viewed each tape and hand coded each skill being
evaluated for the home team and the opponents. Each occurrence of a skill was rated
using the performance scores described in Tables 1 through 4. Every skill was also
associated with an outcome. The outcome was the same for every skill in a succession of
skills leading up to one of five events: (a) every skill leading up to a goal scored by the
team being evaluated was given an outcome of 10, (b) every skill leading up to a shot
taken by the team being evaluated was given an outcome of 1, (c) every skill preceding
the end of the half or end of game was given an outcome of 0, (d) every skill leading up
to a shot taken against the team being evaluated was given an outcome of -1, and (e)
every skill leading up to a goal scored against the team being evaluated was given an
outcome of -10. Goals were considered to be ten times as important as shots because
typically in soccer, roughly one goal is scored for every ten shots (Franks, 1996).

6 Notational Analysis
Coding for a succession of rated skills, consisting of passes, dribbles, first touches
and/or defense occurring between the start of the game, a goal, a shot, and/or the end of
the half or game, was recorded. Each skill was represented in the data file by an outcome
score, skill indicator, a performance score, and an indicator of whether the home team or
opponent performed the skill. For example, a first touch by the home team resulting in
back play (Table 3) leading to a shot on goal was coded as 1 FIRST TOUCH (FRT) 2
HOME. Thus, a succession of coded skills would read 1 DRIBBLE (DRB) 2 HOME; 1
PASS 5 HOME; 1 FRT 4 HOME; 1 DRB 3 HOME; 1 PAS 2 HOME; 1 PAS 1 HOME; 1
SHOT 2 HOME; -1 DEFENSE (DEF) 3 HOME; -1 DEF 2 HOME; -1 DEF 4
HOME…and so on. The codes with the appropriate outcome were then transferred into a
Microsoft Excel spreadsheet.
Frequency of each performance score for each skill was also tallied for each game
and team. Frequency of each shot was also recorded according to whether the shot was
off-target, on-target, or resulted in a goal. Other data such as weather conditions, injuries,
and final score of the game were recorded.
Statistical Analysis
Three general areas of the study were tested statistically. SPSS (version 14) was
used to analyze the test-retest reliability of assigning performance scores, and the
calculation of mean performance scores for each skill. MatLab was used to determine the
relationships between each of the skills and scoring. Statistical significance was
maintained at p < 0.05.
Test-retest reliability. In order to determine test-retest reliability of assigning
performance scores to each skill, three games were randomly chosen to be notated twice.

Notational Analysis 7 At least two weeks lapsed between the first and second notations to minimize bias
between the notations. This type of statistical analysis is a comparison of ordinal data and
needs to show reliability of the sequential nature of the coding. Thus, the data was broken
up into four sets: pass, dribble, first touch, and individual defense, since there should be
no question that the rater can distinguish between the four skills. A Spearman’s rank
correlation established the investigator’s ability to reproduce performance scores for the
same sequence of skill actions. Furthermore, to demonstrate a lack of bias between the
ratings, a one-sample t test was used to determine whether or not the mean difference
between performance scores from the first and second notation was significantly different
from zero.
Mean performance scores. Mean performance scores were calculated for the
home team and opponents for each skill for each of the 10 games throughout the season.
Overall mean performance scores for both teams were calculated for each technique
across the 10 home games. A student’s t test was used to compare the mean performance
scores between the home team and the opponents.
Skills importance model. To determine the importance of each skill on the success
(shot on goal or goal) during the soccer game, we chose to analyze the data using a
Bayesian paradigm. The Bayesian model permits the inclusion of the prior beliefs of the
coach about relative importance of the skills in the analysis. We were also interested in
the entire probability distributions for the parameters of interest, not just point and
interval estimates. We used Markov chain Monte Carlo (MCMC) methodology to
estimate posterior distributions means from the entire posterior distribution as a natural

8 Notational Analysis outcome of the analysis. The use of posterior distribution enables the incorporation of
prior knowledge into the model and thus leads to more accurate estimators.
We chose to model the outcome as a linear function of the standardized
performance scores. Performance scores were standardized so that the lowest rating
became a -10, and the highest rating a 10, to match the lowest and highest outcome
scores. For example, since performance scores for dribbling ranged from 0 to 4 (Table 2),
subtracting 2 and multiplying the result by 5 standardized these scores. All rating scales
were standardized prior to any analysis.
We used the following model:
jijitiitiiji xxxy ,,,1,1,0,0, )( εαβαβ ++++= (1)
Where
yi,j is the outcome for the jth count of the ith skill,
β0, i is the overall intercept for the ith skill,
α0,i is the deviation from the overall intercept for the home team,
xt is an indicator for the team, xt = 1 for the home team and xt = 0 for opponent,
β1,i is the overall slope for the ith skill, which is defined by the performance
scores (x-axis) and the outcomes (y-axis).
α1,i is the deviations from the overall slope for the home team,
and εi, j is the error for the jth count of the ith skill.
The error term was assumed to be normally distributed, and the observations were
assumed to be independent.
Thus, the likelihood function of the data becomes:

Notational Analysis 9
12
122 2 0 0 1 1
2
11
4
( )exp( ( ( ( ) ) ), , , , , ,πσ σ
β α β αi i
i j i i t i i t i jj
n
iy x x
i −− + + +
==∏∏ x (2)
Where
i represents the skill,
σi represents the standard deviation of the observations of the ith skill.
And ni is the number of observations of the ith skill.
Skill importance for the ith skill was defined as
i
i
σβ ,1 (3)
Thus, skill importance increases as either the slope increases and/or the error
around the line decreases.
Prior distributions for the parameters were based on input from the soccer coach,
or were formulated to be reasonably noninformative. We used the coach’s input to
formulate the prior distributions for the slope parameters for each skill. The relationship
between the performance scores and the outcome would be significantly less than 1.0,
thus, we assumed that the largest slope would be 0.1. Using this as the maximum, he
coach estimated the following values for the means of the prior distribution for the β1’s.
A variance of 0.5 was used to cover the range of possible slopes. The notation N(μ, σ2)
represents a normal distribution with mean μ and variance σ2.
β1, pass ~ N(0.06, 0.5)
β1, dribble ~ N(0.03, 0.5)
β1, first touch ~ N(0.05, 0.5)
β1, defense ~ N(0.08,0.5)

10 Notational Analysis
The other prior distributions were taken as follows, with the notational IG(a,b)
representing an inverse gamma distribution with parameters a and b, and i in each case
indicating the skills.
β0, i ~ N(0, 0.5)
α0, i ~ N(0, 0.1)
α1, i ~ N(0, 0.1)
σ2i ~ IG(0.1, 0.1)
We produced samples from the posterior densities of the parameters using
MCMC methods (Gilks, Richardson, & Spiegelhalter, 1998). In particular, at each
iteration, we computed the importance score of each skill as ii i∧∧
1β . Since MCMC
methods draws from the relevant posterior distributions, we used these distributions to
examine the relative importance of the four skills.
We used a burn-in of 3,000 iterations and then made 10,000 draws for the purpose
of characterizing the posterior distributions. Diagnostic plots indicated that mixing was
complete.
Results
The 10 games included in this analysis were played against other National
Collegiate Athletic Association division I women’s soccer teams. Games lasted 90
minutes with the exception of two games that went into overtime, and thus lasted 110
minutes. Two of the ten games experienced adverse weather, one was light rain that
lasted 10 minutes, and the other was heavy rain that continued throughout the entire
game. All home games were played at an elevation of 4,553 ft. The playing field was 120

Notational Analysis 11 yards long and 75 yards wide with a grass playing surface. All games were played at
night under the stadium lights.
Performance Scores and Outcomes
On average, 1500 discrete actions per team per game were rated. Individual
defense constituted 45% of the discrete skills followed by passing (28%), first touch
(18%), and dribbling (8%). Of the total passing attempts, 57.6% were completed, such
that the pass performance scores of 1 or above was followed by a teammate receiving,
passing, dribbling, and/or shooting the ball. Sixty percent of first touch skills resulted in
subsequent passing or dribbling actions. Twenty-six percent of all dribbling attempts
resulted in possession being lost or the ball deflected out of bounds. The average
frequency of each performance score for each skill is listed in Table 5. Mean
performance scores per game are shown in Table 6.
Overall, 207 outcomes occurred, 64.3% were shots on goal, 12.6% were goals
scored, and 23.2% were end of the half, game, or overtime period. The home team
attempted 3 times the shots per game than opponents and scored 1 goal per 10 shot
attempts compared to the opponents scoring 1 goal per 25 attempts, on average. The
frequency of shots per game is given in Table 7.
Test-Retest Reliability
The correlation coefficients between the first and second notation of the same
games were 0.996, 0.997, 0.996, and 0.987 for pass, dribble, first touch, and individual
defense, respectively. The mean difference in skill ratings for passing (0.001 ± 0.305),
dribbling (0.002 ± 0.150), first touch (0.002 ± 0.106), and individual defense (-0.018 ±
.480) were not different from zero (p > 0.05).

12 Notational Analysis Skill Importance
The point estimates and standard deviations for the model parameters are
presented in Table 8. Complete characterizations of the posterior distributions for
importance scores are shown in Figures 1. The overall slope of the dribbling skills was
2.40, 1.64, and 1.54 times greater than the slope of individual defense, passing, and first
touch skills, respectively. The dribbling importance score was 2.54, 1.69, and 1.60 times
greater than the importance scores for individual defense, passing, and first touch skills,
respectively.
Discussion
This study provides a notational analysis tool that allows coaches to evaluate skill
performance as it relates to success during women’s soccer games. The notational
analysis system developed in this study is a reproducible measure to evaluate passing,
dribbling, first touch, and individual defense during a women’s game. In addition, the
notational analysis appears to be an appropriate performance measure for each of the
skills. For the first time, this study has presented a notational analysis that effectively
rates the importance of four specific skills during soccer games in determining the
outcome. Based on importance scores, dribbling was the single most influential skill on
the outcome of a women’s game, followed by first touch, passing, and individual defense.
Test-Retest Reliability and Validity
The notational analysis system developed in this study is a reproducible
evaluation of passing, dribbling, first touch, and individual defense during a women’s
game. Correlations reported in this study of greater than 0.98 were expected and quite
reasonable since the same skill action was reanalyzed. The mean differences between the

Notational Analysis 13 first and second notation were not different from zero for each skill. The mean
differences of nearly zero with a small standard deviation along with high correlations are
evidence of high test-retest reliability in a coach’s ability to assign performance scores.
The notational analysis appears to be an appropriate measure of performance for
each skill. As this is the first record of a notational analysis system that measures
performance of skill during a soccer game, it is difficult to measure its validity. This
notational analysis was developed under the advisement of experienced coaches, previous
research, and recommendation of the United States Soccer Federation (USSF) coaching
education program. Coaches from division I NCAA programs, local high schools, and
clubs validated the performance scores as an appropriate measure of each skill.
Furthermore, the game results from this study support the assumption that superior
performance of skills, represented by higher performance score, will result in a greater
number of shots on goal (Pollard, 1986). The home team out shot the opponent in every
game in which they received higher overall performance score for each skill (Table 6). In
the one instance in which the opponent received higher performance scores than the
home team, the opponent, as expected out shot the home team (Table 7). Lastly,
performance scores were based on coaching principles taught by the USSF (2001)
coaching manual. Based on the support of coaches and previous research, we are
confident that this notational system is an appropriate method of rating skills.
Skill Importance
Since this type of statistical modeling of sport skills is still in its infancy, the
interpretation of importance scores is limited. We expect to gain a better understanding
of the actual value and interpretation of importance scores as the database grows.

14 Notational Analysis Importance scores provide a measure of the influence each skill has on creating scoring
opportunities during a soccer game. Importance scores in this study ranged from 0.0050
to 0.0127. The range of importance scores depends on the model used, thus importance
scores reported in one study can only be compared to important scores reported in other
studies if exactly the same performance score and statistical model are used. For
example, Fellingham and Reese (2004) reported importance scores of volleyball skills
ranging from 0.01 to 17.51 using a binary logistic model with multiple categories.
While, it is difficult to compare importance scores between studies, it is possible
to compare the absolute importance scores of each skill within this study. The
importance scores for passing, dribbling, first touch and individual defense were all
greater than zero (see Figure 1). Thus, there is a positive association between each skill
and scoring opportunities. In addition, based on importance scores reported in this study,
dribbling appears to be the single most important skill, followed by first touch, passing,
and individual defense (Table 8) in creating scoring opportunities in soccer.
Based on the actual importance score values (Table 8), it appears that dribbling is
approximately twice as important as any of the other skills in creating scoring
opportunities. Due to the nature of model it may be erroneous to make relative
comparisons of the importance scores. Importance scores will increase as the slope of the
linear model increases or the error around the line decreases. Additionally, the slope will
increase if the performance scores (x-axis) improve, or if there is a better outcome
associated with the skill (y-axis).
The frequency of which an action (first touch, pass, dribble, and individual
defense) occurs in a game does not necessarily determine its importance. While the

Notational Analysis 15 frequency of an action is not directly accounted for in importance scores, frequency is
represented in the width and height of the posterior density plots (see Figure 1). For
instance, dribbling was the action which occurred the least often during the game, thus
the posterior density plot was short and wide. While an increase in frequency may affect
the error around the line for each skill, the data in this study indicates that the
denominators (error term) in the importance score calculation (equation 3) are similar
despite the wide variation in frequency (Table 8).
Dribbling. Based on the area under the curve of the posterior density plots of
importance scores (Table 8, see Figure 1), dribbling had the highest skill importance
associated with the team’s ability to create scoring opportunities. This was true even
though dribbling only represented 8% of the total discrete actions that occurred during a
game per team. Despite the low occurrence of dribbling, it had the greatest slope and the
smallest error around the line (Table 8) because higher ranked dribbling actions were
consistently associated with better outcomes for the team.
While the evidence presented in this study strongly supports dribbling as the
single most important skill, the standard deviation of its importance score was the largest
(Table 8). We expect that as more data is collected and a greater number of dribbling
occurrences can be rated, the standard deviation of the importance score may decrease,
the posterior density plots will become narrow, and the importance scores may improve.
Increasing the size of the database of analyzed games will improve our confidence in the
findings of this study.
First touch. According to the importance scores, first touch ranked second in
association with the team’s ability to create scoring opportunities. First touch actions

16 Notational Analysis consisted of 18% of the total actions per game, which like dribbling had a relatively low
frequency of occurrence during the game. In this study, first touch passes, such as head or
chest balls executed with the intent of passing, were rated as a pass rather than a first
touch. This is appropriate because purpose of the first touch is for the individual to
maintain possession, while the purpose of the first touch pass is to maintain possession
within the team structure. First touch actions had a greater slope than passing and
individual defense, suggesting that a better first touch action was more likely to be
associated with a positive outcome (Table 8). The standard deviation of the first touch
importance score was greater than that of passing and individual defense. Increasing the
size of the database for first touch actions may decrease the standard deviation of the
importance score and thus, further support the evidence presented in this study.
Passing. Of the four skills evaluated in this study, passing was ranked third in its
association with the team’s ability to create scoring opportunities. Based on the slope of
the line, better passing actions were more likely associated with a positive outcome than
individual defensive actions (Table 8). The error around the line for passing is nearly
equal to that of first touch and individual defense (Table 8). Passing, as well as individual
defense, had the smallest standard deviation for the importance score. This may be due
to the higher frequency of passing (28%) compared to dribbling and first touches.
Although, passing frequency was greater than that of dribbling and first touch, it is
assumed that as more data is collected, the error around the line for passing will decrease,
thus increasing its importance score.
The importance scores for passing and first touch were nearly identical. The
overlap of the posterior density plots (see Figure 1) supports the finding that these two

Notational Analysis 17 actions often occur together. A pass will most likely follow a first touch action and a first
touch action will most likely follow a pass. There are exceptions such as a first time pass,
or if the first touch is lost or deflected. Since it is difficult to separate passing from first
touch actions, the practice of these two skills should be combined and be apportioned the
greatest amount of time. This does not imply that the importance scores for these two
skills are additive, thus making passing plus first touch more important than dribbling.
The importance scores from this study assumed there was dissociation between
first touch and passing. However, first touch is heavily dependent on the ball the player
receives. For instance, a 50/50 pass could result in a first touch action that is lost
immediately. The loss of possession may be a result of a bad pass rather that a poor first
touch. The strong association between the pass and first touch limits our interpretation of
the importance scores. This limitation may be resolved by modifying the coding to
include a new skill variable such as first touch passing.
Individual defense. Defense had the lowest overall importance rating, although it
was the most frequent discrete action. Based on slope of the line for individual defense
(Table 8), higher individual defense performance scores were less likely to be associated
with positive outcomes (i.e. scoring). Although, individual defense occurred more often
than any of the other skills, individual defense actually had the greatest error around the
line (Table 8). Compared to other skills, individual defense had the smallest standard
deviation of the importance score.
Comparison of Men’s and Women’s soccer
This is the first time a notational analysis system has been used to examine skill
performance during a women’s soccer game. No comparison of dribbling, first touch,

18 Notational Analysis and defensive actions could be made between men’s and women’s soccer since this is the
first study to evaluate those skills as discrete actions during soccer games. Only minimal
comparisons can be made between women’s and men’s passing skills. For instance, the
frequency of passing reported in this study (421.5 passes) was comparable to the
frequency of passing (485.3 passes) reported by Reep and Benjamin (1968). Reep and
Benjamin reported a higher percentage of completed passes, 62.6% versus 57.6%
reported in this study. More research is needed to determine similarities or differences in
skill frequency and performance between men’s and women’s soccer.
Conclusion
To the best of our knowledge, this study presents the first use of a notational
analysis system that effectively rates the importance of four specific skills during a soccer
game in determining a positive outcome. Dribbling appears to be the single most
important skill when compared to passing, first touch and defense. However, since
passing skill will affect first touch skill and vice versa, these two skills should be
practiced together. The combination of passing and first touch should be apportioned the
majority of practice time. Particular care should be used to devise drills that encourage
better first touch while still encouraging performance at the four point passing or better
level (Table 1). Dribbling should receive slightly less practice time than first touch and
passing combined. Dribbling practice should include drills that encourage development
of a player’s creativity and improvisation with the ball at their feet. Based on the
importance of defensive actions to scoring outcomes, individual defense should receive
the smallest proportion of practice time. This study provides coaches with reliable and

Notational Analysis 19 objective information in order to improve the specificity of practices and hopefully,
influence the outcome of games.

20 Notational Analysis
References
Bate, R. (1988). Football chance: Tactics and strategy, In T. Reilly, A. Lees, K. Davids,
& W. Murphy (Eds.), Science and football (pp. 293-301). London: E & FN Spon.
Coleman, J. E. (1975). A statistical evaluation of selected volleyball techniques at the
1974 world’s volleyball championships. Unpublished doctoral dissertation,
Brigham Young University, Provo, Utah.
Fellingham, G. W., & Reese, C. S. (2004). Rating skills in international men’s volleyball.
Unpublished manuscript, Brigham Young University.
Franks, I. M. (1996). Analysis of association football. In T. Schum (Ed.), Coaching
soccer (pp. 29-37). Chicago, IL: Masters Press.
Gilks, W. R., Richardson, S., & Spiegelhalter, D. J. (Eds.) (1998). Markov chain Monte
Carlo in practice. London: Chapman & Hall, Ltd.
Harris, S., & Reilly, T. (1988). Space, team work and attacking success in soccer. In T.
Reilly, A. Lees, K. Davids, & W. Murphy (Eds.), Science and football (pp. 322-
329). London: E & FN Spon.
Hodges, N. J., & Franks, I. M. (2002). Modeling coaching practice: The role of
instruction and demonstration. Journal of Sports Sciences, 20, 793-811.
Hughes, M. D., & Bartlett, R. M. (2002). The use of performance indicators in
performance analysis. Journal of Sports Sciences, 20, 739-754.
Hughes, M. D. & Franks, I. M. (2005). Analysis of passing sequences, shots and goals in
soccer. Journal of Sports Sciences, 23, 509-514.

Notational Analysis 21 Pollard, R. (1986) Soccer performance and its application to shots at goal. Sports
statistical special, dept. of Research Hanuman Vyayam Prasarak Mandal, 4(2),
19-27.
Reep, C., & Benjamin, B. (1968). Skill and chance in association football. Journal of
Royal Statistical Society, Series A, 131, 581-585.
Reilly, T., & Thomas, V. (1976). A motion analysis of work-rate in different positional
roles in professional football match-play. Journal of Human Movement Studies, 2,
87-97.
United States Soccer Federation (2001). D-license candidate manual. Canoga Park, CA:
Youth Sports Publishing.

22 Notational Analysis
Table 1 Performance Scores Based on the Effect of the Pass Effect of the pass
Performance
scores
The pass results in an immediate loss of possession
0
The pass results in a 50/50 ball to the opponents
1
The pass is deflected out of bounds / player is fouled
2
The pass results in back play
3
The pass results in a square play
4
The pass results in forward (penetrating) play
5
The pass results in a ball in the “mixer”
6
The pass results in a scoring opportunity
7

Notational Analysis 23
Table 2 Performance Scores Based on the Effect of the Dribble Effect of the dribble
Performance scores
The dribble results in an immediate loss of possession
0
The dribble results in a deflection out of bounds/ player is fouled
1
The dribble is toward own goal or square
2
The dribble is toward the opponent’s goal (penetrating)
3
The dribble results in a scoring opportunity
4
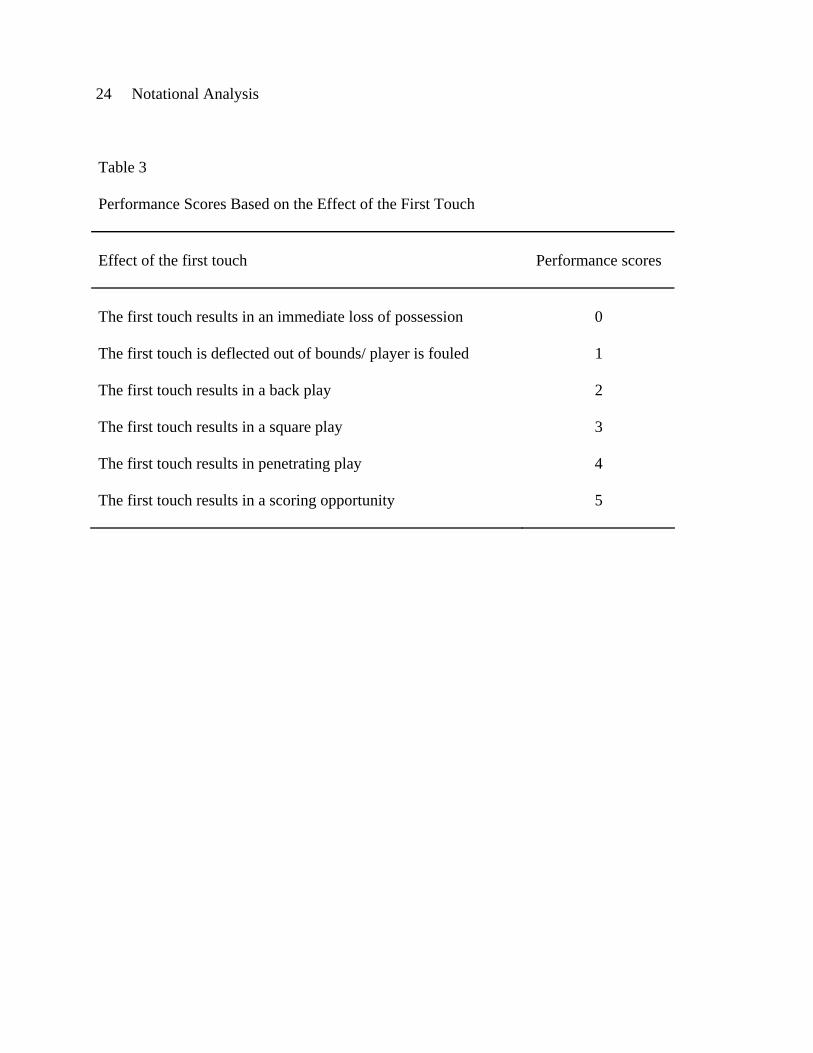
24 Notational Analysis
Table 3 Performance Scores Based on the Effect of the First Touch Effect of the first touch
Performance scores
The first touch results in an immediate loss of possession
0
The first touch is deflected out of bounds/ player is fouled 1
The first touch results in a back play 2
The first touch results in a square play 3
The first touch results in penetrating play 4
The first touch results in a scoring opportunity 5

Notational Analysis 25
Table 4 Performance Scores Based on the Effect of Individual Defensive Tactics Effect of defensive tactics
Performance
scores
Player did not provide immediate chase or chase results in a foul
0
Challenged a 50/50 ball, but possession is not regained 1
Challenge but no delay and the opponents penetrate 2
Challenge with delay but the opponents still penetrate 3
Challenge with delay results in a ball being played indirectly 4
Challenge results in possession, indirect play/forced errors out of bounds
5
Challenge results in possession won, direct play in the defensive 3rd 6
Challenge results in possession won, direct play in the middle 3rd 7
Challenge results in possession won, direct play in the attacking 3rd 8

26 Notational Analysis
Table 5
Average frequency of performance scores for each skill per game.
Performance Score*
Skill
0
1
2
3
4
5
6
7
8
Total
Passing
114.3 59.3 11.7 50.4 67.4 120.4 21.1 9.9 n/a 454.6 Home
Opponent 119.7 74.9 7.2 37.4 49.4 90.9 7.2 1.7 n/a 388.4
Dribbling
24.8 10.1 51.9 50.5 6.5 n/a n/a n/a n/a 143.8 Home
Opponent 21.2 5.6 37.9 27.1 2.5 n/a n/a n/a n/a 94.3
First Touch
51.7 8.4 61.5 54.8 119.0 11.0 n/a n/a n/a 306.4 Home
Opponent 56.6 7.2 60.0 42.8 73.2 4.5 n/a n/a n/a 244.3
Individual Defense
95.0 61.5 95.1 57.4 114.2 28.3 60.5 126.6 19.2 657.9 Home
Opponent 117.2 66.8 97.1 65.8 139.6 33.0 82.4 92.0 8.3 702.2
* Description of performance scores for each skill can be found in Tables 1-4.

Notational Analysis 27
Table 6 Mean performance scores per game for the home team and opponents.
Game
Skill
1
2
3
4
5
6
7
8
9
10
Avg.
Passing
2.85 2.81* 2.87* 2.59 2.70 2.97* 2.89* 2.95* 3.16* 2.78* 2.86*
Home
Opponent 2.69 2.23 2.42 2.32 2.76 2.12 2.10 2.24 2.24 2.31
2.34
Dribbling
2.64* 1.82 2.06 1.95 1.84 2.15* 2.14 2.10* 2.13 1.99 2.03*
Home
Opponent 2.36 1.72 1.95 1.89 1.96 1.80 2.00 1.64 1.87 1.91
1.83
First Touch
1.97* 2.46 2.83* 2.68* 2.69 2.78* 2.76* 2.64* 2.78* 2.76* 2.70*
Home
Opponent 1.57 2.31 2.13 2.30 2.59 2.21 2.22 2.34 2.25 2.52
2.34
Individual Defense
3.72* 3.81 3.51 3.55 3.36 4.05* 3.64* 3.94* 3.69* 3.59 3.69*
Home
Opponent
3.20
3.57
3.51
3.41
3.46
3.37
3.17
3.43
3.17
3.65
3.40
Note: * = the home team performance scores were significantly different than the opponents at p < .05 in the student’s two-tailed t-test.

28 Notational Analysis Table 7 Average per game occurrences of shots during a game per team.
Game
Shots
1
2
3
4
5
6
7
8
9
10
Mean
Off Target
8 10 11 9 7 23 12 18 10 10
11.8 Home Opponent 3 3 2 4 6 4 1 2 7 5
3.7
On Target
10 12 11 8 2 18 9 4 14 9
9.7
Home Opponent 3 1 3 6 7 2 3 1 3 7
3.6
Goals Scored
5 5 2 1 1 0 0 6 2 1
2.3
Home Opponent 1
0
0
0
0
0
1
0
0
1
0.3

Notational Analysis 29 Table 8
Point estimates for the model parameters.
Parameter
Pass
Dribble
First Touch
Defense
β1
0.0288
0.0472
0.0306
0.0197
β0 -1.14 -0.718 -1.07 -1.42
α1 -0.010 -0.040 -0.026 -0.001
α0 2.56 2.09 2.55 2.67
σ2 14.9 13.8 15.0 15.3
Importance Score
Standard Deviation
0.0075
0.0026
0.0127
0.0055
0.0079
0.0034
0.0050
0.0020
Note: β1 = the overall slope for the skill; β0 = the overall intercept for the skill; α1 = the
deviations from the overall slope for the home team; α0 = the deviation from the overall
intercept for the home team; σ2 = the squared standard deviation of the data.

30 Notational Analysis
Defense
Pass
First Touch
Dribbling
Importance Scores (units)
Figure 1. Posterior density plots of the importance scores (units) for the four skills.

31
Appendix A
Prospectus

32
Chapter 1
Introduction
Throughout history notational analyses have been developed to gain insights into
game characteristics, such as game behavior, coaching tactics, and strategies of various
sports. These objective forms of analysis were first developed to examine movement in
music and dance, and have since evolved to analyze individual and team sports (Hughes,
2003). The earliest publication of sport notation explored the combinations of baseball
players batting, pitching, and fielding, and the probabilities of success (Fullerton, 1912).
Several years later, Messersmith and Bucher (1939) devised a notational system to
analyze the distance covered by specific basketball players during a game. The same
system was also used to analyze American football and field hockey players. As the use
of notational systems developed so did the various ways that the analysis could be used.
For instance, a comprehensive sport-notation system was developed by Downey (1973)
to examine such variables as tennis shots used, positions, and type of spin used in a
particular shot during lawn matches. Downey’s notation method has served as a useful
base for the development of systems for use in other racquet sports, specifically
badminton and squash. Other notational systems analyzed physiological demands of
rugby union and basketball games (Carter, 1996; Hughes & Franks, 2004; Treadwell,
1998). Finally, some have examined the relationship of game performance indicators and
the success of teams (Coleman, 1975; Marques, 1990; Mendes & Janeira, 2001).
Notational analyses for soccer have focused on the analysis of movement and
different patterns of play during the game. Introduced by Reilly and Thomas (1976), the
definitive notational analysis of soccer analyzed the intensity and extent of discrete

33activities during match play. They combined written notes with the use of an audio tape
recorder to analyze in detail the movements of English First Division soccer players. An
alternative approach to match analysis was exemplified by Reep and Benjamin (1968),
who collected data from 3,213 matches between 1953 and 1968. They were concerned
with specific skills, such as passing and shooting, rather than work rates of individual
players. Furthermore, Bate (1988) explored aspects of chance in soccer and its relation to
tactics and strategy. Based on the results, Bate recommended what is now known as the
“direct method” or “long-ball” game in soccer. Harris and Reilly (1988) evaluated
attacking success, in relation to team strategy, and the configuration of players around the
point of action. Their analysis focused on the position of attackers in relation to the
defense, and overall, the success of each attacking sequence. This form of analysis was a
considerable departure from previous research, which tended to discriminate each
sequence into discrete actions.
A notational analysis model has yet to be developed to evaluate the tactical and
technical skill of a player during a soccer game. In fact, the traditional method of
assessing skill and its importance in a game has been for an observer to watch a game
take place then draw subjective conclusions about the individuals’ or teams’
performance. Even with the introduction of video recording and the ability to
subsequently view games, most coaches still rely on subjective evaluation for planning
tactics, strategies, and overall style of play.
This project will develop a notational analysis model specifically designed to
evaluate offensive technical skills and defensive tactical aspects of a soccer match. The
technical aspects of passing, dribbling, and first touch will be examined. Passing,

34 dribbling, and first touch were chosen as technical variables since they have a direct
effect on the ability of a team to keep possession of the ball. Previous research has
shown that keeping possession is the most skillful way of playing soccer (Wade, 1996a,
1996b). Individual defensive tactics directly affect the team’s ability to regain possession
and create scoring opportunities (Franks, 1996). Each technique and tactic was chosen
based on the assumption that superior performance of the skill will result in a greater
number of shots on goal, which will then increase the chance of scoring goals (Pollard,
1986).
In addition to the development of a notational analysis model for soccer, this
study will evaluate the technical and tactical skills of a collegiate women’s soccer team.
Data previously reported, using various models of analysis, have been collected from
men’s soccer games. Therefore, there is a great need for data to be collected on women
soccer players and different aspects of the women’s game.
The aim of this study is to develop a notational system which coaches can use to
evaluate passing, dribbling, first touch, and individual defensive performance as it relates
to success during soccer games. Each skill will receive a performance score, such as 0 to
7 for passing, 0 to 4 for dribbling, 0 to 5 for first touches, and 0 to 8 for individual
defense, which the coach can then use to rate or rank an individual’s skill level or the
team’s skill level. The importance of each skill in scoring goals will be quantified. Once
the importance scores of each skill have been determined, coaches can then plan and
conduct practices that are designed to emphasize the more important techniques and
tactics.

35Statement of Purpose
The purpose of this study is to develop a reliable and valid method to
systematically evaluate the performance of passing, dribbling, first touch, and individual
defense in soccer. In addition, this study will define a statistical model to weight the
importance of these skills on the success of a team during a soccer game.
Hypotheses
The null hypothesis assumes that there is no relationship between the performance
levels of the three techniques (passing, dribbling and first touch) and scoring in ten
women’s soccer games. In addition, the null hypothesis assumes that there is no
relationship between the performance level of an individual’s defense and scoring in ten
women’s soccer games.
The alternative hypothesis assumes that there is a relationship between the
performance levels of the three techniques (passing, dribbling and first touch) and scoring
in ten women’s soccer games. In addition, the alternative hypothesis states that there is a
relationship between the performance levels of an individual’s defense and scoring in ten
women’s soccer games.
Definition of Terms
50-50 Ball: A ball that can be equally won by either team. Usually the result of a
goal kick, goalkeeper punt or drop kick, or a defensive clearance.
Assist: An assist is awarded to the second-to-last attacking player who touched the
ball prior to a goal being scored.
Attacking Team: The team in possession of the ball.

36
Attacking 3rd of the Field: The attacking 3rd consists of the opposing team’s goal
and the third of the field that is directly in front of the goal.
Corner Kick: A corner kick is awarded when “the whole of the ball, having last
touched a player of the defending team, passes over the goal line, either on the ground or
in the air, and a goal is not scored” (FIFA, 2004). The ball is placed inside the corner arc
at the nearest corner flagpost.
Defending Team: The team not in possession of the ball.
Defensive 3rd of the Field: The defending 3rd consists of the attacking team’s
goal and the third of the field that is directly in front of the goal.
Defensive Clearance: The act of kicking a ball out and away from an attacking
player. A defensive clear is usually a one-touch pass out of the defensive 3rd of the field
and often times there is no specific target to the pass.
Direct Pass: A pass that travels forward toward the goal being attacked.
Dribble: The controlled movement of the ball by a single player.
F.I.F.A.: Federation Internationale de Football Association
First Defender: The player responsible for applying pressure on the attacking
player who has the ball.
First Touch: The act of controlling the ball after receiving a pass from a teammate
or intercepting a pass from the opposing team.
Forward: This player’s position is more focused on attacking the opponent’s goal
and rarely makes defensive runs into the defending 3rd of the field.
Fullback: This player’s position is more focused on defending their own goal and
rarely makes forward runs into the attacking 3rd of the field.

37Goal: A goal is scored when the whole ball passes over the goal line, between the
goalposts and under the crossbar.
Hand Notation: The act of making a note or writing something down. Used in
this study to define the notational analysis that was done by hand, such as using
pencil/paper or cassette recorder, as opposed to using a computer program.
Immediate Chase: The moment possession of the ball is lost, the nearest player
tries to regain possession or apply pressure on the attacking player who is in possession
of the ball.
Immediate Counter: Once a defensive player wins possession, that player quickly
begins an attack towards goal by dribbling or passing the ball.
Importance Scores: Scores that are given to the end result of a series of technical
and tactical skills performed during a game. The importance scores will be the slope of
the Binary Logistic Model regression line for each technical and tactical skill evaluated.
The greater the importance score, or slope of the regression line, the more important that
skill is in scoring goals.
Indirect Pass: A pass that travels sideways or backward from the goal being
attacked.
N.C.A.A.: The National Collegiate Athletic Association.
N.S.C.A.A.: The National Soccer Coaches of America Association.
Midfielders: A player’s position in which she would stay central on the field in
order to support the forwards when attacking the goal or the fullbacks in defending their
goal.

38
Pass: The controlled movement of the ball from one player to another on the
same team. This includes short passes (2-15 yards) on the ground and long passes (15-40
yards) in the air. In this study a pass will also include throw-ins, corner kicks, goal kicks,
and crosses.
Penetrating Play: A ball passed or dribbled into the space behind the defense and
toward the goal being attacked.
Performance Score: Rating given to each skill once it is performed during the
game. The performance scores range from 0 to 7 for passing, 0 to 4 for dribbling, 0 to 5
for first touches, and 0 to 8 for individual defense.
Pitch: The field on which the game is played.
Possession: One team or player controls the ball through passing and dribbling.
Prior Slope: An educated estimate of the importance scores for each technical and
tactical skill evaluated. The prior slope combined with the data at hand is the Bayesian
approach to creating a more robust regression model.
Scoring Opportunity: When a ball is shot on goal, but is saved by the goalkeeper,
intercepted by the opposing team, or deflected wide of the goal.
Series: A succession of offensive and defensive touches occurring between a goal
and the next goal, a shot on goal and the next shot on goal, or any combination of
outcomes.
Set Play: Receiving a direct or indirect free play as a result of the opposing team
violating the rules of the game.

39 Shot on Goal: The act of directing the ball toward the goal. The shot must be on
the frame of the goal, thus if the keeper or defense doesn’t stop the ball then a goal is
awarded.
Success: Success can be either direct or indirect. Direct success is when a goal is
scored. Indirect success is a scoring opportunity, such as a shot on goal.
Tactics: Team patterns or strategies.
Techniques: The single play of the ball.
Delimitations
1. The data will be collected on the Brigham Young University (BYU) Women’s
Division I Soccer team during regular season competitive play.
2. The study will evaluate only the performance of a pass, dribble, and first touch
of the individual in control of the ball, and the individual tactic of the first defender.
3. All data will be collected by the investigator. As a licensed coach through the
United States Soccer Federation, the investigator has a good understanding of the
accurate identification of soccer techniques and tactics. Furthermore, she is a member of
the Brigham Young University Women’s soccer coaching staff, and thus familiar with
the players being analyzed.
4. The primary purpose of this study is to develop a notational analysis that is a
reliable and valid method to evaluate offensive techniques and defensive tactics in soccer.
Practice time, previous playing experience, player fitness level, improvement of skill as
the competitive season progresses, and many other conditions will affect performance
scores during the game. However, these different conditions could be addressed in future
studies, once the notational analysis system has been established.

40 Basic Assumption
It is possible to systematically evaluate the performance of these three techniques
and one tactic in soccer, and to develop a valid statistical system that will predict soccer
success.
Limitations
1. The BYU women’s soccer home games will be held in Provo, Utah, at the
South Stadium. Home games were chosen to control for variability in field size, turf, and
environmental conditions.
2. All games are played outdoors and are thus subject to the weather. Weather,
such as rain or wind, can affect the player’s first touch, dribble, passes, and shot on goals.
However, there was only light rain in one of the 10 home games taped.
3. Soccer traditionally is not a high scoring sport, thus, the analysis of 10 games
may not provide enough data to define the relationship between the skills and scoring.
Therefore, both teams, home and visiting, will be analyzed and thus, improving sampling
distribution.

41 Chapter 2
Review of Literature
For this study, the literature regarding hand notational analysis of soccer will be
reviewed. The review of literature includes five areas of interest: (a) historical
perspective of notational analysis, (b) a description of notational analysis in other sports,
(c) notational analysis of movement in men’s soccer, (d) notational analysis of patterns of
play in men’s soccer, and (e) notational analysis in women’s soccer.
Historical Perspective of Notational Analysis
Currently, various notational systems are used to describe movement and playing
patterns in dance and sports. This section describes a brief history of notational analysis.
The earliest publication in sport notation is by Fullerton (1912), who explored the
combinations of baseball players batting, pitching, fielding, and the probabilities of
success. The first attempt to devise a notation system specifically for sport analysis may
have been Messersmith and Bucher (1939), who attempted to notate distance covered by
specific basketball players during a game. Messersmith led a research group that initially
explored movement in basketball, but also analyzed American football and field hockey.
The first publication of a comprehensive racquet sport notation system was by
Downey (1973), who developed a system to notate tennis matches. The detail in
Downey’s notation system was so intricate that not only did it permit notation of such
variables as shots used and positions, but it also accounted for the type of spin used in a
particular tennis shot. Downey’s notational system served as the basis for the
development of systems in other racquet sports, such as badminton and squash.

42
Notation systems have been applied to virtually all sporting situations, such as
tennis, squash, soccer, netball, field hockey, rugby union, badminton, basketball, and
volleyball. Each system is unique in purpose and its methodology is specific to that
purpose. It would be exhaustive to describe each and every notational system published.
Furthermore, it is impossible to obtain a comprehensive review of literature on all the
notational systems in use since many were never published.
A Description of Notational Analysis in Other Sports
This section highlights the few studies that have examined the relationship
between the efficiency of selected variables and the success (winning) of teams.
Coleman (1975) statistically evaluated different variables in the final round of the
1974 Men’s World Volleyball Championships. Coleman evaluated the serve, pass, set,
attack, block, and dig. Serves were evaluated from an ace to a service error (scored from
5 to 0). Passes were evaluated from a service ace to an ideal pass (scored from 0 to 5).
Sets were evaluated on the quality of the set for the spiker (scored from 0 to 4). Attackers
were evaluated on the credit for attack, kill, or error (scored from 0 to 4). Blocks were
evaluated on an error, no touch, any block, touch by block resulting in free play, and
spike killed (scored from 5 to 0). Digs were evaluated from an ideal backcourt pass off
the block to a ball killed in defender’s zone of responsibility (scored from 4 to 0).
Information from a game was recorded using a portable cassette tape recorder during the
match and later tabulated from the tapes. The data were tested statistically for (a) the
reliability of the evaluation procedure, (b) the calculation of performance levels for each
technique, (c) the determination of relationships between the techniques and the overall
performance of the team, and (d) the determination of the validity of the evaluation

43 systems. Coleman found a difference between the performance levels of the top teams
and the weaker teams. In addition, sequential analysis showed that good plays tend to
lead to other good plays. Furthermore, there was a relationship between the performance
levels for the various techniques and the final finish order in the tournament. Coleman’s
study showed that differences in technique scores were good predictors of victory.
Marques (1990) developed a notational system that related game performance
indicators with the success of basketball teams. Performance indicators were separated
into two categories: technical indicators, such as missed shots, and offensive and
defensive rebounds; and tactical indicators, such as fast-breaks and possession. First,
Marques evaluated teams with and without success, finding differences in the percentage
of offensive and defensive rebounds and in second shots. He reported that winning teams
shoot more often, are more efficient in shooting, fast-break more often, and get more
offensive and defensive rebounds. Second, Marques analyzed equilibrate games (two-
point or less difference in final score), normal games (three to ten points difference in
final score), and games with large differences (more than ten points difference is final
score) for significant differences in the frequency of performance indicators. He found
that differences between the frequency of shots, fast-breaks, and rebounds were more
relevant in games with large differences in scores. In normal games, differences in
frequency of two-point shots and fast-breaks were not as relevant. In equilibrate games,
there were no large differences in the indicators studied. Marques used univariate
analysis, which only allowed one variable of one group to be compared to the same
variable of the other group. Thus, a multivariate analysis, which is considered more
powerful, could be used to compare groups of different performance levels.

44 Mendes and Janeira (2001) identified the performance indicators that discriminate
between winning and losing basketball teams. The data were collected on 70 games of the
first 12 rounds in the 1995/1996 Portuguese professional basketball season. Indicators
included total assists, scored assists, fouls, interceptions, two-point shots, three-point
shots, free throws, ball steals, defensive rebounds, offensive rebounds, total rebounds,
second shots and turnovers. Mendes and Janeira examined three different game
outcomes: (a) the totality of the games, (b) games with the differences in the final score
of less than ten points, and (c) games with final score margins of ten or more points. The
mean and standard deviations were calculated. They used t test with independent
measures to compare the dependent variables of the two groups (winners and losers), and
then applied MANOVA and discriminate analysis to find the smallest group of variables
which could classify teams into their real groups. Finally, they used the “Jacknife”
technique to reclassify the groups. The significance level was 0.05. The results from the
multivariate study of the game performance indicators showed in all analyses the
discriminatory power of defensive rebounds. In games with differences in final score
greater than ten points, the percentage of two-point shots showed a high discriminant
power. In games where final scores differed by less than ten points, the fouls, assists, and
defensive rebounds all seem to discriminate winning from losing teams.
Competition seems to be the most appropriate moment to evaluate performance of
various skills, and the outcome of the game becomes the criterion to judge the quality of
players or teams. All three studies of the above support the premise that the greater the
efficiency of the performance indicators, the more likely the team will be successful in
winning the game.

45 Notational Analysis of Movement in Men’s Soccer
This section discusses the methods and technique of notation analysis in
examining the physiological demands and the various activities of men’s soccer.
Typically, notation analysis examines movement in soccer in two ways: (a) the distance
covered by an individual during a game, and (b) the discrete activities performed during a
game.
One of the first to systematically analyze the game of soccer was Walter
Winterbottom. He was the manager of the English national team, FA Director of
Coaching from 1946 to 1962, and had a background in physical education. He studied
professional soccer players during a match by tracking their movements on a scale plan
of the field. Winterbottom estimated that the players covered an average distance of 3,361
m (Winterbottom, 1959).
Reilly and Thomas (1976) recorded and analyzed the intensity and extent of
discrete activities during a soccer match. They combined hand-written notation with the
tape-recorded analysis of the match to analyze the detailed movements of English First
Division soccer players. To estimate the distance covered, the authors used a scale plan
of the field. Observations were made from an elevated position in the stands. Reilly and
Thomas reported the frequency and duration of time in the following movement patterns:
walking, backing, and running. Running was further divided according to intensity into
jogging, cruising (running with manifest purpose and effort), and sprinting. To estimate
the distance covered by the players, a number of cues on the playing field and its
boundaries were used. In addition, a field was drawn and superimposed with a grid of
pre-determined distances. Work rate was estimated from the overall distance covered by

46 midfielders, forwards, fullbacks, center defenders, and goalkeepers. Reilly and Thomas
reported that the mean overall distance traveled during competition was 8,680 ± 1,011 m.
Of this, 36.8 % was covered jogging, 24.8% walking, 20.5% cruising, 11.2 % sprinting
and 6.7% backing. They also found that a player is typically in possession of the ball less
than 2% of the game. Finally, center defenders covered significantly less distance than
forwards and midfielders. Midfielders covered significantly more distance than forwards
and fullbacks. There was no significant difference between the distance covered by
fullbacks and center defenders. The study by Reilly and Thomas has become the standard
against which other similar research projects can compare their results and procedures.
Withers, Maricic, Wasilewski, and Kelly (1982) determined the movement
patterns of soccer field players. Fifteen male players (characteristics not available) were
filmed separately for one complete game. The camera was placed at an elevated position
in the stands. Videotapes were then replayed and coded for walking, jogging, striding,
sprinting, walking backwards, jogging backwards, moving sideways, and traveling with
the ball. The overall mean-stride lengths for the seven types of movement were 0.82,
1.36, 1.75, 1.76, 1.25, 0.78, and 1.10 m, respectively. Individual stride lengths were then
used to compute the distances covered. Withers et al. reported that players traveled an
overall distance of 11,527 ± 1,796 m, walking distance of 3,026 ± 533 m, jogging
distance of 5,140 ± 1,440 m, striding and sprinting distance of 2,172 ± 798 m, walking
backwards distance of 590 ± 271 m, jogging backwards distance of 285 ± 239 m,
sideways moving distance of 316 ± 135 m, and traveling with the ball for 218 ± 101 m.
None of the variables observed were significantly different between the following

47 positions: 5 fullbacks, 5 central defenders, 5 midfielders, and 5 forwards. Furthermore,
there was no significant difference between player position and the time of high intensity
work intervals (striding and sprinting). However, closer examination of Withers et al.’s
results suggests that there are some positional differences. For instance, the mean
distance covered in high intensity activities did not differ between positions, however,
center defenders (399) performed the least number of high intensity activities compared
to the midfielders (551) and fullbacks (552). Furthermore, center defenders spent a mean
of 70.3 seconds in low intensity work intervals compared to the midfielders (45.4
seconds), fullbacks (44.6 seconds), and forwards (55.5 seconds). The ratios for high
intensity to low intensity work times suggest that there are differences between positions.
Withers et al. reported a high intensity/low intensity ratio of 1:9 for center defenders and
fullbacks compared to the midfielders who worked at a ratio of 1:3.1. Although Withers
et al. concluded that there was not enough evidence to warrant position specific
conditioning during training, there appears to be some observational difference between
players’ positions.
Mayhew and Wenger (1985) calculated the time spent by three professional
soccer field players (characteristics not available) in different match-play activities. Two
players were video filmed for three games and the other one for two games. In a single
game, two players were alternatively filmed for 7 minutes. In any one game, a player
was followed for a minimum of 42 minutes. There was no indication of how the camera
was positioned. Match-play activities were classified as standing, walking, jogging,
running (combined sprinting and striding), and utility (combined backwards running,
shuffling and jumping). With the aide of a specially designed computer program, the

48 time spent in each activity, the number of times each activity occurred, the mean time
spent per shift in each activity, and the percentage of total time spent in each activity was
estimated. Mayhem and Wenger reported that soccer players spent 2.3% of the total time
standing, 46.4 % walking, 38.0% jogging, 11.0 % running, and 2.0% performing utility
movements. They concluded 88% of the game time was spent in activities that were
primarily aerobic in nature. The remaining 12% of the game time was spent in activities
that would primarily stress the anaerobic energy supply system. Mayhem and Wenger
reported a 1:7 high to low intensity activity ratio. They concluded that training programs
should be designed to improve the performance of aerobic systems under conditions that
mimic game activity
Van Gool, Van Gerven, and Boutmans (1988) determined the physiological load
imposed on seven male soccer field players (age = 19-23 years) under real match-play
conditions. They observed players of the Belgian University team. A complete soccer
game was filmed using a 16 mm camera with a film speed of five frames per second (fs).
The camera was positioned so that the entire field was recorded and all players on the
field were observed during the same game. The film was projected on a “x-y” coordinate
system and was analyzed using a digitizing program. Thus, all players were positioned
and the distance between two successive points was calculated using the formula:
D = SQRT[(x1 – x2)2 + (y1 – y2)2]
Movement of each player was categorized according to low intensity (standing and
walking), medium intensity (jogging), and high intensity (cruising and sprinting). Heart
rate was recorded during the game. All of the subjects also performed a maximal exercise
test on a treadmill to exhaustion. Van Gool et al. found that 42.9% of the total distance
49 was covered by low intensity activities, 42.6% by medium intensity, and 7.5% by high
intensity. Furthermore, they found that the players performed, on average, at 86.7% of
their maximal heart rate in the first half and 84.4% of their maximal heart rate in the
second half. Van Gool et al. also observed that players were working at about 75% of
their maximal aerobic capacity during a game. The physiological measurements suggest
that the mean training intensity should be high (approximately 75% of VO2 max) to
prepare players for game conditions.
Using the methods similar to Mayhew and Wenger (1985), Treadwell (1988)
outlined time-motion analysis of four collegiate matches and one professional soccer
match in South Wales. The games were filmed from a scaffolding platform 6 m above
ground. A light weight camera was used to track players. The data were collected from
the videotapes using a micro computer with a modified game port. Players were grouped
according to the position being analyzed. Four movement patterns were identified: non-
purposive rest, purposive running, sprinting, and running with the ball. Each movement
pattern was grouped into accumulating 0-5 second periods and displayed in a graph.
Other physically demanding variables such as tackles, jumps, controls, and shots were
collated using a simple count mechanism. Using the Tukey test, Treadwell found that
there was a significant difference between the center defenders and midfielders, the
forwards and midfielders, and between the fullbacks and midfielders for non-purposive
rest. There was a significant difference between midfielders and center defenders,
midfielders and forwards, and between midfielders and fullbacks in the purposive
running category. Thus, midfielders spent less time in non-purposive running, but more
time in purposive running. Finally, Treadwell reported significant differences between

50 the center defenders’ ‘time with the ball’ movement and the other three outfield positions.
Information gained from Treadwell’s study can be used to help coaches plan training
programs for players in set positions in soccer.
Bangsbo, Norregaard, and Thorso (1991) studied the movement patterns of 14
male Danish soccer players (age = 16.5 ± 0.9 year; height (ht) = 182.9 ± 1.0 cm; weight
(wt) = 77.5 ± 1.3 kg) filmed during several competitive matches. Filming of soccer
matches was carried out over a 6-week period midway during the second part of the
season. Several videotape recorders, together with cameras, were positioned around the
field. A separate camera filmed each player during at least two complete competitive
matches played on his home ground in the Danish National League. The players had no
knowledge of who was being filmed. The videotapes were replayed and coded for match
activities placed into one of five categories: (a) standing, (b) walking, (c) low intensity
running, (d) high intensity running, and (e) other (heading and tackles). The duration of
each activity was measured and summed, and the frequency of each activity in separate 5-
minute periods was calculated. In addition, blood samples were taken from each subject,
one less than 2 minutes after each competitive match filmed and four during a
noncompetition match. The blood samples were analyzed for lactate by using enzymatic
spectrophotometric methods. Maximum oxygen uptake was determined using a maximal
exercise test on a treadmill. The subjects also completed a continuous field test, which
measured the time required to run four laps of the track (2,160 m). Bangsbo et al.
reported the total distance covered during a match averaged 10,800 m. The mean
distance covered during the first half was 5% longer than during the second half of the
match. The mean distance covered by midfielders (11,400 m) was significantly longer

51 than the distance covered by the fullbacks (10,100 m) or the forwards (10,500 m). They
also found that on average, the players were standing still for 17.1% of the total playing
time, walking for 40.4%, low intensity running for 35.1%, and high intensity running for
8.1% of the total time. When comparing the amount of high intensity exercise between
the three playing positions, no statistically significant differences were found. However,
the larger total distance covered by the midfielders was a result of more low intensity
exercise. In addition, the midfielders stood still for 14.4% of the total time, which was
significantly less than the 21.7% and 17.9% for fullbacks and forwards, respectively.
Furthermore, Bangsbo et al. reported an average lactate concentration of 4.4 mmol l-1.
The mean lactae concentration during the first half of the noncompetition match (4.9
mmol l-1) was higher than the corresponding values in the second half (3.7 mmol l-1). In
addition, they reported that an individual relationship was found between lactate
concentrations and the duration of high speed running and sprint running during the last 5
minutes of play prior to blood samples. Finally, the mean VO2 max averaged 60.6 ml kg-
1 min-1. No difference was found in regard to playing position. Likewise, the running
time in the continuous field test did not differ between playing positions. Bangsbo et al.
concluded that high intensity running can be used for making comparisons in soccer and
that the interpretation of blood lactate concentration in soccer players is limited to giving
an indication of the type of activity that has been carried out a few minutes before
sampling.
Bangsbo and Lindquist (1992) evaluated the distances covered by the Danish
National male soccer field players (age = 24.9 ± 1.3 year; ht = 182.1 ± 1.5 cm; wt = 74.9
± 2.4 kg) during a match.. A separate camera filmed 20 players during at least two

52 complete matches. Using the same technique as Bangsbo, Norregaard, and Thorso
(1991), each videotape was coded for match activities. Eight of the 20 subjects also took
part in all of the following tests:
1. Intermittent endurance test. The test consisted of 46 minutes of intermittent field
running, followed by 14 minutes of rest and, then, intermittent treadmill running
to exhaustion divided in two parts (A and B). The duration of part A was 35
minutes and it consisted of 7 identical intermittent exercise periods. During part B
treadmill speed alternated between 8 km hr-1 (later 12 km hr-1) for 10 seconds and
18 km hr-1 for 15 seconds, which continued until exhaustion. The 46 minute
standard field protocol was composed of an 18-minute warm-up with stretching,
low (6 minutes) and moderate (4 minutes) speed running, the total distance being
1.89 km, and two identical 14-minute periods. The 14-minute periods alternated
between 8 different activities: standing (1:35 minutes), walking (1 minute),
jogging (3:50 minutes), low-speed running (3:15 minutes), backwards running
(0:20 minutes), moderate speed running (2:55 minutes), high speed running (0:35
minutes), and sprint running (0:30 minutes). The total distance covered during
the 46 minutes was 6,856 m. Exhaustion was defined as the point where the
subject was no longer able to exercise for 15 seconds at high intensity. Expired air
was regularly collected during the treadmill running.
2. Treadmill tests. One of the treadmill tests consisted of five 6-minute exercise
bouts and one 3.5-minute bout on a motor driven treadmill. The exercise bouts
were separated by rest periods with progressively increased duration (2-5
minutes). Treadmill speeds were 6, 8, 12, 15, 16.5, and 18 km•hr-1. After a 10-

53 minute rest period the subjects completed a maximal exercise test. The initial
treadmill speed was 18 km hr-1, which increased 2 km hr-1 every 2 minutes until
exhaustion. High-intensity distance was defined as the largest distance covered by
moderate-speed running, high-speed running, and sprint running. In addition to
the aforementioned test, the eight subjects performed an interval treadmill test on
a different day. This test consisted of a 5:50 minutes exercise period in which the
treadmill speed systematically alternated between 8 km hr-1 for 10 seconds and a
higher speed for 15 seconds. The high speed was increased from one exercise
period to the next, starting with 10 km hr-1 and then 12, 15, 16.5, 18, 20, 22
km hr-1 and ending with, if possible, 24 km hr-1. Blood samples were obtained
through a catheter of the antecubital vein immediately after each of the exercise
bouts. Oxygen uptake was measured during the last two minutes of the
submaximal exercise bouts and continuously during the maximal test.
3. Field tests. The eight subjects and an additional six players performed an interval
field test. The duration of the test was 16.5 minutes. Players alternated between
high- and low-intensity exercise for 15 and 10 seconds, respectively. The test
started with high intensity exercise. The players followed the outlined route
during the high-intensity exercise periods, which consisted of forward running (40
m), backwards running (8.25 m), forward running (95.25 m), and side-stepping
with front away from (8.25 m) and against the center (8.25 m). During the low-
intensity periods the players jogged to the center and back to the stop-position.
In addition, the 14 players performed a continuous field test, which was a measure

54
of the time required to run four laps of a track (2,160 m). Immediately after the
tests, a finger tip blood sample was obtained.
4. Analysis. Expiratory gas was collected in Douglas bags and then measured with a
Tissot spirometer. Blood samples were analyzed for lactate by enzymatic
spectrophotmetric methods. In the middle of the experimental period (six weeks),
a muscle biopsy was taken from the medial gastrocnemius of the eight players.
The biopsies were histochemical stained for myofibrillar ATPase activity. In
addition, citrate synthase and hydroxyacyl-CoA were determined using
fluorometric methods.
Bangsbo and Lindquist reported mean match distance was 10,980 m, of which the high-
intensity distance accounted for 19%. Furthermore, they found significant correlations
between match distance and the continuous field test (r = -0.68), VO2 corresponding to 3
mmol l-1 lactate in the blood during the continuous treadmill test (r = 0.58), and V02 max
(r = 0.64). In addition, the interval field test was significantly correlated with the
intermittent endurance test distance (r = 0.83), continuous field test (r = - 0.78), and VO2
corresponding to 3 mmol l-1 lactate in the blood during the continuous treadmill test (r =
.69). Citrate synthase was significantly correlated with the continuous field test (r = -
0.81) and VO2 max (r = -0.84). Bangsbo and Lindquist concluded that since there was a
lack of correlation between the distance covered during the prolonged, intermittent test
and performance during a match, then players’ do not fully utilize this capacity during the
match. Further, muscle characteristics, VO2max, and blood lactate do not seem to be
sensitive measures of physical performance in soccer.

55 Notation analysis has been used to describe the physical demands of soccer.
Overall, data has been collected via a scaled plan of the field or a specifically designed
commuter program. In addition, video recording of games was valuable in collecting
data to be analyzed at a later time. How the camera was positioned in relation to the field
was consistent among the studies. It appears that the best camera position allows the
researcher to see all players on the field during the game. Aside from the notational
method and camera position, previous studies provide a great deal of information on the
physiological demands during a soccer game. However, information regarding the
physiological demands of soccer is not pertinent to the development of a new notational
system in this project.
Notational Analysis of Patterns of Play in Men’s Soccer
Notational analysis has also been used to examine the technical and tactical
aspects of a soccer match. The patterns of play analysis aims to (a) measure the team’s
effectiveness through counting scoring opportunities, (b) measure the types of attacks and
their efficiency in creating a scoring opportunity, (c) gain more knowledge of the match
trends in general, and (d) to have a quantitative and qualitative analysis of each player.
Reep and Benjamin (1968) used an alternative approach to match analysis with
data from 3,213 World Cup and English Premier League matches between 1953 and
1968. They were concerned with techniques such as passing and shooting rather than
work rates of individual players. A successful passing series (r-pass) was defined as one
in which a player from side A, having just obtained the ball, sets off a series of r
successful passes among members of his own team after which there is either a shot or
goal by the rth recipient, or an infringement, or there is an attempted (r+1)th pass which

56 is intercepted. Thus, r equals the number of consecutive passes. Subsequently, a 0-pass
means that A’s first attempted pass is intercepted or that there is a shot at goal without a
preceding pass (i.e. penalty kick). Reep and Benjamin defined two factors that affect the
likelihood of a successful rth pass:
1. The position of the players between whom the pass is attempted and the
defending players who try to intercept;
2. The relative skills of the players and the effectiveness and confidence with
which those skills are applied at this particular stage of the game.
Thus, the probability of an r-pass movement is P(r) = [p1.p2. … .pj. … .pr(1-pr+1)] where
p1>p2>p3….pr>pr+1. Reep and Benjamin theorized that p1 would be fairly high and pr to
fall rapidly to some low value beyond which there is little further decrease. To test this
theory, they complied careful records of actual frequencies of passing moves. Reep and
Benjamin found that generally pr declines as r increases. At higher values of r when
numbers are smaller the ratios {P(r-1)}/{P(r-2)} becomes irregular and produces even
greater irregularity in pr. Furthermore, Reep and Benjamin reported that 80% of goals
resulted from a sequence of ≤ 3 passes, 50% of all goals come from possession gained in
the final attacking quarter of the field, and 30% of regained possessions lead to shots at
goal. Finally, Reep and Benjamin showed that it takes 10 shots to score 1 goal.
Although, findings from this study do not guarantee that excess of shots by one team will
result in more goals and thus win the match, it does show a successful style of play.
Bate (1988) examined factors, such as possession, play in the scoring area, and
number of passes, that lead to the creation of chances and goals within the soccer game.

57 Using the methodology for data collection and analysis of goal scoring by Reep and
Benjamin (1968), Bate identified several factors leading to scoring opportunities, which
became the basis of defensive and attacking strategy in English Premier and international
soccer games. These factors include:
1. The critical scoring area. Goals are not scored unless the attacking team gets the
ball and one or more attacking players into the attacking 3rd of the field.
2. The number of possessions. The higher the number of possessions one team
generated, the greater number of opportunities to enter into the attacking 3rd of
the field.
3. Entry into the critical scoring area. Entry into the attacking 3rd of the field is the
key factor in scoring goals and consequently, winning matches. Bate reported
50%-60% of all movements leading to shots and goals originated in the attacking
3rd of the field.
4. The number of passes in a possession. The higher the number of passes in any
one possession the lower the total number of possessions for that team. For
instance, the longer one team holds possession, the lower the number of
possession exchanges. Furthermore, the longer one team holds possession
through higher number of passes, the lower the number of total potential entries
into the attacking 3rd, and subsequently, the chance of gaining a shooting
opportunity and scoring a goal diminishes. Bate reported that altogether 79% of
the goals were scored from movements of 4 or less passes. In addition, he found
that almost half the goals (48%) came from 0 to 1 pass movements that followed
an interception of the ball, a free kick, or a run at the goal. Increasing the time of

58
possession through passing can be classified as a stalling technique, used when
the team is ahead in a game. Furthermore, if the aim is to create scoring
opportunities, then the ball must move quickly up the field to take advantage of an
unorganized defense. Increasing the number of passes in a series allows time for
the defense to get numbers back and organize against the attack.
5. Frequency of attacks. The greater the number of entries into the attacking 3rd
leads to four factors that affect the team winning a game. First, increasing the
number of entries into the attacking 3rd of the field resulted in a greater chance of
earning set plays in that area. Bate reported that 46 % of the goals scored were
from set plays, such as corner kicks, free kicks, throw-ins, and penalties. Second,
greater number of entries into the attacking 3rd of the field led to a greater chance
of regaining possession of the ball in the attacking 3rd. Bate stated that to
concede possession in the attacking 3rd and to make no attempt to regain the ball
in that area reduced the number of shots and goals that a team had in any one
game. He further reported that regaining the ball in the attacking 3rd of the field
resulted in 10%-20% of the goals. Third, opportunities for a shot on goal were
created by increasing the number of entries into the attacking 3rd of the field.
Finally, by continually moving the ball into the attacking 3rd of the field, the team
did, in fact, decrease the number of times the ball entered into their defensive 3rd.
Bate observed that in order to increase the number of scoring opportunities, a team
needed to (a) play the ball forward as often as possible, (b) reduce square and back passes
to a minimum (c) increase the number of long passes forward and forward runs with the

59 ball, and (d) play the ball into open space into the attacking 3rd of the field as often as
possible. These factors are generally accepted and implemented in coaching strategies.
Chervenjakov and Dimitrov (1988) designed a systematic approach to collecting
data on playing activities of individual players and the team as a whole. A code was
created for recording the 14 parameters for each player of a given team. These parameters
were: total number of ball contacts (L); number of correctly played balls (P); number of
tackles and correctly played balls (O); number of cleared balls or tackles, but incorrectly
played balls (I); number of shots off target (A); number of shots on goal (S); number of
violations of the rules/faults (F); yellow card (Y); red card (R); grant for attacking play
(BN); grant for defensive play (BZ); fair play (C); goals scored (G); and conceded goals
(-G). Coding was recorded directly into a computer or Dictaphone while watching a live
or taped game. This was possible because the researcher had memorized the parameters
and could distinguish the players, even when unable to see their numbers. Based on these
parameters, six mathematical models were developed allowing the differentiation of the
effectiveness of each player and the team. The models for an individual player i, with
summations made over each member of the team with n = 11, are as follows:
1. Coefficient for activity (KA):
KALL
whereLL
nii i= =
∑, , i = 1 to n
This coefficient is based on the reasoning that a higher level of physical
fitness results in more opportunities for the player to be in possession of the
ball.

60
2. Coefficient for correctness (KT):
KTPL
T whereT
PL
nii
i
i
i= = =∑
, , i = 1 to n
The logic is that the better one’s technical preparation, the higher his ability to
play with the ball correctly.
3. Coefficient for attacking play/tactics (KN):
( )KN
P A S BNN
whereNP A S BN
nii i i i i i i i=+ + ×
=+ + ×∑3 3
,
4. Coefficient for defensive play/tactics (KZ):
( )KZ
P O S BZZ
whereZP O S BZ
nii i i i i i i=+ + ×
=+ + × i∑2 3 2 3
,
5. Coefficient for fair play/ behavior (KP):
( )KP
C F Y RP
wherePC F Y
nii i i i i i i=
+ − − −=
+ − − − Ri∑1 01 0 02 01 1 01 0 02 01. . .,
. . .
6. Total coefficient for classifying every player according to his effectiveness
during competition (KE):
KEKA KT KN KZ KP
ii i i i=+ + i+ +
5
Using these six models of playing activity, a mark of ‘1’ reflected a mean level of
effectiveness. Marks above 1 reflected an increased effectiveness in the given aspect of
the play, and the marks below 1 reflected decrease effectiveness. Chervenjakov and
Dimitrov weighted each factor on the basis of the opinions of a panel of experts whose
members were coaches of the first and second soccer divisions in Bulgaria at the time.

61 Although, they stated that this notational technique has been subject to different forms of
statistical treatment, such as correlation analysis and factor analysis, no references were
given or could be found.
Harris and Reilly (1988) focused their evaluation on the configuration of players
around the point of action (ball) and the overall success of each attacking sequence. This
was a considerable departure from many of the systems previously mentioned, which
have tended to break each sequence into discrete actions. First, Harris and Reilly
examined the attacking potential by measuring the start and end of each unit of play,
which reflected an individual’s contribution to the attack while possessing the ball. The
unit of play began when the attacker tried to make contact with the ball and ended when
his contribution to the attack is known. Thus, each attack consisted of one or more units
of play, during each of which one player had possession. Furthermore, the attacker’s
contribution to the attack can be categorized as successful (shot on target), intermediate
(shot off target), or unsuccessful (no shot). A configuration index (CI) was then proposed,
which described the ratio of attackers (A) to defenders (D) in particular instances, while
simultaneously assessing the space between a defender and an attacker in possession of
the ball. The formula adopted was:
CI A DD
D= − + −⎡⎣⎢
⎤⎦⎥
( )( )
( )1211
611
3
Second, Harris and Reilly examined the attackers’ available space. The distance (m)
between the nearest pressurizing defender and the attacker in possession of the ball was
calculated at the moment the ball was received. Distances were measured using reference
cues on the field of play. Harris and Reilly videotaped and analyzed 24 European clubs
and national men soccer matches. Altogether 180 attacks, spread equally between the

62 three hierarchical success categories, were monitored. A one-way analysis of variance
was performed to determine differences between the levels of attacking success for each
unit of play and space availability. Harris and Reilly found that on average each attack
contained 5.3 units of play. For the attack as a whole, the configuration indices (CI) were
significantly higher in successful attacks than for the failures. Results for the space
available to attackers during a whole attack indicated that more shooting opportunities
arose when the distance between the attacker in possession and the nearest defender
increased. Harris and Reilly conclude that teamwork and the use of space on the field
contribute to the success of attacking moves in soccer.
Pollard, Reep, and Hartley (1988) used Reep and Benjamin’s (1968) method of
notation in order to quantitatively assess determinants and consequences of different
styles of play. Data were obtained from two sets of matches: 32 games from the 1982
World Cup in Spain and 42 from the First Division of the Football League in England.
Pollard et al. suggested that elaborate styles of soccer play relied on multi-pass sequences
of possession and that direct styles of play relied on long forward passes and long goal
clearances. In addition, they found no relationship between the degree of elaborate style
and the use of the width of the field. Pollard et al. concluded that it was important for the
coach to develop a style profile of each opponent for future analysis by using this type of
quantitative assessment of playing style.
A notation system developed by Ali (1988) recorded 13 basic factors of a soccer
game: dribbling, short pass, long pass, goal, offside, shot on target, ball intercepted by
goalkeeper, header on target, header off target, intercepted short pass, intercepted long
pass, shot off target, and the position of the restarts. The system attempted to define

63 specific and identifiable patterns of attack and how successful each pattern was in
influencing the results of the match. Ali considered only sequences in the attacking half
of the field. These patterns were recorded on the prepared pitch diagram in graphic form.
The data were entered into a computer in terms of X and Y coordinates on the pitch
diagram and compared in relation to pattern and constituent. Each attack was analyzed in
terms of one of the nine possible final outcomes: (a) goal, (b) shot on target, (c) shot off
target, (d) lost possession, (e) corner-kick, (f) throw-in, (g) offside, (h) penalty, and (i)
free kick. Ali identified seven major types of patterns that resulted in a number of attacks.
Of those seven, Ali concluded that attacking patterns proceeding along the length of the
wing were more successful than those through the center. Using chi-square test, he also
reported a significant positive relationship between the final actions and the number of
long passes. Long passes represents the penetration into the opposition territory and thus,
an attack can be launched quickly through the use of long passes, catching the defenses
out of position. However, Ali found that a greater number of the long passes within a
single move were more likely to end in offside, suggesting that the use of long balls
required an understanding of the game and fundamental skills. Ali also reported that the
types of patterns were related to the number of short passes and dribbling sections. He
concluded that using a combination of long and short passes within these patterns may
help maintain possession and further suggested that it gives the team an advantage in
scoring and shooting opportunities.
Partridge and Franks (1989a, 1989b) examined the crossing pass or the ‘cross’ as
a key factor for successful soccer performance. Videotapes from the 1986 World Cup
Finals in Mexico City were analyzed. The opportunity to cross was defined by the player
64 crossing the ball must have been in the attacking third of the field and wide of the penalty
area, at the time the ball was crossed there must have been at least one attacker in the
central area, and the player with the ball must have been able to make the cross
unimpeded by defenders. The cross was not considered if it originated directly from a
corner or throw-in. Once the opportunity to cross was established, the following aspects
of the cross was examined: (a) build up, (b) area of the build up, (c) area from which the
cross was taken, (d) type of cross, (e) player positions and movements, (f) specific result
of the cross, and (g) general result, if the opportunity to cross was not taken. Furthermore,
three categories of events, free play, set play, and regained possession, were identified as
possible events leading up to the crossing opportunity A computer-assisted system was
specifically to record and store information into a database. Partridge and Franks found
five “Key Factors” of successful performance in crossing:
1. Take the opportunity to cross if a target player can contact the cross and you
have the chance to play the ball behind defenders and eliminate the
goalkeeper. Partridge and Franks reported that nearly 25% of the
opportunities to cross were not taken. Of those not taken, 42% resulted in
possession being lost within two moves of the opportunity. They found that
40% of the crossing opportunities never entered into the penalty area. This
figure becomes even more significant since Partridge and Franks reported that
85% of the goals scored in the 1986 World Cup were from inside the penalty
area.
2. Play the cross first time where possible past the near post and without loft and
hang time. Partridge and Franks reported that 19 of the 38 goals scored from
65 crosses were the result of crosses played first time. Furthermore, nine goals
were scored from the 61 crosses that were passed past the near post. Finally,
results showed that crosses of the high loft type, ball was played into the back
half of the target area; above head height over the front half of the goal, do not
produce a high rate of success. Of the 278 high lofted crosses taken, only
seven strikes “on target” were produced, which resulted in three goals being
scored.
3. Target players should be in a position to contact the cross by moving to get
goal side of the marking defender, being as direct as possible, and always
making an attempt to contact the ball. Partridge and Franks reported that in 17
of the 38 goals, the player who scored was the sole player making a run on
goal to contact the ball. They observed that these runs were short, sharp
movements to get in front of defenders. Partridge and Franks also suggested
that the attacker must be courageous enough to try and contact all crosses.
Without this, many of the other factors will be nullified and little team success
will be gained.
4. Supporting players should position themselves to seal off the top of the
penalty area and seal off the back post area. Partridge and Franks reported that
there were 41 second contact strikes on goal when the first contact was by a
defender. Of these 24.59% were in the area immediately outside and on the
tope of the penalty box. When the first contact was by an attacker and he tried
to guide it to a teammate, there were 33 second contact strikes, all were either
inside the penalty box or within five yards of the top of it.

66
5. Crosses should not be taken from areas close to the corner flag. Instead, the
crosser should dribble toward goal and either win a corner or get into the
penalty area and cross to a particular player. Partridge and Franks reported
that of the 141 crosses from these areas, only one goal was scored.
Partridge and Franks conclude that there were a number of adaptations, which needed to
be made specific to a crossing practice. They suggested that players relied much more on
short, sharp movement to get in front of defenders with other players supporting the back
post area. The crossers should deliver the ball as early as possible. Finally, crossers
should get the ball in the space ahead of the target, between the defenders and the
goalkeeper, below head height if possible, and with pace. Partridge and Franks have
helped to outline of some practices that will help players understand and perfect their
roles in the successful performance of crossing in soccer.
Pollard and Reep (1997) separated the soccer game into a series of team
possessions and recorded on-the-ball events taking place in selected games from the 1986
World Cup in Mexico. They defined a team possession as when a player gains
possession of the ball by any means other than a pass from a player of the same team.
Furthermore, the player must have control over the ball to be able to have a deliberate
influence on its direction. Team possession continues until (a) the ball goes out of play,
(b) the ball touches a player of the opposing team, with the exception of a momentary
touch that does not significantly change the direction, and (c) an infringement of the rules
takes place. Each team possession consisted of several components, such as a long
forward pass hit from midfield. The components were then assessed based on their
relationship with the outcome of each team possession. Possible outcomes were goals,

67 shots, weighted shots, and yield. The outcome variable for shots was assigned a value 0
if the team possession failed to produce a shot and a value of p if a shot resulted, p being
the estimated probability that the shot would score. An estimate for p was derived from
the results of a logistic regression analysis based on the team possessions that resulted in
a shot. For the yield, each team possession was first classified by two variables: the zone
of origin and the type of possession. To define the zone of origin, the field was divided
into six zones. Furthermore, the analysis of shots suggested that the probability of scoring
depended on whether or not the possession originated as a set play or in open play, this
binary information being represented by “type of possession”. Thus, for possession of
type j starting in zone I, the probability of scoring a goal could be estimated by
PP
nijijk
ijk
nij
==∑
1
where i = 1,…, 6 depending on the zone, j = 1 (open play) or j = 2 (set play), pijk denotes
the kth team possession of type j originating in zone i, and is equal to the estimated
scoring probability p of that possession if it ends in a shot or is otherwise 0. Pollard and
Reep reported an average scoring probability of 0.096, which is consistent with a scoring
ratio of about 1 in 10. In addition, they defined a shooting arc inside the penalty area
from which most goals were scored. The probability of scoring for a shot inside the arc
was 0.189, compared with 0.014 from outside. Further, a binary logistic model was used
to determine the probability of scoring a goal from any combination of the explanatory
variables. The explanatory variables were identified as the distance of the shot from the
goal (x1), the position of the ball relative to the goal (x2), number of touches (x3), the
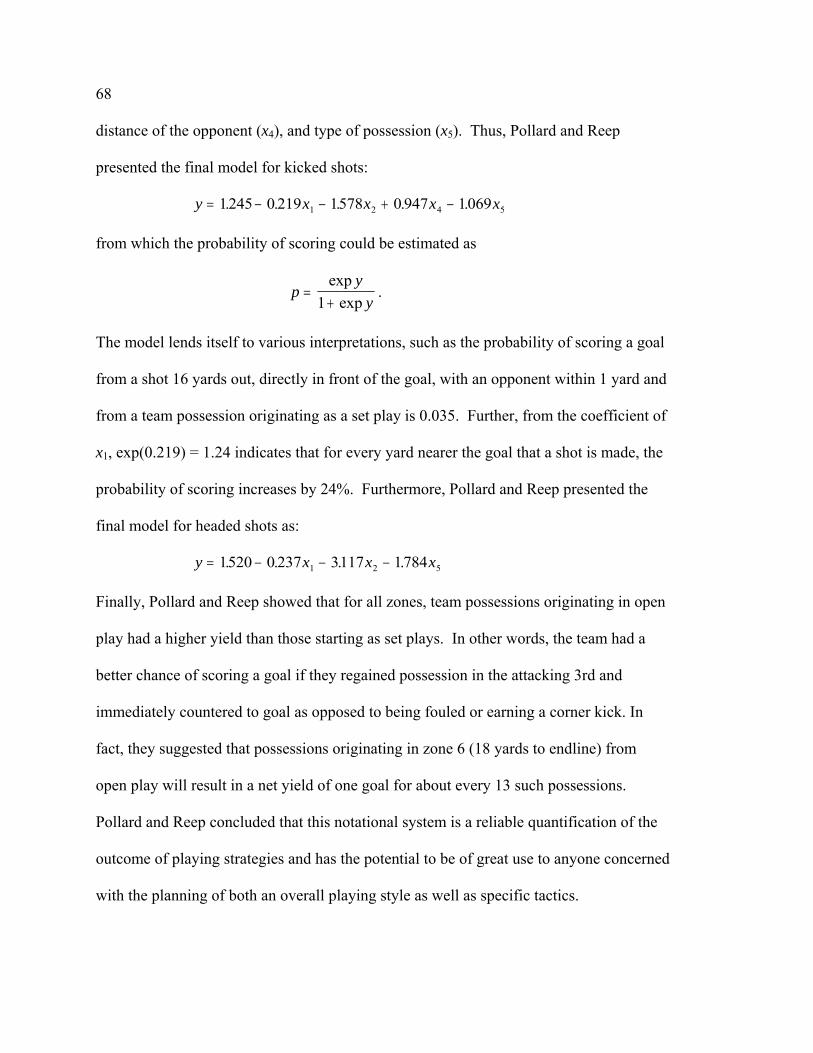
68
x
distance of the opponent (x4), and type of possession (x5). Thus, Pollard and Reep
presented the final model for kicked shots:
y x x x= − − + −1245 0 219 1578 0 947 10691 2 4. . . . . 5
from which the probability of scoring could be estimated as
py
y=
+exp
exp1.
The model lends itself to various interpretations, such as the probability of scoring a goal
from a shot 16 yards out, directly in front of the goal, with an opponent within 1 yard and
from a team possession originating as a set play is 0.035. Further, from the coefficient of
x1, exp(0.219) = 1.24 indicates that for every yard nearer the goal that a shot is made, the
probability of scoring increases by 24%. Furthermore, Pollard and Reep presented the
final model for headed shots as:
y x x= − − x−1520 0 237 3117 17841 2. . . . 5
Finally, Pollard and Reep showed that for all zones, team possessions originating in open
play had a higher yield than those starting as set plays. In other words, the team had a
better chance of scoring a goal if they regained possession in the attacking 3rd and
immediately countered to goal as opposed to being fouled or earning a corner kick. In
fact, they suggested that possessions originating in zone 6 (18 yards to endline) from
open play will result in a net yield of one goal for about every 13 such possessions.
Pollard and Reep concluded that this notational system is a reliable quantification of the
outcome of playing strategies and has the potential to be of great use to anyone concerned
with the planning of both an overall playing style as well as specific tactics.

69 Pettit and Hughes (2001) used a notation system to analyze all the matches from
the 1998 World Cup then entered the notational data into a database. The system was
designed like a flowchart; as each action occurred, the operator inputted the data from
field to field. The system, designed to analyze crossing and shooting, was based on that
used in the study by Partridge and Franks (1989a,b). For example, time was inputted,
then the event that led to the cross, crossed from and to, and so on. If a shot was taken the
data were added; otherwise the process was started again to input the data for the next
cross. Abbreviations were used to help speed up the process of inputting data. All 64
matches from the 1998 World Cup were notated post event over a period of 90 minutes
plus injury time, although extra time and penalty shootouts were omitted from the
analyses. The time the cross occurred, events leading up to the cross, area crossed from,
area crossed to, type of cross, in front or behind the defense, result of cross, and if
applicable, whether or not a pass was made, number of passes in sequence, shot type,
height of shot, direction in relation to goalkeeper, speed and intent of shot, contact,
direction gained possession, outcome and possession were analyzed, which enabled the
frequency of the actions to be recorded. A chi-square test was used as a statistical
process to determine whether difference occurred between the 1986 and 1998 World Cup
Finals.
Notational analysis has been used a variety of ways in order to examine patterns
of play in a soccer match. Each example represents a different way that technical and
tactical variables are treated. Overall, the studies have described the principles of attack
in soccer. Although, some may vary in their views, it appears that winning in soccer is
determined by playing the ball forward as often as possible (direct play), thus entering the

70 attacking 3rd of the pitch as regularly and as accurately as possible. This will create a
greater opportunity for a cross, shot on goal, or set play, all of which have been
associated with an increased chance of scoring. Although these studies provide total
frequency of technical and tactical variables, none address the quality of the touch and its
affect on the scoring opportunities and goals in soccer.
Notational Analysis in Women’s Soccer
Little analysis has been done on women’s soccer. Match analysis of seven
members of an elite Swedish women’s National League squad suggests that the
physiological requirements are similar for both men and women (Ekblom and Aginger,
unpublished data in Davis and Brewer, 1993). The women in this investigation covered
an average of 8,471 m during a game and an average of 14.9 m each time they sprinted.
No studies could be found that examined patterns of play in a women’s soccer game.

71 Chapter 3
Methods
Evaluations for Techniques and Tactics
A basic notational system to evaluate passing, dribbling, first touch and individual
defense has not been developed for soccer. Thus, using the performance scoring system
of Coleman (1975) as a template and the experience of a panel of experts consisting of
soccer coaches and fellow researchers, each technique and tactic was rated based on
possibility of a shot on goal and/or a goal.
Table 1. Performance Scores Based on the Effect of the Pass
Performance Scores for the Pass
Effect of the Pass
The pass results in an immediate loss of possession.
0
The pass results in a 50/50 ball to the opponents.
1
The pass is deflected out of bounds / Player is fouled.
2
The pass results in back play.
3
The pass results in a square play.
4
The pass results in forward (penetrating) play.
5
The pass results in a ball in the “mixer.”
6
The pass results in a scoring opportunity.
7

72 The pass will be evaluated based on the quality of pass to the teammate with little
regard for offensive tactic or the defensive response to the pass. The lowest performance
score is given to a pass that is intercepted by the opposing team or travels out of bounds
thus resulting in a loss of possession. A pass that results in a 50/50 ball is not ideal and
usually results in losing possession or the teammate has no options available. Thus,
50/50 passes include, but are not limited to, defensive clearances, goal kicks, and
goalkeeper punts. A pass will be given a higher performance score if it is deflected out of
bounds by the opposing team and/or the attacking player is fouled during or after the
pass. In addition, the passes will be rated on the player’s ability to promote direct or
indirect play. Finally, the highest performance scores will be given to passes that result
in a scoring opportunity. Table 1 contains the performance scores for various types of
passes.
Table 2. Performance Scores Based on the Effect of the Dribble.
Performance Scores of
the Dribble
Effect of the Dribble
The dribble results in an immediate loss of possession.
0
The dribble results in a deflection out of bounds/ Player is fouled.
1
The dribble is toward own goal or square.
2
The dribble is toward the opponent’s goal (penetrating).
3
The dribble results in a scoring opportunity.
4

73 The dribble will be evaluated based on the result of the dribble. For instance, the
lowest performance score is given when a player attempts to dribble, but instead loses
possession to the opposing team via defensive tackle or the ball goes out of bounds. If
the player is able to dribble and create a scoring opportunity, a greater performance score
will be given. Thus, the player is rated according to what they do with the ball while in
possession. Table 2 contains the performance scores for various results of dribbling.
The first touch will be evaluated in a similar manner as the dribble. When a
player receives a ball from a pass from the teammate or by winning a 50/50 ball the
outcome can vary based on the quality of the first touch. These outcomes are rated from
immediate loss of possession to the scoring of a goal. Although a first time pass is in a
sense the first touch, all one touch passes will be coded using the passing scores.
Table 3. Performance Scores Based on the Effect of the First Touch.
Performance Scores of the First Touch
Effect of the First Touch
0 The first touch results in an immediate loss of possession.
The first touch is deflected out of bounds/ Player is fouled. 1
The first touch results in a back play. 2
The first touch results in a square play. 3
The first touch results in penetrating play. 4
The first touch results in a scoring opportunity. 5

74 However, deflections and 50/50 challenges will be rated according to the first touch
scores. A first touch that is in fact a shot will be rated as a shot. Table 3 contains the
Table 4. Performance Scores Based on the Effects of Defensive Tactics.
Performance Scores of the
Defensive Tactics.
Effect of Defensive Tactics.
Player did not provide immediate chase or chase results in a foul.
0
Challenged a 50/50 ball, but possession is not regained. 1
Challenge but no delay (opponents penetrate) 2
Challenge with delay but the opponents still penetrate. 3
Challenge with delay results in a ball being played indirectly. 4
Challenge results in possession, (indirect play/forced errors out of bounds)
5
Challenge results in possession won, direct play in the defensive 3rd. 6
Challenge results in possession won, direct play in the middle 3rd 7
Challenge results in possession won, direct play in the attacking 3rd. 8
performance scores for various results of the first touches.
An individual’s defensive tactic will be rated according to the opponent’s ability
to move the ball up the field. The lowest performance score is given to the player that
does not provide immediate chase after losing possession, or the chase results in a foul.
The National Soccer Coaches Association of America (NSCAA) states that the

75 immediate chase is the first and primary defensive tactic in the attempt to win possession
(2004). Thus, if a player fails to chase the ball immediately after losing possession then
the opposing team has a greater chance for a scoring opportunity. Higher performance
scores are given to the player based on the quality of the individual’s defensive tactics,
such as whether the player is beat, delays the ball, or wins possession. For instance, if a
player challenges the opposing player in possession of the ball, but is ineffective in
stopping the opposing player from penetrating behind the defensive, then a lower
performance score is awarded than if that player was able to delay the opposing player
from penetrating. Furthermore, a moderate performance score is given when possession is
regained due to an unforced error by the opposing team. Performance scores will vary
based on where the player regains possession of the ball in relation to the field. If a
player regains possession of the ball in the attacking 3rd of the field then there is greater
chance that an offensive counter will result in a scoring opportunity. Possession is
regained when the ball is won directly from a tackle, intercepted pass, or forced errors.
Table 4 contains the performance scores for various outcomes to an individual’s
defensive tactics. Unforced errors, including missed shots, balls passed or lost out of
bounds, poor first touches, or mis-dribbles when the opposing team is under no
immediate pressure, will be noted but will not affect the individual’s performance score
for defensive tactics.
Shots will be rated, but not used in the modeling of importance scores. Since a
shot on goal and a goal are also outcome variables, their importance in relation to success
is obvious. However, to better define the touches during the game, shots will be coded
based on the outcome. For instance, the shot is ranked according to whether it is off

76 target, on target, or results in a goal. Shots are defined as deliberate attempts to kick,
deflect, or head the ball into the goal by the attacking team. Table 5 contains the scores
for the three outcomes to a shot.
Data Collection
Using the new notational system, data will be collected from previously taped
home games of the 2005 Brigham Young University Women’s soccer team. A trained co-
worker recorded films of the 10 selected games from a fixed position where the entire
field of play could be seen. The games were held in Provo, Utah between August 15,
2005 and November 4, 2005. The home schedule consisted of 10 games against
conference and non-conference opponents. Home games were chosen to keep the play
terrain and field dimensions constant, as these confounding factors can affect individual
and team performance. All the games were taped using a digital camcorder.
Table 5. Performance Scores Based on the Effect of a Shot Effect of the Shot
Performance Scores of the
Shot
The shot is off target.
0
The shot is on target.
1
The shot is a goal. 2
The primary investigator will watch each tape and hand write the coding for each
skill being evaluated. Both the home team and away team will be evaluated. However,
only the home team’s codes will be associated to the individual players, since the

77 researcher is familiar with the BYU squad and can identify players without seeing a
number. The codes with the appropriate outcome will then be transferred into an Excel
File (Microsoft Office, 2004). In addition, weather conditions will be recorded.
Technical aspects are addressed and rated in the performance of the pass, dribble,
first touch, shot, and individual defensive tactics (Table 1-5). It is assumed that these
techniques are paired. For example, a first touch may lead to a pass, or dribbling may
lead to a shot on goal. Thus, the notation for players may have one or more aspects
described with one possession of the ball. The number of completed passes, 50/50 balls in
which the team won possession, first touches that led to subsequent touches (dribbling or
passes), and attempted dribbles that led to penetration will be tallied and reported. Tallied
data will be reported for each game according to the individual player (home team only),
home team as a whole, and away team as a whole. Additional data, such as shots on
goals, injuries, approximate individual playing time (home team only), and final score of
the game, will also be recorded.
Statistical Treatments
Three general areas of the study will be tested statistically. These are: (a) the
reliability of the evaluation procedure, (b) the calculation of mean performance levels for
each technique, and (c) the determination of relationships between the skills and scoring.
The reliability of the evaluation procedure. In order to determine reliability, three
games will be randomly chosen to be notated twice. A reliability coefficient will be
calculated by comparing the investigator’s initial notation of a game film to the second
notation of the same game. At least two weeks will elapse between the notations so that

78 memory does not prejudice the reliability. Reliability coefficient will be calculated using
the Proc Freq program in SAS.
The calculation of mean performance score for each technique. Individual mean
performance scores will be calculated for each technique for each player on the home
team for each game. Team mean performance scores will be calculated for the home
team and away team for each technique for each of the 10 games throughout the season.
An overall mean performance score for the home team and away team will be calculated
for each technique across the 10 home games.
The determination of relationships between the skills and scoring. To determine
the importance of each skill on the success (shot on goal or goal) during the soccer match,
we will use a Bayesian implementation of the Logistic Model. Through the use of the
model, we will identify importance scores from the slope of the line between the
performance scores of that specific skill and the response variable. The response
variable, shot on goal or goal, is defined as:
-10 Opponent Scores -1 Opponent Shots on Goal Y = 0 End of Half or Game +1 Shot on Goal +10 Goal Scored
The weight of the response variable was chosen based on the fact that goals are a result of
shots taken, and for every 10 shots taken one goal is scored (Franks, 1996). The
advantage of these response variables is that it takes into account the uncertainty
associated with the performance of a skill.

79 The model relating the response to the skills and skill grades (skill scores) is a
linear regression model
Y = β1(passing) + β2(dribbling) + β3(first touch) + β4(individual defense) + error
There will be no y intercept, thus the importance scores of each skill will be based
on the slope of the line. For example, the steeper the slope of the line, the greater the
importance of that skill on scoring during a soccer game.
Furthermore, each game will be considered a random draw of the total population,
which allows us to draw inferences on the overall mean (μ) and standard deviation (σ)
and thus, the overall effect of each skill. The random effect model
β1i ~ N (μβ1,, σβ1)
for i = 1, …, 32.
To estimate the probability of a shot on goal or goal scored we will calculate the
posterior distribution (β1i) for each skill using Bayesian approach. Posterior distribution
allows us to update our knowledge by combining prior knowledge with the data at hand.
The prior knowledge is an estimate of the importance score (slope) of each skill by a
soccer expert, in this case the principal investigator. For instance, the following
modifications will be made to the passing performance scores in order to scale the slope
to 1:
xadj pass = (xpass – 3.5) * 20/7
where, xpass = performance score for that one touch and xadj pass = the adjusted
performance score. The performance score (xpass) is subtracted from 3.5 which is the
highest passing performance scores (0 to 7) divided by 2, then multiplied by the absolute
number of outcome units (-10 to +10) divided by the highest performance score. The

80 slope of the estimated regression line using the adjusted performance scores would be 1,
assuming there is no variability. Based on the scaled slope of 1, the principal investigator
can then estimate prior slope specifically for that skill. For example, since research
indicates that goals are scored from team passes that are direct and fast in nature (Franks,
1996), we estimated the prior slope for passing to be 0.6. In the Bayesian approach, the
estimate of the prior slope is incorporated in the regression parameters in order to provide
a more robust regression method (Congdon, 2001).
Successful dribbling is enhanced by the support and behavior of the dribbler’s
teammates. A team that is able to pass the ball around will set up players to make good
dribbling runs (Van Balkom, 1996). To scale the estimate regression line slope to 1, the
following transformations will be made:
xadj drb = (xdrb – 2) * 5
where xadj drb = adjusted performance score for the dribble, xdrb = performance score for
that one act of dribbling, 2 = the highest dribbling performance score divided by 2, and 5
= the absolute number of outcome units divided by the highest dribbling performance
score. It is our opinion that dribbling will not have as significant affect on scoring
compared to passing and first touch, thus the estimated prior slope for dribbling will be
0.3, after scaling the slope to 1.
The first touch is the most important, in so much that Steve Sampson of the New
England Revolution, states that ball control is the foundation on which individual players
can make a difference in the outcome of the game (NSCAA, 2004). Furthermore, first
touch needs to be as efficient and quick as possible in order that the team can maintain

81 continued possession of the ball. To scale the estimate regression line slope to 1, the
following transformations will be made
xadj frt = (xfrt – 2.5) * 4
Where, xadj frt = adjusted performance score for the first touch, xfrt = performance score for
that one first touch, 2.5 = the highest first touch performance score divided by 2, and 4 is
the absolute number of outcome units divided by the highest first touch performance
score. Since, the first touch will have the greatest affect on the team’s ability to score, the
estimated prior slope for the first touch will be 0.5, after scaling the slope to 1.
A team’s ability to deny goals, limit opportunities, and recapture the ball depends
on the individual’s application of basic defensive principles (NSCAA, 2004). The
individual’s ability to control the opposing team’s movements of the ball as well as the
individual’s ability to win possession of the ball will greatly affect the opponents’ scoring
opportunities. Furthermore, the ability to regain possession of the ball in the attacking
3rd of the field will increase the chance of scoring. To scale the estimate regression line
slope to 1, the following transformations will be made:
Xadj def = (xdef – 4) * 10/4
where xadj def = adjusted performance score for individual defensive tactics, xdef =
performance score for the individual defensive tactic, 4 = the highest defensive
performance score divided by 2, and 10/4 = the absolute number of outcome units
divided by the highest defensive performance score. The estimated prior slope for
individual defensive tactics will be 0.8, after scaling the slope to 1.

82
An analysis of the posterior distributions suggests that a measure that would
reveal skill importance is a measure that accounts for not only the impact of the skill on
shots on goal and/or goals scored, but that accounts for variation in skills as well.
Statement of Intent
The aim of this study is to provide an analysis tool in which coaches can evaluate
performance as it relates to success during soccer games. Opinions from a panel of
coaches and researchers will be used to validate the notational system. Further, analysis
of game test-retest will provide evidence of reliability. Finally, models will be developed
to identify the importance scores of each skill. Coaches can then use this information to
structure and implement specific practice plans.

83 References
Ali, A. H. (1988). A statistical analysis of tactical movement patterns in soccer. In T.
Reilly, A. Lees, K. Davids, & W. Murphy (Eds.), Science and football (pp. 302-
308). London: E & FN Spon.
Bangsbo, J. & Lindquist, F. (1992). Comparison of various exercise tests with endurance
performance during soccer in professional players. Internal Journal of Sports
Medicine, 13, 125-132.
Bangsbo, J., Norregaard, L., & Thorso, F. (1991). Activity profile of competition soccer.
Canadian Journal of Sport Science, 16, 110-116.
Bate, R. (1988). Football chance: Tactics and strategy, In T. Reilly, A. Lees, K. Davids,
& W. Murphy (Eds.), Science and football (pp. 293-301). London: E & FN Spon.
Carter, A. (1996). Time and motion analysis and heart rate monitoring of a back-row
forward in first class rugby union football. In M. Hughes (Ed.), Notational
analysis of sport – I & II (pp. 145-160). Cardiff: UWIC.
Chervenjakov, M. & Dimitrov, G. (1988). Assessment of the playing effectiveness of
soccer players, In T. Reilly, A. Lees, K. Davids, & W. Murphy (Eds.), Science
and football (pp. 288-292). London: E & FN Spon.
Coleman, J. E. (1975). A statistical evaluation of selected volleyball techniques at the
1974 world’s volleyball championships. Unpublished doctoral dissertation,
Brigham Young University, Provo, Utah.
Congdon, P. (2001). Bayesian statistical modeling. London: John Wiley & Sons, Ltd.
Davis, J. A. & Brewer, J. (1993). Applied physiology of female soccer players. Sports
Medicine, 16, 180-189.

84 Downey, J. C. (1973). The singles game. London: EP Publications.
Federation Internationale de Football Association (2003). Laws of the game 2003/2004.
Zurich, Switzerland: Author.
Franks, I. (1996). Analysis of association football. In T. Schum (Ed.), Coaching soccer
(pp. 29-37). Chicago, IL: Masters Press.
Fullerton, H. S. (1912). The inside game: The science of baseball. The American
Magazine, LXX, 2-13.
Harris, S. & Reilly, T. (1988). Space, team work and attacking success in soccer. In T.
Reilly, A. Lees, K. Davids, & W. Murphy (Eds.), Science and football (pp. 322-
329). London: E & FN Spon.
Hughes, M. (2003). Notational analysis. In T. Reilly & A.M. Williams (Eds.), Science
and soccer (pp. 245-264). London: Routledge.
Hughes, M. & Franks, I. (2004). Notational analysis of sport. London: Routledge.
Llwewllyn, L. & Valdivia, F. (1999). Match 32 postgame report [Electronic version].
Retrieved August 3, 1999, from http://wwc99.fifa.com/
Marques, F. (1990) The efficacy criteria definition in Desportos Collective. Dissertation
presented ace supply of pedagogical aptitude and scientific capacity. Faculdade
of Motricidade Human – University Técnia of Lisbon, Portugal.
Mayhew, S. R. & Wenger, H. A. (1985). Time-motion analysis of professional soccer.
Journal of Human Movement Studies, 11, 49-52.
Mendes, L. & Janeria, M. (2001) Basketball performance – multivariate study in
Portuguese professional male basketball teams. In M. D. Hughes & F. Tavares
(Eds.), Notational analysis of sport – IV (pp. 103-111). Cardiff: UWIC, Cardiff.

85 Messersmith, L. L. & Bucher, C. C. (1939). The distance traversed by big ten basketball
players. Research Quarterly, 10, 61-62.
National Soccer Coaches Association of America (2004). The soccer coaching bible.
Champaign, IL: Human Kinetics.
Partridge, D. & Franks, I. M. (1989a). A detailed analysis of crossing opportunities from
the 1986 World Cup (Part I). Soccer Journal, May-June, 47-50.
Partridge, D. & Franks, I. M. (1989b). A detailed analysis of crossing opportunities from
the 1986 World Cup (Part II). Soccer Journal, June-July, 45-48.
Pettit, A. & Hughes, M. (2001). Crossing and shooting patterns in the 1986 and 1998
World Cups for soccer. In M. Hughes & I. M. Franks (Eds.), Pass.com (pp. 267-
276). Cardiff: CPA, UWIC.
Pollard, R. (1986). Soccer performance and its application to shots at goal. Sports
Statistical Special, Dept. of Research Hanuman Vyayam Prasarak Mandal, (2)4,
19-27.
Pollard, R., Reep, C. & Hartley, S. (1988). The quantitative comparison of playing styles
in soccer. In T. Reilly, A. Lees, K. Davids, & W. Murphy (Eds.), Science and
football (pp. 309-312). London: E & FN Spon.
Reep, C. & Benjamin, B. (1968). Skill and chance in association football. Journal of
Royal Statistical Society, Series A, 131, 581-585.
Reilly, T., Lees, A., Davids, K, & Murphy, W. (1988). Science and football. London: E
& FN Spon.

86 Reilly, T. & Thomas, V. (1976). A motion analysis of work-rate in different positional
roles in professional football match-play. Journal of Human Movement Studies, 2,
87-97.
Rico, J. & Bangsbo, J. (1996). Coding system to evaluate actions with the ball during a
soccer match. In M. Hughes (Ed.), Notational analysis of sport – I & II (pp. 85-
90). Cardiff: UWIC.
Treadwell, P. J. (1998). Computer-aided match analysis of selected ball games (soccer
and rugby union). In T. Reilly, A. Lees, K. Davids, & W. Murphy (Eds.), Science
and football (pp. 282-287). London: E & FN Spon.
Van Gool, D., Van Gerven, D., & Boutmans, J. (1988). The physiological load imposed
on soccer players during real match-play. In T. Reilly, A. Lees, K. Davids, & W.
Murphy (Eds.), Science and football (pp. 51-59). London: E & FN Spon.
Van Balkom, F. (1996). Dribbling. In T. Schum (Ed.), Coaching soccer (pp. 91-93).
Chicago, IL: Masters Press.
Wade, A. (1996a). Effective soccer in theory and in practice. In T. Schum (Ed.),
Coaching soccer (pp. 23-26). Chicago, IL: Masters Press.
Wade, A. (1996b). Statistical analysis of soccer. In T. Schum (Ed.), Coaching soccer (pp.
37-43). Chicago, IL: Masters Press.
Winterbottom, W. (1959). Soccer coaching. Kingswood, Surry England: The Naldrett
Press.
Withers, R. T., Maricic, S., Wasilewski, S., & Kelly, L. (1982). Match analyses of
Australian professional soccer players. Journal of Human Movement Studies, 8,
159-176.

87
Appendix B
Additional Methods

88
Additional Methods
Technical aspects were addressed and rated in the performance of the pass,
dribble, first touch, shot, and individual defensive tactics. Frequency of each rating for
each skill per game was examined. In addition, the frequency of each rating for each skill
per game by positions for the home team was examined. It was assumed that these
techniques are paired. For example, a first touch may lead to a pass, or dribbling may
lead to a shot on goal. Thus, the notation for players may have one or more aspects
described with one possession of the ball. The number of completed passes, 50/50 balls in
which the team won possession, passes into the mixer in which the team kept possession,
first touches that led to subsequent touches (dribbling or passes), and attempted dribbles
that led to penetration were tallied and reported. A completed pass consisted of a
performance score of 1, 3, 4, 5, 6, and 7 for passing. Performance scores for passing that
denoted a 50/50 ball (score = 1) or a mixer (score = 6) were counted as a possession if the
pass was followed by a first touch (rated > 1), pass (rating > 0), or shot (rating > 0). First
touches were counted when a first touch rated as 2 or higher was followed by a dribble
(rating ≥ 1), pass (rating ≥ 1), or shot (rating ≥ 0). Dribble performance scores of 3 were
counted for dribbling that let to penetration. Tallied data was reported for the home team
and away team of each game.
Student’s t test was used to examine the difference between performance scores
for the home team and opponents. One-way Analysis of Variance was used to examine
the positional difference of performance scores for each game. In addition, one-way
ANOVA was used to examine the difference between performances from game to game.
All statistics were performed in Microsoft Excel (2004).

89
Appendix C
Additional Results

90
Additional Results
Frequencies per game of each pass ratings for goalkeepers.
Game
Rating 1 2 3 4 5 6* 7 8 9 10* Avg. per
game
0 1 4 2 10 4 2 3 0 0 6 3.2
1 11 10 5 18 15 6 7 8 11 16 10.7
2 0 0 1 0 0 0 2 0 0 0 0.3
3 0 0 0 0 0 0 0 0 0 0 0.0
4 1 0 0 0 0 0 0 1 0 0 0.2
5 4 4 2 3 1 1 4 2 3 4 2.8
6 0 0 0 0 0 0 0 0 0 0 0.0
7 0 0 0 0 0 0 0 0 0 0 0.0
Total 17 18 10 31 20 9 16 11 14 26 17.2
Note: * indicates the games lasting 110 minutes compared to the regulation game of 90
minute.

91 Frequencies per game of each pass ratings for fullbacks.
Game
Rating 1
2
3
4
5
6*
7
8
9
10*
Avg. per
game 0 53 64 31 66 46 55 70 57 48 68 55.8
1 25 32 33 14 23 34 17 32 21 46 27.7
2 8 5 7 4 3 2 5 7 1 12 5.4
3 19 11 10 7 8 8 17 20 7 11 11.8
4 18 21 11 17 10 34 26 27 26 16 20.6
5 64 62 42 53 54 74 83 69 64 72 63.7
6 6 6 7 11 4 14 7 5 4 4 6.8
7 3 1 1 0 2 6 2 0 3 2 2.0
Total 196 202 142 172 150 227 227 217 174 231 193.8
Note: * indicates the games lasting 110 minutes compared to the regulation game of 90
minute.

92 Frequencies per game of each pass ratings for midfielders.
Game
Rating 1 2 3 4 5 6* 7 8 9 10* Avg. per
game
0 17 15 20 26 33 22 30 22 25 35 24.5
1 3 14 7 7 4 21 5 6 4 13 8.4
2 1 5 0 2 3 1 1 3 3 2 2.1
3 14 28 16 18 16 26 22 14 20 20 19.5
4 11 25 23 14 17 33 35 28 31 34 25.2
5 17 34 19 20 25 23 26 38 39 69 31.0
6 2 5 6 5 6 2 5 2 4 8 4.5
7 1 5 1 3 1 5 4 2 3 2 2.7
Total 66 131 92 95 105 133 128 115 129 183 117.9
Note: * indicates the games lasting 110 minutes compared to the regulation game of 90
minute.

93 Frequencies per game of each pass ratings for strikers.
Game
Rating 1 2 3 4 5 6* 7 8 9 10* Avg.
per
game
0 32 25 19 25 23 40 34 33 23 39 29.3
1 6 7 2 3 6 15 6 11 6 5 6.7
2 3 4 1 5 2 6 6 4 4 3 3.8
3 16 22 16 25 11 24 17 20 18 23 19.2
4 17 13 18 10 10 39 18 22 40 27 21.4
5 23 16 13 19 20 27 24 23 28 23 21.6
6 13 4 8 5 14 14 9 11 8 12 9.8
7 6 7 4 6 1 4 3 9 9 2 5.1
Total 116 98 81 98 87 169 117 133 136 134 116.9
Note: * indicates the games lasting 110 minutes compared to the regulation game of 90
minute

94
Overall frequencies per game of each pass ratings for the home team and opponents.
Game
Rating 1 2 3 4 5 6* 7 8 9 10* Ave. per
ranking
Home
0 105 109 73 130 108 120 138 114 96 150 114.3
1 51 69 53 48 54 81 41 59 51 86 59.3
2 12 14 10 11 8 9 14 14 8 17 11.7
3 49 61 42 50 35 58 56 54 45 54 50.4
4 47 59 52 41 37 106 79 79 97 78 67.5
5 109 117 77 95 101 128 139 136 134 168 120.4
6 21 15 21 21 24 30 21 18 16 24 21.1
7 10 14 6 9 4 15 9 11 15 6 9.9
Total 404 458 334 405 371 547 497 485 462 583 454.6
Opponents
0 94 129 101 106 102 133 132 132 103 165 119.7
1 53 77 63 70 50 112 61 85 76 102 74.9
2 6 9 7 9 9 4 7 12 4 5 7.2
3 42 29 44 31 46 38 32 38 22 54 37.4
4 39 46 51 51 70 55 32 56 40 54 49.4
5 108 91 77 69 110 9 82 96 75 122 90.9
6 9 6 6 10 6 10 3 2 6 14 7.2
7 1 1 2 3 3 1 1 1 2 2 1.7
Total 352 388 351 349 396 432 350 422 328 516 388.4
Note: * indicates the games lasting 110 minutes compared to the regulation game of 90
minute.
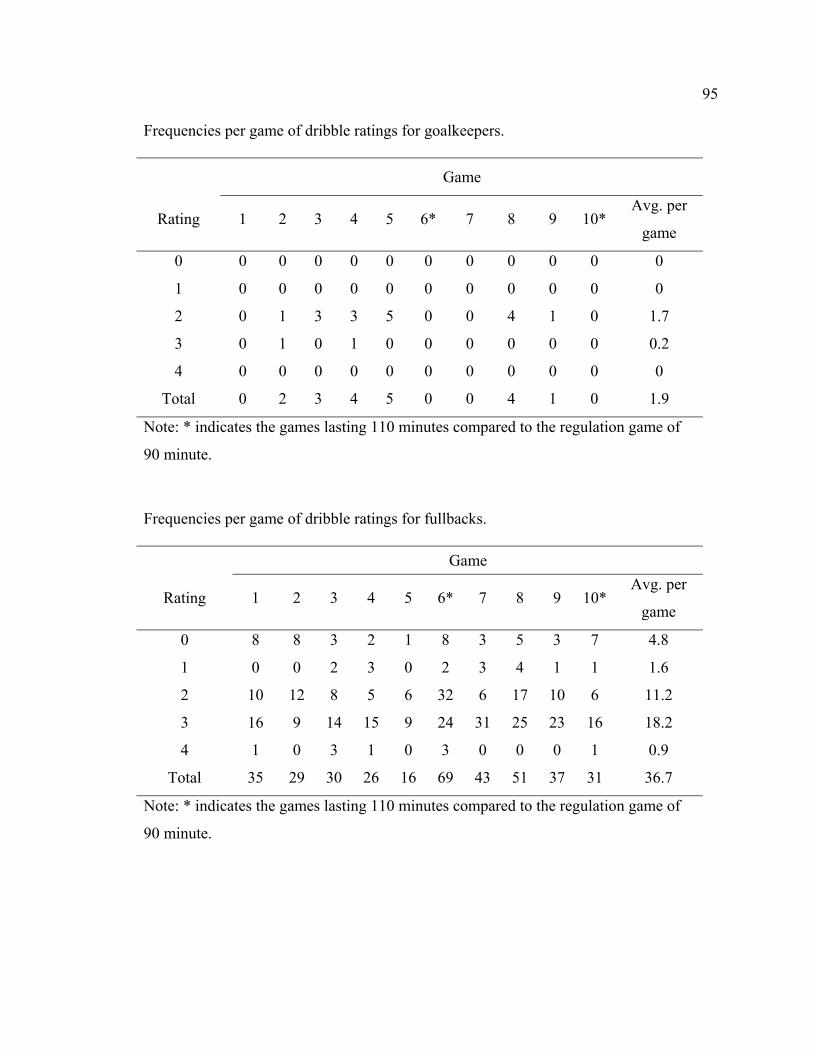
95 Frequencies per game of dribble ratings for goalkeepers.
Game
Rating 1 2 3 4 5 6* 7 8 9 10* Avg. per
game
0 0 0 0 0 0 0 0 0 0 0 0
1 0 0 0 0 0 0 0 0 0 0 0
2 0 1 3 3 5 0 0 4 1 0 1.7
3 0 1 0 1 0 0 0 0 0 0 0.2
4 0 0 0 0 0 0 0 0 0 0 0
Total 0 2 3 4 5 0 0 4 1 0 1.9
Note: * indicates the games lasting 110 minutes compared to the regulation game of
90 minute.
Frequencies per game of dribble ratings for fullbacks.
Game
Rating 1 2 3 4 5 6* 7 8 9 10* Avg. per
game
0 8 8 3 2 1 8 3 5 3 7 4.8
1 0 0 2 3 0 2 3 4 1 1 1.6
2 10 12 8 5 6 32 6 17 10 6 11.2
3 16 9 14 15 9 24 31 25 23 16 18.2
4 1 0 3 1 0 3 0 0 0 1 0.9
Total 35 29 30 26 16 69 43 51 37 31 36.7
Note: * indicates the games lasting 110 minutes compared to the regulation game of
90 minute.

96 Frequencies per game of dribble ratings for midfielders.
Game
Rating 1 2 3 4 5 6* 7 8 9 10*Avg. per
game
0 2 10 5 4 6 3 7 1 8 8 5.4
1 1 2 4 3 1 2 5 1 1 3 2.3
2 14 21 18 14 20 15 18 20 25 31 19.6
3 4 13 14 16 15 5 17 19 18 32 15.3
4 1 3 3 0 1 1 0 3 2 1 1.5
Total 22 49 44 37 43 26 47 44 54 75 44.1
Note: * indicates the games lasting 110 minutes compared to the regulation game of
90 minute.
Frequencies per game of dribble ratings for strikers.
Game
Rating 1 2 3 4 5 6* 7 8 9 10*Avg. per
game
0 16 13 12 14 21 11 10 17 12 20 14.6
1 9 6 7 10 4 7 4 9 4 2 6.2
2 17 22 19 11 9 34 16 21 29 16 19.4
3 23 11 11 10 12 28 16 17 23 17 16.8
4 5 2 5 3 1 9 2 5 3 3 3.8
Total 70 54 54 48 47 89 48 69 71 58 60.8
Note: * indicates the games lasting 110 minutes compared to the regulation game of
90 minute.

97 Overall frequencies per game of dribble ratings for the home team and opponents.
Game
Rating 1 2 3 4 5 6* 7 8 9 10* Ave. per
ranking
Home
0 26 31 20 20 28 22 20 23 23 35 22.8
1 10 8 13 16 5 11 12 14 6 6 10.1
2 42 58 45 33 40 81 40 62 65 53 51.9
3 44 33 39 42 36 57 64 61 64 65 50.5
4 7 6 11 4 3 13 3 8 5 5 6.5
Total 129 136 128 115 112 184 139 168 163 164 143.8
Opponent
0 27 22 14 18 25 21 12 25 21 27 21.2
1 7 5 5 8 8 6 2 6 4 5 5.6
2 26 38 31 30 51 51 24 49 31 48 37.9
3 21 22 27 28 45 21 22 20 27 38 27.1
4 2 1 1 3 4 3 2 0 4 5 2.5
Total 83 88 78 87 133 102 62 100 87 123 94.3
Note: * indicates the games lasting 110 minutes compared to the regulation game of 90
minute.

98 Frequencies per game of first touch ratings for goalkeepers.
Game
Rating
1 2 3 4 5 6* 7 8 9 10* Avg. per game
0 0 0 0 0 0 0 0 0 0 0 0.0
1 0 0 0 0 0 0 0 0 0 0 0.0
2 0 0 0 1 2 0 0 1 0 0 0.4
3 1 0 3 5 0 2 1 2 1 0 1.5
4 5 7 3 2 3 1 4 7 0 1 3.3
5 0 0 0 0 0 0 0 0 0 0 0.0
Total 6 7 6 8 5 3 5 10 1 1 5.2
Note: * indicates the games lasting 110 minutes compared to the regulation game of 90
minute.
Frequencies per game of first touch ratings for fullbacks.
Game
Rating
1 2 3 4 5 6* 7 8 9 10* Avg. per game
0 12 7 5 10 4 8 6 2 6 8 6.8
1 1 2 1 1 1 1 1 1 1 0 1.0
2 11 11 4 9 4 12 9 13 7 10 9.0
3 10 22 10 15 9 27 12 29 9 23 16.6
4 51 40 36 38 26 57 64 75 55 46 48.8
5 2 3 3 2 0 5 2 0 0 1 1.8
Total 87 85 59 75 44 110 94 120 78 88 84.0
Note: * indicates the games lasting 110 minutes compared to the regulation game of 90
minute.

99 Frequencies per game of first touch ratings for midfielders.
Game
Rating 1 2 3 4 5 6* 7 8 9 10* Avg. per
game
0 12 23 9 13 11 11 19 13 19 20 15.0
1 1 2 0 0 2 5 6 3 1 1 2.1
2 16 37 17 14 11 18 20 23 13 26 19.5
3 7 24 10 15 11 20 28 14 23 37 18.9
4 11 33 31 23 34 26 34 30 47 49 31.8
5 2 2 5 1 3 3 2 3 3 4 2.8
Total 49 121 72 66 72 83 109 86 106 137 90.1
Note: * indicates the games lasting 110 minutes compared to the regulation game of 90
minute.
Frequencies per game of first touch ratings for strikers.
Game
Rating 1 2 3 4 5 6* 7 8 9 10* Avg. per
game
0 31 33 24 19 22 45 22 45 27 31 29.9
1 7 11 3 3 3 3 4 6 7 6 5.3
2 23 40 27 24 30 30 29 57 38 28 32.6
3 19 19 6 12 13 30 20 16 18 25 17.8
4 45 23 28 28 27 58 27 27 41 47 35.1
5 7 4 8 4 2 14 4 7 6 7 6.4
Total 132 130 96 90 98 180 106 158 137 144 127.1
Note: * indicates the games lasting 110 minutes compared to the regulation game of 90
minute.
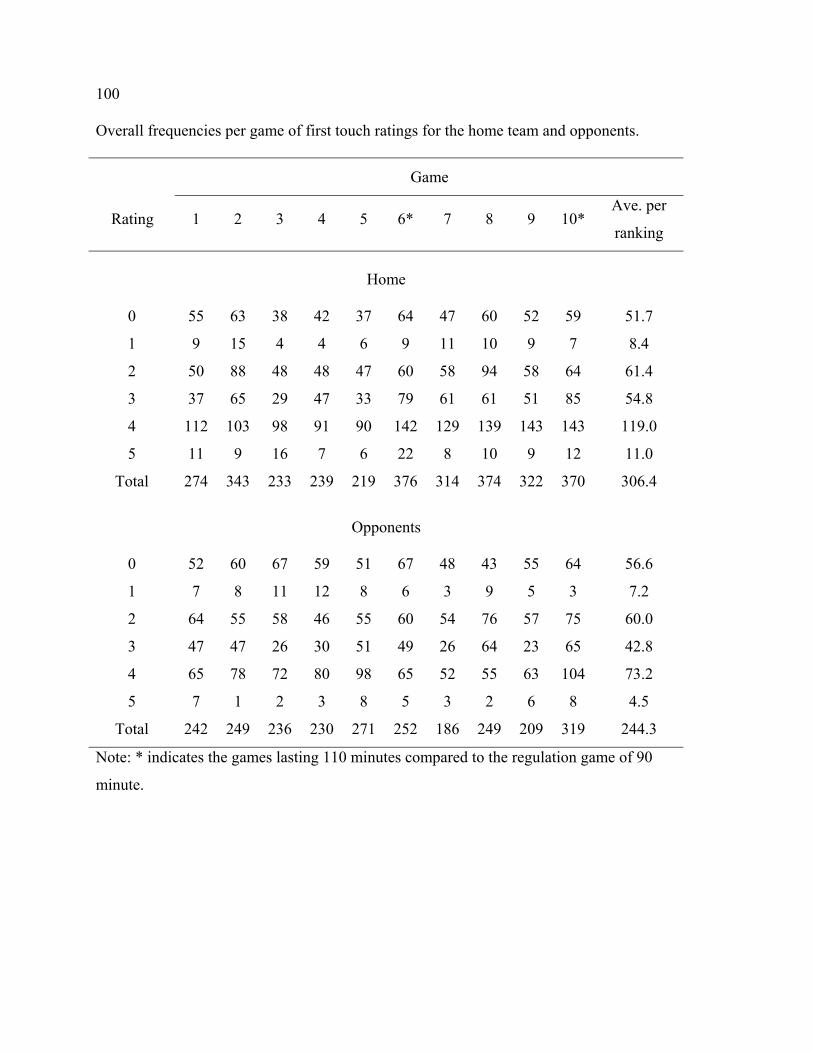
100 Overall frequencies per game of first touch ratings for the home team and opponents.
Game
Rating 1 2 3 4 5 6* 7 8 9 10* Ave. per
ranking
Home
0 55 63 38 42 37 64 47 60 52 59 51.7
1 9 15 4 4 6 9 11 10 9 7 8.4
2 50 88 48 48 47 60 58 94 58 64 61.4
3 37 65 29 47 33 79 61 61 51 85 54.8
4 112 103 98 91 90 142 129 139 143 143 119.0
5 11 9 16 7 6 22 8 10 9 12 11.0
Total 274 343 233 239 219 376 314 374 322 370 306.4
Opponents
0 52 60 67 59 51 67 48 43 55 64 56.6
1 7 8 11 12 8 6 3 9 5 3 7.2
2 64 55 58 46 55 60 54 76 57 75 60.0
3 47 47 26 30 51 49 26 64 23 65 42.8
4 65 78 72 80 98 65 52 55 63 104 73.2
5 7 1 2 3 8 5 3 2 6 8 4.5
Total 242 249 236 230 271 252 186 249 209 319 244.3
Note: * indicates the games lasting 110 minutes compared to the regulation game of 90
minute.

101
Frequencies per game of individual defense ratings for goalkeepers.
Game
Rating 1 2 3 4 5 6* 7 8 9 10* Avg. per
game
0 0 0 0 0 0 0 0 0 0 0 0
1 1 0 0 0 0 0 0 0 0 0 0.1
2 0 0 0 0 0 0 1 0 0 2 0.3
3 0 0 0 0 0 0 0 0 0 1 0.1
4 0 0 1 3 0 0 1 0 2 2 0.9
5 1 0 0 0 0 0 0 0 0 0 0.1
6 11 10 9 21 18 9 20 9 10 18 13.5
7 0 0 0 0 0 0 0 0 0 0 0
8 0 0 0 0 0 0 0 0 0 0 0
Total 13 10 9 22 21 9 21 10 12 23 15.0
Note: * indicates the games lasting 110 minutes compared to the regulation game of 90
minute.

102
Frequencies per game of individual defense ratings for fullbacks.
Game
Rating 1 2 3 4 5 6* 7 8 9 10* Avg. per
game
0 21 12 12 11 11 5 16 9 14 19 13.0
1 20 10 15 15 15 9 10 5 8 11 11.8
2 20 19 15 15 11 23 18 15 24 32 19.2
3 9 18 15 12 21 16 16 17 18 26 16.8
4 42 37 31 34 53 44 26 36 38 62 40.3
5 12 9 7 12 13 7 8 8 8 10 9.4
6 34 34 36 54 37 37 27 31 32 60 38.2
7 78 71 44 45 36 75 73 73 60 75 63.0
8 3 1 2 1 2 4 4 1 2 2 2.2
Total 239 211 177 199 199 220 198 195 204 297 213.9
Note: * indicates the games lasting 110 minutes compared to the regulation game of 90
minute.

103
Frequencies per game of individual defense ratings for midfielders.
Game
Rating 1 2 3 4 5 6* 7 8 9 10* Avg. per
game
0 18 23 20 42 52 13 39 18 37 54 32.6
1 24 23 30 30 21 24 31 17 20 23 24.3
2 22 30 30 26 41 45 41 32 23 56 34.6
3 18 22 19 24 29 24 17 18 21 34 22.6
4 21 44 34 33 68 33 29 33 34 45 37.4
5 3 3 8 4 6 7 10 6 0 6 5.3
6 6 3 8 12 7 10 3 3 7 10 6.9
7 24 39 35 26 44 48 55 41 51 69 43.2
8 7 10 5 8 3 10 2 8 5 11 6.9
Total 143 197 199 205 271 214 227 176 198 308 213.8
Note: * indicates the games lasting 110 minutes compared to the regulation game of 90
minute.

104
Frequencies per game of individual defense ratings for strikers.
Game
Rating 1 2 3 4 5 6* 7 8 9 10* Avg. per
game
0 51 45 40 50 74 31 60 41 40 62 49.4
1 28 25 18 25 29 31 18 25 21 34 25.4
2 43 44 30 31 25 57 33 56 36 55 41.0
3 17 15 11 15 15 29 12 23 15 27 17.9
4 37 45 21 18 37 36 31 71 26 34 35.6
5 14 15 7 9 18 12 16 12 12 15 13.0
6 3 0 4 3 1 2 1 1 0 4 1.9
7 24 24 13 18 16 43 13 29 13 11 20.4
8 15 12 2 9 8 11 13 15 8 8 10.1
Total 232 225 146 178 223 252 197 273 171 250 214.7
Note: * indicates the games lasting 110 minutes compared to the regulation game of 90
minute.

105
Overall frequencies per game of individual defense ratings for the home team and
opponents.
Game
Rating 1 2 3 4 5 6* 7 8 9 10* Ave. per
game
Home
0 90 80 82 103 137 49 115 68 91 135 95.0 1 73 58 63 70 65 64 59 47 49 68 61.6 2 85 93 75 72 77 125 93 103 83 145 95.1 3 44 55 45 51 65 69 45 58 54 88 57.4 4 100 126 86 86 161 113 86 141 100 143 114.2 5 30 27 23 26 39 26 34 26 21 31 28.3 6 54 47 57 90 63 58 51 44 49 92 60.5 7 126 134 92 89 96 166 141 143 124 155 126.6 8 25 23 9 18 13 25 19 24 15 21 19.2
Total 627 643 532 605 716 695 643 654 586 878 657.9
Opponent
0 147 93 94 102 95 131 170 97 139 104 117.2 1 48 61 52 62 62 97 55 68 73 90 66.8 2 81 104 63 83 72 135 82 123 97 131 97.1 3 37 83 55 55 60 68 67 80 70 83 65.8 4 122 162 119 128 99 159 157 127 146 177 139.6 5 30 33 33 32 30 38 33 29 35 37 33.0 6 70 89 55 69 71 119 88 86 82 95 82.4 7 79 96 89 80 90 97 82 94 73 140 92.0 8 7 9 6 10 4 11 3 7 6 20 8.3
Total 621 730 566 621 583 855 737 711 721 877 702.2 Note: * indicates the games lasting 110 minutes compared to the regulation game of 90
minute.

106 Frequencies per game of shots off target, on target, and goals for fullbacks.
Game
Shots 1 2 3 4 5 6* 7 8 9 10*Avg. per
game
Off Target 2 2 3 3 1 4 2 2 0 1 2.0
On Target 2 3 2 1 0 6 2 1 2 0 1.9
Goals 1 1 0 0 0 0 0 0 0 0 0.2
Total 5 6 5 4 1 10 4 3 2 1 4.1
Note: * indicates the games lasting 110 minutes compared to the regulation game of
90 minute.
Frequencies per game of shots off target, on target, and goals for midfielders.
Game
Shots 1 2 3 4 5 6* 7 8 9 10*Avg. per
game
Off Target 1 5 4 2 2 3 4 6 6 2 3.5
On Target 1 1 4 1 0 3 2 1 6 1 2.0
Goals 1 1 1 1 1 0 0 0 2 0 7.0
Total 3 7 9 4 3 6 6 7 14 3 6.2
Note: * indicates the games lasting 110 minutes compared to the regulation game of
90 minute.

107 Frequencies per game of shots off target, on target, and goals for strikers.
Game
Ratings 1 2 3 4 5 6* 7 8 9 10* Avg. per
game
Off Target 5 3 4 4 4 16 6 10 4 7 6.3
On Target 7 8 5 6 2 9 5 2 6 8 5.8
Goals 3 3 1 0 0 0 0 6 0 1 1.4
Total 15 14 10 10 6 25 11 18 10 16 13.5
Note: * indicates the games lasting 110 minutes compared to the regulation game of
90 minute.

108
Overall frequencies per game of shots off target, on target, and goals for the home team
and opponents.
Game
Rating 1 2 3 4 5 6* 7 8 9 10* Ave. per
game
Home
Off target 8 10 11 9 7 23 12 18 10 10 11.8
On target 10 12 11 8 2 18 9 4 14 9 9.7
Goals 5 5 2 1 1 0 0 6 2 1 2.3
Total 23 27 24 18 10 41 21 28 26 20 23.8
Opponents
Off target 3 3 2 4 6 4 1 2 7 5 3.7
On target 3 1 3 6 7 2 3 1 3 7 3.6
Goals 1 0 0 0 0 0 1 0 0 1 0.3
Total 7 4 5 10 13 6 5 3 10 13 7.6
Note: * indicates the games lasting 110 minutes compared to the regulation game of 90
minute.

109
Mean passing performance scores per game for each position
Game
Rating 1 2 3 4 5 6 7 8 9 10 Avg.
Goalkeeper 1.77 1.78 1.58 0.98 1.07 1.72 1.88 2.40 1.52 1.31 1.53
Fullbacks 2.79 2.53 2.68 2.57 2.67 3.08 2.88 2.71 2.95 2.45 2.68
Midfielders 2.95 3.38 3.10 2.86 2.80 2.97 3.13 3.32 3.36 3.39 3.16
Strikers 3.13 2.92 3.27 3.01 3.15 2.97 2.87 3.09 3.52 2.90 3.08
Mean dribbling performance scores per game for each position
Game
Rating 1 2 3 4 5 6 7 8 9 10 Avg.
Goalkeeper 2.50 2.00 0.00 2.25 2.00 0.00 0.00 2.00 2.00 0.00 2.11
Fullbacks 2.06 1.76 2.40 2.38 2.59 2.17 2.57 2.22 2.43 2.10 2.25
Midfielders 2.05 2.00 2.14 2.14 2.09 1.96 1.96 2.50 2.09 2.20 2.12
Strikers 1.89 1.69 1.81 1.54 1.32 2.19 1.92 1.77 2.01 1.67 1.82

110
Mean first touch performance scores per game for each position
Game
Rating 1 2 3 4 5 6 7 8 9 10 Avg.
Goalkeeper 3.83 4.00 3.50 3.13 3.20 3.33 3.80 3.60 3.00 4.00 3.56
Fullbacks 3.07 3.12 3.96 3.01 3.18 3.26 3.41 3.45 3.36 3.16 3.25
Midfielders 2.20 2.40 2.96 2.58 2.89 2.65 2.53 2.62 2.82 2.77 2.65
Strikers 2.46 2.00 2.36 2.43 2.30 2.53 2.36 1.97 2.42 2.50 2.33
Mean individual defense performance scores per game for each position
Game
Rating 1 2 3 4 5 6 7 8 9 10 Avg.
Goalkeeper 5.54 6.00 6.00 5.91 5.71 6.00 5.81 5.80 5.67 5.35 5.74
Fullbacks 4.56 4.76 4.46 4.64 4.36 4.97 4.76 5.00 4.56 4.55 4.66
Midfielders 3.36 3.61 3.30 3.04 3.20 3.87 3.30 3.78 3.56 3.50 3.44
Strikers 2.97 3.01 2.47 2.61 2.44 3.32 2.66 3.22 2.67 2.40 2.81

111
Appendix D
Suggestions for Future Research

112
Future Research
Minor adjustments to the notational system are necessary. Once the performance
scales have been adjusted, more games need to be analyzed to improve the database.
More games from different levels and genders need to be analyzed to compare the
performance scores and diversify the database. Information from the database can be
used to defined trends for scoring goals, winning games, and various styles of soccer. The
performance score database could be used as standards for recruiting players, selecting
players from tryouts, or organizing more successful combinations of players during the
game.
With a greater database, researchers can examine skill performance under certain
conditions. For instance, what is the affect of physical fitness on performance scores from
the first half compared to the second half of a game, or the beginning of the season
compared to the post-season play. In addition, research is needed to examine the affects
of affective learning domains, such as self-efficacy, self-awareness, and motivation, on
performance scores during a game. Finally, the affect of coaching styles, recruiting class,
and skill development may affect the performance scores during a game.