development of a notational analysis system to evaluate
TRANSCRIPT

Brigham Young University Brigham Young University
BYU ScholarsArchive BYU ScholarsArchive
Theses and Dissertations
2007-06-26
Development of a Notational Analysis System to Evaluate Setting Development of a Notational Analysis System to Evaluate Setting
Performance in Volleyball Performance in Volleyball
Nina Puikkonen Mortensen Brigham Young University - Provo
Follow this and additional works at: https://scholarsarchive.byu.edu/etd
Part of the Exercise Science Commons
BYU ScholarsArchive Citation BYU ScholarsArchive Citation Mortensen, Nina Puikkonen, "Development of a Notational Analysis System to Evaluate Setting Performance in Volleyball" (2007). Theses and Dissertations. 950. https://scholarsarchive.byu.edu/etd/950
This Thesis is brought to you for free and open access by BYU ScholarsArchive. It has been accepted for inclusion in Theses and Dissertations by an authorized administrator of BYU ScholarsArchive. For more information, please contact [email protected], [email protected].

DEVELOPMENT OF A NOTATIONAL ANALYSIS SYSTEM
TO EVALUATE SETTING PERFORMANCE
IN VOLLEYBALL
by
Nina Puikkonen Mortensen
A thesis submitted to the faculty of
Brigham Young University
in partial fulfillment of the requirements for the degree of
Master of Science
Department of Exercise Sciences
Brigham Young University
August 2007

BRIGHAM YOUNG UNIVERSITY
GRADUATE COMMITTEE APPROVAL
of a thesis submitted by
Nina Puikkonen Mortensen
This thesis has been read by each member of the following graduate committee and by majority vote has been found to be satisfactory. Date Pat R. Vehrs, Chair Date Gilbert W. Fellingham Date Philip E. Allsen Date Iain Hunter

BRIGHAM YOUNG UNIVERSITY
As chair of the candidate’s graduate committee, I have read the thesis of Nina Puikkonen Mortensen in its final form and have found that (1) its format, citations, and bibliographical style are consistent and acceptable and fulfill university and department style requirements; (2) its illustrative materials including figures, tables, and charts are in place; and (3) the final manuscript is satisfactory to the graduate committee and is ready for submission to the university library. Date Pat R. Vehrs Chair, Graduate Committee Accepted for the Department Larry T. Hall Chair, Department of Exercise Sciences Accepted for the College Gordon B. Lindsay, Associate Dean College of Health and Human Performance
ABSTRACT
DEVELOPMENT OF A NOTATIONAL ANALYSIS SYSTEM TO
EVALUATE SETTING PERFORMANCE IN VOLLEYBALL
Nina Puikkonen Mortensen
Department of Exercise Sciences
Master of Science
The purposes of this study were to develop a notational analysis system for
volleyball to evaluate setting performance independent of the actions of the hitter and to
use the data to develop a Markovian transitional matrix that would make known the
probabilities of specific outcomes from each setting scenario. Setting performance was
analyzed based on the sets distance from the net, height of the set, and position of the set
in relation to the hitter as viewed from 13 filmed competitions of a Division I
intercollegiate women’s volleyball team. Data from the notation of 1353 sets were used
to develop a Markovian transitional matrix. The data indicated that 26 different setting
scenarios occurred. Overall, sets within 3-5 feet from the net resulted in the highest
probability of a point and the lowest probability of a point for the opponent. Low sets,
whether inside or outside in relation to the hitter also resulted in a high probability of
winning a point. High sets, whether inside or outside in relation to the hitter, resulted in
the lowest probability of success and the highest probability of a point for the opponent.

A notational analysis system such as described in this study can effectively be used by
coaches to evaluate setting performance, provide effective feedback, develop team
strategies and style of play, and allocate practice time.

ACKNOWLEDGMENTS
I would like to thank Head Coach Jason Watson and Dr. Gilbert Fellingham for
their inspiration and enthusiasm for this project and for always making yourselves
available to assist me on such short notice. I would like to thank Dr. Pat Vehrs and
Lindsay Florence for their valuable input and the enormous amount of time they provided
in helping make this project a success. I would like to thank the rest of my committee, Dr.
Philip Allsen and Dr. Iain Hunter.
I would especially like to thank my family who share in this accomplishment with
me. Thank you to my husband, father, and sister for their unconditional love and support.
Thank you to my sweet little girl, for being patient enough to let me complete this
project. And finally, I would like to thank my mother for her constant and willing support
which allowed me to focus and complete this project. This accomplishment is dedicated
to her.
viii
Table of Contents
List of Tables ................................................................................................................... ix Development of a notational analysis system to evaluate setting performance in volleyball Abstract ..................................................................................................................2 Introduction............................................................................................................3 Methods..................................................................................................................4 Results..................................................................................................................10 Discussion............................................................................................................11 Conclusion ...........................................................................................................17 References............................................................................................................19 Appendix A Prospectus....................................................................................................26 Introduction..........................................................................................................27 Review of Literature ............................................................................................34 Methods................................................................................................................48 References............................................................................................................57 Appendix A1 – Excerpt from Data Volley Text File...........................................62 Appendix B Additional Results .......................................................................................64

ix
List of Tables
Table Page
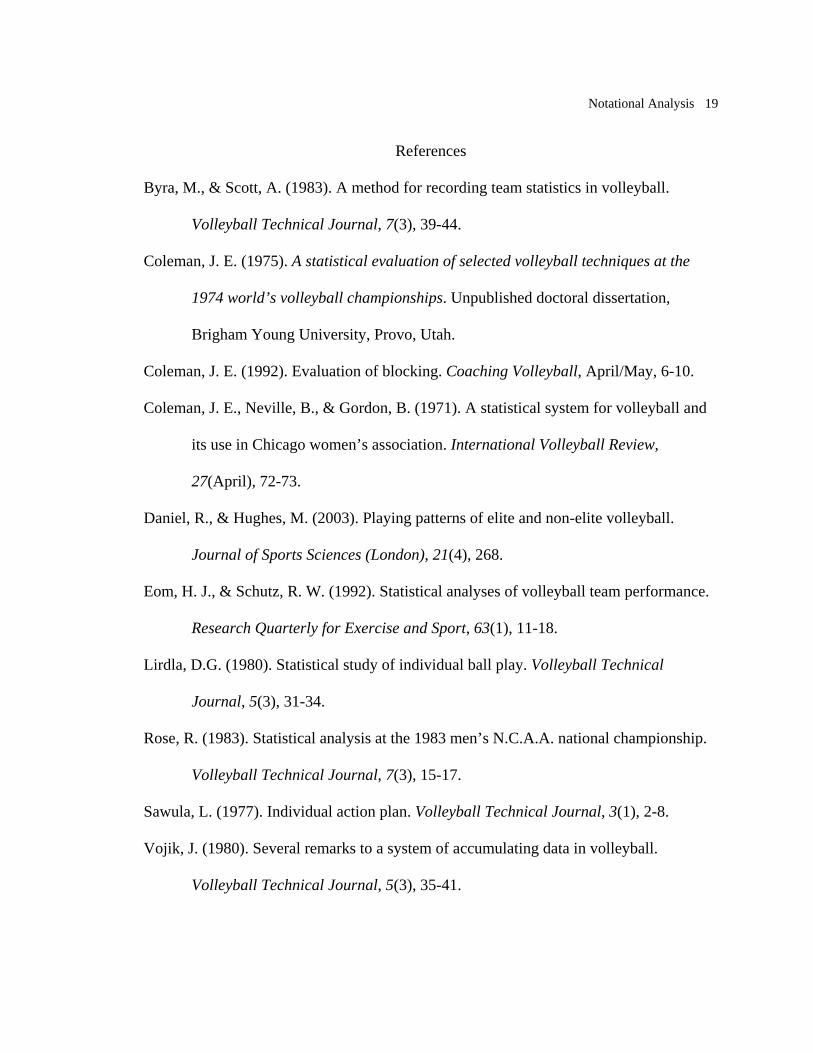
1 Code used to describe the height and position of the set ................................ 20
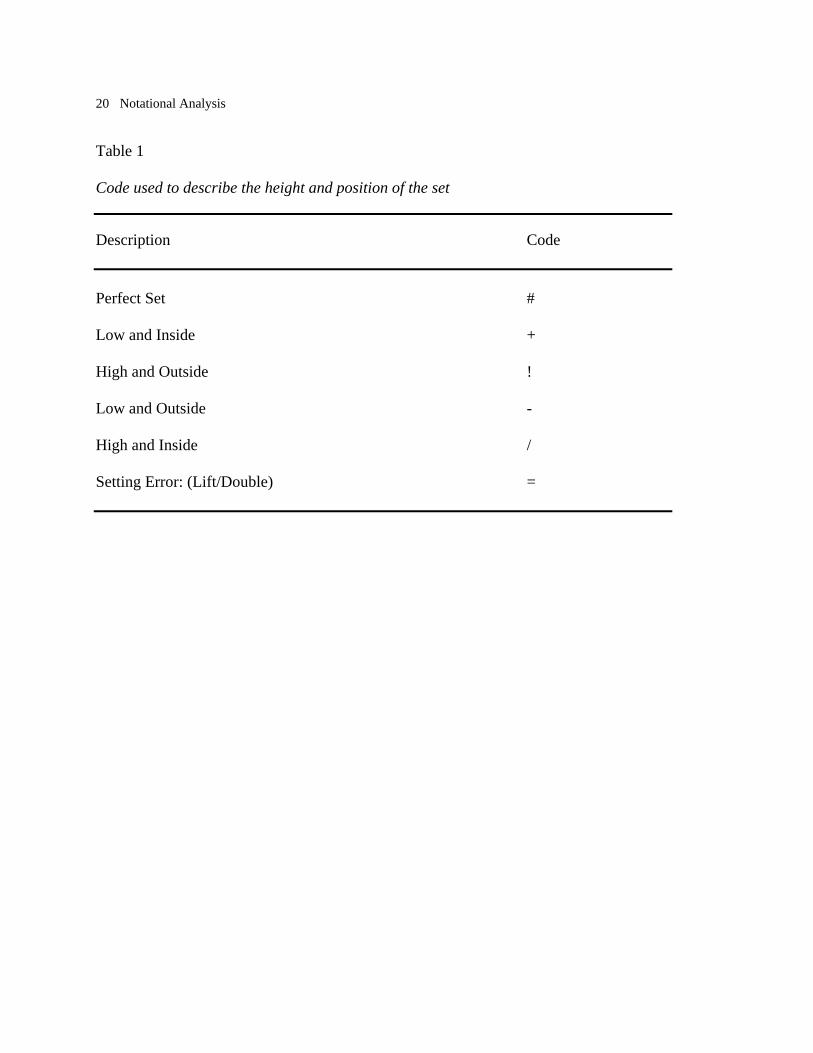
2 Code used to describe the distance of the set from the net ............................. 21
3 Estimated probability outcomes of all possible setting scenarios................... 22
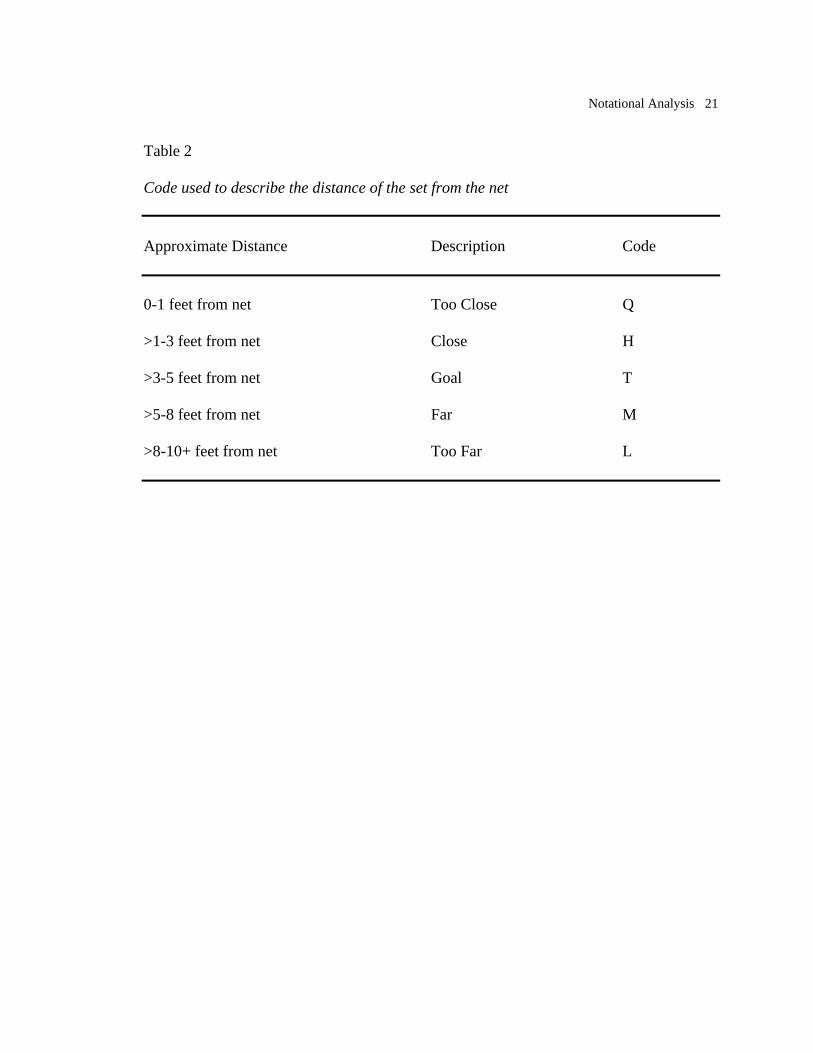
4 Estimated probability outcomes and distribution for
height and position sets............................................................................... 24
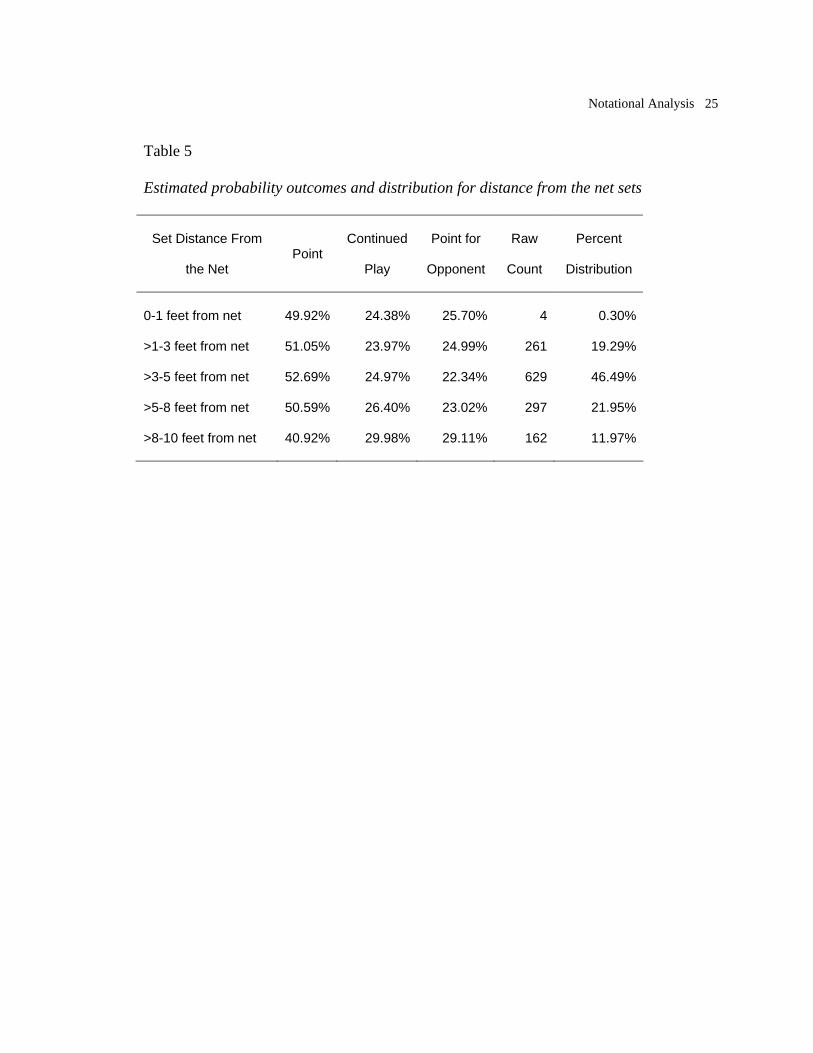
5 Estimated probability outcomes and distribution for
distance from the net sets............................................................................ 25
Notational Analysis
1
Running Head: NOTATIONAL ANALYSIS
Development of a Notational Analysis System
To Evaluate Setting Performance in Volleyball
Nina Puikkonen Mortensen, MS, Department of Exercise Science
Gilbert Fellingham, PhD, Department of Statistics
and Pat Vehrs, PhD, Department of Exercise Science
Brigham Young University
Address Correspondence to: Nina Puikkonen Mortensen 985 S 925 W Lehi, UT 84043 [email protected] 801-766-8818

Notational Analysis
2
Abstract
The purposes of this study were to develop a notational analysis system to
evaluate volleyball setting performance independent of the actions of the hitter and to use
the data to develop a Markovian transitional matrix that would make known the
probabilities of specific outcomes from each setting scenario. Setting performance was
analyzed based on the sets distance from the net, height of the set, and position of the set
in relation to the hitter as viewed from 13 filmed competitions of a Division I
intercollegiate women’s volleyball team. Data from the notation of 1353 sets were used
to develop a Markovian transitional matrix. The data indicated that 25 different setting
scenarios occurred. Overall, sets within 3-5 feet from the net resulted in the highest
probability of a point and the lowest probability of a point for the opponent. Low sets,
whether inside or outside in relation to the hitter also resulted in a high probability of
winning a point. High sets, whether inside or outside in relation to the hitter, resulted in
the lowest probability of success and the highest probability of a point for the opponent.
A notational analysis system such as described in this study can effectively be used by
coaches to evaluate setting performance, provide effective feedback, develop team
strategies and style of play, and allocate practice time.
Notational Analysis
3
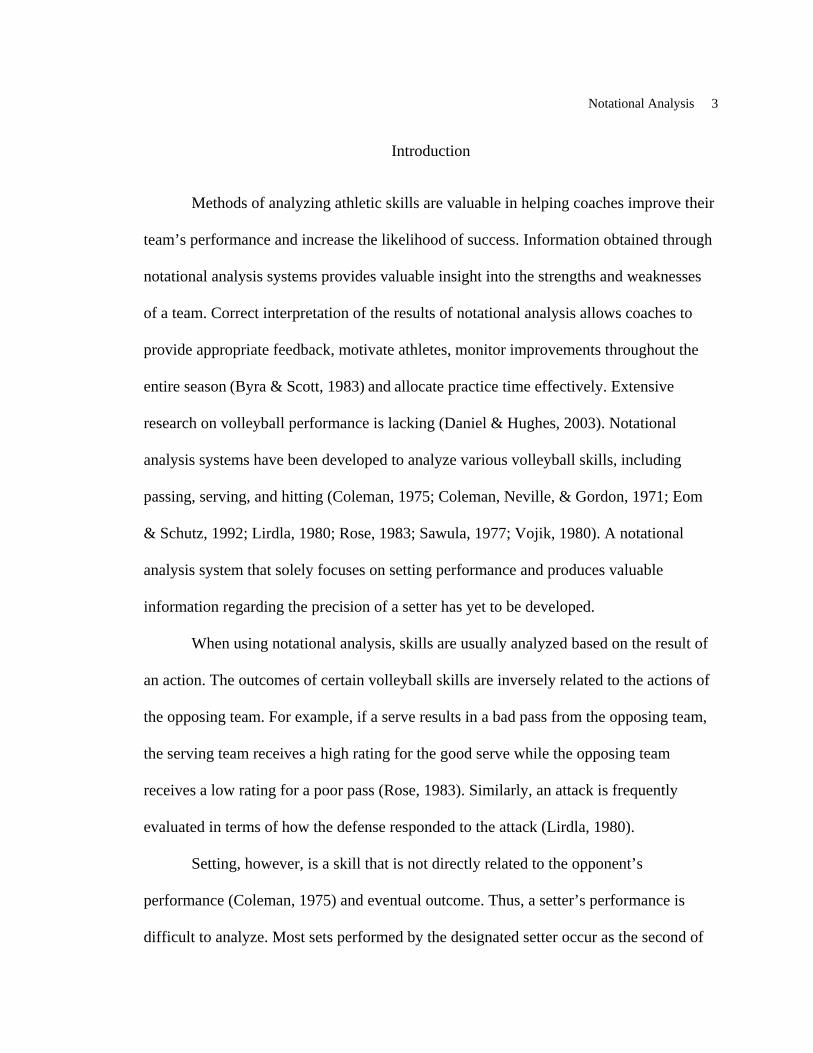
Introduction
Methods of analyzing athletic skills are valuable in helping coaches improve their
team’s performance and increase the likelihood of success. Information obtained through
notational analysis systems provides valuable insight into the strengths and weaknesses
of a team. Correct interpretation of the results of notational analysis allows coaches to
provide appropriate feedback, motivate athletes, monitor improvements throughout the
entire season (Byra & Scott, 1983) and allocate practice time effectively. Extensive
research on volleyball performance is lacking (Daniel & Hughes, 2003). Notational
analysis systems have been developed to analyze various volleyball skills, including
passing, serving, and hitting (Coleman, 1975; Coleman, Neville, & Gordon, 1971; Eom
& Schutz, 1992; Lirdla, 1980; Rose, 1983; Sawula, 1977; Vojik, 1980). A notational
analysis system that solely focuses on setting performance and produces valuable
information regarding the precision of a setter has yet to be developed.
When using notational analysis, skills are usually analyzed based on the result of
an action. The outcomes of certain volleyball skills are inversely related to the actions of
the opposing team. For example, if a serve results in a bad pass from the opposing team,
the serving team receives a high rating for the good serve while the opposing team
receives a low rating for a poor pass (Rose, 1983). Similarly, an attack is frequently
evaluated in terms of how the defense responded to the attack (Lirdla, 1980).
Setting, however, is a skill that is not directly related to the opponent’s
performance (Coleman, 1975) and eventual outcome. Thus, a setter’s performance is
difficult to analyze. Most sets performed by the designated setter occur as the second of
Notational Analysis
4
three contacts on the same side of the net. A setter is awarded an assist for sets which
lead to a positive outcome from the third and final contact. Currently, evaluation of a
setter’s performance is based on assists, even though they are not directly related to the
outcome.
The current methods of evaluating a setter’s performance do not accurately reflect
the quality or precision of the set. Ideally, the setter’s performance should be evaluated
independent of any other contact within the possession. This is confounded by the fact
that setting and hitting are related in a possession’s sequence of events; yet, it is possible
for a hitter to obtain a kill off a poor set, and likewise possible to execute a good set in
which the hitter is unable to terminate the rally. Consequently, setting and hitting should
be evaluated as individual actions. If a notational analysis system were developed to
specifically evaluate setting performance, then coaches, teams, and athletic conferences
might be more confident in their recognition of the best setters. In addition, coaches could
use this information to offer more constructive feedback to their players and allocate
practice time to the development and improvement of necessary skills.
The purposes of this study were to develop a notational analysis system to
evaluate setting performance and to use these data in the development of a Markovian
transitional matrix to determine the probability of specific outcomes from different
setting scenarios.
Methods
An expert committee comprised of four NCAA Division I volleyball coaches and
a statistician established three criteria as an effective evaluation of setting performance.
Notational Analysis
5
The criteria included the distance the ball is to the net, the height of the set, and the
position of the set relative to the hitter. Based on these three criteria, setting performance
was evaluated by analyzing game films of a collegiate women’s volleyball team.
Analysis of setting required coding each set according to pre-determined criteria. Data
entry of codes was performed using the Data Volley software program (Data Project,
Salerno, Italy, release 2.1.9).
The Data Volley software program is limited in the number of possible scenarios
that can exist. Coding actions for specific digits is limited to five or six digits. Although
this slightly influenced how setting was evaluated, the three major criteria of evaluating
setting performance established by the expert committee could be accounted for. The first
two digits of the code (for example: 15EH+) represented the player’s number. The third
digit represented the setting action. The set was automatically coded with an E. We coded
the fourth digit to represent the distance to the net, which was limited to five possible
scenarios. We coded the fifth and last digit to represent the height and position of the set,
which was limited to six possible scenarios.
Game films from the 2005 Brigham Young University women’s volleyball season
were viewed to develop codes for the notational analysis system that matched the data
entry limitations of the Data Volley software program. These games were filmed from a
camera positioned behind the end line which provided a view of the entire court. The
expert committee derived the codes shown in Table 1 to describe the height of the set and
the position of the set relative to the hitter.

Notational Analysis
6
The position of the set referred to whether the ball was too far inside or outside in
relation to the hitter. A set was classified as inside when the ball was set more towards
the center of the court. A set was classified as outside when the ball was set more towards
the side lines of the court. The height of the set referred to the maximum height of the
ball. A set was classified as high when the maximum height of the ball was above the
desired set location. When the maximum height of the ball was below the desired set
location the set was considered too low. Using height and position criteria, a set was
classified as “perfect” when it was neither too high, nor too low, nor too far inside, nor
too far outside. A setting error was classified as any setting violation called by the first
referee (e.g., lift, or double contact).
This study assumed that the height and position of the set could be analyzed
together and were represented by a single coded variable. Therefore, when a set was too
low or too high, it was also either too far inside or too far outside for the hitter. Likewise,
when a set was inside or outside in relation to the hitter, it was also either too high or too
low. Since the principle investigator was a member of the Brigham Young University
women’s volleyball coaching staff, she had a good knowledge of the team’s offensive
systems and desired set locations.
The expert committee also derived the codes shown in Table 2 to describe the
distance the set was from the net. It was anticipated that a set 0-1 feet from the net would
rarely be executed for any hitting position and was therefore described as “too close” to
the net. A set >3-5 feet from the net was expected to be quite common, given that this
distance is the instruction given to the setters, and was therefore described as the “goal”

Notational Analysis
7
set. Therefore, a set >1-3 feet from the net was described as “close” to the net while a set
>5-8 feet from the net was described as “far.” Finally, in terms of a front-row hitter, any
set that was >8 feet from the net was described as “too far” from the expected or desired
location. Scrimmages between players of the 2006 Brigham Young University women’s
volleyball team were used to determine the placement of the camera that would provide
the best side view of the court. The side view camera was placed along a line parallel to
the net and five feet from it. This camera only viewed actions on one side of the net.
Athletic tape was placed upon the floor within the camera’s view to mark the five
categorical distances from the net during the scrimmages. By viewing films from the
scrimmages the principle investigator became proficient in evaluating the distance of
each set from the net.
The codes (Tables 1 and 2) used to describe the three criteria for evaluating
setting performance were used to analyze filmed volleyball competitions of the 13 home
matches between the Brigham Young University women’s volleyball team and opponents
during the 2006 season. Each home match was filmed using two cameras in the positions
described above. Evaluating the set from two different views made it possible to
accurately analyze the setter’s performance.
During actual competitions, a co-investigator trained to interpret volleyball skills
keyed a detailed code of the match into the Data Volley software program. This co-
investigator coded all volleyball actions, including serving, passing, setting, hitting,
blocking, and defense. The co-investigator coded each set with a default code (15EH+)
where the only variable the co-investigator changed was the player number. Only sets
Notational Analysis
8
from eligible designated setters were evaluated from each game film. Consequently, sets
performed from other players who were occasionally in a position to set during
competitions were not evaluated. It was simply noted that a set occurred during the
particular sequence of events.
Although several different actions (i.e., a setter dump, a pass set, a one-handed
set, the two-handed overhead set) can be performed by the setter, the only setting action
that was not evaluated was the setter dump. A setter dump was considered an attack and
therefore did not qualify as a variable in this study. Since this study focused on the
precision of the setter’s ball location rather than the technique used, the evaluation did
not differentiate between the pass set, one-handed set, and the two-handed overhead set.
Coding Protocol
Analysis for the matches was completed after films from both camera angles had
been captured and saved into a computer. The principle investigator then synchronized
both camera views to the co-investigator’s initial code within the Data Volley software
program. The first three digits of the code were used to access each set performed by the
setter within the match. Each set was then evaluated for its distance from the net (Table
2) and the height of the set and position of the set relative to the hitter (Table 1). Each
sets distance from the net was determined from the sideline view camera at the point at
which the hitter contacted the ball. The height and position of the set was determined
from the end line view camera.
Notational Analysis
9
Statistical Analysis
Every time the ball was on Brigham Young University’s side of the net, there was
a sequence of events that followed one of the following patterns: serve-outcome, pass-
set-attack-outcome, or block-dig-set-attack-outcome. It was assumed that these sequences
were Markov chains where the quality of each contact depends on the quality of the
previous contact but not on contacts further removed in the sequence.
The probabilities for the sequences were represented in an extensive matrix of
transition probabilities with 127 rows and columns. The rows of the matrix represented
the coded serve, pass, set, attack, dig, block, or outcome in the sequence, and the columns
represented the next event. Thus, the elements of the matrix were the probabilities of
moving from one state to another. Impossible sequences, such as a serve to another serve,
were constrained to have zero probability. Other sequences known to always occur (e.g.,
service error to opponent scoring) were assigned a probability of one. A Bayesian
paradigm was used to model the unknown transition probabilities. A multinomial
likelihood was used for each row of the transition matrix. Prior probability densities for
transition probabilities were assumed to be distributed as Dirichlet variables. Markov
chain Monte Carlo methods were then used to produce posterior distributions of the
transition probabilities. It was proposed that the median of the posterior distribution be
used as the point estimate to be inserted into the transition matrix.
There were four attack-outcome scenarios: a kill which resulted in a point, a
continuation of play/dig by the opponent, a block by the opponent, or a hitting error.
Blocks by the opponent and hitting errors were pooled since they both resulted in a point
Notational Analysis
10
for the opponent. Thus, the transition matrix was used to determine the probabilities of
the 25 setting scenarios ending in each of three possible outcomes, a point for BYU, a
point for the opponent, or continuation of play. The transitional matrix was then used to
answer questions about relative skill importance of setting.
To establish reliability of the setting evaluation, three randomly selected matches
were analyzed a second time. The same principle investigator performed all analyses of
game films. The second analysis of the three matches occurred at least two weeks
following the first analysis.
Results
In the films of the 13 home matches, there were a total of 1353 sets from the setter
that were included in the analysis. An additional 159 sets were performed by players
other than the designated setter. There were five different height and position possibilities
(Table 1) at each of the five distance from the net categories (Table 2). All setting errors
were pooled into one category. Thus, using the coding for distance to the net and height
and position of the set, 26 different setting scenarios from the setter were possible. While
only 24 setting scenarios from the setter actually occurred in the data set, when sets
performed by non-designated setters were included, there were 25 total scenarios
included in the analysis.
There were several different analyses made from the transition matrix that
determined the estimated probability outcomes. The estimated probabilities of every
possible setting scenario leading to a point, continued play, or point for the opponent are

Notational Analysis
11
listed in Table 3. These data are further collapsed to analyze the height and position of
the set (Table 4) and the distance of the set from the net (Table 5).
Of the 1353 sets, there were 629 (46.5%) sets within the goal distance of >3-5 feet
from the net. The majority of these (292; 46.6% of sets at this distance; 21.6% of all sets)
were perfect sets. Overall, perfect sets had the highest probability of resulting in a point,
followed by sets that were low and either inside or outside (Table 4). Overall, perfect sets
also resulted in the lowest probabilities of a point for the opponent, followed by sets that
were low and either inside or outside. Overall, high sets, whether inside or outside
resulted in lower probabilities of wining a point and higher probabilities of a point for the
opponent. Overall, sets within >3-5 feet of the net resulted in the highest probability of
winning a point and the lowest probability of a point for the opponent (Table 5). The
probability of winning a point decreased and the probability of a point for the opponent
increased as the distance of the set from the net moved further from the goal distance of
>3-5 feet from the net.
In the three matches analyzed twice to determine reliability, there were a total of
272 sets performed. Of these, 235 sets (86.4%) were coded the same for the height and
position of the set. Of the 272 sets, 249 sets (91.5%) were coded the same for the distance
from the net. Of the 272 sets, 88.97% were coded the same for the height and position of
the set and the distance from the net.
Discussion
The importance or value of a player’s performance may be a product of how
performance is being assessed. Value is given to those aspects of performance that are

Notational Analysis
12
measured even though the measurement may not be a true indicator of performance.
Ideally, evaluations must be true measures of performance. Evaluating and ranking a
setter based on assists does not accurately measure the precision and accuracy of a setters
setting performance. For example, if a hitter does not convert a perfect set into a point,
the setter is not recognized for his/her perfect set. On the contrary, if a hitter converts a
poor set into a point, the setter is awarded an assist. In addition, awarding an assist to the
setter fails to describe the quality of his/her set. This leads us to believe that setters are
undervalued in their role and contribution to the team. The notational analysis system
described in this study evaluates a setter’s performance in a more objective manner.
This study presents, for the first time, a notational analysis system that
quantitatively analyzes setting performance based on the sets distance from the net,
height of the set and position of the set in relation to the hitter. To the best of our
knowledge, the data and methods presented in this study, represents one of the most
comprehensive and growing data sets used in evaluating setting performance. Also
unique to this study is the analysis of each set performed by viewing competitive game
films recorded from two different views of the court. Using the notational analysis system
described in this study, 26 possible setting scenarios existed, thus providing an analysis in
far more detail than has previously been reported.
This study analyzed setting performance of a women’s collegiate volleyball team
during the 2006 season. The notational analysis system used in this study was specific to
the team being evaluated. For example, setters are instructed that the ideal or “goal” set
(Table 2) is within >3-5 feet from the net, neither too high nor too low and neither too far
Notational Analysis
13
inside or outside. Although other teams may have different setting strategies, we believe
that the coding derived by the expert committee to analyze a set based on the set’s
distance from the net and the height and position of the set are sound practices that can be
used by any team.
A Sets Distance from the Net
We hypothesized that a perfect set presented in the goal position provides the
greatest advantage to the hitter by offering the largest number of attacking options with
the least likelihood of losing a point to the opposing team. The data gathered from this
study demonstrate that nearly 47% of all sets were placed in the goal location and 19%
and 22% of all sets were placed >1-3 feet from the net or >5-8 feet from the net (Table
5), respectively. This indicates that the setters are performing as instructed. Overall, when
compared to other distances, setting the ball at the goal distance resulted in the highest
probability of winning a point and the lowest probability of losing a point. Setting the ball
closer to or further from the net than the goal distance decreased the probability of
winning a point and increased the probability of losing a point to the opponent. Sets that
are too far from the net (i.e., >8 feet) offer the highest probability (29.1%) of a point for
the opponent. This probability is higher than the probability (28%) of a set made by a
non-designated setter resulting in a point for the opponent. A set placed too far from the
net is not the primary choice for an offensive attack, but is usually the result of setting
from a less than ideal position created from the pass. The results of this study lend
support to providing setters with a specific goal distance from the net to set the ball and
allocating time to practice setting to the goal distance.

Notational Analysis
14
Even though sets placed too close (i.e., 0-1 feet) to the net occurred infrequently,
they usually resulted in an error, or an automatic point for the opponent. Sets to this
distance were most often performed when attempting a quick attack. Such attacks
increase the probability of errors due to the faster speed of play. Sets to this distance
should be avoided.
Height and Position of the Set
We hypothesized that perfect sets, regardless of the distance from the net, would
result in better outcomes than any other height and position of the set. When the data
were collapsed on the height and position of the set (Table 5), perfect sets resulted in the
highest probability of winning a point and the lowest probability of losing a point to the
opponent. At any given distance from the net (Table 3), perfect sets generally resulted in
the highest probability of a point. Sets which were low and either inside or outside also
resulted in high probabilities, and sometimes greater probabilities of a point than a perfect
set. This may be explained by the fact that the nature of the Brigham Young University’s
offense is to be quick and fast. Thus, the setters tend to set low, specifically low and
inside rather than outside (Table 4). It appears that hitters are able to adjust to the lower
and faster inside set and are surprisingly successful with their efforts. This faster paced
game may catch the opponent’s defense off guard and ensure some success in winning a
point. While a low and inside set has previously not been a considered set of choice, the
results of this study supports the re-evaluation of the definition of a perfect set.
In contrast, sets which were high and either inside or outside resulted in the
lowest probabilities for a point and the highest probability of a point for the opponent. In
Notational Analysis
15
fact, high sets resulted in the lowest probability of a point in almost every distance from
the net category (Table 3). We propose that in a fast paced offense, hitters would
generally begin their hitting approach at an earlier moment than when playing a slow
paced offense. Consequently, when the hitter is given a high set, their hitting approach is
slowed down and interrupted. A high set also allows more time for the opposing team to
set up in its most desired and effective defensive option. For a fast paced offense, the
hitting approach would be less interrupted when given a low set.
Sets by Nondesignated Setters
Compared to other players, designated setters have had more practice setting the
ball and therefore are more consistent in their setting performance. Sets performed by
nondesignated setters result in nearly the lowest probability of winning a point and the
highest probability of losing a point to the opponent. Although this would be expected,
the number of sets performed by nondesignated setters should be minimal. The data from
this study indicates that 10.5% of all sets were performed by nondesignated setters. These
sets occur when the setter is forced to take the first contact or when the setter is unable to
be in position to set the second contact due to the quality of the first contact. To reduce
the number of sets by nondesignated setters, additional practice time should be allocated
to receiving the serve and making successful passes to the desired location of the
designated setter.
Notational Analysis
16
Reliability
A second analysis of three matches indicated acceptable reliability of coding 272
sets similarly. After comparing the second analysis to the first, any discrepancies were
reviewed to determine the source of the error. Four of the codings for distance to the net
and 6 codings for height and position of the set were mistakes that could have been
avoided. The majority of discrepancies in coding a sets distance from the net occurred
when the set was placed between categories (Table 2). Most errors occurred when coding
sets placed between the distances of >1-3 feet from the net and >3-5 feet from the net
because sets in these two distance categories combined accounted for 65.7% of the total
number of sets. Marking distances from the net on the computer screen when viewing
films would facilitate accurate and consistent coding of a sets distance from the net. Such
practices help make the coding of volleyball actions systematic, consistent, and accurate.
The discrepancies in coding the height and position of the set appear more random. A
greater number of inconsistencies occurred when differentiating between a perfect set and
a low and inside set. Many of the height and position discrepancies occurred when the
pass pulled the setter away from setting at the net. In some of these situations, the view of
the set, as recorded from the camera on the end line was uncertain. It should also be noted
that most of the inconsistencies between the first and second analysis occurred in the
match that had been coded the earliest among the three. Even though the principle
investigator is an experienced volleyball player and coach and was trained in viewing
films and coding actions, mistakes still occurred. Therefore, it would be prudent for the
coaching staff to develop a systematic method of training those who are assigned to view

Notational Analysis
17
and code game films. For example, the coaching staff may have a set of “practice” films
to view and code actions. Proficiency would be established when one’s codes entered for
the game matched those written by a trained individual who had viewed the game
multiple times and corrected any errors in coding.
Conclusion
With consistent use of this notational analysis system, setters can now receive
beneficial feedback regarding their performance and placement of a set. Coaches can be
objectively informed about the probabilities of success with each setting scenario.
Coaches could use this information to establish team strategies specific to the style of
play and better define the team’s “goal” set. Furthermore, coaches can show their setters
where and how their sets are being distributed and how their choices affect the outcome
of the rally. Coaches can also make informed choices on how to allocate practice time.
Future research using the notational analysis system described in this paper could
analyze the performance of different setters on the same team to determine the best
combination of players on the court. Setting performance of various teams can be
analyzed to develop a better overall evaluation of setting performance. In addition, setting
performance of teams competing at different levels can be analyzed and compared. It
may also be useful to derive a more detailed analysis of where sets are being distributed
while also evaluating the probability of a positive or negative outcome for each choice. In
light of technological advances, and with practice, an efficient managerial assistant could
code a match in real time, allowing the coaching staff to evaluate a team’s performance
and make necessary adjustments during the match. Last of all, a notational analysis as

Notational Analysis
18
described in this paper can also be used to analyze the remaining volleyball skills in
determining a quantitative analysis of a sequence of events beginning with a serve and
ending with a point. If all volleyball actions within a match are coded, as with the Data
Volley software program, the transitional probability matrix that was created in this study
can be used to provide a detailed analysis of the sequence of events.
Notational Analysis
19
References
Byra, M., & Scott, A. (1983). A method for recording team statistics in volleyball.
Volleyball Technical Journal, 7(3), 39-44.
Coleman, J. E. (1975). A statistical evaluation of selected volleyball techniques at the
1974 world’s volleyball championships. Unpublished doctoral dissertation,
Brigham Young University, Provo, Utah.
Coleman, J. E. (1992). Evaluation of blocking. Coaching Volleyball, April/May, 6-10.
Coleman, J. E., Neville, B., & Gordon, B. (1971). A statistical system for volleyball and
its use in Chicago women’s association. International Volleyball Review,
27(April), 72-73.
Daniel, R., & Hughes, M. (2003). Playing patterns of elite and non-elite volleyball.
Journal of Sports Sciences (London), 21(4), 268.
Eom, H. J., & Schutz, R. W. (1992). Statistical analyses of volleyball team performance.
Research Quarterly for Exercise and Sport, 63(1), 11-18.
Lirdla, D.G. (1980). Statistical study of individual ball play. Volleyball Technical
Journal, 5(3), 31-34.
Rose, R. (1983). Statistical analysis at the 1983 men’s N.C.A.A. national championship.
Volleyball Technical Journal, 7(3), 15-17.
Sawula, L. (1977). Individual action plan. Volleyball Technical Journal, 3(1), 2-8.
Vojik, J. (1980). Several remarks to a system of accumulating data in volleyball.
Volleyball Technical Journal, 5(3), 35-41.
Notational Analysis
20
Table 1 Code used to describe the height and position of the set Description Code Perfect Set # Low and Inside + High and Outside ! Low and Outside - High and Inside / Setting Error: (Lift/Double) =
Notational Analysis
21
Table 2
Code used to describe the distance of the set from the net
Approximate Distance Description Code 0-1 feet from net Too Close Q >1-3 feet from net Close H >3-5 feet from net Goal T >5-8 feet from net Far M >8-10+ feet from net Too Far L

Notational Analysis
22
Table 3
Estimated probability outcomes of all possible setting scenarios
Set Distance
From the Net
Set Height and
Position
Point
Continued
Play
Point for
Opponent
Perfect Set 54.89% 21.70% 23.41%
Low and Inside 55.32% 20.58% 24.09%
0-1 feet from
net
High and Outside
32.71% 35.18% 32.11%
Perfect Set 53.77% 24.54% 21.69%
Low and Inside 52.56% 24.48% 22.96%
High and Outside 49.99% 26.19% 23.81%
Low and Outside 53.27% 24.72% 22.01%
High and Inside 50.50% 29.39% 20.11%
>1-3 feet
from net
Setting Error
0.00% 0.00% 100.00%
Perfect Set 53.56% 24.94% 21.50%
Low and Inside 53.57% 24.26% 22.17%
High and Outside 50.69% 25.97% 23.34%
Low and Outside 51.98% 25.86% 22.16%
High and Inside 49.45% 27.13% 23.42%
>3-5 feet
from net
Setting Error
0.00% 0.00% 100.00%

Notational Analysis
23
Table 3 Continued
Perfect Set 52.67% 25.83% 21.50%
Low and Inside 52.81% 25.04% 22.14%
High and Outside 47.54% 28.69% 23.78%
Low and Outside 50.05% 24.79% 25.17%
High and Inside 48.15% 28.17% 23.67%
>5-8 feet
from net
Setting Error
0.00% 0.00% 100.00%
Perfect Set 45.02% 27.54% 27.45%
Low and Inside 39.75% 31.03% 29.22%
High and Outside 41.83% 29.03% 29.14%
Low and Outside 40.25% 32.09% 27.66%
High and Inside 38.84% 31.22% 29.95%
>8 feet from
net
Setting Error
0.00% 0.00% 100.00%
Set not by
Setter
39.24% 32.68% 28.08%
Notational Analysis
24
Table 4
Estimated probability outcomes and distribution for height and position sets
Set Height and
Position
Point
Continued
Play
Point for
Opponent
Raw
Count
Percent
Distribution
Perfect Set 52.88% 25.17% 21.95% 524
38.73%
Low and Inside 52.25% 24.91% 22.84% 415
30.67%
High and Outside 47.20% 27.67% 25.14% 120
8.87%
Low and Outside 50.60% 26.00% 23.39% 80
5.91%
High and Inside 45.66% 29.00% 25.34% 198
14.63%
Setting Error
0.00%
0.00% 100.00% 16
1.18%
Notational Analysis
25
Table 5
Estimated probability outcomes and distribution for distance from the net sets
Set Distance From
the Net
Point
Continued
Play
Point for
Opponent
Raw
Count
Percent
Distribution
0-1 feet from net 49.92% 24.38% 25.70% 4
0.30%
>1-3 feet from net 51.05% 23.97% 24.99% 261
19.29%
>3-5 feet from net 52.69% 24.97% 22.34% 629
46.49%
>5-8 feet from net 50.59% 26.40% 23.02% 297
21.95%
>8-10 feet from net
40.92% 29.98% 29.11% 162
11.97%

Notational Analysis
26
Appendix A
Prospectus
Notational Analysis
27
Chapter 1
Introduction
Analysis of athletic skills is a valuable resource to coaches when deciding how to
help his/her team make improvements to be successful. Information obtained through
notational analysis systems provides valuable insight to the strength and weaknesses of a
team. With this information, coaches can provide appropriate feedback, motivate athletes,
monitor improvements throughout the entire season (Byra & Scott, 1983) and allocate
practice time. In the sport of volleyball, little detailed research in volleyball performance
is available (Daniel & Hughes, 2003). While some notational analysis systems have been
developed to analyze various volleyball skills, including passing, serving, and hitting
(Coleman, 1975; Coleman, Neville, & Gordon, 1971; Eom & Schutz, 1992; Lirdla, 1980;
Rose, 1983; Sawula, 1977; Vojik, 1980), a notational analysis system that produces
valuable information regarding the precision of a setter and solely focuses on setting
performance has yet to be developed.
When using notational analysis, skills are usually analyzed based on the result of
an action. The outcomes of certain volleyball skills are inversely related to the actions of
the opposing team. For example, if a serve results in a bad pass from the opposing team,
the serving team receives a high rating for the good serve while the opposing team
receives a low rating for the poor pass. Similarly, if an attack hit is defended and
controlled by the opposing team, whether by the block or defense, the hitter receives a
low rating while the defense receives a high rating.
Notational Analysis
28
Setting, on the other hand, is most often the only skill that is not directly related to
the opponent’s performance (Coleman, 1975). Most sets occur as the second of three
contacts on the same side of the net. It is a skill performed after a teammate first contacts
the ball and is completed before another teammate attempts to terminate the rally. The
outcome of an offensive rally is usually related to the third and final hit. This makes the
set difficult to analyze because setting performance is a skill unrelated to the opponent’s
performance or only indirectly related to an outcome.
In order to appropriately evaluate the skill of a setter, the set should be analyzed
independent of the rally’s outcome. Currently, the only indicators of a setter’s skill on the
official NCAA statistic sheet for intercollegiate volleyball games are setting errors and
the number of assists. Evaluating a setter’s skill in this manner is problematic because
ball handling errors are indistinguishable from timing errors and the setter is only
rewarded when the hitter obtains a “kill.” We recognize that it is still possible for a hitter
to obtain a kill off a poor set. Likewise, it is possible to execute a good set in which the
hitter is unable to terminate the rally. Consequently, current notational analysis systems
do not accurately reflect the quality or precision of the set. If a notational analysis system
were developed to specifically evaluate setting performance, then coaches, teams, and
athletic conferences might be more confident in their recognition of the best setters.
Coaches might also use this information to offer more constructive feedback to their
players and allocate practice time to the development and improvement of necessary
skills.
Notational Analysis
29
To assign an evaluation to setting performance, three variables will be considered.
These are the distance the ball is from the net, the height of the set, and the position of the
set in relation to the hitter.
Statement of Purpose
The twofold purposes of this study are to develop a notational analysis system to
evaluate setting performance and to use these data as part of the development of a
Markovian transitional matrix.
Hypothesis
The null hypothesis assumes that there is no relationship between setting
performance and the success of the attack hit in thirteen intercollegiate NCAA Division I
women’s volleyball games.
The alternative hypothesis assumes that there is a relationship between setting
performance and the success of the attack hit in thirteen intercollegiate NCAA Division I
women’s volleyball games.
Definition of Terms
Antennae- “An antenna is a flexible rod, 1.8 m long and 10mm in diameter, made
of fiberglass or similar material. An antenna is fastened at the outer edge of each side
band. The antennae are placed at opposite sides of the net . . . the antennae are considered
as part of the net and laterally delimit the crossing space (Rule 2.4).” (FIVB, 2005).
Attack Hit- “All actions which direct the ball towards the opponent, with the
exception of service and block are considered attack hits (13.1.1) . . . An attack hit is

Notational Analysis
30
completed at the moment the ball completely crosses the vertical plane of the net or is
touched by an opponent (13.1.3).” (FIVB, 2005).
Attack Line- “An attack line, whose rear edge is drawn 3 meters (10 feet) back
from the axis of the center line, marks the front zone (1.3.4).” (FIVB, 2005).
Back-row hitter- “A back-row player may complete an attack hit at any height
from behind the front zone: at his/her take-off the player’s foot (feet) must neither have
touched nor crossed over the attack line; after his/her hit, the player may land within the
front zone (13.2.2). A back-row player may also complete an attack hit from the front
zone, if at the moment of contact the ball is not entirely higher than the top of the net.
(13.2.3).” (FIVB, 2005).
Block- “Blocking is the action of players close to the net to intercept the ball
coming from the opponents by reaching higher than the top of the net. Only front-row
players are permitted to complete a block (14.1.1).” (FIVB, 2005).
Defense- “The action by a team when the ball is controlled by its opponents.”
(Coleman & Liskevych as cited by Coleman, 1975, p. 6).
Dig- “Recovery of an opponent’s (attack hit).” (Coleman & Liskevych as cited by
Coleman, 1975, p. 6).
Double Contact- “A player hits the ball twice in succession or the ball contacts
various parts of his/her body in succession (9.3.4).” (FIVB, 2005).
Dump- An attack hit most often performed by the setter on the second of three
allowed contacts.
Notational Analysis
31
Front-row hitter- “A front row player may complete an attack hit at any height,
provided that the contact with the ball has been made within the player’s own playing
space (except Rule 13.2.4.—can’t attack opponents serve) (13.2.1.).” (FIVB, 2005).
Front zone- “On each court the front zone is limited by the axis of the centre line
and the rear edge of the attack line (1.4.1).” (FIVB, 2005).
Kill- “An attack (hit) that cannot be returned and thus directly results in a point or
side out for the attacking team.” (Coleman, 1975, p. 6).
Left side hitter- When facing the net, the front-row player positioned closest to the
left antennae when the ball is in play.
Lift/Catch- “The ball is caught and/or thrown; it does not rebound from a hit
(9.3.3).” (FIVB, 2005).
NCAA- The National Collegiate Athletic Association
Offense- “The techniques and tactics of the team controlling the ball.” (Coleman
& Liskevych as cited by Coleman, 1975, p. 7).
Pass- “The controlled movement of the ball from one player to another on the
same team.” (Coleman & Liskevych as cited by Coleman, 1975, p. 8).
Right side hitter- When facing the net, the front-row player positioned closest to
the right antennae when the ball is in play.
Service- “The act of putting the ball into play, from the back right player, placed
in the service zone (12).” (FIVB, 2005).
Notational Analysis
32
Set- “A pass made overhand or underhand, hit into the air for the purpose of
placing the ball in position for the attack (hit).” (Coleman & Liskevych as cited by
Coleman, 1975, p. 8).
Setting performance- For the purpose of this study, setting performance will be
defined as the ball placement from a set that describes the distance the ball is from the
net, the height of the set, and the position of the ball in relation to the hitter.
Delimitations
1. This study delimits the sample size specific to Brigham Young University’s
women’s volleyball team, and even more specifically those athletes designated as a setter
by position who are eligible to compete. For the 2006 volleyball season, the Brigham
Young University roster has two athletes that meet these criteria which therefore qualifies
them as potential setters for the analysis. Consequently, sets performed by other players
who are in a position to set for a single possession during competition will not be
evaluated.
2. All data will be collected by the investigator. Since the investigator is a
member of the Brigham Young University women’s volleyball coaching staff, she is
familiar with the offensive systems and has a good knowledge of desired set location.
Assumptions
This study assumes that the skill of setting can be analyzed as a quantitative
statistic which coaches can reference when making decisions. In addition, this study

Notational Analysis
33
assumes that the height and position of the set can be analyzed together. For example, it
assumes that when a set is low, it is also either too far inside or too far outside.
Limitations
1. Analysis of game films may be limited to the position of the cameras. One
camera will be positioned to view the entire court from behind the end line. The second
camera will be aimed along a line 5 feet from the net and parallel to it. Consequently, this
sideline view will not be exactly parallel to where every set leaves the setters hands.
Therefore, the accuracy is slightly skewed.
2. The Data Volley software program (Data Project, Salerno, Italy, release 2.1.9)
will be used to evaluate the setting data. This program does limit the number of
possibilities that can be analyzed within its codes. However, all three independent
variables used in this study can be accounted for within the limits of the software
program.
3. Only films of home matches will be evaluated to control for the positioning of
cameras and views of the games.
Notational Analysis
34
Chapter 2
Review of Literature
Athletic notational systems were initially created to use hand recorded
information to provide a statistical analysis of a given event (Hughes, 1988). These
statistics provide numerous benefits for coaches and athletes. The data from these kinds
of statistics can provide evidence that a change in training routine or performance
technique is needed (Byra & Scott, 1983). Other uses for sports statistics include
identifying individual strengths and/or weaknesses, offering feedback about an individual
or team’s performance, motivating athletes, and evaluating performances throughout the
entire season (Byra & Scott, 1983). Perhaps the largest benefit to players and teams is the
ability to evaluate performance during competition (Ejem, 1980). Changes in strategy can
be made to better prepare for future matches against the same opponent.
The literature will be discussed in three different categories: (1) the history of
notational analysis, (2) notational analysis in other sports, and (3) notational analysis in
volleyball.
History of Notational Analysis
Notational analysis is a concept that has evolved from a hand notation system
used by Messersmith and Bucher in 1939 to a video analysis system aided by computers.
Messersmith and Bucher (1939) studied basketball players with the question of how far
one player travels during the course of one basketball game. Their results indicate that
college players in the Big Ten Conference traveled anywhere from 3.46 to 3.97 miles per
Notational Analysis
35
game. The comparison to secondary colleges showed similar averages while that of high
school basketball players was significantly less.
Downey is credited with starting the notational analysis of racket sports in 1973
(Hughes, 1998). However, his system was so complicated that many simply took from
him the idea of recording sport actions. For example, Sanderson and Way (1977) created
a hand notational analysis system for squash. Their system incorporated symbols to
denote racket strokes and proved to be incredibly useful in analyzing the game. However,
it was a labor intensive process requiring 40 hours of work to obtain a full analysis of one
match (Hughes, 1988). Since that time, notational analysis has been aided by film
recording, video analysis, and computers that are capable of processing an immediate
analysis of desired data.
Computers facilitate analysis of sport action by being able to record, analyze, and
recall the action or event (Franks & Nagelkerke, 1988). The data stored in computers is
useful as either feedback for athletes or information for the coach and investigator
(Franks & Nagelkerke, 1988). Analysis of sport actions prior to that time was performed
by either video analysis or even more traditionally, hand notational analysis. Franks,
Wilson, and Goodman (1987) demonstrate how useful computers have become in
offering analysis to coaches by applying a computer program to a field hockey team. This
system offers a detailed and quantifiable analysis of performance that coaches can use to
encourage a change in athlete technique and performance.
Notational analysis was developed as a way to objectively record, store, and recall
data collected from a sports performance. Franks and Miller (1986) determined that

Notational Analysis
36
attempting to recall information after a match cannot be totally reliable. Their results
determined that the probability of novice soccer coaches recalling events correctly after a
match was 42%. Their study also found that certain memorable events within the match
were recalled more easily than others. That is not to say, however, that using a notational
analysis system during the match would prove to be unreliable. In fact, coaches who
choose to use a subjective and qualitative analysis of their team can receive great
accuracy by recording the performance in some type of coded form (Franks & Goodman,
1986). That performance applies to both the individual athlete as well as the team since
they “produce observable behavior that can be objectively quantified” (Franks &
Goodman, 1986). Coaches should base their planning on objective measurements
(Hughes and Franks, 1997). Coding of athletic performance provides an objective
method of analyzing subjective material, thereby offering sports teams useful
information. The current study will use a type of computer software coding program that
has been specifically designed for volleyball.
Notational Analysis in Other Sports
Notational analysis has proven to be such a valuable source of feedback that most
sports are using some form of it to evaluate their teams. Research indicates a heavy
analytical focus placed upon the sports of soccer (Castellano, Mendo, de Segura,
Fontetxa, & Bueno, 2000; Grehaigne, Bouthier, & David, 1997; Luhtanen, Korhonen, &
Ilkka, 1995; Taylor, James, & Mellalieu, 2004) and squash (Hong, Robinson, & Chan,
1998; Hong, Robinson, Chan, Clark, & Choi, 1996; Sanderson, 1983; Sanderson & Way,

Notational Analysis
37
1977). However, tennis, badminton, field hockey, and Australian football are only a few
of the other specific examples that benefit from their own game analysis.
Several studies have analyzed various aspects of the game of soccer. Luhtanen et
al. (1995) created a video-based notational analysis system for the 1994 World Cup that
analyzes such traits as “different time, space and maneuver characteristics per player with
the ball.” They explain that this type of analysis is effective because it objectively
evaluates one’s own team and can also be useful when scouting opposing teams. A new
way of analyzing attacking moves was created by Grehaigne et al. (1997) while
Castellano et al. (2000) describes a new coding system that fully describes and analyzes
all actions that occur in soccer. In recent research, Taylor et al. (2004) used notational
analysis to evaluate corner kicks in soccer. His findings offer advice to coaches for corner
kick routines and also support previous research indicating that corner kicks present a
good scoring opportunity due to the frequent number of kicks attempted.
Squash also receives a great deal of attention and benefit from using notational
analysis. In 1977, Sanderson and Way first began to develop a hand notation system to
evaluate 17 different squash strokes. By 1983, Sanderson fully described his notation
system for squash by using symbols in its coding sequence to denote stroke types. From
this system, match summary information, such as length of rallies and number of winners
or errors, became quickly and easily accessible. In another study, two different scoring
methods for squash were analyzed (Hughes & Knight, 1995) with the conclusion that
there is no significant difference in the length of a rally. Hong et al. (1996, 1998) used a
video notation to analyze the world’s top male and female squash players. Their results

Notational Analysis
38
demonstrate that for the high level female athletes, winning a game depends on winning
shots rather than relying on opponents mistakes (1998). For the men, the results
demonstrate that the most important strategy is focus on the “pressure and attack game”
(1996). The researchers offer this method as a means for analyzing squash in all levels of
competition.
Early research for tennis evaluated serving and match-play strategies (King &
Baker, 1979) using mathematical-statistical methods. Recent research has adopted an
advanced computerized notational analysis system to demonstrate that singles tennis is
greatly influenced by both the gender of the player and the court surface they compete on
at the Grand Slam tournaments (O’Donoghue & Ingram, 2001).
Appleby & Dawson (2002) began analyzing the 1997 inaugural season of the
Australian Football League by means of video analysis. They evaluated the aspects of
marking opportunities, ruck contests, and kick ins from which coaches obtained valuable
information useful in creating applicable, game-like training drills.
In baseball, a qualitative method of analyzing 24 kinematic variables for pitching
technique was recently published by Nicholls, Fleisig, Elliott, Lyman, and Osinski
(2003). However, they concluded that their current protocol did not produce an accurate
profile analysis.
Blomqvist, Luhtanen, and Laakso (1998) determined the validity of a notational
analysis system for badminton. The system was found to be valid and reliable when
evaluating playing time, player position, and the type of shot, but less reliable for the
decision of the shot.

Notational Analysis
39
It is apparent from these examples that notational analysis has advanced
throughout the previous decades and is useful in most if not all sports in providing
information beneficial to coaches and athletes.
Notational Analysis of Volleyball Skills
Volleyball is one sport that has not been well researched from a performance
analysis (Daniel & Hughes, 2003). This is unfortunate due to the fact that in 1980 there
was an estimated 65 million volleyball players throughout the world (Vojik, 1980). This
number has undoubtedly increased over a period of twenty years, and as Vojik argues, is
in and of itself enough incentive to gather as much knowledge about the game as
possible. Data accumulation from notational analysis may be just as beneficial to the
game of volleyball as it is in other sports.
Notational analysis for volleyball became more prominent during the early 1970s
and proved to provide a valuable evaluation. Notational analysis was used to evaluate
various skills and provide information valuable to volleyball coaches. Coleman et al.
(1971) published a 5-point scoring system, ranging from 0 to 4, that is inversely related
for serving and passing. Using this system it becomes apparent that if the server scores a
4, the passer inversely scores a 0. The only exception to this occurs when the server
scores a 0 for missing the serve; the passer receives no score because there was no pass
attempted. Rose (1983) analyzed a variety of volleyball skills during the 1983 men’s
NCAA National Championship. He analyzed serving and passing using Coleman et al.
(1971) scoring system. His scoring system for backcourt defense used a 4-point scale,
ranging from 0-3, while hitting and blocking used a 5-point scale, ranging from 0-4.
Notational Analysis
40
Nothing is established to analyze setting in this study. Coleman (1992) also used a 5-
point notational system for blocking.
Several publications regarding volleyball analysis and statistics appeared in
Volleyball Technical Journal during the early 1980s. They provided useful information
and added to the knowledge of strategy and analysis of team performance. Unfortunately,
publication of the Volleyball Technical Journal was discontinued in 1986. Since that
time, research pertaining to volleyball analysis has not been as available.
Several different aspects of volleyball have been analyzed using notational
analysis. Buck and Harrison (1990) used video analysis in a beginning volleyball class to
describe game play patterns. Successful and unsuccessful trials for four volleyball skills
were tallied. The authors concluded that game play alone does not yield an improvement
in performance; rather instruction is needed with game-like drills to see improvement.
Daniel and Hughes (2003) created a hand notation system that would effectively evaluate
elite and non-elite volleyball players. Their results demonstrated a clear difference in the
execution and quality of skills between elite and non-elite players. Further analysis
revealed that for the elite teams, the quality of the attack hit depends upon the quality of
the set, which depends upon the quality of the pass or defense. A recent study evaluated
setting with aspects of attention and decision making (Sibley & Etnier, 2004). Their
results demonstrate that attention in setting increased both during the last segment of the
ball’s flight and due to the decision-making process.
Katsikadelli has published numerous studies analyzing the jump serve in
volleyball. His most recent study (Katsikadelli, 1998) analyzes the scoring percentages to
Notational Analysis
41
compare serve reception and the jump serve of the 1994 World Volleyball Championship
final and the 1995 European Volleyball Championship final. He reported that although
the jump serve is still the primary serve to hinder the opponent’s serve receive, teams are
now better prepared to receive a jump serve. Agelonidis (2004) adds his analysis to the
jump serve to explain its effectiveness and recent dominance in the sport of volleyball.
Over a ten-year period (1992-2002) the percentage of high level athletes competing with
a jump serve increased from 20.8% to 99.2%, which proved to be statistically significant
through a binomial test.
Among the most recently published studies to compare hitting and setting is that
of Palao, Santos, and Urena (2005). They evaluated Sydney, Australia’s 2000 Olympic
volleyball games to determine if the setter’s position on the court influenced the hitter’s
success. Their results indicate that for men, it did not matter whether the setter’s position
was in the front or back row. However, for women, hitting performance was enhanced
when the setter was positioned in the back row. Our current study may be useful in
providing additional input by analyzing the precision of the set when the setter is
positioned in the front row or the back row.
In order to analyze volleyball skills, a valid and reliable system needs to be in
place. Bartlett, Smith, Davis, and Peel (1991) describe a valid skills test as one that is
game-like and one that is administered by the instructor rather than student peers. Since
serving, passing, and setting are basic volleyball skills, they claim these skills tests
already have content validity. They created a setting skills test of their own to try and
incorporate these ideas. They gave a subject ten underhand tosses to attempt to set the
Notational Analysis
42
ball over a string to an outside hitter target area. This target area is given a 5-point scale.
If the set is the appropriate height and distance to the sideline it is awarded 5 or 4 points.
If the set is too close to the net or is too close to the center of the court, it is awarded 3, 2,
or 1 point. The retest was given after two days. This system is only used for the outside
set and is somewhat controlled due to the fact that the initial ball the subject receives
comes from a controlled toss. Our current study will analyze the quality of the set from
data collected during actual competition.
Downs and Wood (1996) modeled their Special Olympics volleyball skills
assessment test after the assessment used by Bartlett et al. (1991) at North Carolina State
University to evaluate serving and passing skills. Their test for setting, on the other hand,
was done differently to accommodate the Special Olympics participants. Their goal was
to alternate forearm passing and setting to a maximum of 25 actions of each skill for a
total of 50 points. To test for reliability the test and retest period was four days apart and
analyzed by canonical correlation analysis which confirmed moderately high reliability.
To test for validity, they evaluated criterion-related evidence and predictive validity.
Criterion-related validity was proven by the strong relationship between the judges’
ratings of performance and each subtest. Predictive validity was never proven to
absolutely determine placement of teams into groups of equal ability.
Unlike any other volleyball skill, setting is most often the only one that is
performed without being directly influenced by the opposing team (Coleman, 1975).
Setting is the only skill which follows a pass or dig from one’s own side of the net and is
completed before the attacker attempts to end the rally. Even so, several studies have
Notational Analysis
43
evaluated setting based on the result of the hit or play. We recognize, however, that it is
possible for a hitter to make an error even when given an excellent set. In this situation,
the excellent set does not get rewarded. The reverse scenario is also possible. A hitter
could possibly make an excellent play from a poor set. If the hitter obtains a kill, then the
set is incorrectly rewarded.
The following studies have all used some type of notational analysis system for
evaluating volleyball skills. Only the portions dedicated to setting analysis within each
study will be discussed here. Lirdla (1980) placed the set into one of three categories:
good, average, and poor. A good set basically guarantees success, while a poor set does
not. An average set score is awarded when “the attack is performed in strained
circumstances” (Lirdla, 1980). In this system, the setting score is quite vague and is
awarded based upon the result of the attack it creates, rather than awarding a score to the
set itself.
Eom and Schutz (1992) use a similar rating system but with a 5-point (0-4)
performance scale that applies to all six skills analyzed, including setting. A score of 0 is
awarded when there is an error that results in loosing the rally. A score of 1 is awarded
when there is a poor execution, but does not directly loose the rally. A score of 2 is
awarded for an average execution where neither team has a good opportunity to win the
rally. A score of 3 is awarded for a good execution that does not directly win the rally. A
score of 4 is awarded for an excellent execution. Although this study is more specific
than Lirdla’s study (1980), the individual skills evaluated also depend on the result and
do not evaluate the skill itself.
Notational Analysis
44
Eom and Schutz (1992) used their rating system to evaluate volleyball skills
involved in the Attack Process and the Counterattack Process. The Attack Process
includes the initial sequence of skills starting with the serve reception, to the set, and the
attack hit. The Counterattack Process, therefore, includes the sequence of skills from the
block, to the dig, to the set, and the attack hit. The analysis was performed on eight men’s
volleyball teams that were competing in the Third Federation of International Volleyball
Cup. The results suggest that setting for the Attack Process is essentially the same for
strong and weak teams. On the other hand, the top four teams outperformed the bottom
four teams on all skills involved in the Counterattack Process. Therefore, they conclude
that the quality of performance in volleyball skills (setting) for the Counterattack Process
appeared to be a factor in the team’s success.
Unlike other analyses, Coleman’s (1975) analysis attempts to evaluate the set
without the defensive influence on the play. He evaluates the set with a four point (0-3)
performance scale by comparing the suggested relationship between the effect of the set
and the score given for the set. A zero is awarded if the result of the set loses the point
and the rally. A one is awarded if the set is unhittable and a free ball is donated to the
opponents. A two is awarded if the set is not perfect, but is still hittable. A three is
awarded if the set is in the perfect position for the hitter. This system, however, still
evaluates setting from the result of the play.
Almost the same four point (0-3) performance scale used by Coleman (1975) was
used to analyze the set during an Olympiad by Sawula (1977). However, Sawula more
clearly defines losing the rally (score 0) as a ball handling error, the ball set too close to
Notational Analysis
45
the net, or a ball that is set over the net. Sawula also specifies that an excellent set (score
3) provides every chance for the hitter to score, regardless of whether or not he does
score. His rationale for an excellent set describes the set as a good distance from the net,
good placement, and good height. This rationale is correct in idea; however, the
descriptions are still vague and open to interpretation. Using similar rationale, the current
study attempts to objectively quantify the term “good.”
The most detailed notational analysis system that evaluates setting actually uses
three different indices to describe the set (Vojik, 1980). The 1st index is the type of set
with 12 possibilities that physically describe the set. The 2nd index is the place at the net
from sideline to sideline where the ball is contacted and is given five possibilities. This
index examines where the set location is across the width of the court and appears to be
similar to the 1st index which details the type of set. It is similar in the fact that generally
a type of set has a designated position on the court to which it is executed to. The 3rd
index is labeled the quality of set and has seven possibilities. The scoring system for this
index awards the set by reflecting on the actions of the opponents block. While this was a
beneficial analysis during its time, none of these indices indicate whether the placement
of the set is what the coach’s desire. What appears to be missing is a system of analysis
that examines the specific location of the set from the distance to the net and whether the
intended set was precisely executed.
The computer program developed by Doug Penner (1985) to code a volleyball
match requires entry of a 3-point rating system for the set. A zero is awarded if there is an
error, hitter error, or an over-set. A one is awarded if the hitter is blocked or the play
Notational Analysis
46
continues. A two is awarded if the hitter kills the ball. This system again, evaluates
setting based upon the hitter’s performance. We, for the purpose of this study, plan to use
a computer software program, similar in idea to the one Penner developed, to analyze
setting performance. However, the current setting analysis will be much more detailed.
The Canadian Volleyball Association (1985) published the statistical system used
to evaluate men’s volleyball during the 1984 Olympics held in Los Angeles. Their
statistical report for every match offers information regarding the attack, block, serve
reception, serve, and errors. Again, there was no analysis of setting. A similar type of
statistical report is currently being used in NCAA Division I women’s volleyball
matches. However, now there is an assist category, which is the only statistic available to
evaluate setting performance during a match. A set is credited as an assist only if the
intended hitter is credited with a kill and is therefore a reflection of the hitter’s ability to
terminate the rally, rather than the setter’s execution of the set.
The goal of any set is to achieve a high level of accuracy (Tant, Lamack, &
Greene, 1993). Therefore, it is a skill requiring a great deal of precision in order to create
the ideal attacking opportunity. Ironically, setting is the most subjective skill in volleyball
which makes it the hardest to evaluate (Lirdla, 1980). Therefore, the interactions of the
pass, set, and hit are hard to interpret (Coleman, 1975). This might explain why no study
has solely devoted its focus to the evaluation of the set. Nearly all the publications cited
in this review include setting as only a portion of the study, and many evaluate setting
based on the result of the play.

Notational Analysis
47
However, setting is a skill that should be analyzed independent of what the
opponents do to defend the offensive attack (Coleman, 1975). With this in mind, the set is
then evaluated based on the quality of the set itself, rather than the performance of the
hitter or the defense. Consequently, there exists a need to develop a notational analysis
system to solely evaluate the volleyball set, independent of everything else. Doing so
could potentially aid coaches and conferences around the nation in confidently evaluating
setting performance and precision. Conferences might then be more confident in
recognizing the best setters by independently evaluating their performance.
Notational Analysis
48
Chapter 3
Methods
This study develops a notational analysis system that evaluates setting
performance through three variables, the distance the ball is to the net, the height of the
set, and the position of the set in relation to the hitter. An expert committee comprised of
four NCAA Division I coaches have established these criteria as an effective evaluation
of setting performance. These three variables will be evaluated from filmed volleyball
games. Two cameras will be set up to film each competition to be analyzed. One camera
will be set up behind the end line to view the entire court. The second camera will be set
up along a line parallel to the net and five feet from it. This camera will hence only view
Brigham Young University’s side of the net. The investigator will synchronize both
views of the match to a detailed code of all volleyball skills performed within the match.
A coworker trained to interpret volleyball skills will input the detailed code into the Data
Volley software program (Data Project, Salerno, Italy, release 2.1.9). As a result,
evaluating two different views of the same set becomes possible and aids the study in
achieving an accurate evaluation.
The filmed games will include all home matches between the Brigham Young
University women’s volleyball team and opponents during the 2006 season. Only sets
from eligible designated setters will be analyzed from each of the game films.
Consequently, sets from other players who are in a position to set for a single possession
during competition will not be evaluated.
Notational Analysis
49
Although several different actions can be performed by the setter (a dump, a pass
set, a one-handed set, the two-handed overhead set), the only setting action that will not
be evaluated is the dump. A dump is considered an attack hit and therefore does not
qualify as a variable in this study. Since this study will focus on the precision of the
setter’s ball location rather than the technique used, the evaluation will not differentiate
between the pass set, one-handed set, and the two-handed overhead set.
Notational Analysis Coding
Data entry will be performed using the Data Volley software program. Certain
limitations regarding the number of possible scenarios exist for the coding that can be
performed within this program. Although this slightly influences how setting can be
evaluated, the three major variables involved in a set will be accounted for and thus
included in the analysis. The coding is set up to record five digits (for example: 15EH+).
The first two digits represent the player’s number. The third digit represents the action of
the set (automatically coded with an E). The fourth digit represents the distance to the
net, and is only allotted five possible scenarios (Q, H, T, M, L) from the software. The
fifth and last digit represents the final placement of the set and is only allotted six
possible scenarios (#, +, !, -, /, =) from the software. Our interpretations of these
scenarios are outlined as follows.
Distance from the Net. Five different codes are used to describe the distance of
the set from the net (Table 1). This distance will be determined from the sideline view
camera. From this coding, all hitting positions can be evaluated. However, due to a
hitter’s specific position, certain distance to the net codes will most likely not be utilized.
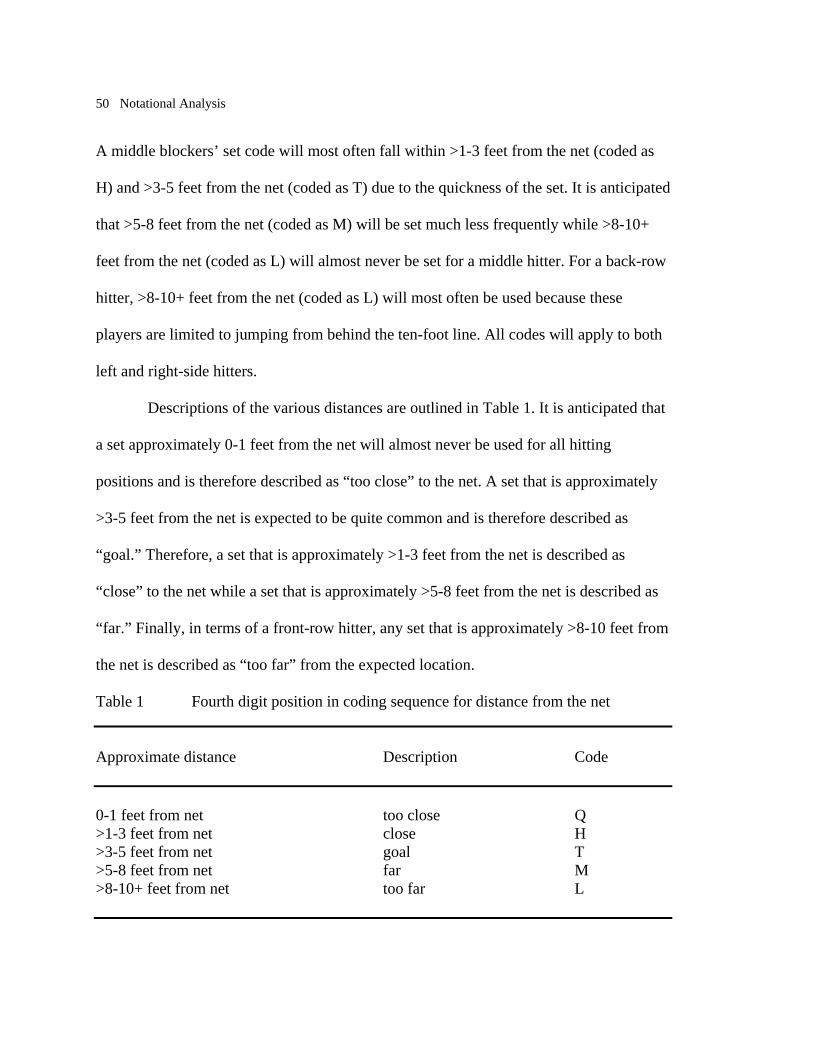
Notational Analysis
50
A middle blockers’ set code will most often fall within >1-3 feet from the net (coded as
H) and >3-5 feet from the net (coded as T) due to the quickness of the set. It is anticipated
that >5-8 feet from the net (coded as M) will be set much less frequently while >8-10+
feet from the net (coded as L) will almost never be set for a middle hitter. For a back-row
hitter, >8-10+ feet from the net (coded as L) will most often be used because these
players are limited to jumping from behind the ten-foot line. All codes will apply to both
left and right-side hitters.
Descriptions of the various distances are outlined in Table 1. It is anticipated that
a set approximately 0-1 feet from the net will almost never be used for all hitting
positions and is therefore described as “too close” to the net. A set that is approximately
>3-5 feet from the net is expected to be quite common and is therefore described as
“goal.” Therefore, a set that is approximately >1-3 feet from the net is described as
“close” to the net while a set that is approximately >5-8 feet from the net is described as
“far.” Finally, in terms of a front-row hitter, any set that is approximately >8-10 feet from
the net is described as “too far” from the expected location.
Table 1 Fourth digit position in coding sequence for distance from the net Approximate distance Description Code 0-1 feet from net too close Q >1-3 feet from net close H >3-5 feet from net goal T >5-8 feet from net far M >8-10+ feet from net too far L

Notational Analysis
51
Height and Position of the Set. The final digit representing the placement of the
set will be subcategorized into six coded possibilities (Table 2). A setting error will be
categorized as any setting violation called by the first referee (lift, or double contact). The
height of the set and the position of the set will be represented by a single coded variable.
The position of the set refers to whether the ball is too far inside or outside in relation to
the hitter. A set will be classified as inside when the ball is set more towards the center
of the court. A set will be classified as outside when the ball is set more towards the side
lines of the court. A set will be classified as high when the maximum height of the ball is
above the desired set location. When the maximum height of the ball is below the
desired set location the set will be considered too low. This study assumes that the height
and position of the set can be analyzed together. Therefore, when a set is too low or too
high, it is also either too far inside or too far outside the hitter. Likewise, when a set is
inside or outside in relation to the hitter, it is also either too high or too low. Since the
investigator is a member of the Brigham Young University women’s volleyball coaching
staff, she is very familiar with the offensive systems and is familiar with the desired set
location.
Any timing related errors between the hitter and the setter will be analyzed in
terms of the set. If a poor set causes a timing related error between the hitter and setter,
the poor set will be reflected within the evaluation. Likewise, if a good set was performed
and the hitter causes poor timing, the good set will be reflected within the evaluation.
Therefore, the setting evaluation will be performed independent of the hitter’s
performance and will not be classified as a setting error.
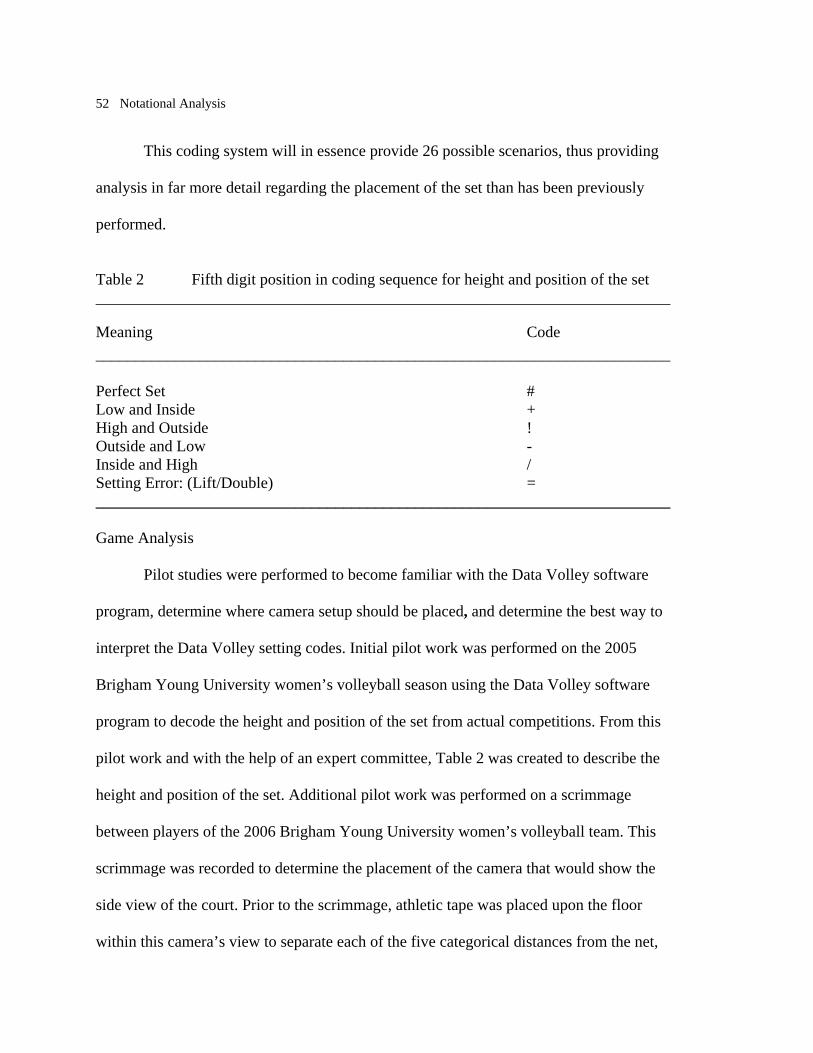
Notational Analysis
52
This coding system will in essence provide 26 possible scenarios, thus providing
analysis in far more detail regarding the placement of the set than has been previously
performed.
Table 2 Fifth digit position in coding sequence for height and position of the set ________________________________________________________________________
Meaning Code ________________________________________________________________________ Perfect Set # Low and Inside + High and Outside ! Outside and Low - Inside and High / Setting Error: (Lift/Double) = ________________________________________________________________________
Game Analysis
Pilot studies were performed to become familiar with the Data Volley software
program, determine where camera setup should be placed, and determine the best way to
interpret the Data Volley setting codes. Initial pilot work was performed on the 2005
Brigham Young University women’s volleyball season using the Data Volley software
program to decode the height and position of the set from actual competitions. From this
pilot work and with the help of an expert committee, Table 2 was created to describe the
height and position of the set. Additional pilot work was performed on a scrimmage
between players of the 2006 Brigham Young University women’s volleyball team. This
scrimmage was recorded to determine the placement of the camera that would show the
side view of the court. Prior to the scrimmage, athletic tape was placed upon the floor
within this camera’s view to separate each of the five categorical distances from the net,

Notational Analysis
53
as outlined in Table 1. From this scrimmage, the investigator became comfortable in
viewing these five separate distances from the net.
Once the game films of the 2006 volleyball season matches are captured and
copied into the Data Volley software program, it will be saved and recorded into the
computer. A trained coworker will break down the film to code for all volleyball actions,
including serving, passing, setting, hitting, blocking, and defense. This coworker was
trained to use the Data Volley software program under the supervision of Brigham Young
University head women’s volleyball coach, Jason Watson. This coworker will code any
set with a default code (15EH+) in which the only variable the coworker might change is
the player number. The investigator will then use the first three digits of the code to
access the designated setter of the game and begin analyzing the final two digits of the
code.
Using the Data Volley software program, the same trained coworker will record
the pass and dig based on a six scenario system. A perfect pass/dig (coded as #) generates
no movement by the setter and all offensive options. A good pass/dig (coded as +)
produces a pass within five feet of perfect and still possesses all offensive options. A
level two pass/dig (coded as!) is one that produces only two offensive options. A level
one pass/dig (coded as -) is one that produces only one offensive option. A level zero
pass/dig is awarded when a player gets aced (coded as =) or creates an overpass yielding
in an immediate point for the opponent (coded as /). From this data, the investigator can
examine the probability of obtaining any set outlined within this study from the quality of
passing performance.
Notational Analysis
54
Although the timing between the hitter and setter is important and is normally a
factor within many setting analyses, the only relationship tying the hitter to the setter for
the evaluation portion of this study occurs at the point in which the hitter contacts the ball
and in the statistical analysis. Since the set is performed along the pathway of the pass, it
is impossible to obtain a parallel view of every set seen in the sideline view camera.
Therefore, in order to determine the distance from the net in the evaluation, the exact
distance to be evaluated occurs at the point in which the hitter contacts the ball.
Analysis for the matches will be completed after both camera angles have been
copied into the computer and then synchronized to the coworker’s codes. To establish
reliability of the evaluation of the set, an additional evaluation of three randomly selected
matches will be performed. The same investigator will perform all volleyball game
setting evaluations.
Statistical Analysis
Every time the ball is on Brigham Young University’s side of the net, there is a
sequence of events that follows one of the following patterns: serve-outcome, pass-set-
attack-outcome, or block-dig-set-attack-outcome. The outcome is a point for BYU, a
point for the opponent, or continuation of play. It is assumed that these sequences are
Markov chains where the quality of each contact depends on the quality of the previous
contact but not on contacts further removed in the sequence. The probabilities for the
sequences are represented in an extensive matrix of transition probabilities with over 100
rows and columns. The rows of the matrix represent the first graded serve, pass, set,
attack, dig, block, or outcome in the sequence, and the columns represent the next event.

Notational Analysis
55
Thus, the elements of the matrix are the probabilities of moving from one state to
another. Impossible sequences, such as a serve to another serve, are constrained to have
zero probability. Other sequences known to always occur (e.g., service error to opponent
scoring) are assigned a probability of one. A Bayesian paradigm will be used to model
the unknown transition probabilities. A multinomial likelihood and prior probability
densities for transition probabilities are assumed to be distributed as Dirichlet variables.
Markov chain Monte Carlo methods will then be used to produce posterior distributions
of the transition probabilities. It is proposed that the maximum of the posterior
distribution be used as the point estimate to be inserted into the transition matrix. The
transition matrix will then be used to answer questions about relative skill importance of
setting.
Independent Variables
The independent variables include the setting distance from the net, the height of
the set, and the position of the set in relation to the hitter.
Dependent Variables
Although setting will be analyzed independent of an outcome, the outcome of the
rally will be determined for the statistical analysis through the Data Volley program. The
dependent variable in this study is the outcome of the attack hit, which includes four
possible outcomes. The attack hit will be evaluated as either a kill (coded as #), as dug by
the opponent and kept in play (coded as +), as an error (coded as =), or as blocked by the
opponent (coded as /).

Notational Analysis
56
Anticipated Results
From the analysis of the data, we hope to determine the importance of the set
relative to an outcome. Conclusions regarding the effect of a good set will be made by
analyzing the probabilities of certain sets leading to positive or negative outcomes. The
statistical analysis will provide information estimating the transitional probabilities of
moving from one skill at a certain level to another skill at certain level. We anticipate that
a better set will lead to a better hitting performance.
Notational Analysis
57
References
Agelonidis, Y. (2004). The jump serve in volleyball: From oblivion to dominance.
Journal of Human Movement Studies, 47(3), 205-213.
Appleby, B., & Dawson, B. (2002). Video analysis of selected game activities in
Australian rules football. Journal of Science and Medicine in Sport, 5(2), 129-
142.
Bartlett, J., Smith, L., Davis, K., & Peel, J. (1991). Development of a valid volleyball
skills test battery. Journal of Physical Education, Recreation & Dance, 62(2), 19-
21.
Blomqvist, M., Luhtanen, P., & Laakso, L. (1998). Validation of a notational analysis
system in badminton. Journal of Human Movement Studies, 35(3), 137-150.
Buck, M., & Harrison, J. (1990). An analysis of game play in volleyball. Journal of
Teaching in Physical Education, 10, 38-48.
Byra, M., & Scott, A. (1983). A method for recording team statistics in volleyball.
Volleyball Technical Journal, 7(3), 39-44.
Canadian Volleyball Association. (1985). The volleyball statistical system used at the
1984 Olympics. Volleyball Technical Journal, 8(1), 7-11.
Castellano, J., Mendo A. H., de Segura, P. G., Fontetxa, E., Bueno, I. (Nov 2000).
Codification system and data quality analysis in top level soccer. Psicothema,
12(4), 635-641.
Notational Analysis
58
Coleman, J. E. (1975). A statistical evaluation of selected volleyball techniques at the
1974 world’s volleyball championships. Unpublished doctoral dissertation,
Brigham Young University, Provo, Utah.
Coleman, J. E. (1992). Evaluation of blocking. Coaching Volleyball, April/May, 6-10.
Coleman, J. E., Neville, B., & Gordon, B. (1971). A statistical system for volleyball and
its use in Chicago women’s association. International Volleyball Review,
27(April), 72-73.
Daniel, R., & Hughes, M. (2003). Playing patterns of elite and non-elite volleyball.
Journal of Sports Sciences (London), 21(4), 268.
Downs, S. B., & Wood, T. M. (1996). Validating a Special Olympics volleyball skills
assessment test. Adapted Physical Activity Quarterly, 13, 166-179.
Ejem, M. (1980). Some theoretical aspects of statistical game analysis utilization in
player’s performance evaluation. Volleyball Technical Journal, 5(3), 43-48.
Eom, H. J., & Schutz, R. W. (1992). Statistical analyses of volleyball team performance.
Research Quarterly for Exercise and Sport, 63(1), 11-18.
Federation Internationale de Volleyball. (2005). Official volleyball rules 2005. Lausanne,
Switzerland: Author.
Franks, I. M., & Goodman, D. (1986). A systematic approach to analyzing sports
performance. Journal of Sport Sciences, 4, 49-59.
Franks, I. M., & Miller, G. (1986). Eyewitness testimony in sport. Journal of Sport
Behavior, 9, 38-45.
Notational Analysis
59
Franks, I. M., & Nagelkerke, P. (1988). The use of computer interactive video in sport
analysis. Ergonomics, 31(11), 1593-1603.
Franks, I. M., Wilson G.E., & Goodman, D. (1987). Analyzing a team sport with the aid
of computers. Canadian Journal of Sport Sciences, 12, 120-125.
Grehaigne, J. F., Bouthier, D., & David, B. (1997). A method to analyse attacking moves
in soccer. Science and Football III; Proceedings of the Third World Congress of
Science and Football, Cardiff, Wales, 9-13 April, 1995, 258-264.
Hong, Y., Robinson, P. D., & Chan, W. K. (March 1998). Game strategy used by the
world’s top female squash players in international competition-a notational
analysis. Women in Sport & Physical Activity Journal (Las Vegas), 7(1), 27-33.
Hong, Y., Robinson, P. D., & Chan, W. K., Clark, C. R., & Choi, T. (1996). Notational
analysis on game strategy used by the world’s top male squash players in
international competition. Australian Journal of Science and Medicine in Sport,
28(1), 18-23.
Hughes, M. (1988). Computerized notation analysis in field games. Ergonomics, 31(11),
1585-1592.
Hughes, M. (1998). The application of notational analysis to racket sports. Science and
Racket Sports, II, 211-220.
Hughes, M., & Franks, I. M. (1997). Notational Analysis of Sport. London: E & FN
Spon.
Notational Analysis
60
Hughes, M., & Knight, I. (1995). A comparison of playing patterns of elite squash
players, using English scoring to point-per-rally scoring. Science and Racket
Sports, London; E & FN Spon, 257-259.
Katsikadelli, A. (1998). Reception and the attack serve of the world’s leading volleyball
teams. Journal of Human Movement Studies, 34, 223-232.
King, H.A., & Baker J.A.W. (1979). Statistical analysis of service and match-play
strategies in tennis. Canadian Journal of Applied Sport Science, 4, 298-301.
Lirdla, D.G. (1980). Statistical study of individual ball play. Volleyball Technical
Journal, 5(3), 31-34.
Luhtanen, P., Korhonen, V., & Ilkka, A. (1995). Comparison of Brazil and her opponents
in the 1994 World Cup using a new notational analysis system. Journal of Sports
Sciences (London), 13(6), 515-516.
Messersmith, L.L., & Bucher, C.C. (1939). The distance traversed by Big Ten basketball
players. Research quarterly of the American Association for Health, Physical
Education, and Recreation, 10, 61-62.
Nicholls, R., Fleisig, G., Elliott, B., Lyman, S., & Osinski, E. (2003). Accuracy of
qualitative analysis for assessment of skilled baseball pitching technique. Sport
Biomechanics, 2(2), 213-226.
O’Donoghue, P. & Ingram, B. (2001). A notational analysis of elite tennis strategy.
Journal of Sports Sciences, 19, 107-115.
Palao, J. M., Santos, J. A. & Urena, A. (2005). The effect of the setter’s position on the
spike in volleyball. Journal of Human Movement Studies, 48, 25-40.

Notational Analysis
61
Penner, D. (1985). Computer volleyball stats. Volleyball Technical Journal, 8(1), 116-
127.
Rose, R. (1983). Statistical analysis at the 1983 men’s N.C.A.A. national championship.
Volleyball Technical Journal, 7(3), 15-17.
Sanderson, F. H. (1983). A notation system for analyzing squash matches. Physical
Education Review, 6(1), 18-23.
Sanderson, F. H., & Way, K. I. M. (December 1977). The development of objective
methods of game analysis in squash rackets. British Journal of Sports Medicine,
11(4), 188.
Sawula, L. (1977). Individual action plan. Volleyball Technical Journal, 3(1), 2-8.
Sibley, B. A. & Etnier, J. L. (2004). Time course of attention and decision making during
a volleyball set. Research Quarterly for Exercise and Sport, 75(1), 102-106.
Tant, C. L., Lamack, D., & Greene, B. (1993). A biomechanical and physiological
analysis of the volleyball jump set. National Strength and Conditioning
Association Journal, 15(4), 25-30.
Taylor, J. B., James, N., & Mellalieu, S. D. (2004). Notational analysis of corner kicks in
the English Premier League. Journal of Sports Sciences (London), 22(6), 518-519.
Vojik, J. (1980). Several remarks to a system of accumulating data in volleyball.
Volleyball Technical Journal, 5 (3), 35-41.

Notational Analysis
62
Appendix A1
Excerpt from Data Volley Text File

Notational Analysis
63
[Match] 10/21/2006;;;;;;;;1;1;;;DVSW Release 3.7.5; [Team] BYU;BYU;3;Watson Jason;Huebner Aldridge; SDSU;San Diego State;0;Warner Mark;; [Oders] ;;;;;;;15;6; [MatchComments] ;;;; [Set] True;10-6;20-15;25-16;30-20;23; True;10-4;20-19;25-20;30-22;31; True;6 -10;17-20;26-25;30-27;29; True;;;;;; True;;;;;; [Player1] 0;1;10;1;1;1;;;GOO-CHE;Goodman;;; 0;2;11;*;*;*;;;BEA-JAN;Beaumont;L;; 0;3;12;;;;;;EVA-LIN;Evans;L;; 0;4;13;2;2;;;;HAN-ASH;Hansen;;; 0;5;14;;;;;;RIC-LAU;Richards;C;; 0;6;15;;;;;;STI-TES;Stimpson;;; 0;7;16;4;4;4;;;WIL-KIM;Wilson;;; 0;8;17;;;2;;;VAN-MAR;Vandersteen;;; 0;9;18;;;;;;BRO-LEX;Brown;;; 0;10;19;3;3;3;;;LOT-ERI;Lott;;; 0;11;20;*;*;*;;;KEM-ANI;Kemp;L;; 0;12;21;;;;;;PAR-CAT;Parker;;; 0;13;22;;;;;;POR-BRY;Porter;;; 0;14;23;5;5;5;;;HAR-LIN;Hartsock;C;; 0;15;24;6;6;6;;;SCH-AMY;Schlauder;;; 0;16;25;;;;;;LAU-STE;Lau;;; 0;20;26;;;;;;JUD-JEN;Judkins;;; 0;24;27;;;;;;DYE-RAC;Dyer;;; [Player2] 1;1;1;;;;;;VER-ANG;Verdenacci;;; 1;2;2;;;;;;MOR-KAR;Moriarty;;; 1;3;3;3;5;5;;;BOW-ASH;Bowker;;; 1;9;4;;6;6;;;STA-MEL;Stapley;;; 1;10;5;4;4;4;;;DEN-AUD;Dent;;; 1;12;6;;;;;;DYK-KAR;Dykema;;; 1;17;7;;;;;;XAV-LUC;Xavier;;; 1;19;8;;;;;;LOU-BAR;Louie;;; 1;20;9;;;;;;PIE-JEN;Pierson;;; [Scout] *P15;;;;;;;19.09.56;1;1;1;;;; aP6;;;;;;;19.09.56;1;1;1;;;; *z6;;;;;;;19.09.56;1;6;1;;;; az1;;;;;;;19.09.56;1;6;1;;;;
01SQ+;;;;;;;19.09.52;1;6;1;1;20;; 65RQ+;;;;;;;19.09.52;1;6;1;1;20;; 65AM#PM;s;r;;;;;19.09.56;1;6;1;1;25;; 49&H=;s;;;;;;19.09.56;1;6;1;1;25;; ap00:01;;;;;;;19.10.01;1;6;1;1;30;; az6;;;;;;;19.10.01;1;6;6;1;30;; 61SH+;;;;;;;19.10.14;1;6;6;1;43;; 11RH!;;;;;;;19.10.14;1;6;6;1;43;; 15EL/;;;;;;;19.10.18;1;6;6;1;47;; 07AM#PM;s;r;;;;;19.10.19;1;6;6;1;48;; 99&H=;s;;;;;;19.10.19;1;6;6;1;48;; *p01:01;;;;;;;19.10.21;1;6;6;1;50;; *z5;;;;;;;19.10.21;1;5;6;1;50;; 11SQ+;;;;;;;19.10.37;1;5;6;1;66;; 65RQ+;;;;;;;19.10.37;1;5;6;1;66;; 65AT+PW;;r;;;;;19.10.40;1;5;6;1;69;; 11DH+;;;;;;;19.10.44;1;5;6;1;73;; 15ET#;;;;;;;19.10.45;1;5;6;1;74;; 14AQ#P2;p;p;;;;;19.10.45;1;5;6;1;74;; 99&H=;p;;;;;;19.10.45;1;5;6;1;74;; *p02:01;;;;;;;19.10.52;1;5;6;1;81;; 11SQ+;;;;;;;19.10.59;1;5;6;1;88;; 65RQ!;;;;;;;19.10.59;1;5;6;1;88;; 65AM=PH;p;r;;;;;19.11.03;1;5;6;1;92;; 49&H#;p;;;;;;19.11.03;1;5;6;1;92;; *p03:01;;;;;;;19.11.08;1;5;6;1;97;; 11SQ=;s;;;;;;19.11.20;1;5;6;1;109;; 99&H#;s;;;;;;19.11.20;1;5;6;1;109;; ap03:02;;;;;;;19.11.24;1;5;6;1;113;; az5;;;;;;;19.11.24;1;5;5;1;113;; 55SH-;;;;;;;19.11.47;1;5;5;1;136;; 01RH#;;;;;;;19.11.47;1;5;5;1;136;; 15EH-;;;;;;;19.11.50;1;5;5;1;139;; 14AQ+P3;;r;;;;;19.11.51;1;5;5;1;140;; 65AH+PS;;p;;;;;19.11.53;1;5;5;1;142;; 15DH=;p;;;;;;19.11.55;1;5;5;1;144;; 99&H#;p;;;;;;19.11.55;1;5;5;1;144;; ap03:03;;;;;;;19.11.59;1;5;5;1;148;; 55SH-;;;;;;;19.12.09;1;5;5;1;158;; 11RH#;;;;;;;19.12.09;1;5;5;1;158;; 15ET#;;;;;;;19.12.12;1;5;5;1;161;; 07AM+PH;;r;;;;;19.12.12;1;5;5;1;161;; 65AM+PM;;p;;;;;19.12.16;1;5;5;1;165;; 07DH+;;;;;;;19.12.18;1;5;5;1;167;; 15ET#;;;;;;;19.12.19;1;5;5;1;168;; 14AQ=P2;p;s;;;;;19.12.21;1;5;5;1;170;; 99&H#;p;;;;;;19.12.21;1;5;5;1;170;; ap03:04;;;;;;;19.12.26;1;5;5;1;175;;

Notational Analysis
64
Appendix B
Additional Result
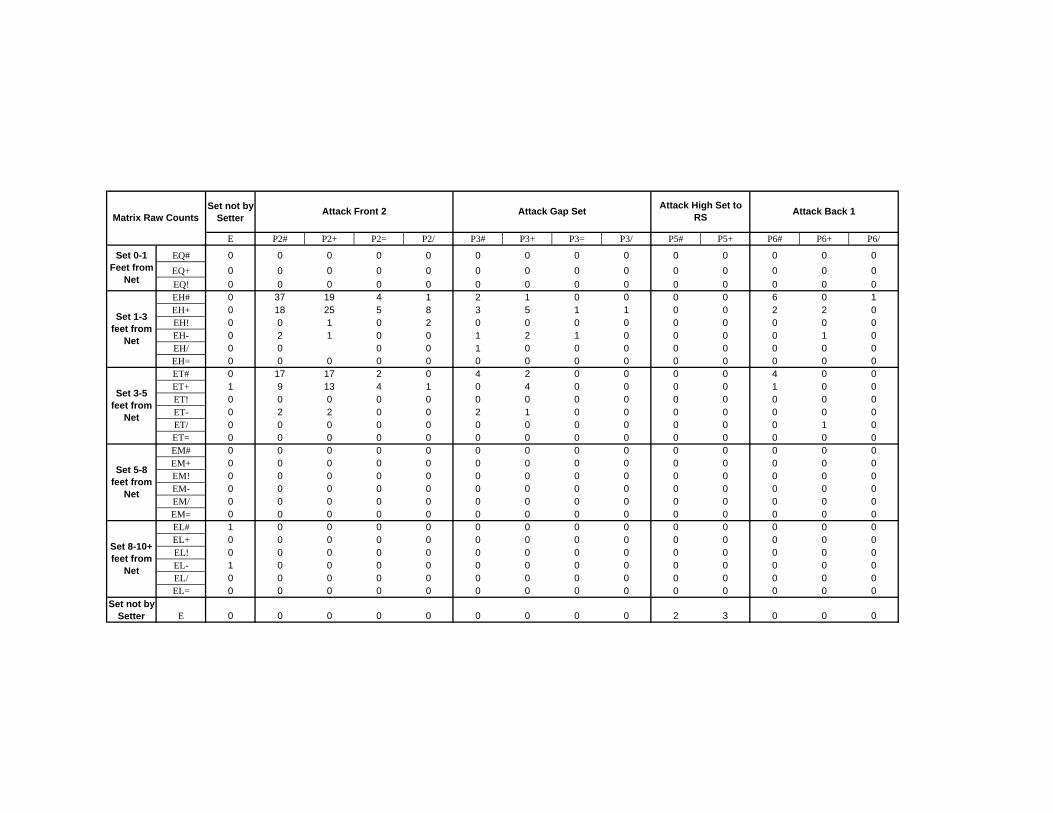
Matrix Raw CountsSet not by
SetterAttack Front 2 Attack Gap Set Attack High Set to
RS Attack Back 1
E P2# P2+ P2= P2/ P3# P3+ P3= P3/ P5# P5+ P6# P6+ P6/
Set 0-1 Feet from
Net
EQ# 0 0 0 0 0 0 0 0 0 0 0 0 0 0EQ+ 0 0 0 0 0 0 0 0 0 0 0 0 0 0EQ! 0 0 0 0 0 0 0 0 0 0 0 0 0 0
Set 1-3 feet from
Net
EH# 0 37 19 4 1 2 1 0 0 0 0 6 0 1EH+ 0 18 25 5 8 3 5 1 1 0 0 2 2 0EH! 0 0 1 0 2 0 0 0 0 0 0 0 0 0EH- 0 2 1 0 0 1 2 1 0 0 0 0 1 0EH/ 0 0 0 0 1 0 0 0 0 0 0 0 0EH= 0 0 0 0 0 0 0 0 0 0 0 0 0 0
Set 3-5 feet from
Net
ET# 0 17 17 2 0 4 2 0 0 0 0 4 0 0ET+ 1 9 13 4 1 0 4 0 0 0 0 1 0 0ET! 0 0 0 0 0 0 0 0 0 0 0 0 0 0ET- 0 2 2 0 0 2 1 0 0 0 0 0 0 0ET/ 0 0 0 0 0 0 0 0 0 0 0 0 1 0ET= 0 0 0 0 0 0 0 0 0 0 0 0 0 0
Set 5-8 feet from
Net
EM# 0 0 0 0 0 0 0 0 0 0 0 0 0 0EM+ 0 0 0 0 0 0 0 0 0 0 0 0 0 0EM! 0 0 0 0 0 0 0 0 0 0 0 0 0 0EM- 0 0 0 0 0 0 0 0 0 0 0 0 0 0EM/ 0 0 0 0 0 0 0 0 0 0 0 0 0 0EM= 0 0 0 0 0 0 0 0 0 0 0 0 0 0
Set 8-10+ feet from
Net
EL# 1 0 0 0 0 0 0 0 0 0 0 0 0 0EL+ 0 0 0 0 0 0 0 0 0 0 0 0 0 0EL! 0 0 0 0 0 0 0 0 0 0 0 0 0 0EL- 1 0 0 0 0 0 0 0 0 0 0 0 0 0EL/ 0 0 0 0 0 0 0 0 0 0 0 0 0 0EL= 0 0 0 0 0 0 0 0 0 0 0 0 0 0
Set not by Setter E 0 0 0 0 0 0 0 0 0 2 3 0 0 0
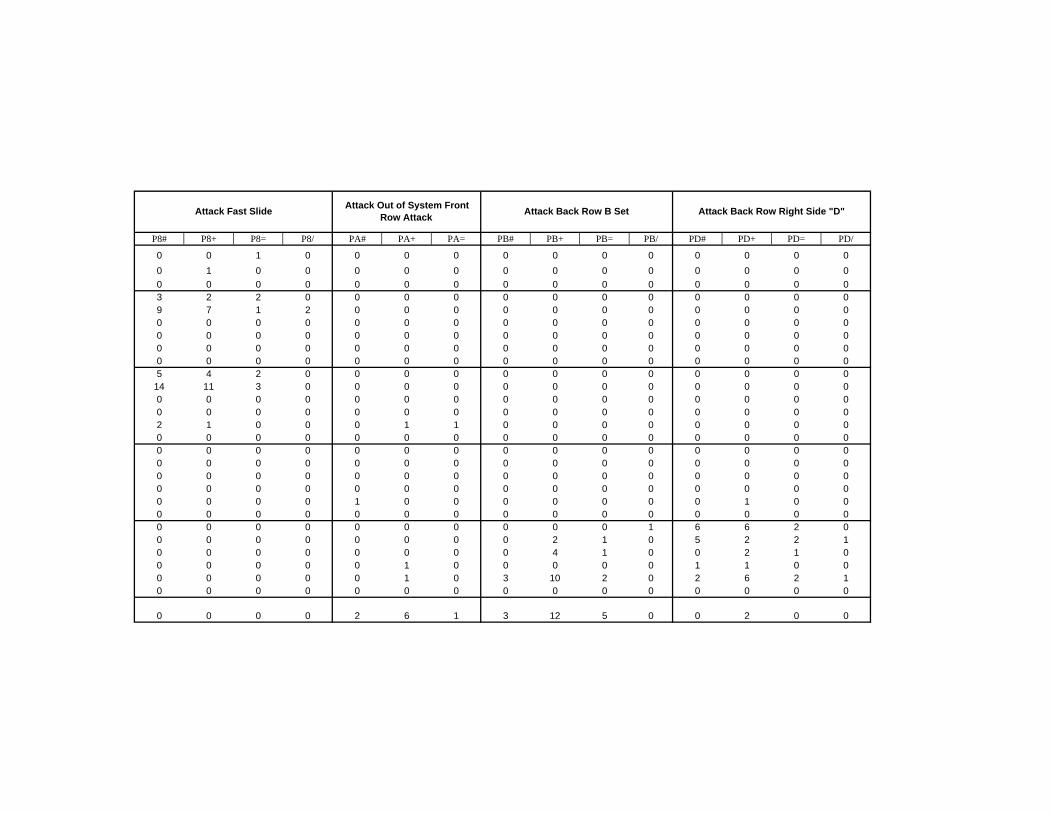
Attack Fast Slide Attack Out of System Front Row Attack Attack Back Row B Set Attack Back Row Right Side "D"
P8# P8+ P8= P8/ PA# PA+ PA= PB# PB+ PB= PB/ PD# PD+ PD= PD/
0 0 1 0 0 0 0 0 0 0 0 0 0 0 00 1 0 0 0 0 0 0 0 0 0 0 0 0 00 0 0 0 0 0 0 0 0 0 0 0 0 0 03 2 2 0 0 0 0 0 0 0 0 0 0 0 09 7 1 2 0 0 0 0 0 0 0 0 0 0 00 0 0 0 0 0 0 0 0 0 0 0 0 0 00 0 0 0 0 0 0 0 0 0 0 0 0 0 00 0 0 0 0 0 0 0 0 0 0 0 0 0 00 0 0 0 0 0 0 0 0 0 0 0 0 0 05 4 2 0 0 0 0 0 0 0 0 0 0 0 0
14 11 3 0 0 0 0 0 0 0 0 0 0 0 00 0 0 0 0 0 0 0 0 0 0 0 0 0 00 0 0 0 0 0 0 0 0 0 0 0 0 0 02 1 0 0 0 1 1 0 0 0 0 0 0 0 00 0 0 0 0 0 0 0 0 0 0 0 0 0 00 0 0 0 0 0 0 0 0 0 0 0 0 0 00 0 0 0 0 0 0 0 0 0 0 0 0 0 00 0 0 0 0 0 0 0 0 0 0 0 0 0 00 0 0 0 0 0 0 0 0 0 0 0 0 0 00 0 0 0 1 0 0 0 0 0 0 0 1 0 00 0 0 0 0 0 0 0 0 0 0 0 0 0 00 0 0 0 0 0 0 0 0 0 1 6 6 2 00 0 0 0 0 0 0 0 2 1 0 5 2 2 10 0 0 0 0 0 0 0 4 1 0 0 2 1 00 0 0 0 0 1 0 0 0 0 0 1 1 0 00 0 0 0 0 1 0 3 10 2 0 2 6 2 10 0 0 0 0 0 0 0 0 0 0 0 0 0 0
0 0 0 0 2 6 1 3 12 5 0 0 2 0 0

Attack Go Attack Hut Attack Right Side "Red" Attack Highball "4"
PG# PG+ PG= PG/ PH# PH+ PH= PH/ PK# PK+ PK= PK/ PM# PM+ PM= PM/
0 0 0 0 0 0 0 0 0 0 0 0 0 0 0 00 0 0 0 0 0 0 0 0 0 1 0 0 0 0 00 0 0 0 0 0 0 0 0 0 0 0 0 0 1 04 0 0 2 3 2 1 0 4 1 1 1 0 0 0 03 0 2 0 2 1 0 0 2 1 0 1 1 2 0 00 0 0 0 1 1 0 0 0 1 0 0 1 0 0 00 1 0 1 3 0 0 0 2 0 1 0 0 0 0 00 0 1 0 1 1 1 0 2 0 0 0 1 0 0 00 0 0 0 0 0 0 0 0 0 0 0 0 0 0 0
56 24 2 8 51 22 3 1 25 9 7 3 1 1 0 025 12 4 4 21 15 0 6 19 10 5 2 2 2 0 06 3 1 2 6 8 2 0 4 6 0 0 3 3 0 16 5 0 0 5 5 0 1 2 2 1 0 1 1 0 07 2 0 0 5 9 0 3 4 5 2 0 2 3 1 10 0 0 0 0 0 0 0 0 0 0 0 0 0 0 0
13 13 2 0 15 21 3 2 11 2 3 0 1 3 0 17 13 4 2 8 8 4 5 6 12 1 2 1 5 0 00 6 2 0 4 8 1 2 0 1 1 0 0 8 2 13 5 0 0 1 0 1 1 1 3 1 0 0 2 1 06 6 0 2 14 13 1 1 4 2 1 1 6 10 1 00 0 0 0 0 0 0 0 0 0 0 0 0 0 0 00 1 0 0 0 2 1 0 1 4 0 0 0 0 0 00 1 0 0 0 0 1 0 0 2 0 0 1 3 0 00 3 0 0 2 1 0 0 1 1 0 0 3 5 1 00 0 1 0 0 1 0 0 0 0 0 0 0 1 0 02 2 0 0 0 3 1 0 0 1 0 0 4 13 1 10 0 0 0 0 0 0 0 0 0 0 0 0 0 0 0
2 3 0 0 3 8 0 1 13 13 5 6 11 36 7 4
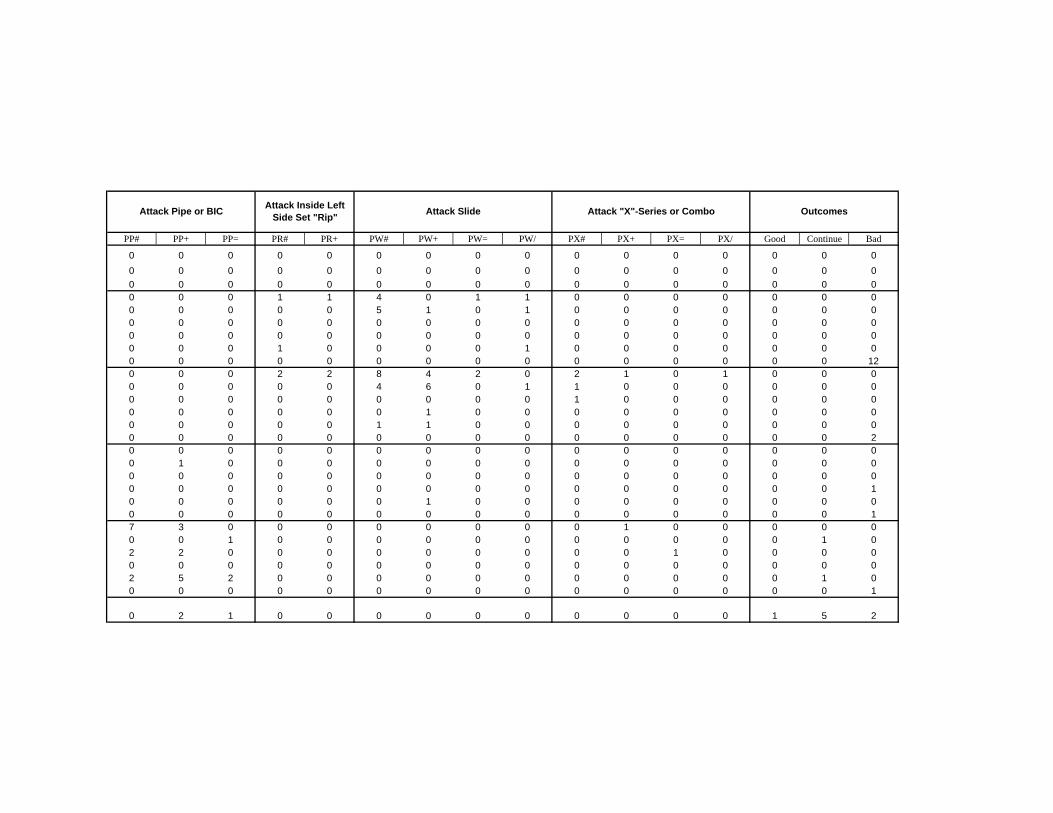
Attack Pipe or BIC Attack Inside Left Side Set "Rip" Attack Slide Attack "X"-Series or Combo Outcomes
PP# PP+ PP= PR# PR+ PW# PW+ PW= PW/ PX# PX+ PX= PX/ Good Continue Bad
0 0 0 0 0 0 0 0 0 0 0 0 0 0 0 00 0 0 0 0 0 0 0 0 0 0 0 0 0 0 00 0 0 0 0 0 0 0 0 0 0 0 0 0 0 00 0 0 1 1 4 0 1 1 0 0 0 0 0 0 00 0 0 0 0 5 1 0 1 0 0 0 0 0 0 00 0 0 0 0 0 0 0 0 0 0 0 0 0 0 00 0 0 0 0 0 0 0 0 0 0 0 0 0 0 00 0 0 1 0 0 0 0 1 0 0 0 0 0 0 00 0 0 0 0 0 0 0 0 0 0 0 0 0 0 120 0 0 2 2 8 4 2 0 2 1 0 1 0 0 00 0 0 0 0 4 6 0 1 1 0 0 0 0 0 00 0 0 0 0 0 0 0 0 1 0 0 0 0 0 00 0 0 0 0 0 1 0 0 0 0 0 0 0 0 00 0 0 0 0 1 1 0 0 0 0 0 0 0 0 00 0 0 0 0 0 0 0 0 0 0 0 0 0 0 20 0 0 0 0 0 0 0 0 0 0 0 0 0 0 00 1 0 0 0 0 0 0 0 0 0 0 0 0 0 00 0 0 0 0 0 0 0 0 0 0 0 0 0 0 00 0 0 0 0 0 0 0 0 0 0 0 0 0 0 10 0 0 0 0 0 1 0 0 0 0 0 0 0 0 00 0 0 0 0 0 0 0 0 0 0 0 0 0 0 17 3 0 0 0 0 0 0 0 0 1 0 0 0 0 00 0 1 0 0 0 0 0 0 0 0 0 0 0 1 02 2 0 0 0 0 0 0 0 0 0 1 0 0 0 00 0 0 0 0 0 0 0 0 0 0 0 0 0 0 02 5 2 0 0 0 0 0 0 0 0 0 0 0 1 00 0 0 0 0 0 0 0 0 0 0 0 0 0 0 1
0 2 1 0 0 0 0 0 0 0 0 0 0 1 5 2
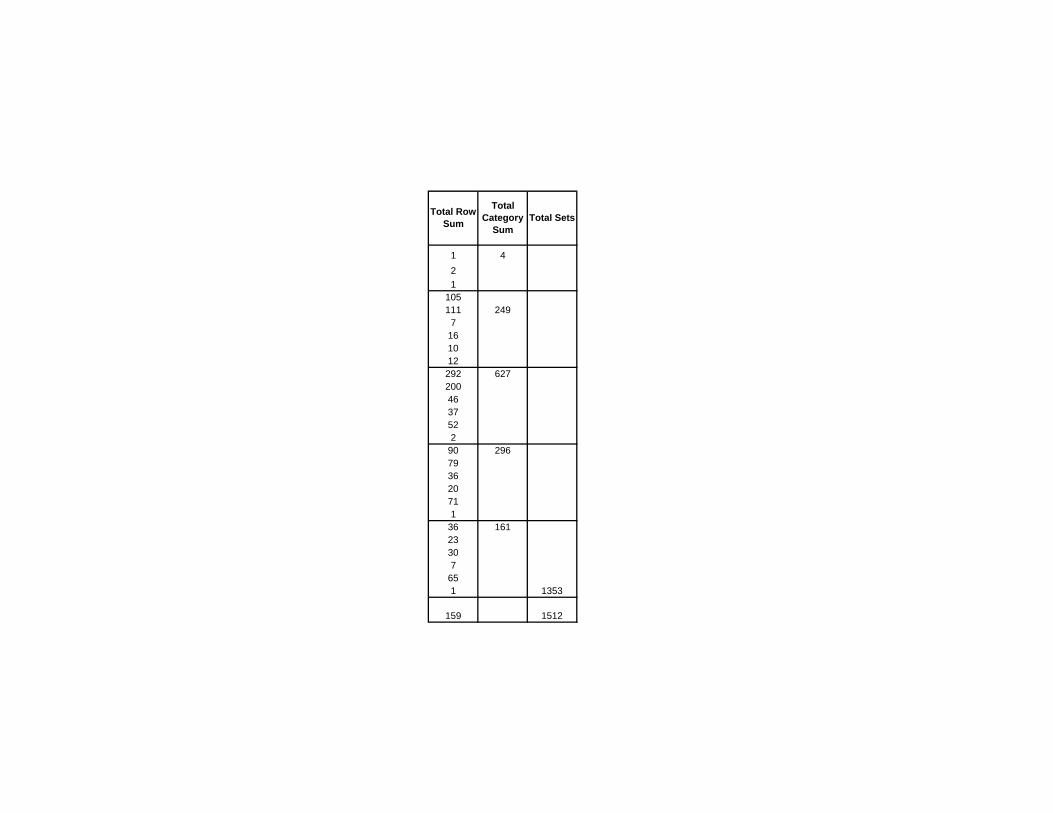
Total Row Sum
Total Category
SumTotal Sets
1 421
105111 249
7161012292 6272004637522
90 296793620711
36 16123307
651 1353
159 1512
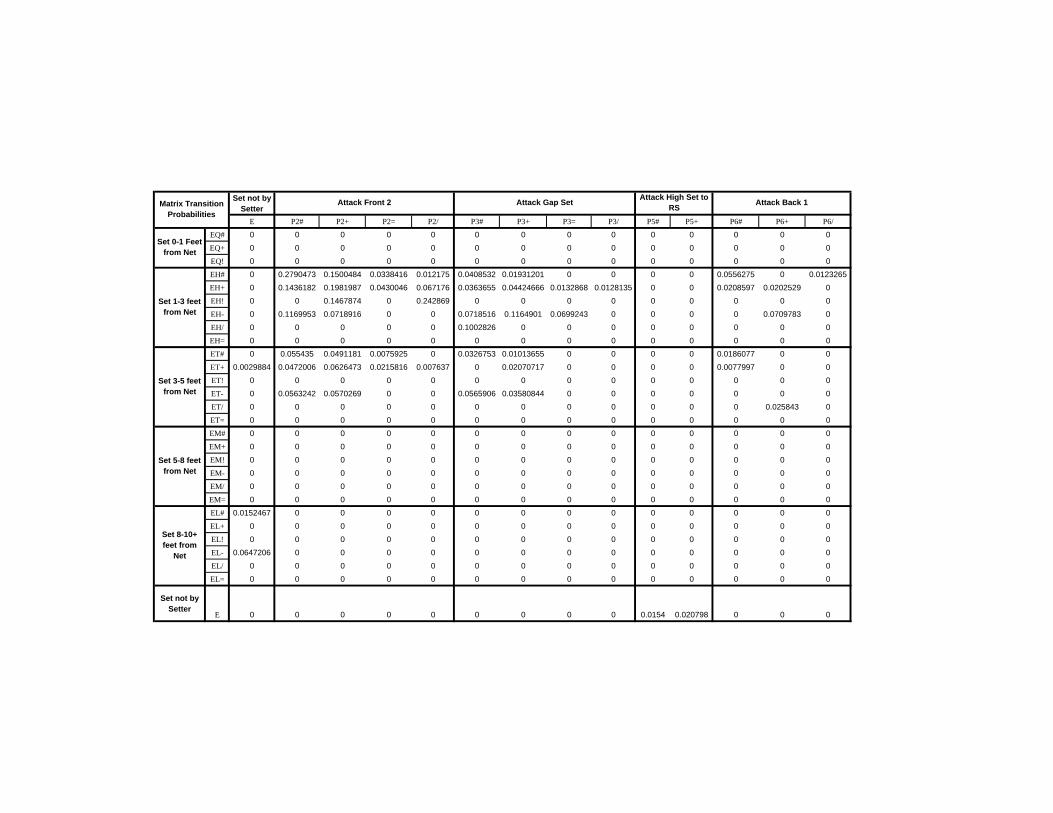
Matrix Transition Probabilities
Set not by Setter
Attack Front 2 Attack Gap Set Attack High Set to RS Attack Back 1
E P2# P2+ P2= P2/ P3# P3+ P3= P3/ P5# P5+ P6# P6+ P6/
Set 0-1 Feet from Net
EQ# 0 0 0 0 0 0 0 0 0 0 0 0 0 0EQ+ 0 0 0 0 0 0 0 0 0 0 0 0 0 0EQ! 0 0 0 0 0 0 0 0 0 0 0 0 0 0
Set 1-3 feet from Net
EH# 0 0.2790473 0.1500484 0.0338416 0.012175 0.0408532 0.01931201 0 0 0 0 0.0556275 0 0.0123265EH+ 0 0.1436182 0.1981987 0.0430046 0.067176 0.0363655 0.04424666 0.0132868 0.0128135 0 0 0.0208597 0.0202529 0EH! 0 0 0.1467874 0 0.242869 0 0 0 0 0 0 0 0 0EH- 0 0.1169953 0.0718916 0 0 0.0718516 0.1164901 0.0699243 0 0 0 0 0.0709783 0EH/ 0 0 0 0 0 0.1002826 0 0 0 0 0 0 0 0EH= 0 0 0 0 0 0 0 0 0 0 0 0 0 0
Set 3-5 feet from Net
ET# 0 0.055435 0.0491181 0.0075925 0 0.0326753 0.01013655 0 0 0 0 0.0186077 0 0ET+ 0.0029884 0.0472006 0.0626473 0.0215816 0.007637 0 0.02070717 0 0 0 0 0.0077997 0 0ET! 0 0 0 0 0 0 0 0 0 0 0 0 0 0ET- 0 0.0563242 0.0570269 0 0 0.0565906 0.03580844 0 0 0 0 0 0 0ET/ 0 0 0 0 0 0 0 0 0 0 0 0 0.025843 0ET= 0 0 0 0 0 0 0 0 0 0 0 0 0 0
Set 5-8 feet from Net
EM# 0 0 0 0 0 0 0 0 0 0 0 0 0 0EM+ 0 0 0 0 0 0 0 0 0 0 0 0 0 0EM! 0 0 0 0 0 0 0 0 0 0 0 0 0 0EM- 0 0 0 0 0 0 0 0 0 0 0 0 0 0EM/ 0 0 0 0 0 0 0 0 0 0 0 0 0 0EM= 0 0 0 0 0 0 0 0 0 0 0 0 0 0
Set 8-10+ feet from
Net
EL# 0.0152467 0 0 0 0 0 0 0 0 0 0 0 0 0EL+ 0 0 0 0 0 0 0 0 0 0 0 0 0 0EL! 0 0 0 0 0 0 0 0 0 0 0 0 0 0EL- 0.0647206 0 0 0 0 0 0 0 0 0 0 0 0 0EL/ 0 0 0 0 0 0 0 0 0 0 0 0 0 0EL= 0 0 0 0 0 0 0 0 0 0 0 0 0 0
Set not by Setter
E 0 0 0 0 0 0 0 0 0 0.0154 0.020798 0 0 0
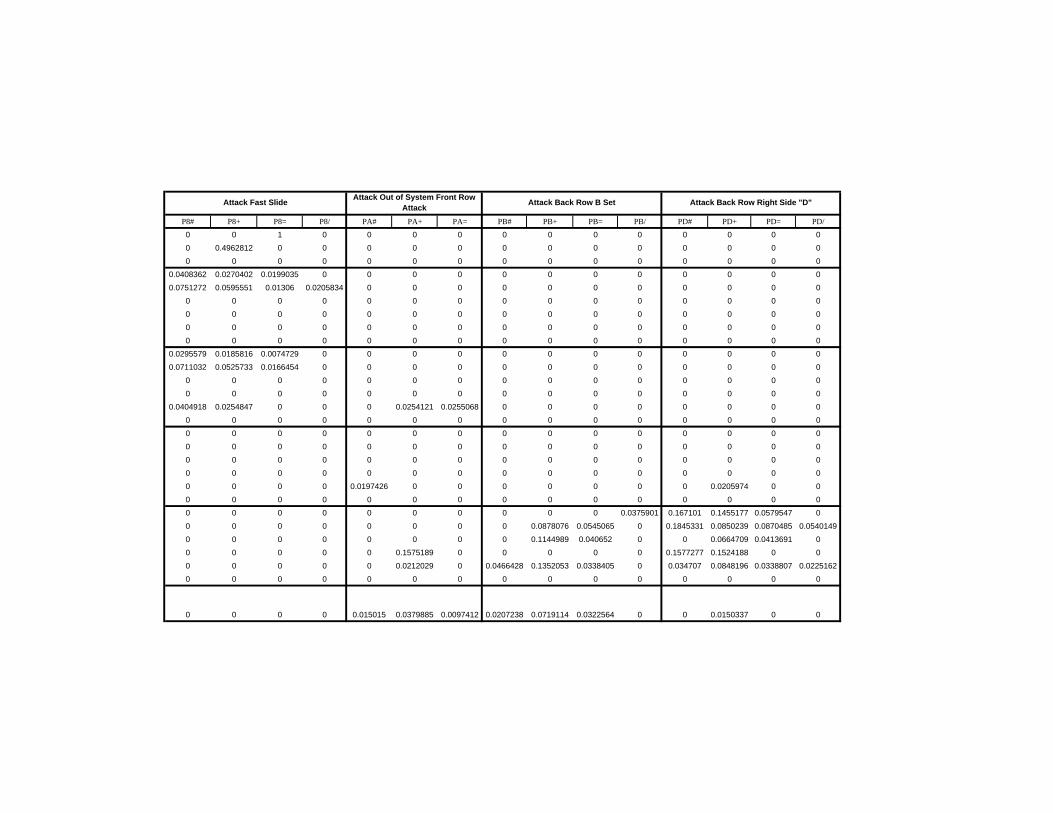
Attack Fast Slide Attack Out of System Front Row Attack Attack Back Row B Set Attack Back Row Right Side "D"
P8# P8+ P8= P8/ PA# PA+ PA= PB# PB+ PB= PB/ PD# PD+ PD= PD/
0 0 1 0 0 0 0 0 0 0 0 0 0 0 00 0.4962812 0 0 0 0 0 0 0 0 0 0 0 0 00 0 0 0 0 0 0 0 0 0 0 0 0 0 0
0.0408362 0.0270402 0.0199035 0 0 0 0 0 0 0 0 0 0 0 00.0751272 0.0595551 0.01306 0.0205834 0 0 0 0 0 0 0 0 0 0 0
0 0 0 0 0 0 0 0 0 0 0 0 0 0 00 0 0 0 0 0 0 0 0 0 0 0 0 0 00 0 0 0 0 0 0 0 0 0 0 0 0 0 00 0 0 0 0 0 0 0 0 0 0 0 0 0 0
0.0295579 0.0185816 0.0074729 0 0 0 0 0 0 0 0 0 0 0 00.0711032 0.0525733 0.0166454 0 0 0 0 0 0 0 0 0 0 0 0
0 0 0 0 0 0 0 0 0 0 0 0 0 0 00 0 0 0 0 0 0 0 0 0 0 0 0 0 0
0.0404918 0.0254847 0 0 0 0.0254121 0.0255068 0 0 0 0 0 0 0 00 0 0 0 0 0 0 0 0 0 0 0 0 0 00 0 0 0 0 0 0 0 0 0 0 0 0 0 00 0 0 0 0 0 0 0 0 0 0 0 0 0 00 0 0 0 0 0 0 0 0 0 0 0 0 0 00 0 0 0 0 0 0 0 0 0 0 0 0 0 00 0 0 0 0.0197426 0 0 0 0 0 0 0 0.0205974 0 00 0 0 0 0 0 0 0 0 0 0 0 0 0 00 0 0 0 0 0 0 0 0 0 0.0375901 0.167101 0.1455177 0.0579547 00 0 0 0 0 0 0 0 0.0878076 0.0545065 0 0.1845331 0.0850239 0.0870485 0.05401490 0 0 0 0 0 0 0 0.1144989 0.040652 0 0 0.0664709 0.0413691 00 0 0 0 0 0.1575189 0 0 0 0 0 0.1577277 0.1524188 0 00 0 0 0 0 0.0212029 0 0.0466428 0.1352053 0.0338405 0 0.034707 0.0848196 0.0338807 0.02251620 0 0 0 0 0 0 0 0 0 0 0 0 0 0
0 0 0 0 0.015015 0.0379885 0.0097412 0.0207238 0.0719114 0.0322564 0 0 0.0150337 0 0

Attack Go Attack Hut Attack Right Side "Red" Attack Highball "4"
PG# PG+ PG= PG/ PH# PH+ PH= PH/ PK# PK+ PK= PK/ PM# PM+ PM= PM/
0 0 0 0 0 0 0 0 0 0 0 0 0 0 0 00 0 0 0 0 0 0 0 0 0 0.5037188 0 0 0 0 00 0 0 0 0 0 0 0 0 0 0 0 0 0 1 0
0.0483176 0 0 0.0193412 0.0340808 0.0193387 0.0116767 0 0.0483355 0.0125187 0.0122072 0.0121585 0 0 0 00.028268 0 0.0207104 0 0.0206301 0.0130046 0 0 0.0205803 0.0132228 0 0.0129913 0.0131655 0.020034 0 0
0 0 0 0 0.1504226 0.15536 0 0 0 0.1521406 0 0 0.152421 0 0 00 0.0715689 0 0.0701425 0.1539774 0 0 0 0.1152004 0 0.0709795 0 0 0 0 00 0 0.1063306 0 0.1063914 0.1052442 0.1053461 0 0.1632858 0 0 0 0.1020687 0 0 00 0 0 0 0 0 0 0 0 0 0 0 0 0 0 0
0.1723022 0.0715946 0.007254 0.0239416 0.1523834 0.0664128 0.010299 0.004628 0.0863152 0.0297184 0.0217396 0.0102816 0.0046773 0.004754 0 00.1209655 0.0564178 0.0215781 0.0209515 0.0972925 0.0698878 0 0.0298665 0.0928857 0.047427 0.0258122 0.0118094 0.0121445 0.0119585 0 00.133391 0.0644121 0.0303098 0.0481559 0.1170111 0.1539127 0.0466011 0 0.1002398 0.1175751 0 0 0.0652783 0.0657153 0 0.0287057
0.1423832 0.1204122 0 0 0.1197897 0.1205717 0 0.0352054 0.056173 0.0558717 0.0356594 0 0.0359334 0.0369808 0 00.1197874 0.0429746 0 0 0.0876534 0.1467963 0 0.0578656 0.0708105 0.0876455 0.0410265 0 0.0415205 0.0564595 0.026376 0.0264638
0 0 0 0 0 0 0 0 0 0 0 0 0 0 0 00.1389184 0.1369526 0.0273369 0 0.1588779 0.2193537 0.0371463 0.0272259 0.1187648 0.026884 0.0373603 0 0.0169263 0.0371596 0 0.01709330.0870109 0.1534201 0.0526217 0.0299519 0.0966566 0.097362 0.05226 0.0646489 0.0754245 0.140277 0.0187068 0.0301759 0.0191394 0.0632816 0 0
0 0.1526809 0.0614462 0 0.1082 0.2005114 0.0403614 0.0614226 0 0.0391969 0.0390861 0 0 0.1966909 0.062279 0.03812450.1353322 0.2152541 0 0 0.0638619 0 0.0640314 0.0633112 0.0653696 0.1409069 0.0638258 0 0 0.0998571 0.0619169 00.0802269 0.0808241 0 0.0320736 0.1786347 0.1663232 0.0204306 0.0201752 0.0560116 0.032249 0.0204396 0.020262 0.0809447 0.1305304 0.020086 0
0 0 0 0 0 0 0 0 0 0 0 0 0 0 0 00 0.0377939 0 0 0 0.0592484 0.0371927 0 0.0366503 0.1018202 0 0 0 0 0 00 0.0551357 0 0 0 0 0.0543629 0 0 0.0865391 0 0 0.0534905 0.1201117 0 00 0.0894457 0 0 0.067722 0.0432182 0 0 0.0423647 0.0416139 0 0 0.0920688 0.1410602 0.0425454 00 0 0.1548209 0 0 0.1590841 0 0 0 0 0 0 0 0.153709 0 0
0.0332653 0.0346948 0 0 0 0.0466407 0.0220231 0 0 0.0218699 0 0 0.0608775 0.176006 0.0214498 0.02066890 0 0 0 0 0 0 0 0 0 0 0 0 0 0 0
0.0148911 0.0203777 0 0 0.0203878 0.0494165 0 0.009445 0.077623 0.0774284 0.0320948 0.0371937 0.0653861 0.2054175 0.0433164 0.026214
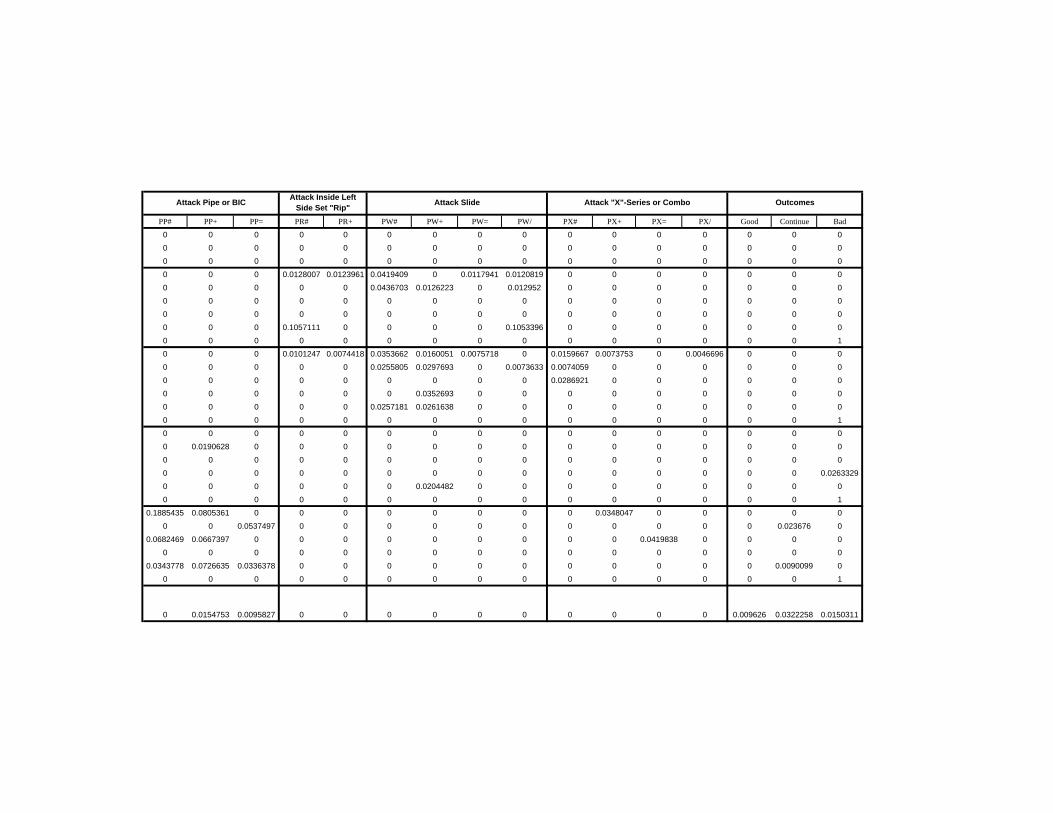
Attack Pipe or BIC Attack Inside Left Side Set "Rip" Attack Slide Attack "X"-Series or Combo Outcomes
PP# PP+ PP= PR# PR+ PW# PW+ PW= PW/ PX# PX+ PX= PX/ Good Continue Bad
0 0 0 0 0 0 0 0 0 0 0 0 0 0 0 00 0 0 0 0 0 0 0 0 0 0 0 0 0 0 00 0 0 0 0 0 0 0 0 0 0 0 0 0 0 00 0 0 0.0128007 0.0123961 0.0419409 0 0.0117941 0.0120819 0 0 0 0 0 0 00 0 0 0 0 0.0436703 0.0126223 0 0.012952 0 0 0 0 0 0 00 0 0 0 0 0 0 0 0 0 0 0 0 0 0 00 0 0 0 0 0 0 0 0 0 0 0 0 0 0 00 0 0 0.1057111 0 0 0 0 0.1053396 0 0 0 0 0 0 00 0 0 0 0 0 0 0 0 0 0 0 0 0 0 10 0 0 0.0101247 0.0074418 0.0353662 0.0160051 0.0075718 0 0.0159667 0.0073753 0 0.0046696 0 0 00 0 0 0 0 0.0255805 0.0297693 0 0.0073633 0.0074059 0 0 0 0 0 00 0 0 0 0 0 0 0 0 0.0286921 0 0 0 0 0 00 0 0 0 0 0 0.0352693 0 0 0 0 0 0 0 0 00 0 0 0 0 0.0257181 0.0261638 0 0 0 0 0 0 0 0 00 0 0 0 0 0 0 0 0 0 0 0 0 0 0 10 0 0 0 0 0 0 0 0 0 0 0 0 0 0 00 0.0190628 0 0 0 0 0 0 0 0 0 0 0 0 0 00 0 0 0 0 0 0 0 0 0 0 0 0 0 0 00 0 0 0 0 0 0 0 0 0 0 0 0 0 0 0.02633290 0 0 0 0 0 0.0204482 0 0 0 0 0 0 0 0 00 0 0 0 0 0 0 0 0 0 0 0 0 0 0 1
0.1885435 0.0805361 0 0 0 0 0 0 0 0 0.0348047 0 0 0 0 00 0 0.0537497 0 0 0 0 0 0 0 0 0 0 0 0.023676 0
0.0682469 0.0667397 0 0 0 0 0 0 0 0 0 0.0419838 0 0 0 00 0 0 0 0 0 0 0 0 0 0 0 0 0 0 0
0.0343778 0.0726635 0.0336378 0 0 0 0 0 0 0 0 0 0 0 0.0090099 00 0 0 0 0 0 0 0 0 0 0 0 0 0 0 1
0 0.0154753 0.0095827 0 0 0 0 0 0 0 0 0 0 0.009626 0.0322258 0.0150311
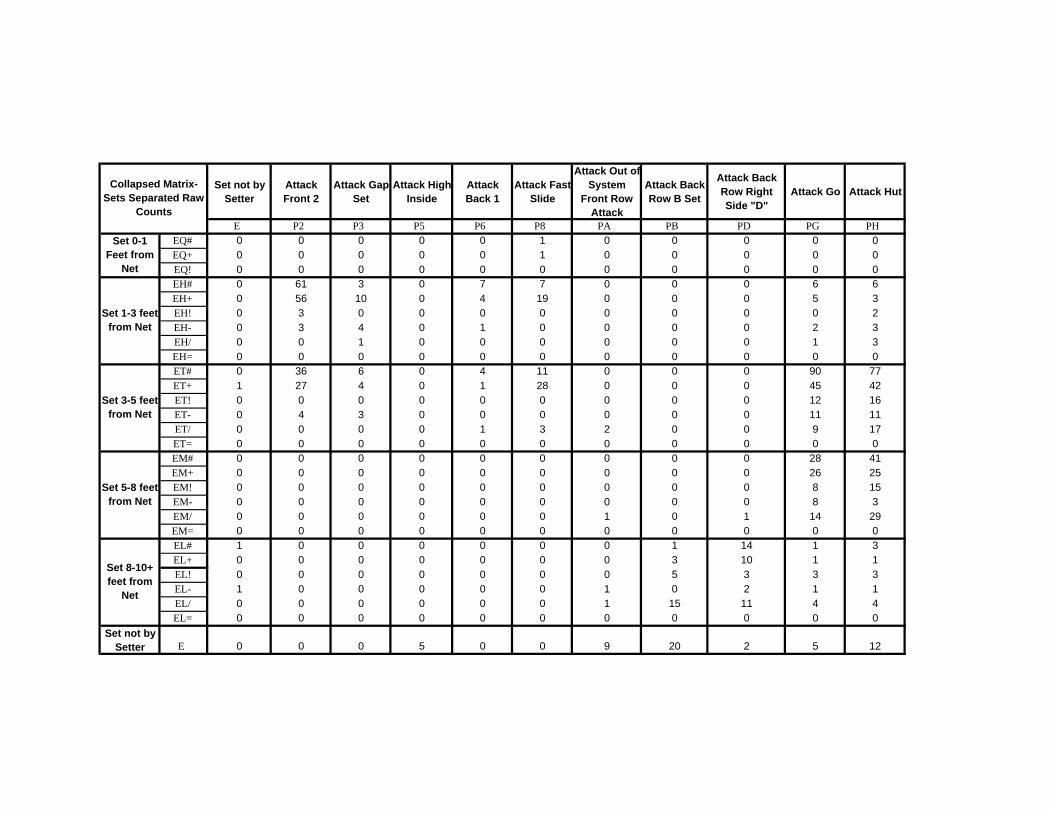
fCollapsed Matrix-
Sets Separated Raw Counts
Set not by Setter
Attack Front 2
Attack Gap Set
Attack HighInside
Attack Back 1
Attack FastSlide
Attack Out o
System Front Row
Attack
Attack Back Row B Set
Attack Back Row Right Side "D"
Attack Go Attack Hut
E P2 P3 P5 P6 P8 PA PB PD PG PH Set 0-1
Feet from Net
EQ# 0 0 0 0 0 1 0 0 0 0 0EQ+ 0 0 0 0 0 1 0 0 0 0 0EQ! 0 0 0 0 0 0 0 0 0 0 0
Set 1-3 feet from Net
EH# 0 61 3 0 7 7 0 0 0 6 6EH+ 0 56 10 0 4 19 0 0 0 5 3EH! 0 3 0 0 0 0 0 0 0 0 2EH- 0 3 4 0 1 0 0 0 0 2 3EH/ 0 0 1 0 0 0 0 0 0 1 3EH= 0 0 0 0 0 0 0 0 0 0 0
Set 3-5 feet from Net
ET# 0 36 6 0 4 11 0 0 0 90 77ET+ 1 27 4 0 1 28 0 0 0 45 42ET! 0 0 0 0 0 0 0 0 0 12 16ET- 0 4 3 0 0 0 0 0 0 11 11ET/ 0 0 0 0 1 3 2 0 0 9 17ET= 0 0 0 0 0 0 0 0 0 0 0
Set 5-8 feet from Net
EM# 0 0 0 0 0 0 0 0 0 28 41EM+ 0 0 0 0 0 0 0 0 0 26 25EM! 0 0 0 0 0 0 0 0 0 8 15EM- 0 0 0 0 0 0 0 0 0 8 3EM/ 0 0 0 0 0 0 1 0 1 14 29EM= 0 0 0 0 0 0 0 0 0 0 0
Set 8-10+ feet from
Net
EL# 1 0 0 0 0 0 0 1 14 1 3EL+ 0 0 0 0 0 0 0 3 10 1 1EL! 0 0 0 0 0 0 0 5 3 3 3EL- 1 0 0 0 0 0 1 0 2 1 1EL/ 0 0 0 0 0 0 1 15 11 4 4EL= 0 0 0 0 0 0 0 0 0 0 0
Set not by Setter E 0 0 0 5 0 0 9 20 2 5 12
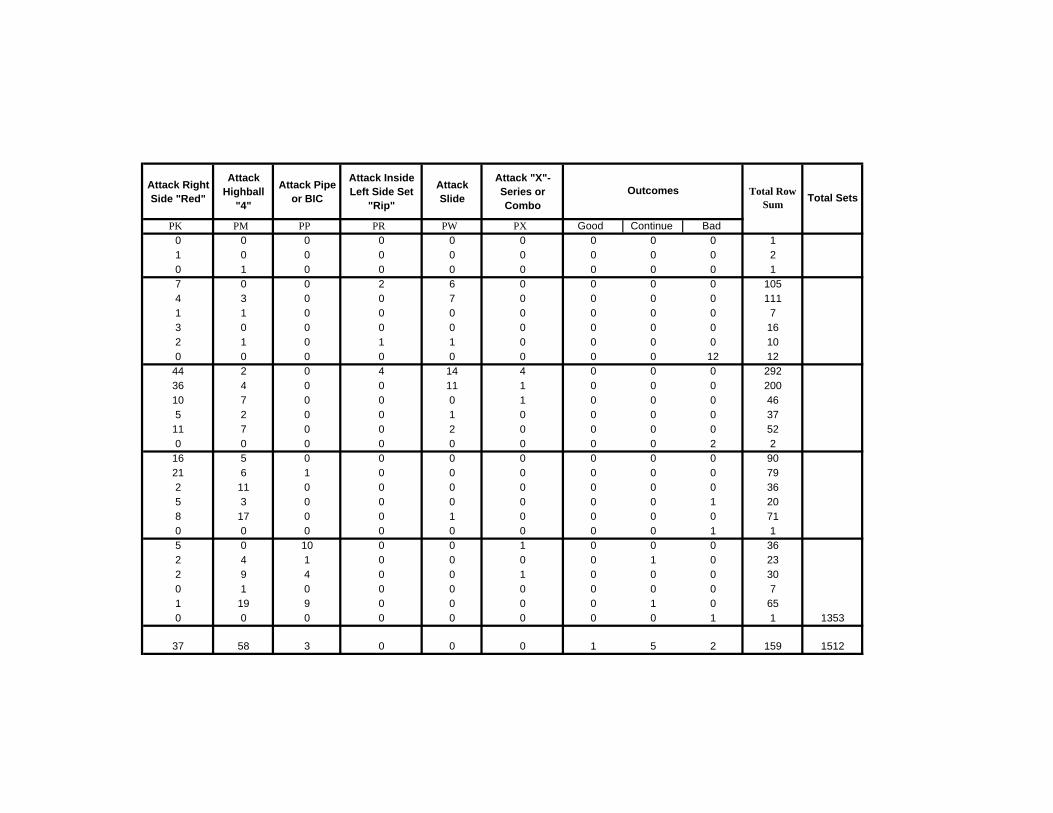
Attack Right Side "Red"
Attack Highball
"4"
Attack Pipe or BIC
Attack Inside Left Side Set
"Rip"
Attack Slide
Attack "X"-Series or Combo
Outcomes Total Row Sum Total Sets
PK PM PP PR PW PX Good Continue Bad 0 0 0 0 0 0 0 0 0 11 0 0 0 0 0 0 0 0 20 1 0 0 0 0 0 0 0 17 0 0 2 6 0 0 0 0 1054 3 0 0 7 0 0 0 0 1111 1 0 0 0 0 0 0 0 73 0 0 0 0 0 0 0 0 162 1 0 1 1 0 0 0 0 100 0 0 0 0 0 0 0 12 12
44 2 0 4 14 4 0 0 0 29236 4 0 0 11 1 0 0 0 20010 7 0 0 0 1 0 0 0 465 2 0 0 1 0 0 0 0 37
11 7 0 0 2 0 0 0 0 520 0 0 0 0 0 0 0 2 2
16 5 0 0 0 0 0 0 0 9021 6 1 0 0 0 0 0 0 792 11 0 0 0 0 0 0 0 365 3 0 0 0 0 0 0 1 208 17 0 0 1 0 0 0 0 710 0 0 0 0 0 0 0 1 15 0 10 0 0 1 0 0 0 362 4 1 0 0 0 0 1 0 232 9 4 0 0 1 0 0 0 300 1 0 0 0 0 0 0 0 71 19 9 0 0 0 0 1 0 650 0 0 0 0 0 0 0 1 1 1353
37 58 3 0 0 0 1 5 2 159 1512
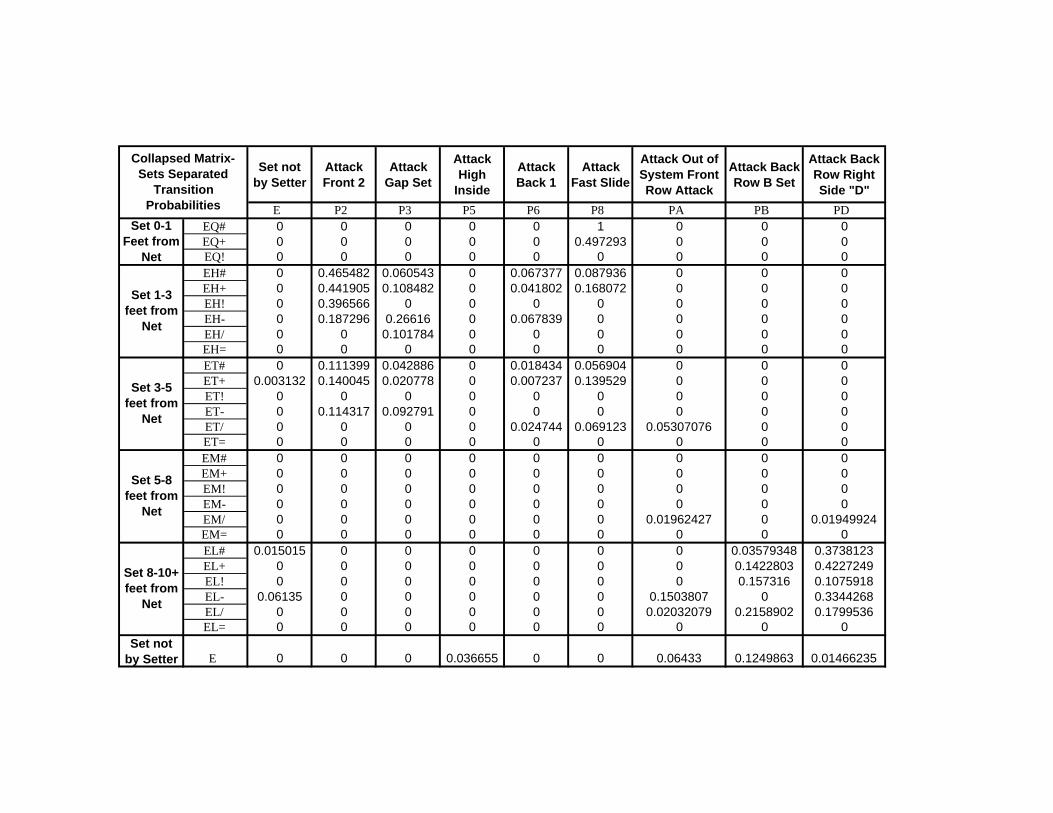
Collapsed Matrix-Sets Separated
Transition Probabilities
Set not by Setter
Attack Front 2
Attack Gap Set
Attack High
Inside
Attack Back 1
Attack Fast Slide
Attack Out of System Front Row Attack
Attack Back Row B Set
Attack Back Row Right Side "D"
E P2 P3 P5 P6 P8 PA PB PD Set 0-1
Feet from Net
EQ# 0 0 0 0 0 1 0 0 0EQ+ 0 0 0 0 0 0.497293 0 0 0EQ! 0 0 0 0 0 0 0 0 0
Set 1-3 feet from
Net
EH# 0 0.465482 0.060543 0 0.067377 0.087936 0 0 0EH+ 0 0.441905 0.108482 0 0.041802 0.168072 0 0 0EH! 0 0.396566 0 0 0 0 0 0 0EH- 0 0.187296 0.26616 0 0.067839 0 0 0 0EH/ 0 0 0.101784 0 0 0 0 0 0EH= 0 0 0 0 0 0 0 0 0
Set 3-5 feet from
Net
ET# 0 0.111399 0.042886 0 0.018434 0.056904 0 0 0ET+ 0.003132 0.140045 0.020778 0 0.007237 0.139529 0 0 0ET! 0 0 0 0 0 0 0 0 0ET- 0 0.114317 0.092791 0 0 0 0 0 0ET/ 0 0 0 0 0.024744 0.069123 0.05307076 0 0ET= 0 0 0 0 0 0 0 0 0
Set 5-8 feet from
Net
EM# 0 0 0 0 0 0 0 0 0EM+ 0 0 0 0 0 0 0 0 0EM! 0 0 0 0 0 0 0 0 0EM- 0 0 0 0 0 0 0 0 0EM/ 0 0 0 0 0 0 0.01962427 0 0.01949924EM= 0 0 0 0 0 0 0 0 0
Set 8-10+ feet from
Net
EL# 0.015015 0 0 0 0 0 0 0.03579348 0.3738123EL+ 0 0 0 0 0 0 0 0.1422803 0.4227249EL! 0 0 0 0 0 0 0 0.157316 0.1075918EL- 0.06135 0 0 0 0 0 0.1503807 0 0.3344268EL/ 0 0 0 0 0 0 0.02032079 0.2158902 0.1799536EL= 0 0 0 0 0 0 0 0 0
Set not by Setter E 0 0 0 0.036655 0 0 0.06433 0.1249863 0.01466235
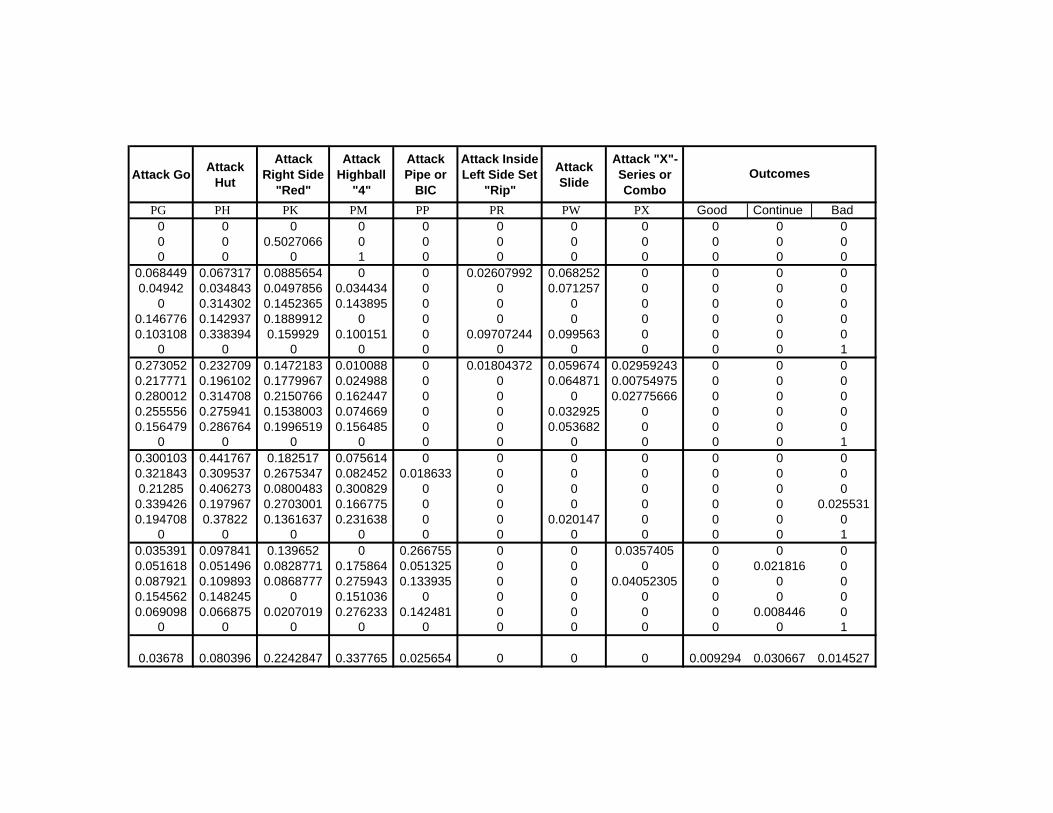
Attack Go Attack Hut
Attack Right Side
"Red"
Attack Highball
"4"
Attack Pipe or
BIC
Attack Inside Left Side Set
"Rip"
Attack Slide
Attack "X"-Series or Combo
Outcomes
PG PH PK PM PP PR PW PX Good Continue Bad 0 0 0 0 0 0 0 0 0 0 00 0 0.5027066 0 0 0 0 0 0 0 00 0 0 1 0 0 0 0 0 0 0
0.068449 0.067317 0.0885654 0 0 0.02607992 0.068252 0 0 0 00.04942 0.034843 0.0497856 0.034434 0 0 0.071257 0 0 0 0
0 0.314302 0.1452365 0.143895 0 0 0 0 0 0 00.146776 0.142937 0.1889912 0 0 0 0 0 0 0 00.103108 0.338394 0.159929 0.100151 0 0.09707244 0.099563 0 0 0 0
0 0 0 0 0 0 0 0 0 0 10.273052 0.232709 0.1472183 0.010088 0 0.01804372 0.059674 0.02959243 0 0 00.217771 0.196102 0.1779967 0.024988 0 0 0.064871 0.00754975 0 0 00.280012 0.314708 0.2150766 0.162447 0 0 0 0.02775666 0 0 00.255556 0.275941 0.1538003 0.074669 0 0 0.032925 0 0 0 00.156479 0.286764 0.1996519 0.156485 0 0 0.053682 0 0 0 0
0 0 0 0 0 0 0 0 0 0 10.300103 0.441767 0.182517 0.075614 0 0 0 0 0 0 00.321843 0.309537 0.2675347 0.082452 0.018633 0 0 0 0 0 00.21285 0.406273 0.0800483 0.300829 0 0 0 0 0 0 0
0.339426 0.197967 0.2703001 0.166775 0 0 0 0 0 0 0.0255310.194708 0.37822 0.1361637 0.231638 0 0 0.020147 0 0 0 0
0 0 0 0 0 0 0 0 0 0 10.035391 0.097841 0.139652 0 0.266755 0 0 0.0357405 0 0 00.051618 0.051496 0.0828771 0.175864 0.051325 0 0 0 0 0.021816 00.087921 0.109893 0.0868777 0.275943 0.133935 0 0 0.04052305 0 0 00.154562 0.148245 0 0.151036 0 0 0 0 0 0 00.069098 0.066875 0.0207019 0.276233 0.142481 0 0 0 0 0.008446 0
0 0 0 0 0 0 0 0 0 0 1
0.03678 0.080396 0.2242847 0.337765 0.025654 0 0 0 0.009294 0.030667 0.014527

Collapsed Matrix Distance - Raw Counts
Set not by Setter
Attack Front 2
Attack Gap Set
Attack High
Inside
Attack Back 1
Attack Fast Slide
Attack Out of System Front Row Attack
Attack Back Row
B Set
Attack Back Row Right Side "D"
Attack Go
E P2 P3 P5 P6 P8 PA PB PD PG Set 0-1 Feet from Net
EQ0 0 0 0 0 2 0 0 0 0
Set 1-3 feet from Net
EH0 123 18 0 12 26 0 0 0 14
Set 3-5 feet from Net
ET1 67 13 0 6 42 2 0 0 167
Set 5-8 feet from Net
EM0 0 0 0 0 0 1 0 1 84
Set 8-10+ feet from Net
EL2 0 0 0 0 0 2 24 40 10
Set not by Setter E 0 0 0 5 0 0 9 20 2 5
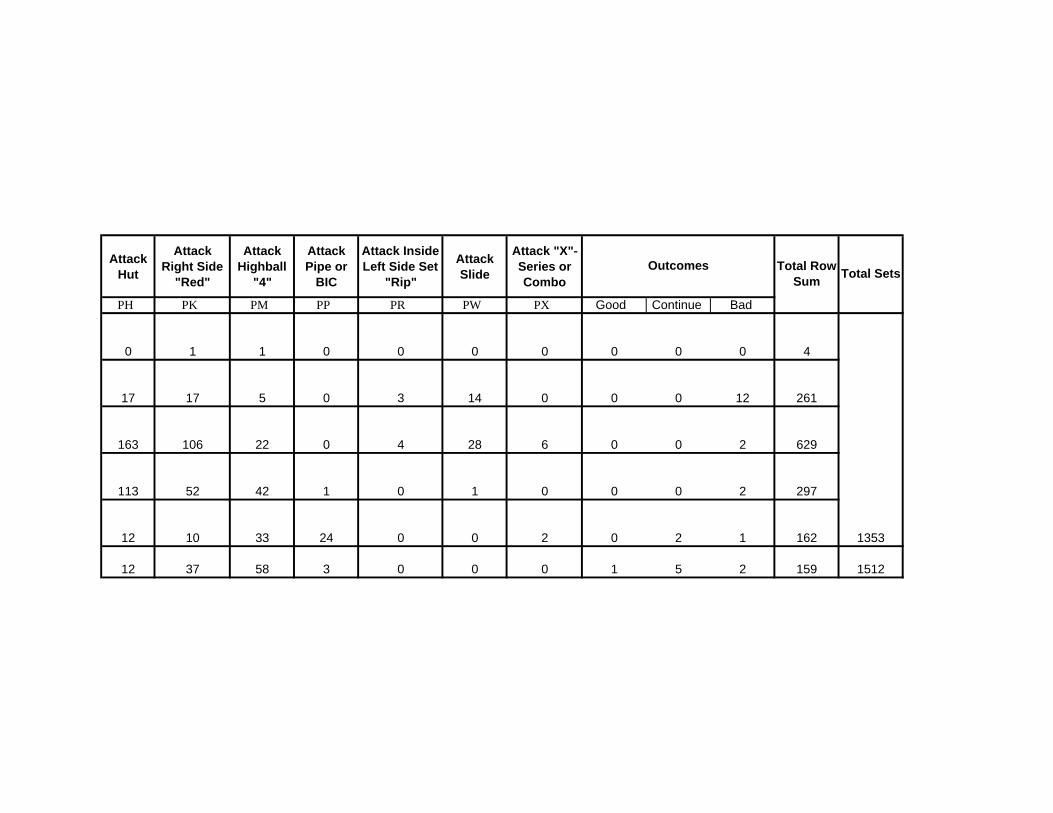
Attack Hut
Attack Right Side
"Red"
Attack Highball
"4"
Attack Pipe or
BIC
Attack Inside Left Side Set
"Rip"
Attack Slide
Attack "X"-Series or Combo
Outcomes Total RowSum
Total Sets
PH PK PM PP PR PW PX Good Continue Bad
0 1 1 0 0 0 0 0 0 0 4
17 17 5 0 3 14 0 0 0 12 261
163 106 22 0 4 28 6 0 0 2 629
113 52 42 1 0 1 0 0 0 2 297
12 10 33 24 0 0 2 0 2 1 162 1353
12 37 58 3 0 0 0 1 5 2 159 1512
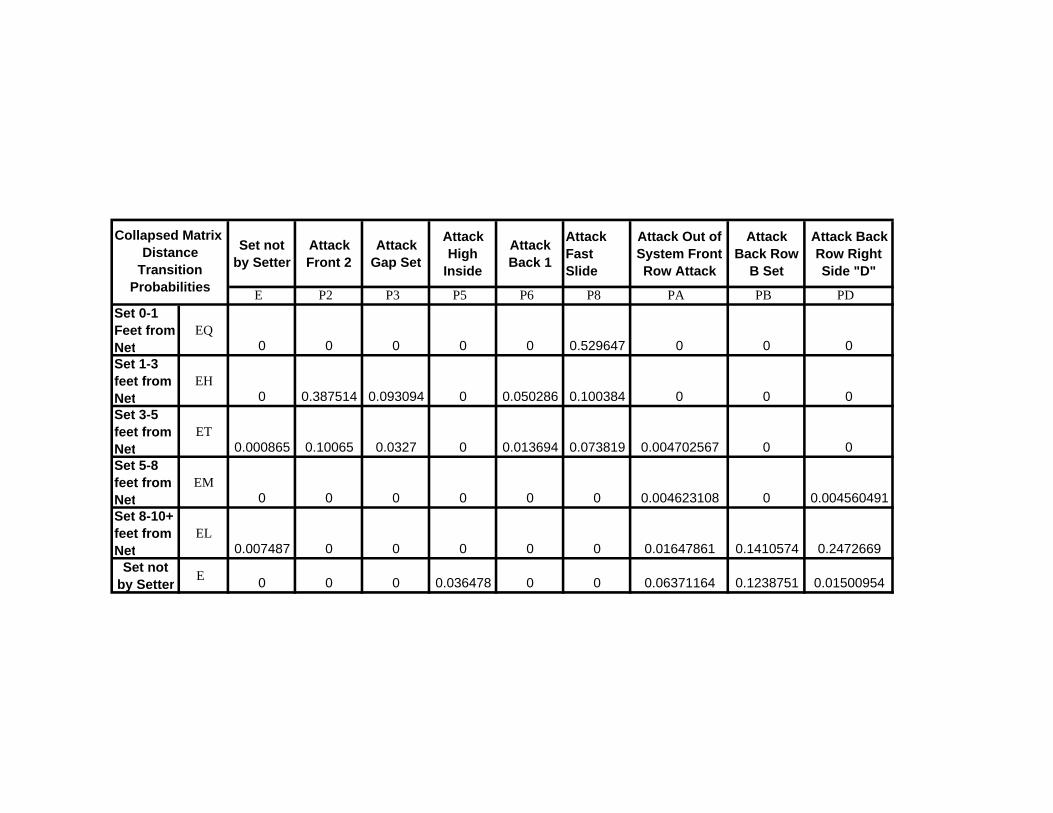
t
t
t
t
t
Collapsed Matrix Distance
Transition Probabilities
Set not by Setter
-Attack Front 2
Attack Gap Set
Attack High
Inside
Attack Back 1
Attack Fast Slide
Attack Out of System Front Row Attack
Attack Back Row
B Set
Attack Back Row Right Side "D"
E P2 P3 P5 P6 P8 PA PB PD Set 0-1 Feet from Ne
EQ0 0 0 0 0 0.529647 0 0 0
Set 1-3 feet from Ne
EH0 0.387514 0.093094 0 0.050286 0.100384 0 0 0
Set 3-5 feet from Ne
ET0.000865 0.10065 0.0327 0 0.013694 0.073819 0.004702567 0 0
Set 5-8 feet from Ne
EM0 0 0 0 0 0 0.004623108 0 0.004560491
Set 8-10+ feet from Ne
EL0.007487 0 0 0 0 0 0.01647861 0.1410574 0.2472669
Set not by Setter E 0 0 0 0.036478 0 0 0.06371164 0.1238751 0.01500954
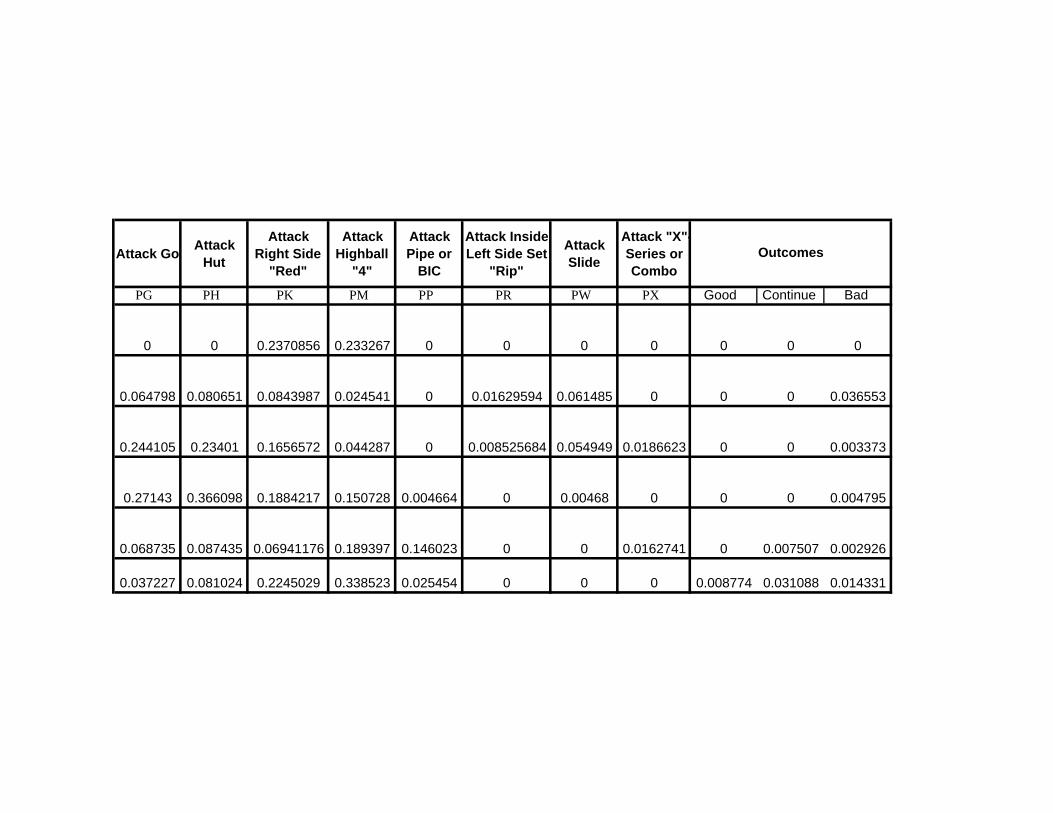
Attack Go Attack Hut
Attack Right Side
"Red"
Attack Highball
"4"
Attack Pipe or
BIC
Attack InsideLeft Side Set
"Rip"
Attack Slide
Attack "X"Series or Combo
-Outcomes
PG PH PK PM PP PR PW PX Good Continue Bad
0 0 0.2370856 0.233267 0 0 0 0 0 0 0
0.064798 0.080651 0.0843987 0.024541 0 0.01629594 0.061485 0 0 0 0.036553
0.244105 0.23401 0.1656572 0.044287 0 0.008525684 0.054949 0.0186623 0 0 0.003373
0.27143 0.366098 0.1884217 0.150728 0.004664 0 0.00468 0 0 0 0.004795
0.068735 0.087435 0.06941176 0.189397 0.146023 0 0 0.0162741 0 0.007507 0.002926
0.037227 0.081024 0.2245029 0.338523 0.025454 0 0 0 0.008774 0.031088 0.014331
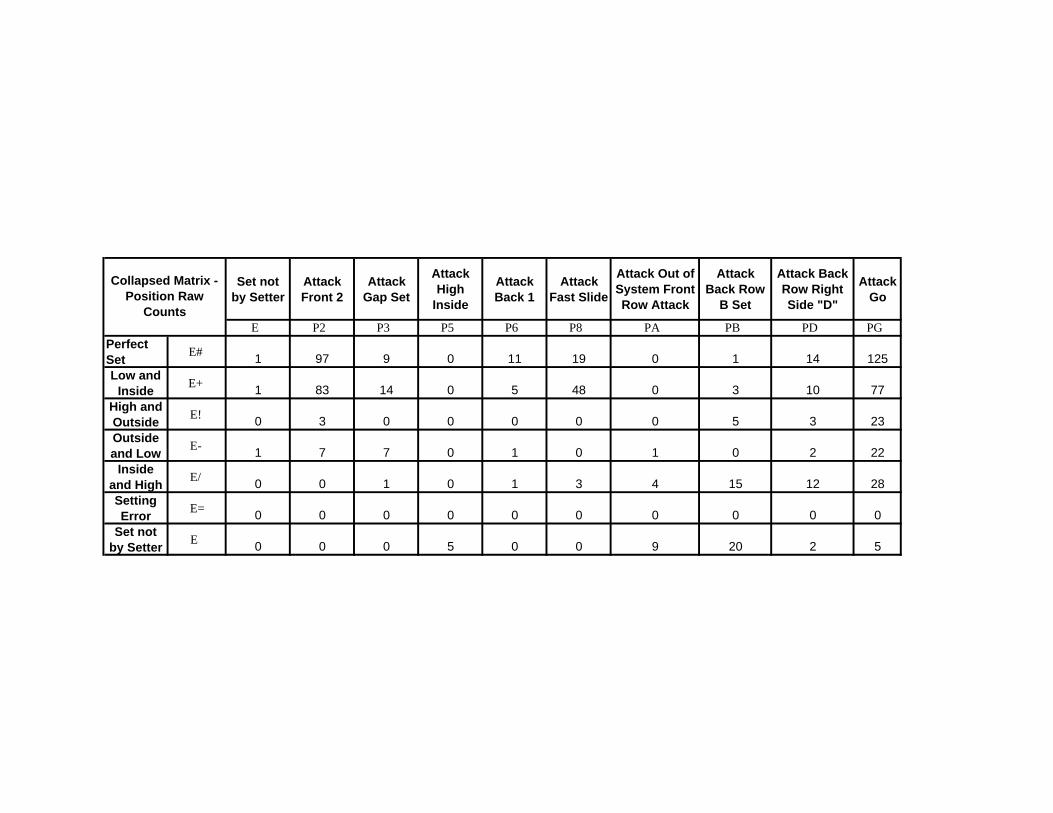
Collapsed Matrix - Position Raw
Counts
Set not by Setter
Attack Front 2
Attack Gap Set
Attack High
Inside
Attack Back 1
Attack Fast Slide
Attack Out of System Front Row Attack
Attack Back Row
B Set
Attack Back Row Right Side "D"
Attack Go
E P2 P3 P5 P6 P8 PA PB PD PG Perfect Set E# 1 97 9 0 11 19 0 1 14 125Low and
Inside E+ 1 83 14 0 5 48 0 3 10 77High and Outside E! 0 3 0 0 0 0 0 5 3 23Outside and Low E- 1 7 7 0 1 0 1 0 2 22
Inside and High E/ 0 0 1 0 1 3 4 15 12 28Setting Error E= 0 0 0 0 0 0 0 0 0 0
Set not by Setter E 0 0 0 5 0 0 9 20 2 5
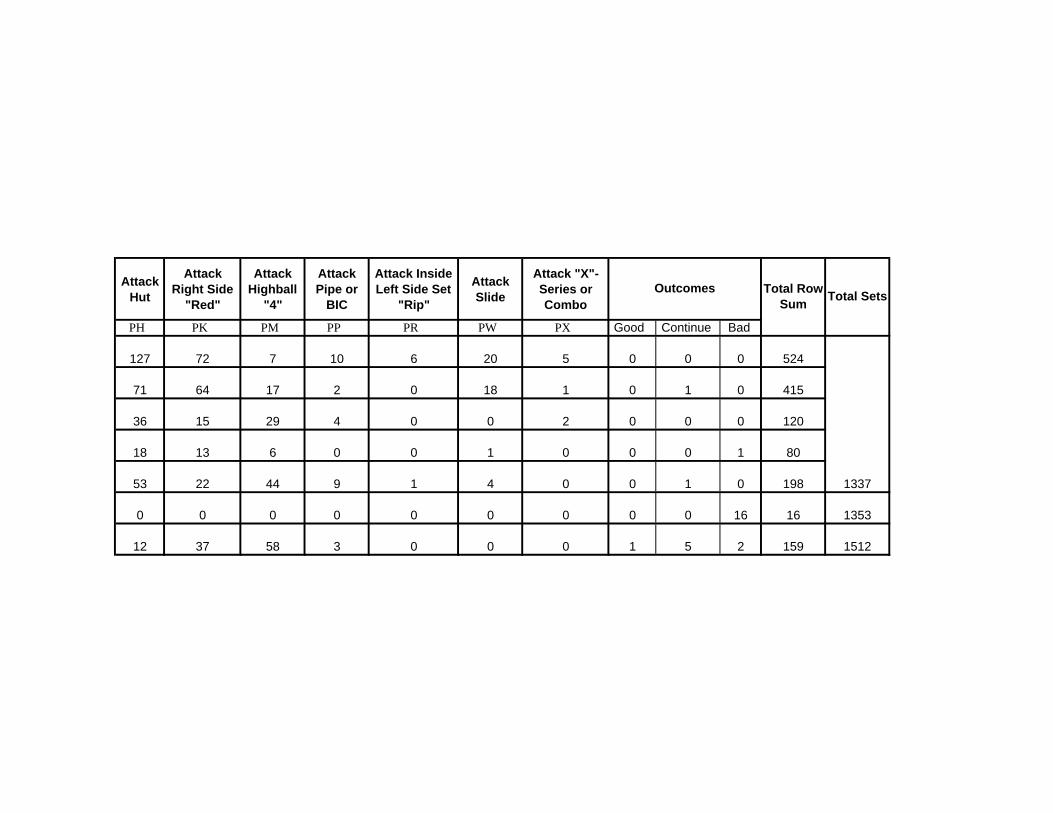
Attack Hut
Attack Right Side
"Red"
Attack Highball
"4"
Attack Pipe or
BIC
Attack Inside Left Side Set
"Rip"
Attack Slide
Attack "X"-Series or Combo
Outcomes Total RowSum
Total Sets
PH PK PM PP PR PW PX Good Continue Bad
127 72 7 10 6 20 5 0 0 0 524
71 64 17 2 0 18 1 0 1 0 415
36 15 29 4 0 0 2 0 0 0 120
18 13 6 0 0 1 0 0 0 1 80
53 22 44 9 1 4 0 0 1 0 198 1337
0 0 0 0 0 0 0 0 0 16 16 1353
12 37 58 3 0 0 0 1 5 2 159 1512
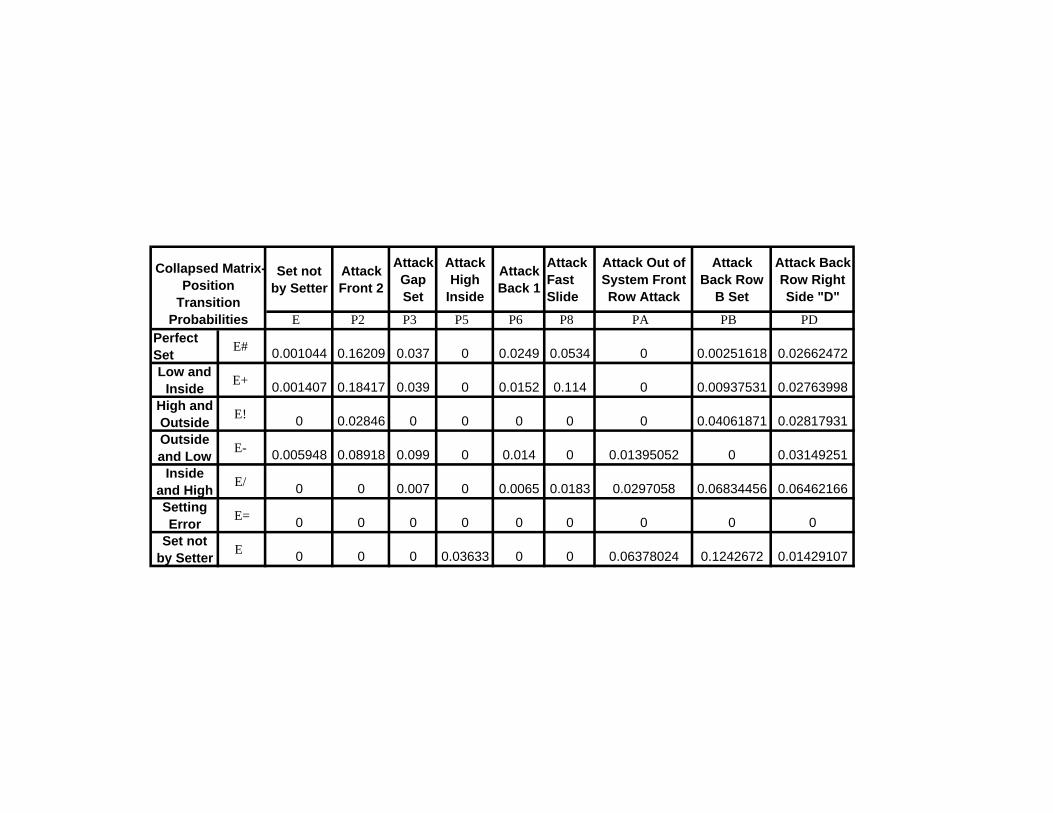
Collapsed MatrixPosition
Transition Probabilities
Set not by Setter
- Attack Front 2
Attack Gap Set
Attack High
Inside
Attack Back 1
Attack Fast Slide
Attack Out of System Front Row Attack
Attack Back Row
B Set
Attack Back Row Right Side "D"
E P2 P3 P5 P6 P8 PA PB PD Perfect Set E# 0.001044 0.16209 0.037 0 0.0249 0.0534 0 0.00251618 0.02662472Low and
Inside E+ 0.001407 0.18417 0.039 0 0.0152 0.114 0 0.00937531 0.02763998High and Outside E! 0 0.02846 0 0 0 0 0 0.04061871 0.02817931Outside and Low E- 0.005948 0.08918 0.099 0 0.014 0 0.01395052 0 0.03149251
Inside and High E/ 0 0 0.007 0 0.0065 0.0183 0.0297058 0.06834456 0.06462166Setting Error E= 0 0 0 0 0 0 0 0 0
Set not by Setter E 0 0 0 0.03633 0 0 0.06378024 0.1242672 0.01429107
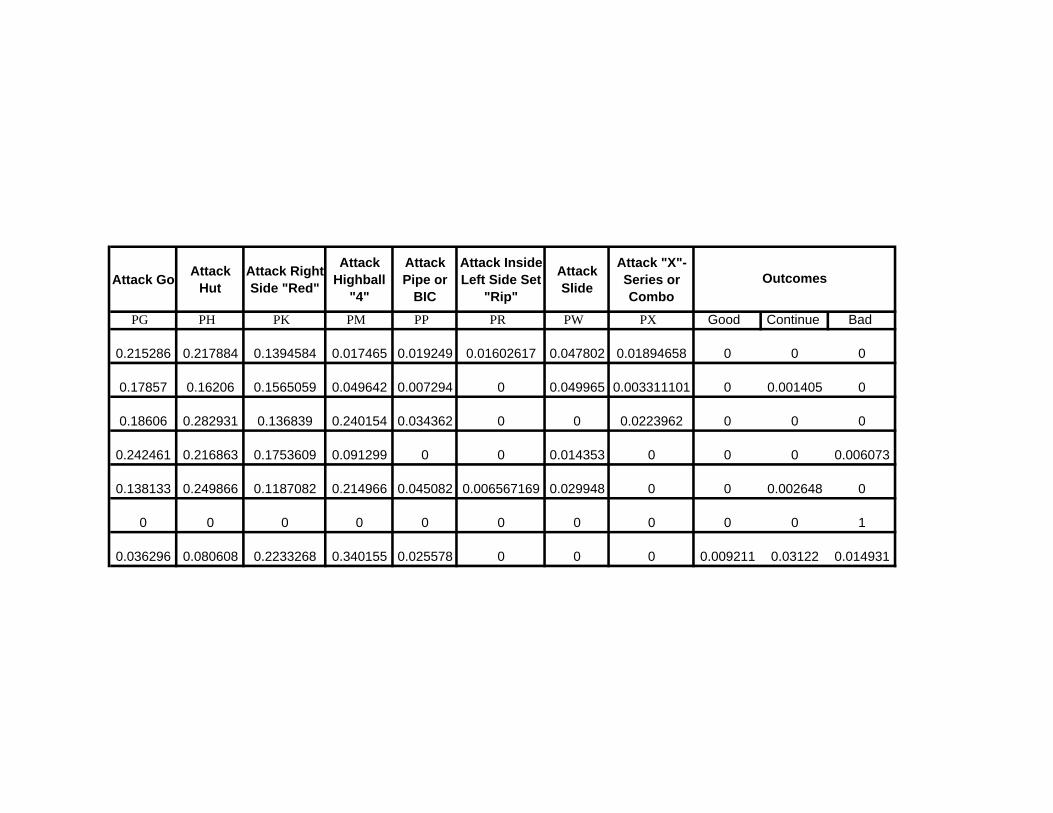
Attack Go Attack Hut
Attack RightSide "Red"
Attack Highball
"4"
Attack Pipe or
BIC
Attack InsideLeft Side Set
"Rip"
Attack Slide
Attack "X"-Series or Combo
Outcomes
PG PH PK PM PP PR PW PX Good Continue Bad
0.215286 0.217884 0.1394584 0.017465 0.019249 0.01602617 0.047802 0.01894658 0 0 0
0.17857 0.16206 0.1565059 0.049642 0.007294 0 0.049965 0.003311101 0 0.001405 0
0.18606 0.282931 0.136839 0.240154 0.034362 0 0 0.0223962 0 0 0
0.242461 0.216863 0.1753609 0.091299 0 0 0.014353 0 0 0 0.006073
0.138133 0.249866 0.1187082 0.214966 0.045082 0.006567169 0.029948 0 0 0.002648 0
0 0 0 0 0 0 0 0 0 0 1
0.036296 0.080608 0.2233268 0.340155 0.025578 0 0 0 0.009211 0.03122 0.014931