development and characterization of a tridimensional ... · 2014 carla luÍs riba development and...
TRANSCRIPT

DEVELOPMENT AND CHARACTERIZATION OF A TRIDIMENSIONAL INTESTINAL MODEL TO STUDY PROTEIN DRUGS
ABSORPTION
CARLA LUÍS RIBAS COSTA PEREIRA MASTER DEGREE IN BIOMEDICAL ENGINEERING AT FACULTY OF ENGINEERING, UNIVERSITY OF PORTO
M 2014

- This page was intentionally left blank. -

3
Carla Luís Ribas Costa Pereira
This thesis was submitted to the Faculty of Engineering of University of Porto for the degree of Master in Biomedical Engineering.
Faculty of Engineering University of Porto
Porto, 2014
DEVELOPMENT AND CHARACTERIZATION OF A TRIDIMENSIONAL INTESTINAL MODEL TO STUDY PROTEIN DRUGS
ABSORPTION

This thesis was supervised and co-supervised, respectively, by: Professor Doutor Bruno Filipe Carmelino Cardoso Sarmento INEB - Instituto de Engenharia Biomédica, Universidade do Porto, Porto, Portugal. CESPU, IINFACTS – Instituto de Investigação e Formação Avançada em Ciências e Tecnologias da Saúde, Instituto Superior de Ciências da Saúde-Norte, Departamento de Ciências Farmacêuticas, CESPU, Gandra, Portugal.
Professor Doutor Pedro Lopes Granja INEB - Instituto de Engenharia Biomédica, Universidade do Porto, Porto, Portugal. FEUP – Faculdade de Engenharia da Universidade do Porto, Porto, Portugal. ICBAS - Instituto de Ciências Biomédicas Abel Salazar, Universidade do Porto, Porto, Portugal
The present work was conducted at:
INEB - Instituto de Engenharia Biomédica, Universidade do Porto, Porto, Portugal.
Biocarrier – Biomaterials for Multistage Drug and Cell Development Group
The work was financially supported by:
This work was financed by the European Regional Development Fund (ERDF) through the
Programa Operacional Factores de Competitividade – COMPETE, by Portuguese funds through
Fundação para a Ciência e a Tecnologia (FCT) in the framework of the project PEst-
C/SAU/LA0002/2013, and co-financed by the North Portugal Regional Operational Programme
(ON.2 – O Novo Norte) in the framework of project SAESCTN-PIIC&DT/2011, under the
National Strategic Reference Framework (NSRF).


i
AKNOWLEDGMENTS
A deeply grateful to my thesis supervisor, Professor Doutor Bruno Sarmento, for the
comprehensive discussions and guidance. For the opportunity of share thoughts and learnings
and for the immediate availability to answer my doubts. My most sincere thank for make all
of this possible.
I would like to thank to Professor Doutor Pedro Granja, my thesis co-supervisor, for the
opportunity to work in such a revolutionary and passionate group, intrigued with the nature of
science. For all the optimism and inspiration shared every day.
To the INEB’s family that surrounding my daily routine, for the tireless and promptness to
lend me a hand. For the moments that we shared and for the constant hold.
No words could suffice to my family, who supported my dreams and ambitions. For the pride
that transmitted in every victory and for the tranquilizing moments.
Finally, a longing work to School of Biotechnology and Faculty of Engineering, for making the
outmost of this mythical five years.
To engineering. To science.

ii

iii
ABSTRACT
Despite the huge palette of the existing intestinal models, the drug development
industry is not entirely satisfied since these models poorly replicate the architecture and
mechanisms occurring in a living tissue. The current understandings on a number of biological
processes are based on two-dimensional (2D) surfaces however in vivo cells primarily exist in
a heterogeneous and information-rich environment which modulate a diversity of cellular
events. The 2D models are a reductionist approach that not faithfully captures the in vivo
scenario. In fact, the striking similarity between the in vivo morphology and behaviour of
cells in tridimensional (3D) culture conditions, have turn 3D models in a mainstream
approach.
The present study extends a traditional intestinal model to the deeper layers of the
small intestine, in particular the intestinal mucosa that includes a broad variety of stromal
cells. Fundamentally, this work aimed to dissect the stromal-epithelial interactions and
evaluate the permeation of a protein drug, insulin, using a 3D based model comprising CCD18-
Co intestinal myofibroblasts embedded in Matrigel, Caco-2 and HT29-MTX epithelial cells and
Raji B lymphocytes.
As the 3D environment triggers different cellular responses of the 2D environment, the
density of CCD18-Co cells was optimized and the results showed that 1×10⁴ cells/cm2 was the
cell density better adapted to 21 days of culture, period necessary to fully differentiate Caco-
2 cells. CCD18-Co cells embedded in Matrigel showed to exert a supportive role in the
maintenance of the epithelial cells onto them. This structure is similar the native intestinal
mucosa architecture. Matrigel, primarily acting as an initial livelihood, was substituted by
extracellular matrix components newly produced by CCD18-Co cells.
All the studied models revealed functionally effective, returning sustainable results of
transepithelial electrical resistance and expression of tight junction (TJ) proteins, which are
indicators of membrane integrity and tightness respectively. Although Caco-2 cells form tight
junctions between them, the introduction of mucus-producing HT29-MTX cells interferes with
the tightness of the barrier due to structural differences between the TJs.
As mean to explore the transcytotic capacity of M cells, Raji B lymphocytes were added
to the basolateral side of the Transwell insert to carry out the phenotypic conversion of Caco-
2 cells into M-like cells. Although trigger these cells is a challenge due to the inexistence of a
distinct cell marker, the lack of microvilli was the best cue to identify M-like cells.
The 3D quadruple model showed to be efficient in the prediction of insulin
permeability. The less tight junctions between the epithelial cells, the existence of mucus
and the presence of M-like cells were critical factors in the transport of insulin.
Ultimately, this model closely resembles the intestinal mucosa representing a
sophisticate and robust tool useful in the absorption’s evaluation of incoming drugs in the
market.

iv

v
RESUMO
Apesar da existência de uma grande palete de modelos intestinais, a indústria de
desenvolvimento de novos fármacos não está inteiramente satisfeita, uma vez que estes
modelos não replicam plenamente a arquitetura e os mecanismos existentes num organismo.
A atual compreensão de muitos processos biológicos é baseada em superfícies bidimensionais
(2D), no entanto, in vivo, as células estão rodeadas por um ambiente heterogéneo e
informativo que modula uma diversidade de eventos celulares. Os modelos 2D são uma
abordagem reducionista que não captura fielmente o cenário in vivo. Na verdade, a
semelhança notável da morfologia e comportamento in vivo em condições de cultura
tridimensional (3D) tem tornado os modelos 3D a principal abordagem.
O presente estudo estende um modelo intestinal tradicional para as camadas mais
profundas do intestine delgado, em particular a mucosa intestinal, que inclui uma ampla
variedade de células do estroma. Fundamentalmente, este trabalho visou dissecar as
interações estroma-epitélio e avaliar a permeação de um fármaco proteico, a insulina, usando
um modelo 3D composto por miofibroblastos intestinais CCD18-Co embebidos em Matrigel,
células epiteliais Caco-2 e HT29-MTX e linfócitos Raji B.
Como o ambiente 3D desencadeia diferentes respostas celulares do ambiente 2D, a
densidade de células CCD18-Co foi otimizada e os resultados demonstram que 1×10⁴
células/cm2 foi a densidade celular melhor adaptada aos 21 dias de cultura, período
necessário para diferenciar totalmente as células Caco-2. As células CCD18-Co embebidas em
Matrigel mostram exercer um papel de suporte na manutenção das células epiteliais. Esta
estrutura é semelhante à arquitetura nativa da mucosa intestinal. Matrigel, que inicialmente
atuava como um meio de vida, foi substituído por componentes da matriz extracelular recém
produzidos pelas células CCD18-Co.
Todos os modelos estudados se revelaram funcionalmente eficazes, devolvendo
resultados sustentáveis de resistência transepitelial e expressão de junções apertadas, que
são indicadores de integridade e estreiteza da membrana, respetivamente. Apesar das células
Caco-2 estabelecerem juncões intercelulares entre elas, a introdução das células HT29-MTX
produtoras de muco interfere com a estreiteza da barreira devido às diferenças estruturais
existentes entre as junções.
Como meio de explorar a capacidade transcitótica das células M, linfócitos Raji B foram
adicionadas na parte basolateral do Transwell insert para conduzir a conversão fenotípica das
células Caco-2 em células do tipo M. Embora detetar estas células seja um desafio devido à
inexistência de uma marcador distinto, a falta de microvilosidades foi a melhor pista para
identificar as células do tipo M.
O modelo quádruplo 3D mostrou ser eficiente na previsão da permeabilidade da
insulina. O carácter menos apertado entre as células epiteliais, a existência de muco e a
presença das células M foram fatores críticos no transporte de insulina.

vi
Para finalizar, este modelo assemelha-se à mucosa intestinal, representando uma
ferramenta sofisticada e robusta útil para a avaliação da absorção de novos fármacos que
chegam ao mercado.

vii
CONTENTS
LIST OF FIGURES........................................................................................ ix
LIST OF TABLES......................................................................................... xi
LIST OF ABBREVIATIONS................................................................................. xiii
CHAPTER I – INTRODUCTION
1.1. Intestinal and mucosal functioning.................................................... 1
1.2. Intestinal progeny....................................................................... 1
1.3. Intestinal immunology................................................................... 3
1.3.1. M cells associated to lymphoid tissues........................................... 4
1.3.1.1. M cell differentiation in the gut epithelium............................ 5
1.3.1.2. In vitro M cell differentiation............................................. 6
1.4. Epithelial - mesenchymal crosstalk.................................................... 7
1.4.1. Epithelial – stromal interface..................................................... 7
1.5. Intestinal barriers........................................................................ 9
1.5.1. Luminal barriers..................................................................... 9
1.5.2. Gut wall barriers.................................................................... 10
1.6. Intestinal transport mechanisms....................................................... 10
1.6.1. Paracellular transport.............................................................. 11
1.6.2. Transcellular transport............................................................. 12
1.6.3. M cells mediated transport........................................................ 12
1.7. Predicting intestinal absorption........................................................ 13
1.7.1. In vivo models....................................................................... 13
1.7.2. In vitro models...................................................................... 14
1.7.3. Caco-2 based models............................................................... 14
1.7.4. Co-culture models.................................................................. 16
CHAPTER II – AIM & OBJECTIVES
2.1. Aim and objectives...................................................................... 21
CHAPTER III – MATERIALS AND METHODS
3.1. Materials................................................................................... 25
3.2. Establishment of in vitro models....................................................... 25
3.2.1. Cell lines and cell culture conditions............................................ 25
3.2.2. Cell thawing......................................................................... 26
3.2.3. Optimization of CCD18-Co cell density.......................................... 26
3.2.3.1. Cell viability.................................................................. 26
3.2.3.2. Cell metabolic activity..................................................... 27
3.2.3.2. Total dsDNA quantification................................................ 27

viii
3.2.3.3. Cell morphology............................................................. 27
3.2.4. Production of ECM components................................................... 28
3.2.5. Monolayer in vitro models......................................................... 29
3.2.6. Tridimensional in vitro models................................................... 30
3.2.7. Transepithelial electrical resistance (TEER) ................................... 32
3.2.8. Cell proliferation.................................................................... 32
3.2.9. Paraffin sections and histological staining...................................... 32
3.2.10. Expression of cell junctions proteins............................................. 33
3.2.11. Alkaline phosphatase assay....................................................... 33
3.2.11.1. Protein quantification................................................. 34
3.2.12. Scanning electron microscopy..................................................... 34
3.2.13. Transmission electron microscopy................................................ 35
3.2.14. Drug transport assay................................................................ 35
3.2.15. Statistical analysis.................................................................. 36
CHAPTER IV - RESULTS
4.1. Analysis of CCD18-Co cells behaviour in 2D.......................................... 39
4.1.1. Effect of cell number on viability of CCD18-Co cells in 2D................... 39
4.1.2. Effect of cell number on metabolic activity of CCD18-Co cells.............. 41
4.1.3. DNA quantification.................................................................. 42
4.1.4. Effect of cell number on CCD18-Co cells morphology......................... 42
4.1.5. Characterization of ECM components............................................ 47
4.1.6. Topographical features of CCD18-Co cells...................................... 49
4.2. Barrier modulation by epithelial cells................................................. 50
4.2.1. Assessing barrier integrity......................................................... 50
4.2.2. Epithelial-stromal interactions.................................................... 52
4.2.3. Topographical features of Caco-2 cells.......................................... 53
4.2.4. Expression of tight junction proteins............................................ 53
4.2.5. Caco-2 / HT29-MTX co-culture.................................................... 54
4.2.6. Evidence of M-like cell formation................................................ 56
4.2.6.1. Quantification of alkaline phosphatase activity.................. 57
4.2.6.2. Morphological features of M-like cells............................. 58
4.2.7. Visualization of the tridimensional model...................................... 60
4.2.8. Insulin permeability................................................................ 61
4.2.8.1. Insulin quantification................................................. 62
4.2.8.2. FITC-Dextran permeability........................................... 67
CHAPTER V – CONCLUDING REMARKS & FUTURE PERSPECTIVES 71
CHAPTER VI – REFERENCES 75

ix
LIST OF FIGURES
Figure 1. 1. Intestinal cells lineage in mammalian small intestine. .................................. 2
Figure 1. 2. The regulatory barrier function of intestinal epithelial cells. .......................... 3
Figure 1. 3. Intestinal sites of immune response......................................................... 4
Figure 1. 4. Morphological features of M cells. ........................................................... 5
Figure 1. 5. Possible mechanism behind M-cell genesis derived from Lgr5+ stem cells in the
crypts. ........................................................................................................... 6
Figure 1. 6. Stromal-epithelial interactions along the villus-crypt axis. ............................. 8
Figure 1. 7.Sequential barriers during the transit of a drug molecule in the GI tract when
orally administered until reaches the systemic circulation. ........................................... 9
Figure 1. 8. Schematic representation of mechanisms of transport. ............................... 11
Figure 3. 1. Schematic configuration of monolayer in vitro models. .............................. 30
Figure 3. 2. Schematic configuration of the double 3D in vitro models. .......................... 31
Figure 3. 3. Schematic configuration of the 3D quadruple model. ................................. 31
Figure 4. 1. Live/Dead viability assay performed in 2D cultures of CCD18-Co cells. ............ 40
Figure 4. 2. Metabolic activity of CCD18-Co cultured in 2D and 3D along 21 days at different
densities. ...................................................................................................... 41
Figure 4. 3. Total dsDNA quantification of CCD18-Co cultured for 21 days in 2D standard
conditions at different densities. ......................................................................... 42
Figure 4. 4. Intestinal fibroblasts morphology identified by vimentin staining at day 7. ....... 44
Figure 4. 5. Intestinal fibroblasts morphology identified by vimentin staining at day 14. ..... 45
Figure 4. 6.Intestinal fibroblasts morphology identified by vimentin staining at day 21. ...... 46
Figure 4. 7. Characterization of fibronectin network of CCD18-Co cells cultured in 2D standard
conditions. Over 21 days, is observed a shy increase of FN expression. ........................... 48
Figure 4. 8. Characterization of fibronectin network of CCD18-Co cells cultured in 3D
conditions.. ................................................................................................... 49
Figure 4. 9. Scanning electron micrographs of the CCD18-Co and Matrigel/CCD18-Co
monolayer. .................................................................................................... 50
Figure 4. 10. TEER cell measurements monitored in function of time during 21 days of culture
in cell based models of CCD18-Co intestinal fibroblasts and Caco-2 cells......................... 51
Figure 4. 11. Effect of the substrate on cell proliferation of Caco-2 and CCD18-Co cells after 7
days of culture. .............................................................................................. 52
Figure 4. 12. Scanning electron micropraphs of the Caco-2 monolayer after 21 days of culture.
.................................................................................................................. 53
Figure 4. 13. Expression of claudin-5, occludin and E-cadherin in Caco-2 cell monolayer. ... 54
Figure 4. 14. TEER cell measurements monitored in function of time during 21 days of culture
in a cell based model of CCD18-Co intestinal fibroblasts, Caco-2 and HT29-MTX cells. ........ 55

x
Figure 4. 15. Expression of claudin-5 in HT29-MTX monolayer and occludin in Caco-2/HT29-
MTX monolayer. .............................................................................................. 55
Figure 4. 16. Transmission electron micrographs of Caco-2/HT29-MTX monolayer. ............ 56
Figure 4. 17. TEER cell measurements monitored in function of time during 21 days of culture
in a cell based model of CCD18-Co intestinal fibroblasts, Caco-2 cells, HT29-MTX and Raji B
cells. ........................................................................................................... 57
Figure 4. 18. Expression of tight junction protein occludin in Caco-2/HT29-MTX/Raji B model.
.................................................................................................................. 57
Figure 4. 19. Alkaline phosphatase (ALP) activity during differentiation of Caco-2/Raji B
model. ......................................................................................................... 58
Figure 4. 20. Transmission electron micrographs of Caco-2/HT29-MTX/Raji B monolayer. .... 59
Figure 4. 21. Scanning electron micrographs of the Caco-2/Raji B double model and of the
Caco-2/HT29-MTX/Raji B triple model after 21 days. ................................................ 60
Figure 4. 22. Tridimensional model visualization through histological cut stained with H&E. 60
Figure 4. 23. Fibronectin expression of a paraffin section of tridimensional model of CCD18-Co
cells embedded in Matrigel and Caco-2 cells. .......................................................... 61
Figure 4. 24. TEER values monitored in function of time during 4 hours of permeability
experiments, comprising Caco-2, CCD18-Co cells, HT29-MTX and Raji B cells. .................. 62
Figure 4. 25. Cumulative transport of insulin across monocultures and co-cultures of CCD18-Co
and Caco-2 cells. ............................................................................................. 63
Figure 4. 26. Cumulative transport of insulin across monocultures and co-cultures of CCD18-Co
fibroblasts, Caco-2 cells and HT29-MTX cells.. ......................................................... 64
Figure 4. 27. Cumulative transport of insulin across monocultures and co-cultures of CCD18-Co
fibroblasts, Caco-2 cells, HT29-MTX and Raji B cells.. ................................................ 65
Figure 4. 28. Apparent permeability coefficient (Papp) of insulin through the tridimensional
models comprising CCD18-Co, Caco-2 cells, HT29-MTX cells and Raji B cells. ................... 67
Figure 4. 29. 4 kDa FITC-Dextran permeability after 4 hours of permeability studies to assess
the membrane integrity. ................................................................................... 68

xi
LIST OF TABLES
Table 1. 1. Mesenchymal stromal cell markers.. ......................................................... 7
Table 1. 2. Morphological and functional characteristics of Caco-2 cell line. .................... 15
Table 1. 3. Alternatives to in vitro drug permeability studies. ..................................... 16
Table 1. 4. Summary of the pros, cons and costs of the intestinal models drug screening and
permeability. ................................................................................................. 18
Table 4. 1. Apparent permeability coefficient (Papp × 10-6 cm/s) of insulin across the
monolayer comprising CCD18-Co and Caco-2 cells .................................................... 64
Table 4. 2. Apparent permeability coefficient (Papp × 10-6 cm/s) of insulin across the models
comprising CCD18-Co, Caco-2 and HT29-MTX cells. ................................................... 65
Table 4. 3. Apparent permeability coefficient (Papp × 10-6 cm/s) of insulin across the
monolayer comprising CCD18-Co, Caco-2, HT29-MTX cells and Raji B lymphocytes. ............ 66
Table 4. 4. Apparent permeability coefficient (Papp × 10-6 cm/s) of insulin across rat ileum ex
vivo models. .................................................................................................. 67

xii

xiii
LIST OF ABREVIATIONS
2D – Two-dimensional
3D – Tridimensional
ADME – Administration, Distribution, Metabolism, Excretion
AJs – Adherent junctions
ALP – Alkaline phosphatase
AMPs – Antimicrobial proteins
APES - 3-aminopropyltriethoxysilane
BM – Basement membrane
CCL20 – Chemokine ligand 20
CCR6 - Chemokine receptor 6
CD – Cluster of differentiation
CYP450 – Cytochrome P450
DAPI - 4', 6-diamidino-2-phenylindole
DCs- Dendritic cells
DMEM - Dulbecco’s Modified Eagle’s Medium
DMSO – Dimethyl sulfoxide
EDTA - Ethylenediamine tetraacetic acid
FAE – Follicle-associated epithelium
FBS - Fetal Bovine Serum
FN – Fibronectin
GALT – Gut-associated lymphoid tissue
GI – Gastrointestinal
HBSS - Hanks Balanced Salt Solution
HDMS - Hexamethyldisilazane
HGF – Hepatocyte growth factor
IDE - Insulin-degrading enzyme
IEL – Intraepithelial lymphocytes
IESC – Intestinal epithelial stem cells

xiv
IL - Interleukin
IMFs – Intestinal myofibroblasts
JAMs - Junctional adhesion molecules
KGF – Keratinocyte growth factor
LPLs - Lamina propria lymphocytes
LTα1β2 – Lymphotoxin
LTβR – Lymphotoxin-β receptor
M cells – Microfold cells
MALT – Mucosa-associated lymphoid tissue
MDCK - Madin Darby Canine Kidney
MDR - Multidrug resistance
M-like cells – Microfold-like cells
MLNs - Mesenteric lymph nodes
MMPs – Metalloproteinases
MRP - Multidrug resistance-associated proteins
MTX – Methotrexate
MUC – Mucin
NEAA - Non-essential aminoacids
PBS - Phosphate Buffer Solution
PDL - Poly-D-Lysine
P-gp – P-glycoprotein
PI - Propidium Iodide
PPs – Peyer’s Patches
PrPc – Cellular prior protein
RANK - Receptor activator of nuclear factor kappa-B
RANKL - Receptor activator of nuclear factor kappa-B ligand
RT- Room temperature
SED – Subepithelial dome
SEM – Scanning electron microscopy
SF4 – Scatter growth factor

xv
SLAA - Sialytated Lewis A antigen
TE – Tris-EDTA
TEER – Transepithelial electrical resistance
TEM – Transmission electron microscopy
TFF – Trefoil factors
TJs – Tight junctions
TNF- α – Tumor necrosis factor - α
UMOD – Uromodulin
ZO - Zonula occludens
α-SMA – α-smooth muscle actin

xvi

CHAPTER I
INTRODUCTION


INTRODUCTION
1
1.1. Intestinal and mucosal functioning
Intestine is the major portion of gastrointestinal (GI) tract whose primary function is
to gather the entrance of pathogens, toxins and undigested molecules while enabling the
digestion and selective absorption of essential nutrients into the body. These distinct
functions place the intestinal mucosa in the center of interactions between the immune
system and the luminal contents [1]. There is no doubt that there is a tight control of enteric
bacteria population and the luminal contents presenting those components to diverse physical
and chemical intestinal barriers. If the foremost barriers fail, immune cells (phagocytes and
lymphocytes underlying the lamina propria) are the next in line to carry out defensive actions
[2].
Human small intestine, owing the larger surface area provided by valves of Kerckring
(macroscopic valve-like folds), villi (finger-like protrusions), crypts (finger-like invaginations)
and microvilli (cytoplasmatic extension), represents the protagonist organ in the drug
absorption [3]. Absorption evaluation plays an ever increasingly role at the early stages of
drug discovery due to its colossal potential to eliminate molecules with poor ADME
(Absorption, Distribution, Metabolism and Excretion) properties from the drug development
pipeline. Therefore, the replication of the intestinal functioning has revealed an attractive
strategy that will potentially energize the drug development.
1.2. Intestinal progeny
The intestinal epithelium is unique in the cell proliferation, differentiation and
apoptosis mechanisms as it occurs in an orderly fashion along the crypt-villus axis but ceases
as cells reach the apex of villi ongoing spontaneous apoptosis and detaching into the lumen
[4]. Wnt signal transduction pathway is the primary driving force behind intestinal
proliferation responsible for maintain the crypt cell population in proliferative state [5, 6].
Proliferative crypts are monoclonal compartments [7] that harbour intestinal epithelial stem
cells (IESC) and their progeny - transit-amplifying cells – partially differentiated cells that
divide 4-5 times before terminally differentiate (Fig. 1.1 A). The differentiated cells
generated from this process are divided in two populations that holds absorptive enterocytes
and secretory cells including goblet, enteroendocrine and Paneth cells (Fig. 1.1 B) [5].
Although most reviews are focused on the aforementioned four cell types, there are
described three additional intestinal cell types including microfold cells (M cells) [8], tuft
cells or brush cells [9] and cup cells [10].

INTRODUCTION
2
Figure 1. 1. Intestinal cells lineage in mammalian small intestine. Migratory process of transit-amplifying cells
occurs in an orderly fashion along the crypt-villus (A) given origin to four main cell types classified according
absorptive or secretory cells (B). Adapted from Crosnier C. et al. [4].
Absorptive enterocytes, representing about 80% of intestinal epithelial cells [11], are
columnar and polarized cells discernible by the presence of apical brush border relevant in
nutrient absorption. Goblet cells, scattered throughout the epithelium, are responsible for
the secretion of protective mucins and trefoil factors (TFF) required for the movement and
expulsion of gut contents and provide protection against shear stress and chemical damage.
Enteroendocrine cells, about ~1% of epithelial cell population, represent a bridge between
the central and enteric neuroendocrine system throughout the secretion of peptide hormones
[12]. Paneth cells, with a function in innate immunity [13], are the only differentiated cells
that reside on the undifferentiated compartment of intestinal mucosa, the crypts. These cells
are usually identified by the large apical secretory granules that contain lysozymes,
antimicrobials proteins (AMPs) and defensins [14]. Collectively, the diverse functions of
intestinal epithelial cells result in a dynamic barrier that maintains the segregation between
the luminal microbial communities and the mucosal immune system (Fig. 1.2) [12].
Overall, intestinal stem cells, their progeny and their microenvironment make up the
niche, an anatomical and functional structure that coordinates the normal homeostatic
production of functional mature cells. An intimate regulation between intrinsic and extrinsic
cellular mechanisms maintains the balance between self-renewal and differentiation events
[7].
A B

INTRODUCTION
3
SM
ALL IN
TESTIN
E
FO
LLIC
LE A
SSO
CIA
TED E
PIT
HELIU
M
Figure 1. 2. The regulatory barrier function of intestinal epithelial cells. AMPs and TFF, respectively secreted by
goblet and Paneth cells, promote the exclusion of bacteria from the epithelial surface. The luminal release of
secretory IgA (sIgA) protects the intestinal epithelium from enteric toxins and pathogenic microorganisms. M cells
mediate the transport of luminal antigens and bacteria across the epithelial barrier for immunological surveillance.
Adapted from Peterson L. and Artis D. [12].
1.3. Intestinal immunology
Despite the selective character provided for highly efficient barriers, some pathogens
can overcome the protective mechanisms and enter in the systemic circulation. As an extra-
protective effort, the intestinal lining has more lymphoid cells and produces more antibodies
than any other organ in the body [15]. The complex interplay of regulatory systems ensures
the maintenance of gut homeostasis allowing the clear discrimination between invasive
organisms and harmless antigens. Indeed, an active immunity against non-pathogenic
materials and hypersensitivity against dietary antigens and commensal bacteria can unroll in
inflammatory disorders such as coelic disease and Crohn’s disease, respectively [1].
Every mucosa region in the body has their own region for immunological surveillance
known as mucosa-associated lymphoid tissue (MALT), with similar but not identical cellular
composition [16]. The intestinal immune responses are entrusted to gut-associated lymphoid
tissue (GALT), which tasks are divided for induction sites consisting of PPs and mesenteric
lymph nodes (MLNs), involved in the induction phase of the immune response [2, 17] and
effector sites that are diffused throughout the lamina propria and the epithelium of the
mucosa [15]. Both the PPs and the villus are drained by afferent lymphatic that go to MLNs [1]
(Fig. 1.3).
PPs have been increasingly valued since they are considered the immune sensors of
intestine [18]. They are macroscopic lymphoid aggregates found in submucosa surrounded by
a single layer of columnar epithelial cells, the follicle-associated epithelium (FAE), an
interface between GALT and the luminal environment [18]. Mature PPs generally consists of

INTRODUCTION
4
collections of large B-cell follicles and intervening T-cell areas [1]. Added to that, FAE is
considered a selective break of intestinal barriers due to the lower levels of digestive
enzymes, a less pronounced brush border surface and mucus production in reduced
quantities, facilitating the access to the apical surface [18].
Figure 1. 3. Intestinal sites of immune response. The lymphoid areas are separated from the intestinal lumen by
FAE and a more diffuse area below the epithelium known as subepithelial dome (SED). Adapted from Mowat A. [1].
1.3.1. M cells associated to lymphoid tissues
FAE’s most determinant feature is the presence of M cells, specialized enterocytes for
antigen sampling that constitute 10% of epithelial cells of the FAE [19]. However they
represent a ratio of 1 in 10 million to the total number of intestinal epithelial cells [20].
These cells are highly specialized for the phagocytosis and transcytosis of luminal content,
particularly antigens and pathogenic or commensal microorganisms [21, 22]. Beneath the M-
cell basolateral membrane, antigens are taken up by intraepithelial pocket which contains a
population of lymphocytes and mononuclear phagocytes (a heterogeneous population of
macrophages and classical DCs) (Fig. 1.4 A) [8].
Morphologically distinct from enterocytes, M cells display poorly organized brush border
with short irregular microvilli at the apical domain (Fig. 1.4 B), usually identified by
immunostaining of actin and villin [23]. The usual thick glycocalyx of absorptive cells is
replaced in M cells by a thin glycocalyx. Naturally, these features lead to a highly attenuated
expression of apical digestive enzymes such as alkaline-phosphatase and iso-sucrase maltase
[20, 24].

INTRODUCTION
5
Figure 1. 4. Morphological features of M cells. (A) M cell features denoting the lack in microvilli and mucus layer
and the basolateral pocket containing immunosurveillance cells. (B) Scanning electron microscopy of M cell
highlighting the blunted microvilli. (C) Immunohistochemical analysis of mature M cells in the FAE of a mouse PPs of
specifically expressing glycoprotein 2 (GP2). Adapted from Mabbott N. A. et al. [8].
The reduced brush border and lack in enzymatic activity clarifies the inexistence of a
prominent role of M cells in digestion or absorption. On the other hand, the exposed nature of
M cell apical surface and their location sited over lymphoid follicles assuring the immediate
exposure of foreign matter to underlying immune cells, points the transepithelial transport as
the primary function of M cells [24].
Due to the lack of knowledge, general agreement on M cell function fails to go further
than this, but, at least, M cells express a variety of “immunosurveillance” receptors on their
apical surfaces that enable them to sample diverse microbial pathogens and antigens such as
glycoprotein 2 (GP2), uromodulin (UMOD) and cellular prior protein (PrPC), among others [8,
19, 25].
1.3.1.1. M cell differentiation in the gut epithelium
In the intestine, the dome-associated crypts surrounding the FAE and the villous
crypts at the base of the villi contain cycling Lgr5+ cells (leucine-rich repeat-containing G
protein couple receptor) intermingled among Paneth cells, from each almost epithelial cells
lineage, including M cells, emerged (Fig. 1.5, A) [26]. As both dome associated crypts and
villous crypts contain cycling Lgr5+ stem cells, additional signals from the stromal and immune
cells in the SED are required to induce M cell differentiation. In intestine, the cytokine
Receptor Activator of NF-kB Ligand (RANKL) is selectively expressed by the subepithelial
stromal cells beneath the FAE (Fig. 1.5, B) [8]. Analysis of a RANKL-deficient mice and
administration of exogenous RANKL in vivo reveals that this cytokine is a critical factor that
controls the differentiation of RANK-expressing enterocytes into M cells. Indeed, the
interaction between RANKL and its receptor RANK will induce Spi-B (transcription factor)
expression that could induce the maturation of M cells (Fig. 1.5, C) [27, 28].
B
C
A

INTRODUCTION
6
M cell phenotype can also be induced by immune cells attracted to the dome region by
the cytokine CCL20 produced by epithelial cells (Fig. 1.5, D) [29]. Immune cells interact with
CCL20 through their receptor CCR6, verifying that when this signalling is impeded, M cell
maturation is likewise compromised [30]. However, CCL20-CCR6 signalling does not influence
the initial M cell differentiation but instead hampers their functional maturation [31].
Therefore, the remaining question of how B cell interacts with M cells precursors is not fully
clarified but some authors claim that CD37L-CD37 signalling between M cells progenitors and
the basolateral pocket of B cells may provide at least one of the signals that induce final
functional maturation [32].
Figure 1. 5. Possible mechanism behind M-cell genesis derived from Lgr5+ stem cells in the crypts. (A) All the
epithelial cell lineages develop from Lgr5+ intestinal stem cells located in the crypts. (B) RANKL is selectively
expressed by the subepithelial stromal cells beneath the FAE. (C) The RANKL-RANK interaction will induce Spi-B
expression that could induce the maturation of functional M cells. (D) Immune cells can also induce M cell
phenotype attracted to the dome region by the cytokine CCL20 produced by epithelial cells. Adapted from Mabbott
N. A. et al. [8].
1.3.1.2. In vitro M cell differentiation
The FAE that overlies Peyer’s Patches constitutively expresses the chemokine CCL20
that is not expressed in the absorptive epithelium [33]. However the mechanisms behind the
interplay between FAE differentiation and CCL20 expression are poorly understood. At the
same time, lymphotoxin β receptor (LTβR) signalling plays a central role in the PPs’
organogenesis [34, 35]. Taking together this events, Rumbo et al. studied whether LTβR
mediates the CCL20 gene expression in intestinal epithelial cells. The results demonstrate in
vivo and in vitro evidences that LTβR signalling may be responsible for the CCL20 production
[33].
Other in vitro studies showed that lymphocytes trigger the conversion of enterocytes
cell lines into M-like cells in co-culture under influence of membrane-bound lymphotoxin
(LTα1β2) secreted by B-lymphocytes. However, in vivo M cell differentiation reveals that the
absence of mature lymphocytes does not prevent the formation of M cells indicating that
signalling molecules that support M cell differentiation, such as lymphotoxin, may be supplied

INTRODUCTION
7
by other underlying cells. Notwithstanding, mature lymphocytes are required for the
formation of full-sized FAE [36].
It is still controversial whether M cells arise as a separate cell line or differentiate from
enterocytes on the dome under the influence of immune cells [37, 38].
1.4. Epithelial - mesenchymal crosstalk
The function of the intestinal stem cells is to maintain the integrity of the intestinal
epithelium. Stem cells dynamics are regulated by environmental factors, the sum of which
constitutes the protective niche composed by neighbouring epithelial cells, mesenchymal
cells, basement membrane (BM) and soluble cell- or matrix-associated growth factors [39]. It
is established that although separated from the epithelial cells by the basement membrane,
the constellation of mesenchymal elements promote the epithelial-mesenchymal crosstalk
required to maintenance of the physiological homeostasis and the stem cell niche [40].
During the past decade, the permissive and instructive actions of the mesenchyme in
the epithelial cells have been highlighted by the expression of important growth factors
whose receptors are found on the epithelial cell surface, for instance, HGF/SF4 (hepatocyte
growth factor/scatter factor) and KGF (keratinocyte growth factor) which regulate the
epithelial cell behaviour [41].
1.4.1. Epithelial - stromal interface
As in most of the tissues, intestinal epithelium is supported by BM that separates
epithelial cells from subepithelial fibroblasts or intestinal myofibroblasts (IMFs). IMFs are
defined by phenotypic characteristics of both fibroblasts and smooth muscle cells [42]. They
express α-smooth muscle actin (α-SMA), intermediate filaments such as vimentin but very
weakly positive or negative for desmin and the absence of epithelial cytokeratins [43, 44]
(Table 1.1). Although various combinations of these markers have been used to demonstrate
the plasticity of IMFs, they are defined by their location and structure together with the
expression of α-SMA, the best single but not absolutely exclusive marker [39].
Table 1. 1. Mesenchymal stromal cell markers. Adapted from Pinchuk I. V. et al. [43].
CELLS MARKERS
Myofibroblasts Fibroblats Pericytes Muscularis mucosae
α-SMA + - + +
Desmin - - ± +
Vimentin + + + -
CD90 + + + ±
INTRODUCTION
8
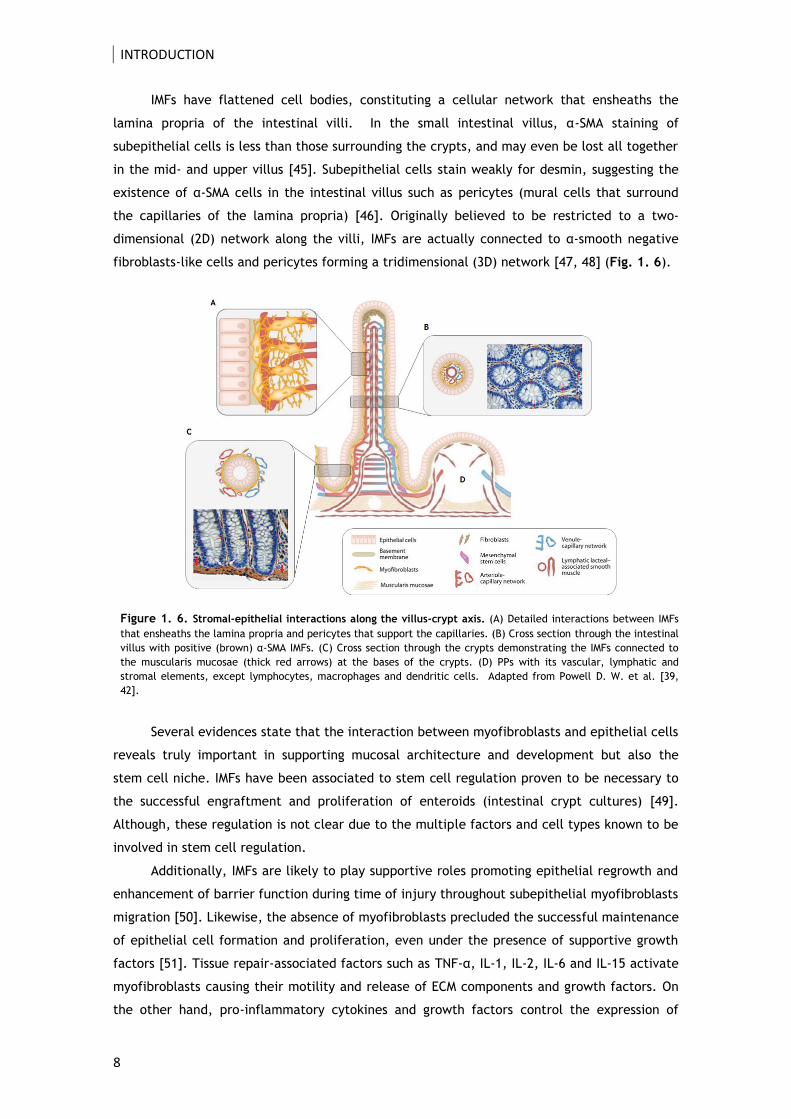
IMFs have flattened cell bodies, constituting a cellular network that ensheaths the
lamina propria of the intestinal villi. In the small intestinal villus, α-SMA staining of
subepithelial cells is less than those surrounding the crypts, and may even be lost all together
in the mid- and upper villus [45]. Subepithelial cells stain weakly for desmin, suggesting the
existence of α-SMA cells in the intestinal villus such as pericytes (mural cells that surround
the capillaries of the lamina propria) [46]. Originally believed to be restricted to a two-
dimensional (2D) network along the villi, IMFs are actually connected to α-smooth negative
fibroblasts-like cells and pericytes forming a tridimensional (3D) network [47, 48] (Fig. 1. 6).
Figure 1. 6. Stromal-epithelial interactions along the villus-crypt axis. (A) Detailed interactions between IMFs
that ensheaths the lamina propria and pericytes that support the capillaries. (B) Cross section through the intestinal
villus with positive (brown) α-SMA IMFs. (C) Cross section through the crypts demonstrating the IMFs connected to
the muscularis mucosae (thick red arrows) at the bases of the crypts. (D) PPs with its vascular, lymphatic and
stromal elements, except lymphocytes, macrophages and dendritic cells. Adapted from Powell D. W. et al. [39,
42].
Several evidences state that the interaction between myofibroblasts and epithelial cells
reveals truly important in supporting mucosal architecture and development but also the
stem cell niche. IMFs have been associated to stem cell regulation proven to be necessary to
the successful engraftment and proliferation of enteroids (intestinal crypt cultures) [49].
Although, these regulation is not clear due to the multiple factors and cell types known to be
involved in stem cell regulation.
Additionally, IMFs are likely to play supportive roles promoting epithelial regrowth and
enhancement of barrier function during time of injury throughout subepithelial myofibroblasts
migration [50]. Likewise, the absence of myofibroblasts precluded the successful maintenance
of epithelial cell formation and proliferation, even under the presence of supportive growth
factors [51]. Tissue repair-associated factors such as TNF-α, IL-1, IL-2, IL-6 and IL-15 activate
myofibroblasts causing their motility and release of ECM components and growth factors. On
the other hand, pro-inflammatory cytokines and growth factors control the expression of

INTRODUCTION
9
matrix metalloproteinase (MMPs) and TIMP (specific inhibitors of MMPs) contributing to the
tissue remodelling [48].
1.5. Intestinal barriers
The magnitude of interactions with the external environment reaches a pinnacle in the
GI tract, the largest mucosal surface in continuous contact with dietary antigens and
microorganisms. Before the immunological surveillance by the underlying immune cells,
foreign organisms are exposed to protective barriers that will counteract absorptive events
[52] (Fig. 1. 7).
Figure 1. 7.Sequential barriers during the transit of a drug molecule in the GI tract when orally administered
until reaches the systemic circulation. Adapted from Chen M. et al. and Artursson P. et al. [53, 54].
1.5.1. Luminal barriers
The drastic pH changes in stomach from slightly acid (pH 1.2 - 3.0) to slightly basic (pH
6.5 – 8.0) in the proximal end of ileum impact the drug stability and solubility [15]. Beyond
small intestine being the major place of absorption, the enzymatic activity gathers a big
palette of proteolytic enzymes divided in three classes: luminal, membrane-bound and
cytosolic proteases. Oral administered compounds undergo proteolytic degradation in
stomach by pepsin [55]. Upon reaching the duodenum, luminal proteases secreted by
pancreas and released in the small intestine, namely serine endopeptidase, trypsin, α-
chymotrypsin, elastase and exopeptidases (carbopeptidases A and B), degrade the mixture of
peptides and proteins. They are digested further by membrane-bound (brush-border) and
cytosolic proteases (cytoplasm and lysosomes) associated to enterocytes. Proteases in the

INTRODUCTION
10
brush border of enterocytes are potential the most biologically active enzymatic barrier,
accounting with membrane-bound proteases and pancreatic enzymes that may be adsorbed
from the luminal fluid [55, 56].
Apart from that, the aminopeptidases in PPs are about 20-30% of the neighbouring
areas reinforcing that the unprotected FAE of PPs is potential targeting site for proteins
delivery [57].
As the most abundant class of antibodies found in the intestinal epithelium, secretory
IgA (sIgA) has been recognized as a first line defence in protecting the intestinal epithelium
from enteric pathogens and toxins [58]. The production of sIgA is dependent on the sampling
by M cells from PPs processing a pallet of antigen-presenting cells and multiple cytokines.
sIgA operates in the clearance of antigens and pathogenic microorganisms from the intestinal
lumen by blocking their access to epithelial receptors, a process known immune exclusion
[59].
1.5.2. Gut wall barriers
Beyond the luminal barriers, the gut wall barriers are equally challenging consisting of
mucus layer, the epithelium equipped with tight junctions and efflux transporters and
metabolizing enzymes.
The entire intestine is covered by a stagnant layer composed by water, mucus and
glycocalyx adjacent to the intestinal wall that is permeable to nutrients, water and small
molecules but restrict to bacteria and pathogens [60] . Mucus secreted by the epithelial cells
throughout the gastrointestinal tract has a unique secretion that forms a gel adherent to the
surface constituting a protective wall. However, mucus layer is responsible by a rapid particle
clearance due to the quick turnover, approximately 2-5 days in the small intestine of humans,
preventing drug penetration and consequent absorption [61]. Additionally, the repulsion
between drugs and the negatively charged mucus obstruct the direct contact between those
drugs and the epithelial cells [62]. Even though all the limitations that mucus represents, its
hydrogel-like structure reduces the shear stress and can stick a compound in the firmly
adherent mucus layer increasing the transcellular migration into the epithelial wall [63].
The second rate-limiting step to absorption is the epithelium reinforced by tight
junction and efflux transporters. Epithelial barrier is regulated by junctional complexes
referred as tight junctions (TJs), adherent junctions (AJs), desmossomes and gap junctions.
TJs between the neighbouring cells exclude the influx bacteria and molecules larger than 200
Da through paracellular routes [53] together with efflux transporters that forward unwanted
substances back to the lumen. P-glycoprotein (P-gp) is the most studied member of multidrug
resistance (MDR) family, primarily expressed on the apical membrane of the epithelial cells
[64]. It reduces the intracellular accumulation or transcellular translocation of many
compounds [65]. The combined role of P-glycoprotein with cytochrome P450 (CYP) 3A drug

INTRODUCTION
11
metabolizing enzyme has been recognized as a major determinant of gut wall absorption [66,
67].
Finally, even if a significant amount of drug is transported through the intestinal
epithelium, the first-pass metabolism by liver will highly reduce the dose fraction that
reaches the systemic circulation [68]. Other limiting factors should fall in the scope of
considerations including fast elimination from the systemic circulation, inducement of an
immune response, uptake by non-target tissues and an inefficient target cell entry [60].
To overcome these barriers, innovative strategies have been proposed including
chemical modification, formulation vehicles, proteases inhibitors, absorption enhancers and
mucus-adhesive polymers [55, 60, 63].
1.6. Intestinal transport mechanisms
The process of absorption involves a set of processes that consists of pre-absorption,
uptake and translocation and arrival to the destination targets. Molecules cross the intestinal
epithelium having at disposal five distinct mechanisms: paracellular transport (A),
transcellular passive transport (B), transcellular active transport or carrier mediated
transport (C), receptor-mediated transcytosis (D) and via M cells of PPs (E), represented in
Fig. 1. 8 [69].
Figure 1. 8. Schematic representation of mechanisms of transport. (A) Paracellular transport; (B) Transcellular
transport; (C) Carrier-mediated transport; (D) Receptor-mediated transport; (E) M-cell mediated transport by
phagocytosis. Adapted from Yun et al. [55].
1.6.1. Paracellular pathway
Starting by the paracellular route, small hydrophilic particles may elect this route or
the aqueous route that normally absorbs nutrients or vitamins [15], using the intracellular
spaces between the epithelial cells (Fig. 1.8 A). This route is used by hydrophobic molecules
such as oxygen and carbon dioxide that are small or neutral in charge and can cross the
epithelial layer by uninhibited diffusion [70].
At a certain level, this route gained interest for peptide delivery due to the lack in
proteolytic activity [60] however, the paracellular space represents less than 1% of the
intestinal mucosa surface contributing for a minimal transport [70].

INTRODUCTION
12
1.6.2. Transcellular pathway
Larger compounds are not able to use intracellular spaces, taking the transcellular
route passively. Transcytosis or transcellular pathway involves the uptake in membrane-bound
vesicles by a process named endocytosis at the apical membrane, further released in the
basolateral membrane (Fig. 1. 8 B) [71]. The endocytic process is divided in phagocytosis
(uptake of large particles) and pinocytosis (uptake of the fluids and solutes), the last divided
at least in four basic mechanisms: macropinocytosis, clathrin-mediated endocytosis, caveolin-
mediated endocytosis and clathrin and caveolin-independent endocytosis [72].
Notwithstanding, most of the therapeutic peptides and proteins are intact absorbed
and are not expected to follow the transcellular route in a passive way. The active
transcellular transport of peptides and proteins occurs via a specific carrier (Fig. 1. 8 C) [69].
Carrier-mediated pathway is a energy-dependent and saturable mechanism (concentration
dependent) [73]. The molecule approaches the cell membrane and interacts with the
transport proteins on the surface of the lipid bilayer forming a reversibly bound. These
complex cross the lipid bilayer and when reaches the other side of the cell, the bound
between the molecule and the transport protein is disrupted placing the molecule outside the
cell [70].
A select group of macromolecules that are too large to slip through facilitated
transport pathways and too constrained thermodynamically to transverse a lipid bilayer
possible, readily moves across the transcellular barrier through receptor-mediated
endocytosis (Fig. 8 D) [74]. This transport has been explored to increase the oral
bioavailability of protein drugs by modification of receptor specific ligands with peptide and
protein drugs. Protein drugs can act either as receptor specific ligands for surface-attached
receptors or as receptor for surface-attached ligands [55]. This transport entails binding of
the ligand to a specific cell surface receptor, receptor clustering and internalization [15].
1.6.3. M-cell mediated transport
As previously mentioned, the break in the intestinal barrier of the specialized
epithelium FAE have been explored as a route of transport (Fig. 1. 8 E) [75]. M cells delivery
by PPs involves the contact with the projections on M cells surfaces followed by a rapid
phagocytosis. The fusion of the phagocytic vesicle with the basolateral membrane results in
the emptying of the vesicle into the intraepithelial pocket. Particles can be engulfed by
phagocytic cells in the pocket or pass through the basal lamina into the sub-epithelial region.
Unavoidably, M cells mediated absorption represents an outstanding opportunity for explore
drug absorption using nanocarriers [76].

INTRODUCTION
13
1.7. Predicting intestinal absorption
Understanding and anticipating the mechanisms and factors that affect the
gastrointestinal absorption is of utmost importance in the development and classification of
new drugs [77].
With view to simplify and speed up the prediction of intestinal permeability, multiple
screening techniques have been purposed. For many reasons, but particularly due to financial
and ethical considerations, in vitro models are the most extensively used over the years
based on Caco-2 intestinal epithelial cells [78]. Inherently, in vitro models raise questions
about the extrapolation of results to the in vivo scenario. On the other hand, the complex in
vivo environment difficult data interpretation together with the fact that, the
microenvironment of a murine has subtle but not no negligible differences compared with in
vivo circumstances [79].
What about artificial membranes and computational-based models? Are they on the way
to replace Caco-2 models? In the drug development field, in silico, computational and
mathematical models significantly support decisions about drug absorption in the early
screening phase of drug evaluation. This power has a huge impact in drug companies,
reducing the time and the costs in selecting potential candidates and performing the
biological screening. The efficiency of this approach is recognized by the pharmaceutical
industry however the insufficient database with reliable information is the major
impediment. Therefore, the fact that neither the absorption process nor the experimental
techniques used for data capture are not fully understood, the computational models will not
do the job better [80, 81].
In this subchapter will be highlighted multiple approaches for drug absorption screening
that reflect the increasingly necessity of predict the intestinal absorption, summarized in
Table 1. 4 at the end of the subchapter.
1.7.1. In vivo models
No matter how sophisticated in vitro models are, in vivo evaluation will continue to be
an invaluable tool required to validate the true performance of a drug or delivery system
[82].
The main advantage of in vivo models is the integration of dynamic components such as
the mesenteric blood circulation, the mucus layer and other factors that influence drug
bioavailability [77].
In turn, the main weakness of in vivo models is the difficulty in separate the variables
involved in the process of absorption, which difficult the identification of individual rate-
limiting steps. The impact of anatomical and physiological differences, between and within
species, influences the choice of the animal model [83]. For instance, the intestinal mucosal
surfaces are comparable between species but drug transported proteins, enzymes and

INTRODUCTION
14
microorganisms can differ. Rat is the most frequently animal model with similar absorption
profiles and similar transport expression patterns to the human. However, the distinct
patterns of metabolizing enzymes mistake the predictions [84]. The evolutionary proximity
between monkeys and humans put this specie in a special place in drug discovery, however
the costs and ethical concerns limit their use [77]. Pigs are also used to absorption studies
due to the similarity of large intestine with human but data is rare [85]. Given these facts,
has been stated that “the only real model for a man is man” [79].
1.7.2. In vitro models
It is been stated that in vitro models do not mimic the real situation, but these models
cannot be reduced just to that. Cell-based models are a commitment between an
intermediate level of complexity, with multiple transport systems than reflect the organ in
vivo and what is feasible to reproduce in the laboratory [77]. In the field of drug discovery
and development, what may be more relevant is to reproduce the extent and nature of
transport and metabolising systems observed in the organ in situ, rather than the organ
specific phenotype. In fact, animal models will always be part of drug development, clearly
showing the propensity for oral absorption and the limitations that the whole organism offers
to the absorption of a drug. At this point, in vitro models can sponsor a significant reduction
of the in vivo models usage, allowing the earlier identification of drug candidates with poor
ADME properties.
Therefore, the key thought is to understand the models limitations and use them as a
mean to reduce the wastage and the expense of drug administered quantities, as well as to
allow a more strategic planning of in vivo animal experiments.
1.7.3. Caco-2 based models
Since their isolation from a human colorectal carcinoma [86], Caco-2 cells have been
widely used to absorption studies, considered to be the ‘gold standard’ of intestinal
absorption assays [87]. Caco-2 cells spontaneously undergo typical enterocytic differentiation,
a process that is growth related. At early stages of culture (3-4 days), Caco-2 cells maintained
undifferentiated, displaying only few apical microvilli and do not express sucrase
immunoreactivity (indicator of microvilli). At confluence they form polarized monolayers
joined by tight junctions and presenting well-developed apical microvilli [88]. Despite their
colonic origin, Caco-2 cells express the majority of morphological and functional
characteristics of absorptive intestinal cells (Table 1. 2), inclusive enzymes such as
disaccharidases and peptidases typically expressed by enterocytes. Adding to that, Caco-2
cells do not constitute a passive membrane, confirmed by identification of multiple uptake
and efflux transporters [89]. However, the most important metabolizing enzyme in the human

INTRODUCTION
15
gut, CYP3A4, is low or absent in Caco-2 cells, overestimating the fraction absorbed for
substrates to 3A4 [90].
Some complications have been reported with respect to this cell line such as the high
and variable expression of P-gp and low expression of metabolising enzymes. Added to that,
the pore size of Caco-2 cells is estimated to be approximately 3.7 ± 0.1 Å, tremendously
underestimating the paracellular transport [91]. The relatively wide variation of the
correlation profiles between different laboratories and within the same laboratory appears to
be a disadvantage, resultant of different culture conditions, protocols or genetic drift [81,
92].
Table 1. 2. Morphological and functional characteristics of Caco-2 cell line [79, 88, 90, 93].
MORPHOLOGY
Grow in monolayer, polarized morphology, microvilli on the
apical side, tight junctions between the adjacent cells and
express small intestinal hydrolase enzyme activities (sucrase-
isomaltase, lactase, aminopeptidase N, dipeptidylpeptidase IV).
INTEGRITY PARAMETERS Transepithelial electrical resistance after confluence and
permeability marker compounds (mannitol).
MEMBRANE IONIC
TRANSPORT
Na+/K+ ATPase, H+/K+ ATPase, Na+/H+ exchange, Na+/K+/Cl- co-
transport, apical Cl- channels.
MEMBRANE NON-IONIC
TRANSPORTERS
Permeability-glycoprotein (P-gp) and multidrug resistant
associated protein (MRP).
RECEPTORS Vitamin B12, vitamin D3, epidermal growth factor and sugar
(GLUT1, GLUT3, GLUT5, GLUT2, SGLT1) transports.
DIGESTIVE ENZYMES Typical membranous peptidases and disaccharidases of the
small intestine.
Besides the correlation that exists between in vivo drug absorption and Caco-2
permeability [82, 94], the permeability of hydrophilic compounds generally transported by
paracellular pathway is low in Caco-2 monolayer because of the relatively tighter junctions
compared with human and animal small intestine, which is explained by their colonic origin
[95]. Also, the absence of mucus layer will enhance the transport of small molecules due to
their molecular characteristics [95]. Furthermore, Caco-2 model cannot differ between
cellular transport or intestinal metabolism, since main barriers opposing drug absorption are
not completely represented by this model [96].
Despite the widespread use and acceptability of the Caco-2 cell model for permeability
assessment, other alternatives have been purposed to overcome Caco-2 limitations (Table 1.
3).

INTRODUCTION
16
Table 1. 3. Alternatives to in vitro drug permeability studies.
CELL LINE CHARACTERISTICS REFERENCE
MDCK
(Madin Darby Canine Kidney)
- Superior model in terms of passive model compared to the Caco-2 model (lower TEER values); - Polarized cells with low intrinsic expression of ABC transporters; - A non-human (dog) and non-intestinal (renal) cell line; - Ideal for transfections;
[97, 98]
LLC-PK1
(Pig kidney epithelial cells)
- Polarized cells with low intrinsic transporter expression; - Ideal for transfections;
[3]
TC7
(Caco-2 subclone)
- Higher levels of CYP3A4 e 3A5; - Useful to evaluate metabolic effects during transport; - Greater homogeneity ensuring more consistent results with lower variability
[99-101]
2/4/A1
(Rat fetal intestinal cells)
- Recommended for passive paracellular transport (leakier monolayers with paracellular pore radius of 9.0 ± 0.2 Å, similar to the human small intestine); - TEER values reached a plateau of 50 Ωcm2, near of the estimated small intestinal TEER values.
[3, 79, 102]
IEC-18
(Rat intestinal cell line)
- Provides a size selective barrier for paracellularly transported compounds. [3]
1.7.4. Co-culture models
Caco-2 model lacks in some characteristics that influence drug absorption, for instance,
mucus production. With the objective of mimicking the heterogeneity of populations in
intestinal epithelium, new Caco-2–based models have been purposed with the introduction of
new cell lines.
In this sense, Caco-2 monocultures evolved to co-cultures of Caco-2 and HT29-MTX cells
in a similar ratio of the in vivo proportions. HT29-MTX cells are a modified cell line treated
with an anticancer drug methotrexate (MTX). This cell line came from HT29 cells that exhibit
variable differentiation depending on the culture medium changes or differentiation inducers.
For instance, when HT29 cells are treated with MTX at 10-7 M, they form a mixed population
of absorptive and goblet cells. Increased concentrations (10-6 to 10-5 M) of MTX lead to a
population exclusively composed by goblet cells secreting gastric mucins. At higher
concentration, is observed a phenotypic change from the mucus to the absorptive phenotype
[88].
HT29 cells do not express P-gp and are morphologically distinguished from Caco-2 by
the presence of sparse and shorter microvilli, whereas the dimensions of both cells are similar
[77]. Caco-2/HT29-MTX model reveals paracellular permeability closer to human situation but
the active transport of drugs is underestimated by this model [103]. Interesting works are
pointed as proof the concept of this model [103-105].

INTRODUCTION
17
The promising characteristics of M cells in the induction of specific mucosal immune
responses have stimulated the in vitro replication of these cells [8]. As result, a new cell
culture system consisting of Caco-2 cells and human Raji B lymphocytes aim to establish a
model expressing M-like cells originating from Caco-2 conversion by B lymphocytes. This
conversion is revealed by the loss of microvilli and consequently by the loss of expression of
apical enzymes such as alkaline phosphatase [106-108].

INTRODUCTION
18
Table 1. 4. Summary of the pros, cons and costs of the intestinal models drug screening and permeability.
MODELS
IN SILICO EX VIVO IN VITRO IN SITU IN VIVO
“Rule of five” Ussing Chamber
Everted intestinal sac Caco-2, HT29-MTX cells and Raji B
lymphocytes Perfusion of drug solution
through intestinal segments Rats, monkeys, dogs and pigs
PROS
- Easy access; - High- throughput; - Reduce the time-consuming step of synthesis; - High level of automation.
- Retains gut architecture; - Analysis of different regions of intestine; - The quantity of sample is small and the collected samples are analytically clean; - Possibility of bidirectional transport; - Animal or human models.
- Encompass many characteristics of the intestinal epithelium; - Represents many absorption process; - Can be partly automated; - Information of cell retention; - Benefits in ethical considerations; - Performed under standardized and controlled conditions.
- Presence of an intact blood, nerve supply and clearance capabilities mimic the in vivo conditions; - Evaluation of the intestinal absorption influences the hepatic first pass metabolism; -Good correlation with the pharmacokinetics studies.
- Integration of the dynamic components that affect the drug dissolution; - Relatively to rats, similar absorption profile, low cost and easy care handling. - Monkeys have evolutionary proximity with humans; - Pigs have similarity of large intestine.
CONS
- Insufficient data base with reliable data; - Low integration of physiological complexity.
- Tissue viability; - Intrinsic difficult in dissect the epithelial tissue; - Low- throughput; - Requires secondary detection; - Large inter-lab variability; - Difficulty on isolate the contribution of one absorption pathway; - Tissue availability; - The drug must cross the whole intestinal wall.
- Requires secondary detection; - Static model; - Lack in physiological factors (mucus, bile salts); - Genetic drift; - Low differentiation of low/medium absorption; - Large inter-lab variability; - Labor-intensive; - Contamination issues; - Influence of all organism is not taken into account; - Long-differentiation period.
- The method relies on the disappearance of compound from the luminal side, but the rate of decrease of concentration does not always represent the rate of absorption; - Requires a huge number of animals and high amounts of test compounds; - No screening control.
- Data extrapolation must be done carefully due to species differences; - Impact of the anatomical and physiological differences; - Difficulty in separate variables involved in the process of drug absorption; - Ethical concerns; - Extensively resource-intensive. - “The only real model for a man is man.”
COSTS - High development costs.
- High costs per result analysis. - High in terms of tissue facilities and time-consumable.
- High costs. - High costs per result analysis.
REFERENCES [80, 82, 87, 92] [79, 92, 109] [21, 88, 91, 96, 104, 105, 110-112] [113-115] [83-85, 113]

CHAPTER II
AIM & OBJECTIVES


AIM & OBJECTIVES
21
2.1. Aim and objectives
Caco-2 cell model is the gold standard of intestinal in vitro models that after 21 days of
culture become differentiated and polarized cells. Their phenotype morphologically and
functionally resembles the absorptive enterocytes in many of features, such as, the presence
of microvilli, expression of tight junctions, enzymes (alkaline phosphatase, sucrose) and
transporters (P-glycoprotein) [112, 116]. However, the value of this model is usually
mitigated by tighter tight junctions [91], up-regulation of P-gp [78] and absence of mucus
[117]. Gradually, new models have been purposed including Caco-2/ HT29-MTX models [104,
105, 118, 119], Caco-2/Raji B models [21, 120, 121] and Caco-2/HT29-MTX/Raji B models
[106-108]. Increasingly, epithelial-stromal interactions have been recognized important
players in the maintenance of intestinal architecture. In specific, subepithelial myofibroblasts
form a tridimensional network with the underlying cells and play supportive roles promoting
epithelial regrowth and enhancement of barrier function [50].
The herein work presents a scenario of interaction between epithelial and stromal
cells, replicating the mucosal architecture in such a way that the epithelial layer of Caco-2,
HT29-MTX and M-like cells lie over a 3D network of CCD18-Co intestinal myofibroblasts
embedded in Matrigel®. The primary aim of this work was to develop a novel intestinal model
able to predict the drug permeability of any compound, as closest as the in vivo situation.
Furthermore, this model has potential to dissect the mutual effect of epithelial and stromal
cells in the maintenance of an intact barrier throughout the production of ECM components.
To characterize this model, were established 3 main tasks which aimed to characterize
the fibroblastic and epithelial layer, visualize the tridimensional architecture of the model
and assess their functional character. Concerning the 21 days of culture and the 3D
architecture, CCD18-Co cell density was optimized. Regarding the epithelial layer, the
proportion of Caco-2 and HT29-MTX cells was of 9:1 as this ratio replicates the in vivo
percentage of goblet cells [122] and was previously optimized by our group [107]. The
evolution of the barrier model was followed by measuring the transepithelial electric
resistance (TEER), evaluating the expression of tight junction proteins between the different
epithelial cells, the production of mucus by HT29-MTX cells and the presence of M-like cells.
At last, the functional character of the 3D model was assessed by determining the absorption
profile of a protein drug, insulin.


CHAPTER III
34
CHAPTER III
MATERIALS & METHODS

MATERIALS & METHODS


MATERIALS & METHODS
25
3.1. Materials
Dulbecco’s Modified Eagle’s Medium (DMEM), Non-essential aminoacids (NEAA), 0.05%
Tripsin-EDTA, 0.4% Trypan Blue, Hanks Balanced Salt Solution (HBSS), Phosphate Buffer
Solution (PBS), DMEM without phenol red were purchased from Gibco®, while Fetal Bovine
Serum (FBS) and Penicillin/Streptomycin were purchased from BioWest.
Resazurin, Human Insulin, Alcian Blue 8GX, DAPI, FluoroshieldTM mounting medium,
Poly-D-Lysine (PDL), 3-aminopropyltriethoxysilane (APES), hexamethyldisilazane (HMDS),
Phosphate Substrate (p-NPP) and Propidium Iodide (PI) were purchased from Sigma. 6-well
Transwell® permeable support (PET membrane and 3μm pore size) and Matrigel® basement
membrane matrix were purchased from BD Biosciences. ClearRite 3, Neg-50TM frozen section
medium, paraffin and alcoholic eosin were purchased from Thermo Scientific. Sodium-
cacodylate was purchased from Fluka®. Calcein-AM was purchased from Invitrogen. DC Protein
Assay Kit was purchased from Bio-Rad. Gill’s Haematoxylin II was purchased from Surgipath.
Quick-D mounting medium was purchased from Klinipath. Epon resin and propylene oxide
were purchased from Electron Microscopy Sciences.
Anti-human vimentin antibody was purchased from Santa Cruz Biotecnology. Donkey
anti-mouse AlexaFluor 488®, goat anti-mouse AlexaFluor 594®, goat anti-rabbit AlexaFluor
594®, goat anti-rabbit AlexaFluor 488® secondary antibodies and Quant-iT PicoGreen dsDNA
kit were purchased from Molecular Probes®. Rabbit anti-fibronectin polyclonal antibody was
purchased from Sigma. Mouse anti-claudin-5 monoclonal antibody was purchased from Life
Technologies. Rabbit anti-human E-cadherin (24A10) was purchased from Cell Signaling.
3.2. Establishment of in vitro models
3.2.1. Cell lines and cell culture conditions
Caco-2 cell line and HT29-MTX was from American Type Culture Collection (ATCC, USA).
Raji B cell line was kindly provided by Dr. Alexandre Carmo (Cellular and Molecular Biology
Institute – IBMC, Porto, Portugal). CCD18-Co was kindly afforded by Dr. Sérgia Velho (Institute
of Molecular Pathology and Immunology of the University of Porto, IPATIMUP, Porto,
Portugal).
CCD18-Co (passage 8-13), Caco-2 (passage 22-40) and HT29-MTX (passage 25-40) cells
grown separately in tissue culture flasks (Orange Scientific) in DMEM basal medium
supplemented with 10% (v/v) of inactivated FBS, 1% (v/v) of NEAA and 1% of
antibiotic/antimitotic mixture (final concentration of 100 U/mL Penicillin and 100 U/mL of
Streptomycin). Cells were routinely observed and, when confluence reached to 80%,
subcultured with 0.05% Trypsin-EDTA and seeded at a density of 6×10⁵ cells per 75 cm2 flask.

MATERIALS & METHODS
26
The medium was replaced every other day. Raji B cells (passage 30-42) were maintained as
aforementioned and seeded at a density of 1×10⁶ cells per 75 cm2 flask.
Cells were maintained in an incubator (CellCulture® CO2 Incubator, ESCO) at 37°C and
5% CO2 in water saturated atmosphere. All the cell culture related procedures were done in a
Labculture® class II, type A2 biological safety cabinet, ESCO.
3.2.2. Cell thawing
All cells were frozen at liquid nitrogen. It is essential to thaw the cell correctly in order
to maintain the viability of the culture and allow them to recover quickly. Furthermore, some
cryoprotectants, such as DMSO, are toxic above 4°C so cultures should be thawed quickly and
diluted in culture medium to minimize the toxic effects. Despite this, DMSO protects the cells
from rupture by the formation of ice crystals.
The basic principle of a successful resuscitation is a quick thaw, by incubation in a 37°C
water bath for 3-4 minutes. All the content in the cryovial (CryoVial®, Falcon) was transferred
to a new container with pre-warmed culture medium and centrifuged at 18 G for 5 minutes at
4°C to remove at DMSO. The supernatant was discarded and the pellet was resuspended in
pre-warmed complete DMEM. The content was transferred to a tissue culture flask (Orange
Scientific) and cell viability was evaluated after 24 hours.
3.2.3. Optimization of CCD18-Co cells density
To determine the optimal density of CCD18-Co intestinal myofibroblasts, different
cellular densities of 1x10⁴ cells/cm2, 5x10⁴ cells/cm2, 10x104 cells/cm2 and 20x104 cells/cm2
were evaluated regarding their viability, metabolic activity, proliferation and morphological
features.
3.2.3.1. Cell viability
At different time points, CCD18-Co cells were washed twice with pre-warmed DMEM
without phenol red to remove/dilute estereases and incubated with Calcein-AM diluted in
DMEM without phenol red (1:250) for 40 minutes at 37⁰C. After washed twice with DMEM
without phenol red, samples were incubated with PI diluted in DMEM without phenol red
(1:250) for 10 minutes at 37⁰C. Samples were finally washed twice with DMEM without phenol
red and immediately examined under an Axiovert 200M inverted fluorescent microscope from
Zeiss. Live cells are distinguished by the presence of ubiquitous intracellular esterase activity
that is able to digest non-fluorescent calcein-AM into fluorescent calcein emitting green
fluorescence [111]. In contrast, dead cells with damaged membranes allow the entrance of
propidium iodide (PI) that emits a bright red fluorescence upon binding to the acid nucleic.

MATERIALS & METHODS
27
3.2.3.2. Cell metabolic activity
Metabolic assays were conducted using the resazurin fluorescent assay. Representative
of 3D condition, CCD18-Co cells were embedded Matrigel® matrix, while other set was
prepared by seeding CCD18-Co, case of study representative of 2D standard conditions.
Resazurin pre-warmed to 37°C was added to the plates in a 10% concentration of the
initial volume in the plate and cells in culture for 7 days were incubated at 37°C. After
incubation, a sample was collected and immediately quantified by measuring the relative
fluorescence units (RFU) using a microplate reader SynergyTM Mx HM550 (BioTek® Instruments,
USA) set at 530/590 nm (excitation/emission wavelength, respectively). The results were
normalized by subtracting the negative control (without cells). The assay was repeated for 14
and 21-days cultures.
In this assay, the cellular metabolic activity is detected through the reduction of a blue
non-fluorescent resazurin reagent into a highly fluorescent resorufin by the dehydrogenase
enzyme in metabolically active cells. This conversion is proportional to the number of viable
cells in the sample.
3.2.3.3. Total dsDNA quantification
After recover the cells by trypsinization, the cell suspension was centrifuged at 18 G for
5 minutes, washed with PBS, centrifuged again and the pellet was stored at -20⁰C until
quantification. Cells were lysed with 1% (v/v) Triton X-100 for 1 hour under agitation at 4⁰C.
Since 1% (v/v) Triton X-100 interferes with the measurement, samples were diluted to a final
concentration of 0.4% (v/v) Triton X-100 with PBS and the double-stranded DNA (dsDNA) was
quantified using the Quant-iT PicoGreen dsDNA kit, according to manufacturer’s instructions.
Briefly, 10 μL of each sample was transferred to a black 96-well plate with clear bottom
(Falcon) and diluted with 90 μL of TE (1x) buffer (200mM Tris-HCl, 20 mM EDTA, pH 7.5). To
each well, was added 100 μL of PicoGreen dsDNA reagent and incubated for 5 minutes at RT,
protected from light. Samples were quantified using a microplate reader SynergyTM Mx HM550
(BioTek® Instruments, USA) set at 480/530 nm (excitation/emission wavelength,
respectively). The dsDNA concentration (ng/mL) was determined using a standard curve of
lambda DNA in a range of 0.0250-2.50 ng/mL.
3.2.3.4. Cell morphology
CCD18-Co cells morphology was assessed by labeling the intermediate filaments of
fibroblasts with vimentin antibody.
Briefly, CCD18-Co cells, previously seeded on coverslips coated with PDL, were rinsed
twice with pre-warmed PBS+ (1.37 M NaCl, 26.8 mM KCl, 14.7 mM KH2PO4, 78.1 mM Na2HPO4,
1mM Ca2Cl, 1mM Mg2Cl, pH 7.4), regular PBS supplemented with Ca2+ and Mg2+ ions to

MATERIALS & METHODS
28
maintain the integrity of cellular junctions. Cells were fixed with 2% (w/v) paraformaldehyde
(Merck, VWR) in PBS+ for 15 minutes at room temperature (RT), following permeabilization
with freshly prepared solution of 0.2% (v/v) Triton X-100 (Sigma®, Sigma Aldrich) in PBS+ for 7
minutes at RT. In order to block non-specific binding, samples were incubated with a freshly
prepared solution of PBST (PBS+ containing 0.05% (v/v) Tween-20 (AppliChem, VWR))
containing 10% (v/v) FBS for 30 minutes in a humidified chamber. Then, without wash,
blocking solution was removed and samples were separately incubated during 2 hours at RT
with a mouse anti-human vimentin primary antibody diluted (1:100) and a donkey anti-mouse
AlexaFluor488® secondary antibody (1:1000) during 1 hour at RT, both diluted in PBST
containing 5% (v/v) FBS. Cell nucleus was counterstained with DAPI diluted 1:1000 in PBS
during 5 minutes. With exception of the blocking step, were performed 5 minutes washes
with PBS+ between fixation, permeabilization and incubation steps. The coverslip was placed
face down to the glass slide with a drop of mounting medium of FluoroshieldTM and visualized
using an Axiovert 200M inverted fluorescent microscope from Zeiss.
The acquired images were taken using Axiovision 4.8.2 SP3 from Zeiss and treated using
ImageJ program. The staining was repeated for 14 and 21 days old cultured cells to
understand the effect of the initial cell density on fibroblasts morphology.
3.2.4. Production of ECM components
CCD18-Co cells entrapped in Matrigel were evaluated regarding expression of ECM
components, namely fibronectin. Moreover, the 3D arrangement of CCD18-Co cells entrapped
in the Matrigel matrix was also assessed. The procedure was performed as previously reported
for paraffin sections with exception of the incubation step. Briefly, cells were incubated
during 2h at RT with both mouse anti-human vimentin primary antibody (1:100) and rabbit
anti-human fibronectin primary antibody (1:400). After 5 minutes washes, a goat anti-mouse
AlexaFluor594 secondary antibody (1:1000) and a goat anti-rabbit AlexaFluor488 secondary
antibody (1:1000) were incubated during 1 hour at RT and protected from light. Cell nucleus
was counterstained with DAPI diluted 1:1000 in PBS during 5 minutes.
Paraffin-embedded sections of the 3D model (CCD18-Co+Matrigel/Caco-2/HT29-
MTX/Raji B) were stained to evaluate the supportive role of fibroblasts embedded in self-
produced extracellular matrix. First, sections were deparaffinise with ClearRite for 10
minutes and hydrated through graded series of ethanol finishing with PBS (1x), during 5
minutes in each solution. Sections were fixed with 4% (w/v) paraformaldehyde (Merck, VWR)
in PBS+ for 20 minutes at RT, following a permeabilization with freshly prepared solution of
0.2% (v/v) Triton X-100 (Sigma®, Sigma Aldrich) in PBS+ for 9 minutes at RT. The blocking was
performed with 1% BSA in PBS+ during 30 minutes at RT. Then, without wash, blocking solution
was removed and sections were incubated during 2 h at RT with a rabbit anti-human
fibronectin primary antibody (1:400) and a goat anti-rabbit AlexaFluor488 secondary antibody

MATERIALS & METHODS
29
(1:1000) during 1 hour at RT, both diluted in 1% BSA in PBS+. Cell nucleus was counterstained
with DAPI diluted 1:1000 in PBS during 5 minutes. With exception of the blocking step, were
performed 5 minutes washes with PBS+ between fixation, permeabilization and incubation
periods.
Samples were mounted with FluoroshieldTM, visualized using an Axiovert 200M inverted
fluorescent microscope from Zeiss and treated using ImageJ program.
3.2.5. Monolayer in vitro models
As manner of proof, single and co-culture monolayers were performed comprising Caco-
2, HT29-MTX, CCD18-Co and Raji B cells. By single monolayers are intended Caco-2 and
CCD18-Co monolayer’s while co-culture monolayers involve CCD18-Co/Caco-2 cells, Caco-
2/HT29-MTX cells, Caco-2/Raji B cells and Caco-2/HT29-MTX/Raji B cells.
Stromal - epithelial co-culture of CCD18-Co/Caco-2 cells (Fig. 3. 1 A) was prepared by
seeding CCD18-Co at a density of 1×10⁴ cells/cm2 onto 3 μm TranswellTM inserts. In the
following day, Caco-2 cells were seeded onto CCD18-Co cells at a densitenty of 1×10⁵
cells/cm2, as described before [106, 107].
Epithelial co-culture of Caco-2/HT29-MTX cells (Fig. 3. 1 B) was prepared by seeding
Caco-2 and HT29-MTX cells to a final density of 1×10⁵ cells/cm2 (90:10 proportion), previously
optimized [107]. These cultures were maintained for further 21 days.
The epithelial – lymphocyte co-culture of Caco-2/Raji B cells (Fig. 3. 1 C) was prepared
by seeding Caco-2 at a final density of 1×10⁵ cells/cm2 in the apical side of the TranswellTM
insert, while 1×10⁶ cells/6-well Raji B lymphocytes were added to the basolateral side after
14 days in culture. Until the end of 21 days, medium was changed every other day only at the
apical compartment.
The triple model of Caco-2/HT29-MTX/Raji B cells (Fig. 3. 1 D) was performed as
described before [106, 107] based on the Caco-2/HT29-MTX co-culture with the addition of
Raji B cells in the basolateral side.

MATERIALS & METHODS
30
Figure 3. 1. Schematic configuration of monolayer in vitro models. (A) Stromal – epithelial monolayer
comprising CCD18-Co and Caco-2 cells. (B) Epithelial monolayer comprising Caco-2 and HT29-MTX cells. (C)
Epithelial - lymphocyte monolayer representative of the formation of M-like cells. (D) Triple model comprising
Caco-2, HT29-MTX and M-like cells.
3.2.6. Tridimensional in vitro models
To explore the impact of CCD18-Co cells’ assembly in the barrier formation were tested
distinct configurations. The first configuration consists on Caco-2 cells beneath CCD18-Co
cells embedded in Matrigel (CCD18-Co cells in 3D assembly) (Fig. 3. 2 A) and the second
configuration consists on CCD18-Co and Caco-2 cells separated by a gel layer of Matrigel
between both cell types (CCD18-Co cells in 2D assembly) (Fig. 3. 2 B).
For the first configuration, 1×10⁴ cells/cm2 of CCD18-Co cells were entrapped in a thick
layer (400μL) of Matrigel (1:3) diluted in ice-cold DMEM without FBS. The cell suspension was
spread evenly by the Transwell® insert from the centre to the periphery, avoiding bubbles.
The Transwell® insert was transferred to the incubator at 37°C and allowed to polymerize for
30 minutes. After that, DMEM was gently added to both sides of the Transwell® insert. After
24h, 1×10⁵ cells/cm2 of Caco-2 cells were added over the layer of CCD18-Co embedded in
Matrigel®.
For the second configuration, CCD18-Co cells were seeded to a final density of 1×10⁴
cells/cm2. In the following day, DMEM as removed and a thin layer (200μL) of Matrigel® (1:3)
was added onto the CCD18-Co monolayer. After 30 minutes of polymerization, Caco-2 cells
were carefully added over the Matrigel® layer. The cell density of CCD18-Co cells was based
on preliminary studies and both culture models were maintained for further 21 days.

MATERIALS & METHODS
31
To advance to further studies was adopted the first configuration based on the
preliminary studies obtained. Moreover, this arrangement closely mimics the intestinal
mucosa. The final model, which adds HT29-MTX and M-like cells converted by Raji B cells, is
represented in Fig. 3. 3.
Figure 3. 3. Schematic configuration of the 3D quadruple model.
Figure 3. 2. Schematic configuration of the double 3D in vitro models. (A) CCD18-Co cells embedded in a
Matrigel® matrix, representing a 3D assembly. (B) CCD18-Co cells seeded on the bottom of the Transwell,
representing a 2D assembly.

MATERIALS & METHODS
32
3.2.7. Transepithelial electrical resistance (TEER)
To monitor the membrane integrity, the transepithelial electrical resistance (TEER) of
each model was measured using a voltohmmeter Millicell® ERS-2 (Millipore, USA) every time
medium was replaced. The values were normalized by subtracting the resistance value of the
empty Transwell® insert and expressed in ohm per area of the insert (Ω.cm2) through the
following equation.
3.2.8. Cell proliferation
The effect of the Matrigel® on cell proliferation of stromal and epithelial cells was
explored by comparing the behaviour of CCD18-Co cells at a density of 1x10⁴ cells/cm2 and
Caco-2 at a density of 1x10⁵ cells/cm2 in plastic and Matrigel. CCD18-Co cells were also
seeded on plastic in direct contact with Caco-2 cells.
After 7 days, cells were washed twice with PBS (1.37 M NaCl, 26.8 mM KCl, 14.7 mM
KH2PO4, 78.1 mM Na2HPO4, pH 7.4) and detached from substrates with 0.05% trypsin-EDTA
during 10 minutes at 37⁰C. Trypsin-EDTA mixture was inactivated with DMEM and the plates
were observed to the microscope to assure that all cells were detached; otherwise
trypsinization was repeated. Each sample was mixed with 0.4% (v/v) Trypan Blue to
determine the cell number using a haemocytometer (Marienfeld-Superior, Germany).
3.2.9. Paraffin sections and histological staining
Membranes were embedded in paraffin to observe the layers that constitute the 3D
model. Briefly, membranes were washed twice with PBS before fixed with 4%
paraformaldehyde for 1 hour and post-fixed with 1% glutaraldehyde for 15 minutes to avoid
depolymerization of Matrigel. Membranes were washed twice with PBS and cut with a scalpel
to be processed automatically in a Spin Tissue Processor STP120 (Thermo Scientific, Germany)
that consisted in graded dehydrations in ethanol for 10 minutes each, followed by a
diaphanization using ClearRite 3 for 10 minutes twice. Membranes processing was finished by
placing membranes in liquid paraffin for 2 hours. Membranes were orientated according the
plane of cut and sectioned with a thickness between 5-10 μm using a Leica RM2255 microtome
(Leica Biosystems, Germany). The glass slides with the sections were allowed to dry overnight
at 37°C before haematoxylin and eosin staining.
Briefly, for the haematoxylin and eosin staining, sections were dewaxed in ClearRite 3
for 10 minutes. After that, sections were hydrated through graded alcohols to water for 2
minutes each, following the staining with Gill’s haematoxylin II for 5 minutes. Sections were
abundantly washed in tap water for 2 minutes, following dehydration through graded alcohols
for 2 minutes each. Sections were stained with alcoholic eosin for 3 minutes and sections

MATERIALS & METHODS
33
were dipped in absolute alcohol 3 quick times. At last, sections were dipped in xylene three
times and mount in Quick-D permanent mounting medium.
3.2.10. Expression of junctions proteins
Immunofluorescence staining was used to determine the expression of the TJ proteins
claudin-5 and occludin and adherent junction protein E-cadherin.
Regarding claudin-5 labeling, cells were washed twice with pre-warmed PBST for 1
minute each. After that, cells were fixed with 2% (w/v) PFA for 15 minutes at RT following
the permeabilization step with 0.2% of Triton during 5 minutes. After washes, the non-
specific binding was blocked with PBST containing 10% FBS for 30 minutes. Then, without
wash, the mouse anti-claudin-5 conjugated with AlexaFluor 488 antibody was incubated
during 1 hour in a 1:100 dilution in PBS. Samples were washed with PBS+ and incubated with
DAPI (1:1000) for 5 minutes to label the cell nuclei.
Regarding the occludin labeling, cells were washed with cold PBS+ and fixed for 10
minutes on ice with methanol. After this, cells were washed 3 times for 5 minutes with PBS+
and non-specific binding was blocked incubating with 5% (v/v) BSA at RT. Then without wash,
mouse anti-occludin conjugated AlexaFluor 594 antibody was incubated for 1 hour at RT and
protected from light, in a dilution of 1:100 in PBS. Samples were washed with PBS+ and
incubated with DAPI (1:1000) for 5 minutes to label the cell nuclei.
Concerning the E-cadherin labeling, samples were washed with PBS+ that allows the
maintenance of junctions, following fixation with 4% (w/v) PFA for 20 minutes at RT. Samples
were incubated with 50 mM NH4Cl (Sigma®) for 10 minutes that blocks aldehyde groups
allowing a better antibody-antigen bonding. After permeabilization with 0.2% Triton for 5
minutes, the non-specific binding was blocked with 5% BSA for 30 minutes. The blocking
solution was removed and samples were incubated with the rabbit anti-human E-cadherin
primary antibody diluted to 1:100 in 5% BSA for 2 hours. It follows the incubation with the
goat anti-rabbit AlexaFluor488 secondary antibody diluted to 1:500 in 5% BSA. The staining
was finalized with nuclei labeling with DAPI (1:1000). Samples were mounted with
FluoroshieldTM and visualized using an Axiovert 200M inverted fluorescent microscope from
Zeiss.
3.2.11. Alkaline phosphatase assay
Alkaline phosphatase activity was measured in situ live cells according to Ferruza et al.
using p-Nitrophenyl (p-NPP) as substrate [123]. Alkaline environment catalyses the hydrolysis
of p-NPP to a inorganic phosphate and p-Nitrophenol (p-NP), a yellow soluble end-product.
The intensity of the colored product is proportional to the enzyme activity measured at pH
9.3 at 405 nm.

MATERIALS & METHODS
34
Briefly, after removing the cell medium and gently wash the monolayer with PBS+ (1mM
CaCl2 and 1mM MgCl2), reaction buffer consisting of one volume of collection buffer (10 mM
Tris-HCl, 150 mM NaCl pH 8.0) and three volumes of pNPP solution (100 mM Tris-HCl, 100 mM
NaCl, 5 mM MgCl2, pH 9.5) was added to the well, kept at 37°C in water bath. At different
time points, 100 μL was collected and transferred to a 96-well plate containing 50 μL of 0.5M
of NaOH to stop the reaction. The standard curve was prepared with 50 μL of eacg p-NP
concentration ranging from 0 to 600 μM, added to 150 μL of p-NPP solution and 50 μL of 0.5M
NaOH. Absorvance was determined using a SynergyTM Mx HM550 microplate reader (BioTeK®
Instruments, USA) and normalized by blank subtraction. Concentration was determined with
reference to the standard curve and corrected for the reaction volume before plotting was
function of the time. The angular coefficient of the linear slop of this plot represents the
enzymatic activity expressed as mU= nmol of p-NP/min at 37°C and normalized to mg of
cellular protein measured Bio-Rad DC Protein Assay, a Lowry-based assay [124].
3.2.11.1. Protein quantification
After the alkaline phosphatase assay, samples were lysed for further protein
quantification using Bio-Rad DC Protein Assay, which is equivalent to the well documented
Lowry assay. This assay is based in two steps that lead to the color development. First, the
reaction between the protein and the copper in an alkaline medium (Reagent A) and
subsequent reduction of Folin Reagent (Reagent B) by the copper treated protein [124].
The assay was performed according to the manufactures instructions. Briefly, cells
were incubated with the lysis buffer (250mM Tris and 0.1% Triton) for 20 minutes at RT. The
cell suspension was collected and was added 1 volume of dilution buffer (250mM Tris) to
reduce the amount of detergent. Samples were vortex and frozen until further quantification.
For quantification purposes, samples were centrifuged at 18 G for 5 minutes to pellet the
insoluble material and 5μL of each standard and samples was transferred to a 96-well plate,
at which was added 25 μL of Reagent A’ (20 μL of Reagent S to each mL of Reagent A) and 200
μL of Reagent B. The plate was mixed for 5 seconds and after 15 minutes, absorbance was
read at 750 nm. Concentration was determined with reference to a standard curve of BSA
between 1.5 mg/mL and 0.125 mg/mL.
3.2.12. Scanning electron microscopy
After 21 days in culture, Transwell membranes were washed twice in PBS+,
following primary fixation with 3% (v/v) Glutaraldehyde (AGAR Scientific, AGAR Scientific)
for 45 minutes. After rinsing with 0.1M sodium-cacodylate buffer, membranes were
dehydrated through a graded series of ethanol, subsequently dried with 75% (v/v)
hexamethyldisilazane (HMDS) in ethanol for 10 minutes. Without remove HMDS, Transwell
inserts were allowed to air-dry for 30 minutes. The membrane of the Transwell inserts was
MATERIALS & METHODS
35
removed from the base of the insert using a scalpel and mounted on double-side stick tape
SEM stubs. The samples were stored in a desiccator until coated. Sputter coat was with gold-
palladium at 15 mA for 120 seconds under argon atmosphere and images were acquired using
a scanning electron microscope (Quanta 400FEG ESEM/EDAX Genesis X4M).
3.2.13. Transmission electron microscopy
After 21 days in culture, Transwell membranes were washed twice in PBS+, following
primary fixation with 2.5% (v/v) Glutaraldehyde (AGAR Scientific, AGAR Scientific) in 0.1M
sodium cacodylate during 3 days at 4°C. After rinsing with 0.1M sodium-cacodylate buffer,
membranes were post-fixed in 2% (v/v) osmium in 0.1M sodium cacodylate buffer overnight.
Membranes were washed with 0.1M sodium-cacodylate buffer, following dehydration through
a graded series of ethanol and propylene oxide for 10 minutes each. The membrane was
infiltrated in embedding resin as follows: propylene oxide and epon (2:1 proportion), 1:1, 1:2
and 0:1 during 1 hour each. After that, resin was allowed to harden during 48 hours in an
incubator set at 65°C. The block was sectioned with 60 nm of thickness using a Leica Reichert
SuperNova ultramicrotome (Leica Microsystems, Germany) and samples are collected to an
aluminum disk. The disks were contrasted using uranyl acetate and lead citrate during 5
minutes in each solution. Images were acquired using a transmission electron microscope Jeol
JEM 1400.
3.2.14. Drug transport assay
In order to determine the permeability of model drugs through the developed cell-
based models, permeability studies were performed correlating the obtained values with the
in vivo data. To start, culture medium was removed from both chambers and the cells
membranes were washed with pre-warmed HBSS, further replaced by new HBSS and allowed
to equilibrate for 15 minutes at 37°C. After this period it is expected that cell cultures reach
a constant TEER value. Permeability studies were run at 37°C during 4 hours with 1.5 mL of
100 μg/mL insulin prepared in HBSS in the apical side and 2.5 mL of HBSS in the basolateral
side.
Cell monolayer integrity during permeability studies was controlled by TEER
measurement before collect the samples in different time points. The samples were further
quantified by reverse HPLC-UV on a Merck-Hitachi LaChrom HPLC instrument (Merck). The
HPLC system was equipped with a XTerra RP-18 column, 5 μm particle size, 4.6 mm internal
diameter × 250 mm length (Waters) and a LiChrospher 100 TP-18, 5 μm particle size guard
column (Merck) [125]. All experiments were run in triplicate at room temperature and the
total area of the peak was used to quantify insulin. The results were expressed in percentage
of release and apparent permeability (Papp). Papp was calculated using the following equation:

MATERIALS & METHODS
36
, where C0 is the initial concentration in the apical compartment (μg/mL), A is the surface
area of the insert (cm2), ∆t is the time in which the experiment occurred (seconds) and ∆Q is
the amount of compound detected in the basolateral side (μg) [107].
Complementary studies to integrity were performed at the end of permeability studies
to evaluate the final integrity state of the models. For this, apical-basolateral flux was
assessed using 4 kDa Fluorescein Isothiocyanate – Dextran molecule (FITC-Dextran). After
transport experiments with insulin, it was discarded and Transwell® inserts were washed
twice with HBSS. After washes, 1.5 mL of 200 μg/mL of FITC-Dextran was added to the apical
compartment, equilibrated with 2.5 mL of HBSS in the basolateral side. The plate was
incubated at 37°C, 5% CO2 for 1 hour. After 1 hour, a sample was collected from the
basolateral side and transferred to a black plate 96-well plate (Falcon). FITC-Dextran
quantification was determined by fluorescence using a SynergyTM Mx HM550 microplate reader
(BioTeK® Instruments, USA) set at 485/530 nm (excitation/emission wavelength, respectively).
Microplate readings were obtained through Gen5 Data Analysis software (BioTek®
Instruments). Fluorescence values were normalized subtracting the blank and concentration
was calculated with reference to the standard curve. The amount of transported 4 kDa FITC-
Dextran was expressed by percentage of rejection.
3.2.15. Statistical analysis
All the results are presented as the mean±SD. Statistical analysis was performed using
Graphpad Prism® software (Prism 6 for Windows, CA, USA).
One way ANOVA, together with Tukey’s post hoc test, was used to compare different
groups of data. P<0.05 was considered statistically significant.

MATERIALS & METHODS
37
CHAPTER IV
RESULTS & DISCUSSION

RESULTS & DISCUSSION
38

RESULTS & DISCUSSION
39
The growing interest in predicting the properties of incoming drugs in the market has
increasingly valuing the in vitro tools as they may encompasses many characteristics of the
tissue in question and also benefit from standardized conditions and lack of ethical
considerations. Nonetheless, the existing in vitro models are restricted to cell monolayers
that do not replicate the entire architecture and mechanisms occurring in a living tissue
[126]. Essential cellular functions are missed by ‘petri-dish’-based cell cultures, limiting the
potential to predict the cellular responses of real organisms. Tridimensional cultures are
believed to incite a strong impact on drug screening, bridging the gap between cells cultures
and animal models, with the potential to additionally decrease the use of animals in research
[127].
The present study extends a traditional standard intestinal model to the deeper layers
of small intestine, in particular the intestinal mucosa that includes a broad variety of stromal
cells. The intimate crosstalk between epithelial and stromal cells was explored using a novel
in vitro cell based model as a mean of mimic the intestinal mucosa’s architecture and
functioning and predicts the permeability of a model drug.
4.1. Analysis of CCD18-Co cells behaviour in 2D and 3D
There is a striking similarity between the morphology and behaviour of cells in vivo and
in 3D culture conditions [127]. The cell behaviour in 2D and 3D matrices has revealed
considerable differences in cell morphology [128], migration [129], adhesion [130] and
signalling [131], comparing to in vivo conditions. Together, these findings empower the
importance of matrix dimensionality, i.e. 2D vs. 3D.
The evaluation of cell behaviour in 3D microenvironments is a multifactorial task that
takes into account matrix extrinsic factors (soluble and direct cell-cell contact signaling) and
matrix related factors (matrix composition, mechanical properties, mesh size and degradation
rate) [132]. A recent study highlights the relevance of optimizing initial cell densities when
establishing 3D cultures [133].
To determine the optimal cell number of CCD18-Co cells intestinal myofibroblasts
several assays were performed, namely viability, metabolic activity and cell morphology over
21 days of culture, period necessary to fully differentiate Caco-2 cells [93]. In this sense, a
range of densities of CCD18-Co cells (between 1×10⁴ cells/cm2 (D1) and 20×104 cells/cm2 (D4))
was seeded on 24-well plates to assess the most suitable density to be used in further
experiments.
4.1.1. Effect of cell number on viability of CCD18-Co cells in 2D
Cell viability was evaluated at days 7, 14 and 21 by the Live/Dead assay. As observed in
Fig. 4. 1, after 7 days, the cells remained highly viable for all the range of densities, with
very few dead cells between them. Despite the high viability at day 14, an alteration of cell

RESULTS & DISCUSSION
40
shape at density D3 (10×104 cells/cm2) and D4 (20×104 cells/cm2), can already be observed
since calcein is ubiquitously distributed by the cells. Cells seem to acquire a starry-like shape
most likely as a result of space constraints at higher cell densities. It is known that high
density cell culture promotes cell-to-cell contact that can stimulate cell cycle arrest causing
cells to stop dividing [134], a phenomenon commonly known as contact inhibition [135].
The starry-like shape is more accentuated at day 21, indicating that D3 and D4 do not
seem appropriate cell densities using 2D standard culture conditions. Notwithstanding,
further morphological assays were carried out to sustain this result.
Figure 4. 1. Live/Dead viability assay performed in 2D cultures of CCD18-Co cells. The results showed that at day
7 (A-D) most of the cells are viable labeled with Calcein-AM (green) presenting an elongated shape. After 14 days (E-
H), cells at higher densities (D3 and D4) start to acquire a starry-like shape with few dead cells labeled with PI (red).
This tendency aggravates at day 21 (I-L) for lower densities (D2). Scale indicates 100 μm and white arrows indicate
dead cells.

RESULTS & DISCUSSION
41
4.1.2. Effect of cell number on metabolic activity of CCD18-Co cells
The metabolic activity of CCD18-Co cells was evaluated in 3D conditions after
entrapment in a matrigel matrix and in standard 2D conditions using the rezasurin assay. The
differences in cell behaviour were evaluated during 21 days. Despite the different culture
conditions, the time of incubation for both 2D and 3D cultures was 3 hours.
In 2D standard conditions (Fig. 4. 2 A), the metabolic activity presented a stairway
profile between D1 and D3 for 7 days. At day 14, an increase in metabolic activity was
observed for all the cell densities tested, although a growing approximation of the fluorescent
values between D2, D3 and D4 was noticed. At day 21, the metabolic activity decreased for
all the densities, probably result of contact inhibition [135]. Concerning the 3D cultures (Fig.
4. 2 B), the metabolic activity also presented a stairway profile for the first 7 days,
proportional to the cell densities. At day 14, the increase of metabolic activity at D4 was not
significant and after 21 days, 3D cultures seemed to acquire a stagnant profile.
Overall, in the first days of culture, the metabolic activity of 3D cultures was lower
when compared with 2D cultures. Under 3D conditions, cells have a limited proliferation as
the matrigel matrix constitutes an obstacle to the proliferation and cells are subject to
hypoxia. But in fact, after 21 days, the metabolic activity of 3D cultures was higher when
compared with 2D cultures. This probably indicates that to cells maintain metabolically viable
they had used their proteolysis machinery and migrated through the matrix [136]. For this
reason, the choice of matrigel dilution and thickness are important parameters that will
condition the cell behaviour as the pore size of the matrigel matrix varies with the protein
concentration. At 50% gel concentration, the average pore size is approximately 2 μm, which
is much smaller than cellular dimensions [136]. Even though balanced matrix degradation
allows cell survival throughout matrix remodeling, further studies are necessary to evaluate
the matrix degradation and production of metalloproteinases (MMPs).
A B
Figure 4. 2. Metabolic activity of CCD18-Co cultured in 2D and 3D along 21 days at different densities. The
metabolic activity of 3D cultures was higher compared with 2D cultures after 21 days. Results are the average of
replicates and bars represent the standard deviation (n=3). The statistical differences (p<0.05) are denoted by (*).

RESULTS & DISCUSSION
42
4.1.3. DNA quantification
As mean to reinforce the results obtained for the metabolic activity in 2D and 3D
cultures, it was determined the DNA content after 21 days of culture (Fig. 4. 3). At day 1, it
was observed that the DNA content was proportional to the range of cell densities tested.
After 21 days, the DNA content in 2D cultures was significantly reduced at D2, D3 and D4 but
not at D1. This means that at D1, cells did not enter in a process of contact inhibition.
Therefore, cell densities higher than 1×10⁵ cells/cm2 (D2) are not recommended for cultures
maintained for 21 days in 2D standard conditions. Cells start to lack of space, detaching and
being removed as the medium is replaced every other day.
The decrease in the DNA content observed in 3D is a result of the reduced proliferation
of cells when are entrapped in a matrix. Notwithstanding, the DNA content was proportional
to the cell density.
Figure 4. 3. Total dsDNA quantification of CCD18-Co cultured for 21 days in 2D standard conditions at
different densities. After 21 days, the decrease in DNA content in both 2D and 3D cultures was result of contact
inhibition and matrix constraints, respectively. Results are the average of replicates and bars represent the
standard deviation (n=3). The statistical differences (p<0.05) are denoted by (*) regarding the control at day 1.
In summary, when entrapped in a matrigel matrix, CCD18-Co cells revealed a non-
proliferative character, result of the matrix constraints.
4.1.4. Effect of cell number in CCD18-Co cells morphology
There are, at least, three major classes of microenvironmental factors that affect the
cellular behaviour, i.e., the biochemical composition, the physical parameters of the matrix,
particularly the pliability, and the spatial cues [137]. 2D surfaces do not represent the
complexity of factors involved in cell communication and growth. However, growth arrest and
consequent metabolic activity inhibition are a consistent issue in 3D matrices added to the
fact that cells are spatially constrained and need to overcome the environment impediments
to populate the surrounding environment [138].
Regarding these issues, the morphology of CCD18-Co cells under 2D culture conditions
was evaluated to further on compare with the cell morphology in 3D culture conditions. After

RESULTS & DISCUSSION
43
7 days were observed remarkable differences between cells densities, highlighting the
elongated cell shape only at the density 1×10⁴ cells/cm2 (Fig. 4. 4 A). Cell morphology
suffered abrupt alterations beyond 1×10⁴ cells/cm2 cell density, result of the contact
inhibition and the lack of space. Between 5×10⁴ cells/cm2 and 10×104 cells/cm2, cells adopted
a starry-like morphology, still mixed with some elongated cells (Fig. 4. 4 B and C). For the
density of 1×10⁵ cells/cm2, the population of cells with the characteristic fibroblast shape was
found on odd occasion. Distinctly, at the highest density (20×104 cells/cm2), CCD18-Co cells
presented a skinny cell body with some cells overlapping in some regions (Fig. 4. 4 D).
At 14 days, the previous scenario is aggravated but 1×10⁴ cells/cm2 cell density seems
to be the better adequate density presenting a good spatial organization and maintained the
original and characteristic morphology of myofibroblasts(Fig. 4. 5 A). At higher densities (D2
and D3), the starry-like population of fibroblasts is more prominent (Fig. 4. 5 B) observing the
existence of a syncytium at D3 (Fig. 4. 5 C), a multinucleated cell that can result from
multiple cell fusions of mononuclear cells. The existence of a syncytium is reported in the in
vivo intestinal mucosa where subepithelial fibroblasts merge with other stromal cells in the
lamina propria, for instance, interstitial fibroblasts and pericytes [48]. Besides not completely
inadequate, this situation is not healthy to the cells. At D4, CCD18-Co cells continue to adopt
an elongated shape with a slender cell body, but with a more mature and evolved shape (Fig.
4. 5 D).
After 21 days, 1×10⁴ cells/cm2 seems to be the healthier and well adapted cell density
to a period time of 21 days (Fig. 4. 6 A), in detriment to the starry-like shape observed at
higher densities (Fig. 4. 6 B-D). Until now, most of the assays were concordant in elect 1×10⁴
cells/cm2 as the cell density better adapted to 21 days of culture. To further characterize the
3D morphology of CCD18-Co and the surrounding matrix was adopted the lowest cell density
of 1×10⁴ cells/cm2.

RESULTS & DISCUSSION
44
7th day
Figure 4. 4. Intestinal fibroblasts morphology identified by vimentin staining at day 7. After 7 days, are already notable differences in cells morphology. At D2 and D3, cells
acquired a starry-like shape result of contact inhibition and lack of space. At D4, CCD18-Co cells presented skinny cell bodies noticing some cells overlapping. Vimentin was labelled
with AlexaFluor488 (green) and a nucleus was labelled with DAPI (blue). Scale indicates 50 μm. (A) 1x10⁴ cells/cm2, (B) 5x10⁴ cells/cm2, (C) 10x104 cells/cm2 and (D) 20x104 cells/cm2.
A B
C D
Vimentin Nuclei
Vimentin Nuclei
Vimentin Nuclei
Vimentin Nuclei

RESULTS & DISCUSSION
45
14th day
Figure 4. 5. Intestinal fibroblasts morphology identified by vimentin staining at day 14. The scenario is aggravated and, so far, D1 revealed the healthier cell density. The starry-
like population is more prominent at higher densities (D2 and D3), observing the presence of multinucleated cells at D3. Vimentin was labelled with AlexaFluor488 (green) and a
nucleus was labelled with DAPI (blue). Scale indicates 50 μm. (A) 1x10⁴ cells/cm2, (B) 5x10⁴ cells/cm2, (C) 10x104 cells/cm2 and (D) 20x104 cells/cm2.
A B
C D
Vimentin Nuclei
Vimentin Nuclei
Vimentin Nuclei
Vimentin Nuclei

RESULTS & DISCUSSION
46
21st day
Figure 4. 6.Intestinal fibroblasts morphology identified by vimentin staining at day 21. After 21 days, D1 seems to be the well adapted density for 2D culture conditions observed by
the distended cell shape and in detriment of the cell morphology at higher cell densities (D2, D3 and D4). Vimentin was labelled with AlexaFluor488 (green) and a nucleus was labelled
with DAPI (blue). Scale indicates 50 μm. (A) 1x10⁴ cells/cm2, (B) 5x10⁴ cells/cm2, (C) 10x104 cells/cm2 and (D) 20x104 cells/cm2.
A B
C D
Vimentin Nuclei
Vimentin Nuclei
Vimentin Nuclei

RESULTS & DISCUSSION
47
4.1.5. Characterization of ECM components
Fibroblasts signaling can substantially differ depending on whether the cells are in 3D
or 2D culture conditions. The matrigel matrix affected cell metabolic activity and
proliferation, as previously observed by resazurin assay and dsDNA quantification. Also, cell
morphology was found to be susceptible to the 3D matrix constrictions. Additionaly,
fibroblasts are specialized cells in the remodeling of ECM and fibronectin (FN) is one of the
components associated with biological processes involved in that remodeling [137]. FN
characterization was thus performed over 21 days, simultaneously staining the intermediate
filaments of CCD18-Co cells using vimentin to observe the changes in cell morphology in 3D
conditions.
As can be observed in Fig. 4. 7 A, the FN staining after 7 days was condensed to small
dots. After 14 days, the outcome was a more complex and concrete staining uniquely
produced by CCD18-Co cells (Fig. 4. 7 B). At day 21, the levels of FN expression seemed not
to be altered when compared with day 14 (Fig. 4. 7 C).
A
B
FN Vimentin Nuclei
FN Vimentin Nuclei
FN
FN
Vimentin Nuclei
Vimentin Nuclei

RESULTS & DISCUSSION
48
Figure 4. 7. Characterization of fibronectin network of CCD18-Co cells cultured in 2D standard conditions. Over
21 days, is observed a shy increase of FN expression. (A) At day 7 the FN is limited to condensed small dots, but
after 14 days (B), it starts to reveal a more concrete staining. (C) At day 21, the levels of FN expression are
maintained with similar complexity compared with day 14. Fibronectin was labelled with AlexaFluor 488 (green),
vimentin AlexaFluor 594 (red) and nucleus with DAPI (blue). Scale indicates of 50 μm.
Regarding the FN expression in 3D conditions, was observed that after 7 days CCD18-Co
cells revealed a complex network of FN (Fig. 4. 8 A). Even though manufactures report the
detection of trace amounts of FN by Western Blot [139], matrigel is from rat origin [140] and
FN expression was assessed with a human antibody to only assess the FN produced by CCD18-
Co cells. Overall, matrigel seems to act as an initial livelihood that maintains the 3D
rearrangement of fibroblasts while they are not producing their own ECM components. After
14 days, the FN expression was similar to the first 7 days (Fig. 4. 8 B). At this point, probably
most of the existent matrigel was completely substituted by ECM components produced by
CCD18-Co cells. To confirm this, further studies are required namely compare the expression
of FN of rat origin and human origin. No relevant images were obtained for the 21 days.
Nonetheless, CCD18-Co cells showed to be evenly distributed throughout the matrigel
matrix confirming that 1×10⁴ cells/cm2 was the cell density better adapted to both 2D and 3D
culture conditions. Usually, there is no correlation between 2D and 3D mechanisms, but, in
this specific case, it was established for cell density. As soon as matrigel polymerization was
completed, matrigel thickness was significantly reduced. After 21 days under the effect of
CCD18-Co cells and environmental factors, matrigel content was probably substituted in the
totality. In fact, matrigel not only contains basement membrane components (laminins,
collagen IV and heparin sulphate proteoglycans) but also matrix degrading enzymes (MMP-2
and MMP-9) and growth factors (EGF, bFGF, NGF, PDGF, TGF-β) [141]. Even though the rate of
matrigel degradation is not reported, MMPs are vital to the degradation of both basement
membrane and stromal matrices. Gelatinases MMP-2 and MMP-9 and transmembrane MMPs are
critical mediators of basement membrane remodelling [142]. Therefore, even though the
matrigel degradation rate is not reported, it integrity is compromised by plenty of
environmental factors that will obey the system to react and produce ECM components.
C
FN Vimentin Nuclei
FN
Vimentin Nuclei

RESULTS & DISCUSSION
49
In spite the cell density has been the same for 2D and 3D culture conditions, the cell
morphology showed to be quite distinct. When CCD18-Co cells are cultured in a 3D Matrigel
matrix (Fig. 4. 8 A and B), they appeared elongated but spindle-shaped. This characteristic
morphology was already observed in cell-derived 3D matrices [137]. Compared with the cells
seeded on a 2D surface at the same density (1×10⁴ cells/cm2), these ones possesses a
characteristic fan-shaped lamellae.
Figure 4. 8. Characterization of fibronectin network of CCD18-Co cells cultured in 3D conditions. (A) After 7
days CCD18-Co cells embedded in Matrigel® revealed a complex network of fibronectin comparable to day 14 (B).
The 3D distribution of CCD18-Co cells seems well adapted to the matrix microenvironment. Fibronectin was
labelled with AlexaFluor 488 (green), vimentin AlexaFluor 594 (red) and nucleus with DAPI (blue). Scale indicates
50 μm.
Overall, CCD18-Co cells in 2D culture condition were broader and more flattened,
presenting more cell protrusions than in the 3D matrices, tendency already observed by
Hakkinen K. et al. [128].
4.1.6. Topographical features of CCD18-Co cells
The topographic features of the membrane were further visualized by SEM. After 21
days, CCD18-Co cells showed to populate the entire film as observed in Fig. 4. 9 A, however,
A
B
FN Vimentin Nuclei
FN Vimentin Nuclei
FN
FN
Vimentin Nuclei
Vimentin Nuclei

RESULTS & DISCUSSION
50
their elongated morphology do not fill all the spaces allowing a freer permeation. In the
detached image of Fig. 4. 9 A, are represented the hole spaces between CCD18-Co cells
acquired throughout the capture of retrodifused electrons instead of the standard secondary
electrons. This acquisition delineates the regions of higher atomic number, appearing brighter
[143]. In this case, the brighter regions represent the glass coverslip, translated in open
spaces for freely permeation of a compound.
On the other hand, CCD18-Co cells seeded onto matrigel previously coated Transwell
inserts revealed a complex network composed by ECM components (Fig. 4. 9 B) in contrast
with fibroblasts seeded on the coverslip (Fig. 20). In certain regions was possible to observe
the porous of the membrane since CCD18-Co cells are not completely opaque.
In one case or in the other, the disposition and morphology of CCD18-Co cells forms a
cell monolayer with unoccupied spaces that allow a freer permeation.
Figure 4. 9. Scanning electron micrographs of the CCD18-Co and Matrigel/CCD18-Co monolayer. (A) CCD18-Co
monolayer in a coverslip showed to populate the entire film. Scale indicates 400 μm. (B) CCD18-Co cells seeded on
Matrigel coated Transwell insert revealed a more complex network composed by ECM components. Scale indicates
40 μm.
4.2 Barrier modulation by epithelial cells
A characteristic feature of epithelial cells is the formation of cell junctions resulting in
a tight cellular barrier that selectively controls the diffusion along the paracellular way,
namely the TJs [144]. An intact barrier is crucial for the biological activities of a tissue but
also for reliable in vitro experiments.
4.2.1 Assessing barrier integrity
A quantitative measure of integrity and maturity of a monolayer is the electric
resistance of the cell layer [145]. Caco-2 cells are tighter linked by TJs, underestimating the
paracellular permeability of compounds transported by this route. As result, Caco-2 cells are
A B

RESULTS & DISCUSSION
51
characterized by high TEER values comprised between 150-1600 Ω.cm2. This wide range is
proof of the high inter-laboratory variability result of different culture conditions such as
seeding density, passage number, days in culture, among others factors [87].
As observed in Fig. 4. 10, TEER measurements of the Caco-2 model presented higher
values compared with the other models. In opposition, CCD18-Co model presented the lowest
TEER values compared with the other models, what is justified by their morphological
features that did not form a tight monolayer. The influence of matrigel coating with respect
to the resistance values was not conclusive. Upon the introduction of CCD18-Co cells in direct
contact with Caco-2 epithelial cells, TEER values presented a significant decrease. It may
happen that CCD18-Co cells are interspaced between Caco-2 cells, interfering with the
barrier tightness.
Were tested two distinct 3D configurations in which CCD18-Co cells are in different
assemblies. As depicted in Fig. 4. 10, 3D co-cultures (CCD18-Co/Matrigel/Caco-2 and CCD18-
Co+Matrigel/Caco-2) presented a slower rate of growth and significant lower TEER values over
the 21 days when compared with 2D models. The CCD18-Co+Matrigel/Caco-2 model resulted
in lower TEER values due to the fact that CCD18-Co cells dispersed in matrigel were not as
proliferative as in 2D standard conditions, as observed before in the proliferative assays.
Despite this, this model reached a desirable integrity above 200 Ω.cm2 [146] and since this
configuration closely mimics the cell-cell and cell-matrix interactions found in the intestinal
mucosa, was proceeded with this configuration for further studies. Notwithstanding, the
model CCD18-Co/Matrigel/Caco-2 represents an interesting configuration to study the in vivo
deposition of ECM components by stromal that will form the supportive basement membrane
[147].
Figure 4. 10. TEER cell measurements monitored in function of time during 21 days of culture in cell based
models of CCD18-Co intestinal fibroblasts and Caco-2 cells. Caco-2 monolayer was the model with higher TEER
values in contrast with the CCD18-Co model. Results are the average of replicates and bars represent the standard
deviation (n=4).

RESULTS & DISCUSSION
52
4.2.2. Epithelial-stromal interactions
In the sequence of the previous results, it was confirmed that the matrigel matrix
influenced the metabolic activity and proliferation of CCD18-Co cells in 3D conditions.
To also clarify the interaction between stromal and epithelial cells, it was
characterized the proliferative behaviour of CCD18-co cells and Caco-2 cells in direct contact
after 7 days on a plastic substrate (Fig. 4. 11 A). Other control situations were tested as
depicted in Fig. 4. 11 B - F.
Figure 4. 11. Effect of the substrate on cell proliferation of Caco-2 and CCD18-Co cells after 7 days of culture.
(A) Epithelial and stromal co-culture seeded onto a plastic substrate. (B) Stromal cell monoculture of CDD18-Co
cells seeded on a plastic substrate. (C) Stromal monoculture of CCD18-Co cells seeded on a matrigel-coated plate.
(D) Stromal cell monoculture of CDD18-Co cells embedded in a Matrigel® matrix. (E) Epithelial cell monoculture of
Caco-2 seeded on plastic substrate. (F) Epithelial cell monoculture of Caco-2 seeded on a matrigel-coated plate. (G)
CCD18-Co cells were less proliferative when entrapped in the Matrigel® matrix compared with plastic. In contrast,
Caco-2 cells were significantly more proliferative when seeded onto a matrigel-coated substrate. Results are the
average of replicates and bars represent the standard deviation (n=3). The statistical differences (p<0.05) are
denoted by (*).
After 7 days of growth, the cell number was determined and compared to the initial
cell number. As observed in Fig. 4. 11 G, stromal cells were proliferative on plastic but
showed reduced proliferation when embedded in matrigel. This reinforces that the
entrapment of CCD18-Co cells in a matrigel matrix limits the cell proliferation, due to the
matrix constraints and the hypoxia environment. Moreover, the process of entrapment
requires multiple pipetting steps to suspend a cell suspension in the matrigel matrix and that
may lead to some shear-induced damage. In contrast, CCD18-Co cells seeded onto a matrigel
coated plate showed to be proliferative. In turn, Caco-2 cells showed identical proliferation
when seeded onto a plastic surface with no significant differences comparing with the initial
cell seeding, but significantly higher proliferation was observed when seeded onto matrigel
A
B
C
D
E
F
G

RESULTS & DISCUSSION
53
coated plates. These results were expected considering that matrigel is rich in ECM
components that constitute an excellent substrate for cell growth and proliferation [148].
Taking advantage of the fact that CCD18-Co cells presented a proliferative behaviour in
the plastic substrate, it was explored the effect CCD18-Co when in direct contact with Caco-2
cells. It was observed a high proliferative activity compared to the initial cell density,
concluding that CCD18-Co cells did not inhibit the proliferation of Caco-2 cells and that both
cell types had a synergetic effect when coated in direct contact.
4.2.3. Topographical features of Caco-2 cells
As observed in Fig. 4. 12, after 21 days, an uniform and differentiated character of
Caco-2 epithelial cells was revealed by the presence of the typical microvilli, reported to be
between 0.5-1.5 μm in length and 0.1 μm in width, varying according the species [149]. The
boundary of cells is circumvented by a denser join of microvilli at the boundaries of two cells.
Figure 4. 12. Scanning electron micropraphs of the Caco-2 monolayer after 21 days of culture. The presence
of microvilli is the most characteristic feature of Caco-2 cells. Scale indicates 20 μm and 10 μm.
4.2.4. Expression of tight junctions proteins
Epithelial barrier function is regulated in large part by the apical intercellular junctions,
referred to as the TJs, which comprises transmembrane proteins (occludin, claudin and
junctional adhesion molecule (JAM)) and cytoplasmatic proteins (zonnula occludens ZO-1, ZO-
2, ZO-3 and cingulin) [150]. TJs form a continuous barrier between epithelial cells, which
create tissue spaces and regulate the movement of solutes across the epithelium. The
formation of a tight monolayer is a determinant factor to an in vitro model which application
aims to test the absorption/permeation of a compound.
All the epithelial cells possess one common characteristic of express TJ proteins and form
TJs between each other [144]. For instance, current evidences indicate that claudins play a
central role in defining electrical resistance and permselectivity [151].

RESULTS & DISCUSSION
54
As observed in Fig. 4. 13 A-C, the top scanning of Caco-2 monolayer demonstrated a
homogeneous ring along the perimeter of the cells confirming that Caco-2 cells formed tight
and adherent junctions that limited the passage of components and confirm the functional
properties of the barrier. This tendency had been already noticed by the TEER measurements,
which returned high values of resistance.
Figure 4. 13. Expression of claudin-5, occludin and E-cadherin in Caco-2 cell monolayer. (A) Claudin-5, (B)
Occludin and (C) E-Cadherin. The top scanning of Caco-2 monolayer demonstrated a homogeneous ring along the
perimeter of the cells, confirming the tight character of Caco-2 monolayer. Claudin-5 and E-Cadherin were labelled
with AlexaFluor488 (green), occludin with AlexaFluor594 (red) and nucleus with DAPI (blue). Scale indicates 20 μm.
4.2.5. Caco-2 / HT29-MTX co-culture model
The introduction of new cell lines somehow interfere with the tighter character of the
Caco-2 monolayer, but at the same time approximate the TEER values from the human
intestine, ranging from 12-69 Ω.cm2 [79, 102]. The introduction of HT29-MTX in the model
interferes with the barrier formation as these cells will be interspersed between Caco-2 cells
altering the tighter character of the Caco-2 monolayer. Even though both cells types establish
TJ between each other, they present a structural variability facilitating the passage of ions by
paracellular pathway [144].
The less tight character of the co-culture of Caco-2 and HT29-MTX cells was confirmed
by the measurement of the TEER (Fig. 4. 14). The Caco-2/HT29-MTX monolayer presented a
gradual increase of TEER values during 21 days but significantly lower when compared with
the Caco-2 monolayer. The 3D triple model (CCD18-Co+Matrigel/Caco-2/HT29-MTX cells)
revealed a decrease in TEER values compared with the previous 3D double model (CCD18-
Co+Matrigel/Caco-2) result of the introduction of HT29-MTX cells.
C A B
Claudin-5 Nuclei
Occludin Nuclei
E-Cadherin Nuclei

RESULTS & DISCUSSION
55
Figure 4. 14. TEER cell measurements monitored in function of time during 21 days of culture in a cell based
model of CCD18-Co intestinal fibroblasts, Caco-2 and HT29-MTX cells. Caco-2/HT29-MTX model presented lower
TEER values compared with Caco-2 model regarding the less tight character of tight junctions between both cell
types. Results are the average of replicates and bars represent the standard deviation (n=4).
In Fig. 4. 15 A, it is depicted the expression of a tight junction protein claudin-5
between HT29-MTX cells, observing the rounder shape distinct from Caco-2 cells. When in co-
cultured, Caco-2 cells and HT29-MTX cells also express a tight junction protein occludin (Fig.
4. 15 B), being impossible to discriminate Caco-2 cells from HT29-MTX by similar shape and
size [77].
Figure 4. 15. Expression of claudin-5 in HT29-MTX monolayer and occludin in Caco-2/HT29-MTX monolayer.
Despite the different structure of tight junctions of HT29-MTX cells, Caco-2/HT29-MTX monolayer expressed a strong
staining for occludin tight junction protein. Claudin-5 was labelled with AlexaFluor488 (green), occludin with
AlexaFluor594 (red) and nucleus with DAPI (blue). Scale indicates 20 μm.
In contrast, it was possible to distinct Caco-2 from HT29-MTX cells by transmission
electron microscopy. As observed in Fig. 4. 16 A, the monolayer is richly covered by mucin-
filled granules, which tend to coalescence, a process in which two or more elements merge to
form a single element. The Caco-2 epithelial cells formed microvilli on their apical surface
exhibiting slight variability in density along the different regions of the monolayer. HT29-MTX
cells were distinguished by the presence of intracellular granules, appearance similar to in
vivo goblet cells that contain mucin granules located below the apical membrane [152]. As
depicted in Fig. 4. 16 B, both epithelial Caco-2 and HT29-MTX cells were able to form tight
junctions.
A B
Claudin-5 Nuclei
Occludin Nuclei

RESULTS & DISCUSSION
56
Figure 4. 16. Transmission electron micrographs of Caco-2/HT29-MTX monolayer. (A) Caco-2/HT29-MTX
monolayer with typical microvilli and mucin granules. Scale bar indicates 0.5 μm. The black arrows represent
indications of coalescence. (B) Tight junction formed between Caco-2 (left) and HT29-MTX cell (right). Scale
indicates 0.5 μm. The fold is an artefact of specimen preparation procedure for TEM.
4.2.6. Evidence of M-like cell formation
M cells, located in the epithelia overlying mucosa-associated lymphoid tissues (i.e.
PPs), are an instrument in initiating mucosal immunity and a portal for the delivery of
macromolecules and microorganisms, consequently explored to antigen delivery [76]. The
little known about the interactions between M cells and enterocytes and between M cells
makes difficult their unambiguous identification. Claudin-1/3 and ZO-1 were detected in the
TJs of both M cells and enterocytes within mouse intestinal follicles-associated epithelium
(FAE) revealing the contact of M cells with the adjacent cells through TJs. Regarding AJs
between M cells of mouse PPs, they revealed enhanced expression of β-catenin, α-actinin,
polymerized actin and in some areas, E-cadherin, differing from enterocytes [153].
Furthermore, M cells appear to exhibit an increased depth and an altered rearrangement of
TJ strands differing from the non-FAE intestinal epithelia [154].
TJs rearrangement between enterocytes and M cells is somehow reproduced in vitro by
the conversion of Caco-2 epithelial cells into M-like cells by Raji B lymphocytes [36]. It was
expected that the TEER values of Caco-2/Raji B model presented similar values to the Caco-2
model since this model is mainly comprised by Caco-2 cells. However, it was observed a
decrease in TEER values compared with Caco-2 model that can be result of the conversion of
Caco-2 cells into M-like cells. This seems to be a remote idea since M-like cells were
originated from Caco-2 cells, which upon the introduction of Raji B cells (day 15), already
form a very tight monolayer. Even though this evidence was already reported [106], is
necessary to confirm this assumption by identifying the soluble factors responsible for this
phenotypic induction and TJ strength.
The triple model of Caco-2/HT29-MTX/Raji B cells presented lower TEER values when
compared with the Caco-2/Raji B control result of the presence of HT29-MTX cells. The 3D
quadruple model (CCD18-Co+Matrigel/Caco-2/HT29-MTX/Raji B) presented a slower increase
A B

RESULTS & DISCUSSION
57
of TEER values with a similar profile to the 3D triple model (CCD18-Co+Matrigel/Caco-2/HT29-
MTX).
Figure 4. 17. TEER cell measurements monitored in function of time during 21 days of culture in a cell based
model of CCD18-Co intestinal fibroblasts, Caco-2 cells, HT29-MTX and Raji B cells. Caco-2/Raji B model
presented high TEER values, in the same range of the TEER values of Caco-2 model. Results are the average of
replicates and bars represent the standard deviation (n=4).
In Fig. 4. 18, is possible to visualize that the triple model of Caco-2, HT29-MTX and M-
like cells is tight enough despite the structural differences between the epithelial cells.. The
top scanning of co-culture monolayer demonstrates a homogeneous ring around the perimeter
of the cells, morphologically identical despite the heterogeneous cell population.
Figure 4. 18. Expression of tight junction protein occludin in Caco-2/HT29-MTX/Raji B model. Despite the
structural differences between epithelial cells, the triple model revealed a tight character. Occludin was labelled
with AlexaFluor594 (red) and a nucleus was labelled with DAPI (blue). Scale indicates 20 μm.
4.2.6.1. Quantification of alkaline phosphatase activity
Morphologically distinct from enterocytes, M cells display poorly organized brush border
with short irregular microvilli at the apical domain. As result, the enzymatic activity of
alkaline phosphatase is down-regulated [8]. In vitro studies showed that lymphocytes trigger
the conversion of enterocytes cell lines into M-like cells in co-culture under influence of
Occludin Nuclei

RESULTS & DISCUSSION
58
membrane-bound lymphotoxin (LTα1β2) secreted by B-lymphocytes [36]. Therefore, the
presence of Raji B lymphocytes in the basolateral side is known to protagonize the M-cell
formation [106-108].
Alkaline phosphatase (ALP) is as an excellent marker of crypt-villus differentiation,
since ALP of Caco-2 cells have identical sequence [155] and similar biochemical
characteristics [156] compared to the intestinal alkaline phosphatase (IAP) isoenzyme, which
is exclusively expressed in villi enterocytes [157].
In order to trigger M-like cell formation, an alkaline phosphatase assay based on a work
of Ferruza et al. [123], was performed as mean to monitor the down-regulation in the alkaline
phosphatase activity. As observed in Fig. 4. 19, the ALP activity increased over the 21 days of
culture, although not significantly between days 14 and 21 (period of contact with Raji B
cells), what reveals that these assay was not significantly sensitive enough to trigger the
presence of M-like cells. The gradual increase of ALP activity was already been observed in
Caco-2 monolayer [123, 158]. Nonetheless, this quantitative assay was never applied to study
the down-regulation of ALP in M-like cells and the down-regulation of ALP activity was only
observed in in vivo studies. There are qualitative evidences of the decrease of ALP activity in
a triple co-culture of Caco-2/HT29-MTX/Raji B when compared with the control of Caco-
2/HT29-MTX [108], however further evidences are required. Moreover, it was not studied the
amount of M-like cells formed regarding the initial Raji B cell density. This is certainly a
hypothesis to explore, in order to equalize the in vitro cell number of M-like cells to the in
vivo proportions of M cells.
Figure 4. 19. Alkaline phosphatase (ALP) activity during differentiation of Caco-2/Raji B model. ALP activity
increased over the 21 days of culture revealing that this method was not sensitive enough to detect the presence
of M-like cells. Results are the average of replicates and bars represent the standard deviation (n=3). The
statistical differences (p<0.05) are denoted by (*).
4.2.6.2. Morphological features of M-like cells
HT29-MTX cells display more sparse microvilli [77], what could enter in conflict with
the identification of M-like cells. Opportunely, HT29-MTX cells contain intracellular mucin
granules that allowed the identification of HT29-MTX cell by transmission electron

RESULTS & DISCUSSION
59
microscopy. As observed in Fig. 4. 20 A, after 21 days some HT29-MTX cells are found closer
to the basal side of Caco-2 cells. In fact, HT29-MTX present a doubling time different from
Caco-2 cells, the last with higher doubling time [106]. Notwithstanding, are still observed
mucin-filled granules at the epithelial monolayer (Fig. 4. 20 B) which shows that, although
not pictured, some HT29-MTX cells are near the apical side of Caco-2 cells, releasing some
mucin granules that remain adsorbed to the apical membrane. Hilgendorf et al. had already
noticed that the standard composition of Caco-2 cell medium did not favored the HT29-MTX
growing, leading to co-cultures that were more similar to Caco-2 monocultures than mixed
cultures [105].
Once again, Caco-2 cells displayed slight variability in microvilli density along of the
different regions of the monolayer. This variability did not allow the undoubted confirmation
of the presence of M-like cells. Nonetheless, epithelial cells are tightly linked each other
constituting an evident barrier to the drug translocation (Fig. 4. 20 B).
Figure 4. 20. Transmission electron micrographs of Caco-2/HT29-MTX/Raji B monolayer. (A) HT29-MTX cells
with intracellular mucin-filled granules sited over the Transwell filter. Scale indicates 1 μm. (B) Tight junctions
formed between epithelial cells with typical microvilli and some mucin granules. Scale indicates 1 μm. The fold is
an artefact of specimen preparation procedure for TEM.
Nevertheless, M-like cells were possibility identified by scanning electron microscopy
by the lack of microvilli interspersed between Caco-2 cells (Fig. 4. 21 A). It was not possible
to distinguish Caco-2 cells from HT29-MTX cells by their morphological features but residual
evidences of mucus seem to be retained over the surface of microvilli (Fig. 4. 21 B).
However, this did not preclude the presence of an uninterrupted layer of mucus covering the
epithelial layer, as reported by other authors in the same proportions of Caco-2 and HT29-
MTX cells [118]. Probably, most of the mucus was lost during the membrane processing for
scanning electron microscopy.
Overall, SEM allowed to observe a more representative area to the identification of M-
like cells while TEM was more effective in the identification of HT29-MTX cells and presence
of mucin-filled granules.
A B

RESULTS & DISCUSSION
60
Figure 4. 21. Scanning electron micrographs of the Caco-2/Raji B double model and of the Caco-2/HT29-
MTX/Raji B triple model after 21 days. (A) M-like cells are identified by shorther or lack of microvilli in the Caco-
2/Raji B model. (B) HT29-MTX cells were not distinguished from Caco-2 cells but there are evidences of mucus
attached. The cracking is an artefact of specimen preparation procedure for SEM. Scale bar of 50 μm and 40 μm.
4.2.7. Visualization of the tridimensional model
As observed in Fig. 4. 22 A, Caco-2 cells presented their characteristic columnar shape.
After three weeks of culture, a dense monolayer of epithelial cells was maintained over a gel
layer of CCD18-Co fibroblasts embedded in matrigel (Fig. 4. 22 B). This organization is
somewhat like the native small intestinal mucosa in with the epithelial cells lying onto a
lamina propria (Fig. 4. 22 C) [111]. In fact, the initial thickness of the matrigel was lost but
their degradation allowed the CCD18-Co cells to easier populate the 3D matrix. Therefore,
CCD18-Co cells had an active role in the construction of lamina propria that sustains epithelial
cells. The elongated morphology of CCD18-Co cells in a 3D matrix seems to indicate that
CCD18-Co cells were able to modulate the matrix, otherwise would appear less elongated.
Figure 4. 22. Tridimensional model visualization through histological cut stained with H&E. (A) Caco-2
monolayer showing the characteristic columnar shape of Caco-2 cells. The colouration below the Transwell insert is
an artefact of the histological staining. (B) In vivo cut of the in vivo small intestinal mucosa. (C) CCD18-Co intestinal
fibroblasts embedded in matrigel sustain Caco-2 cells over them. Scale indicates 20 μm.
A
B C
A
B C

RESULTS & DISCUSSION
61
Then, the matrix that sustains the epithelial cells was characterized by staining
fibronectin. As observed in Fig. 4. 23, the FN expression was restricted to the fibroblastic
layer that sustains the Caco-2 monolayer. Some fibroblasts were able to cross the 3 μm
Transwell insert, evidenced by the presence of residual staining above the filter. This result is
an evidence of the active role of CCD18-Co cells, as they were able of reformulate the
matrigel and leave the matrix.
Figure 4. 23. Fibronectin expression of a paraffin section of tridimensional model of CCD18-Co cells
embedded in Matrigel and Caco-2 cells. FN is restricted to the fibroblastic layer of CCD18-Co cells demonstrating
the supportive role of CCD18-Co cells in maintain epithelial cell layer. Fibronectin was labelled with AlexaFluor
488 (green) and nucleus with DAPI (blue). Scale indicates 10 μm.
4.2.8. Insulin permeability
The functional character of the model was validated comparing the permeability profile
of insulin in the monocultures and co-cultures of CCD18-Co, Caco-2, HT29-MTX and Raji B
cells. The choice of insulin as a model drug supported by the previous experience of the
group.
Besides the controversial character of the absorption mechanism of oral administrated
insulin, the paracellular pathway is the most feasible pathway for its passage across the
intestinal epithelium due to its high hydrophilicity [15]. Moreover, since insulin (isoelectric
point ≈ 5.4) is negatively charged at the pH of the small intestine, it interaction with
negatively charged mucins at the epithelial surface will repulse insulin avoiding it to reach
the cells [159, 160]. In contrast, morpho-cytochemical and biochemical evidences in both
normal and diabetic rats studied the ileal tissues and between 2 and 5 minutes, insulin
labeling was associated to the microvilli and endocytic vesicles in the apical portion of
epithelial cells. At 10 minutes, insulin labeling was found at the level of the trans-side of
Golgi apparatus and along the basolateral membranes of epithelial cells [161, 162].
Importantly, insulin has been reported to be absorbed into the rat ileal epithelium in the
presence of permeation enhancers and protease inhibitors [162], but in addition, an insulin-
degrading enzyme (IDE) has been identified in the cytosol of the rat intestinal enterocytes
constituting up to 92% of total insulin-degrading activity [163]. Moreover, insulin receptors,
that have been identified in the basolateral membranes of dog intestinal mucosa [164], in
mouse intestinal cells [165] and in the membrane of Caco-2 cells [166], may be functional in
the protein transport across the intestinal epithelium but their precise role remains unclear.

RESULTS & DISCUSSION
62
Thus, both pathways are feasible to transport insulin. However, the endossomal degradation
and the insulin-degrading enzyme neglect the real contribution of the transcellular pathway
in the transport of insulin.
Permeability studies were performed with insulin in free-form over 4 hours with
parallel measurement of TEER values. Before the experiment, the cultures were equilibrated
with HBSS and TEER values were allowed to stabilize. The intrinsic resistance of the cell layer
is influenced by the cell culture medium in the apical and basolateral compartment, by the
membrane of the filter inserts and by the electrode-medium interface. Since transport
experiments are performed in HBSS, TEER values typically decreased in result of the
adjustment of the experiment conditions.
As depicted in Fig. 4. 24, all the models showed the same profile in the TEER
measurement, reaching an almost stationary profile after 1 hour of experiment. As the
compound interacts with the cell layer, TEER values usually decrease resulting in the opening
of TJs. That decrease is returned as soon as the culture conditions are reestablished as
proved by higher values of FITC-Dextran permeation and reported by other authors [167,
168].
Figure 4. 24. TEER values monitored in function of time during 4 hours of permeability experiments,
comprising Caco-2, CCD18-Co cells, HT29-MTX and Raji B cells. All models revealed a significant decrease in
TEER values. Despite the decrease, Caco-2 model presented the higher TEER values after 4 hours. Results are the
average of replicates and bars represent the standard deviation (n=3).
4.2.8.1. Insulin quantification
The permeability profile of all the models follows a similar tendency during the time of
the experiment translated in an increased permeability with a decrease of TEER values (Fig.
4. 25).
Caco-2 monoculture presented the lower amount of permeated insulin, expected by the
higher TEER values and the tighter junctions. Noticeably, as higher the initial TEER values,
A B

RESULTS & DISCUSSION
63
the profile of decrease of resistance values during the permeability experiment seems to
decrease quicker and more accentually, with exception of the monolayer co-culture of
CCD18-Co and Caco-2 cells. In contrast, CCD18-Co and Matrigel/CCD18-Co monolayer allowed
the higher permeation to the passage of insulin without meaningful variations after 30
minutes (Fig. 4. 25). The effect of matrigel coating is not perceived in TEER values, but
becomes more noticeable that matrigel coating seems to interfere with the permeability
studies, limiting the transport of insulin to the basolateral side. This observation is justified
by the proliferative behaviour of CCD18-Co cells when seeded on a matrigel substrate. The
permeability profile of the CCD18-Co/Caco-2 model was similar to the Caco-2 model, since
both cells co-exist in co-culture as observed by their proliferative character.
A B
Figure 4. 25. Cumulative transport of insulin across monocultures and co-cultures of CCD18-Co and Caco-2
cells. CCCD18-Co model is the one presenting higher permeation to insulin regarding the high pore size of CCD18-
Co monolayer. Results are the mean of replicates and bars represent the standard deviation (n=3).
The apparent permeability coefficient (Papp) represents a cumulative amount of the test
compound in the basolateral side, not distinguishing the contribution of each transport
pathway. The Papp value to insulin in Caco-2 monolayers was higher 1×10⁻⁶ cm/s but, as
expected, presented the lower Papp compared with the other models (Table 4. 1). Moreover,
Papp values of CCD18-Co/Caco-2 model were not significantly different of Caco-2 model,
recalling the similarity of TEER values with the Caco-2 model. CCD18-Co cell seeded onto
matrigel coating presented significantly lower Papp compared with the Papp of CCD18-Co
monolayer. As observed before by scanning electron microscopy, CCD18-Co seeded onto
matrigel presented a complex matrix that can offer more resistance to the transport of
insulin (Fig. 4.9 B). Comparing both 3D configurations, the 3D double model CCD18-
Co+Matrigel/Caco-2 allowed a higher permeation of insulin when compared with the CCD18-
Co/Matrigel/Caco-2. Besides the less proliferative character of CCD18-Co cells when
embedded in matrigel, the 3D assembly seems to be a critical factor in the transport of
insulin.

RESULTS & DISCUSSION
64
Table 4. 1. Apparent permeability coefficient (Papp × 10-6 cm/s) of insulin across the monolayer comprising Caco-
2 and CCD18-Co cells. Results are the mean of three replicates ± standard deviation (n=3, mean ± SD).
In vitro models Papp (× 10-6 cm/s) Significance level
CCD18-Co 6.03 ± 0.23 (***)
Matrigel/CCD18-Co 3.95 ± 0.74
Caco-2 2.77 ± 0.18 (ns)
CCD18-Co/Caco-2 3.00 ± 0.08
CCD18-Co +Matrigel/Caco-2 4.76 ± 0.08 (**)
CCD18-Co/Matrigel/Caco-2 3.96 ± 0.19
As stated before, the introduction of mucus-producing cells interferes with the barrier
tightness. These results showed that HT29-MTX cells were involved in the increase of
permeability of insulin (Fig. 4. 26). In the in vivo scenario, mucus interaction with the
negative charges of insulin difficult their entrapment by the mucus, however, in static
conditions the mucus may approximate the insulin molecules near of the epithelial surface,
retaining a considerable amount that will permeate through the less strait TJ between both
epithelial Caco-2 and HT29-MTX cell lines. Therefore, the existence of mucus was propitious
to the transport of insulin, effect already reported by Jin et al. [169].
Figure 4. 26. Cumulative transport of insulin across monocultures and co-cultures of CCD18-Co fibroblasts,
Caco-2 cells and HT29-MTX cells. Caco-2/HT29 model presented higher permeation to insulin compared to the
Caco-2 model control, revealing that the existence of mucus was propitious to the transport of insulin. Results are
the mean of three replicates and bars represent the standard deviation (n=3, mean ± SD).
Comparing the Caco-2/HT29-MTX model with the Caco-2 control, the double model
presented higher susceptibility to the permeation of insulin favored by the presence of mucus
and the less tight junctions between both Caco-2 and HT29-MTX epithelial cells. As expected,
the 3D triple model (CCD18-Co+Matrigel/Caco-2/HT29-MTX) showed relative higher

RESULTS & DISCUSSION
65
permeation compared with the 3D double model (CCD18-Co+Matrigel/Caco-2) result of the
presence of HT29-MTX cells (Table 4. 2). As argued before, the 3D models allowed a higher
permeation of insulin justified by entrapment of CCD18-Co cells in the matrigel matrix.
Table 4. 2. Apparent permeability coefficient (Papp × 10-6 cm/s) of insulin across the models comprising CCD18-
Co, Caco-2 and HT29-MTX cells. Results are the mean of three replicates ± standard deviation (n=3, mean ± SD).
In vitro models Papp (× 10-6 cm/s) Significance level
Caco-2 2.77 ± 0.18 ***
Caco-2/HT29-MTX 6.32 ± 0.18
CCD18-Co + Matrigel/Caco-2 4.76 ± 0.08 **
CCD18-Co + Matrigel/Caco-2/HT29-MTX 7.42 ± 0.28
M cells are characterized by their high transcytotic capacity and reduced expression of
enzymatic activity throughout the down-regulation of alkaline-phosphatase and sucrase
enzymes present in microvilli [8]. Even though the in vitro presence of M-like cells has been
progressively revealed [106, 108], detailed information lacks regarding the permeability
behaviour of the models comprising these cells.
In the results depicted in Fig. 4. 27, seems that the presence of M-like cells increased
the permeability of insulin. In fact, it remains the question whether, upon Raji B cells
conversion, there is any change in TJ structure that would justify an increase in permeability.
If there is a loss of the tightness of the monolayer due to the presence of M-like cells, that
would favor the paracellular route. More remotely, insulin can also take advantage of the
transcytotic capacity of M-like cells.
Figure 4. 27. Cumulative transport of insulin across monocultures and co-cultures of CCD18-Co fibroblasts,
Caco-2 cells, HT29-MTX and Raji B cells. (A) Caco-2/Raji B model presented lower permeation to insulin
compared to the CCD18-Co+Matrigel ®/Caco-2/HT29-MTX/Raji B model (B), mainly result of the introduction of
HT29-MTX cells. Results are the mean of three replicates and bars represent the standard deviation (n=3, mean ±
SD).

RESULTS & DISCUSSION
66
Comparing the Papp values, it is evident that the presence of M-like cells favored the
transport of insulin. The 3D quadruple model (CCD18-Co+Matrigel/Caco-2/HT29-MTX/Raji B
cells) represents the model that allows the more freely permeation of insulin (Table 4. 3).
Table 4. 3. Apparent permeability coefficient (Papp × 10-6 cm/s) of insulin across the monolayer comprising
CCD18-Co, Caco-2, HT29-MTX cells and Raji B lymphocytes. Results are the mean of three replicates ± standard
deviation (n=3, mean ± SD).
In vitro models Papp (× 10-6 cm/s) Significance level
Caco-2 2.77 ± 0.18 ***
Caco-2/Raji B 5.51 ± 0.34
CCD18-Co + Matrigel/Caco-2/HT29-MTX 7.42 ± 0.28 ns
CCD18-Co + Matrigel/Caco-2/HT29-MTX/Raji B 8.82 ± 0.98
Comparing all the 3D models, both Papp values of CCD18-Co+Matrigel/Caco-2/HT29-MTX
and CCD18-Co+Matrigel/Caco-2/HT29-MTX/Raji B models were significantly different from
CCD18-Co+Matrigel/Caco-2 model revealing that the introduction of HT29-MTX cells was a
critical factor in the permeability of insulin (Fig. 4. 28). In contrast, the Papp values of CCD18-
Co+Matrigel/Caco-2/HT29-MTX and CCD18-Co+Matrigel/Caco-2/HT29-MTX/Raji B models were
not significantly different but was observed an increase of Papp result of the presence of M-
like cells.
Overall, the non proliferative character of CCD18-Co cells embedded in matrigel is a
critical factor for the barrier formation. All the 3D models showed higher permeation
compared with the respective monolayer of control. In static conditions, the presence of
mucus and the less tight character between the epithelial cells contributed to the increase of
insulin permeability. Arguably, there is a remote chance of insulin take advantage of M-like
cells transcytotic capacity. It also remains the question whether the M-like cells formation
alter the tight character of Caco-2 cell monolayer.

RESULTS & DISCUSSION
67
Figure 4. 28. Apparent permeability coefficient (Papp) of insulin through the tridimensional models comprising
CCD18-Co, Caco-2 cells, HT29-MTX cells and Raji B cells. The 3D quadruple model presented the one with higher
permeation to insulin. Significant differences were analysed regarding the CCD18-Co+Matrigel®/Caco-2 model.
Results are the mean of three replicates and bars represent the standard deviation (n=3, mean ± SD); (*) denotes a
significant decrease (p<0.05).
Besides the low TEER values of the in vivo intestinal tissue, there are a plenty of other
barriers that limit the absorption of the luminal content and justify the higher ex vivo Papp
values. For instance, the drastic pH changes, the enzymatic activity, the presence of efflux
transporters are not usually replicated in standard cell culture [56].
It is worth to mention that despite the high variability between the permeability
studies of different laboratories, our date is correlated with several ex vivo data (Table 4. 4).
When compared the Papp values of the 3D quadruple model with the Papp of ex vivo data, was
concluded that the 3D quadruple model was efficient in predicting insulin permeability.
Table 4. 4. Apparent permeability coefficient (Papp × 10-6 cm/s) of insulin across rat ileum ex vivo models.
Results are the mean of three replicates ± standard deviation (n=3, mean ± SD).
Ex vivo tissue Papp (×10-6cm/s) Reference
Ileum 0.90 ± 0.10 [170]
Ileum 0.55 ± 0.06 [171]
Jejunun 0.60 ± 0.02 [171]
Jejunun 7.35 ± 1.18 [172]
4.2.8.2. FITC-Dextran permeation
After permeability studies, the integrity of the membrane was assessed by permeating
a 4 kDa small fluorescent molecule that follows the paracellular route of transport to

RESULTS & DISCUSSION
68
transverse the epithelial layer. FITC-Dextran crosses the cell layer through passive
paracellular transport being a good indicative of the integrity of the membrane [173]. As
observed in Fig. 4. 29, after the drug transport assays, all of the models retained the FITC-
Dextran above 70%, with exception of CCD18-Co monolayer. The percentage of rejection
regards the amount of molecule that the barrier retains in the apical side. This integrity
studies showed that insulin had not negative repercussions in the membrane and that the
tight junctions opening was reversible.
A B
C
Figure 4. 29. 4 kDa FITC-Dextran permeability after 4 hours of permeability studies to assess the membrane
integrity. Results are the mean of three replicates ± standard deviation (n=3, mean ± SD).
Overall, the 3D quadruple model comprising CCD18-Co intestinal myofibroblasts, Caco-
2, HT29-MTX and M-like epithelial cells was morphologically and functionally characterized.

RESULTS & DISCUSSION
69
CHAPTER V
CONCLUDING REMARKS AND
FUTURE PERSPECTIVES


CONCLUDING REMARKS & FUTURE PERSPECTIVES
71
The herein work is motivated in satisfy the current needs of the drug development
field. ‘Petri-dish’-based models are limiting the potential of predict cellular responses of real
organisms as they do not replicate the architecture and the mechanisms representative of a
living tissue. Based on the Caco-2 gold standard model, we launched the challenge of create a
third dimension that could bridge the gap between cell culture models and live intestinal
tissues. In this sense, a 3D co-culture model comprising CCD18-Co intestinal myofibroblasts,
Caco-2, HT29-MTX and Raji B cells was established. Beyond the fact that Caco-2 cells
resembles the main features of enterocytes, this model is valued by the presence of HT29-
MTX mucus producing cells in the same proportions found in vivo and M-like cells, an
important player in the process of drug absorption owing a high transcytotic capacity.
Moreover, the scenario of interdependency between stromal and epithelial cells was
evaluated as mean to dissect their role in the barrier formation.
By exploring the behaviour of CCD18-Co cells in a 3D matrix through cell viability,
metabolic activity, proliferation and morphological assays, 1×10⁴ cells/cm2 showed to be the
cell density better adapted for 21 days of culture, period necessary to fully differentiate the
Caco-2 cells. Added to that, CCD18-Co cells proved to be active in the modulation the
surrounding Matrigel matrix through the production of fibronectin. This newly-formed matrix
exerts a supportive role in the maintenance of the epithelial cells onto CCD18-Co cells. This
event was the bottom line to establish a 3D model that resembles the native mucosa.
The barrier functionality is essential for purposes of absorption or permeation studies.
The formation of a tightly-knit monolayer between all the cell types is determinant for the
validation of results in permeability assays. Caco-2 cells form a tight polarized monolayer
resulting in the highest TEER values. Even though Caco-2 and HT29-MTX cells establish tight
junctions between each other, they present structural variability, resulting in a decrease of
TEER values. Regarding the interactions between M-like cells and the Caco-2 and HT29-MTX
cells, little is known. But the models comprising M-like cells registered a decrease in TEER
values, which was probably due to the transformation of phenotype of Caco-2 cells into cells
with M-phenotype. Nonetheless, this assumption requires further studies namely the
identification soluble factors responsible for the phenotype induction and TJ strength.
Discriminate Caco-2 and HT29-MTX cells is difficult due to their similar morphology.
Notwithstanding, HT29-MTX cells were distinctly identified by transmission electron
microscopy (TEM) exhibiting the intracellular presence of mucin granules. Evidences of
mucin-filled granules were found to richly cover the epithelial surface. Morphologically
distinct from enterocytes, M cells display poorly organized brush border with short irregular
microvilli. Even though trigger M-like cells have revealing a challenge because of the
inexistence of a distinct cell marker, the lack of microvilli was still the best cue to identify
these cells. Alkaline phosphatase is an excellent marker of crypt-villus differentiation, since
ALP of Caco-2 cells have identical sequence and similar biochemical characteristics compared
to the intestinal alkaline phosphatase (IAP). M cells exhibit down-regulation of alkaline
phosphatase activity. However, there are no in vitro evidences of down-regulation of this

CONCLUDING REMARKS AND FUTURE PERSPECTIVES
72
enzyme upon the phenotypic transformation. Therefore, the sensitivity of ALP assay to trigger
the existence of M-like cells is doubtful and further assays are required.
The utmost importance of this work points to the sustainable results that the present
model returned, supporting the successfully establishment of a barrier model reliable for the
study of drug permeability. The 3D quadruple model (CCD18-Co+Matrigel/Caco-2/HT29-
MTX/Raji B) was efficient in the prediction of insulin permeability when compared with
several ex vivo models. Overall, the less tight character between the epithelial cells, the
presence of mucus and M-like cells were determinant factors in the transport of insulin.
After 4 hours of permeability studies, 4 kDa FITC-Dextran molecule was retained on its
majority by the barrier models, with exception of CCD18-Co monocultures, revealing that
tight junctions opening was reversible and insulin did not have negative repercussions on the
model integrity.
Finally, as future perspectives is imperative to understand how to control the
thickness of the fibroblastic layer and quantify the amount of other ECM components.
Concerning the variety of epithelial cells, it is also necessary to assess the final proportion of
all the cell types in culture and understand how the presence of other epithelial cells (HT29-
MTX and M-like cells) can influence Caco-2 cells differentiation. The mechanisms by which
insulin cross the Caco-2/Raji B models are not fully understood. It remains to explore the TJ
strength between Caco-2 and M-like cells and the contribution of the transcytotic route
through M-like cells in the transport of insulin. To accomplish the undoubtful identification of
M-like cells will be explored other cell markers. With this, we will be able to understand how
the initial cell density of Raji B cells affects the amount of M-like cells. Finally, is necessary
to test a higher number of compounds with different BCS properties and correlate these
results with in vivo experiments.

CONCLUDING REMARKS & FUTURE PERSPECTIVES
73
CHAPTER VI
REFERENCES

REFERENCES
74
REFERENCES
75
[1]. A. M. Mowat, Anatomical basis of tolerance and immunity to intestinal antigens. Nature, 2003, 3 (4), 331-341.
[2]. P. Castro-Sanchez,J. M. Martin-Villa, Gut immune system and oral tolerance. The British Journal of Nutrition, 2013, 109 Suppl 2, S3-11.
[3]. Praveen V. Balimane,Saeho Chong, Cell culture-based models for intestinal permeability: a critique. Drug Discovery Today, 2005, 10 (5), 335-343.
[4]. C. Crosnier, D. Stamataki,J. Lewis, Organizing cell renewal in the intestine: stem cells, signals and combinatorial control. Nature, 2006, 7 (5), 349-359.
[5]. Laurens G. van der Flier,Hans Clevers, Stem cells, self-renewal, and differentiation in the intestinal epithelium. Annual Review of Physiology, 2009, 71, 241-260.
[6]. T. Nakamura, K. Tsuchiya,M. Watanabe, Crosstalk between Wnt and Notch signaling in intestinal epithelial cell fate decision. Journal of Gastroenterology, 2007, 42 (9), 705-710.
[7]. T. H. Yen,N. A. Wright, The gastrointestinal tract stem cell niche. Stem Cell Reviews, 2006, 2 (3), 203-212.
[8]. N. A. Mabbott, D. S. Donaldson, H. Ohno, I. R. Williams,A. Mahajan, Microfold (M) cells: important immunosurveillance posts in the intestinal epithelium. Mucosal Immunology, 2013, 6 (4), 666-677.
[9]. F. Gerbe, C. Legraverend,P. Jay, The intestinal epithelium tuft cells: specification and function. Cell and Molecular Life Sciences, 2012, 69 (17), 2907-2917.
[10]. Y. Fujimura,M. Iida, A new marker for cup cells in the rabbit small intestine: expression of vimentin intermediate filament protein. Medical Electron Microscopy, 2001, 34 (4), 223-229.
[11]. P. de Santa Barbara, G. R. van den Brink,D. J. Roberts, Development and differentiation of the intestinal epithelium. Cell and Molecular Life Sciences, 2003, 60 (7), 1322-1332.
[12]. Lance W. Peterson,David Artis, Intestinal epithelial cells: regulators of barrier function and immune homeostasis. Nature, 2014, 14 (3), 141-153.
[13]. T. Ayabe, T. Ashida, Y. Kohgo,T. Kono, The role of Paneth cells and their antimicrobial peptides in innate host defense. Trends in Microbiology, 2004, 12 (8), 394-398.
[14]. E. M. Porter, C. L. Bevins, D. Ghosh,T. Ganz, The multifaceted Paneth cell. Cellular and Molecular Life Sciences, 2002, 59 (1), 156-170.
[15]. Ann L. Daugherty,Randall J. Mrsny, Transcellular uptake mechanisms of the intestinal epithelial barrier Part one. Pharmaceutical Science & Technology Today, 1999, 2 (4), 144-151.
[16]. L. J. Hathaway,J. P. Kraehenbuhl, The role of M cells in mucosal immunity. Cellular and Molecular Life Sciences, 2000, 57 (2), 323-332.
[17]. L. H. Makala, N. Suzuki,H. Nagasawa, Peyer's patches: organized lymphoid structures for the induction of mucosal immune responses in the intestine. Pathobiology, 2002, 70 (2), 55-68.

REFERENCES
76
[18]. C. Jung, J. P. Hugot,F. Barreau, Peyer's Patches: The Immune Sensors of the Intestine. International Journal of Inflamation, 2010.
[19]. David J. Brayden, Mark A. Jepson,Alan W. Baird, Keynote review: Intestinal Peyer's patch M cells and oral vaccine targeting. Drug Discovery Today, 2005, 10 (17), 1145-1157.
[20]. P. C. Tyrer, A. Ruth Foxwell, J. M. Kyd, D. C. Otczyk,A. W. Cripps, Receptor mediated targeting of M-cells. Vaccine, 2007, 25 (16), 3204-3209.
[21]. Anne des Rieux, Eva G. E. Ragnarsson, Elisabet Gullberg, Véronique Préat, Yves-Jacques Schneider,Per Artursson, Transport of nanoparticles across an in vitro model of the human intestinal follicle associated epithelium. European Journal of Pharmaceutical Sciences, 2005, 25 (4–5), 455-465.
[22]. M. Ann Clark, Barry H. Hirst,Mark A. Jepson, Lectin-mediated mucosal delivery of drugs and microparticles. Adv Drug Deliv Rev, 2000, 43 (2–3), 207-223.
[23]. Takashi Kanaya, Hisashi Aso, Kohtaro Miyazawa, Taketomo Kido, Takeshi Minashima, Kouichi Watanabe, Shyuichi Ohwada, Haruki Kitazawa, Michael T Rose,Takahiro Yamaguchi, Staining patterns for actin and villin distinguish M-cells in bovine follicle-associated epithelium. Research in Veterinary Science, 2007, 82, 141-149.
[24]. S. C. Corr, C. C. Gahan,C. Hill, M-cells: origin, morphology and role in mucosal immunity and microbial pathogenesis. FEMS Immunology and Medical Microbiology, 2008, 52 (1), 2-12.
[25]. N. A. Wong, M. Herriot,F. Rae, An immunohistochemical study and review of potential markers of human intestinal M cells. European Journal of Histochemistry, 2003, 47 (2), 143-150.
[26]. T. Sato, R. G. Vries, H. J. Snippert, M. van de Wetering, N. Barker, D. E. Stange, J. H. van Es, A. Abo, P. Kujala, P. J. Peters,H. Clevers, Single Lgr5 stem cells build crypt-villus structures in vitro without a mesenchymal niche. Nature, 2009, 459 (7244), 262-265.
[27]. K. A. Knoop, N. Kumar, B. R. Butler, S. K. Sakthivel, R. T. Taylor, T. Nochi, H. Akiba, H. Yagita, H. Kiyono,I. R. Williams, RANKL is necessary and sufficient to initiate development of antigen-sampling M cells in the intestinal epithelium. Journal of Immunology, 2009, 183 (9), 5738-5747.
[28]. W. de Lau, P. Kujala, K. Schneeberger, S. Middendorp, V. S. Li, N. Barker, A. Martens, F. Hofhuis, R. P. DeKoter, P. J. Peters, E. Nieuwenhuis,H. Clevers, Peyer's patch M cells derived from Lgr5(+) stem cells require SpiB and are induced by RankL in cultured "miniguts". Molecular Cell Biology, 2012, 32 (18), 3639-3647.
[29]. A. Iwasaki,B. L. Kelsall, Localization of distinct Peyer's patch dendritic cell subsets and their recruitment by chemokines macrophage inflammatory protein (MIP)-3alpha, MIP-3beta, and secondary lymphoid organ chemokine. The Journal of Experimental Medicine, 2000, 191 (8), 1381-1394.
[30]. S. Westphal, A. Lugering, J. von Wedel, C. von Eiff, C. Maaser, T. Spahn, G. Heusipp, M. A. Schmidt, H. Herbst, I. R. Williams, W. Domschke,T. Kucharzik, Resistance of chemokine receptor 6-deficient mice to Yersinia enterocolitica infection: evidence of defective M-cell formation in vivo. American Journal of Pathology, 2008, 172 (3), 671-680.

REFERENCES
77
[31]. M. Ebisawa, K. Hase, D. Takahashi, H. Kitamura, K. A. Knoop, I. R. Williams,H. Ohno, CCR6hiCD11c(int) B cells promote M-cell differentiation in Peyer's patch. International Immunology, 2011, 23 (4), 261-269.
[32]. J. Wang, V. Gusti, A. Saraswati,D. D. Lo, Convergent and divergent development among M cell lineages in mouse mucosal epithelium. Journal of Immunology, 2011, 187 (10), 5277-5285.
[33]. M. Rumbo, F. Sierro, N. Debard, J. P. Kraehenbuhl,D. Finke, Lymphotoxin beta receptor signaling induces the chemokine CCL20 in intestinal epithelium. Gastroenterology, 2004, 127 (1), 213-223.
[34]. P. D. Rennert, J. L. Browning, R. Mebius, F. Mackay,P. S. Hochman, Surface lymphotoxin alpha/beta complex is required for the development of peripheral lymphoid organs. The Journal of Experimental Medicine, 1996, 184 (5), 1999-2006.
[35]. D. D. McCarthy, L. Summers-Deluca, F. Vu, S. Chiu, Y. Gao,J. L. Gommerman, The lymphotoxin pathway: beyond lymph node development. Immunologic Research, 2006, 35 (1-2), 41-54.
[36]. Nathalie Debard, Frédéric Sierro, Jeffrey Browning,Jean–Pierre Kraehenbuhl, Effect of mature lymphocytes and lymphotoxin on the development of the follicle-associated epithelium and M cells in mouse Peyer's patches. Gastroenterology, 2001, 120 (5), 1173-1182.
[37]. C. Nicoletti, Unsolved mysteries of intestinal M cells. Gut, 2000, 47 (5), 735-739.
[38]. A. Gebert, S. Fassbender, K. Werner,A. Weissferdt, The development of M cells in Peyer's patches is restricted to specialized dome-associated crypts. The American Journal of Pathology, 1999, 154 (5), 1573-1582.
[39]. D. W. Powell, I. V. Pinchuk, J. I. Saada, X. Chen,R. C. Mifflin, Mesenchymal cells of the intestinal lamina propria. Annual Review of Physiology, 2011, 73, 213-237.
[40]. C. Fritsch, V. Orian-Rousseaul, O. Lefebvre, P. Simon-Assmann, J. M. Reimund, B. Duclos,M. Kedinger, Characterization of human intestinal stromal cell lines: response to cytokines and interactions with epithelial cells. Experimental Cell Research, 1999, 248 (2), 391-406.
[41]. C. Birchmeier, D. Meyer,D. Riethmacher, Factors controlling growth, motility, and morphogenesis of normal and malignant epithelial cells. International Review of Cytology, 1995, 160, 221-266.
[42]. D. W. Powell, P. A. Adegboyega, J. F. Di Mari,R. C. Mifflin, Epithelial cells and their neighbors I. Role of intestinal myofibroblasts in development, repair, and cancer. American Journal of Physiology. Gastrointestinal and Liver Physiology, 2005, 289 (1), G2-7.
[43]. I. V. Pinchuk, R. C. Mifflin, J. I. Saada,D. W. Powell, Intestinal mesenchymal cells. Current Gastroenterology Reports, 2010, 12 (5), 310-318.
[44]. B. Eyden, The myofibroblast: phenotypic characterization as a prerequisite to understanding its functions in translational medicine. Journal of Cellular and Molecular Medicine, 2008, 12 (1), 22-37.
[45]. S. Furuya,K. Furuya, Subepithelial fibroblasts in intestinal villi: roles in intercellular communication. International Review of Cytology, 2007, 264, 165-223.

REFERENCES
78
[46]. R. C. Mifflin, I. V. Pinchuk, J. I. Saada,D. W. Powell, Intestinal myofibroblasts: targets for stem cell therapy. American Journal of Physiology. Gastrointestinal and Liver Physiology, 2011, 300 (5), G684-696.
[47]. N. C. Joyce, M. F. Haire,G. E. Palade, Morphologic and biochemical evidence for a contractile cell network within the rat intestinal mucosa. Gastroenterology, 1987, 92 (1), 68-81.
[48]. D. W. Powell, R. C. Mifflin, J. D. Valentich, S. E. Crowe, J. I. Saada,A. B. West, Myofibroblasts. II. Intestinal subepithelial myofibroblasts. American Journal of Physiology, 1999, 277 (2 Pt 1), C183-201.
[49]. N. Y. Lei, Z. Jabaji, J. Wang, V. S. Joshi, G. J. Brinkley, H. Khalil, F. Wang, A. Jaroszewicz, M. Pellegrini, L. Li, M. Lewis, M. Stelzner, J. C. Dunn,M. G. Martin, Intestinal subepithelial myofibroblasts support the growth of intestinal epithelial stem cells. PLoS One, 2014, 9 (1), e84651.
[50]. Brian C. McKaig, Shavcharn S. Makh, Christopher J. Hawkey, Daniel K. Podolsky,Yashwant R. Mahida, Normal human colonic subepithelial myofibroblasts enhance epithelial migration (restitution) via TGF-beta3. American Journal of Physiology, 1999, 276 (5 Pt 1), G1087-1093.
[51]. N. Lahar, N. Y. Lei, J. Wang, Z. Jabaji, S. C. Tung, V. Joshi, M. Lewis, M. Stelzner, M. G. Martin,J. C. Dunn, Intestinal subepithelial myofibroblasts support in vitro and in vivo growth of human small intestinal epithelium. PLoS One, 2011, 6 (11), e26898.
[52]. J. R. Turner, Intestinal mucosal barrier function in health and disease. Nature, 2009, 9 (11), 799-809.
[53]. Mei-Chin Chen, Kiran Sonaje, Ko-Jie Chen,Hsing-Wen Sung, A review of the prospects for polymeric nanoparticle platforms in oral insulin delivery. Biomaterials, 2011, 32 (36), 9826-9838.
[54]. P. Artursson, S. Neuhoff, P. Matsson,S. Tavelin, 5.11 - Passive Permeability and Active Transport Models for the Prediction of Oral Absorption, in Comprehensive Medicinal Chemistry II, B. Taylor Editors-in-Chief: John and J. Triggle David, Editors. 2007, Elsevier: Oxford. p. 259-278.
[55]. Y. Yun, Y. W. Cho,K. Park, Nanoparticles for oral delivery: targeted nanoparticles with peptidic ligands for oral protein delivery. Adv Drug Deliv Rev, 2013, 65 (6), 822-832.
[56]. C. B. Woitiski, R. A. Carvalho, A. J. Ribeiro, R. J. Neufeld,F. Veiga, Strategies toward the improved oral delivery of insulin nanoparticles via gastrointestinal uptake and translocation. BioDrugs: clinical immunotherapeutics, biopharmaceuticals and gene therapy, 2008, 22 (4), 223-237.
[57]. E. Hayakawa,V. H. Lee, Aminopeptidase activity in the jejunal and ileal Peyer's patches of the albino rabbit. Pharm Res, 1992, 9 (4), 535-540.
[58]. B. Corthesy, Multi-faceted functions of secretory IgA at mucosal surfaces. Frontiers in Immunology, 2013, 4, 185.
[59]. N. J. Mantis, N. Rol,B. Corthesy, Secretory IgA's complex roles in immunity and mucosal homeostasis in the gut. Mucosal Immunology, 2011, 4 (6), 603-611.
[60]. Josias H. Hamman, Gill M. Enslin,Awie F. Kotzé, Oral delivery of peptide drugs: barriers and developments. Biodrugs: Clinical Immunotherapeutics, Biopharmaceuticals and Gene Therapy, 2005, 19 (3), 165-177.

REFERENCES
79
[61]. C. Atuma, V. Strugala, A. Allen,L. Holm, The adherent gastrointestinal mucus gel layer: thickness and physical state in vivo. American Journal of Physiology - Gastrointestinal and Liver Physiology, 2001, 280 (5), G922-G929.
[62]. R. A. Cone, Barrier properties of mucus. Advanced Drug Delivery Reviews, 2009, 61 (2), 75-85.
[63]. L. M. Ensign, R. Cone,J. Hanes, Oral drug delivery with polymeric nanoparticles: the gastrointestinal mucus barriers. Adv Drug Deliv Rev, 2012, 64 (6), 557-570.
[64]. Terry R. Stouch,Olafur Gudmundsson, Progress in understanding the structure–activity relationships of P-glycoprotein. Advanced Drug Delivery Reviews, 2002, 54 (3), 315-328.
[65]. Giovanni M. Pauletti, Sanjeev Gangwar, Gregory T. Knipp, Manoj M. Nerurkar, Franklin W. Okumu, Kiyoshi Tamura, Teruna J. Siahaan,Ronald T. Borchardt, Structural requirements for intestinal absorption of peptide drugs. Journal of Controlled Release, 1996, 41 (1–2), 3-17.
[66]. Y. Zhang,L. Z. Benet, The gut as a barrier to drug absorption: combined role of cytochrome P450 3A and P-glycoprotein. Clin Pharmacokinet, 2001, 40 (3), 159-168.
[67]. L. Z. Benet,C. L. Cummins, The drug efflux-metabolism alliance: biochemical aspects. Advanced Drug Deliv Reviews, 2001, 50 Suppl 1, S3-11.
[68]. A. S. Darwich, S. Neuhoff, M. Jamei,A. Rostami-Hodjegan, Interplay of metabolism and transport in determining oral drug absorption and gut wall metabolism: a simulation assessment using the "Advanced Dissolution, Absorption, Metabolism (ADAM)" model. Current Drug Metabolism, 2010, 11 (9), 716-729.
[69]. Alessio Fasano, Innovative strategies for the oral delivery of drugs and peptides. Trends in Biotechnology, 1998, 16 (4), 152-157.
[70]. James Blanchette, Nikhil Kavimandan,Nicholas A. Peppas, Principles of transmucosal delivery of therapeutic agents. Biomedicine & Pharmacotherapy, 2004, 58 (3), 142-151.
[71]. Laurence Plapied, Nicolas Duhem, Anne des Rieux,Véronique Préat, Fate of polymeric nanocarriers for oral drug delivery. Current Opinion in Colloid & Interface Science, 2011, 16 (3), 228-237.
[72]. T. Iversen, T. Skotland,K. Sandvig, Endocytosis and intracellular transport of nanoparticles: Present knowledge and need for future studies. Nano Today, 2011, 6 (2), 176-185.
[73]. K. Sugano, M. Kansy, P. Artursson, A. Avdeef, S. Bendels, L. Di, G. F. Ecker, B. Faller, H. Fischer, G. Gerebtzoff, H. Lennernaes,F. Senner, Coexistence of passive and carrier-mediated processes in drug transport. Nature Reviews.Drug Discovery., 2010, 9 (8), 597-614.
[74]. P. W. Swaan, Recent advances in intestinal macromolecular drug delivery via receptor-mediated transport pathways. Pharm Res, 1998, 15 (6), 826-834.
[75]. A. T. Florence, Issues in oral nanoparticle drug carrier uptake and targeting. J Drug Target, 2004, 12 (2), 65-70.
[76]. Ann M. Clark, Mark A. Jepson,Barry H. Hirst, Exploiting M cells for drug and vaccine delivery. Adv Drug Deliv Rev, 2001, 50 (1–2), 81-106.

REFERENCES
80
[77]. F. Antunes, F. Andrade, D. Ferreira, H. M. Nielsen,B. Sarmento, Models to predict intestinal absorption of therapeutic peptides and proteins. Current Drug Metabolism, 2013, 14 (1), 4-20.
[78]. Barry Press,Deanna Di Grandi, Permeability for intestinal absorption: Caco-2 assay and related issues. Current Drug Metabolism, 2008, 9 (9), 893-900.
[79]. E. Le Ferrec, C. Chesne, P. Artusson, D. Brayden, G. Fabre, P. Gires, F. Guillou, M. Rousset, W. Rubas,M. L. Scarino, In vitro models of the intestinal barrier. The report and recommendations of ECVAM Workshop 46. European Centre for the Validation of Alternative methods. Alternatives to Laboratory Animals, 2001, 29 (6), 649-668.
[80]. H. Waterbeemd,E. Gifford, ADMET in silico moddeling: towards prediction paradise? Nature, 2003, 2, 192-204.
[81]. Anna-Lena B. Ungell, Caco-2 replace or refine? Drug Discovery Today:Technologies, 2004, 1 (4), 423-430.
[82]. H. Bohets, P. Annaert, G. Mannens, L. Van Beijsterveldt, K. Anciaux, P. Verboven, W. Meuldermans,K. Lavrijsen, Strategies for absorption screening in drug discovery and development. Current Topics in Medicinal Chemistry, 2001, 1 (5), 367-383.
[83]. S. C. Sutton, Companion animal physiology and dosage form performance. Adv Drug Deliv Rev, 2004, 56 (10), 1383-1398.
[84]. X. Cao, S. T. Gibbs, L. Fang, H. A. Miller, C. P. Landowski, H. C. Shin, H. Lennernas, Y. Zhong, G. L. Amidon, L. X. Yu,D. Sun, Why is it challenging to predict intestinal drug absorption and oral bioavailability in human using rat model. Pharm Res, 2006, 23 (8), 1675-1686.
[85]. N. Gardner, W. Haresign, R. Spiller, N. Farraj, J. Wiseman, H. Norbury,L. Illum, Development and validation of a pig model for colon-specific drug delivery. The Journal of Pharmacy and Pharmacology, 1996, 48 (7), 689-693.
[86]. J. Fogh, T. Orfeo, J. Tiso,F. E. Sharkey, Establishment of human colon carcinoma lines in nude mice. Experimental Cell Biology, 1979, 47 (2), 136-144.
[87]. I. J. Hidalgo, Assessing the absorption of new pharmaceuticals. Current Topics In Medicinal Chemistry, 2001, 1 (5), 385-401.
[88]. P. Simon-Assman, N. Turck, M. Sidhoum-Jenny, G. Gradwohl,M. Kedinger, In vitro models of intestinal epithelial cell differentiation. Cell Biology and Toxicology, 2007, 23 (4), 241-256.
[89]. N. Maubon, M. Le Vee, L. Fossati, M. Audry, E. Le Ferrec, S. Bolze,O. Fardel, Analysis of drug transporter expression in human intestinal Caco-2 cells by real-time PCR. Fundamental & Clinical Pharmacology, 2007, 21 (6), 659-663.
[90]. Anna-Lena Ungell,Johan Karlsson, Cell Cultures in Drug Discovery: An Industrial Perspective, in Drug Bioavailability. 2004, Wiley-VCH Verlag GmbH & Co. KGaA. p. 90-131.
[91]. H. Sun, E. C. Chow, S. Liu, Y. Du,K. S. Pang, The Caco-2 cell monolayer: usefulness and limitations. Expert Opinion on Drug Metabolism and Toxicology, 2008, 4 (4), 395-411.
[92]. M. D. Hämäläinen,A. Frostell-Karlsson, Predicting the intestinal absorption potential of hits and leads. Drug Discovery Today: Technologies, 2004, 1 (4), 397-405.

REFERENCES
81
[93]. Y. Sambuy, I. De Angelis, G. Ranaldi, M. L. Scarino, A. Stammati,F. Zucco, The Caco-2 cell line as a model of the intestinal barrier: influence of cell and culture-related factors on Caco-2 cell functional characteristics. Cell Biology and Toxicology, 2005, 21 (1), 1-26.
[94]. P. Artursson,J. Karlsson, Correlation between oral drug absorption in humans and apparent drug permeability coefficients in human intestinal epithelial (Caco-2) cells. Biochemical and Biophysical Research Communications, 1991, 175 (3), 880-885.
[95]. P. Artursson, Cell cultures as models for drug absorption across the intestinal mucosa. Critical Reviews in Therapeutic Drug Carrier Systems, 1991, 8 (4), 305-330.
[96]. P. Artursson, K. Palm,K. Luthman, Caco-2 monolayers in experimental and theoretical predictions of drug transport. Advanced Drug Delivery Reviews, 2001, 46 (1–3), 27-43.
[97]. J. D. Irvine, L. Takahashi, K. Lockhart, J. Cheong, J. W. Tolan, H. E. Selick,J. R. Grove, MDCK (Madin-Darby canine kidney) cells: A tool for membrane permeability screening. J Pharm Sci, 1999, 88 (1), 28-33.
[98]. D. A. Volpe, Drug-permeability and transporter assays in Caco-2 and MDCK cell lines. Future Medical Chemistry, 2011, 3 (16), 2063-2077.
[99]. M. C. Gres, B. Julian, M. Bourrie, V. Meunier, C. Roques, M. Berger, X. Boulenc, Y. Berger,G. Fabre, Correlation between oral drug absorption in humans, and apparent drug permeability in TC-7 cells, a human epithelial intestinal cell line: comparison with the parental Caco-2 cell line. Pharm Res, 1998, 15 (5), 726-733.
[100]. C. Pontier, J. Pachot, R. Botham, B. Lenfant,P. Arnaud, HT29-MTX and Caco-2/TC7 monolayers as predictive models for human intestinal absorption: role of the mucus layer. J Pharm Sci, 2001, 90 (10), 1608-1619.
[101]. S. T. Buckley, S. M. Fischer, G. Fricker,M. Brandl, In vitro models to evaluate the permeability of poorly soluble drug entities: challenges and perspectives. European Journal of Pharmaceutical Sciences, 2012, 45 (3), 235-250.
[102]. I. Legen, M. Salobir,J. Kerč, Comparison of different intestinal epithelia as models for absorption enhancement studies. International Journal of Pharmaceutics, 2005, 291 (1–2), 183-188.
[103]. E. Walter, S. Janich, B. J. Roessler, J. M. Hilfinger,G. L. Amidon, HT29-MTX/Caco-2 cocultures as an in vitro model for the intestinal epithelium: in vitro-in vivo correlation with permeability data from rats and humans. Journal of Pharmaceutical Sciences, 1996, 85 (10), 1070-1076.
[104]. G. J. Mahler, M. L. Shuler,R. P. Glahn, Characterization of Caco-2 and HT29-MTX cocultures in an in vitro digestion/cell culture model used to predict iron bioavailability. The Journal of Nutritional Biochemistry, 2009, 20 (7), 494-502.
[105]. Constanze Hilgendorf, Hildegard Spahn-Langguth, Carl G. Regardh, Elke Lipka, Gordon L. Amidon,Peter Langguth, Caco-2 versus Caco-2/HT29-MTX co-cultured cell lines: permeabilities via diffusion, inside- and outside-directed carrier-mediated transport. Journal of Pharmaceutical Science, 2000, 89 (1), 63-75.
[106]. Francisca Araújo,Bruno Sarmento, Towards the characterization of an in vitro triple co-culture intestine cell model for permeability studies. International Journal of Pharmaceutics, 2013, 458 (1), 128-134.
REFERENCES
82
[107]. F. Antunes, F. Andrade, F. Araújo, D. Ferreira,B. Sarmento, Establishment of a triple co-culture in vitro cell models to study intestinal absorption of peptide drugs. European Journal of Pharmaceutics and Biopharmaceutics, 2013, 83 (3), 427-435.
[108]. Christa Schimpel, Birgit Teubl, Markus Absenger, Claudia Meindl, Eleonore Fröhlich, Gerd Leitinger, Andreas Zimmer,Eva Roblegg, Development of an Advanced Intestinal in Vitro Triple Culture Permeability Model To Study Transport of Nanoparticles. Molecular Pharmaceutics, 2014, 11 (3), 808-818.
[109]. M. Miyake, H. Toguchi, T. Nishibayashi, K. Higaki, A. Sugita, K. Koganei, N. Kamada, M. T. Kitazume, T. Hisamatsu, T. Sato, S. Okamoto, T. Kanai,T. Hibi, Establishment of novel prediction system of intestinal absorption in humans using human intestinal tissues. Journal of Pharmaceutical Sciences, 2013.
[110]. Elisabet Gullberg, Maurice Leonard, Johan Karlsson, Ann M. Hopkins, David Brayden, Alan W. Baird,Per Artursson, Expression of Specific Markers and Particle Transport in a New Human Intestinal M-Cell Model. Biochemical and Biophysical Research Communications, 2000, 279 (3), 808-813.
[111]. N. Li, D. Wang, Z. Sui, X. Qi, L. Ji, X. Wang,L. Yang, Development of An Improved 3D in Vitro Intestinal Mucosa Model for Drug Absorption Evaluation. Tissue engineering. Part C, Methods, 2013.
[112]. F. Delie,W. Rubas, A human colonic cell line sharing similarities with enterocytes as a model to examine oral absorption: advantages and limitations of the Caco-2 model. Critical Reviews in Therapeutic Drug Carrier Systems, 1997, 14 (3), 221-286.
[113]. P. V. Balimane, S. Chong,R. A. Morrison, Current methodologies used for evaluation of intestinal permeability and absorption. Journal of Pharmacological and Toxicological Methods, 2000, 44 (1), 301-312.
[114]. N. Fotaki, Pros and cons of methods used for the prediction of oral drug absorption. Expert Review of Clinical Pharmacology, 2009, 2, 195-208.
[115]. U. Fagerholm, M. Johansson,H. Lennernäs, Comparison Between Permeability Coefficients in Rat and Human Jejunum. Pharmaceutical Research, 1996, 13 (9), 1336-1342.
[116]. I. J. Hidalgo, T. J. Raub,R. T. Borchardt, Characterization of the human colon carcinoma cell line (Caco-2) as a model system for intestinal epithelial permeability. Gastroenterology, 1989, 96 (3), 736-749.
[117]. Angela MacAdam, The effect of gastro-intestinal mucus on drug absorption. Adv Drug Deliv Rev, 1993, 11 (3), 201-220.
[118]. A. Beduneau, C. Tempesta, S. Fimbel, Y. Pellequer, V. Jannin, F. Demarne,A. Lamprecht, A tunable Caco-2/HT29-MTX co-culture model mimicking variable permeabilities of the human intestine obtained by an original seeding procedure. European Journal of Pharmaceutics and Biopharmaceutics, 2014.
[119]. X. M. Chen, I. Elisia,D. D. Kitts, Defining conditions for the co-culture of Caco-2 and HT29-MTX cells using Taguchi design. Journal of Pharmacological and Toxicological Methods, 2010, 61 (3), 334-342.
[120]. P. Tyrer, A. Ruth Foxwell, J. Kyd, M. Harvey, P. Sizer,A. Cripps, Validation and quantitation of an in vitro M-cell model. Biochemical and Biophysical Research Communications, 2002, 299 (3), 377-383.

REFERENCES
83
[121]. A. des Rieux, V. Fievez, I. Theate, J. Mast, V. Preat,Y. J. Schneider, An improved in vitro model of human intestinal follicle-associated epithelium to study nanoparticle transport by M cells. European Journal of Pharmaceutical Sciences, 2007, 30 (5), 380-391.
[122]. J. Forstner,G. Forstner, Gastrointestinal mucus., in Physiology of the gastrointestinal tract, Raven Press, Editor. 1994.
[123]. S. Ferruzza, C. Rossi, M. L. Scarino,Y. Sambuy, A protocol for in situ enzyme assays to assess the differentiation of human intestinal Caco-2 cells. Toxicol In Vitro, 2012, 26 (8), 1247-1251.
[124]. O. H. Lowry, N. J. Rosebrough, A. L. Farr,R. J. Randall, Protein measurement with the Folin phenol reagent. The Journal of Biological Chemistry, 1951, 193 (1), 265-275.
[125]. B. Sarmento, A. Ribeiro, F. Veiga,D. Ferreira, Development and validation of a rapid reversed-phase HPLC method for the determination of insulin from nanoparticulate systems. Biomed Chromatogr, 2006, 20 (9), 898-903.
[126]. Bradley A. Justice, Nadia A. Badr,Robin A. Felder, 3D cell culture opens new dimensions in cell-based assays. Drug Discovery Today, 2009, 14 (1–2), 102-107.
[127]. Francesco Pampaloni, Emmanuel G. Reynaud,Ernst H. K. Stelzer, The third dimension bridges the gap between cell culture and live tissue. Nature Reviews Molecular Cell Biology, 2007, 8 (10), 839-845.
[128]. K. M. Hakkinen, J. S. Harunaga, A. D. Doyle,K. M. Yamada, Direct comparisons of the morphology, migration, cell adhesions, and actin cytoskeleton of fibroblasts in four different three-dimensional extracellular matrices. Tissue Engineering. Part A., 2011, 17 (5-6), 713-724.
[129]. P. Friedl,E. B. Brocker, The biology of cell locomotion within three-dimensional extracellular matrix. Cellular and Molecular Life Sciences, 2000, 57 (1), 41-64.
[130]. E. Cukierman, R. Pankov, D. R. Stevens,K. M. Yamada, Taking cell-matrix adhesions to the third dimension. Science, 2001, 294 (5547), 1708-1712.
[131]. C. M. Nelson,M. J. Bissell, Of extracellular matrix, scaffolds, and signaling: tissue architecture regulates development, homeostasis, and cancer. Annual Review of Cell and Developmental Biology, 2006, 22, 287-309.
[132]. Cristiana Branco da Cunha, Darinka D. Klumpers, Weiwei A. Li, Sandeep T. Koshy, James C. Weaver, Ovijit Chaudhuri, Pedro L. Granja,David J. Mooney, Influence of the stiffness of three-dimensional alginate/collagen-I interpenetrating networks on fibroblast biology. Biomaterials, (0).
[133]. F. Raquel Maia, Ana H. Lourenço, Pedro L. Granja, Raquel M. Gonçalves,Cristina C. Barrias, Effect of Cell Density on Mesenchymal Stem Cells Aggregation in RGD-Alginate 3D Matrices under Osteoinductive Conditions. Macromolecular Bioscience, 2014, 14 (6), 759-771.
[134]. A. Puliafito, L. Hufnagel, P. Neveu, S. Streichan, A. Sigal, D. K. Fygenson,B. I. Shraiman, Collective and single cell behavior in epithelial contact inhibition. Proceedings of the National Academy of Sciences of the United States of America, 2012, 109 (3), 739-744.
[135]. C. A. Heckman, Contact inhibition revisited. Journal of Cellular Physiology, 2009, 220 (3), 574-575.

REFERENCES
84
[136]. Muhammad H. Zaman, Linda M. Trapani, Alisha L. Sieminski, Drew MacKellar, Haiyan Gong, Roger D. Kamm, Alan Wells, Douglas A. Lauffenburger,Paul Matsudaira, Migration of tumor cells in 3D matrices is governed by matrix stiffness along with cell-matrix adhesion and proteolysis. Proceedings of the National Academy of Sciences, 2006, 103 (29), 10889-10894.
[137]. Angelo J. Green,Kenneth M. Yamada, Three-dimensional microenvironments modulate fibroblast signaling responses. Adv Drug Deliv Rev, 2007, 59 (13), 1293-1298.
[138]. Rebecca G. Wells, The role of matrix stiffness in regulating cell behavior. Hepatology, 2008, 47 (4), 1394-1400.
[139]. BD Matrigel Matrix - Frequently asked questions. 2011, BD Biosciences.
[140]. H. K. Kleinman,G. R. Martin, Matrigel: basement membrane matrix with biological activity. Seminars in Cancer Biology, 2005, 15 (5), 378-386.
[141]. N. T. Kohen, L. E. Little,K. E. Healy, Characterization of Matrigel interfaces during defined human embryonic stem cell culture. Biointerphases, 2009, 4 (4), 69-79.
[142]. A. Albini, R. Benelli, D. M. Noonan,C. Brigati, The "chemoinvasion assay": a tool to study tumor and endothelial cell invasion of basement membranes. The International Journal of Development Biology, 2004, 48 (5-6), 563-571.
[143]. Angus J. Wilkinson,Peter B. Hirsch, Electron diffraction based techniques in scanning electron microscopy of bulk materials. Micron, 1997, 28 (4), 279-308.
[144]. Qing-Hua Yu,Qian Yang, Diversity of tight junctions (TJs) between gastrointestinal epithelial cells and their function in maintaining the mucosal barrier. Cell Biology International, 2009, 33 (1), 78-82.
[145]. Kathrin Benson, Sandra Cramer,Hans-Joachim Galla, Impedance-based cell monitoring: barrier properties and beyond. Fluids and Barriers of the CNS, 2013, 10 (1), 1-11.
[146]. A. MacCallum, S. P. Hardy,P. H. Everest, Campylobacter jejuni inhibits the absorptive transport functions of Caco-2 cells and disrupts cellular tight junctions. Microbiology, 2005, 151 (Pt 7), 2451-2458.
[147]. P. Simon-Assmann, F. Bouziges, C. Arnold, K. Haffen,M. Kedinger, Epithelial-mesenchymal interactions in the production of basement membrane components in the gut. Development, 1988, 102 (2), 339-347.
[148]. J. C. Adams,F. M. Watt, Regulation of development and differentiation by the extracellular matrix. Development, 1993, 117 (4), 1183-1198.
[149]. Marilyn G. Farquhar,George E. Palade, Junctional Complexes in Various Epithelia. Journal of Cell Biology, 1963, 17 (2), 375-412.
[150]. S. F. Assimakopoulos, I. Papageorgiou,A. Charonis, Enterocytes' tight junctions: From molecules to diseases. World Journal of Gastrointestinal Pathophysiology, 2011, 2 (6), 123-137.
[151]. J. M. Anderson,C. M. Van Itallie, Physiology and function of the tight junction. Cold Spring Harbor Perspectives in Biology, 2009, 1 (2), a002584.
[152]. Y. S. Kim,S. B. Ho, Intestinal goblet cells and mucins in health and disease: recent insights and progress. Current Gastroenterology Reports, 2010, 12 (5), 319-330.

REFERENCES
85
[153]. M. A. Clark,B. H. Hirst, Expression of junction-associated proteins differentiates mouse intestinal M cells from enterocytes. Histochemistry and Cell Biology, 2002, 118 (2), 137-147.
[154]. A. Gebert,H. Bartels, Occluding junctions in the epithelia of the gut-associated lymphoid tissue (GALT) of the rabbit ileum and caecum. Cell and Tissue Research, 1991, 266 (2), 301-314.
[155]. K. Fukui, T. Hada, H. Imanishi, W. Liu, A. Iwasaki, K. Hirano,K. Higashino, The tumor-derived fetal-intestinal alkaline phosphatase cDNA is identical in sequence to the adult intestinal alkaline phosphatase isozyme gene. Clinica Chimica Acta, 1997, 265 (1), 57-63.
[156]. H. Matsumoto, R. H. Erickson, J. R. Gum, M. Yoshioka, E. Gum,Y. S. Kim, Biosynthesis of alkaline phosphatase during differentiation of the human colon cancer cell line Caco-2. Gastroenterology, 1990, 98 (5 Pt 1), 1199-1207.
[157]. R. A. Hodin, S. M. Chamberlain,S. Meng, Pattern of rat intestinal brush-border enzyme gene expression changes with epithelial growth state. The American Journal of Physiology, 1995, 269 (2 Pt 1), C385-391.
[158]. S. Ferruzza, C. Rossi, M. L. Scarino,Y. Sambuy, A protocol for differentiation of human intestinal Caco-2 cells in asymmetric serum-containing medium. Toxicol In Vitro, 2012, 26 (8), 1252-1255.
[159]. N. J. Kavimandan,N. A. Peppas, Confocal microscopic analysis of transport mechanisms of insulin across the cell monolayer. International Journal of Pharmaceutics, 2008, 354 (1-2), 143-148.
[160]. C. Tang, J. Yu, L. Yin, C. Yin,Y. Pei, Transport of insulin in modified Valia-Chien chambers and Caco-2 cell monolayers. Drug Dev Ind Pharm, 2007, 33 (4), 449-456.
[161]. M. Bendayan, E. Ziv, D. Gingras, R. Ben-Sasson, H. Bar-On,M. Kidron, Biochemical and morpho-cytochemical evidence for the intestinal absorption of insulin in control and diabetic rats. Comparison between the effectiveness of duodenal and colon mucosa. Diabetologia, 1994, 37 (2), 119-126.
[162]. M. Bendayan, E. Ziv, R. Ben-Sasson, H. Bar-On,M. Kidron, Morpho-cytochemical and biochemical evidence for insulin absorption by the rat ileal epithelium. Diabetologia, 1990, 33 (4), 197-204.
[163]. JaneP F. Bai,L. L. Chang, Transepithelial Transport of Insulin: I. Insulin Degradation by Insulin-Degrading Enzyme in Small Intestinal Epithelium. Pharm Res, 1995, 12 (8), 1171-1175.
[164]. R. L. Gingerich, W. R. Gilbert, P. G. Comens,J. R. Gavin, 3rd, Identification and characterization of insulin receptors in basolateral membranes of dog intestinal mucosa. Diabetes, 1987, 36 (10), 1124-1129.
[165]. N. Gallo-Payet,J. S. Hugon, Insulin receptors in isolated adult mouse intestinal cells: studies in vivo and in organ culture. Endocrinology, 1984, 114 (5), 1885-1892.
[166]. D. J. Pillion, V. Ganapathy,F. H. Leibach, Identification of insulin receptors on the mucosal surface of colon epithelial cells. The Journal of Biological Chemistry, 1985, 260 (9), 5244-5247.
[167]. A. M. Sadeghi, F. A. Dorkoosh, M. R. Avadi, M. Weinhold, A. Bayat, F. Delie, R. Gurny, B. Larijani, M. Rafiee-Tehrani,H. E. Junginger, Permeation enhancer effect of chitosan and chitosan derivatives: comparison of formulations as soluble polymers and

REFERENCES
86
nanoparticulate systems on insulin absorption in Caco-2 cells. European Journal of Pharmaceutics and Biopharmaceutics, 2008, 70 (1), 270-278.
[168]. D. A. Carr,N. A. Peppas, Assessment of poly(methacrylic acid-co-N-vinyl pyrrolidone) as a carrier for the oral delivery of therapeutic proteins using Caco-2 and HT29-MTX cell lines. Journal of Biomedical Materials Research. Part A., 2010, 92 (2), 504-512.
[169]. Yun Jin, Yupin Song, Xi Zhu, Dan Zhou, Chunhui Chen, Zhirong Zhang,Yuan Huang, Goblet cell-targeting nanoparticles for oral insulin delivery and the influence of mucus on insulin transport. Biomaterials, 2012, 33 (5), 1573-1582.
[170]. Lichen Yin, Jieying Ding, Chunbai He, Liming Cui, Cui Tang,Chunhua Yin, Drug permeability and mucoadhesion properties of thiolated trimethyl chitosan nanoparticles in oral insulin delivery. Biomaterials, 2009, 30 (29), 5691-5700.
[171]. L. Yin, J. Ding, L. Fei, M. He, F. Cui, C. Tang,C. Yin, Beneficial properties for insulin absorption using superporous hydrogel containing interpenetrating polymer network as oral delivery vehicles. International Journal of Pharmaceutics, 2008, 350 (1-2), 220-229.
[172]. Camile B. Woitiski, Bruno Sarmento, Rui A. Carvalho, Ronald J. Neufeld,Francisco Veiga, Facilitated nanoscale delivery of insulin across intestinal membrane models. International Journal of Pharmaceutics, 2011, 412 (1–2), 123-131.
[173]. M. Leonard, E. Creed, D. Brayden,A. W. Baird, Evaluation of the Caco-2 monolayer as
a model epithelium for iontophoretic transport. Pharm Res, 2000, 17 (10), 1181-1188.