development and characterization of gibbsite component simulant · · 2009-08-17development and...
TRANSCRIPT

PNNL-18013 WTP-RPT-176, Rev. 0
Development and Characterization of Gibbsite Component Simulant RL Russell DE Rinehart HD Smith RA Peterson January 2009
DISCLAIMER This report was prepared as an account of work sponsored by an agency of the United States Government. Neither the United States Government nor any agency thereof, nor Battelle Memorial Institute, nor any of their employees, makes any warranty, express or implied, or assumes any legal liability or responsibility for the accuracy, completeness, or usefulness of any information, apparatus, product, or process disclosed, or represents that its use would not infringe privately owned rights. Reference herein to any specific commercial product, process, or service by trade name, trademark, manufacturer, or otherwise does not necessarily constitute or imply its endorsement, recommendation, or favoring by the United States Government or any agency thereof, or Battelle Memorial Institute. The views and opinions of authors expressed herein do not necessarily state or reflect those of the United States Government or any agency thereof.
PACIFIC NORTHWEST NATIONAL LABORATORY operated by BATTELLE
for the UNITED STATES DEPARTMENT OF ENERGY under Contract DE-AC05-76RL01830.
Printed in the United States of America
Available to DOE and DOE contractors from the Office of Scientific and Technical Information,
P.O. Box 62, Oak Ridge, TN 37831-0062; ph: (865) 576-8401 fax: (865) 576 5728
email: [email protected]
Available to the public from the National Technical Information Service, U.S. Department of Commerce, 5285 Port Royal Rd., Springfield, VA 22161
ph: (800) 553-6847 fax: (703) 605-6900
email: [email protected] online ordering: http://www.ntis.gov/ordering.htm
PNNL-18013 WTP-RPT-176, Rev. 0
Development and Characterization of Gibbsite Component Simulant RL Russell DE Rinehart HD Smith RA Peterson January 2009 Test specification: 24590-PTF-TSP-RT-06-006, Rev 0 Test plan: TP-RPP-WTP-469, Rev 0 Test exceptions: None R&T focus area: Pretreatment Test Scoping Statement: None Pacific Northwest National Laboratory Richland, Washington 99352
Completeness ofTesting
This report describes the results ofwork and testing specified by Test Specification, 24590-PTF-TSP-RT-06-006, Rev 0 and Test Plan TP-RPP-WTP-469, Rev O. The work followed the quality assurance requirements outlined in the Test Specification and Test Plan. The descriptions provided in this report are an accurate account ofboth the conduct ofthe work and the data collected. Test plan results are reported. Also reported are any unusual or anomalous occurrences that are different from expected results. The test results and this report has been reviewed and verified.
Gordon H. Beeman, Manager WTP R&T Support Project
iii
Contents
Abbreviations and Acronyms ............................................................................................................... vii
Testing Summary .................................................................................................................................. ix
1.0 Introduction.................................................................................................................................. 1.1
2.0 Gibbsite Source Characterization ................................................................................................ 2.1
2.1 X-ray Diffraction (XRD) .................................................................................................... 2.1
2.2 Particle-Size Distribution.................................................................................................... 2.4
2.3 Scanning Electron Microscope (SEM) ............................................................................... 2.6
2.4 Surface Area ....................................................................................................................... 2.9
2.5 Screening Leach Test.......................................................................................................... 2.10
3.0 Determination of the Appropriate Gibbsite Simulant .................................................................. 3.1
4.0 Gibbsite Simulant Dissolution Test Matrix Results..................................................................... 4.1
5.0 Gibbsite Simulant Blend Testing ................................................................................................. 5.1
6.0 Nitrate Effect on Gibbsite Dissolution......................................................................................... 6.1
7.0 Anion Effect on Gibbsite Dissolution.......................................................................................... 7.1
8.0 Gibbsite Simulant Evaluation Against Actual Waste Results ..................................................... 8.1
9.0 Conclusions and Recommendations ............................................................................................ 9.1
10.0 References.................................................................................................................................... 10.1
11.0 Further Reading ........................................................................................................................... 11.1
Appendix A: Actual Analytical Data .................................................................................................... A.1
Appendix B: Testing Conditions........................................................................................................... B.1
Appendix C: Gibbsite Product Specifications ...................................................................................... C.1
iv
Figures
2.1. XRD Pattern of Gibbsite Sample G1 (BASF CP-5).................................................................... 2.2
2.2. XRD Pattern of Gibbsite Sample G2 (Almatis C31C)................................................................ 2.2
2.3. XRD Pattern of Gibbsite Sample G3 (Almatis H710) ................................................................ 2.3
2.4. XRD Pattern of Gibbsite Sample G4 (Almatis C333)................................................................. 2.3
2.5. XRD Pattern of Gibbsite Sample G5 (Almatis C33)................................................................... 2.4
2.6. Volume Distribution of Particle Size Plot of Gibbsite Sources................................................... 2.5
2.7. Number Distribution Particle Size Plot of the Gibbsite Sources................................................. 2.6
2.8. SEM Picture of “Gibbsite Sample G1” at 500, 1000, 5000, and 10,000 ............................ 2.7
2.9. SEM Picture of Gibbsite Sample G2 at 1000, 5000, 10,000, and 25,000 .......................... 2.7
2.10. SEM Picture of Gibbsite Sample G3 at 1000, 5000, 10,000, and 25,000 .......................... 2.8
2.11. SEM Picture of Gibbsite Sample G4 at 1000, 5000, 10,000, and 25,000 .......................... 2.8
2.12. SEM Picture of Gibbsite Sample G5 at 500, 1000, 5000, and 10,000 ............................... 2.9
2.13. Schematic Drawing of the Caustic Leaching Test Setup ............................................................ 2.10
2.14. Percent Al Dissolved in the Screening Gibbsite Leaching Test Results ..................................... 2.11
3.1. Gibbsite Simulant Crystals Compared to Actual Tank Waste Crystals at 1000 ....................... 3.2
3.2. XRD Pattern for Sample G1........................................................................................................ 3.3
3.3. XRD Pattern for Sample G4........................................................................................................ 3.3
4.1. Effect of Hydroxide Concentration on Gibbsite Dissolution. ..................................................... 4.3
4.2. Effect of Temperature on Gibbsite Dissolution........................................................................... 4.4
4.3. Mixing Effect on Gibbsite Dissolution in 1 M (MTG-7 and MTG-8) and 5 M NaOH (MTG-5 and MTG-6) at 40°C..................................................................................................... 4.5
5.1. Gibbsite Dissolution in the Blended Simulant (BSM-3 and BSM-4) ......................................... 5.3
6.1. Gibbsite Dissolution in 3 M NaOH and Nitrate Solutions .......................................................... 6.2
6.2. Gibbsite Precipitation in 3-M NaOH and Nitrate Solutions........................................................ 6.2
6.3. Gibbsite Supersaturation in 3-M NaOH and Nitrate Solutions ................................................... 6.3
7.1. Gibbsite Dissolution Results with Aluminate and Anions .......................................................... 7.2
8.1. Gibbsite Dissolution in 1 M NaOH............................................................................................. 8.2
8.2. Gibbsite Dissolution in 3 M NaOH............................................................................................. 8.2
8.3. Gibbsite Dissolution in 5 M NaOH............................................................................................. 8.3
v
Tables
S.1. Test Objectives ............................................................................................................................ ix
S.2. Results and Performance against Success Criteria ...................................................................... x
S.3. R&T Test Conditions................................................................................................................... xi
2.1. Gibbsite Sources Characterized and Tested ................................................................................ 2.1
2.2. Volume Distribution of Gibbsite Particle-Size Results............................................................... 2.5
2.3. Number Distribution of Gibbsite Particle-Size Results............................................................... 2.6
2.4. BET Surface Area of Gibbsite Samples ...................................................................................... 2.10
2.5. Screening Gibbsite Leaching Test Results .................................................................................. 2.11
4.1. Gibbsite Testing Matrix .............................................................................................................. 4.2
5.1. Supernate Composition at 3.2 M Na ........................................................................................... 5.1
5.2. Blended Component Test Matrix ................................................................................................ 5.2
6.1. Densities of Leach Solutions....................................................................................................... 6.1
7.1. Molar Concentration of Sodium Salts ......................................................................................... 7.1
8.1. Gibbsite Revision Test Matrix .................................................................................................... 8.1

vii
Abbreviations and Acronyms
BET Brunauer, Emmet, and Teller surface area measurement method
BNI Bechtel National, Incorporated
CUF cell unit filter, bench-scale crossflow filtration system
DIW de-ionized water
DOE U.S. Department of Energy
DST double-shell tank
EFRT External Flowsheet Review Team
FIZ Fachinformationszentrum
HLW high-level waste
IC ion chromatography
ICDD International Centre for Diffraction Data
ICP-AES inductively coupled plasma- atomic emission spectroscopy
ICSD Inorganic Crystal Structure Database
LANL Los Alamos National Laboratory
LAW low-activity waste
ORNL Oak Ridge National Laboratory
PEP Pretreatment Engineering Platform
PNNL Pacific Northwest National Laboratory
PSD particle-size distribution
PTF Pretreatment Facility
QAM Quality Assurance Manual
QAP quality assurance program
QARD Quality Assurance Requirements and Descriptions (document)
RPM revolutions per minute
viii
RPP River Protection Project
R&T research and technology
SARM Standard Analytical Reference Material
SEM scanning electron microscopy
SST single-shell tank
SWRI Southwest Research Institute
TRU transuranic elements
WTP Hanford Tank Waste Treatment and Immobilization Plant
XRD X-ray diffraction
ix
Testing Summary
According to Bechtel National, Inc.’s (BNI’s) Test Specification 24590-PTF-TSP-RT-06-006, Rev 0, “Simulant Development to Support the Development and Demonstration of Leaching and Ultrafiltration Pretreatment Processes,” simulants for boehmite, gibbsite, and filtration are to be developed so they can be used in subsequent bench and integrated testing of the leaching/filtration processes for the River Protection Project-Waste Treatment and Immobilization Plant (RPP-WTP). These simulants will then be used to demonstrate the leaching process and to help refine processing conditions that may impact safety basis considerations (Smith 2006). This report documents PNNL’s results of the gibbsite simulant development.
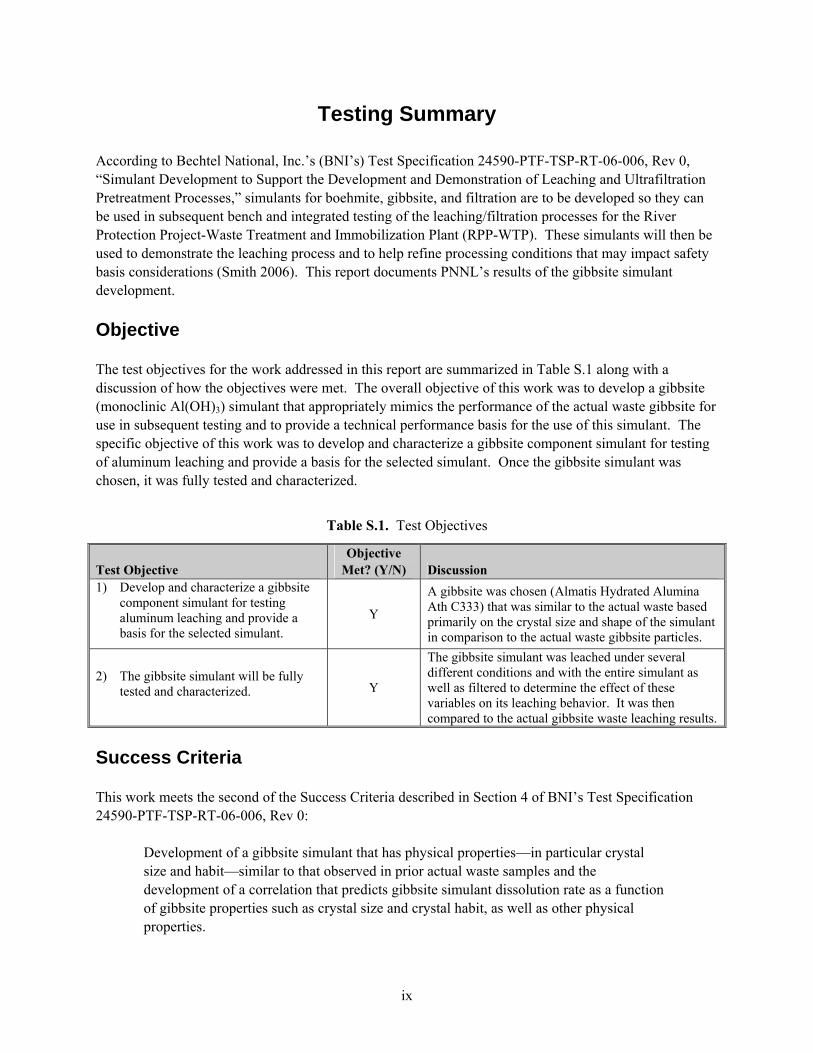
Objective The test objectives for the work addressed in this report are summarized in Table S.1 along with a discussion of how the objectives were met. The overall objective of this work was to develop a gibbsite (monoclinic Al(OH)3) simulant that appropriately mimics the performance of the actual waste gibbsite for use in subsequent testing and to provide a technical performance basis for the use of this simulant. The specific objective of this work was to develop and characterize a gibbsite component simulant for testing of aluminum leaching and provide a basis for the selected simulant. Once the gibbsite simulant was chosen, it was fully tested and characterized.
Table S.1. Test Objectives
Test Objective Objective
Met? (Y/N) Discussion 1) Develop and characterize a gibbsite
component simulant for testing aluminum leaching and provide a basis for the selected simulant.
Y
A gibbsite was chosen (Almatis Hydrated Alumina Ath C333) that was similar to the actual waste based primarily on the crystal size and shape of the simulant in comparison to the actual waste gibbsite particles.
2) The gibbsite simulant will be fully tested and characterized. Y
The gibbsite simulant was leached under several different conditions and with the entire simulant as well as filtered to determine the effect of these variables on its leaching behavior. It was then compared to the actual gibbsite waste leaching results.
Success Criteria This work meets the second of the Success Criteria described in Section 4 of BNI’s Test Specification 24590-PTF-TSP-RT-06-006, Rev 0:
Development of a gibbsite simulant that has physical properties—in particular crystal size and habit—similar to that observed in prior actual waste samples and the development of a correlation that predicts gibbsite simulant dissolution rate as a function of gibbsite properties such as crystal size and crystal habit, as well as other physical properties.
x
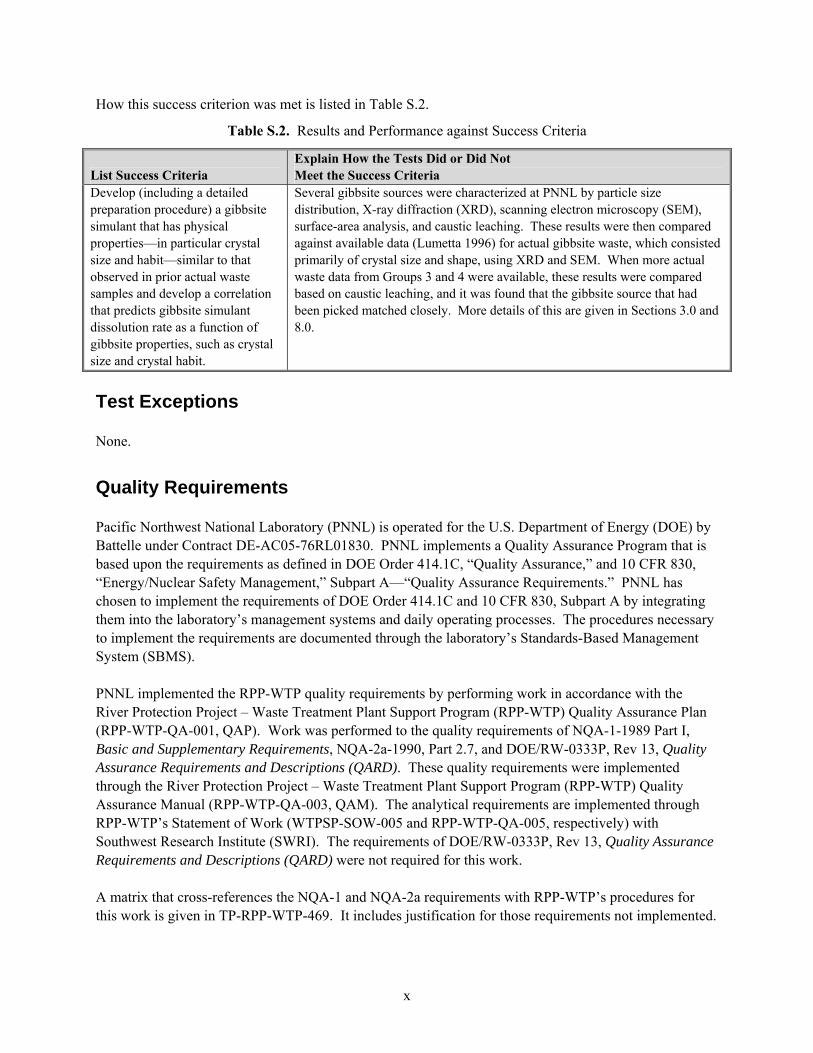
How this success criterion was met is listed in Table S.2.
Table S.2. Results and Performance against Success Criteria
List Success Criteria Explain How the Tests Did or Did Not Meet the Success Criteria
Develop (including a detailed preparation procedure) a gibbsite simulant that has physical properties—in particular crystal size and habit—similar to that observed in prior actual waste samples and develop a correlation that predicts gibbsite simulant dissolution rate as a function of gibbsite properties, such as crystal size and crystal habit.
Several gibbsite sources were characterized at PNNL by particle size distribution, X-ray diffraction (XRD), scanning electron microscopy (SEM), surface-area analysis, and caustic leaching. These results were then compared against available data (Lumetta 1996) for actual gibbsite waste, which consisted primarily of crystal size and shape, using XRD and SEM. When more actual waste data from Groups 3 and 4 were available, these results were compared based on caustic leaching, and it was found that the gibbsite source that had been picked matched closely. More details of this are given in Sections 3.0 and 8.0.
Test Exceptions None.
Quality Requirements Pacific Northwest National Laboratory (PNNL) is operated for the U.S. Department of Energy (DOE) by Battelle under Contract DE-AC05-76RL01830. PNNL implements a Quality Assurance Program that is based upon the requirements as defined in DOE Order 414.1C, “Quality Assurance,” and 10 CFR 830, “Energy/Nuclear Safety Management,” Subpart A—“Quality Assurance Requirements.” PNNL has chosen to implement the requirements of DOE Order 414.1C and 10 CFR 830, Subpart A by integrating them into the laboratory’s management systems and daily operating processes. The procedures necessary to implement the requirements are documented through the laboratory’s Standards-Based Management System (SBMS). PNNL implemented the RPP-WTP quality requirements by performing work in accordance with the River Protection Project – Waste Treatment Plant Support Program (RPP-WTP) Quality Assurance Plan (RPP-WTP-QA-001, QAP). Work was performed to the quality requirements of NQA-1-1989 Part I, Basic and Supplementary Requirements, NQA-2a-1990, Part 2.7, and DOE/RW-0333P, Rev 13, Quality Assurance Requirements and Descriptions (QARD). These quality requirements were implemented through the River Protection Project – Waste Treatment Plant Support Program (RPP-WTP) Quality Assurance Manual (RPP-WTP-QA-003, QAM). The analytical requirements are implemented through RPP-WTP’s Statement of Work (WTPSP-SOW-005 and RPP-WTP-QA-005, respectively) with Southwest Research Institute (SWRI). The requirements of DOE/RW-0333P, Rev 13, Quality Assurance Requirements and Descriptions (QARD) were not required for this work. A matrix that cross-references the NQA-1 and NQA-2a requirements with RPP-WTP’s procedures for this work is given in TP-RPP-WTP-469. It includes justification for those requirements not implemented.
xi
Experiments that were not method-specific were performed in accordance with RPP-WTP’s procedures QA-RPP-WTP-1101 “Scientific Investigations” and QA-RPP-WTP-1201 “Calibration and Control of Measuring and Testing Equipment” so that sufficient data were taken with properly calibrated measuring and test equipment (M&TE) to obtain quality results. RPP-WTP addressed internal verification and validation activities by conducting an Independent Technical Review (ITR) of the final data report in accordance with PNNL’s procedure QA-RPP-WTP-604. This review verifies that the reported results were traceable, inferences and conclusions were soundly based, and the reported work satisfied the Test Plan objectives. This review procedure is part of PNNL’s RPP-WTP QAM.
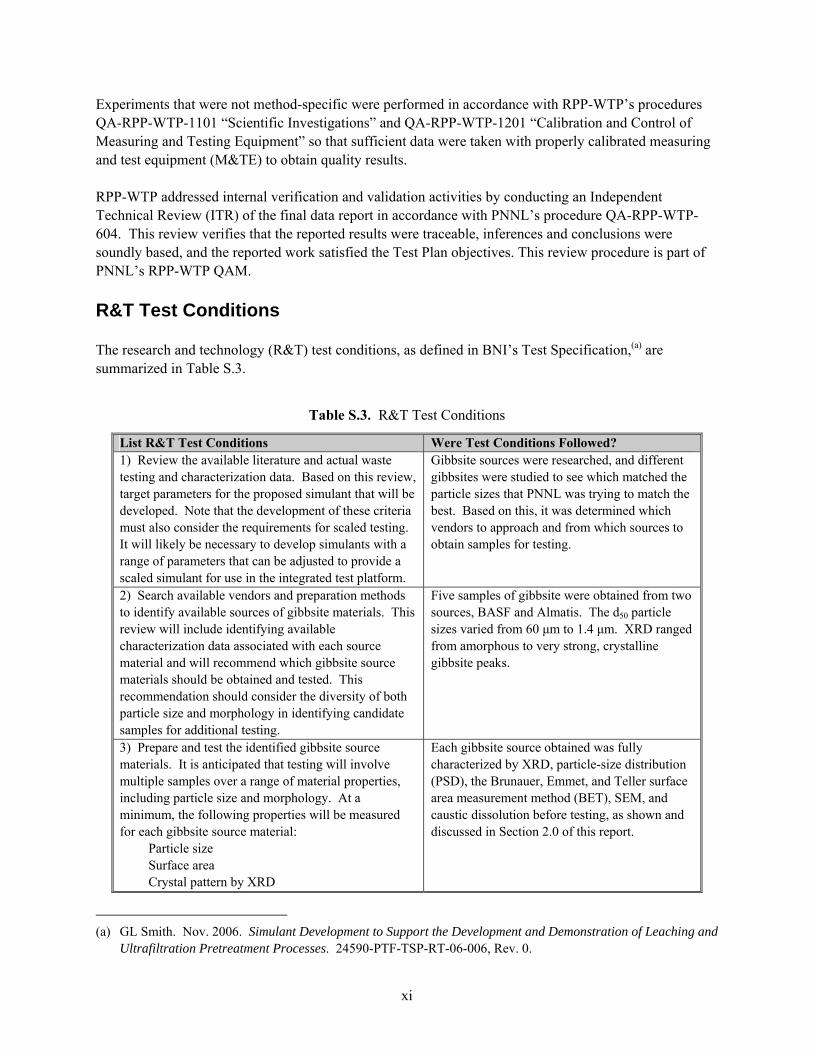
R&T Test Conditions The research and technology (R&T) test conditions, as defined in BNI’s Test Specification,(a) are summarized in Table S.3.
Table S.3. R&T Test Conditions
List R&T Test Conditions Were Test Conditions Followed? 1) Review the available literature and actual waste testing and characterization data. Based on this review, target parameters for the proposed simulant that will be developed. Note that the development of these criteria must also consider the requirements for scaled testing. It will likely be necessary to develop simulants with a range of parameters that can be adjusted to provide a scaled simulant for use in the integrated test platform.
Gibbsite sources were researched, and different gibbsites were studied to see which matched the particle sizes that PNNL was trying to match the best. Based on this, it was determined which vendors to approach and from which sources to obtain samples for testing.
2) Search available vendors and preparation methods to identify available sources of gibbsite materials. This review will include identifying available characterization data associated with each source material and will recommend which gibbsite source materials should be obtained and tested. This recommendation should consider the diversity of both particle size and morphology in identifying candidate samples for additional testing.
Five samples of gibbsite were obtained from two sources, BASF and Almatis. The d50 particle sizes varied from 60 μm to 1.4 μm. XRD ranged from amorphous to very strong, crystalline gibbsite peaks.
3) Prepare and test the identified gibbsite source materials. It is anticipated that testing will involve multiple samples over a range of material properties, including particle size and morphology. At a minimum, the following properties will be measured for each gibbsite source material:
Particle size Surface area Crystal pattern by XRD
Each gibbsite source obtained was fully characterized by XRD, particle-size distribution (PSD), the Brunauer, Emmet, and Teller surface area measurement method (BET), SEM, and caustic dissolution before testing, as shown and discussed in Section 2.0 of this report.
(a) GL Smith. Nov. 2006. Simulant Development to Support the Development and Demonstration of Leaching and
Ultrafiltration Pretreatment Processes. 24590-PTF-TSP-RT-06-006, Rev. 0.
xii
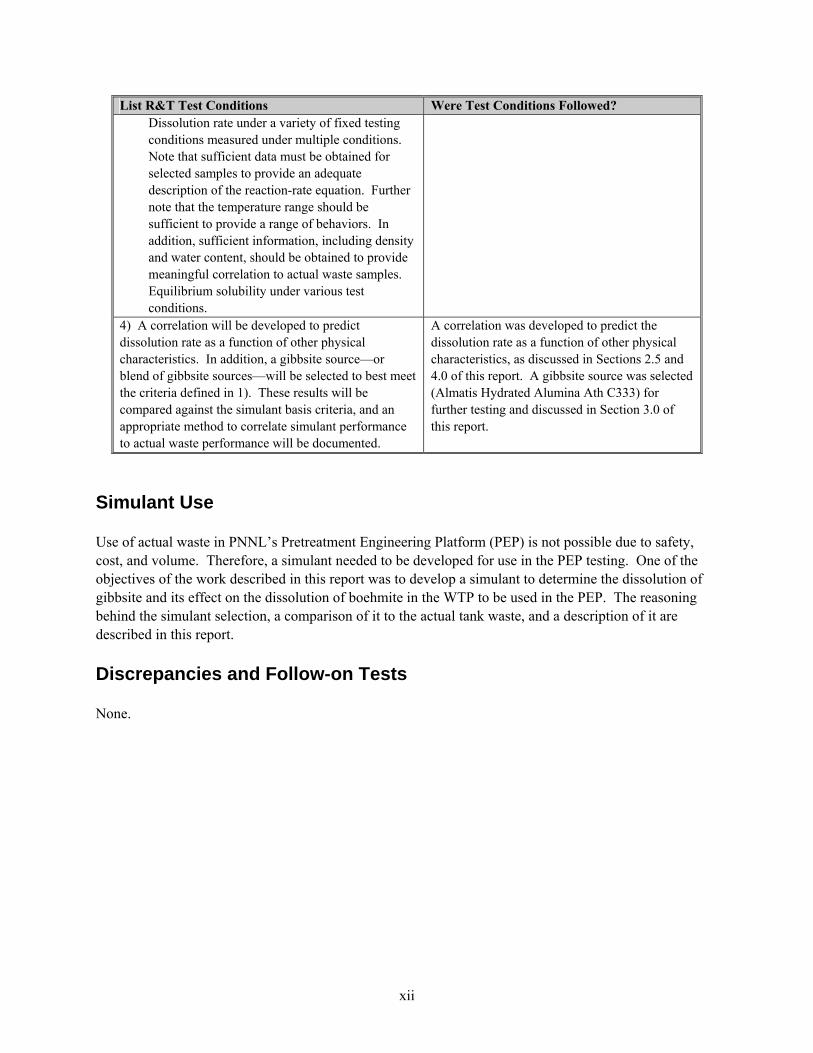
List R&T Test Conditions Were Test Conditions Followed? Dissolution rate under a variety of fixed testing conditions measured under multiple conditions. Note that sufficient data must be obtained for selected samples to provide an adequate description of the reaction-rate equation. Further note that the temperature range should be sufficient to provide a range of behaviors. In addition, sufficient information, including density and water content, should be obtained to provide meaningful correlation to actual waste samples. Equilibrium solubility under various test conditions.
4) A correlation will be developed to predict dissolution rate as a function of other physical characteristics. In addition, a gibbsite source—or blend of gibbsite sources—will be selected to best meet the criteria defined in 1). These results will be compared against the simulant basis criteria, and an appropriate method to correlate simulant performance to actual waste performance will be documented.
A correlation was developed to predict the dissolution rate as a function of other physical characteristics, as discussed in Sections 2.5 and 4.0 of this report. A gibbsite source was selected (Almatis Hydrated Alumina Ath C333) for further testing and discussed in Section 3.0 of this report.
Simulant Use Use of actual waste in PNNL’s Pretreatment Engineering Platform (PEP) is not possible due to safety, cost, and volume. Therefore, a simulant needed to be developed for use in the PEP testing. One of the objectives of the work described in this report was to develop a simulant to determine the dissolution of gibbsite and its effect on the dissolution of boehmite in the WTP to be used in the PEP. The reasoning behind the simulant selection, a comparison of it to the actual tank waste, and a description of it are described in this report.
Discrepancies and Follow-on Tests None.
1.1
1.0 Introduction
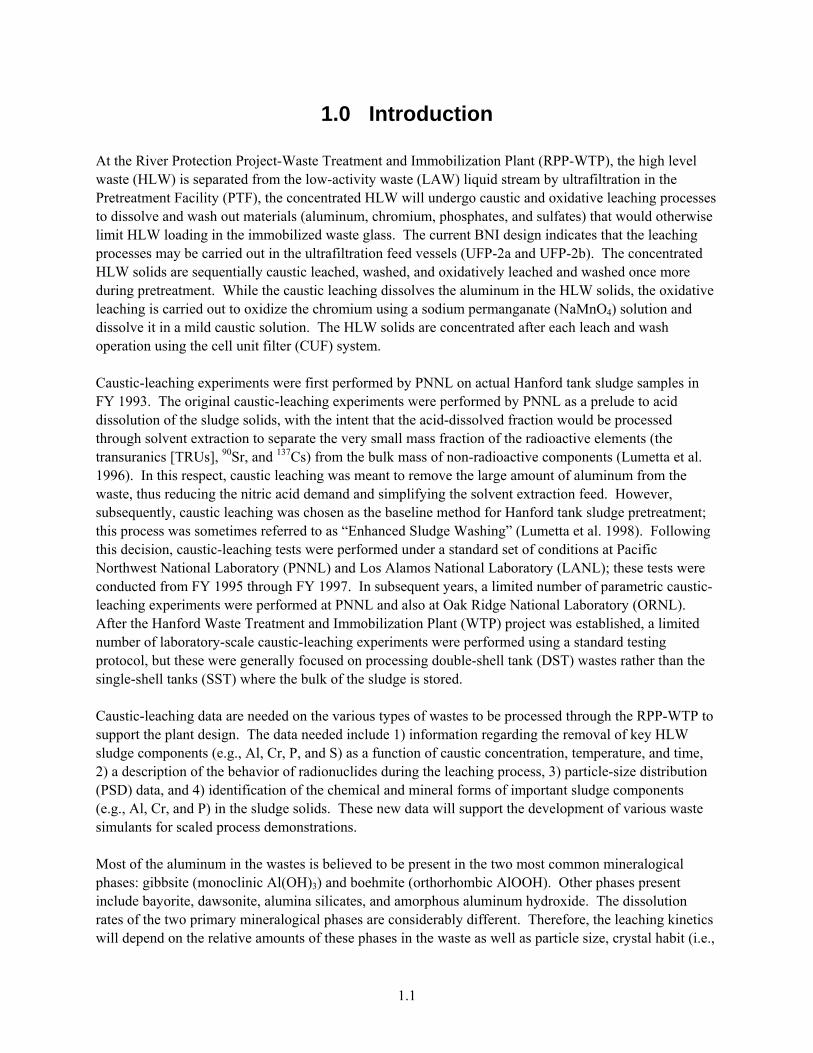
At the River Protection Project-Waste Treatment and Immobilization Plant (RPP-WTP), the high level waste (HLW) is separated from the low-activity waste (LAW) liquid stream by ultrafiltration in the Pretreatment Facility (PTF), the concentrated HLW will undergo caustic and oxidative leaching processes to dissolve and wash out materials (aluminum, chromium, phosphates, and sulfates) that would otherwise limit HLW loading in the immobilized waste glass. The current BNI design indicates that the leaching processes may be carried out in the ultrafiltration feed vessels (UFP-2a and UFP-2b). The concentrated HLW solids are sequentially caustic leached, washed, and oxidatively leached and washed once more during pretreatment. While the caustic leaching dissolves the aluminum in the HLW solids, the oxidative leaching is carried out to oxidize the chromium using a sodium permanganate (NaMnO4) solution and dissolve it in a mild caustic solution. The HLW solids are concentrated after each leach and wash operation using the cell unit filter (CUF) system. Caustic-leaching experiments were first performed by PNNL on actual Hanford tank sludge samples in FY 1993. The original caustic-leaching experiments were performed by PNNL as a prelude to acid dissolution of the sludge solids, with the intent that the acid-dissolved fraction would be processed through solvent extraction to separate the very small mass fraction of the radioactive elements (the transuranics [TRUs], 90Sr, and 137Cs) from the bulk mass of non-radioactive components (Lumetta et al. 1996). In this respect, caustic leaching was meant to remove the large amount of aluminum from the waste, thus reducing the nitric acid demand and simplifying the solvent extraction feed. However, subsequently, caustic leaching was chosen as the baseline method for Hanford tank sludge pretreatment; this process was sometimes referred to as “Enhanced Sludge Washing” (Lumetta et al. 1998). Following this decision, caustic-leaching tests were performed under a standard set of conditions at Pacific Northwest National Laboratory (PNNL) and Los Alamos National Laboratory (LANL); these tests were conducted from FY 1995 through FY 1997. In subsequent years, a limited number of parametric caustic-leaching experiments were performed at PNNL and also at Oak Ridge National Laboratory (ORNL). After the Hanford Waste Treatment and Immobilization Plant (WTP) project was established, a limited number of laboratory-scale caustic-leaching experiments were performed using a standard testing protocol, but these were generally focused on processing double-shell tank (DST) wastes rather than the single-shell tanks (SST) where the bulk of the sludge is stored. Caustic-leaching data are needed on the various types of wastes to be processed through the RPP-WTP to support the plant design. The data needed include 1) information regarding the removal of key HLW sludge components (e.g., Al, Cr, P, and S) as a function of caustic concentration, temperature, and time, 2) a description of the behavior of radionuclides during the leaching process, 3) particle-size distribution (PSD) data, and 4) identification of the chemical and mineral forms of important sludge components (e.g., Al, Cr, and P) in the sludge solids. These new data will support the development of various waste simulants for scaled process demonstrations. Most of the aluminum in the wastes is believed to be present in the two most common mineralogical phases: gibbsite (monoclinic Al(OH)3) and boehmite (orthorhombic AlOOH). Other phases present include bayorite, dawsonite, alumina silicates, and amorphous aluminum hydroxide. The dissolution rates of the two primary mineralogical phases are considerably different. Therefore, the leaching kinetics will depend on the relative amounts of these phases in the waste as well as particle size, crystal habit (i.e.,
1.2
particle size and shape), operating temperature, hydroxide activity, aluminum solubility limits, particle Reynolds number associated with the mixing system, etc. While there may be other phases of aluminum compounds in the waste solids, they are present in relatively smaller amounts and therefore are considered less significant to the caustic leaching for the removal of aluminum from the HLW. The simulant development strategy is based on a two-phased approach. The first phase includes simulant development and the validation of initial single-component chemical and physical simulants for boehmite, gibbsite, chromium, and filtration. The data obtained from the actual waste testing (Sundar 2006) are to serve as benchmarks for defining the simulant characteristics and behaviors to develop chemical, rheological, and physical simulants to more closely simulate actual waste and as a basis for revising the parameters used in evaluating WTP process performance using the appropriate process models. The second phase of the simulant development work involves refinement of the first four component simulants based on additional tank waste characterization data. In addition, the other component simulants (such as phosphate) will be developed during this stage. This report only addresses the first phase of the simulant development work relating to the gibbsite simulant development. For the gibbsite simulant developed as part of this report, this process involved two steps. In the first step, since no historical dissolution rate data was available for gibbsite phases in actual waste, the gibbsite was chosen solely based on physical characteristics and primarily based upon appearance in SEM micrographs. In the second step, once dissolution rate data was available for gibbsite in actual waste, this dissolution rate data was used to assess the choice of gibbsite material used.
2.1
2.0 Gibbsite Source Characterization
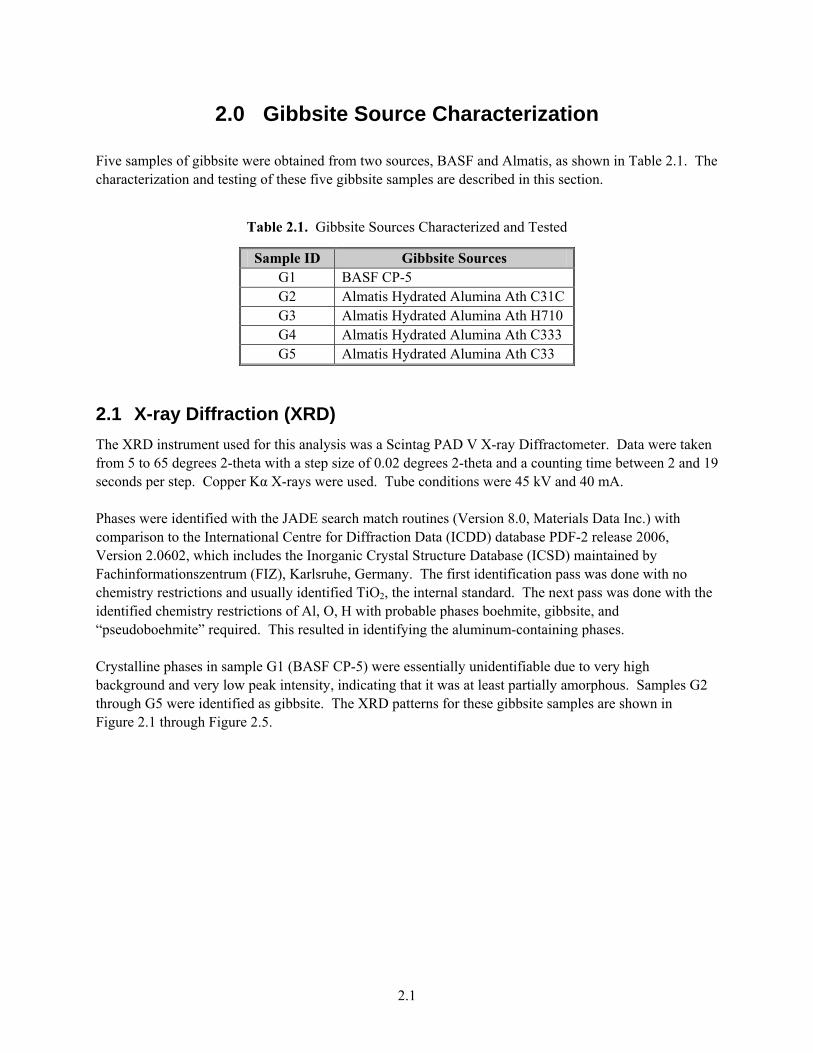
Five samples of gibbsite were obtained from two sources, BASF and Almatis, as shown in Table 2.1. The characterization and testing of these five gibbsite samples are described in this section.
Table 2.1. Gibbsite Sources Characterized and Tested
Sample ID Gibbsite Sources G1 BASF CP-5 G2 Almatis Hydrated Alumina Ath C31C G3 Almatis Hydrated Alumina Ath H710 G4 Almatis Hydrated Alumina Ath C333 G5 Almatis Hydrated Alumina Ath C33
2.1 X-ray Diffraction (XRD)
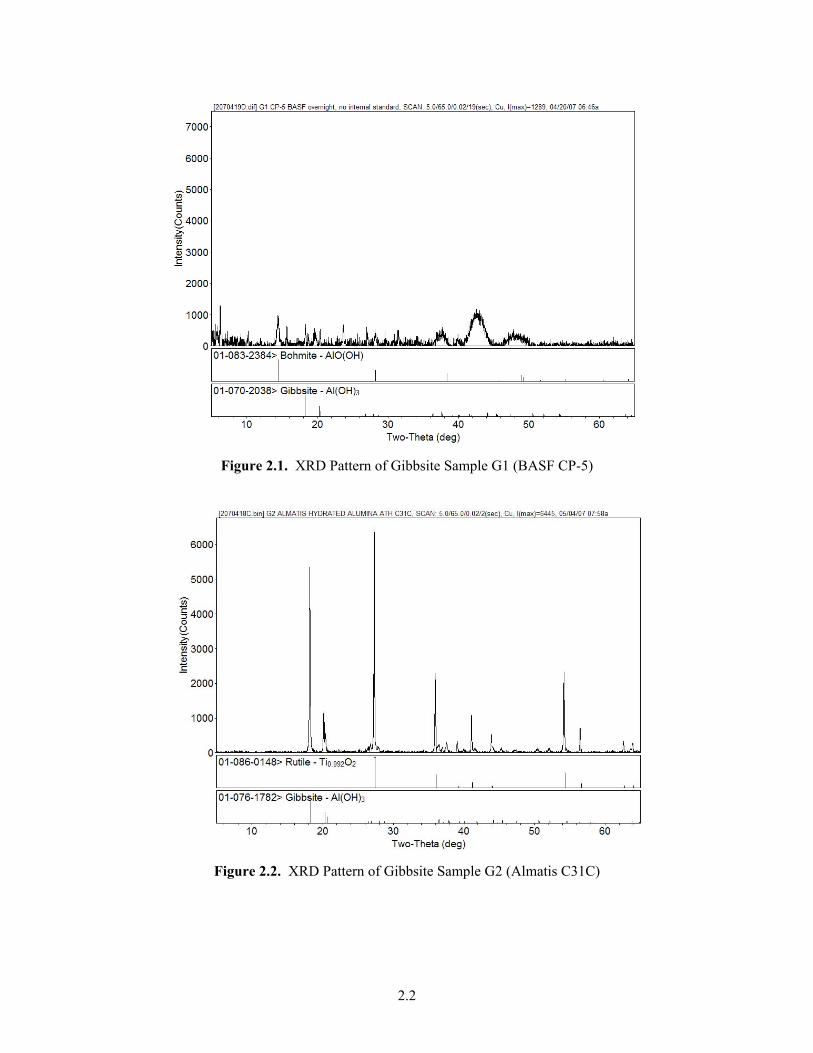
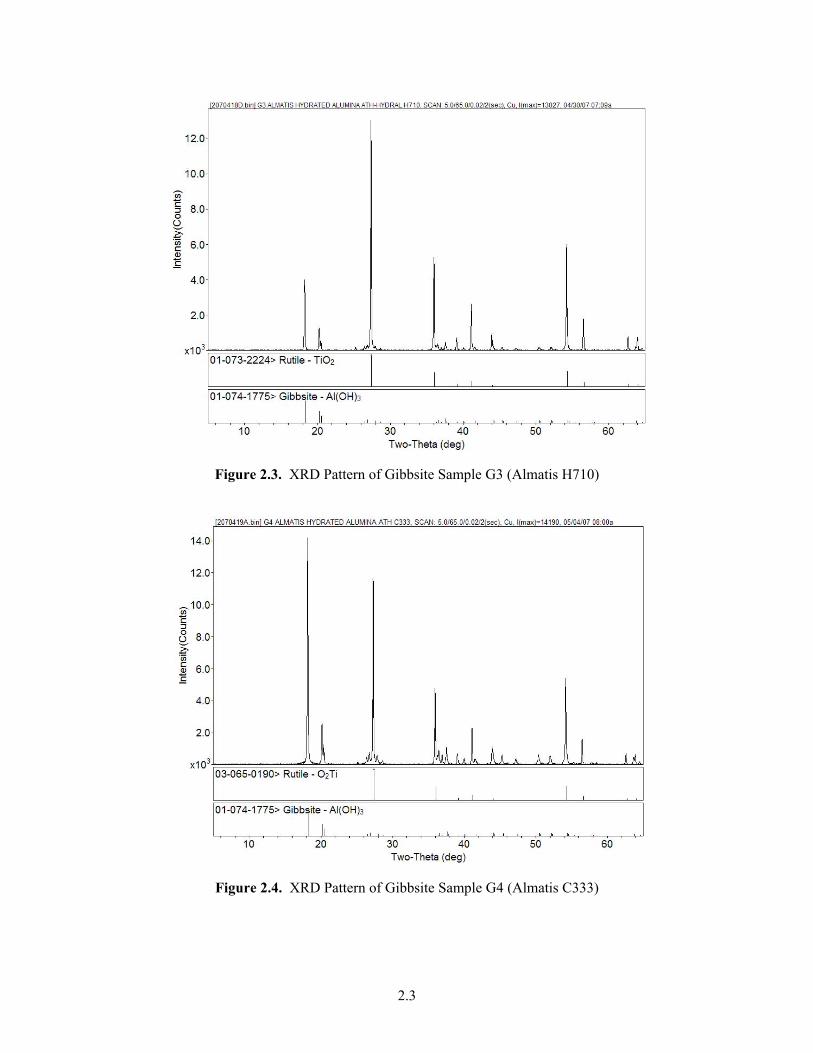
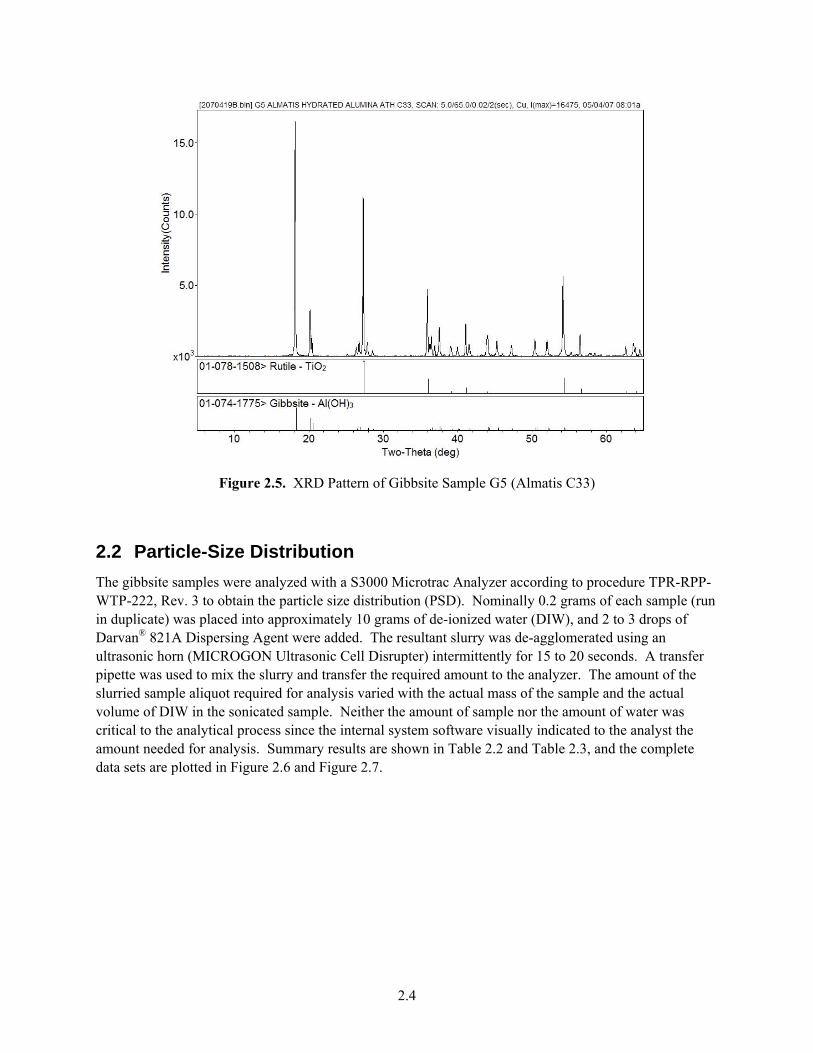
The XRD instrument used for this analysis was a Scintag PAD V X-ray Diffractometer. Data were taken from 5 to 65 degrees 2-theta with a step size of 0.02 degrees 2-theta and a counting time between 2 and 19 seconds per step. Copper Kα X-rays were used. Tube conditions were 45 kV and 40 mA. Phases were identified with the JADE search match routines (Version 8.0, Materials Data Inc.) with comparison to the International Centre for Diffraction Data (ICDD) database PDF-2 release 2006, Version 2.0602, which includes the Inorganic Crystal Structure Database (ICSD) maintained by Fachinformationszentrum (FIZ), Karlsruhe, Germany. The first identification pass was done with no chemistry restrictions and usually identified TiO2, the internal standard. The next pass was done with the identified chemistry restrictions of Al, O, H with probable phases boehmite, gibbsite, and “pseudoboehmite” required. This resulted in identifying the aluminum-containing phases. Crystalline phases in sample G1 (BASF CP-5) were essentially unidentifiable due to very high background and very low peak intensity, indicating that it was at least partially amorphous. Samples G2 through G5 were identified as gibbsite. The XRD patterns for these gibbsite samples are shown in Figure 2.1 through Figure 2.5.
2.2
Figure 2.1. XRD Pattern of Gibbsite Sample G1 (BASF CP-5)
Figure 2.2. XRD Pattern of Gibbsite Sample G2 (Almatis C31C)
2.3
Figure 2.3. XRD Pattern of Gibbsite Sample G3 (Almatis H710)
Figure 2.4. XRD Pattern of Gibbsite Sample G4 (Almatis C333)
2.4
Figure 2.5. XRD Pattern of Gibbsite Sample G5 (Almatis C33)
2.2 Particle-Size Distribution
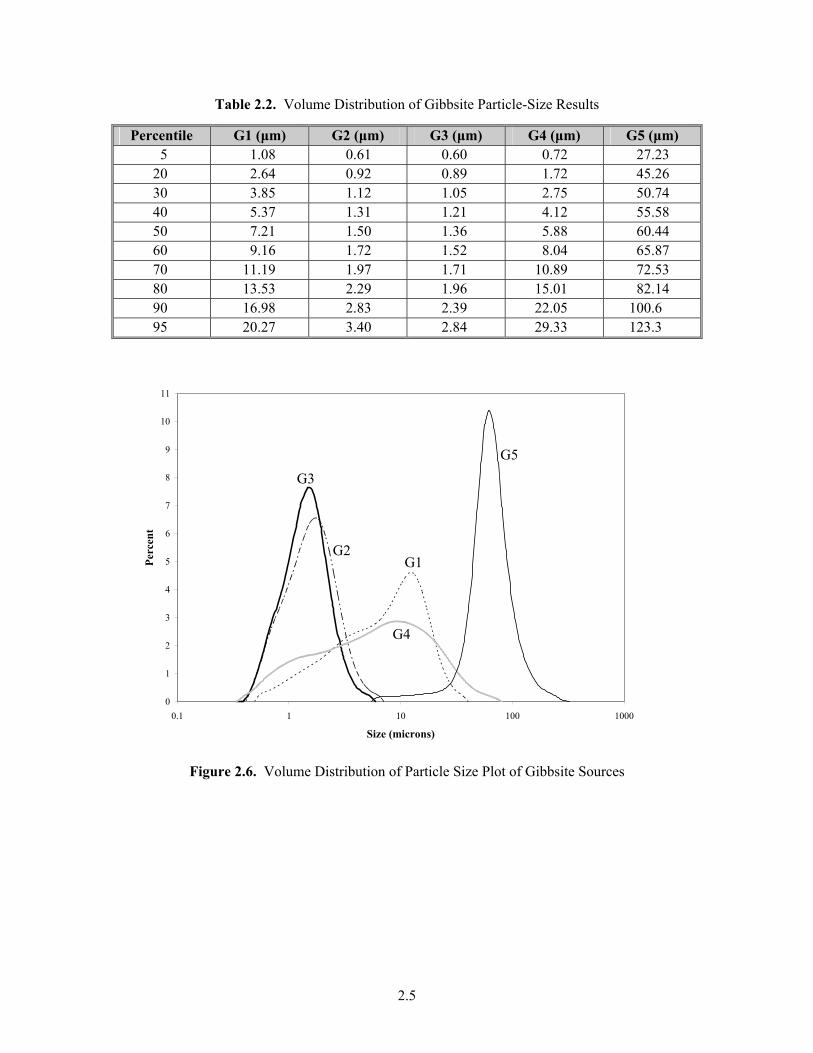
The gibbsite samples were analyzed with a S3000 Microtrac Analyzer according to procedure TPR-RPP-WTP-222, Rev. 3 to obtain the particle size distribution (PSD). Nominally 0.2 grams of each sample (run in duplicate) was placed into approximately 10 grams of de-ionized water (DIW), and 2 to 3 drops of Darvan® 821A Dispersing Agent were added. The resultant slurry was de-agglomerated using an ultrasonic horn (MICROGON Ultrasonic Cell Disrupter) intermittently for 15 to 20 seconds. A transfer pipette was used to mix the slurry and transfer the required amount to the analyzer. The amount of the slurried sample aliquot required for analysis varied with the actual mass of the sample and the actual volume of DIW in the sonicated sample. Neither the amount of sample nor the amount of water was critical to the analytical process since the internal system software visually indicated to the analyst the amount needed for analysis. Summary results are shown in Table 2.2 and Table 2.3, and the complete data sets are plotted in Figure 2.6 and Figure 2.7.
2.5
Table 2.2. Volume Distribution of Gibbsite Particle-Size Results
Percentile G1 (μm) G2 (μm) G3 (μm) G4 (μm) G5 (μm) 5 1.08 0.61 0.60 0.72 27.23
20 2.64 0.92 0.89 1.72 45.26 30 3.85 1.12 1.05 2.75 50.74 40 5.37 1.31 1.21 4.12 55.58 50 7.21 1.50 1.36 5.88 60.44 60 9.16 1.72 1.52 8.04 65.87 70 11.19 1.97 1.71 10.89 72.53 80 13.53 2.29 1.96 15.01 82.14 90 16.98 2.83 2.39 22.05 100.6 95 20.27 3.40 2.84 29.33 123.3
0
1
2
3
4
5
6
7
8
9
10
11
0.1 1 10 100 1000
Size (microns)
Per
cent
Figure 2.6. Volume Distribution of Particle Size Plot of Gibbsite Sources
G3
G5
G1G2
G4
2.6
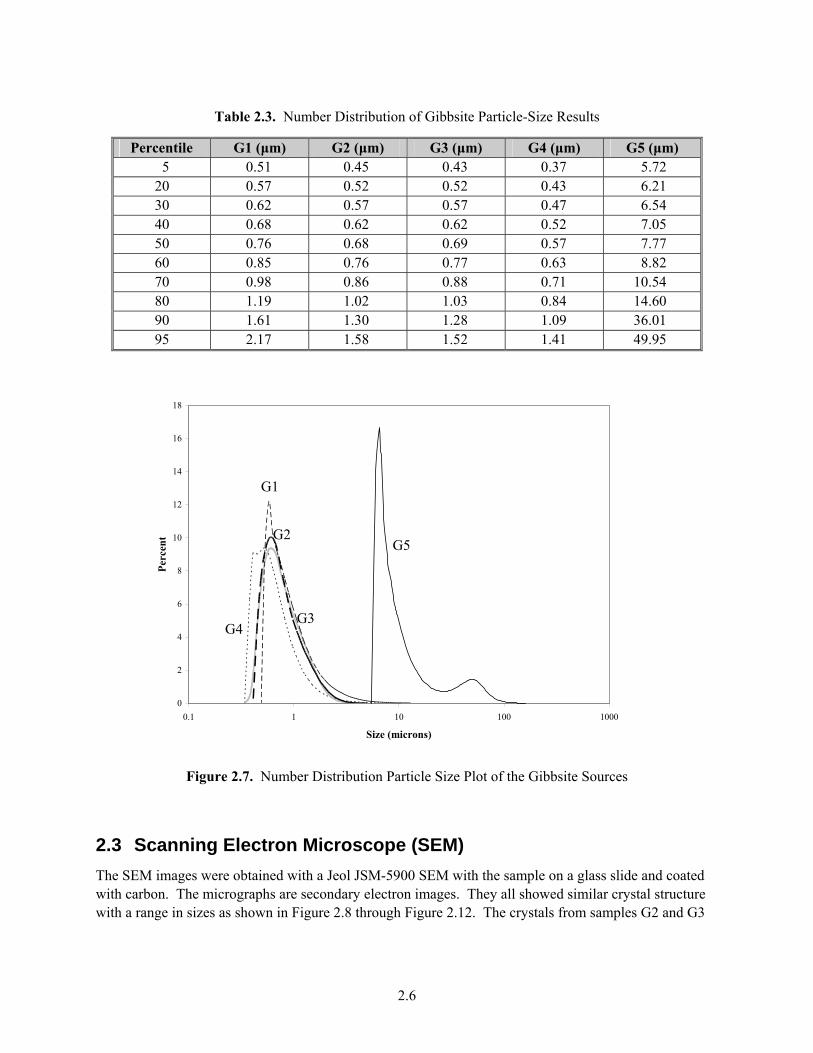
Table 2.3. Number Distribution of Gibbsite Particle-Size Results
Percentile G1 (μm) G2 (μm) G3 (μm) G4 (μm) G5 (μm) 5 0.51 0.45 0.43 0.37 5.72
20 0.57 0.52 0.52 0.43 6.21 30 0.62 0.57 0.57 0.47 6.54 40 0.68 0.62 0.62 0.52 7.05 50 0.76 0.68 0.69 0.57 7.77 60 0.85 0.76 0.77 0.63 8.82 70 0.98 0.86 0.88 0.71 10.54 80 1.19 1.02 1.03 0.84 14.60 90 1.61 1.30 1.28 1.09 36.01 95 2.17 1.58 1.52 1.41 49.95
0
2
4
6
8
10
12
14
16
18
0.1 1 10 100 1000
Size (microns)
Per
cen
t
Figure 2.7. Number Distribution Particle Size Plot of the Gibbsite Sources
2.3 Scanning Electron Microscope (SEM)
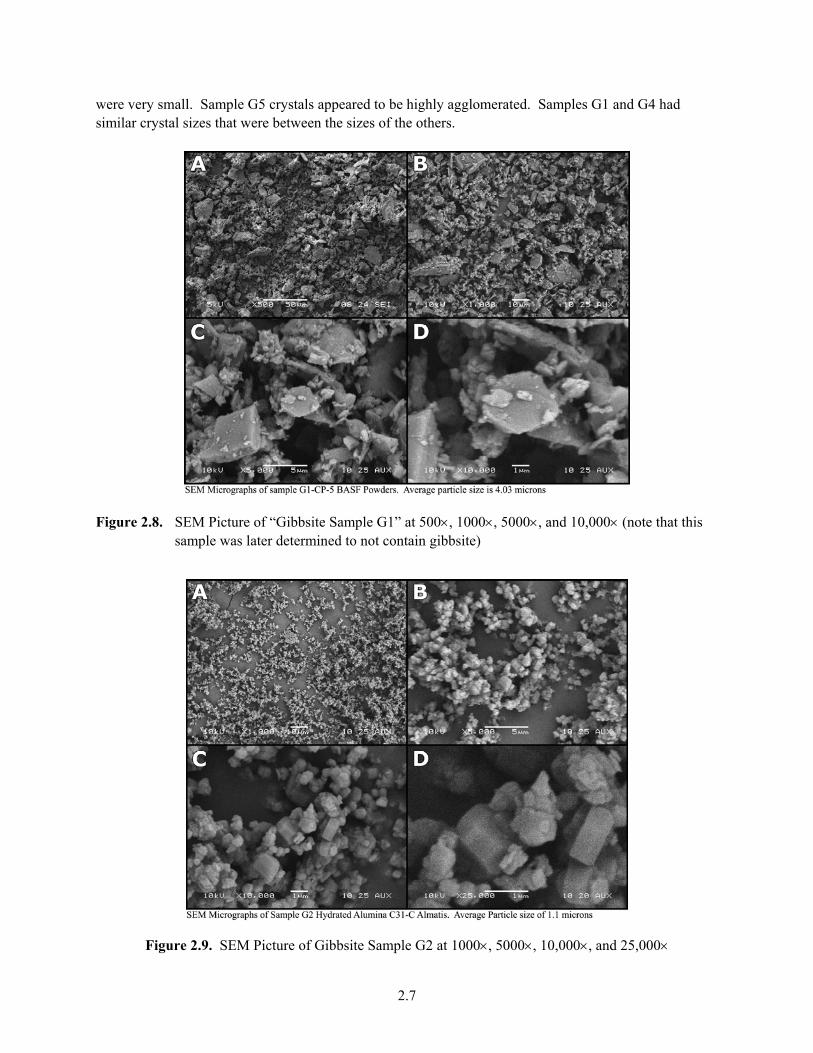
The SEM images were obtained with a Jeol JSM-5900 SEM with the sample on a glass slide and coated with carbon. The micrographs are secondary electron images. They all showed similar crystal structure with a range in sizes as shown in Figure 2.8 through Figure 2.12. The crystals from samples G2 and G3
G5
G1
G4
G2
G3
2.7
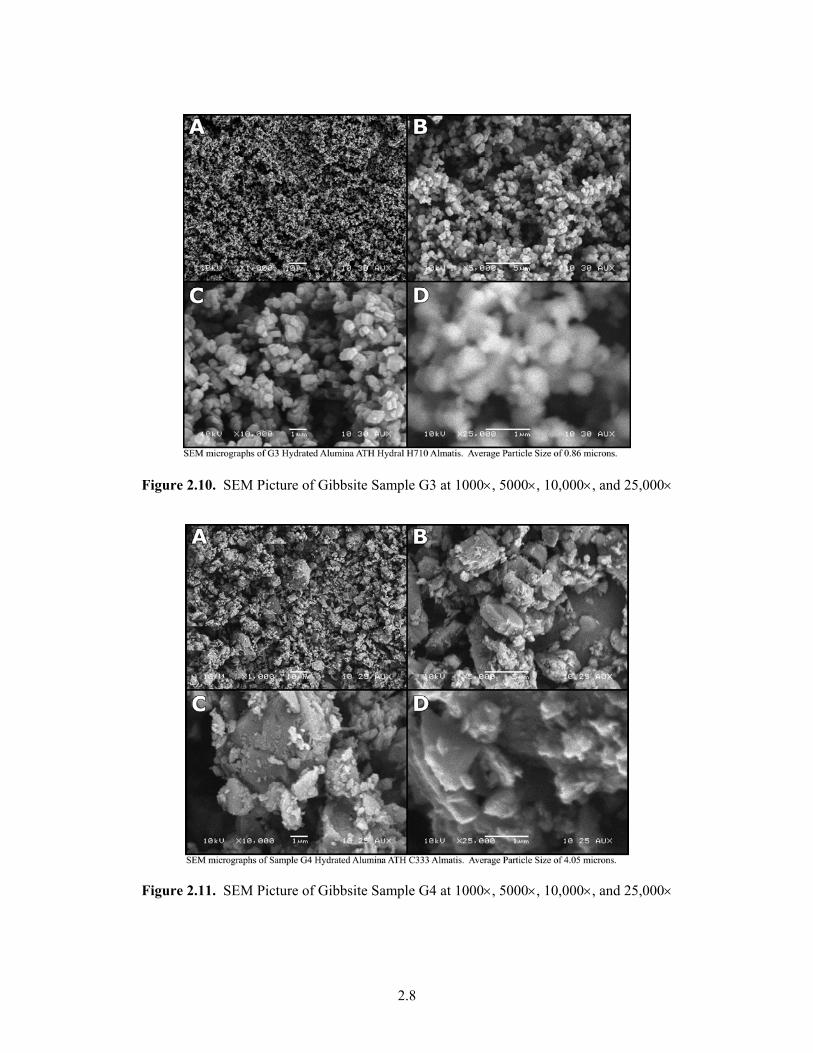
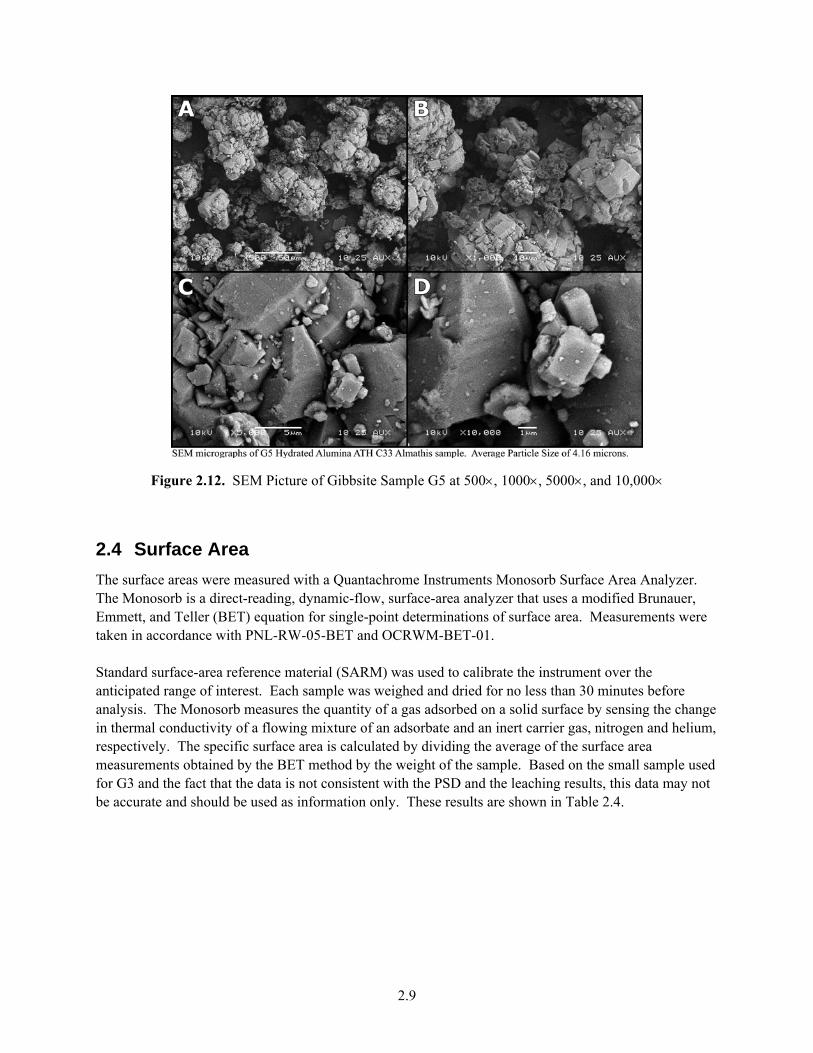
were very small. Sample G5 crystals appeared to be highly agglomerated. Samples G1 and G4 had similar crystal sizes that were between the sizes of the others.
Figure 2.8. SEM Picture of “Gibbsite Sample G1” at 500, 1000, 5000, and 10,000 (note that this sample was later determined to not contain gibbsite)
Figure 2.9. SEM Picture of Gibbsite Sample G2 at 1000, 5000, 10,000, and 25,000
2.8
Figure 2.10. SEM Picture of Gibbsite Sample G3 at 1000, 5000, 10,000, and 25,000
Figure 2.11. SEM Picture of Gibbsite Sample G4 at 1000, 5000, 10,000, and 25,000
2.9
Figure 2.12. SEM Picture of Gibbsite Sample G5 at 500, 1000, 5000, and 10,000
2.4 Surface Area
The surface areas were measured with a Quantachrome Instruments Monosorb Surface Area Analyzer. The Monosorb is a direct-reading, dynamic-flow, surface-area analyzer that uses a modified Brunauer, Emmett, and Teller (BET) equation for single-point determinations of surface area. Measurements were taken in accordance with PNL-RW-05-BET and OCRWM-BET-01. Standard surface-area reference material (SARM) was used to calibrate the instrument over the anticipated range of interest. Each sample was weighed and dried for no less than 30 minutes before analysis. The Monosorb measures the quantity of a gas adsorbed on a solid surface by sensing the change in thermal conductivity of a flowing mixture of an adsorbate and an inert carrier gas, nitrogen and helium, respectively. The specific surface area is calculated by dividing the average of the surface area measurements obtained by the BET method by the weight of the sample. Based on the small sample used for G3 and the fact that the data is not consistent with the PSD and the leaching results, this data may not be accurate and should be used as information only. These results are shown in Table 2.4.
2.10
Table 2.4. BET Surface Area of Gibbsite Samples
Sample ID Mass (g) Surface Area
(m2) Specific Surface Area
(m2/g) Std Dev G1 0.0359 0.2902 8.084 0.017 G2 0.2903 1.376 4.739 0.018 G3 0.0043 0.046 10.775 2.032 G4 0.2722 1.315 4.832 0.221 G5 0.455 0.252 0.545 0.097
2.5 Screening Leach Test
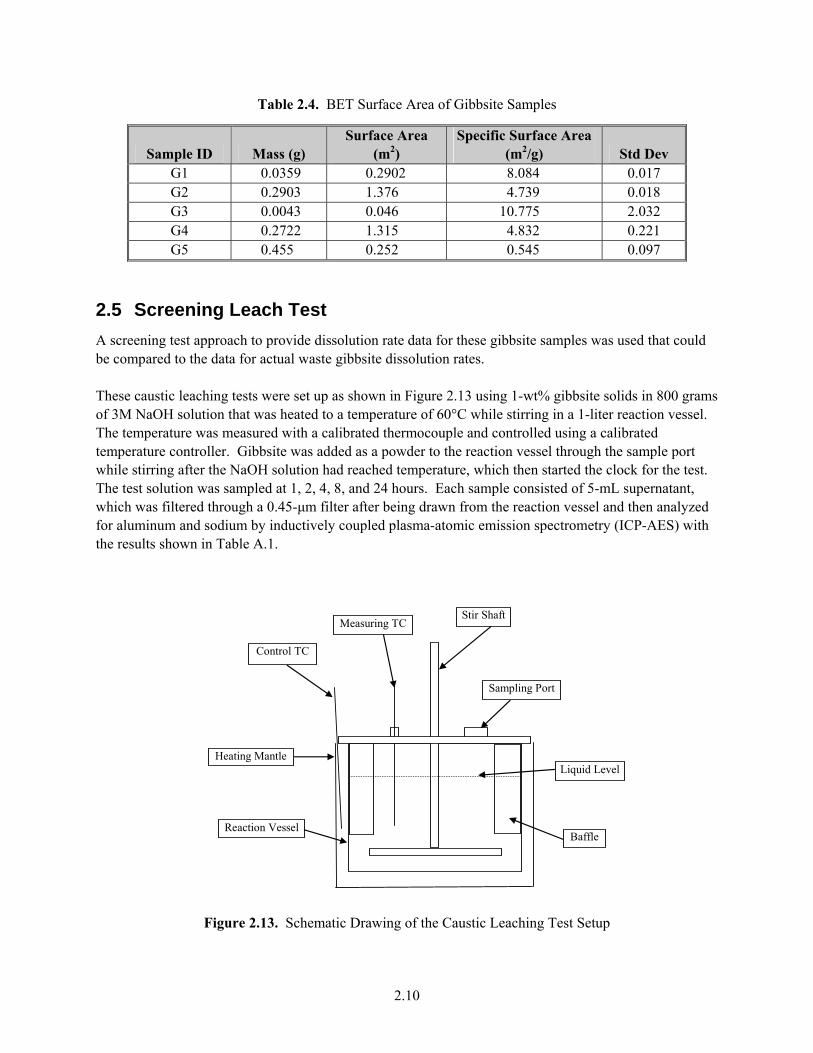
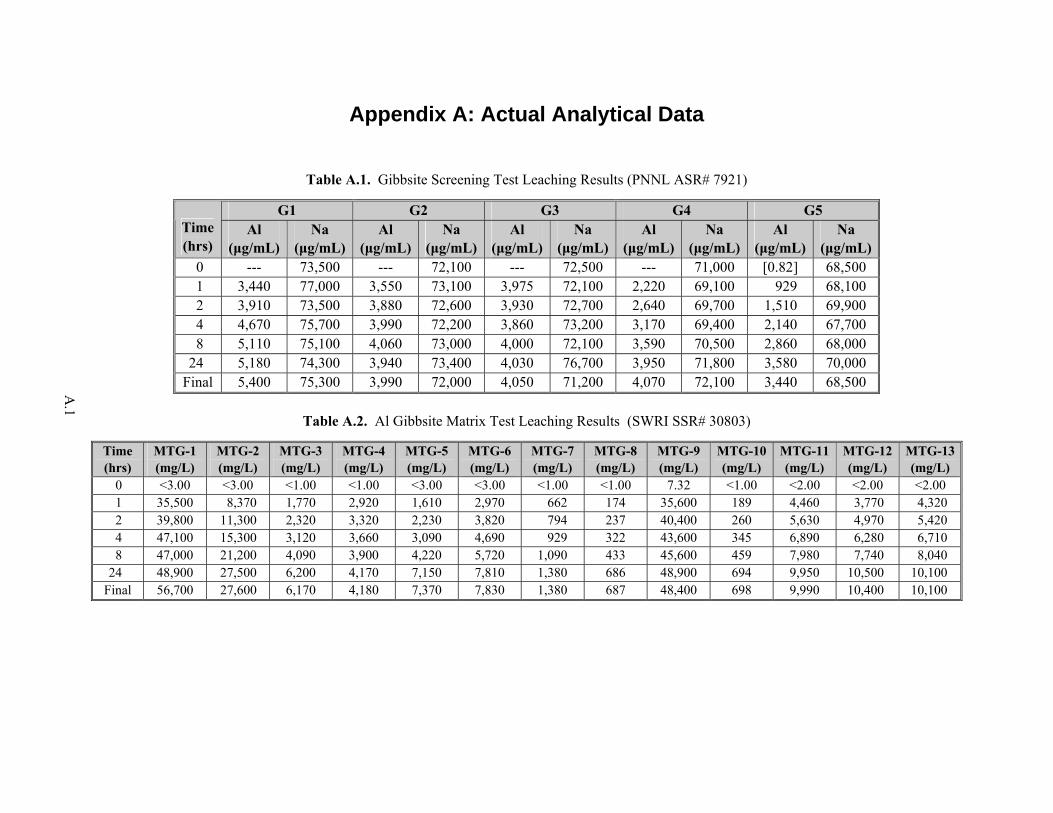
A screening test approach to provide dissolution rate data for these gibbsite samples was used that could be compared to the data for actual waste gibbsite dissolution rates. These caustic leaching tests were set up as shown in Figure 2.13 using 1-wt% gibbsite solids in 800 grams of 3M NaOH solution that was heated to a temperature of 60°C while stirring in a 1-liter reaction vessel. The temperature was measured with a calibrated thermocouple and controlled using a calibrated temperature controller. Gibbsite was added as a powder to the reaction vessel through the sample port while stirring after the NaOH solution had reached temperature, which then started the clock for the test. The test solution was sampled at 1, 2, 4, 8, and 24 hours. Each sample consisted of 5-mL supernatant, which was filtered through a 0.45-μm filter after being drawn from the reaction vessel and then analyzed for aluminum and sodium by inductively coupled plasma-atomic emission spectrometry (ICP-AES) with the results shown in Table A.1.
Control TC
Measuring TC
Heating Mantle
Sampling Port
Baffle
Stir Shaft
Reaction Vessel
Liquid Level
Figure 2.13. Schematic Drawing of the Caustic Leaching Test Setup
2.11
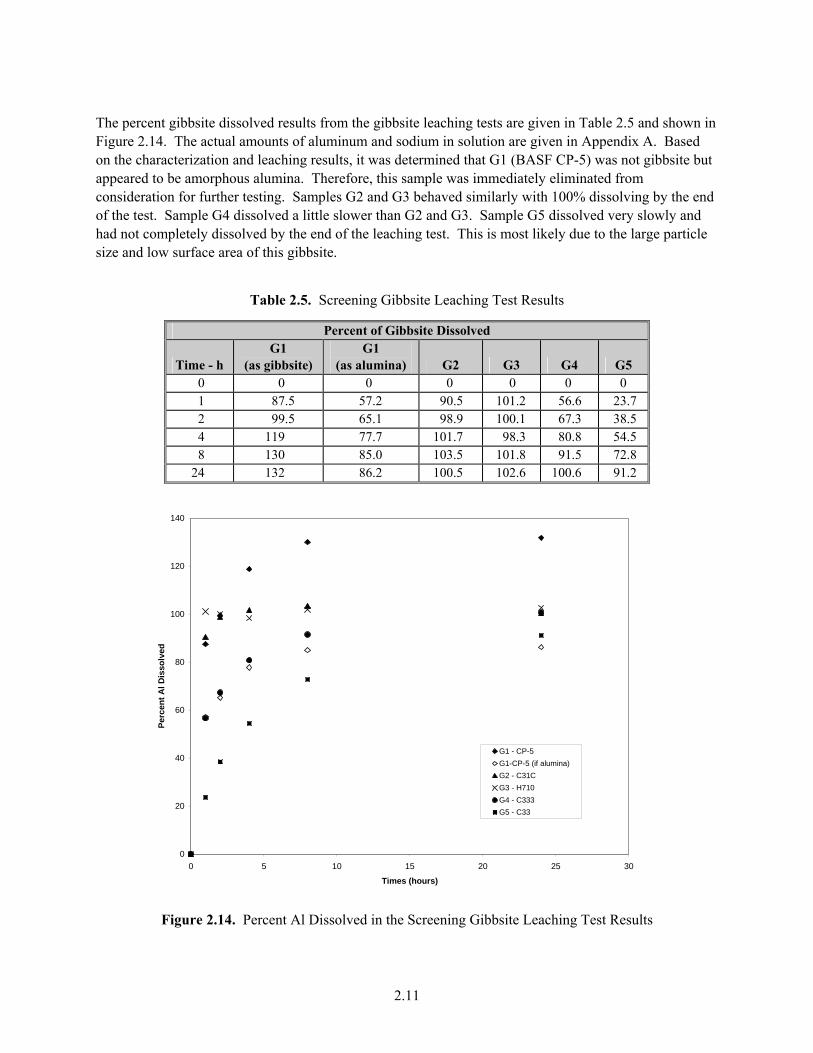
The percent gibbsite dissolved results from the gibbsite leaching tests are given in Table 2.5 and shown in Figure 2.14. The actual amounts of aluminum and sodium in solution are given in Appendix A. Based on the characterization and leaching results, it was determined that G1 (BASF CP-5) was not gibbsite but appeared to be amorphous alumina. Therefore, this sample was immediately eliminated from consideration for further testing. Samples G2 and G3 behaved similarly with 100% dissolving by the end of the test. Sample G4 dissolved a little slower than G2 and G3. Sample G5 dissolved very slowly and had not completely dissolved by the end of the leaching test. This is most likely due to the large particle size and low surface area of this gibbsite.
Table 2.5. Screening Gibbsite Leaching Test Results
Percent of Gibbsite Dissolved
Time - h G1
(as gibbsite) G1
(as alumina) G2 G3 G4 G5 0 0 0 0 0 0 0 1 87.5 57.2 90.5 101.2 56.6 23.7 2 99.5 65.1 98.9 100.1 67.3 38.5 4 119 77.7 101.7 98.3 80.8 54.5 8 130 85.0 103.5 101.8 91.5 72.8
24 132 86.2 100.5 102.6 100.6 91.2
0
20
40
60
80
100
120
140
0 5 10 15 20 25 30
Times (hours)
Per
cen
t A
l D
isso
lved
G1 - CP-5
G1-CP-5 (if alumina)
G2 - C31C
G3 - H710
G4 - C333
G5 - C33
Figure 2.14. Percent Al Dissolved in the Screening Gibbsite Leaching Test Results
3.1
3.0 Determination of the Appropriate Gibbsite Simulant
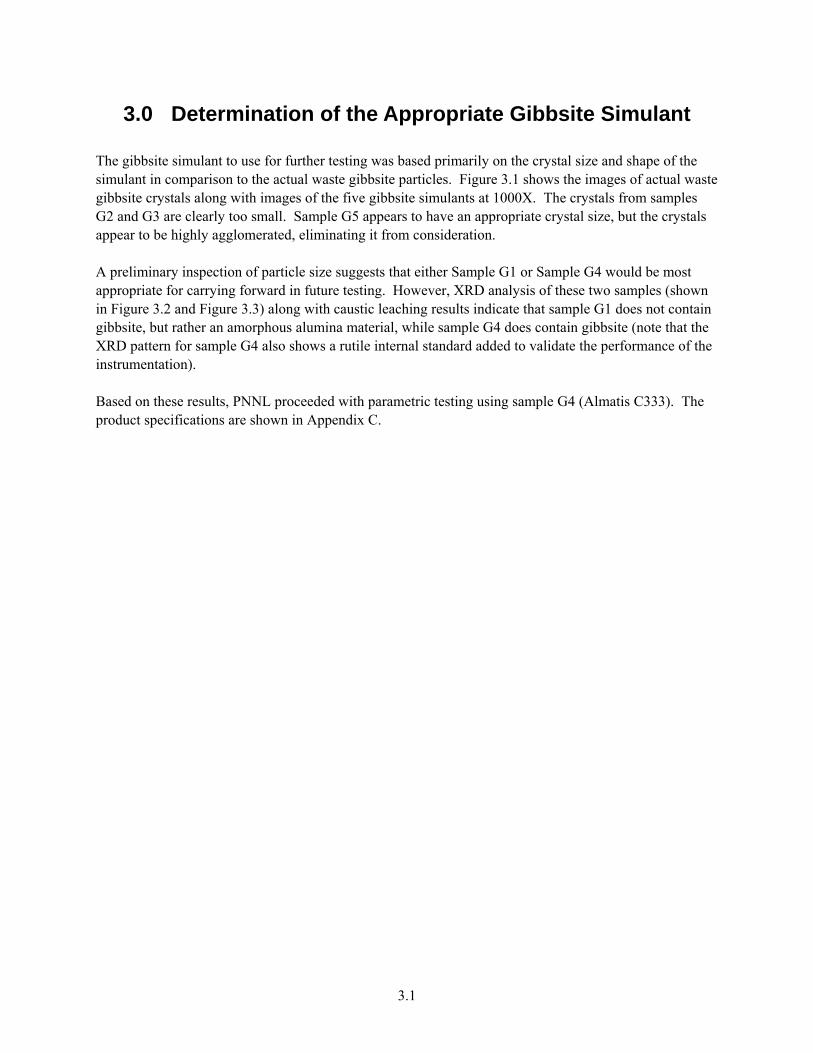
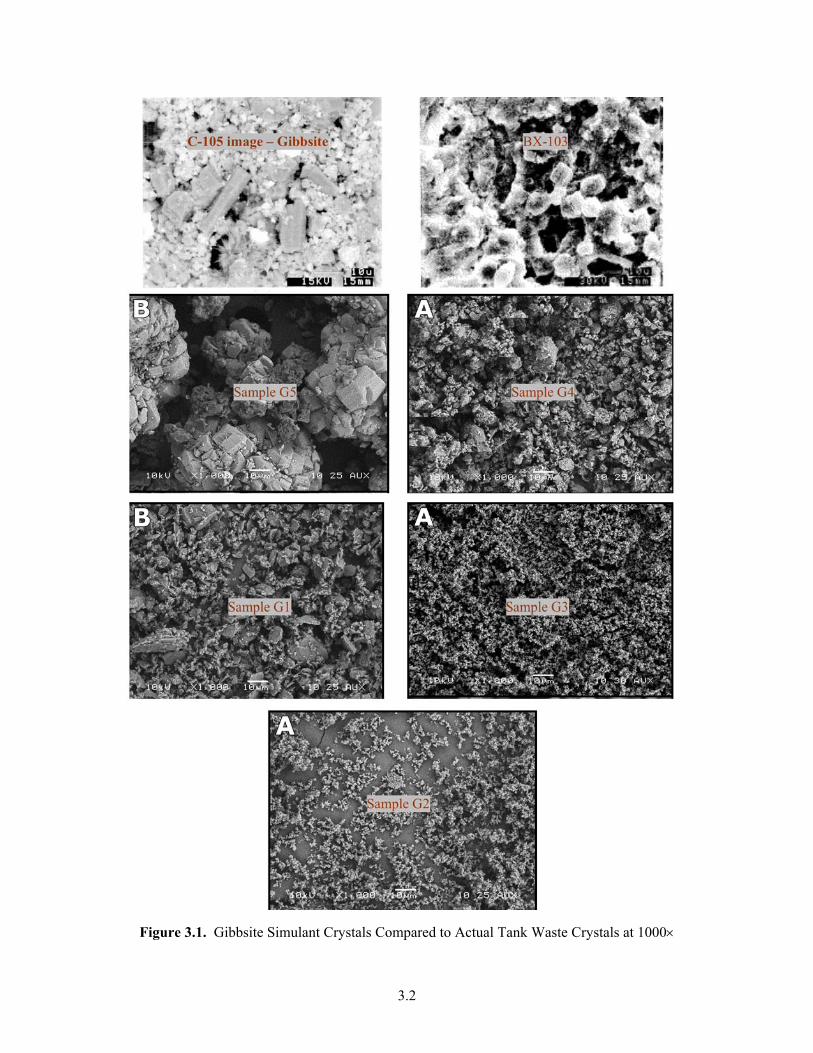
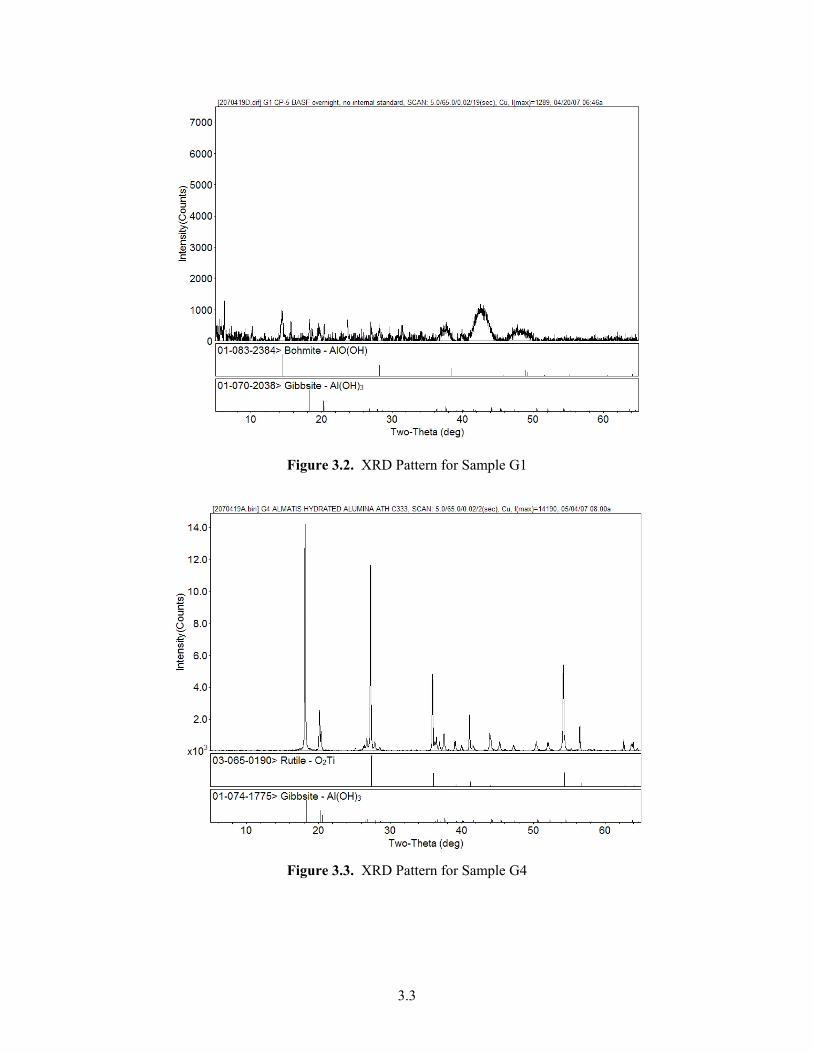
The gibbsite simulant to use for further testing was based primarily on the crystal size and shape of the simulant in comparison to the actual waste gibbsite particles. Figure 3.1 shows the images of actual waste gibbsite crystals along with images of the five gibbsite simulants at 1000X. The crystals from samples G2 and G3 are clearly too small. Sample G5 appears to have an appropriate crystal size, but the crystals appear to be highly agglomerated, eliminating it from consideration. A preliminary inspection of particle size suggests that either Sample G1 or Sample G4 would be most appropriate for carrying forward in future testing. However, XRD analysis of these two samples (shown in Figure 3.2 and Figure 3.3) along with caustic leaching results indicate that sample G1 does not contain gibbsite, but rather an amorphous alumina material, while sample G4 does contain gibbsite (note that the XRD pattern for sample G4 also shows a rutile internal standard added to validate the performance of the instrumentation). Based on these results, PNNL proceeded with parametric testing using sample G4 (Almatis C333). The product specifications are shown in Appendix C.
3.2
Figure 3.1. Gibbsite Simulant Crystals Compared to Actual Tank Waste Crystals at 1000
3.3
Figure 3.2. XRD Pattern for Sample G1
Figure 3.3. XRD Pattern for Sample G4
4.1
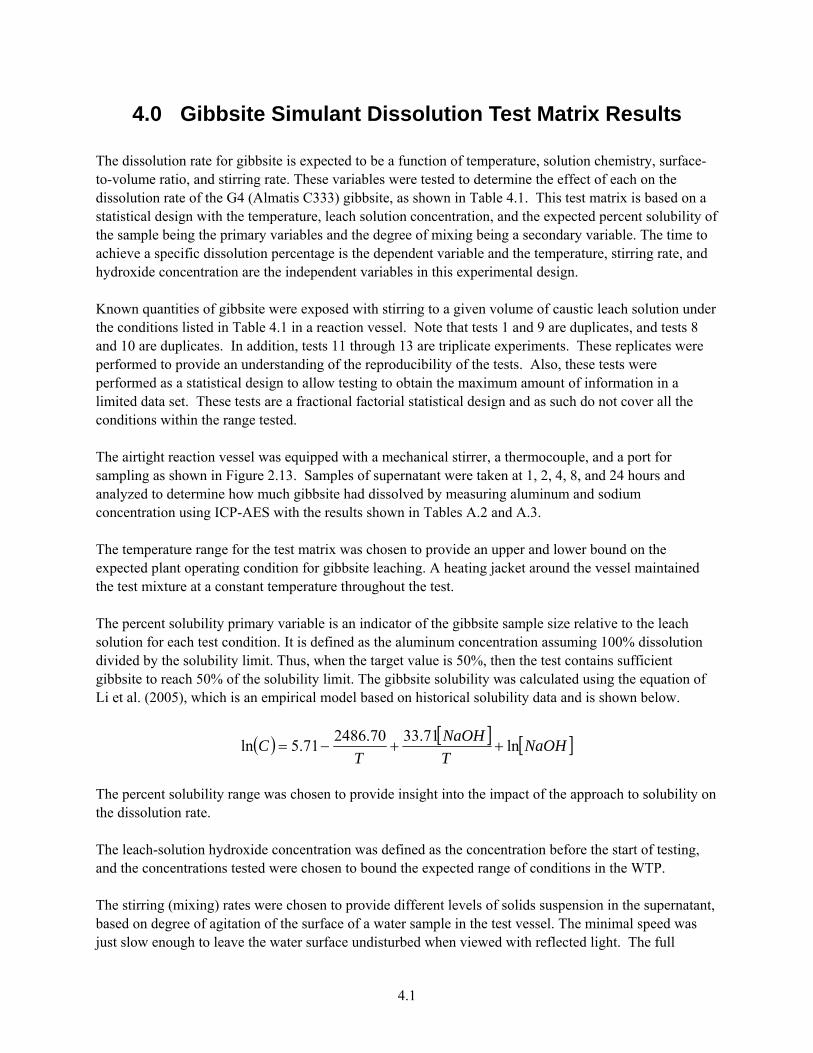
4.0 Gibbsite Simulant Dissolution Test Matrix Results
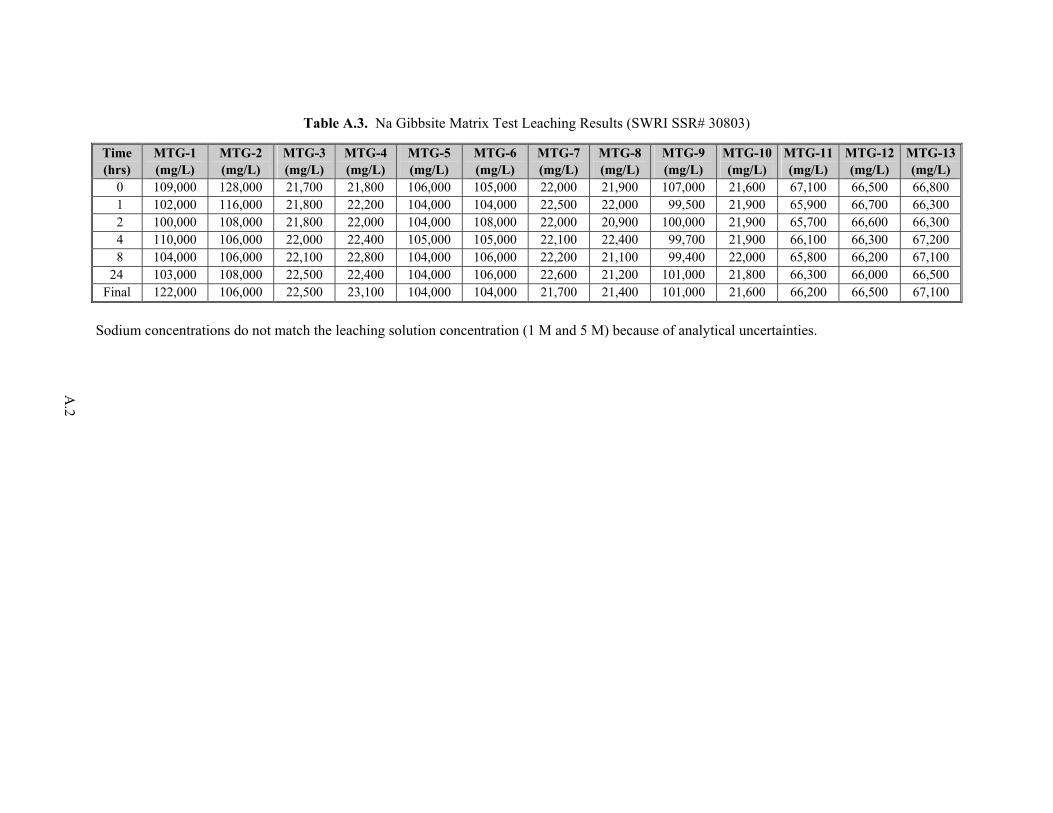
The dissolution rate for gibbsite is expected to be a function of temperature, solution chemistry, surface-to-volume ratio, and stirring rate. These variables were tested to determine the effect of each on the dissolution rate of the G4 (Almatis C333) gibbsite, as shown in Table 4.1. This test matrix is based on a statistical design with the temperature, leach solution concentration, and the expected percent solubility of the sample being the primary variables and the degree of mixing being a secondary variable. The time to achieve a specific dissolution percentage is the dependent variable and the temperature, stirring rate, and hydroxide concentration are the independent variables in this experimental design. Known quantities of gibbsite were exposed with stirring to a given volume of caustic leach solution under the conditions listed in Table 4.1 in a reaction vessel. Note that tests 1 and 9 are duplicates, and tests 8 and 10 are duplicates. In addition, tests 11 through 13 are triplicate experiments. These replicates were performed to provide an understanding of the reproducibility of the tests. Also, these tests were performed as a statistical design to allow testing to obtain the maximum amount of information in a limited data set. These tests are a fractional factorial statistical design and as such do not cover all the conditions within the range tested. The airtight reaction vessel was equipped with a mechanical stirrer, a thermocouple, and a port for sampling as shown in Figure 2.13. Samples of supernatant were taken at 1, 2, 4, 8, and 24 hours and analyzed to determine how much gibbsite had dissolved by measuring aluminum and sodium concentration using ICP-AES with the results shown in Tables A.2 and A.3. The temperature range for the test matrix was chosen to provide an upper and lower bound on the expected plant operating condition for gibbsite leaching. A heating jacket around the vessel maintained the test mixture at a constant temperature throughout the test. The percent solubility primary variable is an indicator of the gibbsite sample size relative to the leach solution for each test condition. It is defined as the aluminum concentration assuming 100% dissolution divided by the solubility limit. Thus, when the target value is 50%, then the test contains sufficient gibbsite to reach 50% of the solubility limit. The gibbsite solubility was calculated using the equation of Li et al. (2005), which is an empirical model based on historical solubility data and is shown below.
NaOHT
NaOH
TC ln
71.3370.248671.5ln
The percent solubility range was chosen to provide insight into the impact of the approach to solubility on the dissolution rate. The leach-solution hydroxide concentration was defined as the concentration before the start of testing, and the concentrations tested were chosen to bound the expected range of conditions in the WTP. The stirring (mixing) rates were chosen to provide different levels of solids suspension in the supernatant, based on degree of agitation of the surface of a water sample in the test vessel. The minimal speed was just slow enough to leave the water surface undisturbed when viewed with reflected light. The full
4.2
mixing resulted in a well-agitated surface, and the intermediate mixing rate resulted in minor agitation of the surface. The minimal mixing rate (40 rpm) was intended to be just sufficient to keep the solids from completely settling on the bottom of the container in order to maintain contact with the bulk liquid. The full speed rate was intended to give a completely homogeneous suspension of the solids, and the ½ speed rate was intended to result in an intermediate solids suspension. The digital rate controllers for the stirring motors were set to specific revolutions per minute (rpm), and the rates at different settings verified by direct observation and manual timing. The variation in the stirring rates is expected to be less than 1%.
Table 4.1. Gibbsite Testing Matrix
Test ID % Solubility Temperature (°C) Mixing (rpm) Leach Soln Conc.MTG-1 100 80 Full (120) 5 M NaOH MTG-2 50 80 Minimal (40) 5 M NaOH MTG-3 100 80 Minimal (40) 1 M NaOH MTG-4 50 80 Full (120) 1 M NaOH MTG-5 100 40 Minimal (40) 5 M NaOH MTG-6 50 40 Full (120) 5 M NaOH MTG-7 100 40 Full (120) 1 M NaOH MTG-8 50 40 Minimal (40) 1 M NaOH MTG-9 100 80 Full (120) 5 M NaOH MTG-10 50 40 Minimal (40) 1 M NaOH MTG-11 75 60 ½ Speed (60) 3 M NaOH MTG-12 75 60 ½ Speed (60) 3 M NaOH MTG-13 75 60 ½ Speed (60) 3 M NaOH
Figure 4.1 shows the effect of hydroxide concentration on gibbsite dissolution with the 5-M NaOH solution dissolving more than the 1-M NaOH solution (MTG-6 and MTG-7). This indicates that hydroxide concentration has a significant effect on the gibbsite dissolution. Complete results of these tests are shown in Appendix A.

4.3
0
0.1
0.2
0.3
0.4
0.5
0.6
0.7
0 5 10 15 20 25
Time (hours)
Fra
ctio
n D
isso
lved
40 C - 5 M -Full Mixing
40 C - 1 M - Full Mixing
Figure 4.1. Effect of Hydroxide Concentration on Gibbsite Dissolution.
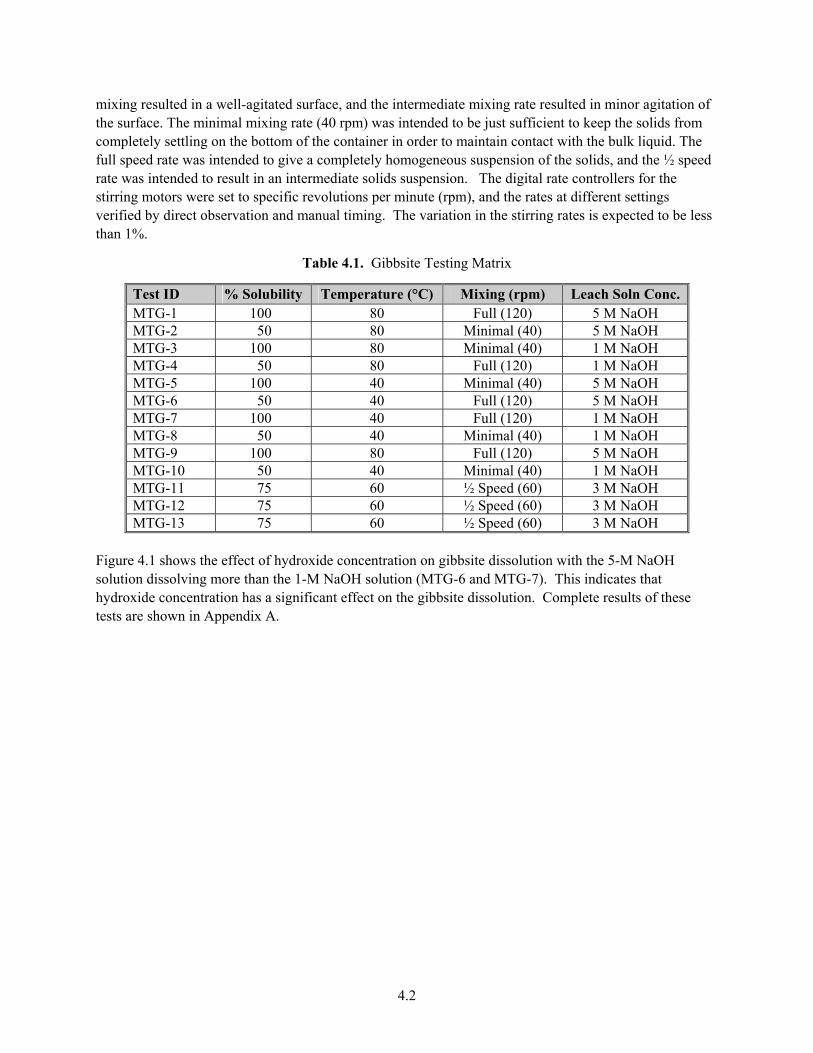
Results of Tests MTG-6 and MTG-7 Figure 4.2 compares dissolution data for gibbsite leached at 40°C and 80°C in 5 M NaOH at full mixing (120 rpm) (MTG-1 and MTG-6). Mixing over the range tested has a significant effect in the dissolution rate for the gibbsite tested (G4).
4.4
0
0.1
0.2
0.3
0.4
0.5
0.6
0.7
0.8
0.9
0 5 10 15 20 25 30
Time (hours)
Fra
ctio
n D
isso
lved
80 C - 5 M - Full Mixing
40 C - 5 M -Full Mixing
Figure 4.2. Effect of Temperature on Gibbsite Dissolution.
Results of Tests MTG-1 and MTG-6
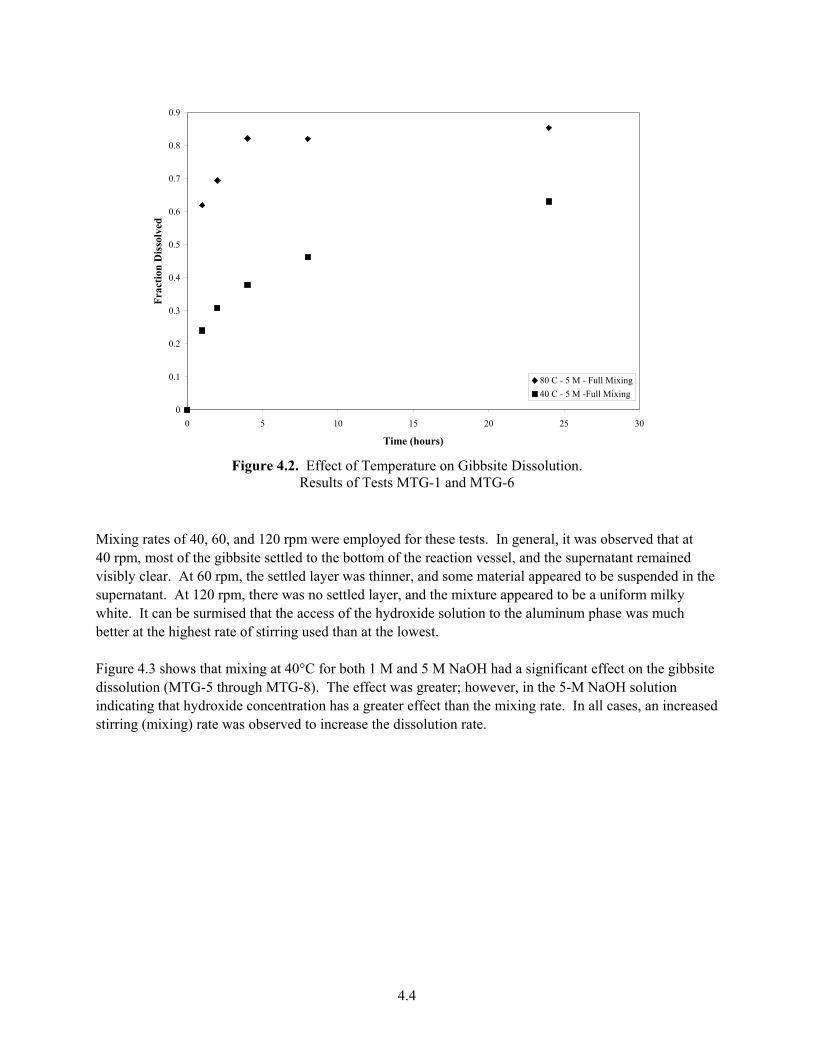
Mixing rates of 40, 60, and 120 rpm were employed for these tests. In general, it was observed that at 40 rpm, most of the gibbsite settled to the bottom of the reaction vessel, and the supernatant remained visibly clear. At 60 rpm, the settled layer was thinner, and some material appeared to be suspended in the supernatant. At 120 rpm, there was no settled layer, and the mixture appeared to be a uniform milky white. It can be surmised that the access of the hydroxide solution to the aluminum phase was much better at the highest rate of stirring used than at the lowest. Figure 4.3 shows that mixing at 40°C for both 1 M and 5 M NaOH had a significant effect on the gibbsite dissolution (MTG-5 through MTG-8). The effect was greater; however, in the 5-M NaOH solution indicating that hydroxide concentration has a greater effect than the mixing rate. In all cases, an increased stirring (mixing) rate was observed to increase the dissolution rate.
4.5
0
0.1
0.2
0.3
0.4
0.5
0.6
0.7
0 5 10 15 20 25 30
Time (hours)
Fra
ctio
n D
isso
lved
40 C - 5 M - Minimal Mixing
40 C - 1 M -Minimal Mixing
40 C -1 M - Full Mixing
40 C - 5 M - Full Mixing
Figure 4.3. Mixing Effect on Gibbsite Dissolution in 1 M (MTG-7 and MTG-8) and
5 M NaOH (MTG-5 and MTG-6) at 40°C
5.1
5.0 Gibbsite Simulant Blend Testing
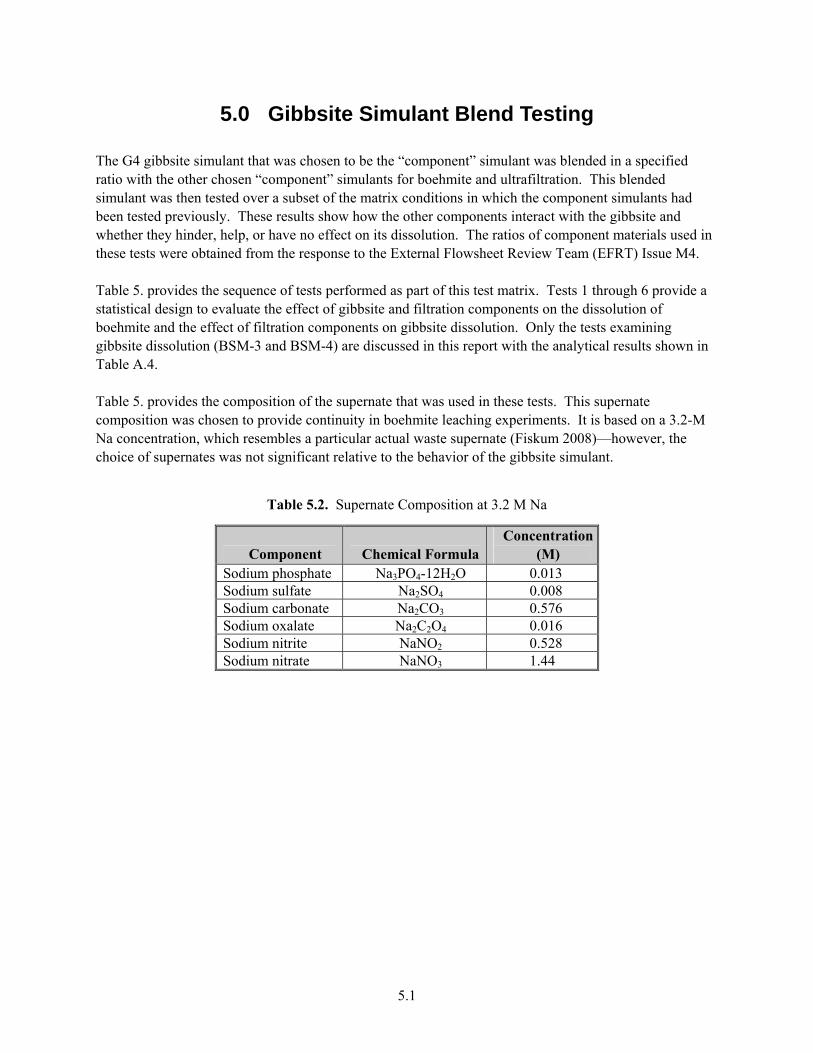
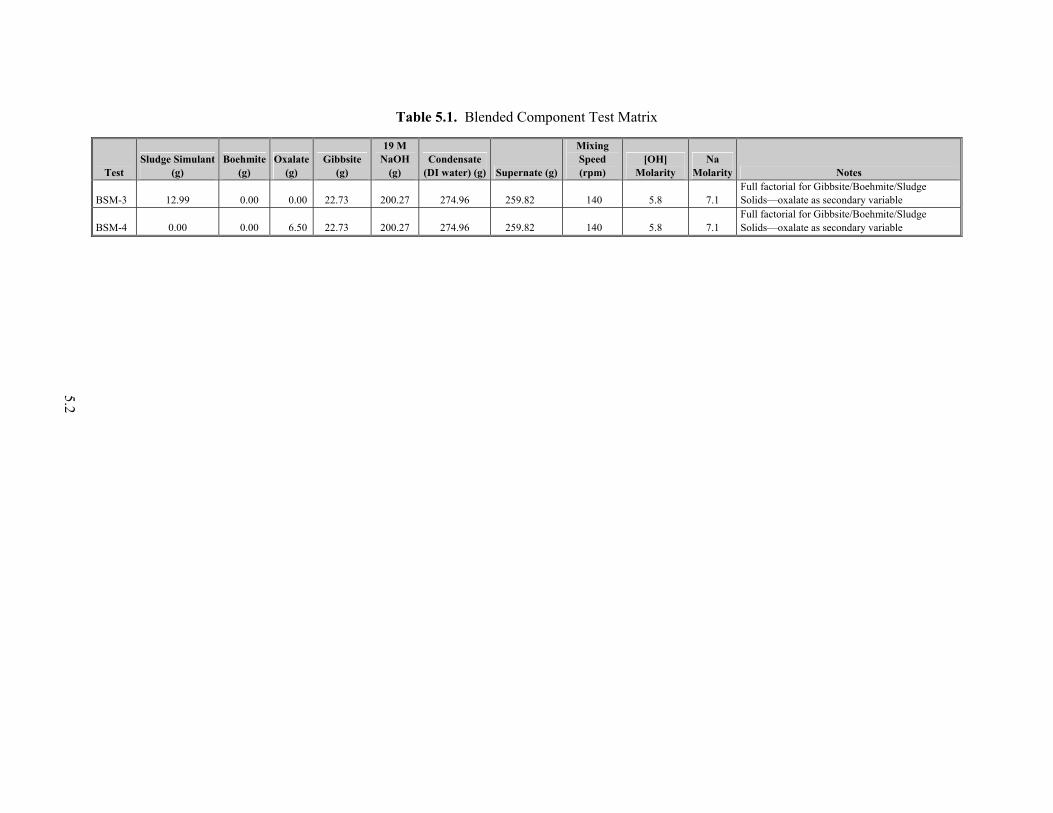
The G4 gibbsite simulant that was chosen to be the “component” simulant was blended in a specified ratio with the other chosen “component” simulants for boehmite and ultrafiltration. This blended simulant was then tested over a subset of the matrix conditions in which the component simulants had been tested previously. These results show how the other components interact with the gibbsite and whether they hinder, help, or have no effect on its dissolution. The ratios of component materials used in these tests were obtained from the response to the External Flowsheet Review Team (EFRT) Issue M4. Table 5. provides the sequence of tests performed as part of this test matrix. Tests 1 through 6 provide a statistical design to evaluate the effect of gibbsite and filtration components on the dissolution of boehmite and the effect of filtration components on gibbsite dissolution. Only the tests examining gibbsite dissolution (BSM-3 and BSM-4) are discussed in this report with the analytical results shown in Table A.4. Table 5. provides the composition of the supernate that was used in these tests. This supernate composition was chosen to provide continuity in boehmite leaching experiments. It is based on a 3.2-M Na concentration, which resembles a particular actual waste supernate (Fiskum 2008)—however, the choice of supernates was not significant relative to the behavior of the gibbsite simulant.
Table 5.2. Supernate Composition at 3.2 M Na
Component Chemical FormulaConcentration
(M) Sodium phosphate Na3PO4-12H2O 0.013 Sodium sulfate Na2SO4 0.008 Sodium carbonate Na2CO3 0.576 Sodium oxalate Na2C2O4 0.016 Sodium nitrite NaNO2 0.528 Sodium nitrate NaNO3 1.44
5.2
Table 5.1. Blended Component Test Matrix
Test Sludge Simulant
(g) Boehmite
(g) Oxalate
(g) Gibbsite
(g)
19 M NaOH
(g) Condensate
(DI water) (g) Supernate (g)
Mixing Speed (rpm)
[OH] Molarity
Na Molarity Notes
BSM-3 12.99 0.00 0.00 22.73 200.27 274.96 259.82 140 5.8 7.1 Full factorial for Gibbsite/Boehmite/Sludge Solids—oxalate as secondary variable
BSM-4 0.00 0.00 6.50 22.73 200.27 274.96 259.82 140 5.8 7.1 Full factorial for Gibbsite/Boehmite/Sludge Solids—oxalate as secondary variable
5.3
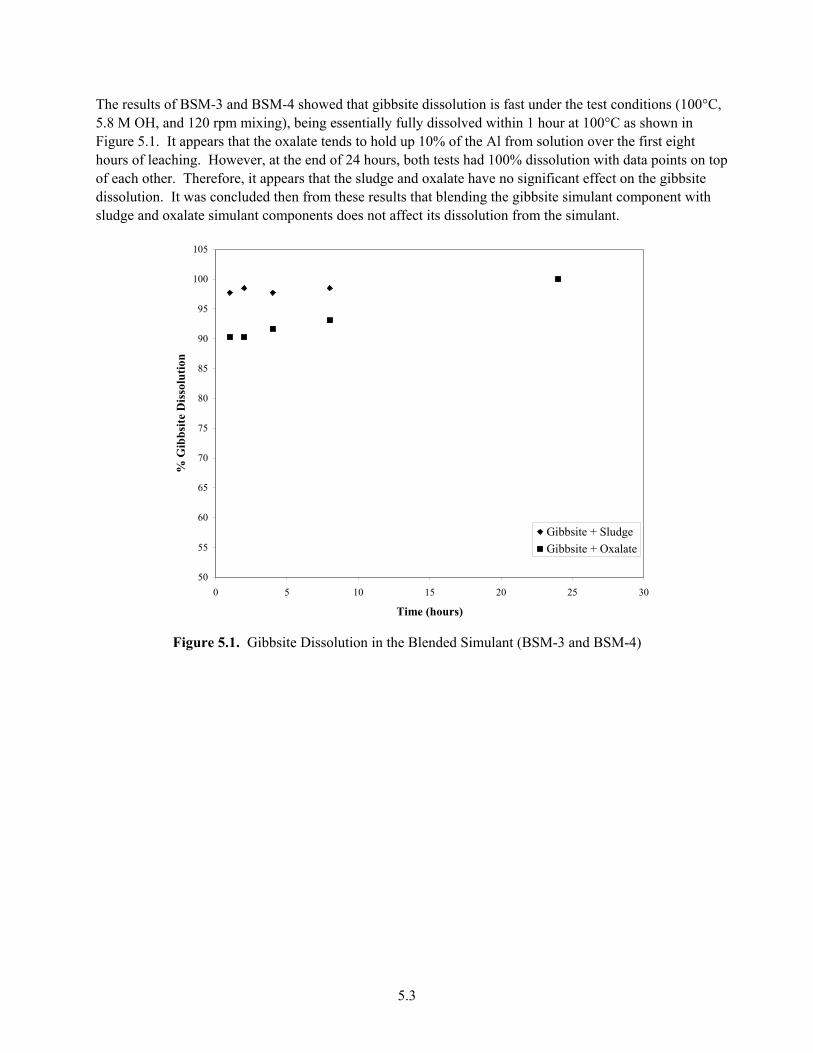
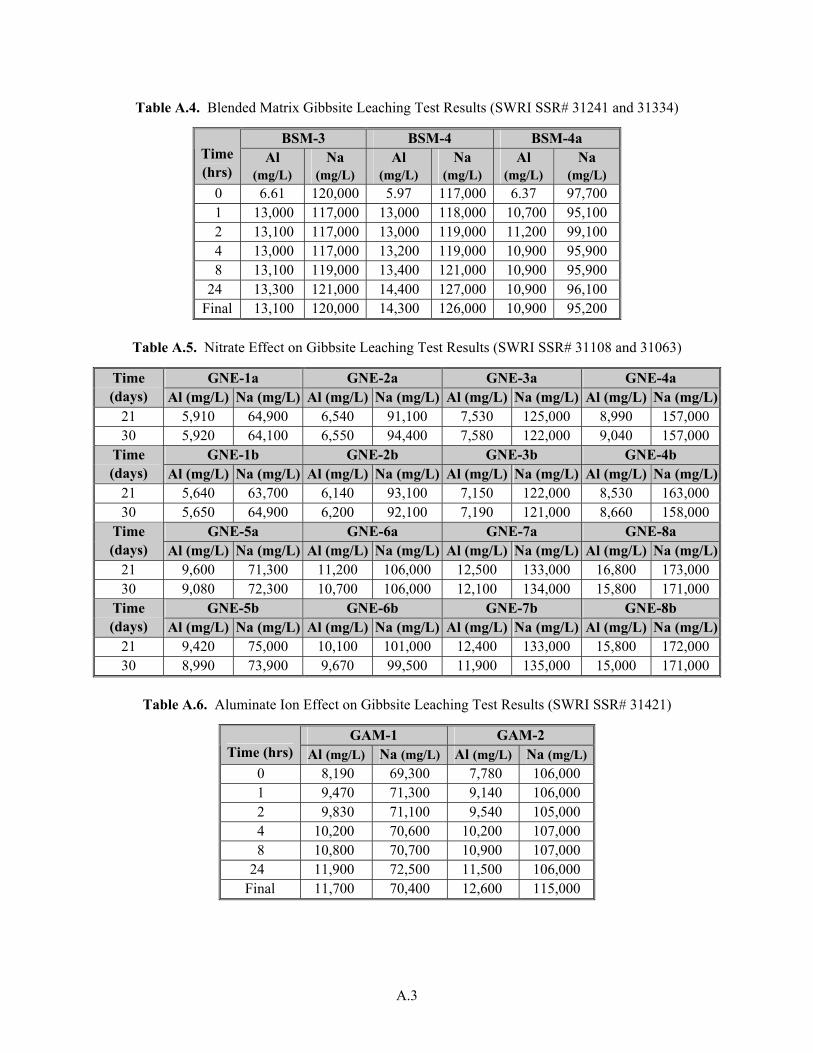
The results of BSM-3 and BSM-4 showed that gibbsite dissolution is fast under the test conditions (100°C, 5.8 M OH, and 120 rpm mixing), being essentially fully dissolved within 1 hour at 100°C as shown in Figure 5.1. It appears that the oxalate tends to hold up 10% of the Al from solution over the first eight hours of leaching. However, at the end of 24 hours, both tests had 100% dissolution with data points on top of each other. Therefore, it appears that the sludge and oxalate have no significant effect on the gibbsite dissolution. It was concluded then from these results that blending the gibbsite simulant component with sludge and oxalate simulant components does not affect its dissolution from the simulant.
50
55
60
65
70
75
80
85
90
95
100
105
0 5 10 15 20 25 30
Time (hours)
% G
ibb
site
Dis
solu
tion
Gibbsite + Sludge
Gibbsite + Oxalate
Figure 5.1. Gibbsite Dissolution in the Blended Simulant (BSM-3 and BSM-4)
6.1
6.0 Nitrate Effect on Gibbsite Dissolution
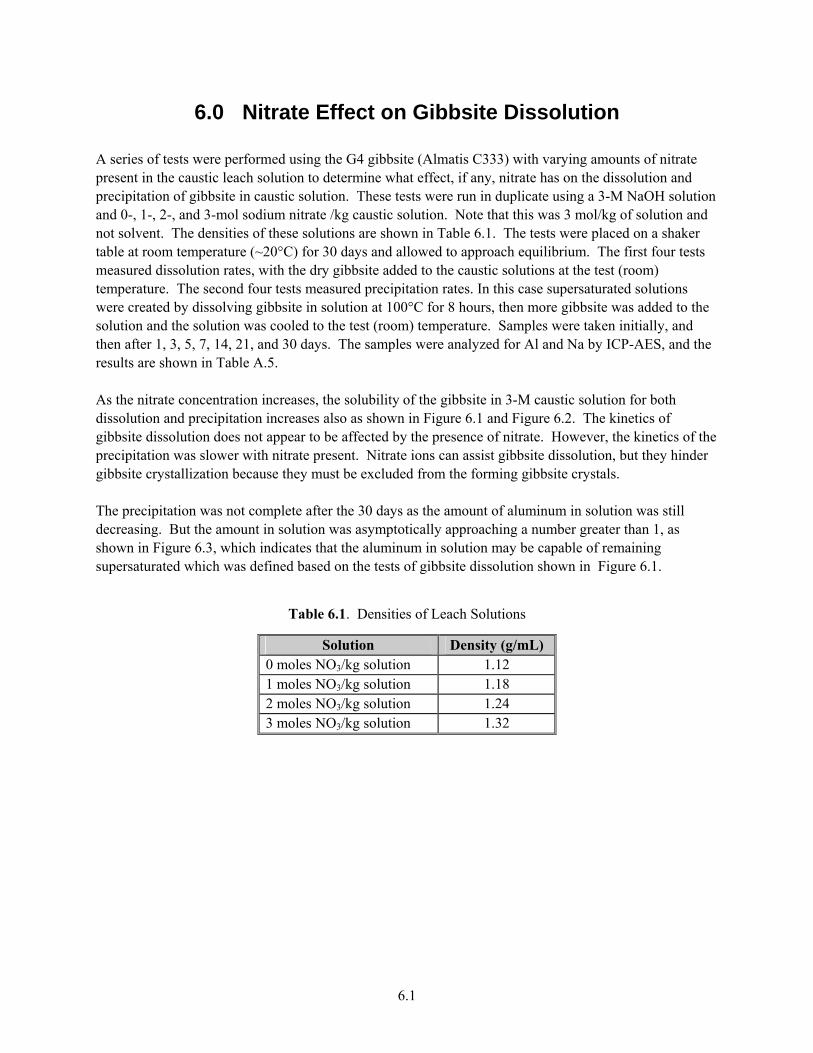
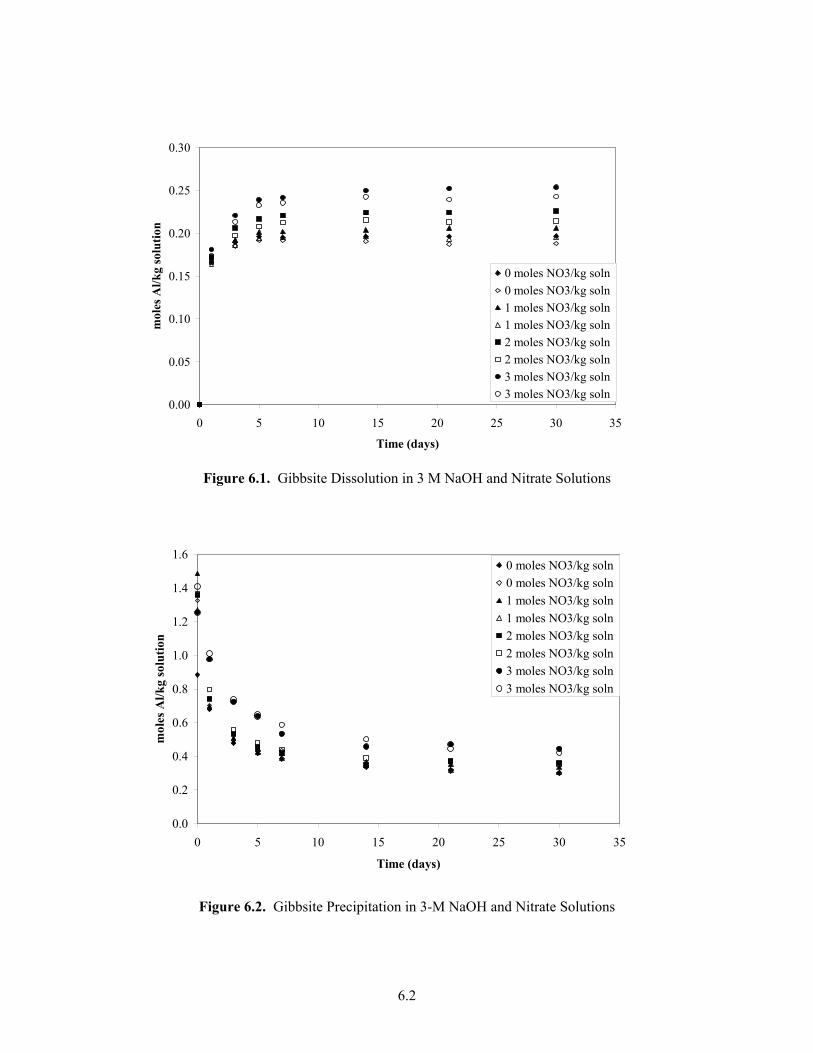
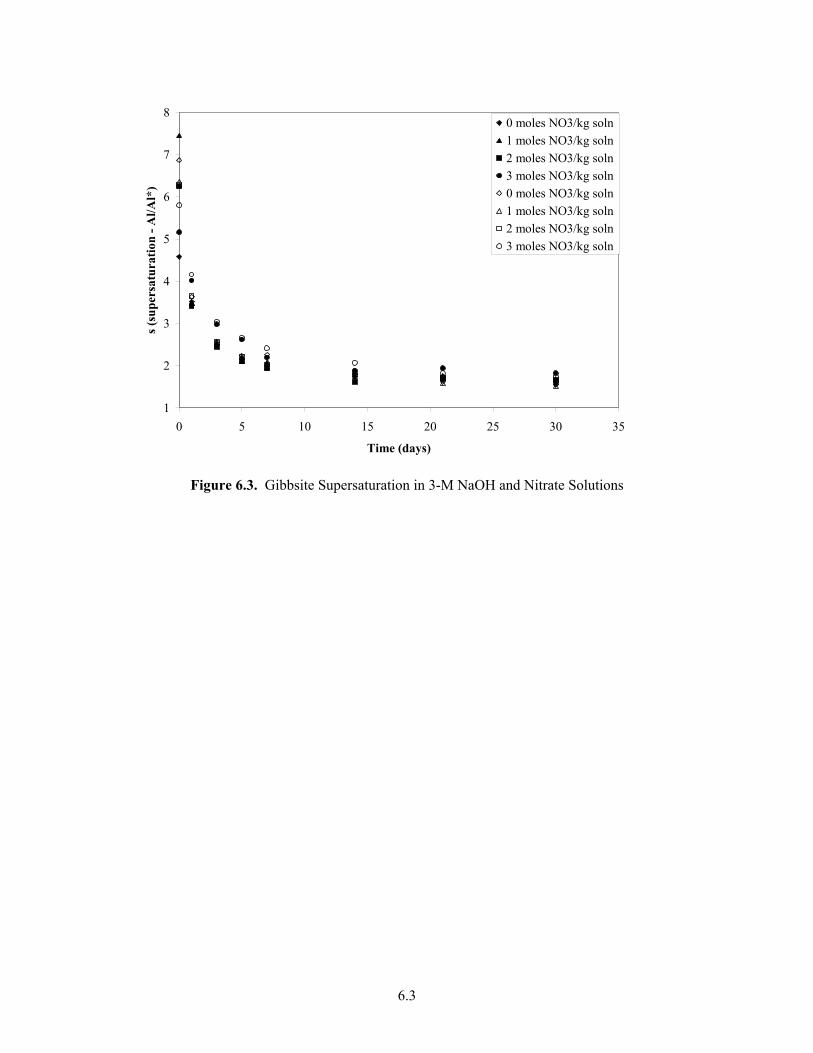
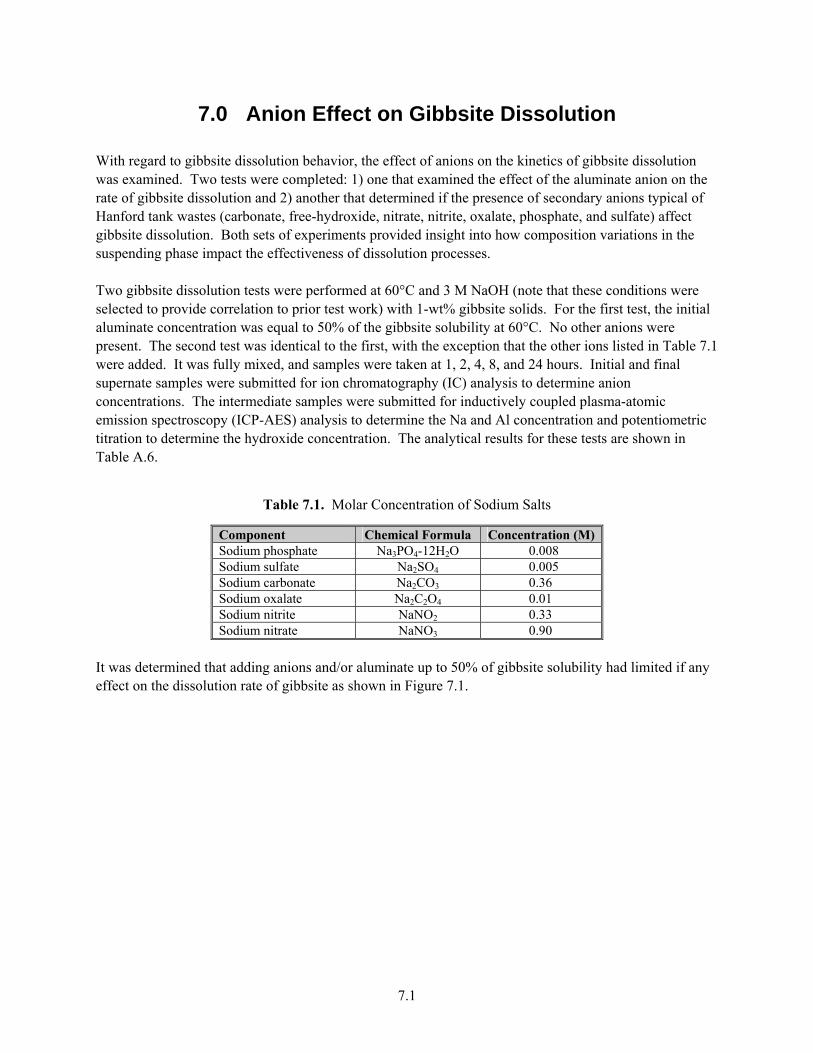
A series of tests were performed using the G4 gibbsite (Almatis C333) with varying amounts of nitrate present in the caustic leach solution to determine what effect, if any, nitrate has on the dissolution and precipitation of gibbsite in caustic solution. These tests were run in duplicate using a 3-M NaOH solution and 0-, 1-, 2-, and 3-mol sodium nitrate /kg caustic solution. Note that this was 3 mol/kg of solution and not solvent. The densities of these solutions are shown in Table 6.1. The tests were placed on a shaker table at room temperature (~20°C) for 30 days and allowed to approach equilibrium. The first four tests measured dissolution rates, with the dry gibbsite added to the caustic solutions at the test (room) temperature. The second four tests measured precipitation rates. In this case supersaturated solutions were created by dissolving gibbsite in solution at 100°C for 8 hours, then more gibbsite was added to the solution and the solution was cooled to the test (room) temperature. Samples were taken initially, and then after 1, 3, 5, 7, 14, 21, and 30 days. The samples were analyzed for Al and Na by ICP-AES, and the results are shown in Table A.5. As the nitrate concentration increases, the solubility of the gibbsite in 3-M caustic solution for both dissolution and precipitation increases also as shown in Figure 6.1 and Figure 6.2. The kinetics of gibbsite dissolution does not appear to be affected by the presence of nitrate. However, the kinetics of the precipitation was slower with nitrate present. Nitrate ions can assist gibbsite dissolution, but they hinder gibbsite crystallization because they must be excluded from the forming gibbsite crystals. The precipitation was not complete after the 30 days as the amount of aluminum in solution was still decreasing. But the amount in solution was asymptotically approaching a number greater than 1, as shown in Figure 6.3, which indicates that the aluminum in solution may be capable of remaining supersaturated which was defined based on the tests of gibbsite dissolution shown in Figure 6.1.
Table 6.1. Densities of Leach Solutions
Solution Density (g/mL) 0 moles NO3/kg solution 1.12 1 moles NO3/kg solution 1.18 2 moles NO3/kg solution 1.24 3 moles NO3/kg solution 1.32
6.2
0.00
0.05
0.10
0.15
0.20
0.25
0.30
0 5 10 15 20 25 30 35
Time (days)
mol
es A
l/k
g so
luti
on
0 moles NO3/kg soln
0 moles NO3/kg soln
1 moles NO3/kg soln
1 moles NO3/kg soln
2 moles NO3/kg soln
2 moles NO3/kg soln
3 moles NO3/kg soln
3 moles NO3/kg soln
Figure 6.1. Gibbsite Dissolution in 3 M NaOH and Nitrate Solutions
0.0
0.2
0.4
0.6
0.8
1.0
1.2
1.4
1.6
0 5 10 15 20 25 30 35
Time (days)
mol
es A
l/k
g so
luti
on
0 moles NO3/kg soln
0 moles NO3/kg soln
1 moles NO3/kg soln
1 moles NO3/kg soln
2 moles NO3/kg soln
2 moles NO3/kg soln
3 moles NO3/kg soln
3 moles NO3/kg soln
Figure 6.2. Gibbsite Precipitation in 3-M NaOH and Nitrate Solutions
6.3
1
2
3
4
5
6
7
8
0 5 10 15 20 25 30 35
Time (days)
s (s
up
ersa
tura
tion
- A
l/Al*
)
0 moles NO3/kg soln
1 moles NO3/kg soln
2 moles NO3/kg soln
3 moles NO3/kg soln
0 moles NO3/kg soln
1 moles NO3/kg soln
2 moles NO3/kg soln
3 moles NO3/kg soln
Figure 6.3. Gibbsite Supersaturation in 3-M NaOH and Nitrate Solutions
7.1
7.0 Anion Effect on Gibbsite Dissolution
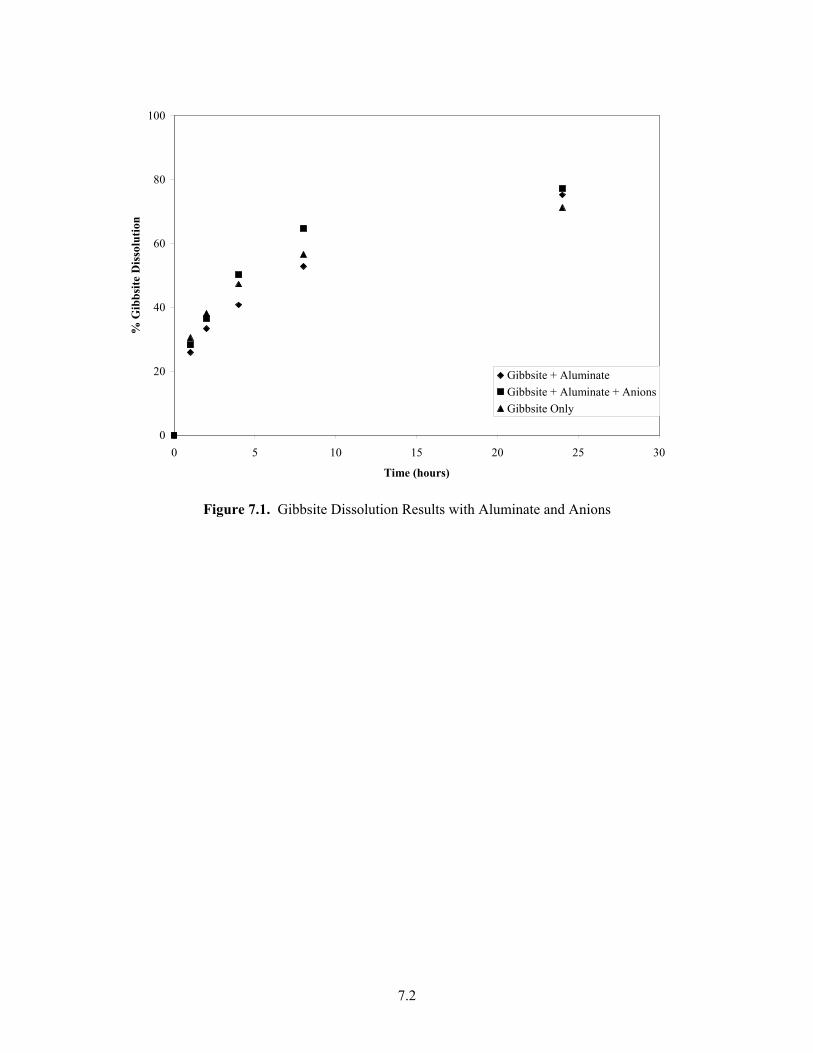
With regard to gibbsite dissolution behavior, the effect of anions on the kinetics of gibbsite dissolution was examined. Two tests were completed: 1) one that examined the effect of the aluminate anion on the rate of gibbsite dissolution and 2) another that determined if the presence of secondary anions typical of Hanford tank wastes (carbonate, free-hydroxide, nitrate, nitrite, oxalate, phosphate, and sulfate) affect gibbsite dissolution. Both sets of experiments provided insight into how composition variations in the suspending phase impact the effectiveness of dissolution processes. Two gibbsite dissolution tests were performed at 60°C and 3 M NaOH (note that these conditions were selected to provide correlation to prior test work) with 1-wt% gibbsite solids. For the first test, the initial aluminate concentration was equal to 50% of the gibbsite solubility at 60°C. No other anions were present. The second test was identical to the first, with the exception that the other ions listed in Table 7.1 were added. It was fully mixed, and samples were taken at 1, 2, 4, 8, and 24 hours. Initial and final supernate samples were submitted for ion chromatography (IC) analysis to determine anion concentrations. The intermediate samples were submitted for inductively coupled plasma-atomic emission spectroscopy (ICP-AES) analysis to determine the Na and Al concentration and potentiometric titration to determine the hydroxide concentration. The analytical results for these tests are shown in Table A.6.
Table 7.1. Molar Concentration of Sodium Salts
Component Chemical Formula Concentration (M) Sodium phosphate Na3PO4-12H2O 0.008 Sodium sulfate Na2SO4 0.005 Sodium carbonate Na2CO3 0.36 Sodium oxalate Na2C2O4 0.01 Sodium nitrite NaNO2 0.33 Sodium nitrate NaNO3 0.90
It was determined that adding anions and/or aluminate up to 50% of gibbsite solubility had limited if any effect on the dissolution rate of gibbsite as shown in Figure 7.1.
7.2
0
20
40
60
80
100
0 5 10 15 20 25 30
Time (hours)
% G
ibb
site
Dis
solu
tion
Gibbsite + Aluminate
Gibbsite + Aluminate + Anions
Gibbsite Only
Figure 7.1. Gibbsite Dissolution Results with Aluminate and Anions
8.1
8.0 Gibbsite Simulant Evaluation Against Actual Waste Results
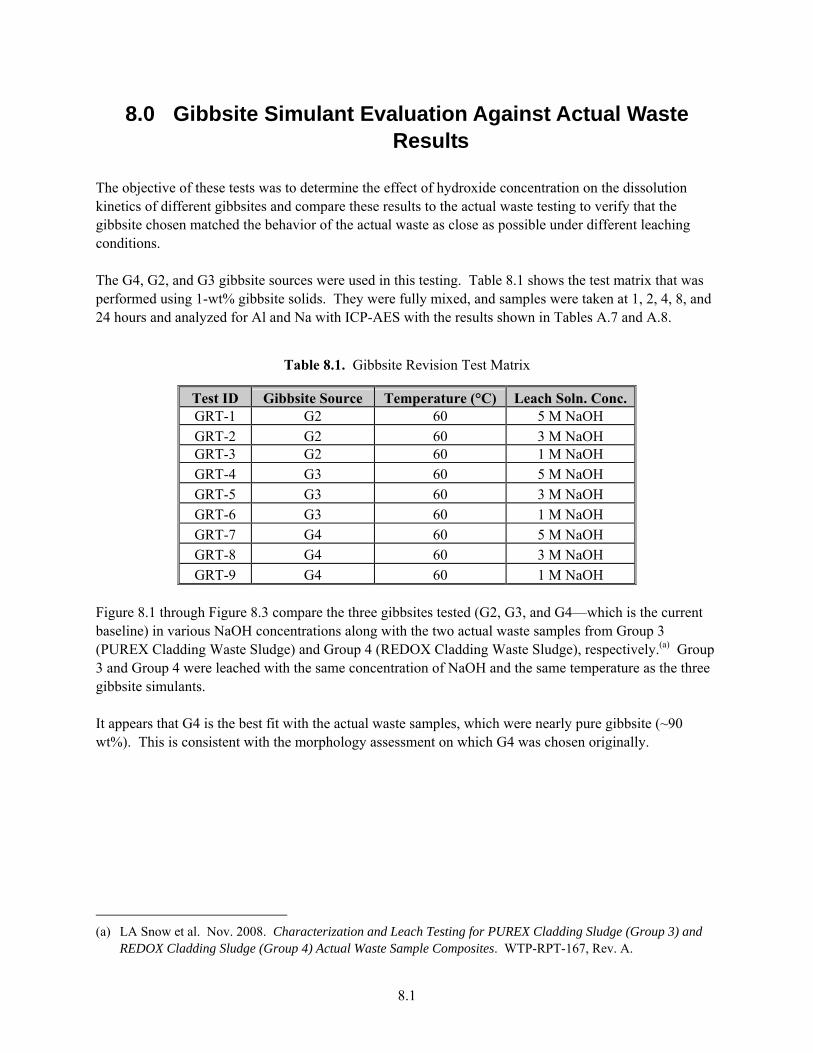
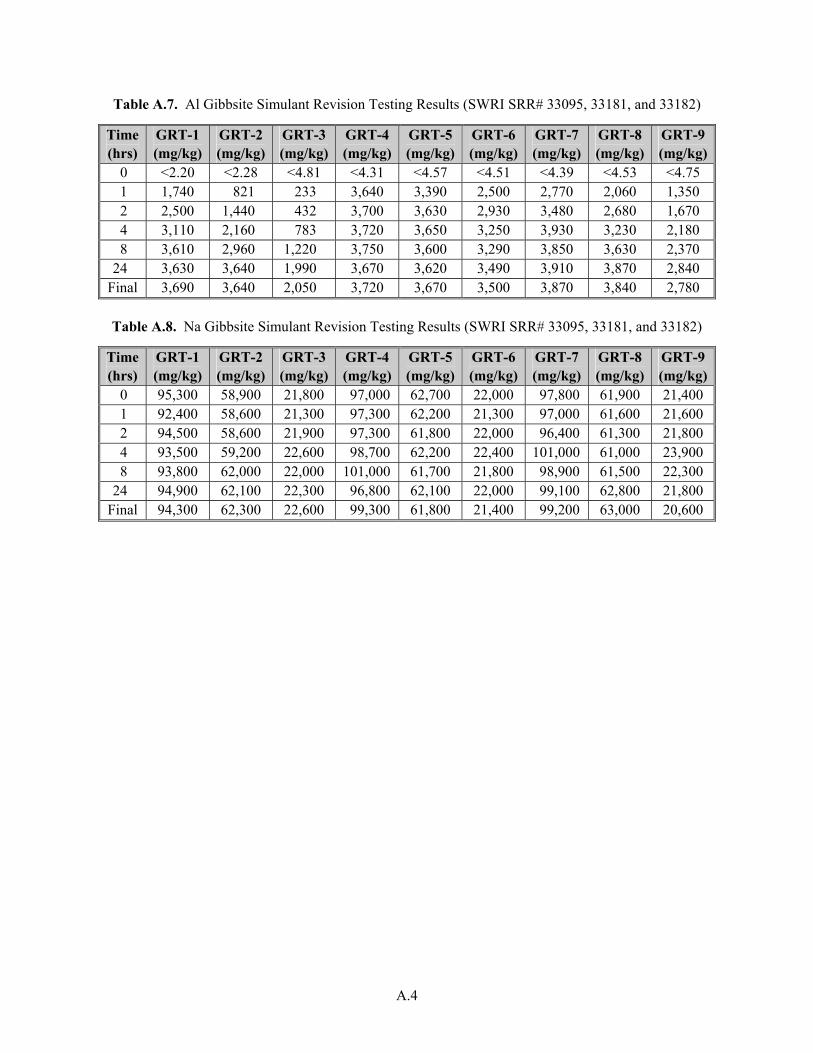
The objective of these tests was to determine the effect of hydroxide concentration on the dissolution kinetics of different gibbsites and compare these results to the actual waste testing to verify that the gibbsite chosen matched the behavior of the actual waste as close as possible under different leaching conditions. The G4, G2, and G3 gibbsite sources were used in this testing. Table 8.1 shows the test matrix that was performed using 1-wt% gibbsite solids. They were fully mixed, and samples were taken at 1, 2, 4, 8, and 24 hours and analyzed for Al and Na with ICP-AES with the results shown in Tables A.7 and A.8.
Table 8.1. Gibbsite Revision Test Matrix
Test ID Gibbsite Source Temperature (°C) Leach Soln. Conc. GRT-1 G2 60 5 M NaOH GRT-2 G2 60 3 M NaOH GRT-3 G2 60 1 M NaOH GRT-4 G3 60 5 M NaOH GRT-5 G3 60 3 M NaOH GRT-6 G3 60 1 M NaOH GRT-7 G4 60 5 M NaOH GRT-8 G4 60 3 M NaOH GRT-9 G4 60 1 M NaOH
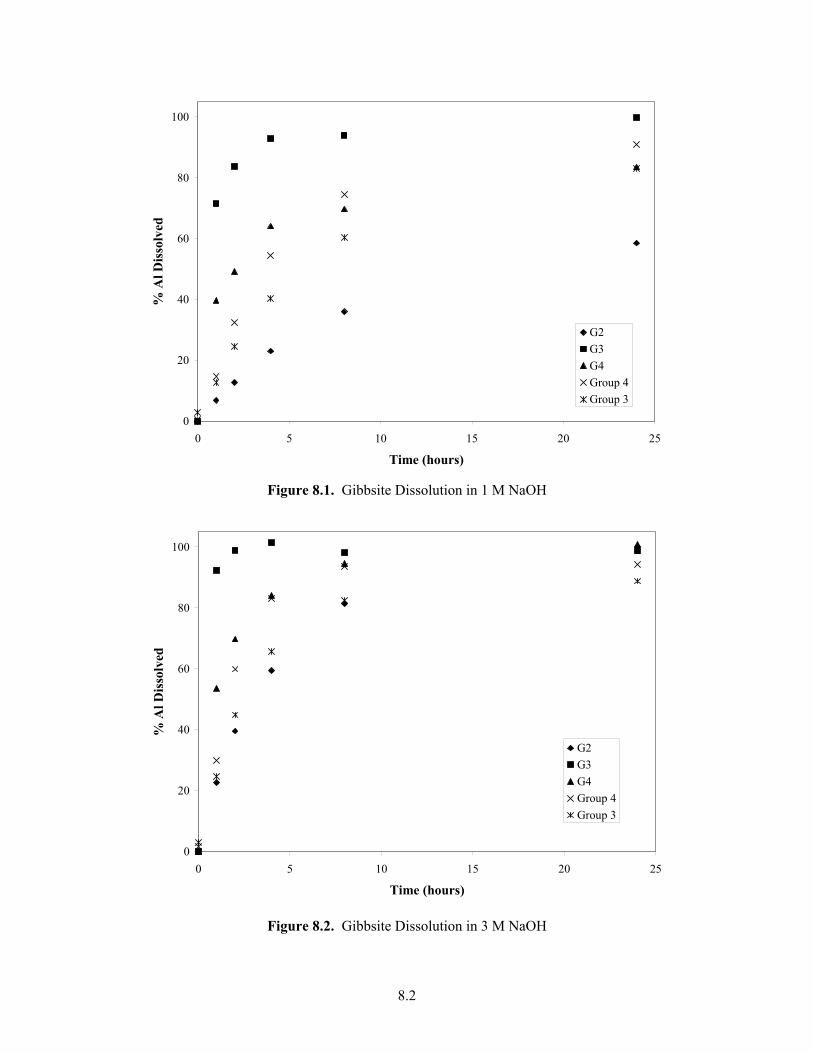
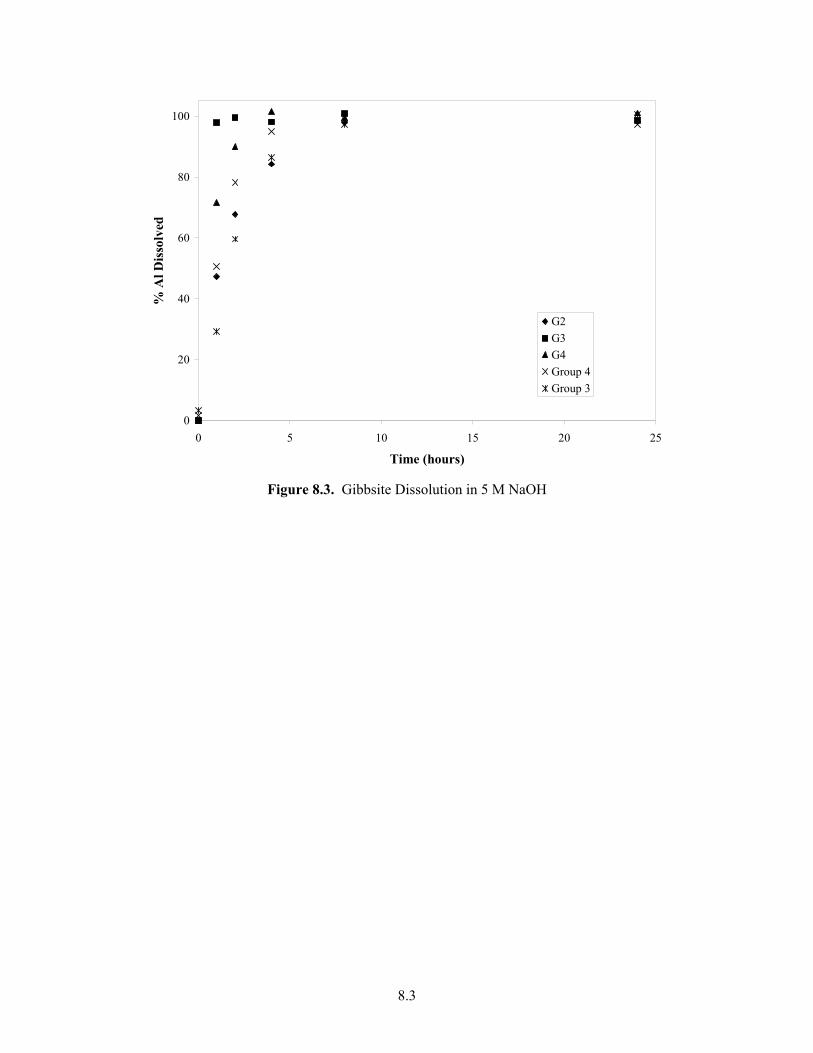
Figure 8.1 through Figure 8.3 compare the three gibbsites tested (G2, G3, and G4—which is the current baseline) in various NaOH concentrations along with the two actual waste samples from Group 3 (PUREX Cladding Waste Sludge) and Group 4 (REDOX Cladding Waste Sludge), respectively.(a) Group 3 and Group 4 were leached with the same concentration of NaOH and the same temperature as the three gibbsite simulants. It appears that G4 is the best fit with the actual waste samples, which were nearly pure gibbsite (~90 wt%). This is consistent with the morphology assessment on which G4 was chosen originally.
(a) LA Snow et al. Nov. 2008. Characterization and Leach Testing for PUREX Cladding Sludge (Group 3) and
REDOX Cladding Sludge (Group 4) Actual Waste Sample Composites. WTP-RPT-167, Rev. A.
8.2
0
20
40
60
80
100
0 5 10 15 20 25
Time (hours)
% A
l Dis
solv
ed
G2
G3
G4
Group 4
Group 3
Figure 8.1. Gibbsite Dissolution in 1 M NaOH
0
20
40
60
80
100
0 5 10 15 20 25
Time (hours)
% A
l Dis
solv
ed
G2
G3
G4
Group 4
Group 3
Figure 8.2. Gibbsite Dissolution in 3 M NaOH
8.3
0
20
40
60
80
100
0 5 10 15 20 25
Time (hours)
% A
l Dis
solv
ed
G2
G3
G4
Group 4
Group 3
Figure 8.3. Gibbsite Dissolution in 5 M NaOH
9.1
9.0 Conclusions and Recommendations
Five samples of gibbsite were obtained from two sources, BASF and Almatis. They were physically characterized, and then a screening leach test was performed to provide dissolution rate data for these gibbsite samples that could be compared to the data for actual waste gibbsite dissolution rates. The gibbsite simulant selection for further testing was based primarily on the crystal size and shape of the simulant particles in comparison to the actual waste gibbsite particles, due to lack of actual waste-dissolution data available at that time. Based on the characterization and leaching results, it was determined that G1 (BASF CP-5) was not gibbsite but appeared to be amorphous alumina. Therefore, this sample was immediately eliminated from consideration for further testing. Samples G2 and G3 behaved similarly in the screening leach test, with 100% dissolving by the end of the test. Sample G4 dissolved a little slower than G2 and G3. Sample G5 dissolved very slowly and had not completely dissolved by the end of the leaching test. This is most likely because of the large particle size of this gibbsite. Therefore, it was decided to proceed with further testing using G4 (Almatis Hydrated Alumina Ath C333). The effect of temperature, mixing speed and [OH-] on the G4 gibbsite dissolution was tested. It was found that hydroxide concentration, leaching temperature, and mixing rate all have significant effects on the gibbsite dissolution. The G4 gibbsite simulant that was chosen to be the “component” simulant was blended in a specified ratio with the other chosen “component” simulants for boehmite and ultrafiltration. This blended simulant was then retested over a subset of the matrix conditions in which the component simulants had been tested previously. These results show how the other components interact with the gibbsite and whether they hinder, help, or have no effect on its dissolution. These results showed that gibbsite dissolution is fast under these conditions (5.8 M NaOH at 100°C) with it being essentially fully dissolved within 1 hour. It also appeared that the sludge and oxalate had no significant effect on the gibbsite dissolution. Therefore, it is concluded that blending the gibbsite simulant component with sludge and oxalate simulant components does not affect its dissolution from the simulant. A series of tests were performed using the G4 gibbsite (Almatis C333) with varying amounts of nitrate present in the caustic leach solution to determine what effect, if any, nitrate has on the dissolution and precipitation of gibbsite in caustic solution. It was observed in the effect of nitrate on gibbsite dissolution that as the nitrate concentration increases, the solubility of the gibbsite in 3-M caustic solution for both dissolution and precipitation increases also. The kinetics of gibbsite dissolution does not appear to be affected by the presence of nitrate. However, the kinetics of the precipitation was slower with nitrate present. The precipitation was not complete after the 30 days as the amount of aluminum in solution was still decreasing, but the saturation of aluminum in solution was asymptotically approaching a number greater than 1, which indicates that the aluminum in solution may be capable of remaining supersaturated. It was also determined that adding anions and/or aluminate had no significant effect on the dissolution rate of gibbsite.

9.2
It appears that gibbsite G4 (Almatis Hydrated Alumina Ath C333) is the best fit with the actual waste samples, which is consistent with the morphology assessment on which it was chosen and therefore is an appropriate simulant. It is therefore recommended that Almatis Hydrated Alumina Ath C333 be used as the gibbsite simulant in the performance evaluation program testing activities at the PEP.
10.1
10.0 References
Fiskum SK, Buck, EC, Daniel, RC, Draper, K, Edwards, MK, Hubler, TL, Jagoda, LK, Jensen, ED, Lumetta, GJ, McNamara, BK, Peterson, RA, Sinkov, SI, and Snow, LA. 2008. Characterization and Leach Testing for REDOX Sludge and S-Saltcake Actual Waste Sample Composites. WTP-RPT-157, Rev. 0, Pacific Northwest National Laboratory, Richland, Washington.
Li H, J Addai-Mensah, J Thomas, and A Gerson. 2005. “The influence of Al (III) supersaturation NaOH concentration on the rate of crystallization of Al(OH)3 precursor particles from sodium aluminate solutions.” Journal of Colloid and Interface Science 286:511-519.
Lumetta GJ, BM Rapko, MJ Wagner, J Liu, and YL Chen 1996. Washing and Caustic Leaching of Hanford Tank Sludges: Results of FY 1996 Studies. PNNL-11278, Pacific Northwest National Laboratory, Richland, Washington.
Lumetta G. BM Rapko, J Liu, and DJ Temer. 1998. “Enhanced Sludge Washing for Pretreating Hanford Tank Sludges.” Science and Technology for Disposal of Radioactive Tank Wastes, WW Schulz and NJ Lombardo, eds., Plenum Press, New York, pp. 203-218.
Packter A, and HS Dhillon. 1974. “Studies on recrystallised aluminum hydroxide precipitates. Kinetics and mechanism of dissolution by sodium hydroxide solutions.” Colloid and Polymer Science 252:249-256.
Smith GL. 2006. Characterization and Small Scale Testing of Hanford Wastes to Support the Development and Demonstration of Leaching and Ultrafiltration Pretreatment Processes. WTP Project Doc. No. 24590-PTF-TSP-RT-06-006, Rev. 0.
Sundar PS. 2006. Characterization and Small Scale Testing of Hanford Wastes to Support the Development and Demonstration of Leaching and Ultrafiltration Pretreatment Processes. WTP Project Doc. No. 24590-PTF-TSP-RT-06-003, Rev. 0.
11.1
11.0 Further Reading
Barnes S, and R Voke. 2006. Issue Response Plan for Implementation of External Flowsheet Review Team (EFRT) Recommendations - M12, Undemonstrated Leaching Processes. WTP Project Doc. No. 24590-WTP-PL-ENG-06-0024, Rev. 0.
Benezeth P, DA Palmer, and DJ Wesolowski. 1997. The Aqueous Chemistry of Aluminum. A New Approach to High-Temperature Solubility Measurements. Geothermics 26(4):465-481.
Brooks KP, PR Bredt, SK Cooley, GR Golcar, LK Jagoda, KG Rappe, and MW Urie. 2000. Characterization, Washing, Leaching, and Filtration of AZ-102 Sludge. PNWD-3045, Rev. 0, Battelle—Pacific Northwest Division, Richland, Washington.
Geeting J, RT Hallen, LK Jagoda, AP Poloski, RD Scheele, and DR Weier. 2003. Filtration, Washing, and Caustic Leaching of Hanford Tank AZ-101 Sludge. PNWD-3206, Rev. 1, Battelle—Pacific Northwest Division, Richland, Washington.
Geeting JGH, KP Brooks, RT Hallen, LK Jagoda, AP Poloski, DR Weier, and RD Scheele. 2002. Filtration, Washing and Caustic Leaching of Hanford Tank AZ-101 Sludge. WTP-RPT-043, Battelle—Pacific Northwest Division, Richland, Washington.
Lucas L. 2006. Hanford Waste Treatment and Immobilization Plant (WTP) Project Response Plan for Resolution of Issues Identified by the Comprehensive Review of the WTP Flowsheet and Throughput. WTP Project Doc. No. 24590-WTP-PL-ENG-06-0008, Rev 0.
Lumetta GJ, IE Burgeson, MJ Wagner, J Liu, and YL Chen. 1997. Washing and Caustic Leaching of Hanford Tank Sludge: Results of FY 1997 Studies. PNNL-11636, Pacific Northwest National Laboratory, Richland, Washington.
Lumetta GJ, KJ Carson, LP Darnell, LR Greenwood, FV Hoopes, RL Sell, SI Sinkov, CZ Soderquist, MW Urie, and JJ Wagner. 2001. Caustic Leaching of Hanford Tank S-110 Sludge. PNL-13702, Pacific Northwest National Laboratory, Richland, Washington.
Lumetta GJ, and RT Hallen. 2007. Review of Caustic Leaching Testing With Hanford Tank Waste Sludges. WTP-RPT-151, Rev. 0, Pacific Northwest National Laboratory, Richland, Washington.
Packter A. 1976. “Studies on recrystallised aluminum mono-hydroxide precipitates. Kinetics of dissolution by sodium hydroxide solutions.” Colloid and Polymer Science 254:1024-1029.
Rapko BM, GJ Lumetta, and MJ Wagner. 1995. Washing and Caustic Leaching of Hanford Tank Sludges: Results of FY1995 Studies. PNL-10712, Pacific Northwest Laboratory, Richland, Washington.
Smith GL, and K Prindiville. 2002. Guidelines for Performing Chemical, Physical, and Rheological Properties Measurements. WTP Project Doc. No. 24590-WTP-GPG-RTD-001, Rev. 0.
Smith GL. 2003. Guideline for R&T Simulant Development, Approval, Validation, and Documentation. WTP Project Doc. No. 24590-WTP-GPG-RTD-004, Rev. 0.
11.2
Sundar PS. 2006. Process Development for Design of Oxidative Leaching of Hanford Wastes. WTP Project Doc. No. 24590-PTF-TSP-RT-06-002, Rev 0.
Temer DJ, and R Villarreal. 1995. Sludge Washing and Alkaline Leaching Tests on Actual Hanford Tank Sludge: A Status Report. LA-UR-95-2070, Los Alamos National Laboratory, Los Alamos, New Mexico.
Temer DJ, and R Villarreal. 1996. Sludge Washing and Alkaline Leaching Tests on Actual Hanford Tank Sludge: FY1996 Results. LA-UR-96-2839, Los Alamos National Laboratory, Los Alamos, New Mexico.
Temer DJ, and R Villarreal. 1997. Sludge Washing and Alkaline Leaching Tests on Actual Hanford Tank Sludge: FY1997 Results. LA-UR-97-2889, Los Alamos National Laboratory, Los Alamos, New Mexico.
U.S. Department of Energy, Office of Environmental Management (DOE-EM). 2006. Comprehensive Review of the Hanford Waste Treatment Plant Flowsheet and Throughput - Assessment Conducted by an Independent Team of External Experts. WTP Project Doc. No. CCN 132846, chartered by the Hanford Waste Treatment and Immobilization Plant Project at the direction of DOE-EM, Washington DC.
U.S. Department of Energy, Office of Environmental Management (DOE-EM). 2006. Background Information and Interim Reports for the Comprehensive Review of the Hanford Waste Treatment Plant Flowsheet and Throughput - Assessment Conducted by an Independent Team of External Experts. WTP Project Doc. No. CCN 132847, chartered by the Hanford Waste Treatment and Immobilization Plant Project at the direction of DOE-EM, Washington DC.
Appendix A
Actual Analytical Data
A.1
Appendix A: Actual Analytical Data
Table A.1. Gibbsite Screening Test Leaching Results (PNNL ASR# 7921)
G1 G2 G3 G4 G5 Time (hrs)
Al (μg/mL)
Na (μg/mL)
Al (μg/mL)
Na (μg/mL)
Al (μg/mL)
Na (μg/mL)
Al (μg/mL)
Na (μg/mL)
Al (μg/mL)
Na (μg/mL)
0 --- 73,500 --- 72,100 --- 72,500 --- 71,000 [0.82] 68,500 1 3,440 77,000 3,550 73,100 3,975 72,100 2,220 69,100 929 68,100 2 3,910 73,500 3,880 72,600 3,930 72,700 2,640 69,700 1,510 69,900 4 4,670 75,700 3,990 72,200 3,860 73,200 3,170 69,400 2,140 67,700 8 5,110 75,100 4,060 73,000 4,000 72,100 3,590 70,500 2,860 68,000
24 5,180 74,300 3,940 73,400 4,030 76,700 3,950 71,800 3,580 70,000 Final 5,400 75,300 3,990 72,000 4,050 71,200 4,070 72,100 3,440 68,500
Table A.2. Al Gibbsite Matrix Test Leaching Results (SWRI SSR# 30803)
Time (hrs)
MTG-1 (mg/L)
MTG-2 (mg/L)
MTG-3 (mg/L)
MTG-4 (mg/L)
MTG-5 (mg/L)
MTG-6 (mg/L)
MTG-7 (mg/L)
MTG-8 (mg/L)
MTG-9 (mg/L)
MTG-10 (mg/L)
MTG-11 (mg/L)
MTG-12 (mg/L)
MTG-13 (mg/L)
0 <3.00 <3.00 <1.00 <1.00 <3.00 <3.00 <1.00 <1.00 7.32 <1.00 <2.00 <2.00 <2.00 1 35,500 8,370 1,770 2,920 1,610 2,970 662 174 35,600 189 4,460 3,770 4,320 2 39,800 11,300 2,320 3,320 2,230 3,820 794 237 40,400 260 5,630 4,970 5,420 4 47,100 15,300 3,120 3,660 3,090 4,690 929 322 43,600 345 6,890 6,280 6,710 8 47,000 21,200 4,090 3,900 4,220 5,720 1,090 433 45,600 459 7,980 7,740 8,040
24 48,900 27,500 6,200 4,170 7,150 7,810 1,380 686 48,900 694 9,950 10,500 10,100 Final 56,700 27,600 6,170 4,180 7,370 7,830 1,380 687 48,400 698 9,990 10,400 10,100
A.2
Table A.3. Na Gibbsite Matrix Test Leaching Results (SWRI SSR# 30803)
Time (hrs)
MTG-1 (mg/L)
MTG-2 (mg/L)
MTG-3 (mg/L)
MTG-4 (mg/L)
MTG-5 (mg/L)
MTG-6 (mg/L)
MTG-7 (mg/L)
MTG-8 (mg/L)
MTG-9 (mg/L)
MTG-10 (mg/L)
MTG-11 (mg/L)
MTG-12 (mg/L)
MTG-13 (mg/L)
0 109,000 128,000 21,700 21,800 106,000 105,000 22,000 21,900 107,000 21,600 67,100 66,500 66,800 1 102,000 116,000 21,800 22,200 104,000 104,000 22,500 22,000 99,500 21,900 65,900 66,700 66,300 2 100,000 108,000 21,800 22,000 104,000 108,000 22,000 20,900 100,000 21,900 65,700 66,600 66,300 4 110,000 106,000 22,000 22,400 105,000 105,000 22,100 22,400 99,700 21,900 66,100 66,300 67,200 8 104,000 106,000 22,100 22,800 104,000 106,000 22,200 21,100 99,400 22,000 65,800 66,200 67,100
24 103,000 108,000 22,500 22,400 104,000 106,000 22,600 21,200 101,000 21,800 66,300 66,000 66,500 Final 122,000 106,000 22,500 23,100 104,000 104,000 21,700 21,400 101,000 21,600 66,200 66,500 67,100
Sodium concentrations do not match the leaching solution concentration (1 M and 5 M) because of analytical uncertainties.
A.3
Table A.4. Blended Matrix Gibbsite Leaching Test Results (SWRI SSR# 31241 and 31334)
BSM-3 BSM-4 BSM-4a Time (hrs)
Al (mg/L)
Na (mg/L)
Al (mg/L)
Na (mg/L)
Al (mg/L)
Na (mg/L)
0 6.61 120,000 5.97 117,000 6.37 97,700 1 13,000 117,000 13,000 118,000 10,700 95,100 2 13,100 117,000 13,000 119,000 11,200 99,100 4 13,000 117,000 13,200 119,000 10,900 95,900 8 13,100 119,000 13,400 121,000 10,900 95,900
24 13,300 121,000 14,400 127,000 10,900 96,100 Final 13,100 120,000 14,300 126,000 10,900 95,200
Table A.5. Nitrate Effect on Gibbsite Leaching Test Results (SWRI SSR# 31108 and 31063)
GNE-1a GNE-2a GNE-3a GNE-4a Time (days) Al (mg/L) Na (mg/L) Al (mg/L) Na (mg/L) Al (mg/L) Na (mg/L) Al (mg/L) Na (mg/L)
21 5,910 64,900 6,540 91,100 7,530 125,000 8,990 157,000 30 5,920 64,100 6,550 94,400 7,580 122,000 9,040 157,000
GNE-1b GNE-2b GNE-3b GNE-4b Time (days) Al (mg/L) Na (mg/L) Al (mg/L) Na (mg/L) Al (mg/L) Na (mg/L) Al (mg/L) Na (mg/L)
21 5,640 63,700 6,140 93,100 7,150 122,000 8,530 163,000 30 5,650 64,900 6,200 92,100 7,190 121,000 8,660 158,000
GNE-5a GNE-6a GNE-7a GNE-8a Time (days) Al (mg/L) Na (mg/L) Al (mg/L) Na (mg/L) Al (mg/L) Na (mg/L) Al (mg/L) Na (mg/L)
21 9,600 71,300 11,200 106,000 12,500 133,000 16,800 173,000 30 9,080 72,300 10,700 106,000 12,100 134,000 15,800 171,000
GNE-5b GNE-6b GNE-7b GNE-8b Time (days) Al (mg/L) Na (mg/L) Al (mg/L) Na (mg/L) Al (mg/L) Na (mg/L) Al (mg/L) Na (mg/L)
21 9,420 75,000 10,100 101,000 12,400 133,000 15,800 172,000 30 8,990 73,900 9,670 99,500 11,900 135,000 15,000 171,000
Table A.6. Aluminate Ion Effect on Gibbsite Leaching Test Results (SWRI SSR# 31421)
GAM-1 GAM-2 Time (hrs) Al (mg/L) Na (mg/L) Al (mg/L) Na (mg/L)
0 8,190 69,300 7,780 106,000 1 9,470 71,300 9,140 106,000 2 9,830 71,100 9,540 105,000 4 10,200 70,600 10,200 107,000 8 10,800 70,700 10,900 107,000
24 11,900 72,500 11,500 106,000 Final 11,700 70,400 12,600 115,000
A.4
Table A.7. Al Gibbsite Simulant Revision Testing Results (SWRI SRR# 33095, 33181, and 33182)
Time (hrs)
GRT-1 (mg/kg)
GRT-2 (mg/kg)
GRT-3 (mg/kg)
GRT-4 (mg/kg)
GRT-5 (mg/kg)
GRT-6 (mg/kg)
GRT-7 (mg/kg)
GRT-8 (mg/kg)
GRT-9 (mg/kg)
0 <2.20 <2.28 <4.81 <4.31 <4.57 <4.51 <4.39 <4.53 <4.75 1 1,740 821 233 3,640 3,390 2,500 2,770 2,060 1,350 2 2,500 1,440 432 3,700 3,630 2,930 3,480 2,680 1,670 4 3,110 2,160 783 3,720 3,650 3,250 3,930 3,230 2,180 8 3,610 2,960 1,220 3,750 3,600 3,290 3,850 3,630 2,370
24 3,630 3,640 1,990 3,670 3,620 3,490 3,910 3,870 2,840 Final 3,690 3,640 2,050 3,720 3,670 3,500 3,870 3,840 2,780
Table A.8. Na Gibbsite Simulant Revision Testing Results (SWRI SRR# 33095, 33181, and 33182)
Time (hrs)
GRT-1 (mg/kg)
GRT-2 (mg/kg)
GRT-3 (mg/kg)
GRT-4 (mg/kg)
GRT-5 (mg/kg)
GRT-6 (mg/kg)
GRT-7 (mg/kg)
GRT-8 (mg/kg)
GRT-9 (mg/kg)
0 95,300 58,900 21,800 97,000 62,700 22,000 97,800 61,900 21,400 1 92,400 58,600 21,300 97,300 62,200 21,300 97,000 61,600 21,600 2 94,500 58,600 21,900 97,300 61,800 22,000 96,400 61,300 21,800 4 93,500 59,200 22,600 98,700 62,200 22,400 101,000 61,000 23,900 8 93,800 62,000 22,000 101,000 61,700 21,800 98,900 61,500 22,300
24 94,900 62,100 22,300 96,800 62,100 22,000 99,100 62,800 21,800 Final 94,300 62,300 22,600 99,300 61,800 21,400 99,200 63,000 20,600
Appendix B
Testing Conditions
B.1
Appendix B: Testing Conditions
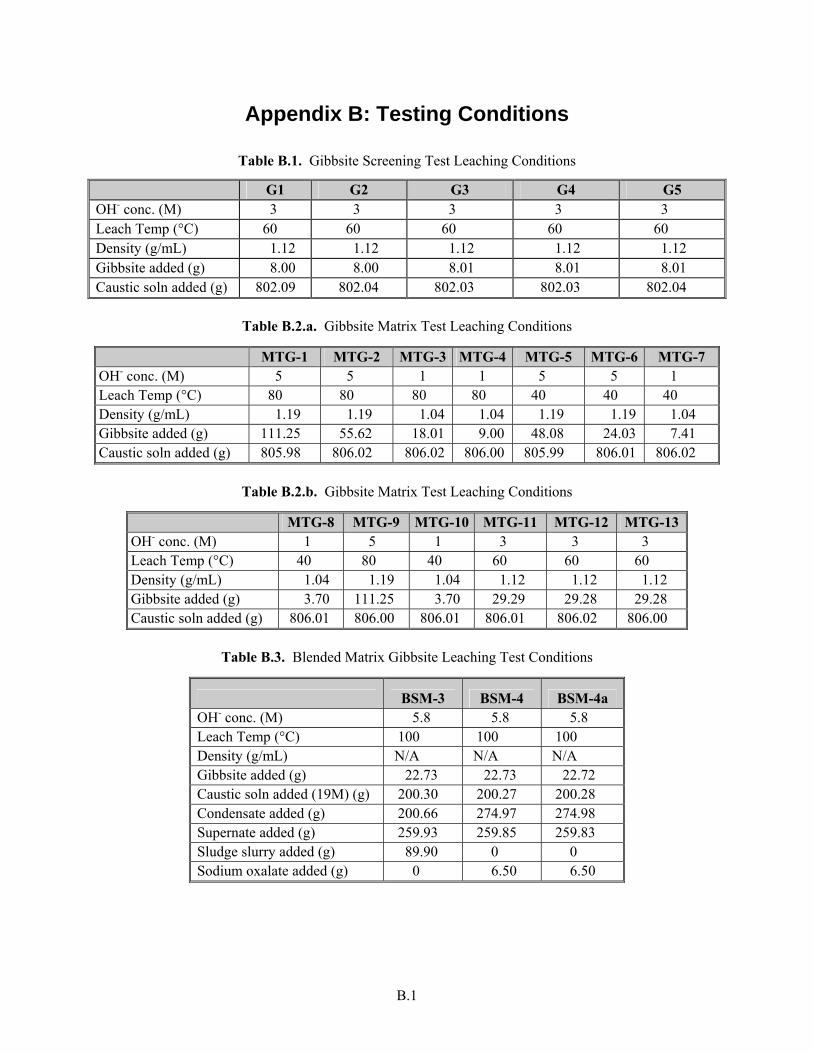
Table B.1. Gibbsite Screening Test Leaching Conditions
G1 G2 G3 G4 G5 OH- conc. (M) 3 3 3 3 3 Leach Temp (°C) 60 60 60 60 60 Density (g/mL) 1.12 1.12 1.12 1.12 1.12 Gibbsite added (g) 8.00 8.00 8.01 8.01 8.01 Caustic soln added (g) 802.09 802.04 802.03 802.03 802.04
Table B.2.a. Gibbsite Matrix Test Leaching Conditions
MTG-1 MTG-2 MTG-3 MTG-4 MTG-5 MTG-6 MTG-7 OH- conc. (M) 5 5 1 1 5 5 1 Leach Temp (°C) 80 80 80 80 40 40 40 Density (g/mL) 1.19 1.19 1.04 1.04 1.19 1.19 1.04 Gibbsite added (g) 111.25 55.62 18.01 9.00 48.08 24.03 7.41 Caustic soln added (g) 805.98 806.02 806.02 806.00 805.99 806.01 806.02
Table B.2.b. Gibbsite Matrix Test Leaching Conditions
MTG-8 MTG-9 MTG-10 MTG-11 MTG-12 MTG-13 OH- conc. (M) 1 5 1 3 3 3 Leach Temp (°C) 40 80 40 60 60 60 Density (g/mL) 1.04 1.19 1.04 1.12 1.12 1.12 Gibbsite added (g) 3.70 111.25 3.70 29.29 29.28 29.28 Caustic soln added (g) 806.01 806.00 806.01 806.01 806.02 806.00
Table B.3. Blended Matrix Gibbsite Leaching Test Conditions
BSM-3 BSM-4 BSM-4a OH- conc. (M) 5.8 5.8 5.8 Leach Temp (°C) 100 100 100 Density (g/mL) N/A N/A N/A Gibbsite added (g) 22.73 22.73 22.72 Caustic soln added (19M) (g) 200.30 200.27 200.28 Condensate added (g) 200.66 274.97 274.98 Supernate added (g) 259.93 259.85 259.83 Sludge slurry added (g) 89.90 0 0 Sodium oxalate added (g) 0 6.50 6.50

B.2
Table B.4. Nitrate Effect on Gibbsite Leaching Test Conditions
GNE-1a GNE-2a GNE-3a GNE-4a OH- conc. (M) 3 3 3 3 Leach Temp (°C) 25 25 25 25 Density (g/mL) 1.12 1.18 1.24 1.32 Gibbsite added (g) 21.94 21.94 21.95 21.94 Caustic soln added (g) 203.07 203.07 203.08 203.05 NO3
- added (g/kg soln) 0 1 2 3
GNE-1b GNE-2b GNE-3b GNE-4b OH- conc. (M) 3 3 3 3 Leach Temp (°C) 25 25 25 25 Density (g/mL) 1.12 1.18 1.24 1.32 Gibbsite added (g) 21.95 21.94 21.94 21.94 Caustic soln added (g) 203.07 203.06 203.05 203.06 NO3
- added (g/kg soln) 0 1 2 3
GNE-5a GNE-6a GNE-7a GNE-8a OH- conc. (M) 3 3 3 3 Leach Temp (°C) 100 for 8h, then 25 100 for 8h, then 25 100 for 8h, then 25 100 for 8h, then 25Density (g/mL) 1.12 1.18 1.24 1.32 Gibbsite added (g) 21.95 + 10.97 21.93 + 10.97 21.94 + 10.97 21.94 + 10.97 Caustic soln added (g) 203.05 203.05 203.08 203.06 NO3
- added (g/kg soln) 0 1 2 3
GNE-5b GNE-6b GNE-7b GNE-8b OH- conc. (M) 3 3 3 3 Leach Temp (°C) 100 for 8h, then 25 100 for 8h, then 25 100 for 8h, then 25 100 for 8h, then 25Density (g/mL) 1.12 1.18 1.24 1.32 Gibbsite added (g) 21.94 + 10.97 21.95 + 10.97 21.94 + 10.97 21.94 + 10.97 Caustic soln added (g) 203.08 203.08 203.08 203.07 NO3
- added (g/kg soln) 0 1 2 3
Table B.5. Aluminate Ion Effect on Gibbsite Leaching Test Conditions
GAM-1 GAM-2 OH- conc. (M) 3 3 Leach Temp (°C) 60 60 Density (g/mL) 1.12 1.12 Gibbsite added (g) 8.62 9.68 Caustic soln added (g) 845.02 845.01 NaAlO2 added (g) 21.55 21.55 Other Na salts added (g) 0 106.89
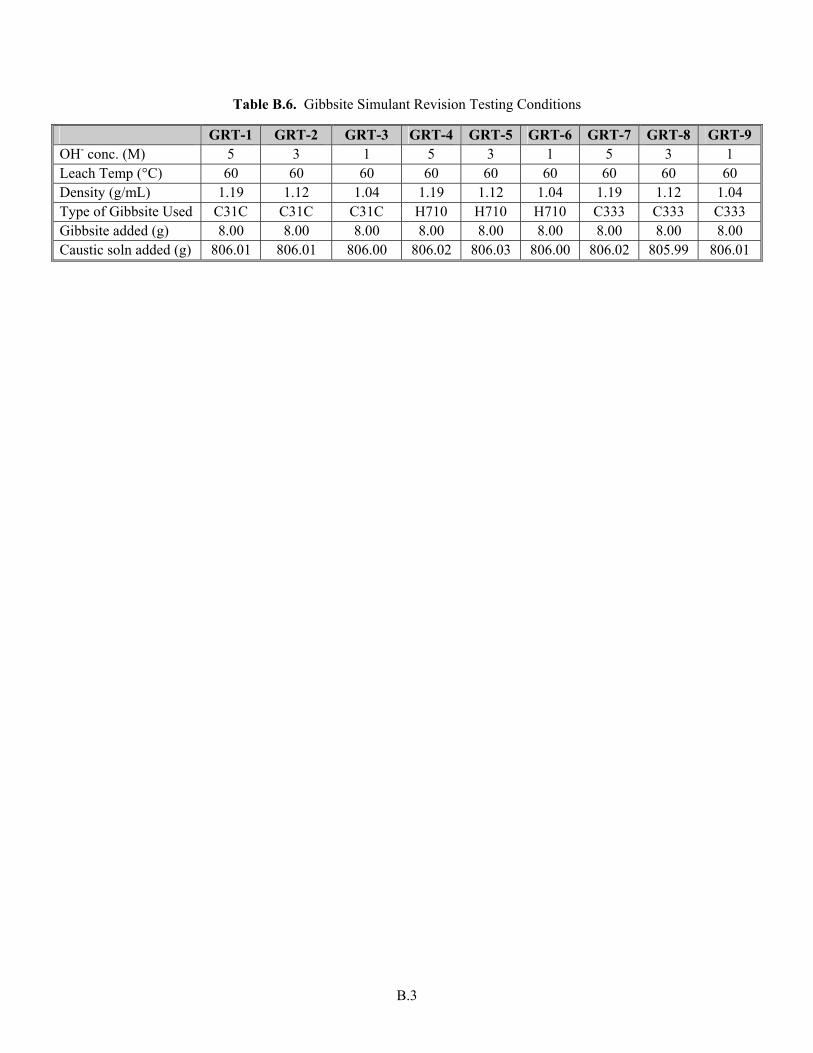
B.3
Table B.6. Gibbsite Simulant Revision Testing Conditions
GRT-1 GRT-2 GRT-3 GRT-4 GRT-5 GRT-6 GRT-7 GRT-8 GRT-9 OH- conc. (M) 5 3 1 5 3 1 5 3 1 Leach Temp (°C) 60 60 60 60 60 60 60 60 60 Density (g/mL) 1.19 1.12 1.04 1.19 1.12 1.04 1.19 1.12 1.04 Type of Gibbsite Used C31C C31C C31C H710 H710 H710 C333 C333 C333 Gibbsite added (g) 8.00 8.00 8.00 8.00 8.00 8.00 8.00 8.00 8.00 Caustic soln added (g) 806.01 806.01 806.00 806.02 806.03 806.00 806.02 805.99 806.01


Appendix C
Gibbsite Product Specifications
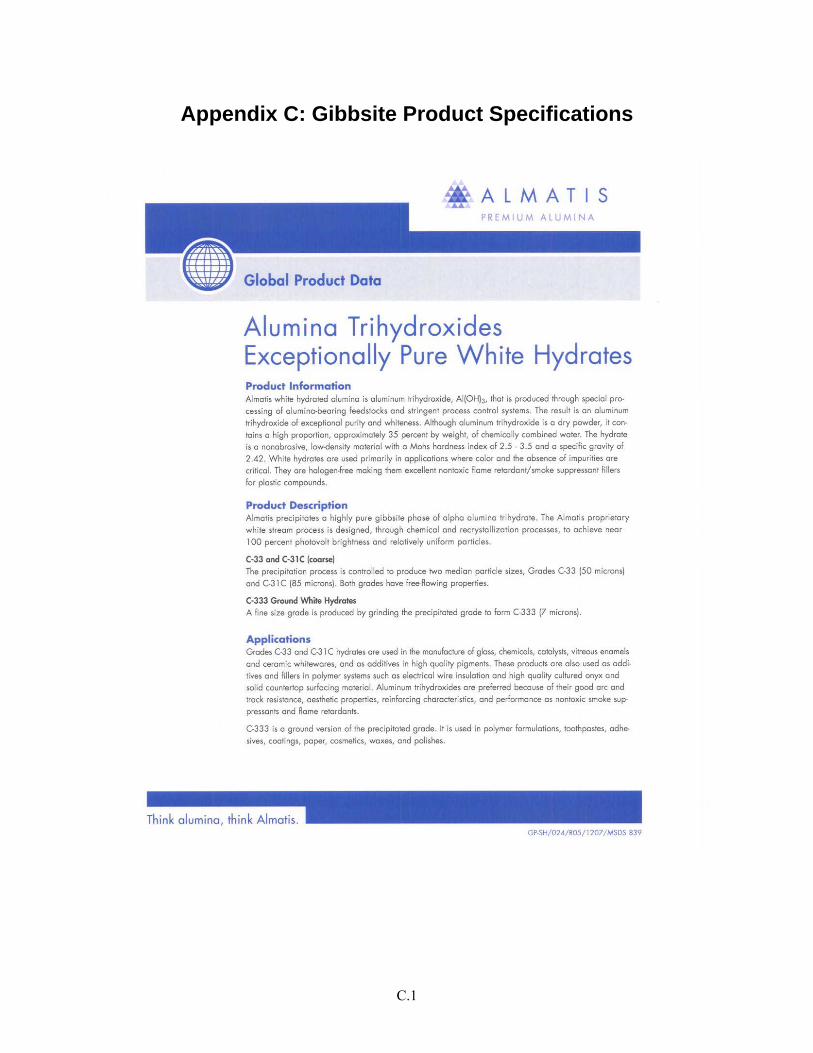
C.1
Appendix C: Gibbsite Product Specifications
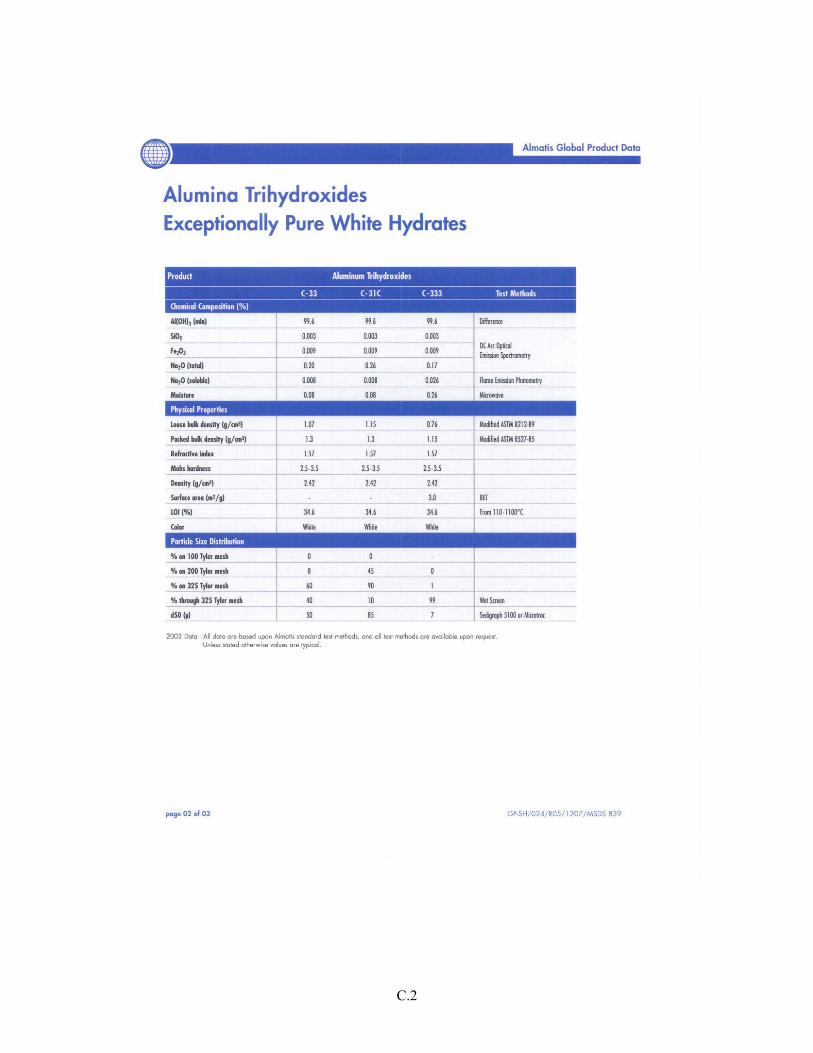
C.2
C.3
PNNL-18013 WTP-RPT-176 Rev 0
Distr. 1
Distribution No. of Copies ONSITE
4 Bechtel National, Inc. WTP R&T Docs (2) H4-02 P. S. Sundar H4-02 S. Barnes H4-02
8 Pacific Northwest National Laboratory
D. E. Kurath K3-52 R. A. Peterson P7-22 D. E. Rinehart K6-24 R. L. Russell (3) K6-24 H. D. Smith K6-24 Project File P7-28