development and application of microsatellite markers for diversity analysis...
TRANSCRIPT
DEVELOPMENT AND APPLICATION OF
MICROSATELLITE MARKERS FOR DIVERSITY
ANALYSIS IN JATROPHA CURCAS L.
THESIS SUBMITTED
TO THE
UNIVERSITY OF LUCKNOW
FOR THE DEGREE
OF
DOCTOR OF PHILOSOPHY
IN
BOTANY
BY
RAMANUJ MAURYA M.Sc. (Botany)
CSIR-NATIONAL BOTANICAL RESEARCH INSTITUTE
RANA PRATAP MARG, LUCKNOW-226001 (U.P.), INDIA
AND
DEPARTMENT OF BOTANY
UNIVERSITY OF LUCKNOW
LUCKNOW- 226007 (U.P.), INDIA
2014

Dedicated To My Beloved Parents
& Late Grandparents
CERTIFICATE
This is to certify that the work embodied in this thesis entitled
“DEVELOPMENT AND APPLICATION OF MICROSATELLITE MARKERS FOR
DIVERSITY ANALYSIS IN JATROPHA CURCAS L.” has been carried out by
Mr. RAMANUJ MAURYA, M.Sc. (Botany) under our supervision. He has
fulfilled all the requirements for the degree of DOCTOR OF PHILOSOPHY IN
BOTANY of the University of Lucknow, Lucknow regarding the nature and
prescribed period of work. The work included in this thesis is all original,
unless otherwise stated.
(Dr. Hemant Kumar Yadav) Co-Supervisor
Senior Scientist
Genetics and Plant Breeding
CSIR-National Botanical Research Institute
Lucknow-226 001 (U. P.), India
(Dr. Rantna Katiyar) Supervisor
Associate Professor Department of Botany
University of Lucknow
Lucknow-226 007 (U. P.), India

Acknowledgements
ACKNOWLEDGEMENTS
I am grateful to almighty and my parents Mrs. Bhanumati Maurya and Late Mr. Jagadeesh
Prasad Maurya for blessing me with strong will power, patience and confidence, which helped me in
completing the present work.
I am very much grateful to Dr. Ratna Katiyar, Botany Department, University of Lucknow
for accepting me as a Ph.D. student. Her valuable guidance from time to time helped immensely in
boosting my morale. I deeply appreciate her untiring help and sweet behavior to me.
I express my heartfelt gratitude and thanks to Dr. Hemant Kumar Yadav, Senior Scientist,
Genetics and Plant Breeding Division, C.S.I.R.-N.B.R.I. for giving me an opportunity to join him as a
Ph.D. student and also for excellent guidance, critical suggestions and long scientific discussions.
This work would not have been possible without the guidance, encouragement and appreciation I
received from him. His devotion to the work and untiring efforts has left deep impression in my heart.
I gratefully acknowledge Prof. Y.K. Sharma (HOD, Botany Dept., University of Lucknow) for
allowing me to use the facilities of the university.
I offer my special thanks to the former Director Dr. Rakesh Tuli and the present Director Dr.
Chandra Shekhar Nautiyal, CSIR-N.B.R.I, for providing me facilities and allowing to use the
infrastructure at the institute.
I feel a special gratitude to Dr. Bajarang Singh, Ex-Scientist CSIR- N.B.R.I and Dr. S. A.
Ranade, Chief Scientist CSIR-N.B.R.I. for their constant guidance in planning and completion of this
work and useful advices.
I acknowledge with thanks for fellowship and other financial support provided by C.S.I.R. and
D.B.T in accomplishment of this work.
My sincere thanks and gratitude to my maternal uncle Mr. Krishna Nand Maurya (Technical
Officer, CSIR- N.B.R.I. Lucknow) and Dr. P.P. Gothawal (Chief Scientist CSIR-C.F.T.R.I. Lucknow)
for their useful advice, encouragement, constant support and graciously sharing their vast
knowledge to me.
I would like to convey sincere and heartfelt thanks to Dr. Samir V. Sawant, Dr. P.K. Singh, Dr.
Sribas Roy, Dr. Pravin Chandra Verma, Dr. A.K. Saxena, Dr. S.N. Jena, Dr. C.S. Mohanti, Dr.
Sumit Kumar Bag and Dr. S.K. Raj.
I am especially thankful for the help and support given by Dr. Raju Madanala, and Dr. Anil
Kumar for their cooperation in central Facilities and very friendly behavior.

I am elated with delight to avail of this wonderful opportunity to express my sincere thanks to
my immediate seniors Dr. Neeraj Dubey, Dr. Rahul Singh, Dr. Harsh Singh, Mr. Anukool
Srivastava, Dr. Saurabh Verma, Mr. Sunil Kumar Singh, Mr. K.M. Rai and Dr. Sunil Kumar Snehi,
for their moral support and pleasant company all along.
Very special thanks to my friends Mr. Sidharth , Mr. Omesh Bajpai, Mr. Kasim, Mr. Komal, Mr.
Sachin, Mr. Vrijesh, Mr. Vikas, Mr. Rajiv, Mr. Vikram Rajapure, Mr. Ravi, Mr. Surendra, Miss.
Rinky, Miss. Subhi, Miss Namrata Singh, Mr. Sunil Gupta, Miss Vimlesh Rawat, Miss Pratibha
Maurya, Dr. Karamveer Gautam, Mr. Rameshwar and Mr. Nitesh for their unconditional support in
various aspects of my work.
I would like to thank my dear colleagues like Miss Astha Gupta, Mrs. Chandrawati, Mr.
Umesh Kumar and trainee Miss Parul, Mrs. Shipra and Mr. Suresh Yadav for giving support in my
Ph.D. work.
Special thanks to Mr. Alok Jain, Mr. Jitesh and Mr. Chaitu Ram for their cooperation and
assistance whenever it was needed. I acknowledge the assistance provided by Mr. Krishnakant, Mr.
Ramu, Mr. Hansraj, Mr. Maheshpal and Mr. Sunil Kumar Yadav.
Finally, to be very special and different I find no words in owing my sincere gratitude to my
grandparents Late Mr. Bihari Lal Maurya and Mrs. Chandra Kala and Mrs. Prabhawati and Late
Mr. Babu Ram Maurya whose affection, encouragement and blessings have always been a source of
light to me. I wish to express my cordial appreciation and special thanks to my sister (Mrs. Kavita
Maurya and Mrs. Ranjana Maurya) and maternal aunt Mrs. Shradha Maurya for their constant
support to concentrate on completing this work.
Last but not least acknowledgement to dear Master Apoorv and Ms. Pragya Priyadrshini for
their cheerful smiling faces, which gave me strength during most odd days of my tenure.
Not everyone is mentioned, but none is forgotten, I humbly acknowledge to all.
Dated:
Place: (Ramanuj Maurya)

Contents
1. INTRODUCTION……………………………………………………………..... 1-4
2. REVIEW OF LITERATURE………………………………………………….
2.1 Genetic Markers…………………………………………………………………
2.2 Classification of DNA Markers…………………………………………………
2.3 Simple Sequence Repeats (SSRs) or Microsatellite Markers…………………...
2.4 Discovery and development of SSR markers…………………………………...
2.5 Cross-species amplification of SSRs……………………………………………
2.6 Advantage of SSR analysis…………………………………………………......
2.7 Application of SSR markers…………………………………………………….
2.8 Application of molecular markers in J. curcas………………………………….
5-48
5
7
12
19
25
26
28
33
3.0 MATERIALS AND METHODS……………………………………………...
3.1 Materials……………………………………………………………………......
3.2 Methods……………………………………………………………...
49-67
49
54
4.0 RESULS ……………………………………………………………………….
4.1 Phenotypic characterization of indigenous accessions of J. curcas.....................
4.2 Development of large scale genomic derived SSRs from four microsatellite
enriched genomic libraries (two di-nucleotide and two tri-nucleotide)…………….
4.3 PCR optimization, polymorphism detection and characterization of developed
SSRs for various attributes…………………………………………………………..
4.4 Study of molecular genetic diversity among indigenous and exotic accessions
of J. curcas. …………………………………………………………………………
4.5 Molecular characterization of interspecific hybrid of J. curcas x J. integerrima
4.6 Heterozygosity assessment of J. curcas ……………………………………….
68-132
69
81
88
113
123
131
5.0 DISCUSSION………………………………………………………………….. 133-155
5.1 Phenotypic characterization of indigenous accessions of J. curcas…………….. 134
5.2 Development of large scale genomic derived SSRs from di- and tri-nucleotide
enriched genomic libraries………………………………………………………….
143
5.3 PCR optimization, polymorphism detection and characterization of developed
SSRs for various attributes…………………………………………………………
147
5.4 Study of molecular genetic diversity among indigenous and exotic accessions
of J. curcas L……………………………………………………………………….
149

5.6 Characterization of interspecific hybrid population of J. curcas x J.
integerrima ……………………………………………………………………….....
154
5.7Assessment of heterozygosity in J. curcas L…………………………………..... 155
6.0 SUMMARY…………………………………………………………………… 156-160
7.0 REFERENCES……………………………………………………………….. 161-180
APPENDIX………………………………………………………………………....
LIST OF PUBLICATIONS……………………………………………………….

Abbreviations
Abbreviations
CTAB - Cetyl trimethyl ammonium bromide
EDTA - Ethylene diamine tetra acetic acid
NaCl - Sodium chloride
NaOH - Sodium hydroxide
TAE - Tris-acetate-EDTA
TBE - Tris- borate- EDTA
TE - Tris-EDTA
Tris - Tris (hydroxymethyl) aminomethane
βME - 2Betamercaptoetahnol
dNTP - Deoxy nucleoside triphosphate
LA - Luria agar medium
LB - Luria broth medium
LBA - Luria broth agar
IPTG - Isopropyl D thiogalactopyranoside
Xgal - 5bromo4chloro3indolylDgalactopyranoside
PVP - Polyvinylpyrolidone
P: C: I - Phenol:Chloroform:Isoamyl
RNaseA - RibonucleaseA
rpm - Rotation per minute
gDNA - Genomic DNA
RT - Room temperature
hrs - Hours
M - Molar
mg - Milligram
MgCl2 - Magnesium chloride
DNA - Deoxyribonucleic acid
RNA - Ribonucleic acid
PCR - Polymerase chain reaction
min - Minute
ng - Nanogram
nm - Nanometer

UV - Ultraviolet
µ - Micro
mg - miligram
Kg - Kilogram
SSRs - Simple Sequence Repeats
AFLP - Amplified Fragment Length Polymorphism
RAPD - Random Amplified Polymorphic DNA
ISSR - Inter Simple Sequence Repeats
SNP - Single Nucleotide Polymorphism
EST - Expressed sequence tag
QTL - Quantitative Trait Loci
MAS - Marker Assistant Selection
mm - millimeter
NMR - Nuclear Magnetic Resonance
SSR - Simple sequence repeat
STR - Short tandem repeat
STMS - Sequence tagged microsatellite site
SSLP - Simple sequence length polymorphism
MP-PCR - Microsatellite-primed PCR
SPAR - Single primer amplification reaction
AMP-PCR - Anchored microsatellite primed PCR
ISSR - Inter-simple sequence repeats
ASSR - Anchored simple sequence repeat
RAMP - Random amplified microsatellite polymorphism
RAMPO - Random amplified microsatellite polymorphism
RAHM - Random amplified hybridization microsatellites
RAMS - Randomly amplified microsatellites
SAMPLE - Selective amplification of microsatellite polymorphic loci
REMAP - Retrotransposon-microsatellite amplified polymorphism

List of figures
List of Figures
Figure No. Title Page No.
Figure 2.1 Putative functions/effects of SSRs (Reproduced from Li et al.
2002). 13
Figure 2.2 Slippage during DNA replication. Assume that in the original
DNA molecule there were 5 repeats of the motif, symbolized
by a box. Slippage leads to the formation of new alleles with 6
and 4 repeats, depending on the strand containing the
polymerase error (reproduced from Goldstein and Schlottrer
1999).
15
Figure 2.3 Unequal crossing-over between homologous chromosomes.
Black and blue regions correspond to microsatellite repeat
sequences (Reproduce from Oliveira et al. 2006). 16
Figure 2.4 A general protocol for developing SSR markers with a SSR-
enrichment step (reproduced from Park et al. 2009). 22
Figure 2.5 Microsatellite- a summary of development, distribution,
functions and applications (reproduced from Kalia et al. 2011).
28
Figure 3.1 Map of India showing collection sites of Jatropha curcas from
different states of India. 53
Figure 3.2 A graphical representation of SSR identification and primer
designing.
58
Figure 4.1 Dendrogram of 80 Jatropha curcas accessions derived from
the Wards minimum variance cluster analysis using
Mahalanobis distances.
75
Figure 4.2 Histogram showing frequency of different types of SSRs
repeat motif recovered.
82
Figure 4.3 Histogram showing frequency of different repeat units
recovered for Lib A and Lib B.
83
Figure 4.4 Histogram showing frequency of different repeat motifs
recovered from Lib A and Lib B.
84

Figure 4.5 The average read length and unique sequence length. 85
Figure 4.6 Histogram showing distribution of SSRs based on (a) Repeat
types and (b) Repeat motifs.
87
Figure 4.7 Histogram showing repeat units of different types of SSRs
recovered.
88
Figure 4.8 A representative 1.5% Agarose gel image showing PCR
amplification and non-amplification. Sample from first 3
accessions (out of 8) were loaded for each SSR primers.
Primer 1 from well No. (1-3), Primer 2 (4-6), Primer 3 (7-9),
Primer 4 (10-12), Primer 5 (13-15), Primer 6 (16-18), Primer 7
(19-21), Primer 8 (22-24), Primer 9 (25-27), Primer 10 (28-
30), Primer 11 (31-33) and Primer 12 (34-36). All primers
amplified except primer number 10th
.
89
Figure 4.9 A representative 6% non-denaturing polyacrylamide gel image
showing polymorphism. 90
Figure 4.10 A representative snapshot from GeneMapper showing
polymorphism. Arrow showing polymorphic peak. 90
Figure 4.11 PIC distribution of 248 polymorphic SSR loci (106 from Lib A
and 142 from Lib B) calculated from 7 accessions of J. curcas
including non-toxic accession. 98
Figure 4.12 PIC distribution of polymorphic SSRs (447) based on 7
accessions of J. curcas. 110
Figure 4.13 Annotation of genomic SSRs developed from Lib A and B of
J. curcas. Each bar indicates the percent sequence similarity
with various plant genomes based on BLASTIX. 111
Figure 4.14 Gene Ontology (GO) classification of the SSR containing
genomic sequences derived from microsatellite enriched
libraries of J. curcas. The relative frequencies of GO hits to
functional categories of cellular components, biological
process and molecular functions. 111
Figure 4.15 Annotation of genomic SSRs developed from enriched
libraries of J. curcas. Each pie indicates the percent sequence 112
similarity with various plant genomes based on BLASTX.
Figure 4.16 PIC distributions of 41 polymorphic SSR loci calculated across
96 J. curcas accessions. 115
Figure 4.17 Genetic relationship among 96 accessions of J. curcas based
on NJ tree constructed using genotyping data of 41
polymorphic genomic SSRs. The numbers on branches
indicates bootstrap values based on 1000 replications. 120
Figure 4.18 17 Population structure analysis showing; a) Delta K showing
highest probability of four (K=4) subpopulation and b)
Structural plot of 96 accessions of J. curcas. 122
Figure 4.19 Photograph showing (A) J. curcas (Female parent) (B) J.
integerrima (Male parent) selected for interspecific
hybridization (C) Developing successful fruits after crossing
(D) Seedling of F1 interspecific hybrids in glasshouse, (E)
Transplanted F1 hybrid plants growing in field, (F) Close up
view of F1 hybrid plant (G) Close up view of inflorescence of
hybrid plant and (H) Hybrid plant showing fruits. 124
Figure 4.20 (A) Dorsal side and (B) ventral side showing morphological
variation in leaf shape and pigmentation of parents (J. curcas
and J. integerrima) and hybrid plants. 125
Figure 4.21 A snapshot of GeneMapper showing the allelic pattern of J.
curcas, J. integerrimma and their hybrid. 126
Figure 4.22 Dendrogram showing clustering of 94 interspecific hybrids
alongwith their parental lines J. curcas (JC) and J. integerrima
(JI). 129
Figure 4.23 Two- Dimensional plot by PCA showing clustering of 94
interspecific hybrids alongwith their parental lines J. curcas
(JC) and J. integerrima (JI). 130
List of tables
List of tables
Table No. Title Page No.
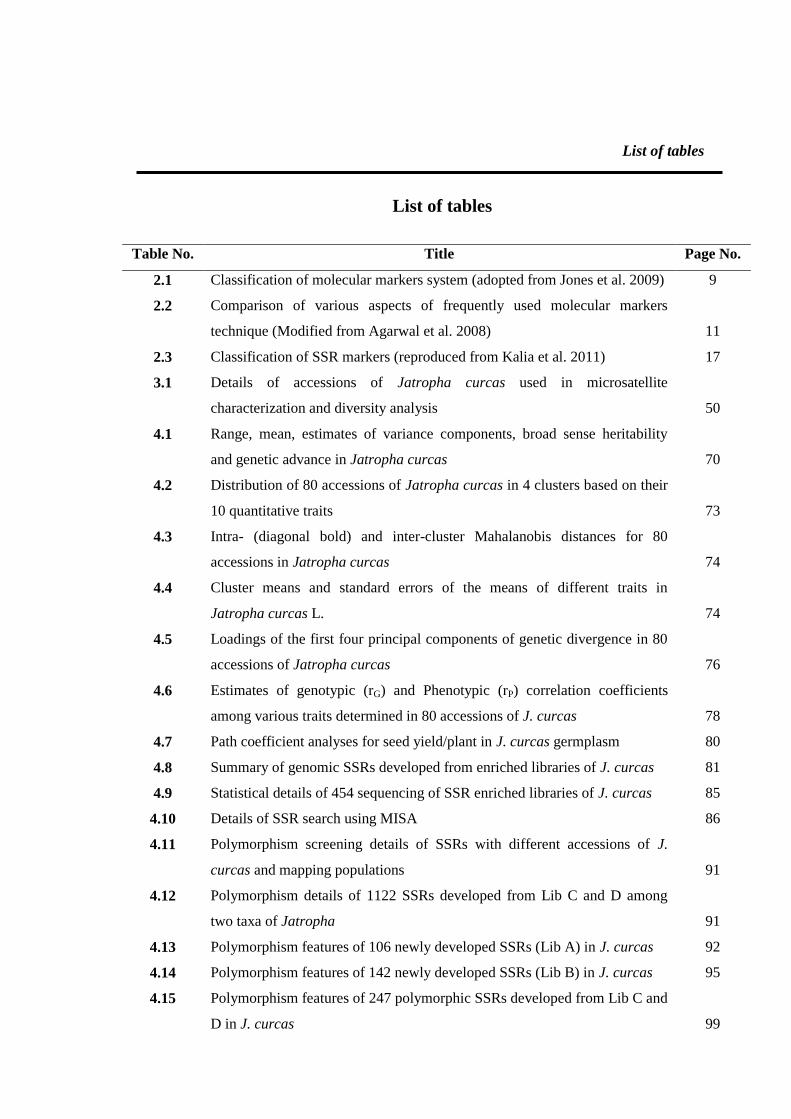
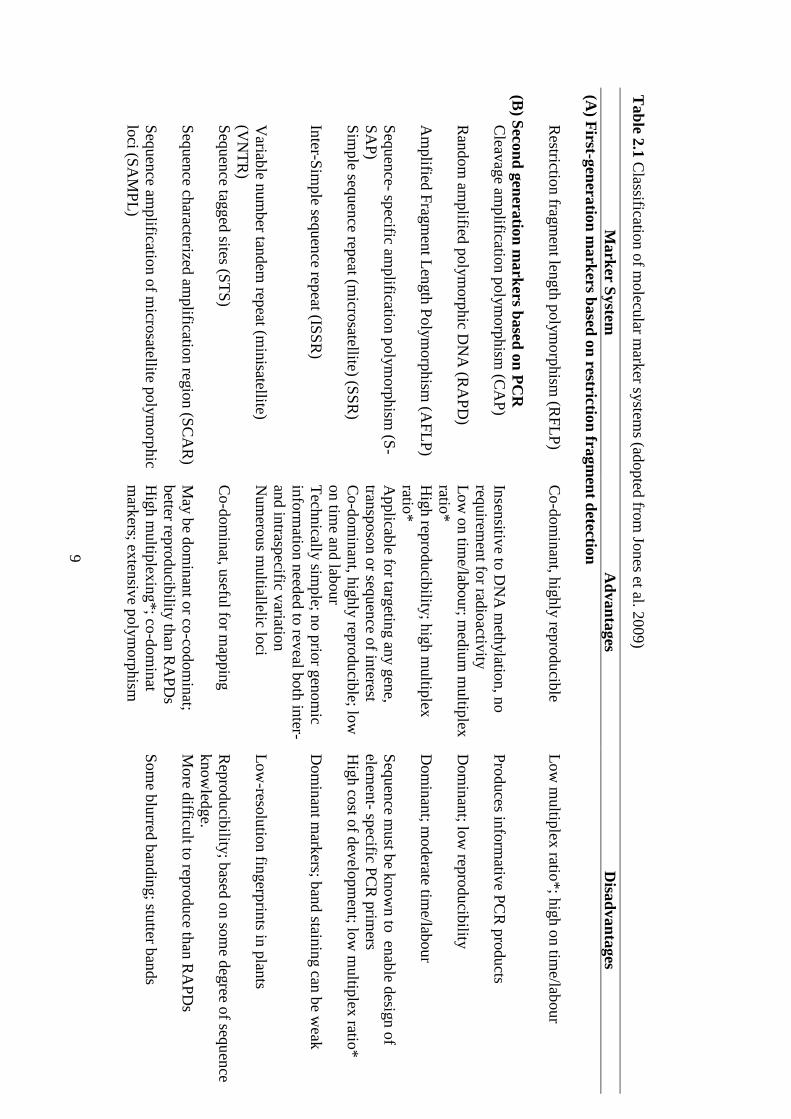
2.1 Classification of molecular markers system (adopted from Jones et al. 2009) 9
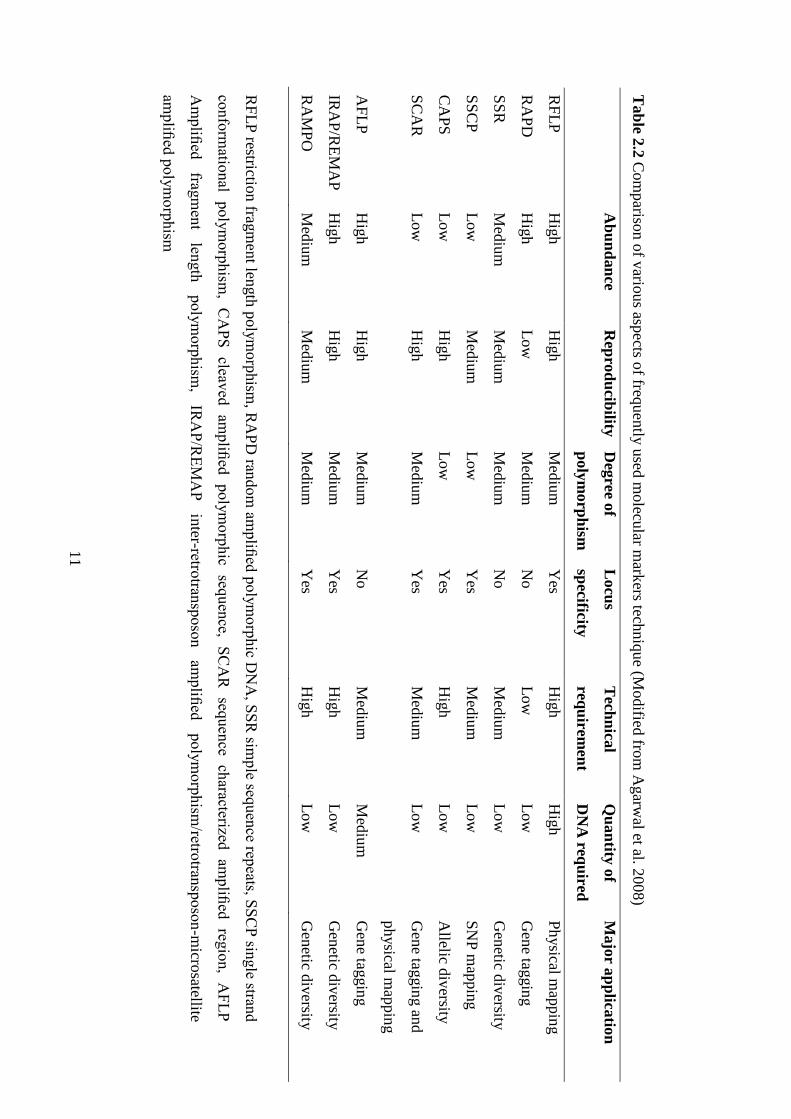
2.2 Comparison of various aspects of frequently used molecular markers
technique (Modified from Agarwal et al. 2008) 11
2.3 Classification of SSR markers (reproduced from Kalia et al. 2011) 17
3.1 Details of accessions of Jatropha curcas used in microsatellite
characterization and diversity analysis 50
4.1 Range, mean, estimates of variance components, broad sense heritability
and genetic advance in Jatropha curcas 70
4.2 Distribution of 80 accessions of Jatropha curcas in 4 clusters based on their
10 quantitative traits 73
4.3 Intra- (diagonal bold) and inter-cluster Mahalanobis distances for 80
accessions in Jatropha curcas 74
4.4 Cluster means and standard errors of the means of different traits in
Jatropha curcas L. 74
4.5 Loadings of the first four principal components of genetic divergence in 80
accessions of Jatropha curcas
76
4.6 Estimates of genotypic (rG) and Phenotypic (rP) correlation coefficients
among various traits determined in 80 accessions of J. curcas 78
4.7 Path coefficient analyses for seed yield/plant in J. curcas germplasm 80
4.8 Summary of genomic SSRs developed from enriched libraries of J. curcas 81
4.9 Statistical details of 454 sequencing of SSR enriched libraries of J. curcas 85
4.10 Details of SSR search using MISA 86
4.11 Polymorphism screening details of SSRs with different accessions of J.
curcas and mapping populations 91
4.12 Polymorphism details of 1122 SSRs developed from Lib C and D among
two taxa of Jatropha 91
4.13 Polymorphism features of 106 newly developed SSRs (Lib A) in J. curcas 92
4.14 Polymorphism features of 142 newly developed SSRs (Lib B) in J. curcas 95
4.15 Polymorphism features of 247 polymorphic SSRs developed from Lib C and
D in J. curcas 99

4.16 Polymorphism features of 41 SSR markers surveyed over 96 accessions of
J. curcas 113
4.17 Analysis of molecular variance (AMOVA) for 96 J. curcas accessions 116
4.18 Different genetic diversity estimates for two populations (indigenous and
exotic) of J. curcas based on 41 SSR loci 116
4.19 Minimum, maximum and mean of the genetic dissimilarity coefficient of 96
accessions of J. curcas 117
4.20 Crossability success in crosses between J. curcas and J. integerrima 123
4.21 Genotyping details of 15 polymorphic primers with 94 interspecific hybrids
and its parents (J. curcas and J. integerrima) 127
4.22 Polymorphism feature of 18 polymorphic SSRs among 48 progenies of
single plants used for heterozygosity assessment 132

Preface
Preface
Jatropha curcas L. is a non-edible, oil-rich crop which has attracted global attention as a
promising renewable resource of biodiesel production. Before its use as a bio-energy crop,
Jatropha was used for medicinal products and as a live fence around arable land. Considering the
importance of this biofuel plant various genetic studies has been carried out and which are still
going on towards the genetic improvement of J. curcas including traditional and modern
approaches.
Wide genetic variation is required in breeding for major agronomically important traits
like seed yield, oil yield and composition, flowering behavior, tree morphology, disease
resistance and the absence of anti-nutritional factors that currently inhibit the use of Jatropha
seed meal in animal feeding. Plant breeding programs need such genetic variation to be able to
combine positive traits from different parents to provide the required profitable and sustainable
Jatropha varieties of the future.
Traditional approaches of genetic improvement of polygenic traits have mainly relied on
phenotypic and pedigree information which are time and labour intensive especially in
heterozygous perennial crops such as J. curcas. Various molecular tools has been devised and
integrated to assist the traditional breeding strategies for faster and precise improvement
including perennial plants.
The molecular marker techniques is one of the most widely exploited tools for various
molecular breeding related studies such as assessing genetic diversity, phyolgenetics,
linkage/QTL mapping etc. In case of J. curcas several studies have also been conducted using
different class of molecular markers to evaluate the genetic diversity in different sets of
germplasm collections such as RAPD, ISSR, AFLP, SSRs and SNPs markers.
The molecular marker based studies showed contrasting results about level of genetic
diversity varying from low to high and explained accordingly based on number of accessions and
techniques used. Majority of these studies were carried out with a limited number of markers and
accessions. This warrants the enrichment of the gene pool along with development and validation
of a large number of polymorphic markers to better understand the available genetic variability
in J. curcas.

Preface
Till date, most of the markers based studies in J. curcas have been performed with
limited numbers of markers. For better understanding of polygenic traits, construction of dense
map and fine QTL mapping a large number of workable and validated markers are required.
Thus, in view of the previous report of low level of genetic diversity and limited number of
validated markers, there is a need to enrich the genetic pool, develop and validate large number
of polymorphic markers. Therefore, the present investigation is devoted to topic “Development
and Application of Microsatellite Markers for the genetic diversity analysis in the Jatropha
curcas L.”
This thesis incorporates the objectives of work undertaken, techniques used, results obtained,
discussion, summary and the bibliography under the following seven heads:
1. INTRODUCTION: This chapter commences with a brief introduction to the background
and objectives of the problem.
2. REVIEW OF LITERATURE: This provides the in depth studies of genetic markers
development and world-wide genetic diversity analysis using different types of molecular
markers.
3. MATERIALS AND METHODS: The chapter describes the experimental procedure
and techniques that were employed in order to accomplished the objectives of the
dissertation.
4. RESULTS: Details of various observations made and results obtained from the
experiments and that were performed are described in the chapter.
5. DISCUSSIONS: Detail analysis of results obtained and conclusions drawn are described
in this chapter.
6. SUMMARY: This chapter summarizes the work that has been presented in this
dissertation and conclusions drawn from it.
7. REFERENCES: This chapter lists the publications that have been referred to the
dissertation.

Chapter 1 Introduction
1
The Jatropha curcas L. was first described by Swedish botanist Carl Linnaeus in 1753 in
“Species Plantarum”. The name of Jatropha derived from the Greek word ‘Jatros’ means
‘Doctor’ and ‘trophe’ means ‘Nutrition’. J. curcas L. is belonging to the family
Euphorbiaceae having chromosome number 2n=22 (Dehgan 1984) with relatively smaller
genome size of ~416 Mb (Carvalho et al. 2008; Sato et al. 2011). It is a multipurpose small
tree or large shrub of 5-7 m tall with an average life span of upto 50 years and is found
throughout the tropical region. Common vernacular names of J. curcas L. in India are
Ratanjyot, Safed arand, Physic nut, Purging nut, Chandrajyot, Jamalghota etc.
J. curcas L. is a tropical species native to Mexico and Central America, but widely
distributed in other tropical and sub-tropical areas of the world, especially in Africa, India
and South-East Asia (Heller 1996; Sujatha and Prabhakaran 1997; Openshaw 2000; Rao et al.
2008). In India, the Portuguese settlers introduced it in the 16th
century. It occurs in almost all
parts of India including Andman islands and generally grown as live fence. It is well adapted
to arid and semi- arid conditions. There are approximately 170 species of Jatropha across the
world (Brittaine and Lutaladio 2010), of which 9 species are being reported in India viz. J.
curcas, J. gossypifolia, J. glandulifera, J. integerrima, J. nana, J. podagrica, J. multifida, J.
maheshwari and J. vilosa.
The plant has inflorescence which is axillary paniculate polychasial cymes formed
terminally on the branches and are complex, possessing main and co-florescences with
paracladia. Flowers are unisexual, monoecious, greenish yellow colored in terminal long,
peduncle paniculate cymes (Divakara et al. 2010). The male flowers consists of 5 calyx,
nearly equal, elliptic or obviate, corolla is campanulate, 5 lobes, connate, hairy inside,
exceeding the calyx, each lobe bears inside a gland at the base, 10 stamens in two series,
outer 5 filaments free, inner 5 filaments connate, dithecous erect anther with opening by
longitudinal slit. Female flowers consist of sepals up to 18 mm long, persistent, calyx as in
male, 4 corolla scarcely exceeding the calyx lobes united, villous inside, ovary 3-locular,
ellipsoid, 1.5-2 mm in diameter, style bifid, ovules solitary in each locule. Flowering time,
number and male/female flower ratio all varied substantially depending on soil fertility, soil
moisture, precipitation and temperature. Flowering occurs during the wet season often with
two flowering peaks, i.e. during summer and autumn (Raju and Ezradanam 2002).
Numerically, 1-5 female flowers and 25-29 male flowers are produced per inflorescences
with an average male to female ratio of 29:1 (Solomon and Ezradanam 2002).
J. curcas can be both protandrous and protogynous and able to produce seeds through
both self- and cross-pollination (Negussie et al. 2013). The unisexual flowers of Jatropha
depend on pollination by insects, including bees, flies, ant and thrips (Brittaine and Lutaladio

2
2010). Each inflorescence yields a bunch of ovoid fruits. Seeds resemble castor in shape,
ovoid, oblong and black in colour. The seeds mature when the capsule changes from green to
yellow, after two months of fruit setting. Each fruit bears three seeds and seeds contain 25-
35% oil.
It can grow well in different kinds of soils, tolerate drought and other environmental
stress conditions and animals do not browse its leaves (Patil 2004; Gmunder et al. 2012). It
can grow almost everywhere- even or gravely, sandy, acidic and alkaline soils having pH
ranging from 5.5 to 8.5. It can thrive in poorest stony soils. It grows even in the cracks and
crevices of rocks on all types of soil except one subjected to water lodging. Jatropha can
grow between 15 and 40 0C temperature and under a broad spectrum of rainfall regimes from
250 to over 1200 mm per annum and is more altered by lower temperatures than by altitude
or day length (Foidl et al. 1996; Katwal and Soni 2003).
J. curcas is usually propagated on mass scale both by seed as well as stem cutting. J.
curcas respond very well to vegetative propagation through stem cutting. Stem cuttings are
typically prepared with one-year-old terminal branches having 2-3 cm diameter. The
branches are cut into 15-20 cm long pieces and put into polybags filled with rooting media of
soil and sand in equal ratio. The polybags are kept in closed and humid condition to promote
rooting. Cuttings are generally exercised during February – March for better rooting and
survival. The rooting begins after 45 days and generation rate from cuttings ranged from 50-
80% (Li 2005). The roots of the cuttings are not as robust as those of the seedlings (Ye et al.
2009). The benefit of cutting propagation is that it offers the possibility to grow privileged
accessions. The cuttings and seedlings of Jatropha are grown in nurseries for 2-6 months and
thereafter transplanted on the field at the beginning of the wet season. The plant propagated
through cuttings show a lower longevity and possesses a lower drought and disease resistance
than those propagated through seeds (Heller 1996).
The production of J. curcas seed yield ranges from 0.1 to 15 t/ha/year in different
countries and regions (Ong et al. 2011) and the oil yield is reported to be 1590 kg/ha/year
(Ong et al. 2011; Silitonga et al. 2011; Mofijur et al. 2012). Depending on the variety, the oil
content of decorticated seed ranges from 30% to 50% by weight and the kernel ranges from
45% to 60% (Ong et al. 2011; Silitonga et al. 2011; Atabani et al. 2013; Mofijur et al. 2012).
J. curcas seed oil is proven to be toxic to many microorganisms, insects and animals.
Despite its toxicity, Jatropha is not pest and disease resistant. J. curcas is susceptible to many
insects, pests and viral diseases such as root rot, stem borer, fruit damage by Webber and
plant damaged by root rot and fruit Webber. The fruit sap suckers (Sahai et al. 2011; Pandey
et al. 2012), virus infestation and bark eater rodents are quite common problems at different
3
locations. The disease is endemic to Jatropha not transmitted to any other plant (Tewari et al.
2007; Narayana et al. 2006). Gao et al. (2010) identified a new strain of Indian cassava
mosaic virus causing a mosaic disease in J. curcas. Snehi et al. (2011) identified new
begomovirus associated with yellow mosaic disease of J. gossypifolia in India.
J. curcas L. has received much attention because of its immense role in biodiesel
production as-an eco-friendly fuel, biodegradable, renewable and non-toxic in nature as
compared to petro-diesel (Pandey et al. 2012). The oil from Jatropha plant is considered as
the best source of biofuel production among the various plants based fuel resources world
over (Belewu et al. 2010). J. curcas L., a non-domesticated shrub has been popularized as an
unique candidate among renewable energy sources due to its peculiar feature like drought
tolerance (Openshaw 2000), rapid growth and easy propagation, higher oil content than other
oil crops (Achten et al. 2008), small gestation period, wide range of environmental adaptation
(King et al. 2009; Johnson et al. 2011) and the optimum plant size and architecture make it as
a sole candidate for further consideration (Sujatha et al. 2008). J. curcas is identified by the
Indian government as one of most suitable biodiesel feedstock, since it is able to grow on
marginal land and yields high-quality oil suitable for energetic use (Gmunder et al. 2012).
Beside biodiesel, J. curcas has number of uses such as: potential phytoremediator
(Moursy et al. 2014), Soil carbon sequestration (Wani et al. (2012), reduction of
environmental pollutants (Bender 2011), as a live fence (Reubens et al. 2011), Jatropha agro-
forestry (Agbogidi et al. 2013b), Jatropha for enrichment of soil (Wani et al. 2006), Biogas
production (Subramanian et al. 2005), Human consumption and animal feed (Segura et al.
2014), In Industry (Atabani et al. 2013), Medicinal value (Dahake et al. 2012, Costa et al.
2014).
Genetic diversity can be assessed using either morphological traits (Kaushik et al.
2007) or molecular markers. The study of genetic diversity based on morphological traits is
not much reliable as they are highly influenced by environment. However, molecular markers
base studies are independent of environmental factors. There is a surge of interest in
identifying a large number of molecular markers for rapid application in the assessment of
genetic diversity and the selection of desired genotypes. Molecular markers have been
considered to have great potential for plant breeding in enhancing the efficiency of selection
of desirable traits via markers-assisted breeding and understanding the genetic relationships,
evolutionary trends and fingerprinting of varieties. Among the various molecular markers,
PCR-based markers such as RAPD, AFLP, ISSR and SSRs were most preferred.
J. curcas is still considered as an undomesticated or semi- domesticated plant and its
response to yield and oil content is found to be erratic with different agro-climatic zones.

4
There are various drawbacks associated with J. curcas such as (i) Non availability of high
yielding varieties, (ii) Asynchronous maturity of fruits (iii) Lesser female flowers (iv) Seed
toxicity (v) Susceptibility for water lodging, frost and diseases (vi) low diversity and
productivity.
Various studies have been carried out in J. curcas to investigate the genetic variability
in different sets of genetic materials. Most of these studies carried out at morphological and
molecular level reported low level of genetic variability and diversity in J. curcas. However,
limited numbers of molecular markers were used for genetic diversity analysis and
identification of polymorphic markers in J. curcas. The low level of genetic variation
warrants the enrichment of the genetic pool, develop and validate large number of
polymorphic markers for the development of linkage map, diversity assessment, quantitative
trait loci (QTL) map and marker assisted breeding for selection of high oil yielding
accessions of J. curcas.
Keeping all these aspects in view, present investigation was undertaken with the following
objectives:
(i) Phenotypic characterization of indigenous accessions of J. curcas.
(ii) Development of large scale genomic derived SSRs from four microsatellite enriched
genomic libraries.
(iii) PCR optimization, polymorphism detection and characterization of developed SSRs for
various attributes.
(iv) Study of molecular genetic diversity among indigenous and exotic accessions of J.
curcas L.
Chapter 2 Review of Literature
5
2.1 Genetic Markers
In recent years, the molecular markers especially DNA-based markers, have been extensively
used in many areas of research such as gene mapping and tagging (Kliebenstein et al. 2001;
Karp and Edwards 1997), characterization of sex (Flachowsky et al. 2001; Martinez et al.
1999), analysis of genetic diversity (Erschadi et al. 2000; Palacios et al. 1999; Lerceteau and
Szmidt 1999; Godt and Hamrick 1999), genetic relatedness (Mace et al. 1999; Rao et al.
1997; Brookfield 1992), linkage map construction and marker assisted breeding (Kalia et al.
2011). According to Stansfield (1986), the term MARKER is usually used for “LOCUS
MARKER”. Each gene has a particular place along the chromosome called LOCUS. Due to
mutations, gene can be modified in several forms mutually exclusives called ALLELES (or
allelic forms). All the allelic forms of gene occur at the same locus on homologous
chromosomes. When allelic forms of one locus are identical, the genotype is called
HOMOZYGOTE (at this locus), whereas different allelic forms constitute a
HETEROZYGOTE. Thus, a molecular marker is defined as a particular segment of DNA that
is representative of the differences at the genomic level. Molecular markers may or may not
correlate with phenotypic expression of a trait. Molecular markers offer numerous advantages
over conventional phenotype based alternatives as they are stable and detectable in all tissues
regardless of growth, differentiation, development or defense status of the cell and are not
confounded by the environment, pleiotropic and epistatic effects. According to Agarwal et al.
(2008), an ideal molecular marker technique should have the following criteria: (1) be
polymorphic and evenly distributed throughout the genome (2) provide adequate resolution
of genetic differences (3) generate multiple, independent and reliable markers (4) simple,
quick and inexpensive (5) need small amounts of tissue and DNA samples (6) have linkage to
distinct phenotypes and (7) require no prior information about the genome of an organism.
In recent years, the progress made in the development of DNA based marker have
great potential for plant breeding in enhancing the efficiency of selection of desirable traits
via marker-assisted breeding and understanding the genetic relationships, evolutionary trends
and fingerprinting of varieties (Johnson et al. 2011).There are three major types of genetic
markers: (1) morphological markers, which themselves are phenotypic characters of a trait
(2) biochemical markers, which include allelic variants of enzymes called isozymes (3) DNA
(or molecular) markers, which reveal sites of variation in DNA (Winter and Kahl 1995, Jones
et al. 1997). Brief description of different types of genetic markers is given below.

6
2.1.1 Morphological markers
Morphological markers are visually characterized as phenotypic characters such as flower
color, seed shape, growth habits or pigmentation. In conventional plant breeding programs
breeder generally used to select desired plant types based on morphological data and also
tried to correlate them to specific morphological markers. However, the morphological
markers are available in limited numbers and have influence of environmental conditions.
Therefore, these markers are not of much utility in plant breeding programs.
2.1.2 Biochemical marker- allozymes (Isozyme)
In population genetics, protein-based markers (allozymes) were the first markers developed
and widely used (Hamrick and Godt 1990). Allozyme was the first true molecular marker
established to distinguish protein variants in enzymes (Schlotterer 2004). Isozyme analysis
has been used for over 60 years for various purposes in biology, viz. to delineate
phylogenetic relationships, to estimate genetic variability and taxonomy, to study population
genetics and developmental biology, to characterize plant genetic resources and plant
breeding (Bretting and Widrlechner 1995). Isozymes were defined as structurally different
molecular forms of an enzyme with, qualitatively, the catalytic function. Isozymes originate
through amino acid alterations, which cause changes in net charge or the spatial structure
(conformation) of the enzyme molecules and also, therefore, their electrophoretic mobility.
Like morphological marker, the biochemicals markers are are also limited in number and are
influenced by environmental factors or the developmental stage of the plant (Winter and Kahl
1995).
2.1.3 Molecular markers or DNA markers
Molecular markers are the DNA sequence variations that can be readily detected and whose
inheritance can be monitored easily. The uses of molecular markers are based on the naturally
occurring DNA polymorphism, which forms basis for designing strategies to exploit for
applied purposes. A marker must be polymorphic i.e. it must exit in different forms so that
chromosome carrying the mutant genes can be distinguished from it. Genetic polymorphism
is defined as the simultaneous occurrence of a trait in the same population of two variants or
genotypes. DNA markers seem to be the best candidates for efficient evaluation and selection
of plant genetic material. Unlike protein markers, DNA markers segregate as single gene and
are not influenced by the environment. DNA is easily extracted from plant materials of any

7
developmental stage and its analysis can be cost and labour effective (Kumar et al. 2009).
The development and use of molecular markers for the detection and exploitation of DNA
polymorphism is one of the most significant developments in the field of molecular genetics
(Semagn et al. 2006). It has also been proved to be helpful in understanding the genetic
relationships, evolutionary trends and fingerprinting of varieties. Genetic diversity can be
assessed either through morphological traits or by using molecular markers. The assessment
of genetic diversity using molecular marker assumes greater significance as it is a pre-
requisite for any sound breeding program (Surwenshi et al. 2011). DNA marker systems,
which were introduced to genetic analysis in the 1980s, have many advantages over the
traditional morphological and protein markers that are used in genetic and ecological analyses
of plant population: firstly, an unlimited number of DNA markers can be generated;
secondly, DNA marker profiles are not affected by the environment and thirdly DNA
markers, unlike isozyme markers are not constrained by tissue or developmental stage
specificity (Park et al. 2009).
2.2 Classification of DNA markers
The various types of available DNA markers can be classified broadly into following three
groups:
2.2.1 First generation DNA markers (Hybridization based)
The first generation DNA marker system employed southern blot based markers such as
RFLPs (Restriction Fragment Length Polymorphism). The RFLP technique employs
molecular hybridization of cDNA or genomic DNA probes with genomic DNA digested with
restriction enzymes. RFLP is the most widely used hybridization-based molecular marker.
RFLP markers were first used in 1975 to identify DNA sequence polymorphism for genetic
mapping of a temperature- sensitive mutation of adeno-virus serotypes (Grodzicker et al.
1975). It was then used for human genome mapping (Botstein et al. 1980) and later adopted
for plant genomes (Helentjaris et al. 1986; Weber and Helentjaris 1989).
2.2.2 Second generation (PCR- based markers)
The second generation DNA-based molecular markers were driven by the invention of
polymerase chain reaction (PCR) (Mullis et al. 1986). PCR is a molecular biology technique
for enzymatically replicating (amplifying) small quantities of DNA and analyzed in many
individuals without the requirement for cloning or isolating large amounts of ultra-pure

8
genomic DNA. It is used to amplify a short (usually up to 10 kb), well-defined part of a DNA
strand from single gene or just a part of a gene. PCR revolutionized the genetic and
ecological analysis of populations in several ways because it had two major advantages over
southern blot based markers. First, it requires only small amount of DNA to allow analysis at
very early stages, thus reducing the need for plant nurseries. Second, it is inexpensive and
simple enough so that large scale experiments can be carried out rapidly on a large scale
basis. The various types of PCR based markers such as RAPD, AFLP, ISSR, IRAPs and SSR
relies on the use of PCR primers, which binds to multiple or specific sites in the genome.
This can be achieved by using either short PCR primers (Randomly Amplified
Polymorphism, RAPD) (Williams et al. 1990), PCR primers that are complementary to
repetitive elements such as microsatellites (Inter-Simple-Sequence-Repeats, ISSR)
(Zietkiewicz et al. 1994) or retrotransposans (Inter- Retrotransposon amplified
Polymorphism, IRAPs) (Kalendar et al. 1999). Alternatively, restriction fragments could be
amplified by adding linkers and subsequent selective amplification as in case of AFLP
(Zabeau and Vos 1993; Vos et al. 1995).
2.2.3 Third generation DNA markers (DNA sequence based)
In recent years, there has been an emphasis on the development of newer and more efficient
high throughput molecular marker systems involving inexpensive non gel-based assays with
high throughput detection systems i.e. SNPs (Single Nucleotide Polymorphism) (Gupta et al.
2001) and Microarrays (Linman et al. 2009). The polymorphism of single base differences
can be assayed by high-throughput analysis, by hybridization with allele-specific
oligonucleotides (ASO), primer extension, oligonucleotide ligation assays (OLA) and
invasive cleavage. The main advantage of SNPs is their high potential for an automated high-
throughput analysis at moderate cost (Chen and Sullivan 2003)
“….the arrival of DNA manipulation techniques promoted a shift from
enzyme-based to DNA-based markers (Schlotterer 2004).”
9
Tab
le 2.1
Classificatio
n o
f molecu
lar mark
er system
s (adopted
from
Jones et al. 2
009)
Mark
er Syste
m
Ad
van
tages
Disa
dvan
tages
(A) F
irst-gen
eratio
n m
ark
ers based
on
restrictio
n fra
gm
ent d
etection
Restrictio
n frag
men
t length
poly
mo
rphism
(RF
LP
) C
o-d
om
inan
t, hig
hly
repro
ducib
le L
ow
multip
lex ratio
*; h
igh o
n tim
e/labour
(B) S
econ
d g
enera
tion
ma
rkers b
ased
on
PC
R
Cleav
age am
plificatio
n p
oly
morp
hism
(CA
P)
Insen
sitive to
DN
A m
ethylatio
n, n
o
requirem
ent fo
r radio
activity
Pro
duces in
form
ative P
CR
pro
ducts
Ran
dom
amplified
poly
morp
hic D
NA
(RA
PD
) L
ow
on tim
e/labour; m
ediu
m m
ultip
lex
ratio*
Dom
inan
t; low
repro
ducib
ility
Am
plified
Frag
men
t Len
gth
Poly
morp
hism
(AF
LP
) H
igh rep
roducib
ility; h
igh m
ultip
lex
ratio*
Dom
inan
t; moderate tim
e/labour
Seq
uen
ce- specific am
plificatio
n p
oly
morp
hism
(S-
SA
P)
Applicab
le for targ
eting an
y g
ene,
transp
oso
n o
r sequen
ce of in
terest
Seq
uen
ce must b
e know
n to
enab
le desig
n o
f
elemen
t- specific P
CR
prim
ers
Sim
ple seq
uen
ce repeat (m
icrosatellite) (S
SR
) C
o-d
om
inan
t, hig
hly
repro
ducib
le; low
on tim
e and lab
our
Hig
h co
st of d
evelo
pm
ent; lo
w m
ultip
lex ratio
*
Inter-S
imple seq
uen
ce repeat (IS
SR
) T
echnically
simple; n
o p
rior g
enom
ic
info
rmatio
n n
eeded
to rev
eal both
inter-
and in
traspecific v
ariation
Dom
inan
t mark
ers; ban
d stain
ing can
be w
eak
Variab
le num
ber tan
dem
repeat (m
inisatellite)
(VN
TR
)
Num
erous m
ultiallelic lo
ci L
ow
-resolu
tion fin
gerp
rints in
plan
ts
Seq
uen
ce tagged
sites (ST
S)
Co-d
om
inat, u
seful fo
r map
pin
g
Rep
roducib
ility; b
ased o
n so
me d
egree o
f sequ
ence
know
ledge.
Seq
uen
ce characterized
amplificatio
n reg
ion (S
CA
R)
May
be d
om
inan
t or co
-codom
inat;
better rep
roducib
ility th
an R
AP
Ds
More d
ifficult to
repro
du
ce than
RA
PD
s
Seq
uen
ce amplificatio
n o
f micro
satellite poly
morp
hic
loci (S
AM
PL
)
Hig
h m
ultip
lexin
g*; co
-dom
inat
mark
ers; exten
sive p
oly
morp
hism
Som
e blu
rred b
andin
g; stu
tter ban
ds

10
(C) T
hird
- gen
eratio
n m
ark
ers based
on
DN
A seq
uen
cing
Sin
gle n
ucleo
tide p
oly
morp
hism
(SN
P)
Com
mon; ev
enly
distrib
uted
; detectio
n
easily au
tom
ated; h
igh th
roughput; lo
w
assay co
st; usefu
l for asso
ciation
studies; p
oten
tially h
igh m
ultip
lex
ratio*
Usu
ally o
nly
two alleles p
resent
Ex
pressed
sequen
ce tag (E
ST
) E
asy to
collect an
d seq
uen
ce; reveals
novel tran
scripts; g
ood rep
resentatio
n
of tran
scripts
Erro
r-pro
ne co
-dom
inan
t and d
om
inan
t mark
ers,
which
can lead
to co
mplex
ity; n
ull alleles d
etected
directly
Targ
et recognitio
n am
plificatio
n p
roto
col (T
RA
P)
Sim
ple to
use; h
ighly
info
rmativ
e;
pro
duces n
um
erous m
arkers b
y u
sing
existin
g p
ublic E
ST
datab
ase; uses
mark
ers targeted
to sp
ecific gen
e.
Req
uires cD
NA
or E
ST
sequen
ce info
rmatio
n fo
r
prim
er dev
elopm
ent
Micro
arrays (arran
gem
ent o
f small sp
ots o
f DN
A
fixed
to g
lass slides)
Whole g
enom
e scannin
g; h
igh
-
thro
ughput tech
nolo
gy; g
enoty
pe-
phen
oty
pe relatio
nsh
ip; ex
pressio
n
analy
sis of larg
e num
bers o
f gen
es
Ex
pen
sive; n
eeds g
ene seq
uen
ce data; tech
nically
dem
andin
g
Div
ersity arra
y tech
nolo
gy (D
ArT
) N
o seq
uen
ce data req
uired
; hig
h-
thro
ughput; d
etects single b
ase chan
ges
and in
dels; rap
id g
ermplasm
characterizatio
n
Dom
inan
t mark
ers; techn
ically d
eman
din
g
Sin
gle-stran
d co
nfo
rmatio
nal p
oly
morp
hism
(SS
CP
) D
etects DN
A p
oly
morp
hism
and
mutatio
ns at m
ultip
le sites in D
NA
fragm
ents
Tem
peratu
re-dep
enden
t; sensitiv
ity affected
by p
H
Den
aturin
g g
radien
t gel electro
phoresis (D
GG
E)
Sep
arates indiv
idual seq
uen
ce from
a
com
plex
mix
ture o
f micro
bes b
ased o
n
sequen
ce differen
ces
PC
R frag
men
t size limited
to ab
out 5
00 b
p;
difficu
lt to reso
lve frag
men
ts that d
iffer by o
nly
one
or tw
o b
ases
Tem
peratu
re grad
ient g
el electrophoresis (T
GG
E)
Alm
ost id
entical to
DG
GE
; more
reliable; u
ses temperatu
re grad
ient
Tech
nically
dem
andin
g; little u
sed in
plan
ts
*T
he m
ultip
lex ratio
is the n
um
ber o
f indep
enden
t loci d
etected in
the assa
y
11
Tab
le 2.2
Com
pariso
n o
f vario
us asp
ects of freq
uen
tly u
sed m
olecu
lar mark
ers techniq
ue (M
odified
from
Agarw
al et al. 2008)
A
bu
nd
an
ce R
epro
du
cibility
D
egre
e of
poly
morp
hism
Locu
s
specificity
Tech
nica
l
requ
irem
ent
Qu
an
tity o
f
DN
A req
uired
Majo
r ap
plica
tion
RF
LP
H
igh
H
igh
M
ediu
m
Yes
Hig
h
Hig
h
Ph
ysical m
appin
g
RA
PD
H
igh
L
ow
M
ediu
m
No
Low
L
ow
G
ene tag
gin
g
SS
R
Med
ium
M
ediu
m
Med
ium
N
o
Med
ium
L
ow
G
enetic d
iversity
SS
CP
L
ow
M
ediu
m
Low
Y
es M
ediu
m
Low
S
NP
map
pin
g
CA
PS
L
ow
H
igh
L
ow
Y
es H
igh
L
ow
A
llelic div
ersity
SC
AR
L
ow
H
igh
M
ediu
m
Yes
Med
ium
L
ow
G
ene tag
gin
g an
d
ph
ysical m
appin
g
AF
LP
H
igh
H
igh
M
ediu
m
No
Med
ium
M
ediu
m
Gen
e taggin
g
IRA
P/R
EM
AP
H
igh
H
igh
M
ediu
m
Yes
Hig
h
Low
G
enetic d
iversity
RA
MP
O
Med
ium
M
ediu
m
Med
ium
Y
es H
igh
L
ow
G
enetic d
iversity
RF
LP
restriction frag
men
t length
poly
morp
hism
, RA
PD
random
amplifi
ed p
oly
mo
rphic D
NA
, SS
R sim
ple seq
uen
ce repeats, S
SC
P sin
gle stran
d
confo
rmatio
nal
poly
morp
hism
, C
AP
S
cleaved
am
plifi
ed
poly
mo
rphic
sequen
ce, S
CA
R
sequen
ce ch
aracterized
amplifi
ed
regio
n,
AF
LP
Am
plifi
ed
fragm
ent
length
poly
morp
hism
, IR
AP
/RE
MA
P
inter-retro
transp
oso
n
amplifi
ed
poly
morp
hism
/retrotran
sposo
n-m
icrosatellite
amplifi
ed p
oly
mo
rphism

12
2.3 Simple sequence repeats (SSRs) or microsatellite markers
The first widespread markers to avail full advantage of PCR technology was microsatellites
(Litt and Luty 1989; Tautz 1989; Weber and May 1989). The genomes of higher organisms
contain three types of multiple copies of simple repetitive DNA sequences (satellite DNAs,
minisatellites and microsatellites) arranged in arrays of vastly differing size (Armour et al.
1999; Hancock 1999). Microsatellites, variously known as short tandem repeats (STR),
Simple Sequence Repeats (SSRs) or Simple Sequence Length Polymorphism (SSLPs) are
tandem repeats occurs in the form of iterations of repeat units of almost anything from a
single base pair to thousands of base pairs (Litt and Luty 1989). Some researchers (e.g.
Armour et al. 1999) define microsatellites as 2-8 bp repeats, others (e.g., Goldstein and
Pollock 1997 ) as 1-6 or even 1-5 bp repeats (Schlotterer 1998). Mono-, di-, tri- and
tetranucleotide repeats are the main types of microsatellite, but repeats of five (penta-) or six
(hexa-) nucleotides are usually classified as microsatellites as well. The term satellite DNA
originate from the observation in the 1960s of a fraction of shared DNA that showed a
distinct buoyant density, detectable as a ‘satellite peak’ in density gradient centrifugation and
that was subsequently identified as large centromeric tandem repeat.
Microsatellites were first identified in humans in 1981 by sequence analysis of alleles
at the β globin locus (Miesfeld et al. 1981; Spritz 1981) and subsequently found to be
naturally occurring and ubiquitous in prokaryotic and eukaryotic genomes (Tautz and Renz
1984; Jeffreys et al.1985; Tautz 1989; Thoren et al.1995; Toth et al. 2000). The repeats of
longer units form minisatellites or in the extreme case, satellite DNA (Ellegren 2004). The
isolation and sequencing of satellite DNAs revealed repeat motifs of variable length from just
a single base to thousands of base, a typical satellite DNA is a centromeric sequence with a
100bp repeat (Pardue and Gall 1970). Subsequently, satellite of 10-30 bp repeat motifs,
termed minisatellites was isolated in mammals (Jeffreys et al. 1985). Finally, satellites with
even shorter repeat motifs, called microsatellites, were isolated. In 1982, Hamada and his
colleagues showed the existence of dinucleotide repeats of poly (CA) and poly (GT) in
diverse eukaryotic genomes. Furthermore, Weber and May (1989) demonstrated that SSR
polymorphisms (SSRPs) could be easily detected by PCR, using two flanking primers, which
prompted the development of SSRs in various mammalian species and their subsequent
assignment to specific chromosomes. In plants, the presence of SSRs was first demonstrated
by the hybridization of oligonucleotide probes of poly (GT) and poly (AG) on the phage
libraries of tropical tree genomes.

13
A search of published DNA sequences reveals that SSRs are also highly abundant in
diverse plant genomes (Morgante and Olivieri 1993). It has been shown that SSR in exons are
less abundant than in non-coding regions (Hancock 1995) and that different taxa exhibit
different preferences for SSR types (Beckmann and Weber 1992, Lagercrantz et al. 1993;
Tautz and Schlotterer 1994). Microsatellites are highly polymorphic, abundant and fairly
evenly distributed throughout the euchromatic part of the genomes. These properties have
made microsatellites one of the most popular genetic markers for mapping, paternity testing
and population genetics (Goldstein and Schlotterer 1999). SSRs are non-randomly distributed
within expressed sequence tags (ESTs), UTR regions, introns and coding regions. SSR
variations within these regions can cause frame-shift, alteration in gene expression,
inactivation of gene, change of function and eventually phenotypic changes and can cause
neuronal disease, cancers in human and animals (Li et al. 2004). The significant part of SSR
structure are functionally important for gene transcription, translation, chromatin
organization, recombination, DNA replication, DNA MMR system, cell cycle, etc. as shown
in Figure 2.1.
Figure 2.1 Putative functions/effects of SSRs (Reproduced from Li et al. 2002)
SSR functions/effects
Chromatin
organization
Regulation of DNA
metabolic processes
Regulation of gene
activity
Chromosoma
l organization
DNA
structure
Centromere
and
telomere
Transcription Binding
protein
Translation
DNA
replication
Recombination MMR
system Cell cycle

14
2.3.1 Origin/genesis of microsatellites
The genesis/origin of SSRs is an evolutionarily dynamic process and has proven to be
exceedingly complex phenomenon (Ellegren 2004; Pearson et al. 2005). The most accepted
mechanism of microsatellite genesis is based on (i) proto-microsatellite (ii) insertion/deletion
of 2-4 nucleotide and (iii) retro-transposon
(i) Proto-microsatellite
The origin of microsatellites concluded that a minimum number of repeats called as proto-
microsatellite are required before DNA polymerase slippage can extend the number of
repeats (Rose and Falush 1998). It has been shown that in the species that have primates as
their common ancestor (e.g. gorillas, chimpanzees and humans) GA mutations at the ƞ-globin
locus change the sequence ATGTGTGT to ATGTATGT, thus creating a microsatellite
(ATGT)2 which evolved into (ATGT)4 in African monkeys and (ATGT)5 in humans (Messier
et al. 1996).
(ii) Insertion/deletion of 2-4 nucleotides
Zhu et al. (2000) conducted an elegant study on mutated human genes and demonstrated that
more than 70% of all 2 to 4 nucleotide insertions resulted in 2 to 5 new repeats, most of
which are not extensions of pre-existing repeats but new microsatellites originating from
random sequences e.g.
AC
ACGGACG ACGACGACG (ACG) 3
ACGAATCGACG ACGACGACG (ACG) 3
AT
(iii) Retro-transposon
Retro-transposons are repetitive DNA fragments, which are inserted into chromosomes after
they had been reverse-transcribed from any RNA molecule. SSR generation was found to be
accompanied by retro-transposition events by analysis of a portion-sequenced of human and
rice genome DNA (Nadir et al. 1996; Temnykh et al. 2001). According to Arcot et al. (1995),
the Alu SINES (Short Interspersed Nuclear Elements) family is largely dispersed in the
primate genome and is likely to contribute to the genesis of microsatellites due to the
presence of A-rich regions at the 3’ terminal and within the sequence.

15
2.3.2 Mechanism of SSR length variation
The most accepted mechanism of microsatellite length variation is mutational mechanism
including errors during recombination (Levinson and Gutman 1987), unequal crossing-over
(Harding et al. 1992) and polymerase slippage (Wolff et al. 1991; Stephan and Kim 1998)
during DNA replication or repair. When unequal crossing-over occurs, there can be drastic
changes such as the loss or gain of a large number of repeats.
(i) Replication slippage
Length changes in microsatellite DNA generally occur during DNA replication or repair. The
DNA polymerase slippage can occur, in which one DNA strand temporarily dissociates from
the other and rapidly rebinds in a different position, leading to base-pairing errors and
continued lengthening of the new strand and an increase in the number of repeats (i.e.
additions). If the error occurs on the complementary strand or a decreased number of repeats
(i.e. deletions) if the error occurs on the parent strand (Goldstein and Schlottrer 1999,
Ellegren 2004). High rate of slippage have been demonstrated but these appear to lead to only
small changes in the number of repeats. Slippage can destabilize microsatellites either
because there is no effective repair system for DNA loops or because of alteration in DNA
polymerase or its cofactors that result in increased slippage rates.
Figure 2.2 Slippage during DNA replication. Assume that in the original DNA molecule
there were 5 repeats of the motif, symbolized by a box. Slippage leads to the formation of
new alleles with 6 and 4 repeats, depending on the strand containing the polymerase error
(reproduced from Goldstein and Schlottrer 1999)
3' 5'
’ 5' 3'
3' 5'
3’
’'’ 5'
3'
’
5'
’
3'
’
5'
’ 3' 5’
Replication
Slippage
3'
’ 5'
’
3'
’
5
’'
’
3' 5'
New replication cycle
+1 repeat -1 repeat
3' 5'
3' 5'
3' 5'
3' 5'
16
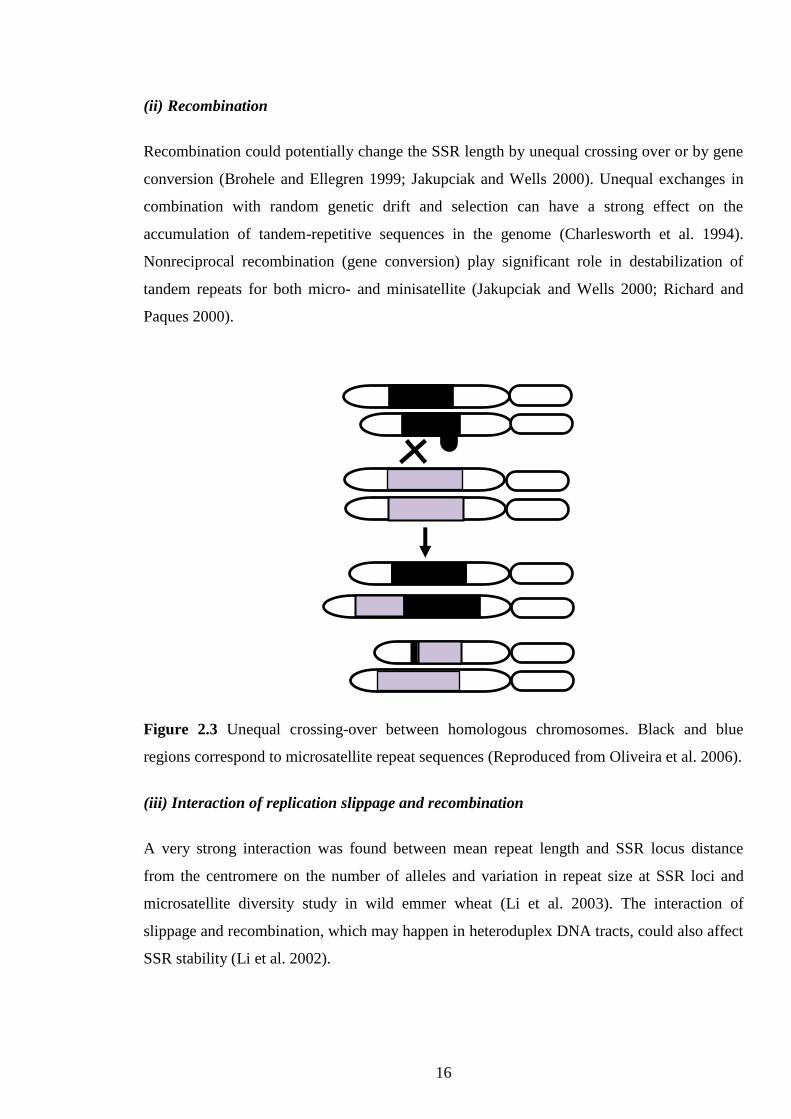
(ii) Recombination
Recombination could potentially change the SSR length by unequal crossing over or by gene
conversion (Brohele and Ellegren 1999; Jakupciak and Wells 2000). Unequal exchanges in
combination with random genetic drift and selection can have a strong effect on the
accumulation of tandem-repetitive sequences in the genome (Charlesworth et al. 1994).
Nonreciprocal recombination (gene conversion) play significant role in destabilization of
tandem repeats for both micro- and minisatellite (Jakupciak and Wells 2000; Richard and
Paques 2000).
Figure 2.3 Unequal crossing-over between homologous chromosomes. Black and blue
regions correspond to microsatellite repeat sequences (Reproduced from Oliveira et al. 2006).
(iii) Interaction of replication slippage and recombination
A very strong interaction was found between mean repeat length and SSR locus distance
from the centromere on the number of alleles and variation in repeat size at SSR loci and
microsatellite diversity study in wild emmer wheat (Li et al. 2003). The interaction of
slippage and recombination, which may happen in heteroduplex DNA tracts, could also affect
SSR stability (Li et al. 2002).

17
2.3.3 Classification of SSRs
Microsatellites are classified according to the type of repeat sequence as perfect, imperfect,
interrupted or compound. In a perfect microsatellite, the repeat sequence is not interrupted by
any base not belonging to the motif (e.g. TATATATATATATATA). While in an imperfect
microsatellite there is a pair of bases between the repeated motifs that does not match the
motif sequence (e.g. TATATATACTATATA). In case of an interrupted microsatellite there
is a small sequence that does not match the motif sequence (e.g.
TATATACGTATATATATA). While in a compound microsatellite the sequence contains
two adjacent distinctive sequence repeats (e.g. TATATATATAGTGTGTGTGT). Depending
upon the arrangement of nucleotides within the repeat motifs, Weber (1990) used the terms
perfect, imperfect and compound to classify microsatellites, whereas Wang et al. (2009a)
coined the terms simple perfect, simple imperfect, compound perfect and compound
imperfect.
Table 2.3 Classification of SSR markers (reproduced from Kalia et al. 2011)
Types Example
(a) Based on the number of nucleotides per repeat
Mononucleotide (A)n
Dinucleotide (CA)n
Trinucleotide (CGT)
Tetranucleotide (CAGA)n
Pentanucleotide (AAATT)n
Hexanucleotide (CTTTAA)n
(b) Based on the arrangement of nucleotides in the repeat motifs
perfect or simple perfect (CA)n
Simple imperfect (AAC)n ACT (AAC)n+1
Compound or simple compound (CA)n (GA)n
Interrupted or imperfect or compound imperfect (CCA)n TT (CGA)n+1
( C) Based on location of SSRs in genome
Nuclear nuSSR
Chloroplastic cpSSRs
Mitochondrial mtSSRs

18
2.3.4 Frequency and distribution of SSRs
Various studies have demonstrated that the SSRs constitute a large fraction of non-coding
DNA. However, recently several reports have shown that a large number of SSRs are also
located in transcribed regions of genomes, including protein coding genes and expressed
sequence tags (ESTs), although, repeat number of SSRs in these regions are comparatively
low (Morgante et al. 2002; Li et al. 2004). For instance, in cereals (maize, wheat, barley,
Sorghum and rice), only 1.5-7.5% SSRs are available in ESTs (Kantety et al. 2002; Thiel et
al. 2003). The dinucleotide repeats are most common in many species, but are much less
frequent in coding region than in non-coding regions (Li et al. 2002; Wang et al. 1994). In
many species, exons have more triplet SSRs than other repeats (Morgante et al. 2002; Li et al.
2004). In plants, the most frequent triplet is AAG (Li et al. 2004), although in cereals, most
common triplet is CCG (Cordeiro et al. 2001; Varshney et al. 2002; Thiel et al. 2003). In
general, frequency of microsatellites is inversely related to the genome size in plants, but the
percentage of repetitive DNA appeared to remain constant in coding regions (Morgante et al.
2002). The genomic distribution, evolutionary dynamics, biological function and practical
utility have been the objective of many researchers, as summarized in several review articles
(Tautz and Schlotterer 1994; Jarne and Lagoda 1996; Schlotterer 1998; Chambers and
MacAvoy 2000; Li et al.2002; Dieringer and Schlotterer 2003; Ellegren 2004; Oliveira et al.
2006; Subirana and Messeguer 2008; Sun et al.2009).
2.3.5 Identification of polymorphism
To identify DNA markers that reveal differences between parents (i.e. polymorphic markers)
it is critical that sufficient polymorphism exists between parents. Generally, cross pollinating
species possess higher levels of DNA polymorphism compared to inbreeding species,
mapping in inbreeding species generally requires the selection of parents that are distantly
related. In many cases, parents that provide adequate polymorphism are selected on the basis
of the level of genetic diversity between parents (Anderson et al. 1993). The choice of DNA
markers used for mapping may depend on the availability of characterized markers or the
appropriateness of particular markers for a particular species. Once polymorphic markers
have been identified, they must be screened across the entire mapping population, including
the parents (and F1 hybrid, if possible). This is known as marker ‘genotyping’ of the
population.

19
2.4 Discovery and development of SSR markers
Highly polymorphic and dispersed molecular markers can be used to study the biological
relatedness of organism, facilitate the mapping of valuable traits and ultimately the cloning of
their genes. In recent years, a number of different molecular marker systems have been
developed, with microsatellite markers proving to be most powerful. However, despite their
usefulness for many applications, the difficulty, expenses and time in obtaining microsatellite
markers are a major hindrance to their use. The traditional method for isolating microsatellite
clones is to create a small-insert, partial genomic library in a plasmid or phage vector and
then screen clones by repeated rounds of filter hybridization using an oligonucleotide repeat
probe. Microsatellite enrichment has also been developed to increase the proportion of clones
in a given library containing the microsatellite motif of interest. Several strategies for
microsatellite enrichment have been reported (Edwards et al. 1996; Fisher and Bachman
1998; Hamilton et al. 1999; Kijas et al. 1994; Koblizkova et al. 1998; Paetkau 1999; Phan et
al. 2000; Zane 2002; Nunome et al. 2006 and 2009). Conventional genomic libraries
construction and subsequent screening is cumbersome, tedious and cost intensive process
which requires high level of expertise. However, once developed, the running cost of these
markers is low enough. AT di-nucleotides, which are the most abundant type of SSRs in
plants are difficult to isolate from libraries because they are palindromic (Powell et al. 1996).
Therefore, several alternative strategies have been devised in order to reduce the time
invested in SSR isolation and to significantly increase yield of SSRs. These methods involve
identification of SSR sequence in RAPD amplicons, screening of available sequenced EST
databases and transferability of markers from related species.
2.4.1 Development of SSRs through enriched small insert genomic library construction
An efficient way to discover new SSR is to construct libraries enriched for specific SSR
motifs (Ostrander et al. 1992; Kijas et al. 1994; Kandpal et al. 1994; Edwards et al.1996;
Fisher and Bachmann 1998; Hamilton et al. 1999; Jakse and Javornik 2001). The SSR
markers have been developed for many plant species (Edwards et al.1996; Connell et al.1998;
Fisher and Bachmann 1998; Jones et al. 2001; Kolliker et al. 2001; Zane et al. 2002; Cai et al.
2003; Wang et al. 2004) including several trees (Rossetto et al. 1999; Liebhard et al. 2002;
Marinoni et al. 2003; Merdinoglu et al. 2005). The construction of SSR-enriched libraries can
be tedious and expensive work, especially without some type of enhancement process to
eliminate non-SSR-containing clones. Several enrichment methodologies have been
developed (Edwards et al. 1996; Connell et al. 1998; Fisher and Bachmann 1998; Hamilton et

20
al. 1999; Wang et al. 2004), but regardless of the protocols, SSR detection and discovery
invariably relies on sequencing all the insert of selected clones to confirm the presence of the
desired motif. Several polymerase chain reaction (PCR)- based methods have been applied to
both non-enriched and enriched libraries to identify inserts containing SSRs before
sequencing and these strategies have increased the efficiency of detecting colonies with
desired SSR inserts (Lench et al. 1996; Lunt et al. 1999; Chen et al. 2005). Microsatellite
DNA loci have become important source of genetic information for a variety of purposes
(Goldstein and Schlotterer 1999). To amplify microsatellite loci by PCR, primers must be
developed from the DNA that flanks specific microsatellite repeats. These regions of DNA
are among the most variable in the genome, thus primer-binding sites are not well conserved
among distantly related species (Pepin et al. 1995; Primmer et al. 1996; Zhu et al. 2000).
Among various strategies for obtaining microsatellite loci, the cloning small genomic
fragments and using radio labeled oligonucleotide probes of microsatellite repeats to identify
clones with microsatellite was the first described and works well in organisms with abundant
microsatellite loci (Tautz1989; Weber and May 1989; Weissenbach et al. 1992).
Unfortunately, this approach does not work well when microsatellite repeats are less
abundant. Thus, two classes of enrichment strategies have been developed: 1) uracil-DNA
selection (Ostrander et al. 1992) and 2) selective hybridization capture (Armour et al. 1994;
Kandpal et al.1994; Kijas et al. 1994). The selective hybridization strategy based SSR
enrichment technique is a relatively simple, robust, reproducible and cost effective approach
for isolating large number of SSRs from diverse plant species with higher efficiency. In the
first step of selective hybridization approach, fragments generated by sonication or
endonuclease digestion of genomic DNA are ligated to known sequence, a vector or an
adaptor. Following the fragmentation-ligation step, DNA is denatured and hybridized with
the repeat containing probes (Figure 2.4). The probes can be bound to a nylon membrane
(Karagyozov et al. 1993, Armour et al. 1994) or biotynylated and captured on streptavidin
coated beads (Kandpal et al.1994; Kijas et al. 1994). After the hybridization step and several
washes with buffer to remove nonspecific binding, the probe bound DNA is eluted and
recovered by southern blotting, PCR or direct sequencing (Zane et al. 2002).
Two protocols were proposed to produce genomic libraries that were highly enriched
for specific SSRs using a primer extension reaction (Ostrander et al. 1992; Paetkau 1999).
Both methods rely on the construction of a primary genomic library, in which fragmented
genomic DNA is inserted into a phagemid or a phage vector in order to obtain a single strand
DNA (ssDNA) library. ssDNA is then used as a template for a primer extension reaction,
primed with repeat-specific oligonucleotides, which generates a double stranded product only

21
from vectors containing the desired repeat. During the primary library production step, for
practical reasons, only a limited portion of the investigated.
2.4.2 Development of SSRs through screening of RAPD amplicons
To avoid library construction and screening, some authors proposed modifications of the
RAPD approach for the amplification of unknown SSRs, by either using repeat-anchored
random primers (Wu et al. 1994) or using RAPD primers and subsequent southern
hybridization of polymerase chain reaction (PCR) bands with SSR probes (Cifarelli et al.
1995; Richardson et al. 1995). Although not useful for single-locus analyses as no
information on SSR flanking regions is obtained, these methods inspired alternative strategies
for the identification of single SSRs. Based on the observed abundance of repeat regions in
RAPD amplicons, isolation of SSR regions was achieved simply by means of southern
hybridization of RAPD profiles with SSR-repeat containing probes, followed by the selective
cloning of positive bands (Ender et al. 1996), or through the cloning of all the RAPD
products and screening of arrayed clones (Lunt et al. 1999). Other non-library PCR based
strategies rely on the use of repeat-anchored primers to isolate and then sequence one (Fisher
et al. 1996) or both regions (Lench et al. 1996; Cooper et al. 1997) flanking SSR repeats. All
these methods provide, if successful, a quick alternative to laborious and time- consuming
library screening, but their use has not been that much frequent (Zane et al. 2002).

22
Figure 2.4 A general protocol for developing SSR markers with a SSR-enrichment step
(reproduced from Park et al. 2009)
2.4.3 Development of SSRs from EST sequences (genic or EST-SSRs)
A wealth of sequence data of ESTs has been generated as a result of sequencing projects for
gene discovery from several plant species, giving scientists the flexibility to access many full-
length cDNA clones and characterized genes. These sequences are usually available in online
database in public domain and can be downloaded and scanned for identification of SSRs.
The expressed sequence tag-simple sequence repeats (EST-SSRs), genic SSRs or gene-
derived SSRs, found in complementary DNA (cDNA) or ESTs sequence, between 1.1% and
4.8% have EST-SSR tandems (Saha et al. 2004). These informative markers are becoming
Extracted genomic DNA from young leaves
Digested Genomic DNA with restriction enzymes
Size fractionated from 300 to 1500bp
Adaptor ligation
One way PCR amplification using adaptor primers
Hybridization with SSR motif biotin probe and Streptavidin
coated magnetic beads in amplicons
Substract SSR motif elements using magnet
Washing
Denaturation
Reamplification
Cloning and Sequencing with SSR motif
fragments

23
the marker of choice as a large number of cDNA and EST sequences are being uploaded over
the public databases. These markers are more attractive than genome-based SSR markers
because they are obtained in a fast, efficient and low-cost method and are present in coding
regions of the genome, which makes them absolute markers of functional genes (Haimei et al.
2005; Varshney et al. 2005). Thus, the development of EST-SSRs is relatively easy and
inexpensive because they are produced form ESTs that are publicly available. However, the
generation of EST-SSRs is largely limited to those species or close relatives for which the
ESTs sequences are available. The EST-SSRs have some intrinsic advantages over genomic
SSRs as they have higher transferability rate because the primers are designed from the more
conserved coding regions of the genome. Several search modules or programmes have been
extensively used to identify SSRs such as:
MISA(MIcroSAtellite,http://pgrc.ipk-gatersleben.de/misa),
SSRprimer (http://hornbill.cspp.latrobe.edu.au.http://acpfg.imb.uq.edu.au),
Sputnik (http://abajian.nert/sputnik/index.html),
SSRIT (SSR Identification Tool, http://www.gramene.org/db/searches/ssrtool),
SSRSEARCH (ftp://ftp.gramene.org/pub/gramene/software/scripts/ssr.pl),
TRF (Tandem Repeat Finder, http://tandem.bu.edu/trf/trf.html) etc. Recently, Yadav et al.
(2011) developed and deployed 50 EST-SSRs over 25 accessions of J. curcas collected from
different geographical regions of India for genetic diversity analysis. Cubry et al. (2014)
developed 226 EST-SSR markers and tested over 19 Hevea accessions to assess the
polymorphism and diversity analysis. Wang et al. (2014) developed 1129 EST-SSRs from
two 454 sequencing cDNA libraries of Gossypium barbadense and 311 polymorphic loci
were integrated into interspecific BC1 genetic linkage map. Jain et al. (2014) downloaded
13,513 ESTs from NCBI and obtained 7552 unigenes from these ESTs and developed 377
ESTs-SSR in Jatropha curcas. SSRs have been isolated for a number of plant species using
this strategy. Greater DNA sequence conservation in transcribed regions, however, leads to
lower polymorphism in EST-SSRs making them less efficient compared to genomic SSRs for
distinguishing the closely related genotypes. Therefore, genomic SSRs are superior over
EST-SSRs for fingerprinting or varietal identification studies.
A major drawback of EST-SSRs is the sequence redundancy that yields multiple sets
of markers at the same locus (Parida et al. 2006). To circumvent the problem of redundancy
in EST data base, a non-redundant unigene EST data set (random EST sequences assembled
into unique gene sequences called unigenes) should be used. However, EST sequence
analyses revealed approximately 1.5-7.5% of sequences containing microsatellite motifs in
cereals (Kantety et al. 2002; Thiel et al. 2003). Among dicotyledonous species the frequency

24
of ESTs containing SSRs was found to range from 2.65 to 16.82% (Kumpatla and
Mukhopadhyay 2005). Therefore, regardless of the plant considered, an ever-increasing
number of EST sequences provide a complementary source for microsatellite marker
identification. Although the conserved nature of coding sequences may limit their
polymorphism, it should facilitate cross-amplification of loci among phylogenetically related
species (Scott et al. 2000) and even genera.
2.4.4 Development of SSRs through search of genome sequences
Another approach for the isolation of SSRs involves a computational search of the genome
databases. Weber and May (1989) reported abundance of the (CA)n SSRs in the human
genome through search of human genome sequence database. In plants, the first report of
(CA)n repeats in soybean sequence was the one from a computer search of the Gene Bank
databases (Akkaya et al. 1992). Morgante and Olivieri (1993) showed an abundance of (AT)n
repeats in 30 different plant genomes and demonstrated that the analysis of repeat number
variations by PCR was highly informative in genome analyses. Wang et al. (1994) surveyed
mono-, di-, tri- and tetra-nucleotide repeats which were all present in non-coding regions, but
57% of the tri-nucleotide repeats, containing G-C base pairs, reside in the coding region. The
abundance of tri-nucleotide repeats in coding region was attributed to the other types being
eliminated from the coding sequences because of their ability to cause frame-shift mutations.
However, in species lacking genomic sequences, a computer search would not be
useful in developing large scale SSR markers. Construction of SSR-enriched libraries leading
to development of large-scale sequences would be a plausible way to develop SSR markers.
2.4.5 Development of SSR through next generation sequencing
Traditional methods for the identification of microsatellite markers usually demand the
construction of small-insert genomic libraries, colony selection by microsatellite- containing
probe hybridization, sequencing of selected clones, primer design for suitable flanking
regions and assessments on the marker polymorphism by PCR analysis on a germplasm
sample. Later on, methods employing microsatellite- enriched genomic libraries diminished
costs, time and workload necessary for marker development (Billotte et al. 1999; Ostrander et
al. 1992; Paetkau 1999). More recently, researchers are being applying next-generation
sequencing technologies to generate sequence data for the genome identification of
microsatellite regions and primer design (Abdelkrim et al. 2009; Castoe et al. 2010;
Csencsics et al. 2010; Zhu et al. 2012). Next-generation sequencing (NGS) techniques

25
became commercially available around 2005 and since then, several different sequencing
methods have been developed, all of which are continuously being improved.
2.5 Cross-species amplification of SSRs
Sometimes, sequence information for a particular genome is not available or insufficient to
develop large scale SSRs. In such cases, it may be advantageous to utilize primer sequences
identified for one species in the analysis of other closely related species. In general, the EST-
SSRs showed higher rate of cross-species transferability as compared to genomic SSRs. In
this way SSRs developed for one species can be successfully utilized for other related
species. A large numbers of reports available cross-species transferability of SSRs was used
and few are listed below:
Wen et al. (2010) selected 419 Expressed sequence tag (EST)-SSR that had been
developed for Manihot esculenta (Cassava), and investigated whether they could be
transferred to J.curcas and found that the transferability of EST-SSR markers was high across
the species. Pamidimarri et al. (2011) isolated 49 SSR markers from J. curcas and checked
the ability of cross species amplification to deduce the generic relationship with its 6 sister
taxa (J. glandulifera, J. gossypifolia, J. integerrima, J. multifida, J. podagroca and J.
tanjorensis). Yadav et al. (2011) designed 406 EST-SSR markers and showed 57% to 95.6%
transferability among 5 species of Jatropha and 47.0% transferability across genera in
Ricinus communis. Laosatit et al. (2013) developed 163 EST-SSRs to evaluate the
transferability and genetic relatedness among 4 accessions of J. curcas from China, Mexico,
Thailand and Vietnam, 5 accessions of congeneric species, viz. J. gossypifolia, dwarf J.
integerrima, J. multifida, J. podagrica and Ricinus communis. The polymorphic markers
showed 75.56-85.19% transferability among four species of Jatropha and 26.67%
transferability across genera in Ricinus communis. The cross species SSR transferability has
also been used in various crop plant as few are listed here. Peakall et al. (1998) demonstrated
the successful cross-species amplification of 31 Soybean (Glycine max) SSR loci to within
and among legume genera, for the study of variation within population of single species. The
cross- species amplification within soybean (Glycine max) was up to 65% whereas, outside
the genus was much lower about 3% to 13%. Gupta et al. (2003) used 78 SSRs primer
successfully for the study of their transferability to 18 related wild species and 5 cereal
species (barley, oat, rye, rice and maize). Kuleung et al. (2004) examined the transferability
of SSR markers among wheat (Triticum aestivum L.), rye (Secale cereaale L.) and triticale
(T.duram L. or T. aestivum L. X Secale sp.). One hundred forty-eight wheat and 28 rye SSR

26
markers were used to amplify genomic DNA from five lines each of wheat, rye and triticale.
Tang et al. (2006) analyzed the utility of EST-SSR markers among monocots in silico and by
experiment for homologous analysis of SSR-ESTs and transferability of wheat SSR-EST
markers across barley, rice and maize. Chen et al. (2010) assessed the transferability 120 rice
SSR markers to 21 different bamboo species and reported 68.3% transferability. Sathya and
Jayamani (2013) used 35 microsatellite primers pairs derived from the adzukibean (Vigna
angularis (wild.) Ohwi & Ohashi) for the assessment of transferability over 36 genotype of
greengram and related Vigna species.
2.6 Advantage of SSR analysis
SSR markers have many advantages over the other marker systems. A few advantages are
listed as 1) High reproducibility: The high reproducibility would be the most important in
genetic analysis. While reproducibility of the SSR profile is as robust as it is with RFLPs,
experimental procedures for SSR analysis are much simpler and require only a small amount
of the template DNA. Since SSR analysis does not require restriction with enzymes, it can
reproduce the same profiles regardless of the state of the template DNA. It also does not
require template DNA to be ultra pure, which is a requirement in AFLP analysis since
contaminated or impure DNA is often recalcitrant in restriction enzyme digestion to produce
nonspecific spurious bands. This is a real benefit when one is dealing with specimens that are
dry, contaminated, mummified or even in fossilized form in the wild (Manen et al. 2003;
Boder et al. 2006). 2) Hyper-variability: The hyper-variable nature of SSRs produces very
high allelic variations even among very closely related varieties. A literature survey showed
that number of alleles varied from 1 to 37 with diversity indices of 0.29-0.95 in major crop
species (Powell et al. 1996). The level of genetic variation detected by SSRs analysis was
almost two times higher than that detected by RFLPs, with 61 soybean lines (Morgante et al.
1994). In a comparative study of the utility of RFLP, RAPD, AFLP and SSR marker systems
for germplasm analysis, SSRs showed the highest expected heterozygosity, while AFLP had
the highest effective multiplex ratio (Powell et al. 1996). 3) Co-dominancy: The third
advantage has to do with the co-dominat nature of SSR polymorphisms. Although
homoplasious bands can be misleading in scoring SSR profiles, the SSR bands produced
from the same set of primers are intuitively orthologous. The multiple bands generated from
RAPD and AFLP analysis do not permit their designation as allelic or orthologous bands
until they are converted into STS markers after sequencing. The co-dominant nature of SSRs
is suitable for genetical analysis in segregating F2 population or parentage analysis in hybrids
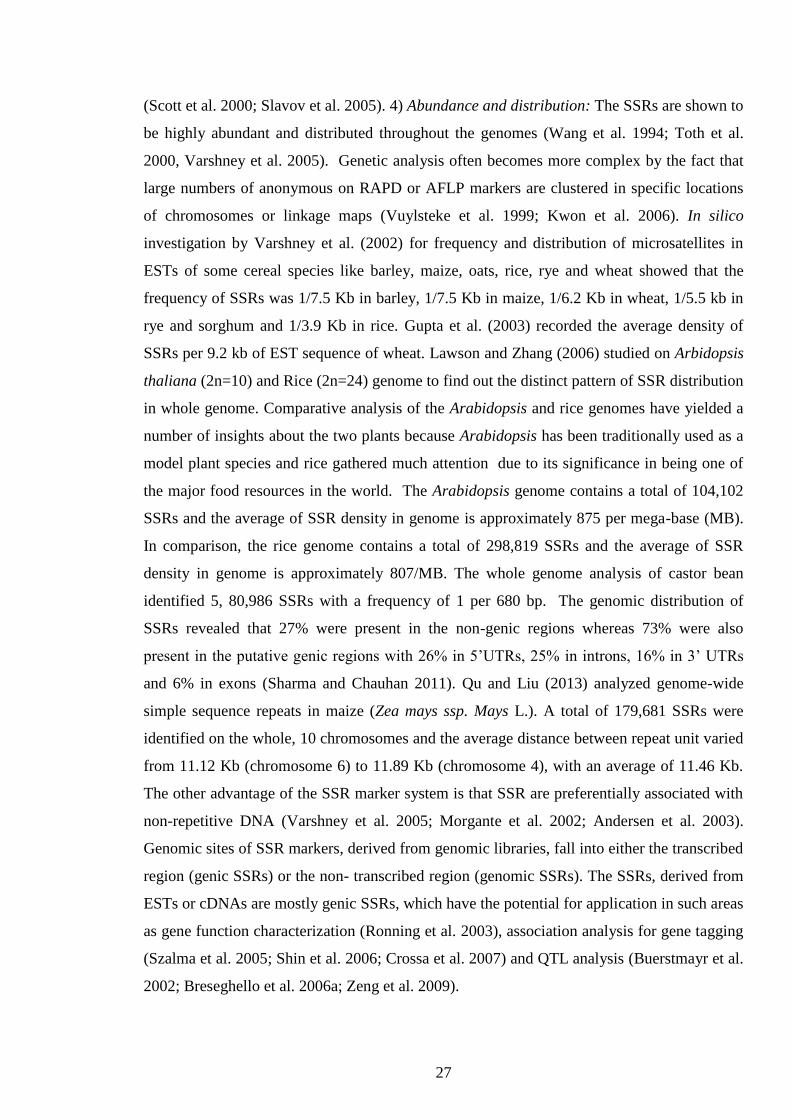
27
(Scott et al. 2000; Slavov et al. 2005). 4) Abundance and distribution: The SSRs are shown to
be highly abundant and distributed throughout the genomes (Wang et al. 1994; Toth et al.
2000, Varshney et al. 2005). Genetic analysis often becomes more complex by the fact that
large numbers of anonymous on RAPD or AFLP markers are clustered in specific locations
of chromosomes or linkage maps (Vuylsteke et al. 1999; Kwon et al. 2006). In silico
investigation by Varshney et al. (2002) for frequency and distribution of microsatellites in
ESTs of some cereal species like barley, maize, oats, rice, rye and wheat showed that the
frequency of SSRs was 1/7.5 Kb in barley, 1/7.5 Kb in maize, 1/6.2 Kb in wheat, 1/5.5 kb in
rye and sorghum and 1/3.9 Kb in rice. Gupta et al. (2003) recorded the average density of
SSRs per 9.2 kb of EST sequence of wheat. Lawson and Zhang (2006) studied on Arbidopsis
thaliana (2n=10) and Rice (2n=24) genome to find out the distinct pattern of SSR distribution
in whole genome. Comparative analysis of the Arabidopsis and rice genomes have yielded a
number of insights about the two plants because Arabidopsis has been traditionally used as a
model plant species and rice gathered much attention due to its significance in being one of
the major food resources in the world. The Arabidopsis genome contains a total of 104,102
SSRs and the average of SSR density in genome is approximately 875 per mega-base (MB).
In comparison, the rice genome contains a total of 298,819 SSRs and the average of SSR
density in genome is approximately 807/MB. The whole genome analysis of castor bean
identified 5, 80,986 SSRs with a frequency of 1 per 680 bp. The genomic distribution of
SSRs revealed that 27% were present in the non-genic regions whereas 73% were also
present in the putative genic regions with 26% in 5’UTRs, 25% in introns, 16% in 3’ UTRs
and 6% in exons (Sharma and Chauhan 2011). Qu and Liu (2013) analyzed genome-wide
simple sequence repeats in maize (Zea mays ssp. Mays L.). A total of 179,681 SSRs were
identified on the whole, 10 chromosomes and the average distance between repeat unit varied
from 11.12 Kb (chromosome 6) to 11.89 Kb (chromosome 4), with an average of 11.46 Kb.
The other advantage of the SSR marker system is that SSR are preferentially associated with
non-repetitive DNA (Varshney et al. 2005; Morgante et al. 2002; Andersen et al. 2003).
Genomic sites of SSR markers, derived from genomic libraries, fall into either the transcribed
region (genic SSRs) or the non- transcribed region (genomic SSRs). The SSRs, derived from
ESTs or cDNAs are mostly genic SSRs, which have the potential for application in such areas
as gene function characterization (Ronning et al. 2003), association analysis for gene tagging
(Szalma et al. 2005; Shin et al. 2006; Crossa et al. 2007) and QTL analysis (Buerstmayr et al.
2002; Breseghello et al. 2006a; Zeng et al. 2009).
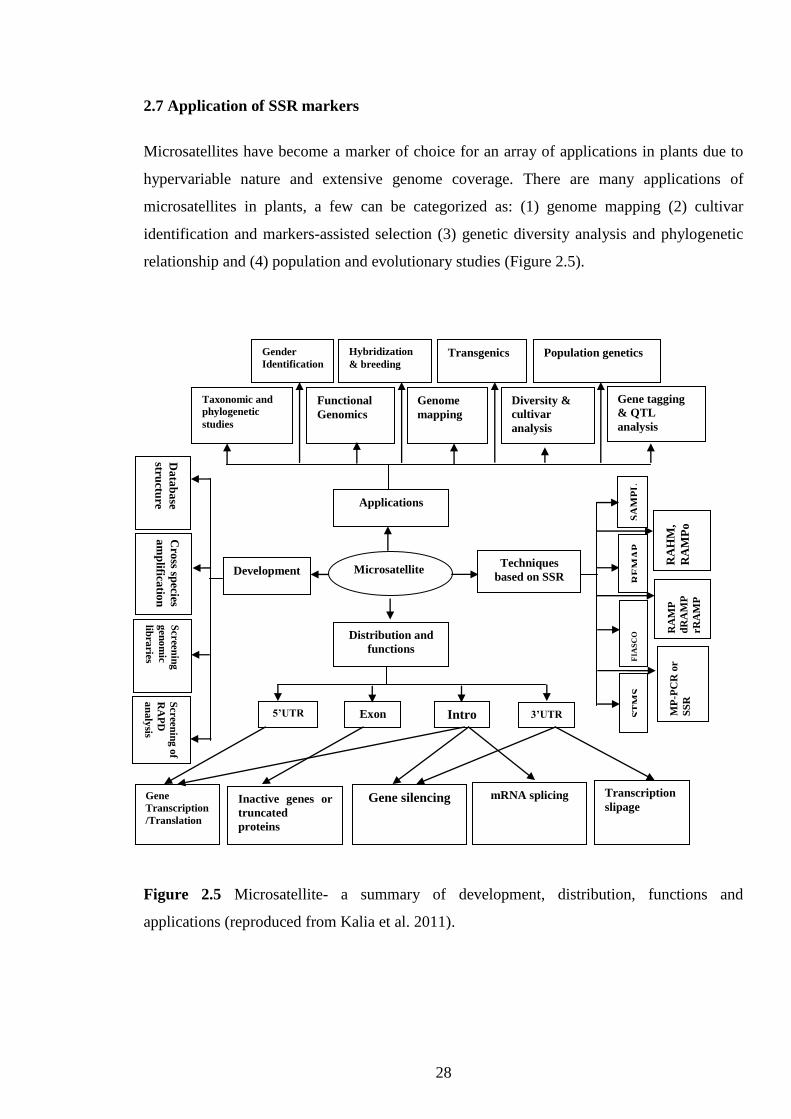
28
2.7 Application of SSR markers
Microsatellites have become a marker of choice for an array of applications in plants due to
hypervariable nature and extensive genome coverage. There are many applications of
microsatellites in plants, a few can be categorized as: (1) genome mapping (2) cultivar
identification and markers-assisted selection (3) genetic diversity analysis and phylogenetic
relationship and (4) population and evolutionary studies (Figure 2.5).
Figure 2.5 Microsatellite- a summary of development, distribution, functions and
applications (reproduced from Kalia et al. 2011).
Gender
Identification
Hybridization
& breeding Transgenics Population genetics
Taxonomic and
phylogenetic
studies
Functional
Genomics
Genome
mapping
Diversity &
cultivar
analysis
Gene tagging
& QTL
analysis
Da
tab
ase
structu
re Applications
Techniques
based on SSR Development
Distribution and
functions
RA
HM
,
RA
MP
o S
AM
PL
Cro
ss species
am
plifica
tion
Scree
nin
g
gen
om
ic
libra
ries
Scree
nin
g o
f
RA
PD
an
aly
sis R
EM
AP
F
IAS
CO
S
TM
S
RA
MP
dR
AM
P
rR
AM
P
MP
-PC
R o
r
SS
R
Microsatellite
3’UTR Intro
n
Exon 5’UTR
Gene
Transcription
/Translation
Inactive genes or
truncated
proteins
Gene silencing mRNA splicing Transcription
slipage

29
(1) Genome mapping
Genome mapping consists of (a) genetic mapping (b) comparative mapping and (c) physical
mapping.
(a) Genetic mapping
Genetic mapping with microsatellite markers in plants was first reported in tropical trees
(Condit and Hubbell 1991) and then reported in soybean (Akkaya et al. 1992) and rice (Wu
and Tanksley 1993; Zhao and Kochert 1993).
(b) Comparative mapping
Comparative mapping is the alignment of chromosome or chromosomal fragment of related
species based on genetic mapping of common DNA markers and can trace the history of
chromosome rearrangements during the evolution of plants, animals and insects.
Microsatellite markers can facilitate comparative mapping which definitely helps to identify
‘linkage blocks’, major gene syntenies, chromosome rearrangement and micro-syntenies
among species. Major or micro-synthesis will further help to develop DNA markers for
specific chromosomal regions for marker-assisted selection and even for cross-species
homologous cloning (Wang et al. 2009b). Comparative genomics of Arabidopsis relatives has
great potential to improve our understanding of molecular function and evolutionary
processes. Recent studies of phylogenetic relationships within Family Brassicaceae provide
an important framework for comparative genomics research. Comparative linkage mapping
and chromosome painting in the close relatives of Arabidopsis inferred an ancestral
karyotype of these species. In addition, comparative mapping to Brassica identified genomic
blocks that have been maintained since the divergence of the Arabidopsis and Brassica
lineages (Schranz et al. 2007). Microsatellite markers have been used for comparative
mapping between Quercus robur (L.) and Castanea sativa (Mill.) (Barreneche et al. 2004).
EST-SSRs were used in comparative mapping in wheat, barley, rye and rice. The
conservative chromosome regions between wheat and rice and the presence of orthologues of
barley EST-SSRs in different species have been confirmed and identified (Yu et al. 2013,
Varshney et al. 2005; Stein et al. 2007). SSR markers have also been used to construct whole
genome physical maps of model crop species, for anchoring and comparing the frames of
soybean genetic and physical maps (Shultz et al. 2007; Shoemaker et al. 2008).
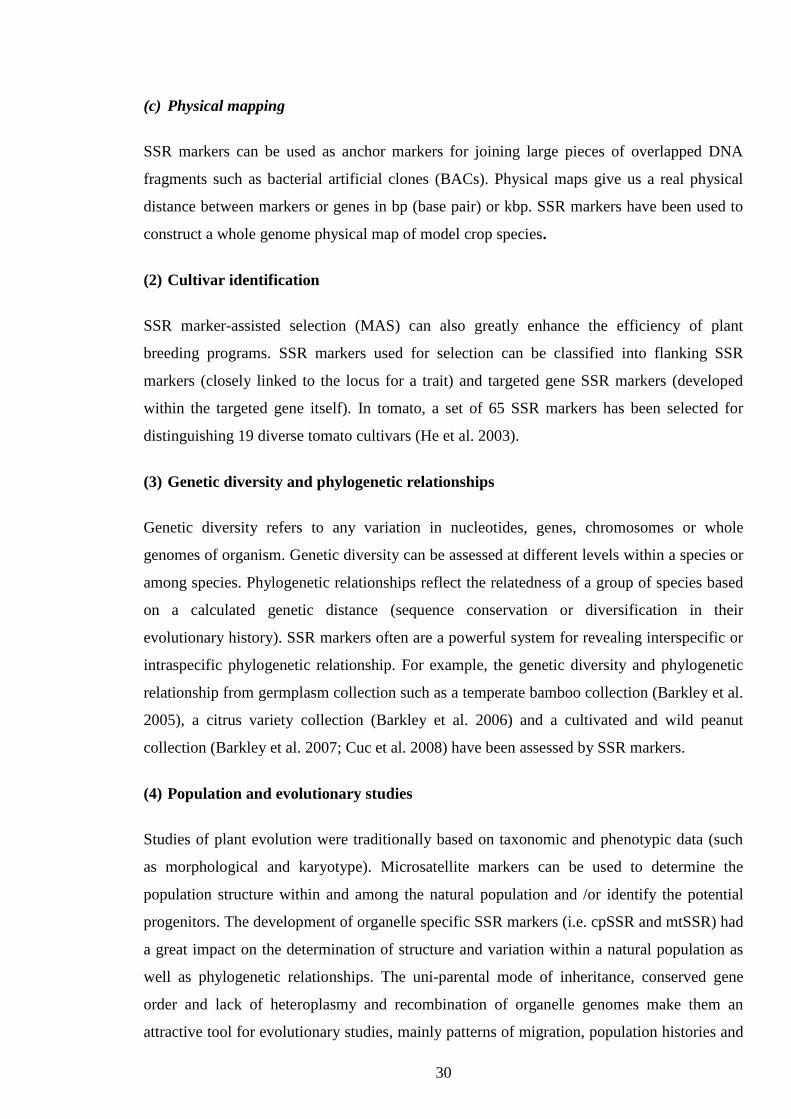
30
(c) Physical mapping
SSR markers can be used as anchor markers for joining large pieces of overlapped DNA
fragments such as bacterial artificial clones (BACs). Physical maps give us a real physical
distance between markers or genes in bp (base pair) or kbp. SSR markers have been used to
construct a whole genome physical map of model crop species.
(2) Cultivar identification
SSR marker-assisted selection (MAS) can also greatly enhance the efficiency of plant
breeding programs. SSR markers used for selection can be classified into flanking SSR
markers (closely linked to the locus for a trait) and targeted gene SSR markers (developed
within the targeted gene itself). In tomato, a set of 65 SSR markers has been selected for
distinguishing 19 diverse tomato cultivars (He et al. 2003).
(3) Genetic diversity and phylogenetic relationships
Genetic diversity refers to any variation in nucleotides, genes, chromosomes or whole
genomes of organism. Genetic diversity can be assessed at different levels within a species or
among species. Phylogenetic relationships reflect the relatedness of a group of species based
on a calculated genetic distance (sequence conservation or diversification in their
evolutionary history). SSR markers often are a powerful system for revealing interspecific or
intraspecific phylogenetic relationship. For example, the genetic diversity and phylogenetic
relationship from germplasm collection such as a temperate bamboo collection (Barkley et al.
2005), a citrus variety collection (Barkley et al. 2006) and a cultivated and wild peanut
collection (Barkley et al. 2007; Cuc et al. 2008) have been assessed by SSR markers.
(4) Population and evolutionary studies
Studies of plant evolution were traditionally based on taxonomic and phenotypic data (such
as morphological and karyotype). Microsatellite markers can be used to determine the
population structure within and among the natural population and /or identify the potential
progenitors. The development of organelle specific SSR markers (i.e. cpSSR and mtSSR) had
a great impact on the determination of structure and variation within a natural population as
well as phylogenetic relationships. The uni-parental mode of inheritance, conserved gene
order and lack of heteroplasmy and recombination of organelle genomes make them an
attractive tool for evolutionary studies, mainly patterns of migration, population histories and

31
levels of differentiation (Provan et al. 2001). However, ESTs are also being used for such
analysis because in such studies, one actually looks at the evolution of functional genes (Joshi
et al. 1999). Evolution of genetic diversity and phylogenetic relationships has resulted in
identification of some misclassified accessions that were reclassified. Genetic diversity
assessment and phylogenetic relationship construction will provide important information for
choosing parental lines for breeding programs, classification of plant germplasm accessions
and further curation and acquisition of new plant germplasm accessions (Wang et al. 2009a).
(5) QTL mapping and marker assisted breeding (MAB)
Microsatellite markers have been efficiently deployed in determination of specific genomic
regions that are responsible for the expression of important physiological and agronomic
traits. It has been used in analyzing quantitative trait loci (QTLs) which can lead to the
identification of candidate genes for the trait of interest that are particularly vital for the
breeding program like yield, disease resistance, stress tolerance, seed and fruit quality etc.
(Neeraja et al. 2007; Romero et al. 2009). Countless number of studies are available on QTL
mapping and MAB in plant using SSR markers. A few important and latest studies are
mentioned here.
(A) QTL mapping
Ding et al. (2011) developed genetic map consisting of 180 polymorphic SSR markers with
an average linkage distance of 11.0 cM and identified 5 QTL for maize test weight. Wang et
al. (2012) explored the genetic basis for stay-green traits in maize using 112 polymorphic
SSR markers and identified 14 quantitative trait loci (QTLs) for three stay-green and related
traits. Guo et al. (2013) utilized 245 RILs and 236 markers (211 SSR, 6 CAPS, 5 STS, 2 SNP
and 12 IDP) to identify QTLs for oil, starch and protein content traits in maize. Liu et al.
(2014) identified a total of 83 QTL for maize kernel-size traits and kernel weight in multi-
environments. Uga et al. (2013) identified five quantitative trait loci (QTLs) for rice using
SSR and SNP for the ratio of deep rooting (RDR). Lim et al. (2014) identified QTLs for 6
traits (plant height, tiller number, panicle diameter, panicle length, flag leaf length and flag
leaf width) for japonica rice. They identified 11 main- and 16 minor-effect QTLs for 6 traits
using 131 molecular markers (68 SSR, 35 STS and 28 insertion/deletion). Feng et al. (2013)
constructed genetic map for common wheat (Triticum aestivum L.) using 195 SSR and STS
markers and identified 3 QTL for A-type starch granule content. Rustgi et al. (2013)
developed high-density linkage map of wheat using 81 molecular markers (31 SSR, 1 STM,

32
25 RFLP, and 24 DArT) on chromosome 3A to increase the precision of previously identified
yield component QTLs and to map QTLs for biomass- related trait and identified four novel
QTLs for shoot biomass, total biomass, kernels/spike (KPS) and Pseudocercosporella
induced lodging (PsIL). Cui et al. (2014) constructed a genetic map consisting of 159 loci
distributed across 21 wheat chromosomes using 589 molecular markers (g-SSR, e-SSR,
DArT, STS, SRAP and ISSR). They identified 22 QTL for yield per plant (YD) and 12 QTLs
for yield difference between the value (YDDV) under higher nitrogen (HN) and the value
under lower nitrogen (LN). Rajkumar et al. (2013) constructed a linkage map with 104
markers loci comprising 50 EST-SSRs, 34 non-genic nuclear SSR and 20 SNPs in Sorghum
(Sorghum bicolor L. Moench) and identified a total of 28 QTLs for root and yield related
traits.
(B) Marker assisted breeding (MAB)
Furthermore, a large number of monogenic and polygenic loci for various traits could be
identified and exploited for marker-assisted selection (Joshi et al. 1999). Marker assisted
selection or marker assisted breeding can help breeders bypass the traditional phenotype
based selections in the field and save time and labour to develop new varieties. MAB can not
be affected by environmental factors, thus allowing the selection to be performed under any
environmental conditions. MAB is highly suitable for gene pyramiding. The rice variety
Swarna has been efficiently converted to a submergence tolerant variety in three backcross
generations using markers assisted backcrossing (Neeraja et al. 2007). Singh et al. (2013a)
utilized marker-assisted simultaneous and stepwise backcross breeding for pyramiding blast
resistance genes, Piz5 and Pi54, from non-Basmati donors, C101A51 and Tetep, respectively,
into PRR78, an elite Basmati restorer line of rice hybrid, Pusa RH10. Cao et al. (2014)
demonstrated the first practical use of chromosome segment introgression lines (CSILs) for
the transfer of fiber quality QTLs into upland cotton cultivars using SSR markers without
detrimentally affecting desirable agronomic characteristics. Tyagi et al. (2014) developed
high-yielding wheat variety with better nutritional quality and resistance to all major diseases.
For this purpose a popular elite wheat cultivar PBW343 were pyramided eight QTLs /gene
for four grain quality traits (high grain weight, high grain protein content, pre-harvest
sprouting tolerance and desirable high-molecular-weight glutenin subunits) and resistance
against the three rusts. Hao et al. (2014) transferred a major QTL for oil content using
markers-assisted backcrossing into an elite hybrid to increase the oil content in maize.

33
(C) Association mapping
Association mapping which refers to significant association of a molecular marker with a
phenotypic trait is especially useful for implementing marker-assisted selection for
quantitative traits in plant breeding programs (Breseghello and Sorrells 2006b). QTL
mapping usually uses a population from a bi-parental cross, while association mapping uses a
collection of individuals often with varying ancestry. In recent years, genetic maps have been
prepared in several plant species including rice, wheat, barley, cotton, ryegrass, white clover,
raspberry, potato, sorghum, etc. Once mapped, microsatellite markers could be employed in
tagging several individual traits that are particularly important for a breeding program.
Association mapping using SSR markers has been successfully conducted in many important
crop species as: Zhao et al. (2014) studied on genetic structure, linkage disequilibrium and
association mapping of Verticillium wilt resistance in elite cotton (Gossypium hirsutum L.)
germplasm population. Xiao et al. (2013) studied the associate markers with drought
tolerance at vegetative stage and examined the pattern of LD in a diversity and stress
adaptation rice panel containing 184 rice germplasm accessions with 141 polymorphic SSR
markers that were nearly evenly distributed at 3 mb bin on the 12 rice chromosomes. Hu et al.
(2014) identified yield-enhancing QTL and conducted association mapping with 85 SSR
markers in wild soybeans accessions (Glycine soja). Laido et al. (2014) studied on linkage
disequilibrium and genome-wide association mapping in tetraploid wheat (Triticum turgidum
ssp) using 26 SSR and 970 DArT markers.
2.8 Application of molecular markers in J. curcas
Different types of molecular markers such as RAPD, ISSR, AFLP, SSR and SNPs have been
used for various molecular and genetic studies in J. curcas. The detailed survey of related
literatures on molecular marker applications in J. curcas is presented here under different
sub-heads.
2.8.1 Molecular marker based genetic diversity analysis in J. curcas
Conventional methods have shown that morphological characteristics are useful to establish
phylogenetic relationship at the generic level, but are insufficient to define genetic diversity
and relationships among accessions of J. curcas due to the strong influence of the
environment on traits like seed weight, seed protein and oil content (Medina et al. 2011). It is
therefore clear that evaluation of genetic variation is more feasible and reliable using neutral

34
molecular markers (Basha and Sujatha 2007). A number of molecular markers have been
used for the genetic diversity analysis in J. curcas as follows:
2.8.1.1 RAPD based genetic diversity analysis
The earliest report of application of RAPD markers to investigate the genetic similarity
between toxic Indian accessions and non-toxic Mexican accessions was made by Sujatha et
al. (2005). They had shown similarity index of 96.3% and developed unique fingerprints for
identifying the Indian toxic accessions and the Mexican non-toxic accessions.
Basha and Sujatha (2007) evaluated the genetic diversity among 42 J. curcas
germplasm collected from various geographic locations of India along with a non-toxic
genotype from Mexico using 400 RAPD and 100 ISSR markers and reported 64%
polymorphism.
Ranade et al. (2008) studied genetic diversity among 18 accessions of J. curcas using
RAPD and DAMD markers alongwith two other species J. gossypifolia L. and Phyllanthus
emblica L. (Family Euphorbiaceae). The UPGMA tree clearly shows the accessions collected
from NBRI, Bhubaneswar, North-East, Lalkuan and outgroup accessions are all separated
from each other. The North East accessions are most dissimilar relative to the NBRI and
Bhubaneswar accessions.
Ganesh et al. (2008) assessed genetic diversity using 26 RAPD primers with 5 J.
curcas accession from Tamil Nadu and seven Jatropha species native to India. They found
high genetic variability among the 8 species (80.2% polymorphic). The Jaccard’s coefficient
of similarity ranged from 0.00 to 0.85 which showed a high level of genetic variation among
the genotypes. The UPGMA cluster analysis indicated three distinct clusters, one comprising
all accessions of J.curcas while second included 6 species viz., J. ramanadensis, J.
gossypifolia, J. podagrica, J. tanjorensis and J. integerrima. However, J. glandulifera
remained distinct and formed third cluster indicating its higher genetic distinctness from other
species.
Kumar et al. (2009) differentiated 26 accessions of J. curcas using 55 RAPD markers.
Out of 55 primers, 26 primers produced good amplification products. The 5 primers
exhibited the highest level of variability and the percentage of polymorphic bands was 42.94
to 62.89. The polymorphic primers were selected to generate dendrogram UPGMA based for
genetic relationship among the accessions of J. curcas. Finally, it was concluded that RAPD
markers could be used for estimation of genetic relationship, which will be helpful in the
characterization of J. curcas germplasm.

35
Jubera et al. (2009) deployed 5 RAPD markers to assess the genetic diversity among 7
J. curcas (L.) genotypes. Four RAPD primers revealed polymorphism among the genotypes.
The genetic distance (%) based on Jaccard’s similarity co-efficient ranged from 81.8-100,
indicating narrow genetic variability among the genotypes based on RAPD markers.
Pamidimarri et al. (2009) characterized the toxic and non-toxic varieties at molecular
level and to develop PCR based markers for distinguishing non-toxic from toxic or vice
versa. In total 371 RAPD, 1,442 AFLP markers were analyzed and 56 (15%) RAPD, 238
(16.49%) AFLP markers were found specific to either of the varieties. Genetic similarity
between non-toxic and toxic varieties was found to be 0.92% by RAPD and 0.90% by AFLP
fingerprinting.
Ambrosi et al. (2010) analyzed 27 accessions of J. curcas from different geographic
locations in the world using flow cytometric seed screening (FCSS) and 10 RAPD markers to
study the genetic diversity and reproductive strategy. The study reiterated the fact that the
germplasm from different geographical regions had limited genetic variation with the
exception of accessions from Mexico.
Ikbal et al. (2010) assessed the genetic diversity among 40 accessions of J. curcas L.
collected from different eco-geographical regions of India using 50 RAPD primers. Cluster
analysis based on Jaccard’s similarity coefficient using UPGMA grouped all the 40
genotypes into two major groups at a similarity coefficient of 0.54. The similarity indices
ranged from 0.44 to 0.92 with an average of 0.73, indicating a moderate to high genetic
variability among the genotypes.
Subramanyam et al. (2010) analyzed the genetic diversity among 10 accessions of J.
curcas collected from different eco-climatic zones of India using 43 RAPD markers. Out of
43 primers, 10 primers were found to be polymorphic and showed reproducibility. The
average number of polymorphic bands per primers was 7.6 and the percentage of
polymorphism ranged from 41.66 to 92.30 which indicated the variable potentiality of the
primers in resolving the variation in genotypes. The visualization of genetic relatedness
among the J. curcas genotypes revealed a wider genetic base.
Rosado et al. (2010) studied diversity among 192 germplasm of J. curcas collected
from Brazil. A total of 96 RAPD primers, 48 of which were selected on previous studies that
reported primers amplifying a large number of polymorphic markers for J. curcas and 6 SSR
markers used for diversity analysis. Only 23 of the RAPD and one microsatellite were
polymorphic. Surprisingly, all the accessions were homozygous at all but one microsatellite,
in contrast with the outcrossing mating system reported for the species, suggesting that J.
curcas not only supports selfing but possibly breeds by geitonogamy.

36
Machua et al. (2011) analyzed diversity among 160 individuals of J. curcas randomly
selected from eight populations including three populations from the Coastal region (Likoni,
Kilifi and Kwale), three in South Rift (Ngurumani, Kajiado and Namanga) and two in Eastern
Kenya (Kibwezi and Kitui) using 40 RAPD primers. Only 10 RAPD produced unambiguous
polymorphic and reproducible fragments. Analysis of molecular variance (AMOVA) showed
that, more variation (53%; P=0.01) was partitioned among population while 47% (P=0.01)
variation was partitioned within the population.
Rafii et al. (2012) used 8 RAPD primers for genetic diversity analysis of 48
accessions of J. curcas collected from different locations of the Selangor, Terengganu and
Kelantan states of Malaysia. The polymorphism percentages of J. curcas accessions for
Selangor, Kelantan and Terengganu states were 80.4, 50.0, and 58.7% respectively, with an
average of 63.04%.
Khurana-Kaul et al. (2012) assessed the genetic relationship of 29 J. curcas accession
using 52 RAPD and 26 ISSR markers. Out of 52 RAPD primers, 47 showed polymorphic
banding patterns which produced 552 bands that could be scored and of which 334 were
polymorphic with an average of 7.1 polymorphic fragments per primer. The results indicated
the modest level of genetic diversity in the J. curcas accessions.
Gopale and Zunjarrao (2013) used 10 RAPD primers to evaluate the genetic diversity
in 20 accessions of J. curcas L. collected from four agro-climatic regions of Maharashtra,
India. Ten selected markers produced 125 bands, of which 94 (75.2%) were polymorphic.
Cluster analysis based on Jaccard’s similarity coefficient using UPGMA grouped all the 20
accessions in two major groups at similarity coefficient of 0.54. The similarity indices from
the 20 accessions ranged from 0.14 to 0.98 with an average of 0.63, indicating moderate to
high genetic variability among the accessions.
Kumar et al. (2013b) assessed the genetic diversity in 20 J. curcas genotypes using 10
RAPD primers. Out of 10 RAPD primers, only 6 primers showed amplification in all the 20
genotyps. A total of 47 sharp and reproducible bands were obtained, out of which 44 bands
were polymorphic resulting in 93.61% polymorphism among the genotypes. Genetic
similarity matrices of the genotypes ranged from 0.88 to 0.93, indicating a moderate genetic
variability among the genotypes.
Alves et al. (2013) assessed the genetic variability of the Brazilian physic nut
germplasm (117 accessions) using a combination of phenotypic and molecular markers
(RAPD and SSR). They reported that molecular markers did not adequately sample the
genomic regions that were relevant for phenotypic differentiation of the accessions. The
diversity varied from 0 to 1.29 among the 117 accessions, with an average dissimilarity

37
among genotypes of 0.51. Joint analysis of phenotypic and molecular diversity indicated that
the genetic diversity of the physic nut germplasm was 156% and 64% higher than the
diversity estimated from phenotypic and molecular data, respectively.
Murty et al. (2013) assessed genetic diversity using RAPD (100 primers), ISSR (11
primers) and DAMD (4 primers) markers over 15 Jatropha accession and 4 different species.
Highest polymorphism (96.67%) was recorded by RAPD followed by DAMD (91.02%) and
ISSR (90%). All the markers proved J. gossypiifolia as one of the parents of J. tanjorensis.
Dhillon et al. (2014) assessed the genetic variability in J. curcas induced by different
doses of gamma- rays using 47 RAPD primers. Molecular characterization of induced
mutants (M1 generation) with 47 RAPD primers showed 65.27% polymorphism. The
variability created by gamma rays ranged from 9 to 28%. The gamma- rays exposure changed
the patterns of RAPD in comparison with control and hence can be adopted in mutation
breeding of J. curcas.
2.8.1.2 AFLP based genetic diversity analysis
Tatikonda et al. (2009) studied genetic diversity among 48 accessions collected from
6 different states of India using 7 AFLP primer combinations. A total of 770 fragments were
produced with an average of 110 fragments per primer combination. A total of 680 (88%)
fragments showed polymorphism in the germplasm analyzed, of which 59 (8.7%) fragments
were unique (accession specific) and 108 (15.9%) fragments were rare (present in less than
10% accessions). They reported a moderate to high level of genetic variability among the
accessions surveyed and also the clustering was in accordance with the geographical
distribution.
Shen et al. (2010) studied 38 populations of J. curcas L. collected from China using 9
AFLP primer combinations. These AFLP primers generated a total of 246 fragments and of
which 72 (26.99%) were polymorphic. The Jaccard’s similarity coefficient showed a high
similarity range from 0.866 to 0.977, suggesting a low genetic diversity among the 38
populations.
Santos et al. (2010) studied genetic relationship between 12 accessions of J. curcas
using 17 AFLP primer combinations which generated 164 bands. An UPGMA dendrogram
constructed, based on genetic distances estimated by Jaccard’s similarity coefficient showed a
cophenetic value of 0.91. Groups of plants were observed in 6 of the 12 accessions studied
with similarity of over 30%, indicating high genetic variability. The variation among
accessions was estimated to be 0.275, also indicating high variability.

38
Pecina-Quintero et al. (2011) used 6 AFLP primer pairs for genetic diversity analysis
in 88 accessions of J. curcas collected from the state of Chiapas, Mexico and reported 79% of
the genetic variation within the populations, 16% among populations within regions and 5%
among regions. The AFLP analysis detected high levels of polymorphism (90%) among 88
accessions of J. curcas from the state of Chiapas, Mexico and allowed for discrimination
between accessions.
Ovando-Medina et al. (2011) assessed genetic diversity using AFLP primers in 134
genotypes of J. curcas collected from Chiapas, Mexico. Out of 209 AFLP markers, 152
useful markers were obtained for diversity analysis. The polymorphism rates were found to
range between 71.7% and 92.1%, while the average polymorphism was 81.1%, the effective
number of alleles (Ne) was between 1.181 and 1.398 with an average of 1.303, the Shannon
diversity index (I) ranged from 0.202 to 0.378, the average was 0.306, the genetic diversity of
Nei (He) ranged from 0.121 to 0.245 with an average of 0.192. These results revealed high
genetic diversity in the population studied.
Shen et al. (2012) characterized the genetic variation among 63 populations of J.
curcas from 10 countries in Asia, Africa and Mexico grown in the provenance trials in China
and Vietnam using AFLP markers. Four primer combinations were used to generate a total of
89 bands of which 87 were polymorphic. The total genetic diversity (Ht) was low (0.15) and
genetic diversity within populations (Hs) was 0.07. AMOVA indicated that 69% of the total
variation corresponded to variation within populations and 31% to variation among
populations. The polymorphic loci (Np=16), the percentage of polymorphic loci (Pp=18%),
Nei’s diversity index (H=0.07) and Shannon’s information index (I=0.10) all indicated low
genetic diversity among populations.
Mastan et al. (2012) assessed genetic diversity in 15 selected germplasm of J. curcas
using 180 RAPD, 21 AFLP primer combinations and 19 SSR markers. The percentage
polymorphism among the selected germplasm using RAPD, AFLP and SSR was found to be
56.43, 57.9 and 36.84, respectively. The variation of diversity among the germplasm using 3
markers in the present study may be due to the codominant nature of SSR and dominant
nature of RAPD and AFLP markers. As the AFLP provides more amplified fragments than
RAPD followed by SSRs, it shows highest polymorphism when compared with other.
Sinha and Tripathi (2013) used 4 AFLP primer combinations for genetic diversity
study in 6 Jatropha species namely J. curcas, J. integerrima, J. gossypifolia, J. glandulifera,
J. Podagrica and J. dioca. Four AFLP primer combinations produced a total of 178
fragments with an average of 44.5 fragments per primer combination. A total of 167
(93.80%) fragments showed polymorphism in the germplasm analyzed. The UPGMA cluster

39
analysis revealed the level of similarity among 6 Jatropha species and maximum similarity
was observed between J. curcas and J. dioca which was 59%, J. integerrima (53%) was
found next to it in similarity matrix generated. J. glandulifera showed highest dissimilarity
with other Jatropha species.
Osorio et al. (2014) assessed the genetic variation of 182 J. curcas accessions
collected from Central America (47 accessions), South America (9 accessions), Africa (35
accessions) and Asia (91 accessions) with 29 SSR, 13 TRAP and 20 AFLP primers. Out of 29
SSR, 13 TRAP, 20 AFLP, 14, 13 and 2 markers yielding polymorphic patterns respectively.
The Jaccard’s similarity, cluster analysis by UPGMA and PCA (principle component
analysis) indicated higher variability in Central America accessions compared to Asian,
African and South America accessions.
Pamidimarri and Reddy (2014) assessed the genetic diversity among 63 germplasm
collected from India, Madagascar Spain, Mexico, Cape Verde using RAPD, AFLP and
nrDNA-ITS. Using 18 combinations of AFLP selective primers, 911 markers were generated,
out of which 667 markers were resulted to be polymorphic. A total of 180 RAPD primers
were screened and 52 primers responded with more than 6 bands were considered to study
the genetic polymorphism. The germplasm of J. curcas taken for RAPD and AFLP analysis
were also used for nrDNA-ITS sequence analysis. The study was focused to understand the
molecular diversity at reported probable center of origin (Mexico) and to reveal the dispersal
route to other regions. They found that the overall genetic diversity of J. curcas was narrow
and the highest genetic diversity was observed in the germplasm collected from Mexico.
Least genetic diversity found in the Indian germplasm and clustering results revealed that the
species was introduced simultaneously by two distinct germplasm and subsequently
distributed in different parts of India.
2.8.1.3 ISSR based genetic diversity analysis
He et al. (2007) assessed genetic diversity of 9 populations from 5 provinces of China
using 10 ISSR markers. All the primers generated highly reproducible and stable DNA
fragments. The polymorphic loci (PPB=97.04%) and POPGENE analysis result (H=0.2357,
I=0.3760) suggested a high level of genetic variation of J. curcas among the different
populations.
Vijayanand et al. (2009) assessed genetic diversity of among 12 Jatropha accessions
collected from different geographical areas of India using 19 morphological traits and 21
ISSR primers. Five accessions of J. curcas were collected from Coimbatore (Tamil Nadu), 6
40
Jatropha species i.e. J. ramanadensis, J. villosa, J. glandulifera, J. gossypifolia, J. podagrica,
J. tanjorensis were collected from Tamil Nadu and one species J. integerrima was collected
from Andhra Pradesh. The twenty-one ISSR primers generated 156 polymorphic alleles with
an average 7.47 per primer. Maximum diversity was noticed between J. villosa and J.
integerrima.
Cai et al. (2010) collected a set of 224 accessions including 219 from all the
adaptation areas in China and 5 from Myanmar to assess genetic diversity using 100 ISSR
primers. Out of 100 ISSR primers, 15, that had good reproducibility were selected to
genotype the population. Among the 169 amplified bands, 127 (75.15%) were polymorphic
which showed that Chinese Jatropha had high genetic diversity.
Grativol et al. (2011) assessed genetic diversity in 332 accessions of J. curcas
collected from eight states of Brazil using 7 ISSR primers. Seven ISSR primers amplified 104
loci with a total of 21,253 bands in all accessions, of which 19,472 bands (91%) showed
polymorphism. Polymorphic information content (PIC), marker index (MI) and resolving
power (RP) averaged 0.26, 17.86 and 19.87 per primers, respectively, showing the high
efficiency and reliability of the markers used. The UPGMA-phenogram and
multidimensional scaling MDS showed that Brazilian accessions are closely related but have
a higher level of genetic diversity than accessions from other countries.
Tanya et al. (2011) studied 39 Jatropha plants that included 30 accessions of J. curcas
from China, Mexico, Thailand and Vietnam, two J. gossypifolia (Bellyache bush), two J.
integerrima (Spicy Jatropha), J. podagrica (Bottle plant shrub) and 3 R. communis (castor
bean) using 86 ISSR markers. Genetic relationships were evaluated using 27 of 86 ISSR
markers, yielding 307 polymorphic bands with polymorphism contents ranging from 0.76 to
0.95. Dice’s genetic similarity coefficient ranged from 0.39 to 0.99, which clearly separated
the plant sample into seven groups at the coefficient of 0.48. The first group comprised
J.curcas from Mexico, the second group comprised J. curcas from China and Vietnam, the
third group comprised J. curcas from Thailand, the fourth group was J. integerrima, the fifth
group was J. gossypifolia, the sixth group was J. podagrica and the last and most distinct
group was Ricinus communis.
Sunil et al. (2011) assessed the genetic diversity in 34 accessions of J. curcas
collected from the diverse geographical regions of India using 56 RAPD and 40 ISSR
markers. All the tested RAPD primers amplified across the 34 genotypes. The total number of
polymorphic markers was 543 with a mean of 9.69 per primer and the percentage of
polymorphism was 87.3. The 40 ISSR primers produced a total of 494 scorable markers
among the genotypes. The total number of polymorphic markers and the percentage of

41
polymorphism were 325 and 68.5, respectively. The dendrogram based on both marker
systems separated the genotypes into 7 clusters, with similarity coefficient ranging from 0.50
to 0.92. The molecular markers (RAPD and ISSR) yielded 868 polymorphic markers that
discriminate the 34 genotypes into 7 and 8 clusters, respectively.
Arolu et al. (2012) characterized 48 accessions of J. curcas L. collected from 3 states
(Kelantan, Selangor and Terengganu) in Peninsular Malaysia using 10 ISSR markers. The 48
J. curcas accessions were grouped into 3 different populations based on state from where
they were collected. The percentage of polymorphism in these 3 populations ranged from
90.75% (Terengganu) to 100% (Kelantan). Analysis of molecular variance (AMOVA)
showed that 94% of the total variation was observed within the populations while variation
among the populations accounted for the remaining 6%.
Camellia et al. (2012) assessed the genetic diversity in the 16 accessions of J. curcas
and Ricinus sp. of Malaysia using 8 ISSR primers. From the 8 ISSR primers used, the number
of amplicons per primers varied from 2 to 14 and amplicons size from 151 bp to 2779 bp.
From the total of 63 bands, 25 (40%) were polymorphic with an average of 4.16 polymorphic
bands per primer. Jaccard’s coefficient of similarity varied from 0.72 to 1, indicating low
level of genetic variation among the genotypes.
Biabani et al. (2013) studied genetic diversity on 114 accessions of Jatropha collected
from 6 populations from 4 countries (Malaysia, Philippines, India and Indonesia) using 35
ISSR primers. Ten ISSR primer combinations were generated a total of 143 polymorphic
fragments varied from 4 to 27. The percentage of polymorphic bands for the Indonesia1,
Indonesia2, Malaysia1, Malaysia2, Philippines and India, Jatropha populations were 54.6,
59.4, 46.2, 53.2, 60.8 and 56.4%, respectively with an average of 55.1%. An UPGMA
dendrogram was constructed and the Jatropha populations were grouped into four major
clusters at a coefficient level of 0.28. The genetic similarities between the populations ranged
from 0.31% to 0.25%.
Alkimim et al. (2013) assessed the genetic diversity among the 46 accessions of
Jatropha from Brazil using 69 RAPD and 37 ISSR markers. The genetic distance between
accessions ranged from 0.13 to 0.76, with an average genetic distance of 0.21. A
dendrogram generated by UPGMA presented that only two phylogenetic groups, one of
which contained only 3 individuals, the remaining group included 95.6% of the analyzed
genotypes which showed low genetic diversity.

42
2.8.1.4 SSR based genetic diversity analysis
Wen et al. (2010) selected 419 EST-SSR and 182 genomic SSRs that had been
developed for the Manihot esculenta (Cassava) to investigate the transferability to J. curcas.
In total, 187, out of 419 EST-SSR and 54 out of 182 genomic SSR from Cassava were found
polymorphic among the 5 J. curcas accessions. Thirty-six EST-SSRs and 20 genomic SSRs
were chosen to analyze the genetic diversity of 45 accessions of J. curcas and reported a
total of 216 alleles and 183 (84.72%) of them were polymorphic. On the basis of the
distribution of these polymorphic alleles, the 45 accessions were classified into 6 groups.
The estimated mean genetic diversity index was 0.55 showing that J. curcas germplasm
collection has high level of genetic diversity.
Na-ek et al. (2011) assessed genetic diversity of 32 J. curcas accessions, including 6
from Thailand, 9 non-toxic accessions from Mexico, 12 gamma radiation-treated seeds from
Mukdahan province and 1 accession each from Myanmar, Cambodia, India, Laos and China
using 10 SSR markers. Low level of average genetic diversity were observed (He=0.160).
The analysis of molecular variance (AMOVA) showed higher variability (63.753%) among
groups than within groups (36.247%).
Yadav et al. (2011) deployed 50 EST-SSRs over 25 J.curcas accessions collected
from different geographical regions of India for genetic diversity analysis. Out of 50 EST-
SSR markers 21 SSR markers were polymorphic and used to determine genetic relationships
among 25 J. curcas accessions collected from different geographical regions of India.
Twenty-one SSR markers were polymorphic and with allele variation from two to four. The
Polymorphic information content (PIC) value ranged between 0.04 to 0.61 with an average
of 0.25±0.16, indicating low to moderate level of informativeness within these EST-SSRs.
Sato et al. (2011) carried out genome sequencing of J. curcas and identified large
number of SSRs. They selected 100 genome-derived microsatellites and assessed genetic
diversity analysis with 12 Jatropha accessions collected from the various parts of the world.
A total of 88 markers generated specific amplicons, whereas the other 8 and 4 markers
showed no amplification and non-specific amplification, respectively. The number of alleles
per locus ranged from 1 to 4 with a mean value of 1.31. The large number of markers
detecting no polymorphism and the low mean value of PIC (0 to 0.45) indicated that genetic
diversity in Jatropha lines is generally narrow.
Bressan et al. (2012) developed 40 SSR and validated in 41 accessions of J. curcas
collected from 6 populations from Brazil, Mexico and Colombia. Nine loci were polymorphic
revealing from 2 to 8 alleles per locus and 6 primers were able to amplify alleles in the

43
congeners J. podagrica, J. pohliana and J. gossypifolia. The primers developed that revealed
polymorphic loci are suitable for genetic diversity and structure, mating system and gene
flow studies in J. curcas and some congeners.
Ricci et al. (2012) collected 64 Jatropha germplasm from 7 geographical locations on
2 continents and analyzed with 32 SSRs and two candidate gene-specific primers (ISPJ-1
gene and Curcin-P2 gene promoter). In general, markers were found to be highly conserved
and many (40%) were monomorphic. The polymorphic information content of the
polymorphic markers ranged from 0.03 to 0.47. The genetic similarity analysis identified 2
distinct groups at 0.73 DICE similarity coefficient. Group I included germplasm collected
from the islands of Cuba and Cape Verde and group II consisted of Brazil, Mozambique and
Senegal populations. They developed several population-specific microsatellite markers
(JC03, JC05 and JC09) and a single base substitution at Jcps9 locus that clearly separated the
island and mainland populations.
Vischi et al. (2013) studied genetic diversity between 29 toxic and non-toxic
accessions of Jatropha collected from America (North, central, South) and Mexico using 40
SSR markers. The genetic study pointed out a high degree of similarity both within and
among the non- Mexican accessions. The Mexican accessions proved to be non-toxic and
genetically differentiated forming a well separated cluster from out of Mexico accessions.
Yue et al. (2013) assessed genetic variation using 29 microsatellites located on 11
linkage groups in 276 accessions of J. curcas collected from 9 locations in 5 countries in
South- America, Asia and Africa. They did not detect any genetic diversity at all 29
microsatellites loci. All the 276 accessions were homozygous at all loci and shared the same
genotype at each locus, suggesting no microsatellite variation in the genome of Jatropha
curcas.
Kumari et al. (2013) used 32 EST-SSR markers to analyze the genetic diversity
among 42 accessions collected from different parts of India. Out of 32 EST-SSR primers, 24
primer pairs exhibited polymorphism among the genotypes with varying amplicons from 1 to
8 with an average of 2.33 alleles per polymorphic marker. The polymorphic information
content value ranged from 0.02 to 0.5 with an average of 0.402 indicating moderate level of
informativeness within these EST-SSR markers.
Jain et al. (2014) developed in silico microsatellites (SSR) using J. curcas ESTs from
various tissues viz. embryo, root, leaf and seed available in the public domain of NCBI to
assess genetic diversity and identification of markers for the selection of high oil yielding
clones in Jatropha. A total of 13,513 ESTs were downloaded and from these ESTs, 7552
44
unigenes were obtained and 395 SSRs were generated from 377 SSR-ESTs. In this study they
reported low level of polymorphism in Jatropha.
Ouattara et al. (2014) assessed genetic diversity of 103 accessions including 82
accessions from different agro- ecological zones in Senegal and 21 exotic accessions through
33 microsatellite markers. They found low level of genetic variation because introduction of
J. curcas in Senegal seems to have been done from or few origins and the species have not
retained genetic diversity since then, due to vegetative propagation.
2.8.1.5 SNP based genetic diversity analysis
Gupta et al. (2012a) discovered 2,482 informative single nucleotide polymorphisms
(SNPs) and did genotyping of selected SNPs among 148 accessions of J. curcas for diversity
analysis. The 148 genotypes of J. curcas were collected from different crop-growing regions
of India, North America, South America and Africa. The diversity analysis revealed that a
narrow level of genetic diversity existed among the indigenous genotypes as compared to the
exotic genotypes of J. curcas.
Montes et al. (2014) assessed the genetic structure and diversity in Jatropha
germplasm with 54 SSR and 120 SNP markers in a diverse, worldwide, germplasm panel of
70 accessions. They reported a high level of homozygosis in the germplasm that does not
correspond to the purely out-crossing mating system assumed to be present in Jatropha. They
hypothesize that the prevalent mating system of Jatropha comprise a high level of self-
fertilization and that the outcrossing rate is low. Genetic diversity in accessions from Central
America and Mexico was higher than in accession from Africa, Asia, and South America.
They also identified markers associated with the presence of phorbol esters.
2.8.2 Linkage and QTL mapping in J. curcas
Wang et al. (2011) have constructed first generation linkage map of J. curcas with
216 SSRs and 290 SNPs using backcross mapping population derived from J. curcas and J.
integerrima. They established first generation linkage map using a mapping panel containing
two backcross populations with 93 progeny and mapped 506 markers (216 SSR and 290 SNP
from ESTs) onto 11 linkage groups. The total length of the map was 1440.9 cM with an
average markers space of 2.8 cM.
Liu et al. (2011) identified 18 QTL underlying the oil traits and 3 eQTLs of the
oleosin genes using backcrossing population (286) derived from crosses with J. curcas and J.
integerrima through SNP markers. The QTLs and eQTLs, especially qC18:1-1, qOil-4 and

45
qOlelll-5 with contribution rates (R2) higher than 10%, controlling oleic acid, total oil content
and oleosin gene expression respectively.
Sun et al. (2012) developed linkage map and reported QTLs association with growth
and seed in J. curcas using 105 SSR markers on 11 linkage groups. They identified a total pf
28 QTL for 11 growth and seed traits using a population of 296 back crossing Jatropha trees.
Two QTLs qTSW-5 and qTSW-7 controlling seed yield were mapped on LGs 5 and 7
respectively. These two QTL clusters were critical with pleotropic roles in regulating plant
growth and seed yield.
King et al. (2013) developed linkage map from 4 F2 mapping population of J. curcas
that reveals a locus controlling the biosynthesis of phorbol esters which cause seed toxicity
and restricted for animal feed. The consensus linkage map contains 502 co-dominant
markers, distributed over 11 linkage groups, with a mean markers density of 1.8 cM per
unique locus. They observed segregation ratio of 3:1 within seeds collected from F2 plants
and QTL analysis revealed that a locus on linkage group 8 was responsible for phorbol ester
biosynthesis. The identification of the locus responsible for PE biosynthesis will be useful to
develop new non-toxic varieties.
2.8.3 Morphological traits based variability and genetic diversity analysis
Characterization of genetic material based on morphometric traits is an important step
towards the genetic improvement of J. curcas. Such studies help in assessment of the genetic
variability, identification of diverse parental line, interrogation of desirable trait etc. Some
preliminary genetic diversity studies based on quantitative traits are summarized as under:
Ginwal et al. (2005) reported preliminary quantitative genetic variations in seed
morphology, germination and seedling growth among 10 accessions collected from Madhya
Pradesh, India. The phenotypic and genotypic variance, their coefficient of variability and
broad sense heritability also showed a sizeable variability. The high percentage of heritability
coupled with moderate intensity of genetic gain was reported for seed germination traits,
which signifies that germination is under strong genetic control and good amount of heritable
additive genetic component can be exploited for improvement of Jatropha.
Kaushik et al. (2007) evaluated 24 accessions of J. curcas collected from different
agro-climatic zones of Haryana, India for seed oil content variations and divergence. They
found that the phenotypic coefficient of variation was higher than the genotypic coefficient of
variation indicating the predominant role of environment. High heritability and genetic gain

46
were recorded for oil content (99% and 18.90%) and seed weight (96% and 18%),
respectively, indicating the additive gene action for these traits.
Rao et al. (2008) collected 32 wild accessions of J. curcas from Andhra Pradesh,
India and evaluated for genetic association, variability and diversity in seed traits, growth,
reproductive and yield traits. Broad sense heritability was high in general and exceeded 80%
for all the seed traits studied.
Sunil et al. (2009) studied on J. curcas for its distribution and diversity in South-East
coastal zone of India using DIVA-GIS. The analysis for richness using rarefaction method of
DIVA-GIS showed that Ranga Reddy district of Andhra Pradesh is the potential area for
germplasm with high oil content. The study revealed that diverse germplasm accessions of J.
curcas are distributed all over the South-East coastal zone and enabled them to find out gaps
in collection and diversity richness.
Das et al. (2010) collected 16 Jatropha genotypes from four different regions of India
and evaluated for 12 morphological characters. The genotypes showed significant differences
in most of the component traits and seed yield, primary branches/plant, fruits/branch and
seed/fruit. The phenotypic coefficient of variation (PCV) and genotypic coefficient of
variation (GCV) estimates were high for seed yield/plant followed by flowering
bunches/plant, fruits/plant and secondary branches/plant. Heritability was high (>80%) for
plant height, fruits/plant and 100 seed weight. Genetic advance (GA) was high (>50%) for
seed yield/plant, fruits/plant and flowering bunches/plant. Moderate to high heritability
accompanied with high genetic advance for seed yield/plant, fruits/plant and flowering
bunches/plant indicated additive gene action and selection for these characters would be
effective.
Mohapatra and Panda (2010) studied variability on growth, phenology and seed
characteristics among 20 randomly selected J. curcas collected from different agro-climatic
zones of India in a progeny trial under tropical monsoon climatic conditions of Bhubaneswar,
India. The correlation studies revealed that length and number of branches were positively
correlated with number of inflorescence and number of fruits per plant. A positive correlation
were observed between fruit diameter and oil content and also, between seed length and test
weight. On the basis of non-hierarchial Euclidian cluster analysis, 20 accessions were
grouped into 6 clusters. The maximum inter-cluster distance (7.195) between cluster III and
VI followed by cluster III and IV (7.074) indicates wider genetic diversity between the trees
in these groups.
Ghosh and Singh (2011) assessed the variation in seed and seedling characters of J.
curcas collected from 6 zones (geographical regions) within India and 4-6 provenances

47
within each zone. They found significant variation among zones and among different
provenances within zones, for all traits of seed and seedlings of J. curcas. This study has
implications for identifying potential seed sources of J. curcas for exploiting for higher oil
content.
Zapico et al. (2011) assessed intraspecific variation/interrelationships and to
determine the association of geographical distribution and phenotypic diversity in the J.
curcas accessions. Ex situ morphological characterization of 13 J. curcas genotype from
various sources was undertaken using 21 quantitative traits. The PCA analysis reduced the
collected data to 5 principal components that cumulatively explained 88.81% of total
variance. The 2 clustering mechanism, UPGMA and UPGMC, divided the provenances into
two major groups and revealed the divergence of Tubao- Philbio from the provenances.
Gairola et al. (2011) assessed the variability in seed characteristics of J. curcas L.
from hill region of Uttarakhand, India. They found significant differences among the seed
sources for all the parameters studied. The fruit weight ranged from 2.21 to 3.41g, seed
weight from 0.58 to 0.81g, seed length from 1.49 to 1.81 cm, seed circumference from 2.97
to 3.51 cm, seed moisture content from 6.20 to 10.44% and seed germination from 53.33 to
79.83%. In case of genetic component analysis, heritability value was found high for seed
germination percentage (85.34%) coupled with moderate genetic gain which signifies that
seed germination is under genetic control and can be used for improvement of this species.
Shabanimofrad et al. (2011) collected 59 accessions of J. curcas from different
locations of Selangor, Kelantan and Terengganu states of Malaysia to assess the genetic
diversity using multivariate analysis and DIVA-geographical information system (GIS). The
6 quantitative characters- seed length, seed width, fruit length, fruit width, 100 seed weight
and oil content were recorded. Based on 6 quantitative characters, 59 accessions were
grouped into 3 clusters at a coefficient level of 3.7.
Biabani et al. (2012) assessed phenotypic and genotypic variation of Jatropha
population from Malaysia, India, Indonesia and the Philippines to select superior plants with
high seed and oil yields production for commercial planting and to study inter-populations
variation in morphological, seed and oil yield characteristics. Highly significant genotypic
differences were obtained among the Jatropha populations for various traits measured.
Wani et al. (2012b) evaluated genetic variability for morphological and qualitative
attributes among 7 J. curcas L. accessions grown under subtropical conditions of North India.
The seed yield/plant had a positive and significant correlation with number of branches/plant,
oil yield, plant spread (r=0.806, 0.802, 0.782), plant spread had a highest correlation with

48
plant height (r= 0.840). The oil content varied from 24.5% to 37.9%. The evaluation will be
helpful to identify cultivar with specific yield and vegetative growth features.
Ouattara et al. (2013) assessed distribution and variability in seed traits of J. curcas in
Senegal collected from different agro-ecological zones of the country. Among the seed traits
studied, 100 seed weight ranged from 63.68 to 77.83 g and seed length from 17.89 to 19.15
mm. Variability in seed traits was not linked to the geographical location.
Singh et al. (2013b) assessed genetic association, divergence and variability in 24
accessions of J. curcas for seed and oil yield and its contributing traits. Based on genetic
divergence D2 statistics, 24 accessions were grouped into 14 clusters. Phenotypic variances
were higher than genotypic variances for all characters. The results showing significant and
positive correlation with seed and oil content can be used for genetic improvement of seed
and oil yield.
Guan et al. (2013) studied the characterization of the seed morphology and genetic
diversity of J. curcas L. from 8 different provenances for providing support for the breeding
and allocation of seed. For the morphological characterization 5 traits were investigated,
including 100 seed weight, seed length, width, lateral diameter, seed length and width ratio.
The genetic diversity of 8 populations from different provenances was assessed using five
DALP primers. The 5 DALP primers generated a reproducible DNA fragment that is 219 of
244 loci and were polymorphic, i.e. PPB was 89.75%. The result showed that seed
morphology had significant variation among location and the 8 populations had high level of
genetic diversity and show apparent genetic differentiation.
Brasileiro et al. (2013) estimated genetic parameters, selection gain and genetic
diversity in physic nut of 20 half-sib progeny of 17 families obtained from the experimental
station of Empresa Baiana de desenvolvimento Agricol (EBDA), Brazil. In the analysis of
genetic diversity, genotypes were divided into 4 groups. The genotypes 18, 18, 20 and 8
clustered together and presented the highest means for the vegetative characters and
production and the lower means were observed in 17, 12, 13 and 9 genotypes from the same
group.

Chapter 3 Materials and Methods
49
3.1 Materials
3.1.1 Plant materials for SSR enriched libraries preparation and polymorphism
detection
The J. curcas accession NBJC132 was used to extract genomic DNA for the preparation of
SSR enriched libraries. The plant materials used to identify polymorphic SSRs include 7
accessions of J. curcas i.e. NBJC132, NBJC139, NBJC147, NBJC148, NBJC161, NBJC183,
NBJC195 (Table 3.1). In addition, one accession of J. integerimma was also included in the
screening panel. The first 5 accessions of J. curcas i.e. NBJC132, NBJC139, NBJC147,
NBJC148, NBJC161 were collected from different eco-geographical and agro-climatic zones
of India. These accessions were reported to be elite and diverse accessions of J. curcas from
India. The rest two accessions i.e. NBJC183 and NBJC195 were exotic collection and
procured from South Africa and Mexico respectively. The Mexican accession (NBJC195)
was reported to be comparatively more diverse and non toxic as it contains low level of
phorbol esters as compared to other accessions of J. curcas (Makkar et al. 1998, Basha et al.
2009). The accession of J. integerrima was collected from germplasm repository of Botanical
garden of CSIR-NBRI.
3.1.2 Plant material for SSR based genetic diversity analysis
The plant materials used to assess the magnitude of genetic diversity in the present
investigation include 96 accessions of J. curcas which comprise of 70 indigenous collections
from different states of India and 26 exotic collections. The details of these accessions are
presented in Table 3.1. The exotic collections include 3 non-toxic accessions from Mexico
(NBJC194, NBJC195 and NBJC196). These non-toxic accessions were reported to have low
level of phorbol esters (Makkar et al. 1998, Basha et al. 2009).

50
Table 3.1 Details of accessions of J. curcas used in microsatellite characterization and
diversity analysis
Sl.
No. Code* Collection site States/country
Toxicity Latitude Longitude
1 NBJC101 Udaipur Rajasthan, India Toxic 27° 42' N 75° 33' E
2 NBJC102 Chittorgarh Rajasthan, India Toxic 24° 54' N 74° 42' E
3 NBJC103 Dungarpur Rajasthan, India Toxic 23° 50' N 73° 50' E
4 NBJC104 Sirohi Rajasthan, India Toxic 24° 88' N 72° 87’ E
5 NBJC105 Nainital Uttaranchal, India Toxic 29º 23' N 79º 30' E
6 NBJC106 Pithoragarh Uttaranchal, India Toxic 29° 34' N 80° 13' E
7 NBJC107 Tehri Uttaranchal, India Toxic 30º 20' N 78º 53' E
8 NBJC108 Dehradun Uttaranchal, India Toxic 30º 19' N 78º 04' E
9 NBJC109 Ranchi Jharkhand, India Toxic 23º 23' N 85º 23' E
10 NBJC110 Latehar Jharkhand, India Toxic 23º 76' N 84º 6' E
11 NBJC111 Plamau Jharkhand, India Toxic 23º 52' N 84º 17' E
12 NBJC112 Garhwa Jharkhand, India Toxic 24º 10' N 83º 52' E
13 NBJC113 Begusarai Bihar, India Toxic 23º 75' N 84º 5' E
14 NBJC114 Patna Bihar, India Toxic 25º 37' N 85º 13'E
15 NBJC115 Bihar Sharif Bihar, India Toxic 25 º 11' N 85 º 31' E
16 NBJC116 Nawada Bihar, India Toxic 24º 53' N 85º 35' E
17 NBJC117 Raigarh Chhatisgarh, India Toxic 21º 9' N 83º 4' E
18 NBJC118 Bilashpur Chhatisgarh, India Toxic 22º 05' N 82º 13' E
19 NBJC119 Korba Chhatisgarh, India Toxic 22 º 20' N 82 º 42' E
20 NBJC120 Ambikapur Chhatisgarh, India Toxic 23º 10' N 83º 15' E
21 NBJC121 Kangra Himachal Pradesh, India Toxic 32° 05' E 76° 18' E
22 NBJC122 Hamirpur Himachal Pradesh, India Toxic 31° 68' E 76° 52' E
23 NBJC123 Mandi Himachal Pradesh, India Toxic 31° 43' N 76° 58' E
24 NBJC124 Shimla Himachal Pradesh, India Toxic 31° 06' N 77° 13' E
25 NBJC125 Yamunanagar Haryana, India Toxic 30° 6' N 77° 17' E
26 NBJC126 Hisar Haryana, India Toxic 29° 10' N 75° 46' E
27 NBJC127 Gurgaon Haryana, India Toxic 28° 37' N 77° 04' E
28 NBJC128 Yamunanagar Haryana, India Toxic 30° 6' N 77° 16' E
29 NBJC129 Allahabad Uttar Pradesh, India Toxic 25° 28' N 81° 54' E
30 NBJC130 Gorakhpur Uttar Pradesh, India Toxic 26° 45' N 83° 24' E
31 NBJC131 Mahoba Uttar Pradesh, India Toxic 25° 18' N 79° 55' E
32 NBJC132* Lucknow Uttar Pradesh, India Toxic 26° 55' N 80° 59' E
33 NBJC133 Dhar Madhya Pradesh, India Toxic 22° 35' N 75° 20' E

51
34 NBJC134 Indore Madhya Pradesh, India Toxic 22° 44' N 75° 50' E
35 NBJC135 Ujjain Madhya Pradesh, India Toxic 23° 09' N 75° 43' E
36 NBJC136 Satna Madhya Pradesh, India Toxic 24° 34' N 80° 55' E
37 NBJC137 Rangareddy Andhra Pradesh, India Toxic 17°23' N 77°50' E
38 NBJC138 Vishakhpatnam Andhra Pradesh, India Toxic 17 °42' N 83° 15' E
39 NBJC139* Rangareddy Andhra Pradesh, India Toxic 17°23' N 77°50' E
40 NBJC140 Mahboobnagar Andhra Pradesh, India Toxic 16°46' N 77° 56' E
41 NBJC141 Hoshiarpur Punjab, India Toxic 31° 32' N 75° 57' E
42 NBJC142 Gurdaspur Punjab, India Toxic 32° 03' N 75° 27' E
43 NBJC143 Gurdaspur Punjab, India Toxic 32° 03' N 75° 27' E
44 NBJC144 Bankura West Bengal, India Toxic 23° 24' N 87°07' E
45 NBJC145 Midnapur West Bengal, India Toxic 22° 33' N 87° 15' E
46 NBJC146 Purulia West Bengal, India Toxic 23° 34' N 86° 36' E
47 NBJC147* Bhavnagar Gujarat, India Toxic 21° 46' N 72° 11' E
48 NBJC148* Banaskantha Gujarat, India Toxic 24° 17' N 72°43'E
49 NBJC149 Panchmahal Gujarat, India Toxic 23°23'N 74°75'E
50 NBJC150 Junagarh Gujarat, India Toxic 21° 31' N 70° 36' E
51 NBJC151 Pulbhani Orissa, India Toxic 19° 08' N 76° 5' E
52 NBJC152 Ganjam Orissa, India Toxic 19° 22' N 85° 06' E
53 NBJC153 Balasur Orissa, India Toxic 23° 51' N 90° 21' E
54 NBJC154 Bhubaneswar Orissa, India Toxic 20° 15' N 85° 52' E
55 NBJC155 Golaghat Assam, India Toxic 26° 31'N 93° 58'E
56 NBJC156 Sonitpur Assam, India Toxic 26° 69'N 92° 33'E
57 NBJC157 Karbi angling Assam, India Toxic 26°11'N 93°34'E
58 NBJC158 Lakhimpur Assam, India Toxic 27 °14'N 94°15'E
59 NBJC159 Papumpare Arunachal Pradesh, India Toxic 27°10'N 93°42'E
60 NBJC160 Dibong Valley Arunachal Pradesh, India Toxic 28°25'N 95°52'E
61 NBJC161* Mon Nagaland, India Toxic 26 °75' N 95°1' E
62 NBJC162 Mokokchung Nagaland, India Toxic 26 °33' N 94°51' E
63 NBJC163 - Karnataka, India Toxic - -
64 NBJC164 - Karnataka, India Toxic - -
65 NBJC165 West Tripura Tripura, India Toxic 23° 49'N. 91° 27'E.
66 NBJC166 West Garo hills Meghalaya, India Toxic
67 NBJC167 Coimbatore Tamil Nadu, India Toxic 11° 00' N 77° 00' E
68 NBJC168 Coimbatore Tamil Nadu, India Toxic 11° 00' N 77° 00' E
69 NBJC169 Imphal Manipur, India Toxic 24° 44' N 93° 58' E
70 NBJC170 Palakkad Kerala, India Toxic 10° 78' N 76° 65' E

52
71 NBJC171 - Eastern China Toxic - -
72 NBJC172 - Southern Asia Toxic - -
73 NBJC173 Ghana Western Africa Toxic 8.00°N 1.07°W
74 NBJC174 Mozambique Eastern Africa Toxic 18.69°S 35.55°E
75 NBJC175 Brazil South America Toxic 8.46°S 51.33°W
76 NBJC176 Lola South America Toxic - -
77 NBJC177 Brazil South America Toxic 8.46°S 51.33°W
78 NBJC178 Brazil South America Toxic 8.46°S 51.33°W
79 NBJC179 Brazil South America Toxic 8.46°S 51.33°W
80 NBJC180 Brazil South America Toxic 8.46°S 51.33°W
81 NBJC181 Suriname South America Toxic 3.89°N 56.01°W
82 NBJC182 Mexico Central America Toxic 23.68°N 102.01°W
83 NBJC183* Senegal Western Africa Toxic 14.47°N 14.52°W
84 NBJC184 Guinea Eq Middle Africa Toxic 9.94°N 11.33°W
85 NBJC185 Togo Western Africa Toxic 8.57°N 0.82°E
86 NBJC186 Togo Western Africa Toxic 8.57°N 0.82°E
87 NBJC187 Ghana Western Africa Toxic 8.00°N 1.07°W
88 NBJC188 Madagascar Eastern Africa Toxic 18.92°S 46.44°E
89 NBJC189 Tanzania Eastern Africa Toxic 6.41°S 34.92°E
90 NBJC190 Zimbabwe Eastern Africa Toxic 18.92°S 29.15°E
91 NBJC191 Cameroon Middle Africa Toxic 8.70°N 11.25°E
92 NBJC192 Cambodia Southe-Estern Asia Toxic 13.7°N 104.94°E
93 NBJC193 Indonesia South-Eastern Asia Toxic 2.77°S 118.16°E
94 NBJC194 Mexico Central America Non-toxic 23.68°N 102.01°W
95 NBJC195* Mexico Central America Non-toxic 23.68°N 102.01°W
96 NBJC196 Mexico Central America Non-toxic 23.68°N 102.01°W
*Accessions of 7 DNA panel used for polymorphism detection
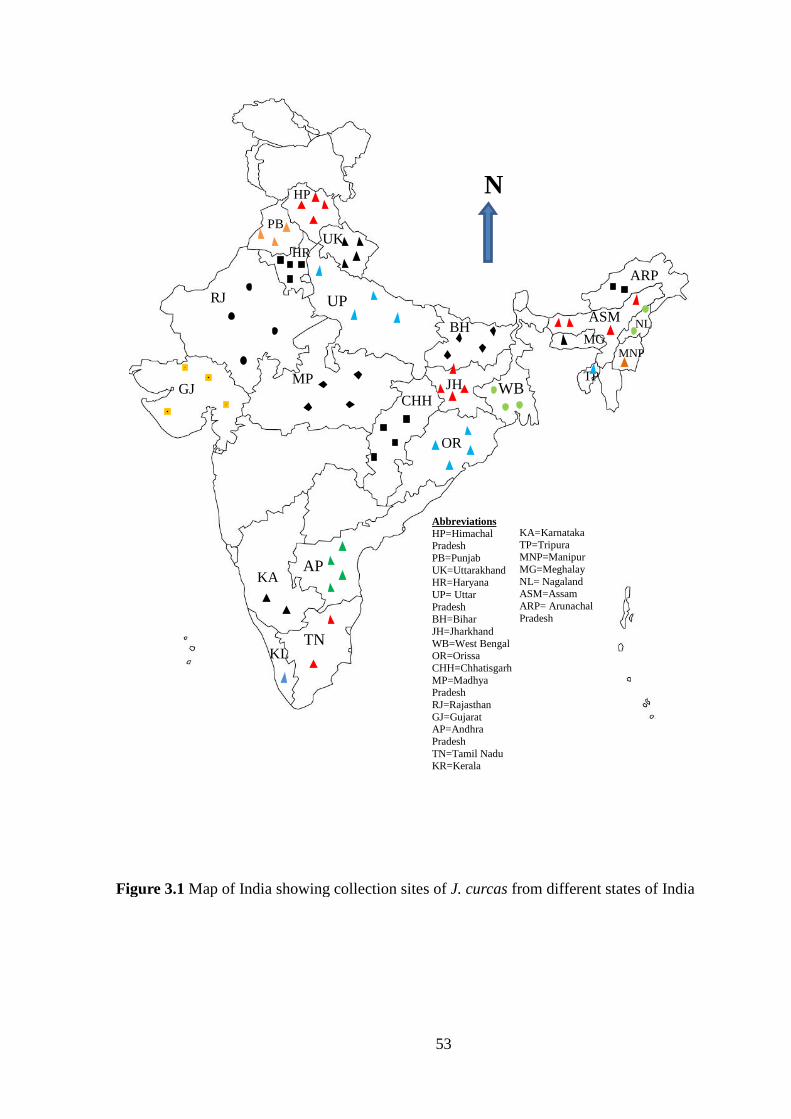
53
Figure 3.1 Map of India showing collection sites of J. curcas from different states of India
RJ
PB
HP
UK HR
UP
BH
JH WB
OR
CHH
AP
TN KL
MP GJ
ASM NL
ARP
KA
MNP
TP
MG
Abbreviations HP=Himachal Pradesh PB=Punjab UK=Uttarakhand HR=Haryana UP= Uttar
Pradesh BH=Bihar JH=Jharkhand WB=West Bengal OR=Orissa CHH=Chhatisgarh MP=Madhya Pradesh RJ=Rajasthan GJ=Gujarat AP=Andhra
Pradesh TN=Tamil Nadu KR=Kerala
KA=Karnataka TP=Tripura MNP=Manipur MG=Meghalay NL= Nagaland ASM=Assam ARP= Arunachal
Pradesh
N
54
3.1.3 Materials for heterozygosity assessment
For the assessment of heterozygosity level in J. curcas, one accessions i.e. NBJC147 was
selfed to check the cross pollination. The seeds thus obtained were used to raise seedlings in
the experimental field of CSIR- National Botanical Research Institute, Lucknow, India for
heterozygosity assessment. The seedlings were raised in polybags and DNA from fresh
leaves was extracted.
3.1.4 Interspecific hybrid plant material
In order to develop interspecific mapping population in J.curcas an interspecific hybrid
between J. curcas and J. integerrima was developed and maintained at CSIR-NBRI
experimental field. The J. curcas was used as female parent and J. integerrima used as male
parent to affect the crosses. About 200 hybrid seeds were first sown in small plastic pots with
a mixture of soil and manure in glass house. The seedlings were transferred into field after 1
month. Ninety four seedlings were established in the field which were used for detail
molecular characterization alongwith their parental lines.
3.1.5 Materials for morphological characterization
For morphometric evaluation, a total of 80 accessions of J. curcas representing different eco-
geographical and agro-climatic zones of India were selected from germplasm bank
maintained at Banthra Research Center (BRC) of National Botanical Research Institute,
Lucknow India.
3.2 Methods
3.2.1 Genomic DNA extraction
The genomic DNA was isolated from young fresh leaves following CTAB (Cetyle tri-methyl
ammonium bromide) method of Saghai-Maroof et al. (1984) with minor modifications. In
brief, approximately 5 g fresh and young leaves were subjected to grinding in liquid nitrogen
alongwith 2% PVP (Polyvinylpyrrolidone) with the help of mortar and pestle to obtain a fine
powder. The fine powder was quickly transferred to 50ml polypropylene centrifuge tube
containing 15 ml of pre-warmed (at 600C) extraction buffer and homogenized the mixture by
gentle shaking. This was then incubated for 45min at 60 0c in water-bath and mixed by gentle

55
swirling after every 10 min. After incubation, equal volume of chloroform:Isoamyl alcohol
(24:1) was added and the tubes were gently shaken for 10 min. and centrifuged for 20 min. at
10000 rpm at room temperature and the upper aqueous phase was transferred to a fresh sterile
50 ml centrifuge tubes. To each of the above tubes, 2 volume ice-cold isopropanol was added
and the tube was shaken gently and kept at – 20 0C for 1 hr. With the help of a sterile glass
hook, DNA was spooled out and transferred to 2 ml sterile tube for washing with 70%
ethanol for 10 min. The 2ml tube having DNA with 70% ethanol was centrifuged for 2 min.
at 12000 rpm and ethanol was discarded. The pellet was air-dried and dissolved in 500µl of
autoclaved sterile water. For purification of extracted genomic DNA, the RNase A was added
to the sample 20µg/ml (100 µl DNA: 1µl RNase A) and the mixture was incubated at 37 0c
for 1 hour. DNA was extracted with equal volume of phenol:chloroform:isoamyl alcohol
(25:24:1) by centrifuging the tube at 10,000 rpm for 5 minutes at room temperature. The
upper aqueous supernatant was transferred to new sterile 2 ml tube and two volume of ice-
cold absolute alcohol and 1/10th
volume of 3M sodium acetate was added and kept at -20 0c
for 1 hour. After 1 hour, the tube was centrifuged at 10000 rpm for 5 min. and DNA was
pelleted. Finally, the pellet was washed with 70% ethanol two times, air dried and dissolved
in 500 µl autoclaved sterile water.
3.2.2 Quantification and quality check of genomic DNA
The concentration of genomic DNA was determined using a Nanodrop spectrophotometer
ND1000 (Nanodrop Technologies, DE, USA) as per standard manufacturer’s instructions.
The concentration was recorded in g/µl. The ratio of absorbance at 260 nm and 280 nm was
used to assess the purity of DNA and RNA. A ratio of ~1.8 is generally accepted as ‘pure’
for DNA and a ratio of ~2.0 is generally accepted ‘pure’ for RNA. If the ratio is appreciably
lower in either case, it may indicate the presence of protein, phenol or other contaminants that
absorbs strongly at or near 280 nm. Further, the quality of DNA was also checked by running
on 0.8% agarose gel.
3.2.3 Development of SSR markers
3.2.3.1 Construction of SSR enriched genomic libraries of J. curcas
The genomic DNA of J. curcas (accession NBJC 132) was utilized for the construction of
SSR- enriched genomic DNA libraries. For this purpose, 4 SSRs repeat motif i.e. (AC)n,
56
(AG)n, (AAC)n and (AAT)n were selected for the construction of 4 independent SSR-
enriched genomic libraries. The work for constructing 4 SSR-enriched genomic libraries was
outsourced to Genetic Identification Services (GIS, Chatsworth, CA, USA). The standard
protocol used to prepare SSR enriched libraries is as follows: the genomic DNA was partially
digested with a mixture of endonucleases. Size- separated DNA fragments, ranging from 300
to 750 bp, were ligated with adapters and separately enriched for each specific SSR motif
using biotinylated capture molecules (CPG, Lincoln Park, NJ). The captured fragments were
amplified and digested with HindIII to remove the adaptors and the fragments were cloned in
pUC19 vector. GIS supplied ligation mixtures of all the 4 SSR-enriched libraries. Using each
of the above 4 ligation mixtures separately, transformation of Escherichia coli strain Dh5α
(Invitrogen) was done by electroporation using MicroPulser (BIO-RAD, Gladesville, New
South Wales, Australia). The recombinant clones were used for plasmid isolation and
sequencing of cloned inserts. A graphical representation of identification of SSR and primer
designing with classical and new method were shown in figure 3.2.
3.2.3.2 Screening of SSRs containing sequences through classical method (Sanger
sequencing)
The two genomic libraries enriched for CA and GA repeat motifs of recombinant plasmid
were transformed into ElectroMaxTM
DH5-ETM
electro-competent Escherichia coli cells
(Invitrogen) ), which were then plated onto LB agar plates containing 200µg/ml ampicillin,
100µg/ml X-galactosidase and 0.1M Isopropyl –β- D- thiogalactopyranoside (IPTG) for blue
white selection. The plates were incubated overnight at 37 0c. The white colonies were picked
up and grown in 5 ml LB overnight for the isolation of plasmid DNA.
Small- scale isolation of plasmid DNA was carried out by the alkaline lysis method of
Birnboim and Doly (1979), as described by Sambrook et al. (1989). In brief, a single isolated
colony was inoculated in 3 ml luria broth (LB) medium containing appropriate antibiotic and
grown overnight at 37 0c with continuous shaking at 250 rpm in an incubator shaker (New
Brunswick, New Jersey, USA). About 1.5 ml of the overnight grown culture was transferred
to micro-centrifuge tube and spun at 12,000 rpm for 1 minute at 4 0c to pellet down the cells.
The remaining 1.5 ml culture was transferred to the same tube after discarding the
supernatant and centrifuged to collect cells. The supernatant was carefully discarded and the
pellet was thoroughly suspended in 100 l of solution I (0.05 M Glucose, 0.025 M TrisCl, pH
8.0 and 0.01 M EDTA, pH 8.0, stored at 4 0c) by vortexing. To this mixture, 200 l of freshly

57
prepared solution II (Alkaline SDS1% and 0.2 N NaOH) was added and the tube was gently
inverted to get a clear suspension. To this suspension, 150 l of solution III was added and
the content of the tube were gently mixed by inverting for a few seconds and the lysate was
kept on ice for 10-15 minutes. The tube containing lysate was centrifuged at 12,000 rpm for
15 minutes at 4oc and the supernatant was transferred to a fresh 2 ml eppendorf tube and mix-
up 2µl RNase (10mg/ml) and put on 37 0c for 30 min. Equal volume of chloroform: iso-amyl
alcohol (24:1 v/v) was added and centrifuged at 12,000 rpm for 5 min at room temperature.
The supernatant was transferred to a fresh 2 ml eppendorf tube and added equal volume of
isopropanal and centrifuged at 12,000 rpm for 15 min at 40c. The supernatant was discarded
and the pellet was then washed with 70% ethanol (v/v) by centrifuging at 12,000 rpm for 10
minute at room temperature. The DNA pellet was air-dried until the ethanol evaporated. The
dried pellet was dissolved in 50 l sterile water (MQ) and stored at –20oc. The quality of
plasmid DNA was checked on 0.8% agarose and quantified using Nanodrop. The good
quality plasmid DNA was used for Sanger sequencing using ABI 3730xl DNA analyzer.
Sequencing of the plasmid DNA was done by Sanger sequencing method with M13
primer (5΄ACGACGTTGTAAAACGACGG-3΄) on ABI 3730xl DNA Analyzer (Applied
Biosystems, Foster City, CA, USA). The BigDye®
Terminator v3.1 Cycle Sequencing Kit
(Applied Biosystems) was used for sequencing reaction. The reaction was carried out
according to the manufacturer’s instruction. The composition of the reaction mixture was as
follows-
Template - 300 ng
Ready Reaction mix - 0.5µl
Dilution Buffer - 1.75 µl
Primer (M13) - 2.0 pmol
Volume of the reaction mixture was adjusted to 10 µl with nuclease free water. The reaction
mixture was subjected to 25 cycles of PCR with following program:
Denaturation - 96oc - 30 sec
Annealing - 50oc - 15 sec
Extension - 60oc - 4 min
On completion of above PCR reaction, sequencing product was purified by Ethanol/EDTA
precipitation methods and dissolved in 10µl Hi-Di formamide which was then denatured at
950c for 5 minutes. The denatured samples were taken up in the instrument DNA Analyzer
3730xl for sequencing.
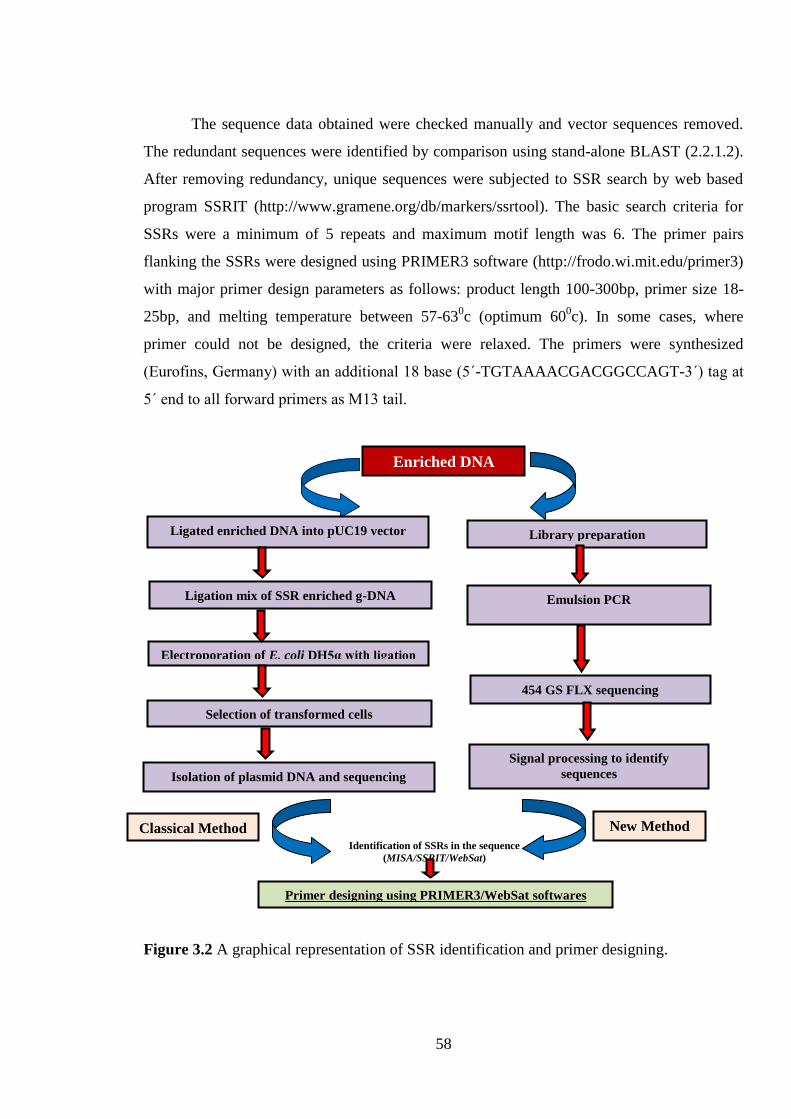
58
The sequence data obtained were checked manually and vector sequences removed.
The redundant sequences were identified by comparison using stand-alone BLAST (2.2.1.2).
After removing redundancy, unique sequences were subjected to SSR search by web based
program SSRIT (http://www.gramene.org/db/markers/ssrtool). The basic search criteria for
SSRs were a minimum of 5 repeats and maximum motif length was 6. The primer pairs
flanking the SSRs were designed using PRIMER3 software (http://frodo.wi.mit.edu/primer3)
with major primer design parameters as follows: product length 100-300bp, primer size 18-
25bp, and melting temperature between 57-630c (optimum 60
0c). In some cases, where
primer could not be designed, the criteria were relaxed. The primers were synthesized
(Eurofins, Germany) with an additional 18 base (5΄-TGTAAAACGACGGCCAGT-3΄) tag at
5΄ end to all forward primers as M13 tail.
Figure 3.2 A graphical representation of SSR identification and primer designing.
Library preparation
Emulsion PCR
Signal processing to identify
sequences
454 GS FLX sequencing
Enriched DNA
fragments
Ligated enriched DNA into pUC19 vector
Ligation mix of SSR enriched g-DNA
Electroporation of E. coli DH5α with ligation
Isolation of plasmid DNA and sequencing
Selection of transformed cells
New Method
Primer designing using PRIMER3/WebSat softwares
Identification of SSRs in the sequence
(MISA/SSRIT/WebSat)
Classical Method

59
3.2.3.3 Screening of SSR containing sequences using next generation sequencing
(Roche 454 GS FLX sequencer)
The rest two genomic libraries enriched for trinucleotide repeat motif microsatellite (AAT
and AAG) were used to develop genomic derived SSRs utilizing high throughput next
generation sequencing technique of Roche 454 whole genome sequencer. The ligated SSR
enriched fragment was diluted 1:50 and PCR amplified with M13 universal primers. The
agarose gel having smear of 300-800bp was cut and eluted using PCR gel elution kit
(Genetix, India). This eluted DNA fragment were sequenced on Roche 454 GS-FLX
sequencer (Titanium, GS sequencer v2.5, 454 Life Sciences, Branford, CT) on 1/8th
area of
the PicoTiter Plate device using GS emPCR kit1 and GS LR 70 sequencing kit, according to
the manufacturer’s protocol.
The adaptor sequences of the raw reads were removed from the DNA sequence data
obtained from the GS FLX sequencer and assembled using CAP3 assembler (Huang and
Madan 1999). The criteria for assembling the reads were minimum overlap length of 40 bases
with 90% identity. The redundant sequences were identified by comparison using stand-alone
BLAST (2.2.1.2) and removed. The resulting contigs and singlets were then used for
identification and localization of microsatellites by a microsatellite search module MISA
(MIcroSAtellite, http://pgrc.ipk-gatersleben.de/misa). The criteria for SSR search by MISA
were repeat stretches having a minimum of: 5 repeat unit in case of di-, tri-, and 4 repeat units
for tetra-, penta- and hexanucleotide SSRs. The flanking sequences of the repeat motifs were
used to design specific primer for the SSR containing sequences using PRIMER3
(http://frodo.wi.mit.edu/primer3) software with major criteria as: length, 20-26 bp; melting
temperature, 55-650c and length of PCR product 100-400bp. The primers were synthesized
(Sigma -Aldrich) with an additional 18 base (5΄-TGTAAAACGACGGCCAGT-3΄) tag at 5΄
end to all forward primers as M13 tail.
3.2.3.4 Similarity search and functional annotation
Functional annotations of the sequences were determined against NCBI non-redundant (NR)
protein database (NCBI nr, release: 20th
Dec, 2011) using BLASTX with a criteria of
minimum e-value of 1e-5 and minimum alignment length 50% of the query sequence and
classified on the basis of their plant (genus) specific associations.

60
3.2.4 SSR Genotyping
3.2.4.1 PCR amplification and confirmation on agarose gel
The SSR flanking primers were commercially synthesized with an additional 18 base (5'-
TGTAAAACGACGGCCAGT-3') at 5' end to all the forward primers as “M13 tail”
following Schuelke (2000). In addition, 4 “M13 tag” with the same sequence of 18 base of
M13 tail was also synthesized with different fluorescent dyes namely FAM, VIC, NED and
PET (Applied Biosystems, USA). The PCR amplification was carried out in 10µl reaction
mixtures that contained 10 g of genomic DNA, 1X PCR master mix (AmpliTaq Gold®,
Applied Biosystems, USA), 0.1 µl (5pmol/µl ) of forward primer (tailed with M13 tag), 0.3µl
(5pmol/µl) each of both, reverse primer and M13 tag (labeled with either 6- FAM, VIC, NED
and PET). PCR was performed on Verti Thermal Cycler (Applied Biosystems, USA) and
DNA Engine Tetrad (Bio-Rad) using the following cycling condition: initial denaturation at
950c for 5 min. followed by 36 cycle of 94
0c for 30 s, 50-55
0c (primer specific) for 45
s and
72 0c for 1 min. Subsequently, 10 cycles of denaturation for 30 s at 94,
0c annealing for 45 s at
530c, extension for 45 s at 72
0c followed by final extension for 15 min at 72
0C was
performed.
The genomic DNA amplified with SSR primers were first checked for their
amplification on 1.5% agarose gel. For agarose gel electrophoresis, gels were prepared using
agarose (Pronadisa) in 1X TBE buffer and 0.5X TBE buffer using horizontal agarose gel slab
apparatus. The TBE buffer was used to suspend the agarose and dissolved by heating in a
microwave oven. After melting the agarose properly, it was cooled down at 600c followed by
addition of 10 μg/ml ethidium bromide and pouring in tray. Slots were made by fixing comb
over the tray, prior to the pouring of molten agarose. The comb was removed after the
agarose gelled and the gel was transferred to electrophoresis tank containing 0.5X TBE
buffer. The DNA samples and molecular weight markers were mixed with tracking dye and
loaded into the slots of gel. Electrophoresis was carried out at 5V/cm. DNA bands in the gel
were examined under transmitted UV light and documented using Bio Rad Gel
Documentation system. After confirmation of PCR amplification on agarose gel the amplified
PCR amplicon were separated on PAGE or ABI 3730xl capillary electrophoresis.
61
3.2.4.2 Polyacrylamide gel electrophoresis (PAGE) and data scoring
Some PCR amplified SSR were separated on PAGE and some on ABI DNA Analyzer. The
amplified PCR products were resolved on 8% polyacrylamide gel (29:1 acrylamide: N, N’-
methylene bis acrylamide, 1X TBE buffer) using a Bio-Rad Sequi Gen gel apparatus (Bio-
Rad, USA). Twenty base pair ladder marker was used as DNA marker in each gel. For
resolving the SSR PCR products, casting of PAGE gels and electrophoresis involved the
following steps. (i) The two glass plates, one notched IPC (Integral Plate Chamber) and one
outer plate were washed with liquid labolene detergent using warm distilled water and
allowed to air dry and plates were wiped. (ii) On the outer glass plate binding silane were
spread with 0.5% acetic acid and 95% ethanol and at notched plate repel silane were spread
(iii) The glass plates with a pair of 0.4 mm thick spacers were assembled together in the
precision caster base with gasket with the help of GT lever clamps. (iv) The required amount
of TEMED was added to the 8% polyacrylamide gel solution, which was immediately
injected/ poured between the plates through an orifice of precision caster base injection port
with the help of a 180 cc loading syringe. Precaution was taken to avoid the introduction of
air bubbles. When the solution reached the neck of the plates, a 49- well vinyl sharks tooth
comb (0.4 mm thick) facing upward was placed between the plates. The gel was allowed to
polymerize for about 1 h (v) After polymerization, the comb was removed carefully and the
walls of the gel were carefully cleaned with lint free paper, so that the dust/dirt or any foreign
object does not interfere with the resolution of amplified SSR fragments. The plates were
mounted onto the sequencing system with the assembly and upper and lower buffer chambers
were filled to the required volume with 1X fresh TBE buffer (vi) The comb with shark teeth
facing downwards was placed at the appropriate position without damaging the gel. (vii)
After completing the assembly, gel was pre-run for 30 min at constant voltage of 1500V. The
voltage and the time of the pre-run were set with the help of Bio-Rad PowerPac 3000. (viii)
After pre-run, the 1µl PCR products with an equal volume of gel loading dye (xylene cyanol
and bromophenol blue) were properly mixed and loaded with a loading tip in the wells. After
loading, gel was run at 600 V and 60 0c for 2 h.
The PAGE was silver stained to visualize the DNA bands. Following steps were
involved in silver staining of gels: (i) After electrophoresis, the gel was carefully removed
from the glass plates and transferred to a tray containing double distilled water and kept for
5min. with gentle shaking (ii) The distilled water in the above tray was then replaced with
fixing solution containing 10% ethanol/methanol and 0.50% glacial acetic acid and kept for

62
another 5 min with gentle shaking (iii) The above fixing solution was removed from the tray
and retained for further use. Silver solution (0.3g AgNO3 powder in 150 ml 10%
ethanol/methanol solution with 750 µl glacial acetic acid) was then poured in the tray for
staining the gels. The gel was kept in the silver solution for 5 min with gentle shaking (iv)
The silver solution was removed from the tray and gel was rinsed for a while in distilled
water (v) The gel was transferred to the developing solution (prepared by dissolving 4.0 g
NaOH pellets in 150 ml distilled water with 450 µl of 40% formaldehyde). The solution in
the tray was shaken gently for 5-10 min. allowing the DNA bands to appear (vi) The staining
was stopped by rinsing the gel for 5 min in the fixing solution retained after step three (vii)
The gel was placed on a light box and photographed using a digital camera and the picture
was transferred to the computer for recording of data. A 20 bp DNA marker (0.05 µg/ µl, 25
µg) was used as a size standard.
To determine the DNA band size of visualize in PAGE the migration distance of
bands of known size of 20 bp DNA marker were measured with scale. The migration distance
of the unknown fragment was also measured. The migration distances recorded were used for
the calculation of the size of the unknown fragments by using web based software ‘Fragment
Size Calculator’ (www.basic.northwestern.edu/biotools/SizeCalc.html). Thus, the genotypic
data on all SSR bands for each genotype were recorded in terms of fragment size (bp).
3.2.4.3 Automated capillary electrophoresis (ABI 3730xl) and data scoring
The SSR amplified PCR product was also separated on ABI 3730xl DNA analyzer. The ABI
DNA analyzer not only has the ability to perform sequencing by capillary electrophoresis but
also can perform a variety of additional DNA analysis applications based on the sizing and
intensity of fluorescently labelled DNA fragments. Collectively, these applications are
referred to as “fragment analysis”. For the fragment analyses following steps were involved:
(i) Preparation of sample
After PCR amplification confirmation on 1.5% agarose gel, post PCR multiplex sets were
prepared based on fluorescence labelled primers. For post PCR multiplexing, 1µl of 6-FAM
and 2 µl of each VIC, NED and PET labelled PCR products representing different SSRs were
combined with 13 µl of water. 1 µl of this mixed product was added to 10 µl HI-Di
formamide containing 0.25 µl GeneScanTM
600 LIZ(R)
as internal size standard, denatured for
5 min at 95 0c, quickly chilled on ice for 5 min. and loaded on ABI 3730xl DNA Analyzer.

63
(ii) Capillary electrophoresis
Both the dye-labelled sample and size standard fragments were co-injected and separated
based on size and charge as they move through the capillary filled with polymer. As each of
the fluorescently labelled sample and size standard fragments moves across the laser window
and fluoresces, the signal produced is detected by an optical detection device on the
instrument. The data collection software then reports the DNA fragments.
(iii) Data analysis using software
Basic data collection occurs during a capillary electrophoresis run. After data collection,
secondary analysis software is used to analyse the data. Applied Biosystem®
Gene-Mapper®
V.4.0 software is flexible, high-performance software package which was used to calculate
SSR allelic data.
3.2.5 Statistical analysis of SSR data
The allelic SSR data obtained from PAGE and ABI DNA analyzer were subjected to various
statistical analysis using different softwares. The allelic data subjected to Power Marker
software (Liu and Muse 2005) to calculate polymorphic SSRs, observed heterozygosity (Ho),
gene diversity or expected heterozygosity (He), major allele frequency and polymorphic
information content (PIC) value. The PIC value was calculated following Botstein et al.
(1980) as:
Where Pi and Pj are the frequencies of ith
and jth
allele. GenAlex 6.5 software was
used to calculate number of observed alleles (Na), number of effective alleles (Ne), Shannon’
information index (I) and molecular variance (AMOVA) (Excoffier et al. 1992). The allelic
data were converted into 0-1 matrix which was used to calculate pair-wise genetic
dissimilarities among the accessions using Jaccard’s coefficient with bootstrap value of 1000.
The dissimilarity matrix thus generated was used to construct a neighbor-joining (NJ) tree
using DARwin 5.0.157 software (Perrier et al. 2003). Further, in order to determine the
genetic structure and define the number of clusters (gene pools), model-based cluster analysis
was also performed using software STRUCTURE version 2.3.3 (Pritchard et al. 2000). The
number of presumed population (K) was set from 2 to 10 with admixture model, without prior
64
information on their origin. Five independent runs were assessed for each fixed K and each
run consisted of 30,000 burn-in period and 1,00,000 iterations. The optimal value of K was
determined by examination of the ΔK statistic and L (K) (Evanno et al. 2005) using Structure
Harvester (Earl and vonHoldt 2012).
3.2.6 Morphometric analyses
3.2.6.1 Field experiment and morphological data measurement
A total of 80 accessions of J. curcas representing different eco-geographical and agro-
climatic zone of India were selected from germplasm bank maintained at Banthra Research
Center (BRC) of CSIR-National Botanical Research Institute, Lucknow, India. Fifteen
cuttings of each accession were raised in polybags filled with soil, cowdung manure and sand
in equal proportion during March 2008. The 6 rooted cuttings of each accession were then
transplanted in experimental plot in Randomized Block Design (RBD) with 3 replications and
2 plants/replication during July 2008. The experimental plot is situated between 260
40’N
latitude and 800
45’ E longitude and at an altitude of 129 m above sea level. The distances
between rows and plants were kept 2 meter. The field was irrigated as and when required.
Pruning of plants was practiced 2 feet above the ground in the first week of March 2009 and
2010.
Data on different morphometric traits were recorded during November 2010- January
2011. Following traits were considered for data measurement:
Female flower/plant: Number of female flowers counted during flowering period (November
– January)
Male flower/plant: Number of male flowers counted per plant.
Male/female ratio: ratio between female and male flowers per plant.
Number of fruits/plant: total number of fruits counted per plant at harvesting time.
Number of seeds/plant: Total number of seeds counted per plant.
Fruit weight/plant: total fruit weight measured in gram per plant.
Seed weight/plant: total seed weight measured in gram per plant.
Seed length and width: twenty seeds per plant randomly selected and length and width
measured in middle with vernier caliper (mm) and
Oil content: twenty five to thirty seeds randomly selected per plant and used to measure oil
content in percent through Nuclear Magnetic Resonance (NMR) spectrometer.
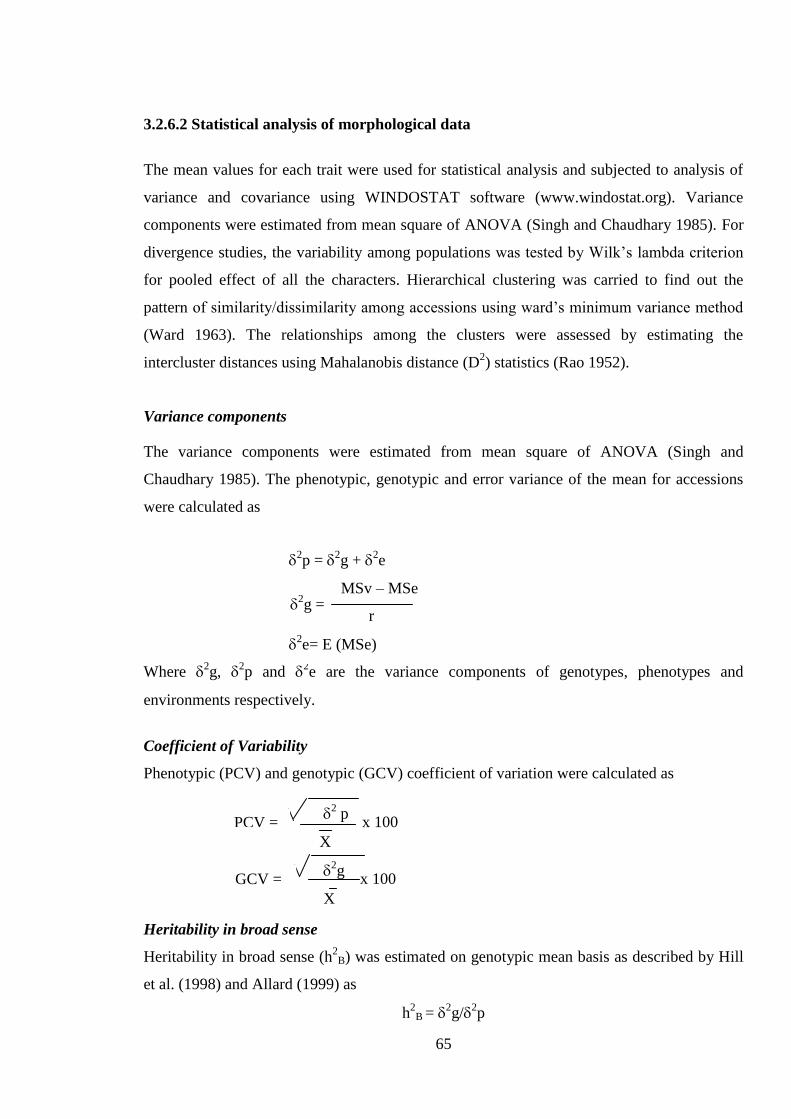
65
2 p
X
2g
X
x 100
x 100
3.2.6.2 Statistical analysis of morphological data
The mean values for each trait were used for statistical analysis and subjected to analysis of
variance and covariance using WINDOSTAT software (www.windostat.org). Variance
components were estimated from mean square of ANOVA (Singh and Chaudhary 1985). For
divergence studies, the variability among populations was tested by Wilk’s lambda criterion
for pooled effect of all the characters. Hierarchical clustering was carried to find out the
pattern of similarity/dissimilarity among accessions using ward’s minimum variance method
(Ward 1963). The relationships among the clusters were assessed by estimating the
intercluster distances using Mahalanobis distance (D2) statistics (Rao 1952).
Variance components
The variance components were estimated from mean square of ANOVA (Singh and
Chaudhary 1985). The phenotypic, genotypic and error variance of the mean for accessions
were calculated as
Where 2g,
2p and
2e are the variance components of genotypes, phenotypes and
environments respectively.
Coefficient of Variability
Phenotypic (PCV) and genotypic (GCV) coefficient of variation were calculated as
Heritability in broad sense
Heritability in broad sense (h2
B) was estimated on genotypic mean basis as described by Hill
et al. (1998) and Allard (1999) as
h2
B = 2g/
2p
2p =
2g +
2e
MSv – MSe
r
2e= E (MSe)
2g =
PCV =
GCV =

66
Genetic Advance
Expected genetic advance (%) of mean was estimated according to Johnson et al. (1955).
GA= k x (p) x h2
B
GA % = (GA/X) x 100
Where,
k- Standardized selection differential (2.06),
p - Phenotypic standard deviation,
h2
B – broad sense heritability and
X - Mean of the trait.
Correlation and path coefficient analysis
The correlation coefficient between different characters at genotypic and phenotypic level
was worked out according to Johnson et al. (1955).
1. Phenotypic correlation coefficient (rp)
Phenotypic correlation (rp) =
Phenotypic covariance = genotypic covariance + error covariance
Error covariance = M.S.P. error
Phenotypic variance X or Y = genotypic variance + error variance
2. Genotypic correlation coefficient (rg)
Genotypic correlation (rg) =
Genotypic covariance =
Genotypic variance X or Y=
Phenotypic covariance X Y
√Phenotypic variance X. Phenotypic variance Y
Genotypic covariance X Y
√Genotypic variance X. Genotypic variance Y
M.S.S. treatment – M.S.S. error
replication
M.S.P. treatment – M.S.P. error
replication
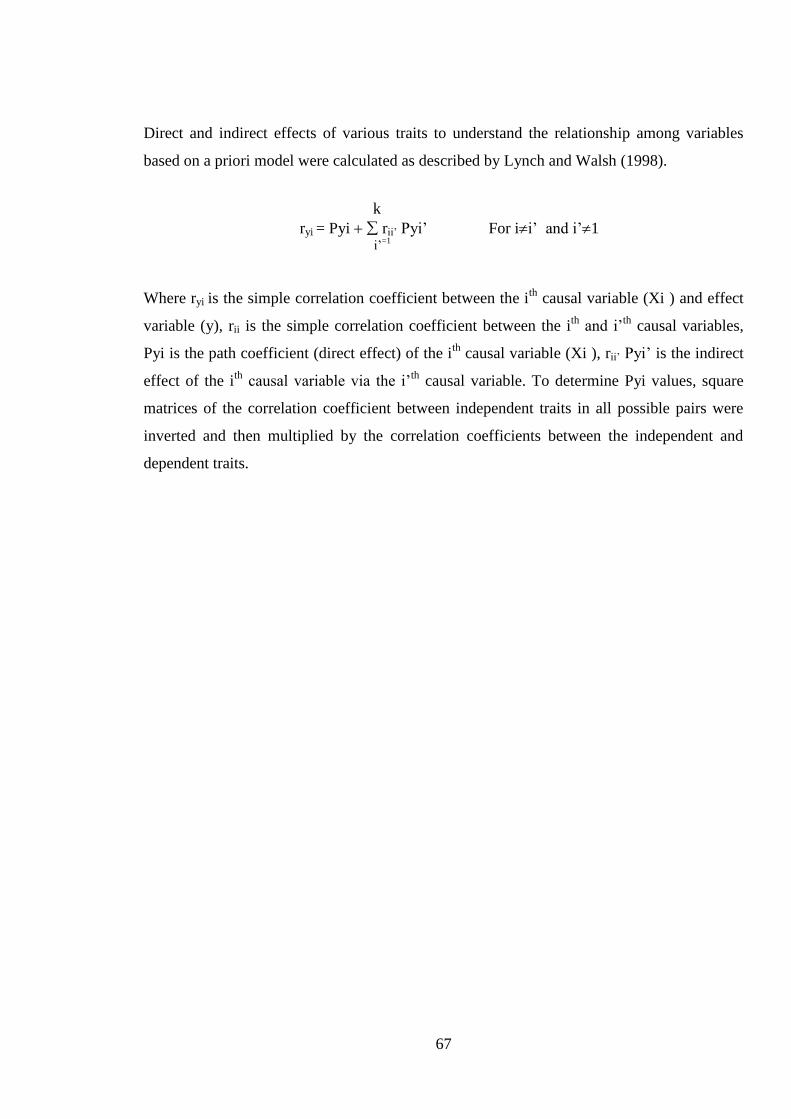
67
Direct and indirect effects of various traits to understand the relationship among variables
based on a priori model were calculated as described by Lynch and Walsh (1998).
Where ryi is the simple correlation coefficient between the ith
causal variable (Xi ) and effect
variable (y), rii is the simple correlation coefficient between the ith
and i’th
causal variables,
Pyi is the path coefficient (direct effect) of the ith
causal variable (Xi ), rii’ Pyi’ is the indirect
effect of the ith
causal variable via the i’th
causal variable. To determine Pyi values, square
matrices of the correlation coefficient between independent traits in all possible pairs were
inverted and then multiplied by the correlation coefficients between the independent and
dependent traits.
k
ryi = Pyi rii’ Pyi’ For ii’ and i’1
i’=1
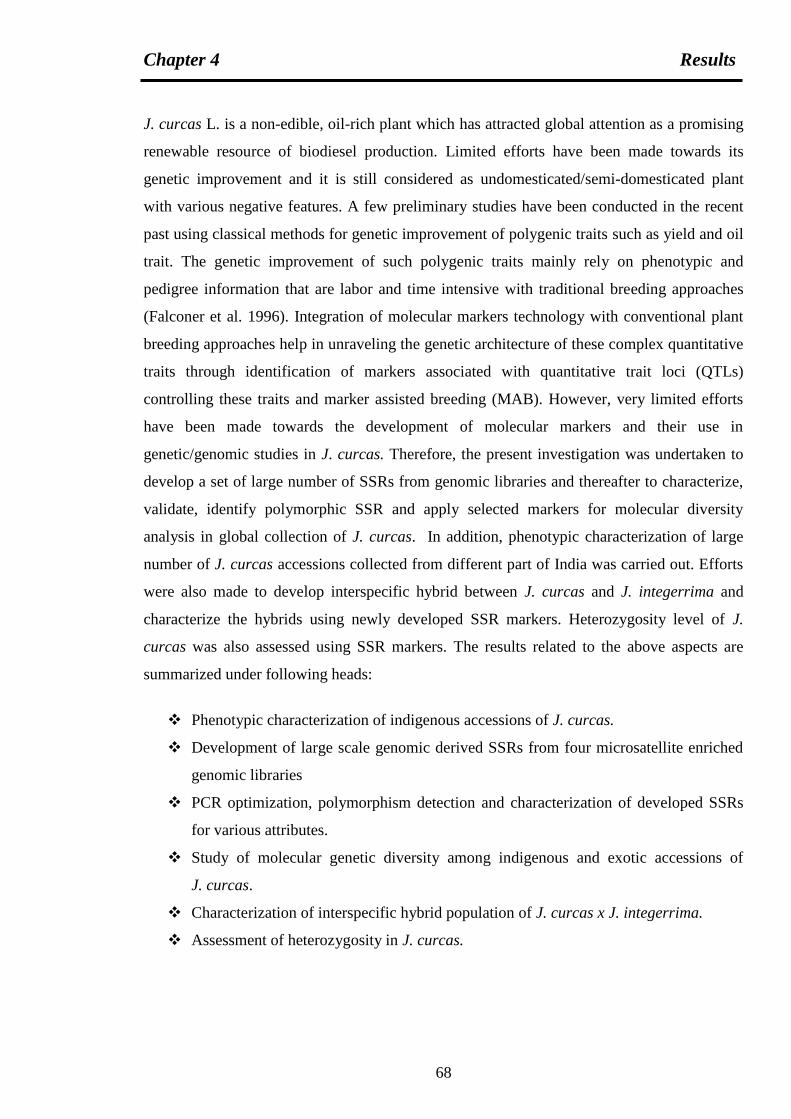
Chapter 4 Results
68
J. curcas L. is a non-edible, oil-rich plant which has attracted global attention as a promising
renewable resource of biodiesel production. Limited efforts have been made towards its
genetic improvement and it is still considered as undomesticated/semi-domesticated plant
with various negative features. A few preliminary studies have been conducted in the recent
past using classical methods for genetic improvement of polygenic traits such as yield and oil
trait. The genetic improvement of such polygenic traits mainly rely on phenotypic and
pedigree information that are labor and time intensive with traditional breeding approaches
(Falconer et al. 1996). Integration of molecular markers technology with conventional plant
breeding approaches help in unraveling the genetic architecture of these complex quantitative
traits through identification of markers associated with quantitative trait loci (QTLs)
controlling these traits and marker assisted breeding (MAB). However, very limited efforts
have been made towards the development of molecular markers and their use in
genetic/genomic studies in J. curcas. Therefore, the present investigation was undertaken to
develop a set of large number of SSRs from genomic libraries and thereafter to characterize,
validate, identify polymorphic SSR and apply selected markers for molecular diversity
analysis in global collection of J. curcas. In addition, phenotypic characterization of large
number of J. curcas accessions collected from different part of India was carried out. Efforts
were also made to develop interspecific hybrid between J. curcas and J. integerrima and
characterize the hybrids using newly developed SSR markers. Heterozygosity level of J.
curcas was also assessed using SSR markers. The results related to the above aspects are
summarized under following heads:
Phenotypic characterization of indigenous accessions of J. curcas.
Development of large scale genomic derived SSRs from four microsatellite enriched
genomic libraries
PCR optimization, polymorphism detection and characterization of developed SSRs
for various attributes.
Study of molecular genetic diversity among indigenous and exotic accessions of
J. curcas.
Characterization of interspecific hybrid population of J. curcas x J. integerrima.
Assessment of heterozygosity in J. curcas.

69
4.1 Phenotypic characterization of indigenous accessions of J. curcas
4.1.1 Genetic variability
For studying the level of genetic variability for various agronomic traits a subset of 80
accessions of J. curcas collected from different eco-geographical and agro-climatic zones of
India were used for phenotypic evaluation. A total of 10 morphometric traits related to floral
characters and yield were measured and data were analyzed to assess the level of genetic
variability and diversity in J. curcas. The range and mean value of different traits along with
various statistical parameters is presented in Table 4.1. The analysis of variance revealed
significant differences for all the 10 traits as indicated by F value (Table 4.1). The number of
female flowers/plant varied from 72.6 to 118.0 with an average of 94.6±1.39 and the number
of male flowers/plant varied from 1627.2 to 2960.0 with an average of 2240.8±42.92.
Male/female flower ratio was found to be varied between 17.2 and 32.1 with an average of
24.0±0.37. The number of fruits/plant varied from 63.4 to 112.9 with an average of
80.5±1.31. The number of seeds/plant varied from 169.6 to 297.0 with an average of
218.3±3.89. The seed weight/plant varied from 102.7 to 273.8 g with an average of
180.2±4.20 g. The range of seed length (mm) and seed width (mm) were 13.3 - 18.5 and 7.8 -
11.8 with an average of 16.4±0.13 and 10.7±0.09 respectively. The oil content varied
between 20.8 to 36.1% with an average of 26.2±0.38. Out of 80 accessions, 37 accessions
had seed weight/plant above average value (i.e.180.2g) and of which only 4 accessions had
seed weight/plant above 250g with maximum in accession NBJC1078 (273.08g). Likewise,
26 accessions had oil content above average value of 26.2% and only 3 accessions namely
NBJC1055, NBJC1051 and NBJC1048 had oil content above 35%.
In order to assess the heritable portion of total variability, the phenotypic variance
(2p) was partitioned into genotypic (
2g) and error variance (
2e). The values of error
variance were found to be higher than those of genotypic variance (2g) for number of female
flowers/plant (163.5), male/female ratio (18.89), number of fruits/plant (143.13), number of
seeds/plant (1047.72) and seed weight/plant (1075.79) indicating the influence of
environmental factors on these traits. The other traits namely male flowers/plant, fruit
weight/plant, seed length, seed width and oil content were not much influenced by
environmental factors as these traits showed lower error variance than the genotypic variance.
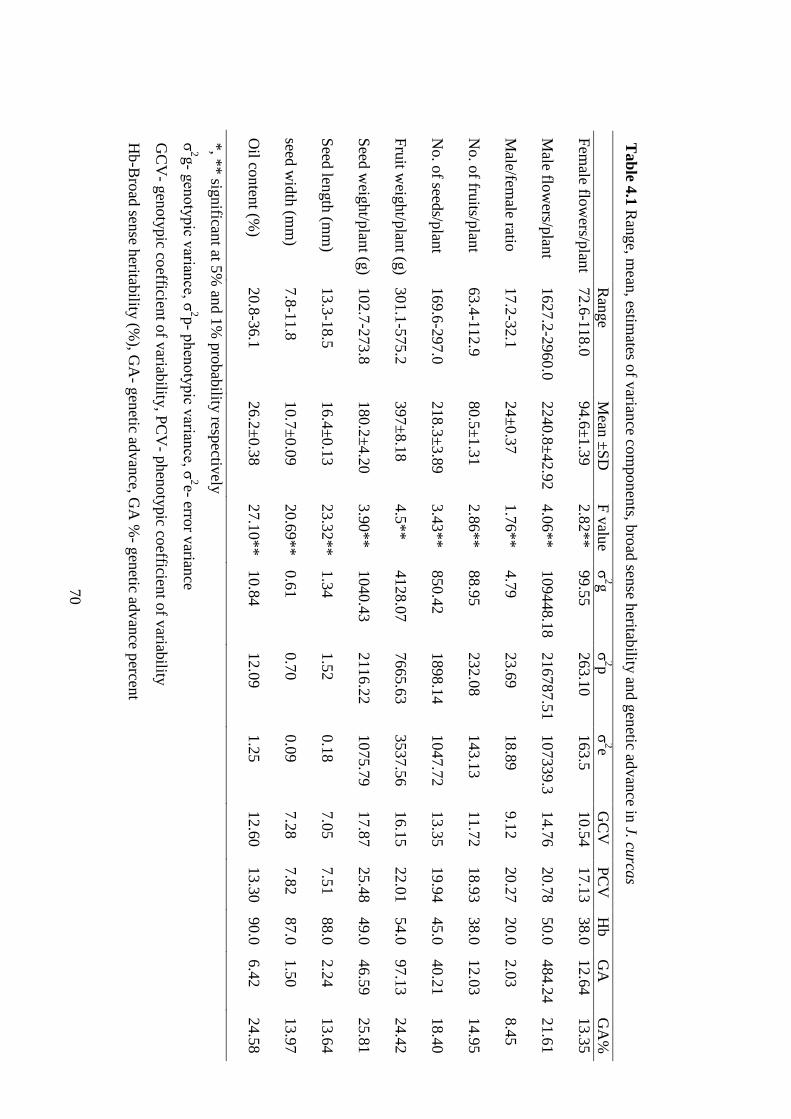
70
Tab
le 4.1
Ran
ge, m
ean, estim
ates of v
ariance co
mponen
ts, bro
ad sen
se heritab
ility an
d g
enetic ad
van
ce in J. cu
rcas
R
ange
Mean
±S
D
F v
alue
σ2g
σ
2p
σ2e
GC
V
PC
V
Hb
GA
G
A%
Fem
ale flow
ers/plan
t 72.6
-118.0
94.6
±1.3
9
2.8
2**
99.5
5
263.1
0
163.5
10.5
4
17.1
3
38.0
12.6
4
13.3
5
Male flo
wers/p
lant
1627.2
-2960.0
2240.8
±42.9
2
4.0
6**
109448.1
8
216787.5
1
107339.3
14.7
6
20.7
8
50.0
484.2
4
21.6
1
Male/fem
ale ratio
17.2
-32.1
24±
0.3
7
1.7
6**
4.7
9
23.6
9
18.8
9
9.1
2
20.2
7
20.0
2.0
3
8.4
5
No. o
f fruits/p
lant
63.4
-112.9
80.5
±1.3
1
2.8
6**
88.9
5
232.0
8
143.1
3
11.7
2
18.9
3
38.0
12.0
3
14.9
5
No. o
f seeds/p
lant
169.6
-297.0
218.3
±3.8
9
3.4
3**
850.4
2
1898.1
4
1047.7
2
13.3
5
19.9
4
45.0
40.2
1
18.4
0
Fru
it weig
ht/p
lant (g
) 301.1
-575.2
397±
8.1
8
4.5
**
4128.0
7
7665.6
3
3537.5
6
16.1
5
22.0
1
54.0
97.1
3
24.4
2
Seed
weig
ht/p
lant (g
) 102.7
-273.8
180.2
±4.2
0
3.9
0**
1040.4
3
2116.2
2
1075.7
9
17.8
7
25.4
8
49.0
46.5
9
25.8
1
Seed
length
(mm
) 13.3
-18.5
16.4
±0.1
3
23.3
2**
1.3
4
1.5
2
0.1
8
7.0
5
7.5
1
88.0
2.2
4
13.6
4
seed w
idth
(mm
) 7.8
-11.8
10.7
±0.0
9
20.6
9**
0.6
1
0.7
0
0.0
9
7.2
8
7.8
2
87.0
1.5
0
13.9
7
Oil co
nten
t (%)
20.8
-36.1
26.2
±0.3
8
27.1
0**
10.8
4
12.0
9
1.2
5
12.6
0
13.3
0
90.0
6.4
2
24.5
8
*, *
* sig
nifican
t at 5%
and 1
% p
robab
ility resp
ectively
σ2g
- gen
oty
pic v
ariance, σ
2p- p
hen
oty
pic v
ariance, σ
2e- error v
ariance
GC
V- g
enoty
pic co
efficient o
f variab
ility, P
CV
- phen
oty
pic co
efficient o
f variab
ility
Hb-B
road
sense h
eritability
(%), G
A- g
enetic ad
van
ce, GA
%- g
enetic ad
van
ce percen
t

71
The phenotypic coefficient of variation (PCV) and genotypic coefficient of variation
(GCV) varied from 7.51 to 25.48 and 7.05 to 17.87% respectively. Maximum PCV and GCV
were noticed for seed weight/plant (25.48; 17.87) followed by fruit weight/plant (22.01;
16.15), number of male flowers/plant (20.78; 14.76), number of seeds/plant (19.94; 13.35).
The PCV was found to higher than that of GCV for all the traits with remarkable differences
in their values. However, the traits as seed length, seed width and oil content had very
insignificant differences in PCV and GCV values.
Broad sense heritability varied from 20% to 90% and maximum was observed for oil
content (90%) followed by seed length (88%), seed width (87%), fruit weight/plant (54%)
and male flowers/plant (49%). The lowest heritability (20%) was noticed for male/female
ratio. The female flowers/plant and number of fruits/plant had 38.0% heritability. The
number of seeds/plant had 45.0% heritability. The high heritability noticed for oil content,
seed length and seed width indicates that these characters are under genotypic control.
The genetic advance as percent of mean varied from 8.45 for male/female ratio to
25.81 for seed weight/plant. High heritability (90.0%) coupled with high GA (24.58) and
GCV (12.60) was found for oil content. Low heritability (49%) with high GA (25.81) was
noticed for seed weight/plant, fruit weight/plant (45.0; 24.42) and number of seeds/plant
(45.0; 18.40). The high heritability with low GA was found for seed length (88.0; 13.64) and
seed width (87.0; 13.97). The trait male/female ratio had lowest heritability (20%), lowest
GA (8.45%) and lowest GCV (9.12).
4.1.2 Diversity analysis based on morphological traits
The morphological data of all the 10 traits were subjected to multivariate analysis for diversity
assessment among the 80 accessions of J. curcas. The testing of significance based on Wilk’s
lambda criterion for pooled effect of all the characters showed significant differences among
the accessions (χ2=790 df=3079.06**). A hierarchical cluster analysis based on Wards
minimum variance grouped all the 80 accessions into 4 clusters (Table 4.2 Figure 4.1).
4.1.2.1 Cluster composition
The number of accessions per clusters varied from 6 (cluster III) to 29 (cluster II). The cluster
II was largest with 29 accessions collected from 11 states India i.e. Andhra Pradesh (6
accessions), Rajasthan (5), Jharkhand (4), Uttar Pradesh (2), Chhattisgarh (2), Bihar (2),
Punjab (2), Gujarat (1), Haryana (1), Kerala (1) and Tamil Nadu (1). The cluster I was second
72
largest comprising 27 accessions including 5 accessions collected from Uttar Pradesh, 4 from
Gujarat, 3 from West Bengal, 2 each from Rajasthan, Tamil Nadu, Himachal Pradesh, Bihar,
Chhattisgarh, Haryana, and 1 each from Punjab, Madhya Pradesh, Uttaranchal, Jharkhand
and Kerala. The cluster III was the smallest with 6 accessions collected from Uttaranchal (4),
Jharkhand (1) and Rajasthan (1). The cluster IV had 18 accessions collected from
Chhattisgarh (4), Uttar Pradesh (4), Tamil Nadu (3), Himachal Pradesh (2), Haryana (2),
Orissa (1), Andhra Pradesh (1), and West Bengal (1).
4.1.2.2 Cluster distance and mean value of traits
The maximum intra-cluster distance was noticed in cluster IV (30.15) followed by cluster I
(28.61), cluster II (25.89) and cluster III (24.77). The inter-cluster distance varied from 47.59
(between cluster I and cluster II) to 211.27 (between cluster III and cluster I). Based on
cluster distance, the cluster III showed maximum genetic distance with cluster I, followed by
cluster IV and cluster II suggesting comparatively wider genetic diversity among them.
Considering the cluster means for all the 10 traits, the cluster I which was second largest
cluster showed highest mean value for all the traits (Table 4.4) i.e. female flowers/plant
(103.12±2.18), male flowers/plant (2471.53±68.74), male/female ratio (24.30±0.70) number
of fruits/plant (89.31±2.37), fruit weight/plant (432.88±14.52), number of seeds/plant
(245.39±7.10), seed weight/plant (198.61±7.75), seed length (17.58±0.10) and seed width
(11.12±0.08) except oil content (24.97±0.36). On contrary, cluster III which was the smallest
cluster had lowest mean value for number of male flowers/plant (2018.00±114.06),
male/female ratio (22.29±1.07), fruit weight/plant (347.50±11.85), seed weight/plant
(151.44±6.98), seed length (13.92±0.24) and seed width (8.29±0.02). However, it had
moderate mean value for female flowers/plant (91.44±4.54), fruits/plant (75.50±3.55),
seeds/plant (205.28±9.10) and oil content (25.56±1.02). The cluster II had second highest
mean value for the traits female flowers/plant, fruits/plant, fruit weight/plant, seed
weight/plant, seed length, seed width and lowest mean value for oil content. The cluster IV
which had 18 accessions showed highest mean value for oil content, lowest mean value for
female flowers/plant, fruits/plant, and seeds/plants.
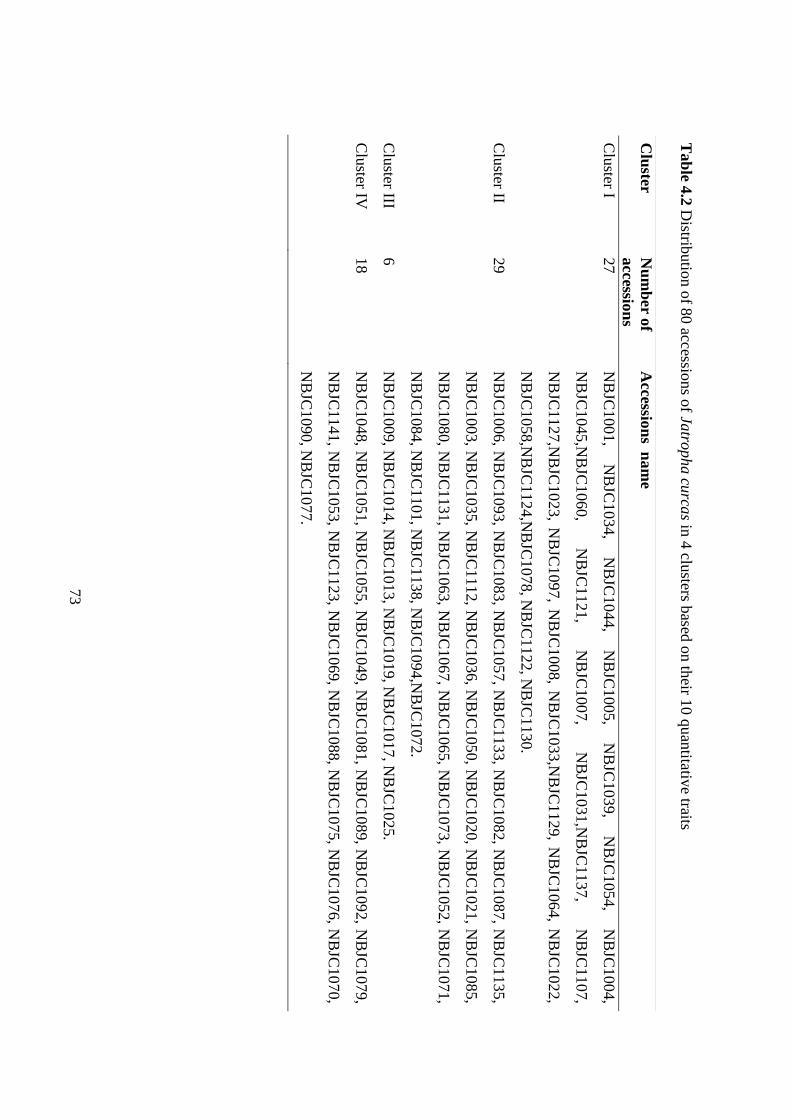
73
Tab
le 4.2
Distrib
utio
n o
f 80 accessio
ns o
f Jatro
ph
a cu
rcas in
4 clu
sters based
on th
eir 10 q
uan
titative traits
Clu
ster
Nu
mb
er o
f
accessio
ns
Accessio
ns n
am
e
Clu
ster I 27
NB
JC1001,
NB
JC1034,
NB
JC1044,
NB
JC1005,
NB
JC1039,
NB
JC1054,
NB
JC1004,
NB
JC1045,N
BJC
1060,
NB
JC1121,
NB
JC1007,
NB
JC1031,N
BJC
1137,
NB
JC1107,
NB
JC1127,N
BJC
1023, N
BJC
1097, N
BJC
1008, N
BJC
1033,N
BJC
1129, N
BJC
1064, N
BJC
1022,
NB
JC1058,N
BJC
1124,N
BJC
1078, N
BJC
1122, N
BJC
1130.
Clu
ster II 29
NB
JC1006, N
BJC
1093, N
BJC
1083, N
BJC
1057, N
BJC
1133, N
BJC
1082, N
BJC
1087, N
BJC
1135,
NB
JC1003, N
BJC
1035, N
BJC
1112, N
BJC
1036, N
BJC
1050, N
BJC
1020, N
BJC
1021, N
BJC
1085,
NB
JC1080, N
BJC
1131, N
BJC
1063, N
BJC
1067, N
BJC
1065, N
BJC
1073, N
BJC
1052, N
BJC
1071,
NB
JC1084, N
BJC
1101, N
BJC
1138, N
BJC
1094,N
BJC
1072.
Clu
ster III 6
NB
JC1009, N
BJC
1014, N
BJC
1013, N
BJC
1019, N
BJC
1017, N
BJC
1025.
Clu
ster IV
18
NB
JC1048, N
BJC
1051, N
BJC
1055, N
BJC
1049, N
BJC
1081, N
BJC
1089, N
BJC
1092, N
BJC
1079,
NB
JC1141, N
BJC
1053, N
BJC
1123, N
BJC
1069, N
BJC
1088, N
BJC
1075, N
BJC
1076, N
BJC
1070,
NB
JC1090, N
BJC
1077.

74
Tab
le 4.3
Intra- (d
iagonal b
old
) and in
ter-cluster M
ahalan
obis d
istances fo
r 80 accessio
ns in
Jatro
pha cu
rcas
C
luster I
Clu
ster II C
luster III
Clu
ster IV
Clu
ster I 28.6
1
47.5
9
211.2
7
91.6
2
Clu
ster II
25.8
9
129.4
7
66.5
1
Clu
ster III
24.7
7
153.2
4
Clu
ster IV
30.1
5
Tab
le 4.4
Clu
ster mean
s and stan
dard
errors o
f the m
eans o
f differen
t traits in Ja
trop
ha cu
rcas
F
emale
flow
er/
plan
t
Male flo
wer/
plan
t
male/fem
ale
ratio
No.
of
fruits/
plan
t
Fru
it weig
ht/
plan
t (g)
No. o
f seeds
/plan
t
Seed
weig
ht/
plan
t (g)
Seed
length
(mm
)
Seed
wid
th
(mm
)
Oil
conten
t
(%)
Clu
ster I 103.1
2±
2.1
8
2471.5
3±
68.7
4
24.3
0±
0.7
0
89.3
1±
2.3
7
432.8
8±
14.5
2
245.3
9±
7.1
0
198.6
1±
7.7
5
17.5
8±
0.1
0
11.1
2±
0.0
8
24.9
7±
0.3
6
Clu
ster II 91.7
1±
1.8
2
2200.5
3±
67.2
6
24.0
6±
0.6
5
77.7
7±
1.7
5
390.9
5±
14.1
8
209.2
9±
4.9
0
179.3
2±
6.2
4
16.1
7±
0.1
4
10.8
8±
0.0
6
24.3
4±
0.2
7
Clu
ster III 91.4
4±
4.5
4
2018.0
0±
114.0
6
22.2
9±
1.0
7
75.5
0±
3.5
5
347.5
0±
11.8
5
205.2
8±
9.1
0
151.4
4±
6.9
8
13.9
2±
0.2
4
8.2
9±
0.0
2
25.5
6±
1.0
2
Clu
ster IV
85.9
1±
2.2
6
2033.9
4±
66.7
0
24.0
4±
0.6
8
73.2
0±
1.4
2
372.9
4±
12.1
9
196.4
1±
4.1
1
163.6
3±
7.3
7
15.9
8±
0.1
6
10.7
2±
0.0
7
31.0
4±
0.6
9
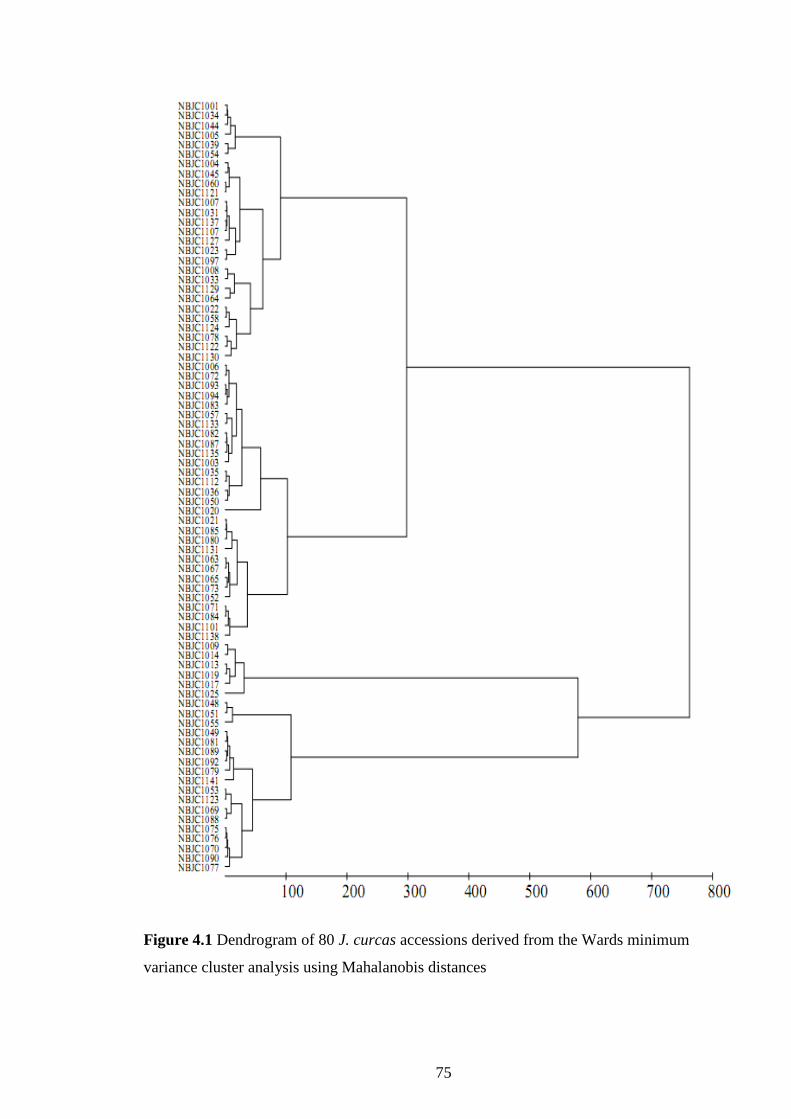
75
Figure 4.1 Dendrogram of 80 J. curcas accessions derived from the Wards minimum
variance cluster analysis using Mahalanobis distances
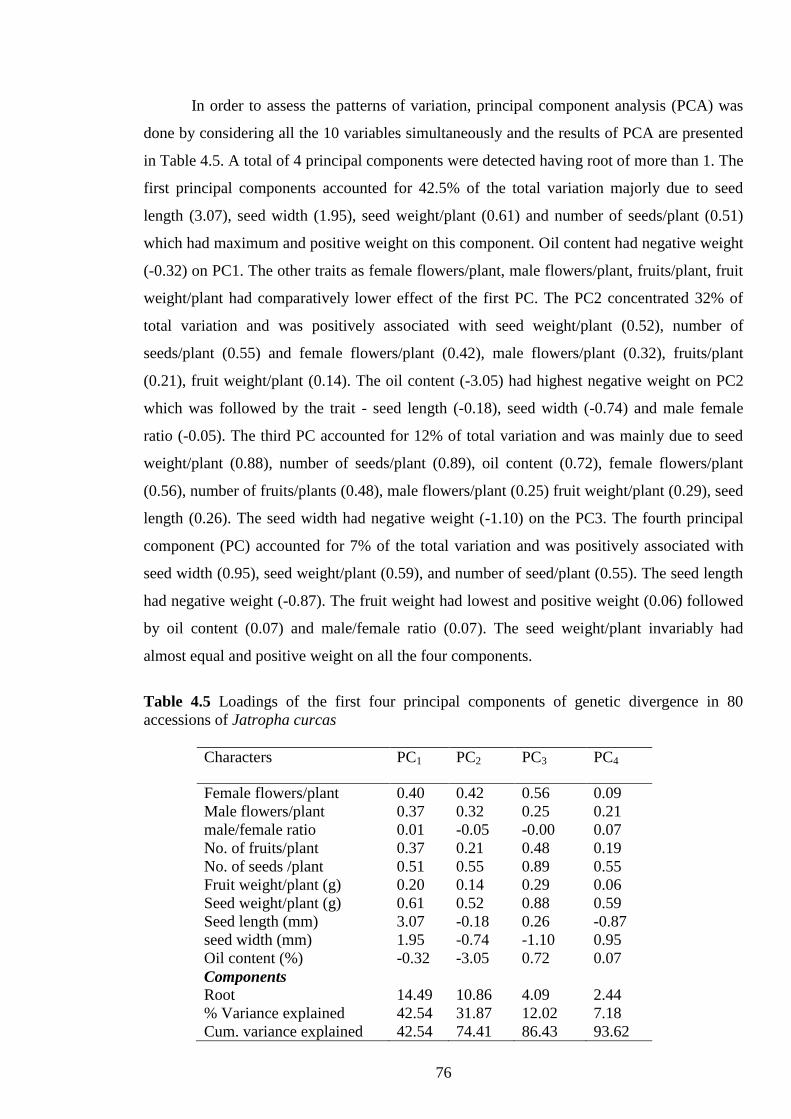
76
In order to assess the patterns of variation, principal component analysis (PCA) was
done by considering all the 10 variables simultaneously and the results of PCA are presented
in Table 4.5. A total of 4 principal components were detected having root of more than 1. The
first principal components accounted for 42.5% of the total variation majorly due to seed
length (3.07), seed width (1.95), seed weight/plant (0.61) and number of seeds/plant (0.51)
which had maximum and positive weight on this component. Oil content had negative weight
(-0.32) on PC1. The other traits as female flowers/plant, male flowers/plant, fruits/plant, fruit
weight/plant had comparatively lower effect of the first PC. The PC2 concentrated 32% of
total variation and was positively associated with seed weight/plant (0.52), number of
seeds/plant (0.55) and female flowers/plant (0.42), male flowers/plant (0.32), fruits/plant
(0.21), fruit weight/plant (0.14). The oil content (-3.05) had highest negative weight on PC2
which was followed by the trait - seed length (-0.18), seed width (-0.74) and male female
ratio (-0.05). The third PC accounted for 12% of total variation and was mainly due to seed
weight/plant (0.88), number of seeds/plant (0.89), oil content (0.72), female flowers/plant
(0.56), number of fruits/plants (0.48), male flowers/plant (0.25) fruit weight/plant (0.29), seed
length (0.26). The seed width had negative weight (-1.10) on the PC3. The fourth principal
component (PC) accounted for 7% of the total variation and was positively associated with
seed width (0.95), seed weight/plant (0.59), and number of seed/plant (0.55). The seed length
had negative weight (-0.87). The fruit weight had lowest and positive weight (0.06) followed
by oil content (0.07) and male/female ratio (0.07). The seed weight/plant invariably had
almost equal and positive weight on all the four components.
Table 4.5 Loadings of the first four principal components of genetic divergence in 80
accessions of Jatropha curcas
Characters PC1 PC2 PC3 PC4
Female flowers/plant 0.40 0.42 0.56 0.09
Male flowers/plant 0.37 0.32 0.25 0.21
male/female ratio 0.01 -0.05 -0.00 0.07
No. of fruits/plant 0.37 0.21 0.48 0.19
No. of seeds /plant 0.51 0.55 0.89 0.55
Fruit weight/plant (g) 0.20 0.14 0.29 0.06
Seed weight/plant (g) 0.61 0.52 0.88 0.59
Seed length (mm) 3.07 -0.18 0.26 -0.87
seed width (mm) 1.95 -0.74 -1.10 0.95
Oil content (%) -0.32 -3.05 0.72 0.07
Components
Root 14.49 10.86 4.09 2.44
% Variance explained 42.54 31.87 12.02 7.18
Cum. variance explained 42.54 74.41 86.43 93.62
77
4.1.3 Correlation coefficient analysis
The morphological data was subjected to correlation coefficient analysis to understand the
genetic relationship among the various traits. The genotypic and phenotypic correlations had
been calculated in 80 diverse accessions of J. curcas and are presented in Table 4.6. The
values of phenotypic and genotypic correlations were of the same sign except in female
flowers/plant vs. male flowers/plant, male female ratio vs fruit weight/plant. In general,
genotypic correlations were slightly higher than the corresponding phenotypic correlation.
The seed weight/plant (SWP) was positively and significantly associated with female
flowers/plant (0.95; 0.36), male flowers/plant (0.64; 0.36), Number of flowers/plant (0.99;
0.39), Number of seed/plant (0.99; 0.52), fruit weight/plant (0.98; 0.40), seed width (0.23;
0.16) and negatively associated with oil content (-0.30; -0.18). Non-significant and positive
association of seed weight/plant was noticed with seed length (0.19; 0.11). The oil content
was found to be negatively and significantly correlated with female flowers/plant, male
flowers/plant, number of seeds/plant, fruit weight/plant and seed weight/plant. The negative
but non-significant association of oil content was also noticed with male female ratio, number
of female flowers/plant, seed length and seed width. Among component traits, female
flowers/plants was significantly and positively correlated with male flowers/plant (0.77;
0.44), number of fruits/plants (0.99; 0.57), number of seeds/plants (0.98; 0.41), fruit
weight/plants (0.99; 0.63) and seed length (0.32; 0.14) and had negative association with oil
content (-.039; -0.22). Male flowers/plant had significant and positive correlation with male
female ratio (0.71; 0.65), number of fruits/plant (0.73; 0.39) and fruit weight/plant (0.72;
0.39). Male female ratio had significant and negative correlation with fruit weight/plant
(0.03; -0.13). Number of fruits/plant had significant and positive correlation with number of
seeds/plant (0.99; 0.42), fruit weight/plant (0.99; 0.81), seed length (0.37; 0.17) and seed
width (0.24; 0.14). Number of seeds/plant had significant and positive correlation with fruit
weight/plant (0.99; 0.47) and negatively correlated with oil content (-0.31; -0.20). Fruit
weight/plant had significant and positive correlation with seed length (0.35; 0.14) and seed
width (0.17; 0.14) while negatively correlated with oil content (-0.30; -0.20). Seed length had
significant and positive correlation with seed width (0.74; 0.65).

78
Table 4.6 Estimates of genotypic (rg) and phenotypic (rp) correlation coefficients among
various traits determined in 80 accessions of J. curcas
MFP MFR NFP NSP FWP SWP SL SW OC
FFP rg
rp
0.77
0.44**
0.10
-0.38**
0.99
0.57**
0.98
0.41**
0.99
0.63**
0.95
0.36**
0.32
0.14*
0.10
0.09
-0.39
-0.22**
MFP rg
rp
0.71
0.65**
0.73
0.39**
0.66
0.37**
0.72
0.39**
0.64
0.36**
0.22
0.11
0.20
0.11
-0.32
-0.20**
MFR rg
rp
-0.04
-0.09
-0.05
0.04
0.03
-0.13*
-0.04
0.05
0.00
-0.00
0.24
0.05
-0.07
-0.03
NFP rg
rp
0.99
0.42**
0.99
0.81**
0.99
0.39**
0.37
0.17**
0.24
0.14*
-0.29
-0.19
NSP rg
rp
0.99
0.47**
0.99
0.52**
0.11
0.06
0.14
0.09
-0.31
-0.20**
FWP rg
rp
0.98
0.40**
0.35
0.14*
0.17
0.14*
-0.30
-0.20**
SWP rg
rp
0.19
0.11
0.23**
0.16
-0.30**
-0.18
SL rg
rp
0.74
0.65**
-0.05
-0.05
SW rg
rp
-0.03
-0.04
OC
*, ** = significant at 5% and 1% respectively.
FFP: female flowers/plant; MFP: male flowers/plant; MFR: male female ratio; NFP: number
of flowers/plant; NSP: number of seeds/plant; FWP: fruit weight/plant; SWP: seed
weight/plant; SL: seed length; SW: seed width; OC: oil content; rg: genotypic correlation
coefficient; rp: phenotypic correlation coefficient

79
4.1.4 Path coefficient analysis
Correlation analysis reveals over all relationships among different traits which may be
negative or positive in nature and it is the net result of direct effect of a particular trait and
indirect effects via other traits. In order to predict the direct and indirect effect of traits on
correlation among various traits the path analysis studies are being carried out. The path
coefficient analysis for seed yield in J. curcas germplasm was performed and results are
presented in table 4.7. The male flowers/plant had the maximum direct effect on seed yield
(4.87), followed by number of seeds/plant (0.71), seed width (0.57), number of fruits/plant
(0.28) and oil content (0.15). On the other hand, the female flowers/plant (-2.19), male female
ratio (-3.32), fruit weight/plant (-1.14), seed length (-0.4) exhibited negative and direct effect
on seed yield but showed positive and significant correlation on seed yield except male
female ratio. The negative direct effect of female flowers/plant, fruit weight/plant, seed
length on seed yield/plant was counterbalanced by indirect positive effect via male
flowers/plant, number of fruits/plant, number of seeds/plant, and seed width. Male
flowers/plant (3.78), number of fruits/plant (0.31), number of seeds/plant (0.70), seed width
(0.05) had indirect positive effect and influenced female flower which indirectly affect yield.
Male female ratio showed negative indirect effect and negative correlation with seed yield.
Oil content had positive direct effect on seed yield/plant though it had negative association
which was due to negative indirect effect via male flower/plant, number of seeds/plant,
number of fruit/plant and seed width.

80
Tab
le 4.7
Path
coefficien
t analy
ses for seed
yield
/plan
t in J. cu
rcas g
ermplasm
Traits
In
direct effect v
ia
Direct E
ffect F
FP
M
FP
M
FR
N
FP
N
SP
F
WP
S
L
SW
O
C
r2
Total In
direct effect
FF
P
-2.1
9
_
3.7
8
-0.3
3
0.3
1
0.7
-1
.18
-0.1
3
0.0
5
-0.0
6
0.9
5
3.1
4
MF
P
4.8
7
-1.6
7
_
-2.3
6
0.2
0.4
6
-0.8
3
-0.0
9
0.1
1
-0.0
5
0.6
4
-4.2
3
MF
R
-3.3
2
-0.2
2
3.4
6
_
-0.0
1
-0.0
4
-0.0
4
0
0.1
4
-0.0
1
-0.0
4
3.2
8
NF
P
0.2
8
-2.4
2
3.5
0.1
4
_
0.8
-1
.25
-0.1
5
0.1
4
-0.0
5
0.9
9
0.7
1
NS
P
0.7
1
-2.1
7
3.2
0.1
6
0.3
2
_
-1.2
-0
.05
0.0
8
-0.0
6
0.9
9
0.2
8
FW
P
-1.1
4
-2.2
6
3.5
4
-0.1
2
0.3
0.7
5
_
-0.1
4
0.0
9
-0.0
4
0.9
8
2.1
2
SL
-0
.4
-0.7
1.1
0
0.1
0.0
8
-0.4
_
0.4
1
0
0.1
9
0.5
9
SW
0.5
7
-0.2
0.9
9
-0.8
0.0
7
0.1
-0
.2
-0.3
_
0
0.2
3
-0.3
4
OC
0.1
5
0.8
5
-1.5
7
0.2
3
-0.0
8
-0.2
2
0.3
4
0.0
2
-0.0
2
_
-0.3
0
-0.4
5
FF
P: fem
ale flow
ers/plan
t; MF
P: m
ale flow
ers/plan
t; MF
R: m
ale female ratio
; NF
P: n
um
ber o
f flow
ers/plan
t; NS
P: n
um
ber o
f seeds/p
lant;
FW
P: fru
it weig
ht/p
lant; S
WP
: seed w
eight/p
lant; S
L: seed
length
; SW
: seed w
idth
; OC
: oil co
nten
t
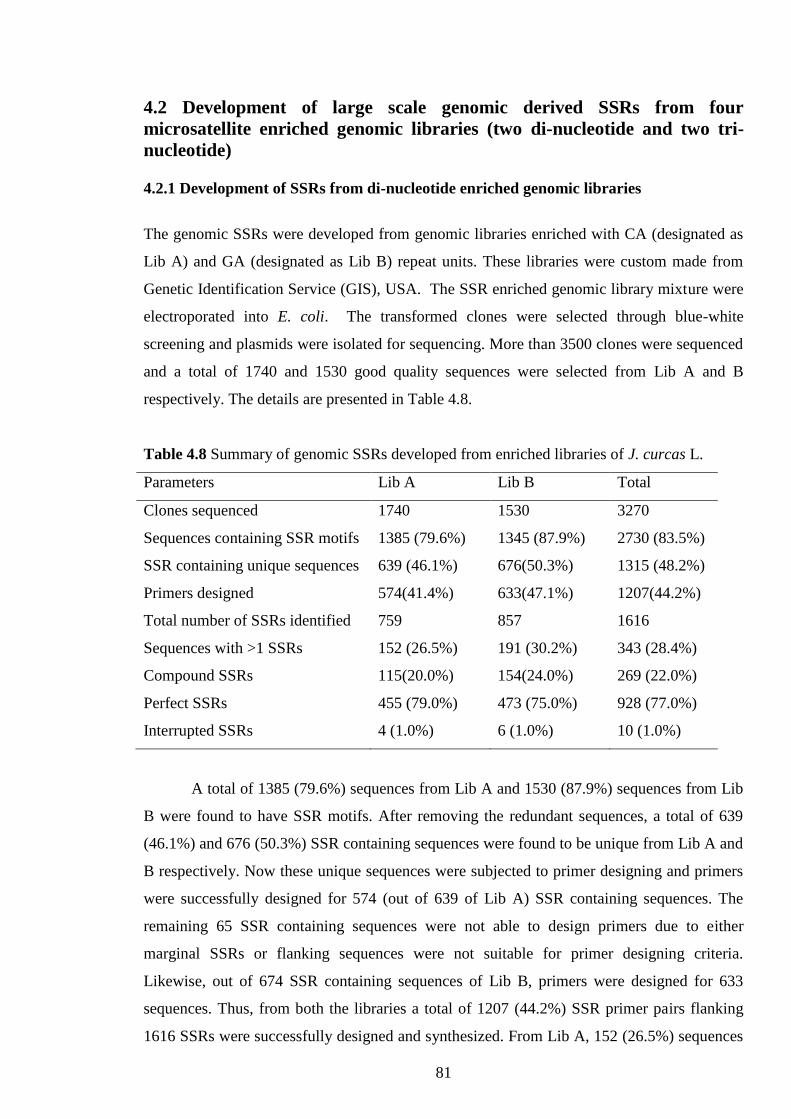
81
4.2 Development of large scale genomic derived SSRs from four
microsatellite enriched genomic libraries (two di-nucleotide and two tri-
nucleotide)
4.2.1 Development of SSRs from di-nucleotide enriched genomic libraries
The genomic SSRs were developed from genomic libraries enriched with CA (designated as
Lib A) and GA (designated as Lib B) repeat units. These libraries were custom made from
Genetic Identification Service (GIS), USA. The SSR enriched genomic library mixture were
electroporated into E. coli. The transformed clones were selected through blue-white
screening and plasmids were isolated for sequencing. More than 3500 clones were sequenced
and a total of 1740 and 1530 good quality sequences were selected from Lib A and B
respectively. The details are presented in Table 4.8.
Table 4.8 Summary of genomic SSRs developed from enriched libraries of J. curcas L.
Parameters Lib A Lib B Total
Clones sequenced 1740 1530 3270
Sequences containing SSR motifs 1385 (79.6%) 1345 (87.9%) 2730 (83.5%)
SSR containing unique sequences 639 (46.1%) 676(50.3%) 1315 (48.2%)
Primers designed 574(41.4%) 633(47.1%) 1207(44.2%)
Total number of SSRs identified 759 857 1616
Sequences with >1 SSRs 152 (26.5%) 191 (30.2%) 343 (28.4%)
Compound SSRs 115(20.0%) 154(24.0%) 269 (22.0%)
Perfect SSRs 455 (79.0%) 473 (75.0%) 928 (77.0%)
Interrupted SSRs 4 (1.0%) 6 (1.0%) 10 (1.0%)
A total of 1385 (79.6%) sequences from Lib A and 1530 (87.9%) sequences from Lib
B were found to have SSR motifs. After removing the redundant sequences, a total of 639
(46.1%) and 676 (50.3%) SSR containing sequences were found to be unique from Lib A and
B respectively. Now these unique sequences were subjected to primer designing and primers
were successfully designed for 574 (out of 639 of Lib A) SSR containing sequences. The
remaining 65 SSR containing sequences were not able to design primers due to either
marginal SSRs or flanking sequences were not suitable for primer designing criteria.
Likewise, out of 674 SSR containing sequences of Lib B, primers were designed for 633
sequences. Thus, from both the libraries a total of 1207 (44.2%) SSR primer pairs flanking
1616 SSRs were successfully designed and synthesized. From Lib A, 152 (26.5%) sequences
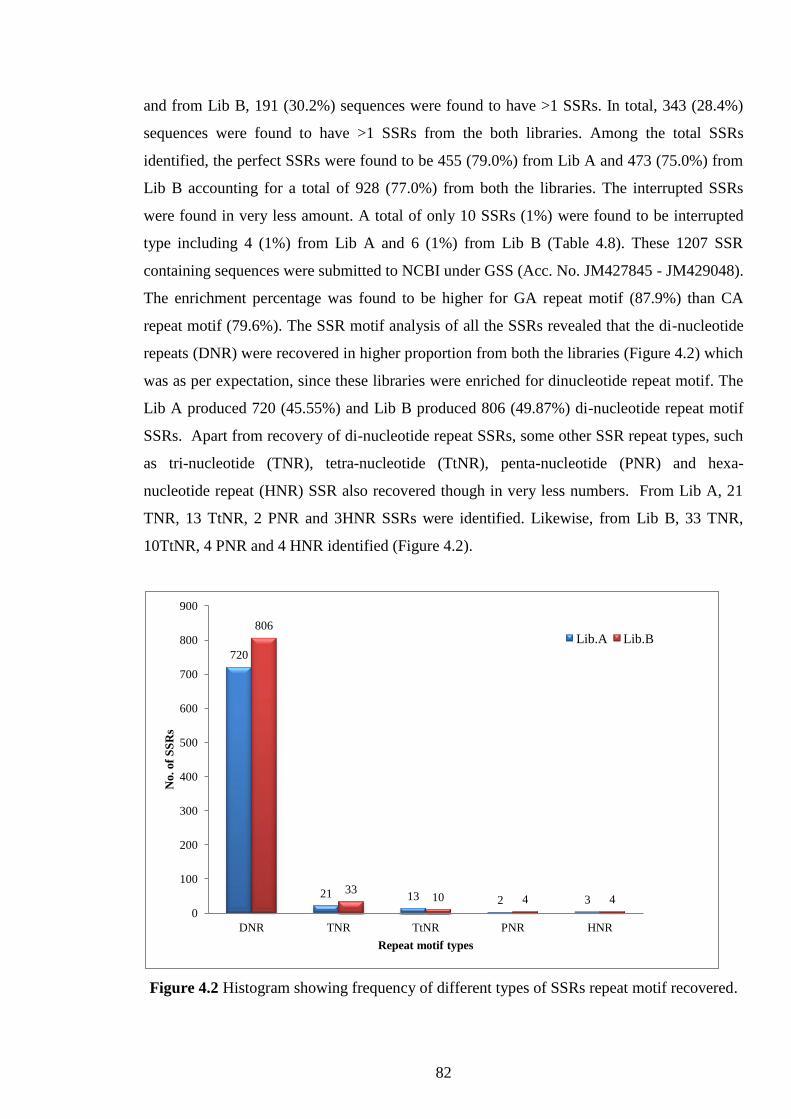
82
and from Lib B, 191 (30.2%) sequences were found to have >1 SSRs. In total, 343 (28.4%)
sequences were found to have >1 SSRs from the both libraries. Among the total SSRs
identified, the perfect SSRs were found to be 455 (79.0%) from Lib A and 473 (75.0%) from
Lib B accounting for a total of 928 (77.0%) from both the libraries. The interrupted SSRs
were found in very less amount. A total of only 10 SSRs (1%) were found to be interrupted
type including 4 (1%) from Lib A and 6 (1%) from Lib B (Table 4.8). These 1207 SSR
containing sequences were submitted to NCBI under GSS (Acc. No. JM427845 - JM429048).
The enrichment percentage was found to be higher for GA repeat motif (87.9%) than CA
repeat motif (79.6%). The SSR motif analysis of all the SSRs revealed that the di-nucleotide
repeats (DNR) were recovered in higher proportion from both the libraries (Figure 4.2) which
was as per expectation, since these libraries were enriched for dinucleotide repeat motif. The
Lib A produced 720 (45.55%) and Lib B produced 806 (49.87%) di-nucleotide repeat motif
SSRs. Apart from recovery of di-nucleotide repeat SSRs, some other SSR repeat types, such
as tri-nucleotide (TNR), tetra-nucleotide (TtNR), penta-nucleotide (PNR) and hexa-
nucleotide repeat (HNR) SSR also recovered though in very less numbers. From Lib A, 21
TNR, 13 TtNR, 2 PNR and 3HNR SSRs were identified. Likewise, from Lib B, 33 TNR,
10TtNR, 4 PNR and 4 HNR identified (Figure 4.2).
Figure 4.2 Histogram showing frequency of different types of SSRs repeat motif recovered.
720
21 13 2 3
806
33 10 4 4
0
100
200
300
400
500
600
700
800
900
DNR TNR TtNR PNR HNR
No. of
SS
Rs
Repeat motif types
Lib.A Lib.B

83
The SSR repeat length analysis revealed that the majority of identified SSRs i.e.
557(34.46%) from Lib A and 500 (30.94%) from Lib B were of short length varied from 4 to
10 repeat units (Figure 4.3). The 151 SSRs from Lib A and 245 from Lib B were found to be
in the range of 11-15 repeat units. The repeat unit ranged from 16 to 20 had only 42 and 84
SSRs from Lib A and Lib B respectively. There were only 37 SSRs (9 from Lib A and 28
from Lib B) were recovered having repeat length more than 20.
Figure 4.3 Histogram showing frequency of different repeat units recovered for Lib A and
Lib B.
The SSR motif types showed that the AC/GT and AG/CT motif, the targeted motif,
were recovered in higher frequency of 506 (32.5%) and 703 (45.3%) of Lib A and Lib B
respectively (Figure 4.4). Next to these motifs, the AT/AT SSR motifs were also recovered in
significant numbers (164 in Lib A and 68 in Lib B) among DNRs as compared to other non-
targeted motifs. Among TNR, the AAG/GTT and AAT/ATT SSR motif accounted for 23 and
21 respectively from both the libraries.
557
151
42
9
500
245
84
28
0
100
200
300
400
500
600
4-10 11-15 16-20 >20
No
. o
f S
SR
s
Repeat units
Lib.A
Lib.B

84
Figure 4.4 Histogram showing frequency of different repeat motifs recovered from
Lib A and Lib B.
4.2.2 Development of SSR markers from tri-nucleotide SSR enriched genomic libraries
The isolation of SSRs from tri-nucleotide repeat libraries was done with a different and new
approach using next generation sequencing technology. For the development of tri-nucleotide
SSR markers, the SSR enriched genomic libraries AAC (designated as Lib. C) and AAT
(designated as Lib. D) were sequenced using Roche 454 GS-FLX whole genome sequencer
on 1/8th
sequencing run. The 454 pyrosequencing resulted in 124,279 reads covering 29.3 Mb
size (Table 4.9) with more than 95% Q40 plus bases which represents about 7% of J. curcas
genome. The average read length was found 235.16 bases with longest one of 601 bases
(Figure 4.5).
506
47
164
3 0 6 10 1 1 1 2 1 4 0 2 1 3 0 33
703
68
2 1 17 11 1 1 1 1 2 2 1 1 2 0 2
0
100
200
300
400
500
600
700
No. of
SS
Rs
Repeat motifs
Lib.A
Lib.B

85
Figure 4.5 The average read length and unique sequence length
The assembly of raw reads generated 25,495 sequences (6.79 Mb) including 2,845
contigs and 22,650 singletons. A total of 72.62% reads and 73.32% bases were aligned. The
average contig size after assembly was found to be 584.54 bases. A total 933 contigs were
recovered with length of > 500 bp.
Table 4.9 Statistical details of 454 sequencing of SSR enriched libraries of J. curcas L.
Raw read statistics Numbers
Total reads generated 124279
Total bases generated (bases) 29226427
Avg. Read length (bases) 235.16
Longest Read length (bases) 601
Trashed Reads ( < 50 bp and low quality reads) 7940
Total reads used for assembly 116339
Details of assembly statistics
All Contigs (≥ 100 bp) 2845
Large contigs (≥ 500 bp) 933
Singletons 22650
Average contig size (bp) 584.54
% Reads Aligned 72.62
% Bases Aligned 73.32
%Q40 Plus basesb 94.56
a N50 corresponds to the length of the smallest contig in the set of largest contigs whose combined length
represents 50% of the total assembly size. b Percentage of bases called that have a quality score of 40 or above
All the assembled contigs and singletons were used for search of SSR motifs using the MISA
software. A total of 5,844 putative microsatellites were identified in 5142 sequences with

86
23% SSR recovery (Table 4.10). Out of 2,845 contigs, 155 had 190 SSRs (6.6%) and 4986
singleton had 5654 SSRs (24.9%). Six hundred nine sequences have more than one SSR loci
and 485 SSRs were found to be present in compound form. Primer pairs were successfully
designed for 1122 SSR containing sequences while the remaining sequences failed to primer
design either due to marginal SSRs or flanking sequences not suitable for primer designing
criteria. Finally, 1122 primer pairs were synthesized and used for validation and
characterization.
Table 4.10 Details of SSR search using MISA
Parameters Numbers
Total number of sequence examined 25495
Total number of identified SSRs 5844
Number of SSR containing sequences 5141
Number of SSR containing more than 1 SSRs 609
Number of SSRs present in compound form 485
Total Primers designed 1122
With respect to recovery of different types of SSR types, it was noticed that trinucleotide
repeat SSRs was found in maximum numbers (59%) (Figure 4.6a) which was as per
expectation as the libraries were enriched for TNR. The tetra-nucleotide was found to be
second highest (25%). The other repeat motifs i.e. DNR, PNR and HNR were recovered with
less than 6%. Among the TNR, the repeat motif AAT/ATT and AAG/CTT were found in
major frequency (73.2%) followed by ATC/ATG (7.0%) and ACC/GGT (6.0%) (Figure 4.6
b). Although, we have targeted TNR SSRs but significant amount of TtNR SSRs were also
recovered and among them AAAT/ATTT motif was found in maximum frequency (51.0%).
The AG/CT and AT/AT was also recovered among DNR SSRs. The repeat motif ACC/GGT,
ATC/ATG among TNR, AAAG/CTTT, AATT/AATT among TtNR were also recovered in
good number.

87
Figure 4.6 Histogram showing distribution of SSRs based on (a) Repeat types and (b) Repeat
motifs
Considering the repeat length of SSR motif, it was noticed that most of the SSRs
(5559; 59%) had short repeat length which varied in the range of 4-10 (Figure 4.7). Two
hundred twenty eight SSRs were found in the range of 11-15 and 41 were in the range of 16-
20. There were only 16 SSRs which had repeat length of more than 20.
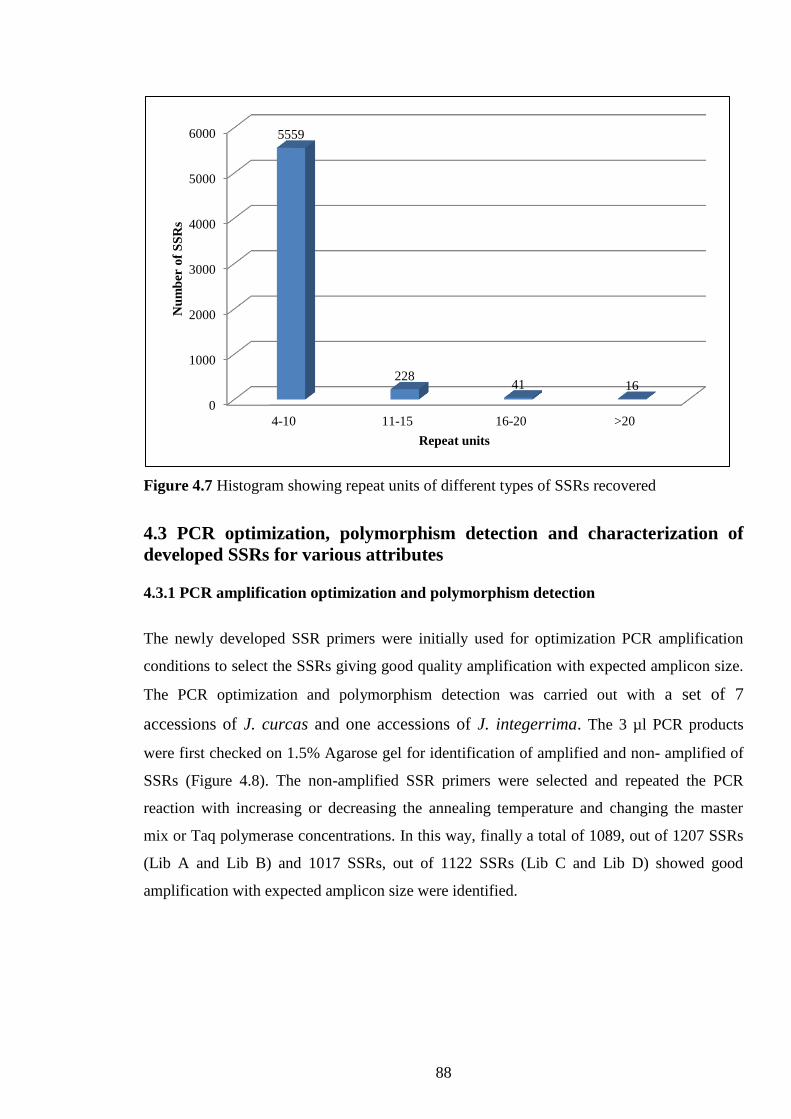
88
Figure 4.7 Histogram showing repeat units of different types of SSRs recovered
4.3 PCR optimization, polymorphism detection and characterization of
developed SSRs for various attributes
4.3.1 PCR amplification optimization and polymorphism detection
The newly developed SSR primers were initially used for optimization PCR amplification
conditions to select the SSRs giving good quality amplification with expected amplicon size.
The PCR optimization and polymorphism detection was carried out with a set of 7
accessions of J. curcas and one accessions of J. integerrima. The 3 µl PCR products
were first checked on 1.5% Agarose gel for identification of amplified and non- amplified of
SSRs (Figure 4.8). The non-amplified SSR primers were selected and repeated the PCR
reaction with increasing or decreasing the annealing temperature and changing the master
mix or Taq polymerase concentrations. In this way, finally a total of 1089, out of 1207 SSRs
(Lib A and Lib B) and 1017 SSRs, out of 1122 SSRs (Lib C and Lib D) showed good
amplification with expected amplicon size were identified.
0
1000
2000
3000
4000
5000
6000
4-10 11-15 16-20 >20
5559
228 41 16
Nu
mb
er o
f S
SR
s
Repeat units

89
Figure 4.8 A representative 1.5% Agarose gel image showing PCR amplification and non-
amplification. Sample from first 3 accessions (out of 8) were loaded for each SSR primers.
Primer 1 from well No. (1-3), Primer 2 (4-6), Primer 3 (7-9), Primer 4 (10-12), Primer 5 (13-
15), Primer 6 (16-18), Primer 7 (19-21), Primer 8 (22-24), Primer 9 (25-27), Primer 10 (28-
30), Primer 11 (31-33) and Primer 12 (34-36). All primers amplified except primer number
10th
.
The SSR primers which showed amplification of the expected band size (checked on
agarose gel) were selected for the polymorphism detection. The polymorphism
identification was carried out using polyacrylamide gel electrophoresis (PAGE)
(Figure 4.9) and automated capillary electrophoresis DNA analyzer ABI 3730xl
(Figure 4.10). Out of 574 Lib A SSRs, 106 (18.5%) were found to be polymorphic
among 7 accessions of J. curcas. The 420 (73.2%) SSRs showed monomorphic band
and the rest 48 (8.3%) failed to amplify (Table 4.11). When data was analyzed
excluding the non-toxic accession (NBJC195), the polymorphism percentage was
further reduced to 9.6% (Table 4.11). The polymorphism screening panel included
parental lines for one intraspecific and one interspecific mapping population. The
parental polymorphism screening for intraspecific population (NBJC132 x NBJC195)
revealed that 71 (12.4%) from Lib A and 446 were monomorphic, while 57 were not
amplified in both the accessions. In case of the parents of interspecific population i.e.
Chhatrapati (NBJC147) x J.integerrima, 144 (25%) SSRs were polymorphic and 177
(30.8%) were monomorphic. Similarly, 251 and 2 SSRs were not amplified with J.
100 bp ladder 1 2 3 4 5 6 7 8 9 10 11 12
13 14 15 16 17 18 19 20 21 22 23 24
25 26 27 28 29 30 31 32 33 34 35 36

90
integerrima and Chhatrapati respectively. Furthermore, the results obtained with Lib
B SSRs showed that 70 SSRs did not amplified with any of the accessions of J. curcas
and out of the rest 563, 421(75.0%) were found to be monomorphic. The polymorphic
SSRs of Lib B were found to be 142 (25.0%) with 7 accessions of J. curcas. The
number of polymorphic SSRs reduced from 142 to 74 when accession NBJC195 (non-
toxic) was excluded from the analysis (Table 4.11). A total of 108 and 187 SSRs were
found to be polymorphic among intra-specific and interspecific mapping population
respectively.
Figure 4.9 A representative 6% non-denaturing polyacrylamide gel image showing
polymorphism
Figure 4.10 A representative snapshots from GeneMapper showing polymorphism. Arrow
showing polymorphic peak.
M
700 bp
500bp
400bp
300bp
200bp
150bp
100bp
1 2 3 4 5 6 7 8 9 10 11 12 13 14

91
Table 4.11 Polymorphism screening details of SSRs with different accessions of J. curcas
and mapping populations
Lib A SSRs Lib B SSRs
Polymorphic Monomorphic Fail Polymorphic Monomorphic Fail
Seven acc. of J. curcas 106 420 48 142 421 70
Six acc. J. curcas
(excluding NBJC195)
55 471 48 74 489 70
NBRI-J05 (NBJC132) x
EC643912 (NBJC195)*
71 446 57 108 450 75
Chhatrapati (NBJC147 x
J.integerrima#
144 177 253 187 228 218
* Parental lines of intraspecific mapping population
# Parental lines of inter-specific mapping population
Likewise, the polymorphism analysis of SSRs developed from Lib C and D showed
that out of 1122 SSRs, 447 (39.83%) were found to be polymorphic among 7 accessions of J.
curcas and 570 (50.80%) were monomorphic. The rest 105 (9.35%) SSRs either failed to
amplify or gave non-specific amplification (Table 4.12). The polymorphism analysis among
J. curcas and J. integerrima revealed that 273 (24%) SSR primers failed to amplify with J.
integerrima and 226 (20%) were found to be monomorphic. However, the polymorphic SSRs
increased from 447 to 623 (73%) with respect to J. integerrima and J.curcas (Table 4.12).
Table 4.12 Polymorphism details of 1122 SSRs developed from Lib C and D among two taxa
of Jatropha
In J.curcas In J.integerrima*
Failed/nonspecific 105 (9%) 273 (24%)
Monomorphic 570 (51%) 226 (20%)
Polymorphic 447 (40%) 623 (56%)
* Monomorphism and polymorphism with reference to J. curcas accessions

92
4.3.2 Statistical analysis and characterization of SSRs for various attributes
In addition to the polymorphism detection, the genotypic data of polymorphic SSRs with 7
accessions of J. curcas was also subjected to various statistical analyses to assess the
potential of newly developed SSRs for further genetic studies. The 106 polymorphic Lib A
SSRs showed different degree of variability at each locus as the number of alleles varied
from 2 to 5 (JGM_A281) with an average of 2.24±0.55 alleles/SSR (Table 4.13). The major
allele frequency of polymorphic SSRs varied from 0.43 to 0.93 with an average of 0.83±0.11.
The PIC values of these polymorphic SSRs ranged between 0.12-0.63 with an average of
0.23±0.11. The maximum PIC was noticed for JGM_A281 and JGM_A326 (0.63) followed
by JGM_A244 (0.55) and JGM_A107 (0.52). Most of the SSRs (85; 53.1%) showed lower
PIC value less than 0.3 (Figure 4.11). The rest 11 SSR PIC values were found to be in the
range of 0.30-0.40 and 6 SSRs were found between 0.51-0.60. There were only four SSRs
which had PIC value in the range of 0.51-0.70 (Figure 4.11). The observed heterozygosity
(Ho) varied between 0.00 and 1.00 with an average of 0.3±0.23 and expected heterozygosity
(He) or gene diversity varied from 0.12 to 0.65 with an average of 0.24±0.11 (Table.4.13).
The maximum heterozygosity (He) was noticed for the JGM_A244, JGM_A326 and
JGM_A577. The maximum gene diversity (0.65) was found for the JGM_A236
Table 4.13 Polymorphism features of 106 newly developed SSRs (Lib A) in J. curcas
S.N.
Marker
major allele
frequency Allele No.
Gene
Diversity Heterozygosity PIC
1. JGM_A102 0.86 2 0.21 0.00 0.21
2. JGM_A105 0.86 2 0.21 0.00 0.21
3. JGM_A107 0.57 4 0.51 0.14 0.52
4. JGM_A112 0.86 2 0.21 0.00 0.21
5. JGM_A113 0.79 3 0.32 0.14 0.33
6. JGM_A115 0.93 2 0.12 0.14 0.12
7. JGM_A116 0.86 2 0.21 0.00 0.21
8. JGM_A120 0.86 3 0.23 0.14 0.24
9. JGM_A121 0.86 2 0.21 0.00 0.21
10. JGM_A124 0.80 2 0.26 0.00 0.27
11. JGM_A125 0.93 2 0.12 0.14 0.12
12. JGM_A132 0.86 2 0.21 0.00 0.21
13. JGM_A141 0.86 2 0.21 0.00 0.21
14. JGM_A143 0.92 2 0.14 0.17 0.14
15. JGM_A146 0.79 3 0.32 0.14 0.33
16. JGM_A150 0.86 2 0.21 0.00 0.21
17. JGM_A151 0.71 3 0.38 0.00 0.41
18. JGM_A159 0.86 2 0.21 0.00 0.21

93
19. JGM_A160 0.86 2 0.21 0.00 0.21
20. JGM_A162 0.86 2 0.21 0.00 0.21
21. JGM_A163 0.86 2 0.21 0.00 0.21
22. JGM_A164 0.86 2 0.21 0.00 0.21
23. JGM_A172 0.79 3 0.32 0.14 0.33
24. JGM_A184 0.83 2 0.23 0.00 0.24
25. JGM_A188 0.79 3 0.32 0.14 0.33
26. JGM_A197 0.86 2 0.21 0.00 0.21
27. JGM_A203 0.86 2 0.21 0.00 0.21
28. JGM_A207 0.86 2 0.21 0.00 0.21
29. JGM_A212 0.86 2 0.21 0.00 0.21
30. JGM_A215 0.83 2 0.23 0.00 0.24
31. JGM_A219 0.86 2 0.21 0.00 0.21
32. JGM_A222 0.93 2 0.12 0.14 0.12
33. JGM_A224 0.86 2 0.21 0.00 0.21
34. JGM_A243 0.93 2 0.12 0.14 0.12
35. JGM_A244 0.43 4 0.60 1.00 0.55
36. JGM_A250 0.86 2 0.21 0.00 0.21
37. JGM_A259 0.86 2 0.21 0.00 0.21
38. JGM_A264 0.86 2 0.21 0.00 0.21
39. JGM_A266 0.86 3 0.23 0.14 0.24
40. JGM_A267 0.83 2 0.23 0.00 0.24
41. JGM_A270 0.86 2 0.21 0.00 0.21
42. JGM_A271 0.93 2 0.12 0.14 0.12
43. JGM_A277 0.86 2 0.21 0.00 0.21
44. JGM_A279 0.64 2 0.44 0.71 0.35
45. JGM_A281 0.50 5 0.62 0.71 0.63
46. JGM_A288 0.71 2 0.35 0.00 0.32
47. JGM_A290 0.93 2 0.12 0.14 0.12
48. JGM_A310 0.93 2 0.12 0.14 0.12
49. JGM_A322 0.93 2 0.12 0.14 0.12
50. JGM_A323 0.83 3 0.26 0.17 0.27
51. JGM_A326 0.43 4 0.65 1.00 0.63
52. JGM_A327 0.79 3 0.32 0.14 0.33
53. JGM_A328 0.86 2 0.21 0.00 0.21
54. JGM_A329 0.64 3 0.47 0.43 0.46
55. JGM_A330 0.93 2 0.12 0.14 0.12
56. JGM_A331 0.57 2 0.48 0.86 0.37
57. JGM_A334 0.86 2 0.21 0.00 0.21
58. JGM_A342 0.93 2 0.12 0.14 0.12
59. JGM_A351 0.93 2 0.12 0.14 0.12
60. JGM_A361 0.86 2 0.21 0.00 0.21
61. JGM_A372 0.86 2 0.21 0.00 0.21
62. JGM_A380 0.86 2 0.21 0.00 0.21
63. JGM_A384 0.93 2 0.12 0.14 0.12
64. JGM_A387 0.93 2 0.12 0.14 0.12
65. JGM_A390 0.93 2 0.12 0.14 0.12

94
66. JGM_A392 0.93 2 0.12 0.14 0.12
67. JGM_A399 0.93 2 0.12 0.14 0.12
68. JGM_A401 0.93 2 0.12 0.14 0.12
69. JGM_A406 0.86 2 0.23 0.29 0.21
70. JGM_A411 0.86 2 0.21 0.00 0.21
71. JGM_A424 0.86 2 0.21 0.00 0.21
72. JGM_A427 0.86 3 0.23 0.14 0.24
73. JGM_A428 0.79 2 0.32 0.43 0.28
74. JGM_A430 0.86 2 0.21 0.00 0.21
75. JGM_A434 0.86 2 0.21 0.00 0.21
76. JGM_A439 0.86 2 0.23 0.29 0.21
77. JGM_A444 0.93 2 0.12 0.14 0.12
78. JGM_A445 0.93 2 0.12 0.14 0.12
79. JGM_A451 0.86 2 0.21 0.00 0.21
80. JGM_A464 0.71 3 0.38 0.00 0.41
81. JGM_A468 0.86 2 0.21 0.00 0.21
82. JGM_A472 0.93 2 0.12 0.14 0.12
83. JGM_A475 0.71 3 0.38 0.00 0.41
84. JGM_A476 0.86 2 0.21 0.00 0.21
85. JGM_A484 0.86 2 0.21 0.00 0.21
86. JGM_A490 0.86 2 0.21 0.00 0.21
87. JGM_A500 0.86 2 0.21 0.00 0.21
88. JGM_A506 0.86 2 0.21 0.00 0.21
89. JGM_A513 0.86 2 0.21 0.00 0.21
90. JGM_A521 0.83 2 0.23 0.00 0.24
91. JGM_A536 0.86 2 0.21 0.00 0.21
92. JGM_A540 0.93 2 0.12 0.14 0.12
93. JGM_A553 0.86 2 0.21 0.00 0.21
94. JGM_A572 0.86 2 0.21 0.00 0.21
95. JGM_A577 0.50 3 0.55 1.00 0.46
96. JGM_A604 0.86 2 0.21 0.00 0.21
97. JGM_A615 0.86 2 0.21 0.00 0.21
98. JGM_A631 0.86 2 0.21 0.00 0.21
99. JGM_A632 0.57 2 0.48 0.86 0.37
100. JGM_A639 0.93 2 0.12 0.14 0.12
101. JGM_A650 0.64 3 0.47 0.43 0.46
102. JGM_A653 0.79 3 0.32 0.14 0.33
103. JGM_A654 0.86 2 0.21 0.00 0.21
104. JGM_A656 0.79 3 0.33 0.43 0.33
105. JGM_A658 0.86 2 0.21 0.00 0.21
106. JGM_A675 0.86 2 0.21 0.00 0.21
Range 0.43-0.93 2.0-5.0 0.12-0.65 0.00-1.00 0.12-0.63
Average±SD 0.83±0.11 2.25±0.55 0.24±0.11 0.13±0.23 0.23±0.11
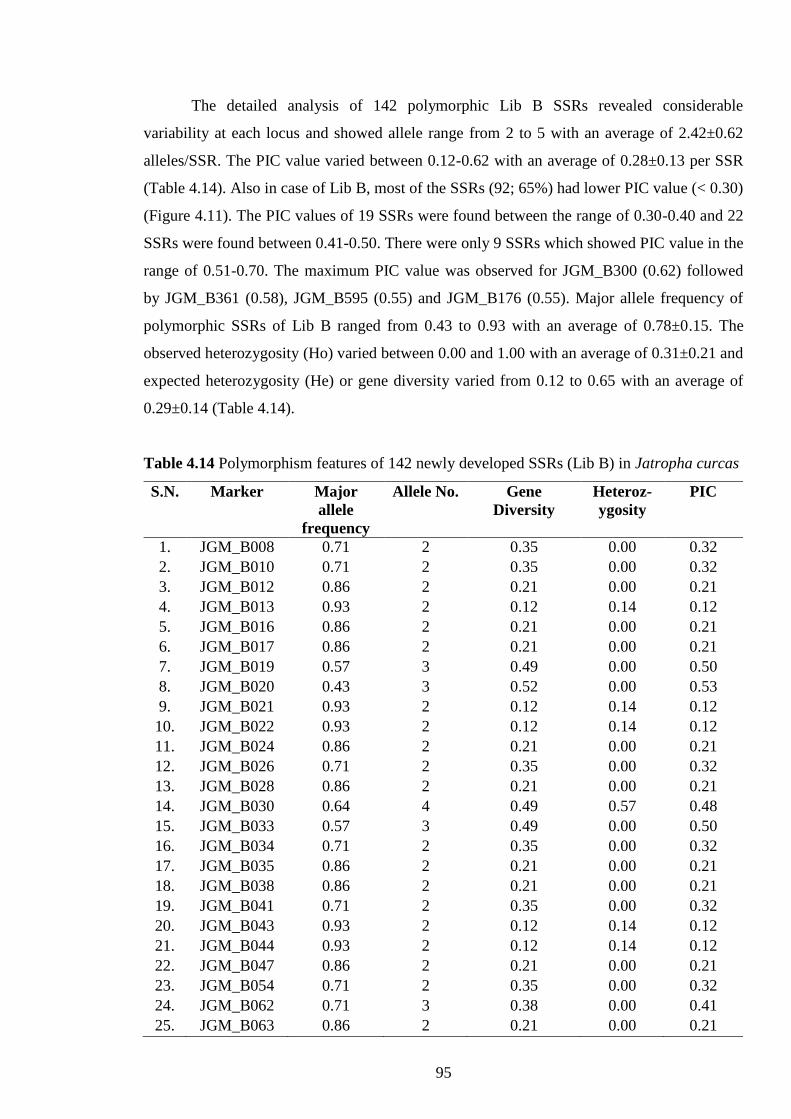
95
The detailed analysis of 142 polymorphic Lib B SSRs revealed considerable
variability at each locus and showed allele range from 2 to 5 with an average of 2.42±0.62
alleles/SSR. The PIC value varied between 0.12-0.62 with an average of 0.28±0.13 per SSR
(Table 4.14). Also in case of Lib B, most of the SSRs (92; 65%) had lower PIC value (< 0.30)
(Figure 4.11). The PIC values of 19 SSRs were found between the range of 0.30-0.40 and 22
SSRs were found between 0.41-0.50. There were only 9 SSRs which showed PIC value in the
range of 0.51-0.70. The maximum PIC value was observed for JGM_B300 (0.62) followed
by JGM_B361 (0.58), JGM_B595 (0.55) and JGM_B176 (0.55). Major allele frequency of
polymorphic SSRs of Lib B ranged from 0.43 to 0.93 with an average of 0.78±0.15. The
observed heterozygosity (Ho) varied between 0.00 and 1.00 with an average of 0.31±0.21 and
expected heterozygosity (He) or gene diversity varied from 0.12 to 0.65 with an average of
0.29±0.14 (Table 4.14).
Table 4.14 Polymorphism features of 142 newly developed SSRs (Lib B) in Jatropha curcas
S.N. Marker Major
allele
frequency
Allele No. Gene
Diversity
Heteroz-
ygosity
PIC
1. JGM_B008 0.71 2 0.35 0.00 0.32
2. JGM_B010 0.71 2 0.35 0.00 0.32
3. JGM_B012 0.86 2 0.21 0.00 0.21
4. JGM_B013 0.93 2 0.12 0.14 0.12
5. JGM_B016 0.86 2 0.21 0.00 0.21
6. JGM_B017 0.86 2 0.21 0.00 0.21
7. JGM_B019 0.57 3 0.49 0.00 0.50
8. JGM_B020 0.43 3 0.52 0.00 0.53
9. JGM_B021 0.93 2 0.12 0.14 0.12
10. JGM_B022 0.93 2 0.12 0.14 0.12
11. JGM_B024 0.86 2 0.21 0.00 0.21
12. JGM_B026 0.71 2 0.35 0.00 0.32
13. JGM_B028 0.86 2 0.21 0.00 0.21
14. JGM_B030 0.64 4 0.49 0.57 0.48
15. JGM_B033 0.57 3 0.49 0.00 0.50
16. JGM_B034 0.71 2 0.35 0.00 0.32
17. JGM_B035 0.86 2 0.21 0.00 0.21
18. JGM_B038 0.86 2 0.21 0.00 0.21
19. JGM_B041 0.71 2 0.35 0.00 0.32
20. JGM_B043 0.93 2 0.12 0.14 0.12
21. JGM_B044 0.93 2 0.12 0.14 0.12
22. JGM_B047 0.86 2 0.21 0.00 0.21
23. JGM_B054 0.71 2 0.35 0.00 0.32
24. JGM_B062 0.71 3 0.38 0.00 0.41
25. JGM_B063 0.86 2 0.21 0.00 0.21
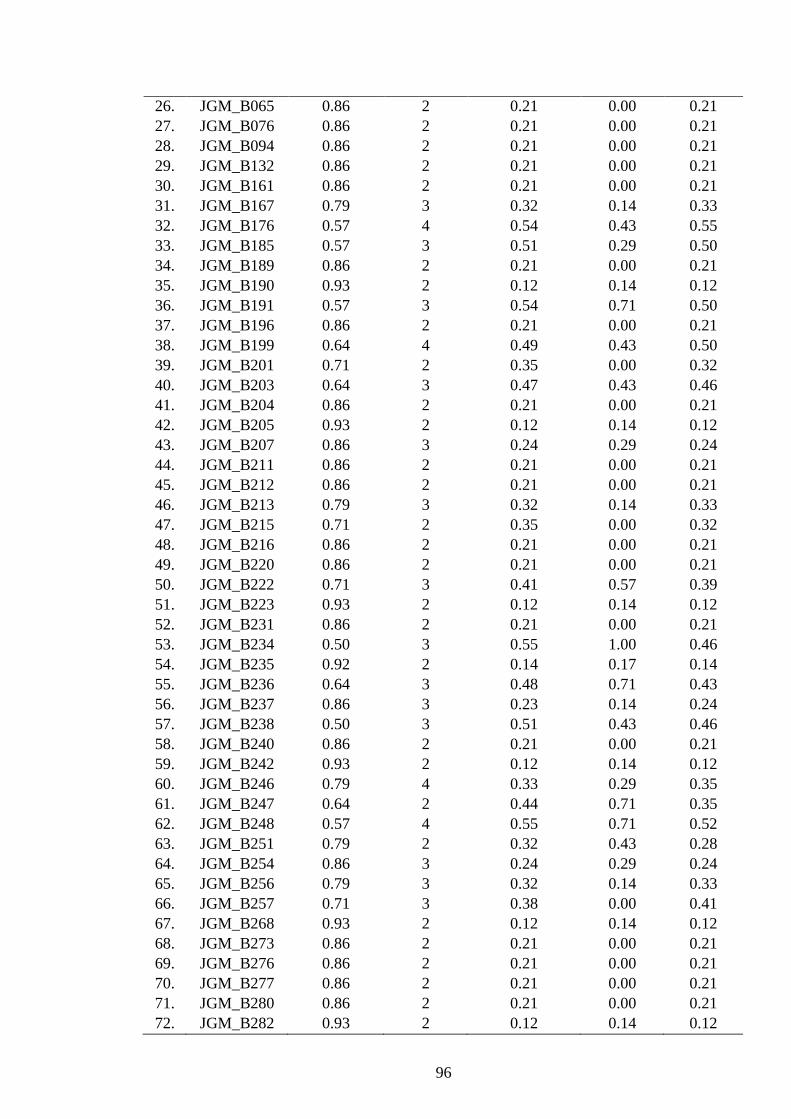
96
26. JGM_B065 0.86 2 0.21 0.00 0.21
27. JGM_B076 0.86 2 0.21 0.00 0.21
28. JGM_B094 0.86 2 0.21 0.00 0.21
29. JGM_B132 0.86 2 0.21 0.00 0.21
30. JGM_B161 0.86 2 0.21 0.00 0.21
31. JGM_B167 0.79 3 0.32 0.14 0.33
32. JGM_B176 0.57 4 0.54 0.43 0.55
33. JGM_B185 0.57 3 0.51 0.29 0.50
34. JGM_B189 0.86 2 0.21 0.00 0.21
35. JGM_B190 0.93 2 0.12 0.14 0.12
36. JGM_B191 0.57 3 0.54 0.71 0.50
37. JGM_B196 0.86 2 0.21 0.00 0.21
38. JGM_B199 0.64 4 0.49 0.43 0.50
39. JGM_B201 0.71 2 0.35 0.00 0.32
40. JGM_B203 0.64 3 0.47 0.43 0.46
41. JGM_B204 0.86 2 0.21 0.00 0.21
42. JGM_B205 0.93 2 0.12 0.14 0.12
43. JGM_B207 0.86 3 0.24 0.29 0.24
44. JGM_B211 0.86 2 0.21 0.00 0.21
45. JGM_B212 0.86 2 0.21 0.00 0.21
46. JGM_B213 0.79 3 0.32 0.14 0.33
47. JGM_B215 0.71 2 0.35 0.00 0.32
48. JGM_B216 0.86 2 0.21 0.00 0.21
49. JGM_B220 0.86 2 0.21 0.00 0.21
50. JGM_B222 0.71 3 0.41 0.57 0.39
51. JGM_B223 0.93 2 0.12 0.14 0.12
52. JGM_B231 0.86 2 0.21 0.00 0.21
53. JGM_B234 0.50 3 0.55 1.00 0.46
54. JGM_B235 0.92 2 0.14 0.17 0.14
55. JGM_B236 0.64 3 0.48 0.71 0.43
56. JGM_B237 0.86 3 0.23 0.14 0.24
57. JGM_B238 0.50 3 0.51 0.43 0.46
58. JGM_B240 0.86 2 0.21 0.00 0.21
59. JGM_B242 0.93 2 0.12 0.14 0.12
60. JGM_B246 0.79 4 0.33 0.29 0.35
61. JGM_B247 0.64 2 0.44 0.71 0.35
62. JGM_B248 0.57 4 0.55 0.71 0.52
63. JGM_B251 0.79 2 0.32 0.43 0.28
64. JGM_B254 0.86 3 0.24 0.29 0.24
65. JGM_B256 0.79 3 0.32 0.14 0.33
66. JGM_B257 0.71 3 0.38 0.00 0.41
67. JGM_B268 0.93 2 0.12 0.14 0.12
68. JGM_B273 0.86 2 0.21 0.00 0.21
69. JGM_B276 0.86 2 0.21 0.00 0.21
70. JGM_B277 0.86 2 0.21 0.00 0.21
71. JGM_B280 0.86 2 0.21 0.00 0.21
72. JGM_B282 0.93 2 0.12 0.14 0.12
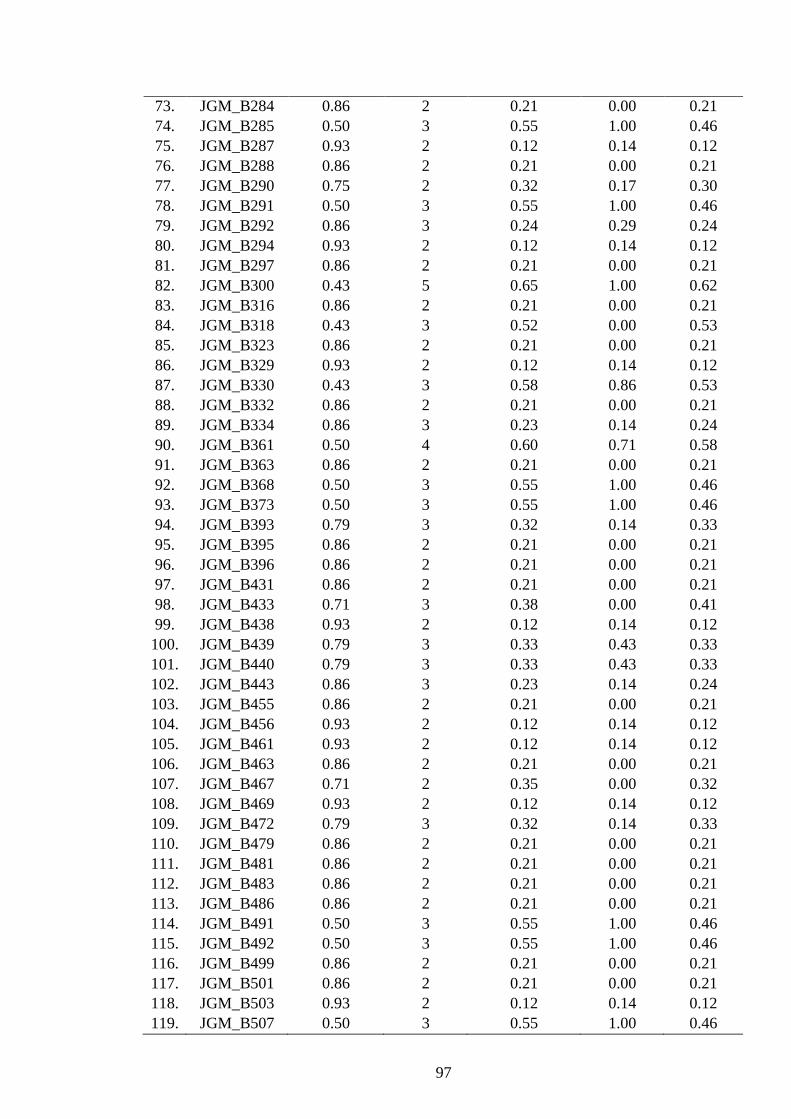
97
73. JGM_B284 0.86 2 0.21 0.00 0.21
74. JGM_B285 0.50 3 0.55 1.00 0.46
75. JGM_B287 0.93 2 0.12 0.14 0.12
76. JGM_B288 0.86 2 0.21 0.00 0.21
77. JGM_B290 0.75 2 0.32 0.17 0.30
78. JGM_B291 0.50 3 0.55 1.00 0.46
79. JGM_B292 0.86 3 0.24 0.29 0.24
80. JGM_B294 0.93 2 0.12 0.14 0.12
81. JGM_B297 0.86 2 0.21 0.00 0.21
82. JGM_B300 0.43 5 0.65 1.00 0.62
83. JGM_B316 0.86 2 0.21 0.00 0.21
84. JGM_B318 0.43 3 0.52 0.00 0.53
85. JGM_B323 0.86 2 0.21 0.00 0.21
86. JGM_B329 0.93 2 0.12 0.14 0.12
87. JGM_B330 0.43 3 0.58 0.86 0.53
88. JGM_B332 0.86 2 0.21 0.00 0.21
89. JGM_B334 0.86 3 0.23 0.14 0.24
90. JGM_B361 0.50 4 0.60 0.71 0.58
91. JGM_B363 0.86 2 0.21 0.00 0.21
92. JGM_B368 0.50 3 0.55 1.00 0.46
93. JGM_B373 0.50 3 0.55 1.00 0.46
94. JGM_B393 0.79 3 0.32 0.14 0.33
95. JGM_B395 0.86 2 0.21 0.00 0.21
96. JGM_B396 0.86 2 0.21 0.00 0.21
97. JGM_B431 0.86 2 0.21 0.00 0.21
98. JGM_B433 0.71 3 0.38 0.00 0.41
99. JGM_B438 0.93 2 0.12 0.14 0.12
100. JGM_B439 0.79 3 0.33 0.43 0.33
101. JGM_B440 0.79 3 0.33 0.43 0.33
102. JGM_B443 0.86 3 0.23 0.14 0.24
103. JGM_B455 0.86 2 0.21 0.00 0.21
104. JGM_B456 0.93 2 0.12 0.14 0.12
105. JGM_B461 0.93 2 0.12 0.14 0.12
106. JGM_B463 0.86 2 0.21 0.00 0.21
107. JGM_B467 0.71 2 0.35 0.00 0.32
108. JGM_B469 0.93 2 0.12 0.14 0.12
109. JGM_B472 0.79 3 0.32 0.14 0.33
110. JGM_B479 0.86 2 0.21 0.00 0.21
111. JGM_B481 0.86 2 0.21 0.00 0.21
112. JGM_B483 0.86 2 0.21 0.00 0.21
113. JGM_B486 0.86 2 0.21 0.00 0.21
114. JGM_B491 0.50 3 0.55 1.00 0.46
115. JGM_B492 0.50 3 0.55 1.00 0.46
116. JGM_B499 0.86 2 0.21 0.00 0.21
117. JGM_B501 0.86 2 0.21 0.00 0.21
118. JGM_B503 0.93 2 0.12 0.14 0.12
119. JGM_B507 0.50 3 0.55 1.00 0.46

98
120. JGM_B512 0.86 2 0.21 0.00 0.21
121. JGM_B516 0.93 2 0.12 0.14 0.12
122. JGM_B518 0.86 3 0.24 0.29 0.24
123. JGM_B524 0.86 3 0.23 0.14 0.24
124. JGM_B527 0.86 2 0.21 0.00 0.21
125. JGM_B534 0.50 3 0.55 1.00 0.46
126. JGM_B548 0.86 2 0.21 0.00 0.21
127. JGM_B558 0.93 2 0.12 0.14 0.12
128. JGM_B571 0.86 2 0.21 0.00 0.21
129. JGM_B585 0.93 2 0.12 0.14 0.12
130. JGM_B586 0.79 2 0.32 0.43 0.28
131. JGM_B589 0.86 2 0.21 0.00 0.21
132. JGM_B590 0.86 3 0.23 0.14 0.24
133. JGM_B594 0.86 3 0.23 0.14 0.24
134. JGM_B595 0.43 4 0.60 1.00 0.55
135. JGM_B603 0.86 2 0.21 0.00 0.21
136. JGM_B617 0.93 2 0.12 0.14 0.12
137. JGM_B620 0.86 3 0.23 0.14 0.24
138. JGM_B623 0.86 3 0.24 0.29 0.24
139. JGM_B625 0.86 2 0.21 0.00 0.21
140. JGM_B627 0.50 3 0.55 1.00 0.46
141. JGM_B629 0.79 2 0.30 0.14 0.28
142. JGM_B631 0.43 3 0.58 0.86 0.53
Range 0.43-0.93 2.0-5.0 0.12-0.65 0.00-1.00 0.12-0.62
Average±SD 0.78±0.15 2.43±0.62 0.29±0.14 0.21±0.31 0.28±0.13
Figure 4.11 PIC distribution of 248 polymorphic SSR loci (106 from Lib A and 142 from
Lib B) calculated from 7 accessions of J. curcas including non-toxic accession
23
62
11
6 2 2
24
68
19 22
8
1
0
10
20
30
40
50
60
70
80
0.10-0.20 0.21-0.30 0.30-0.40 0.41-0.50 0.51-0.60 0.61-0.70
No
. o
f p
oly
mo
rph
ic S
SR
s
Range of PIC value
Lib A
Lib B
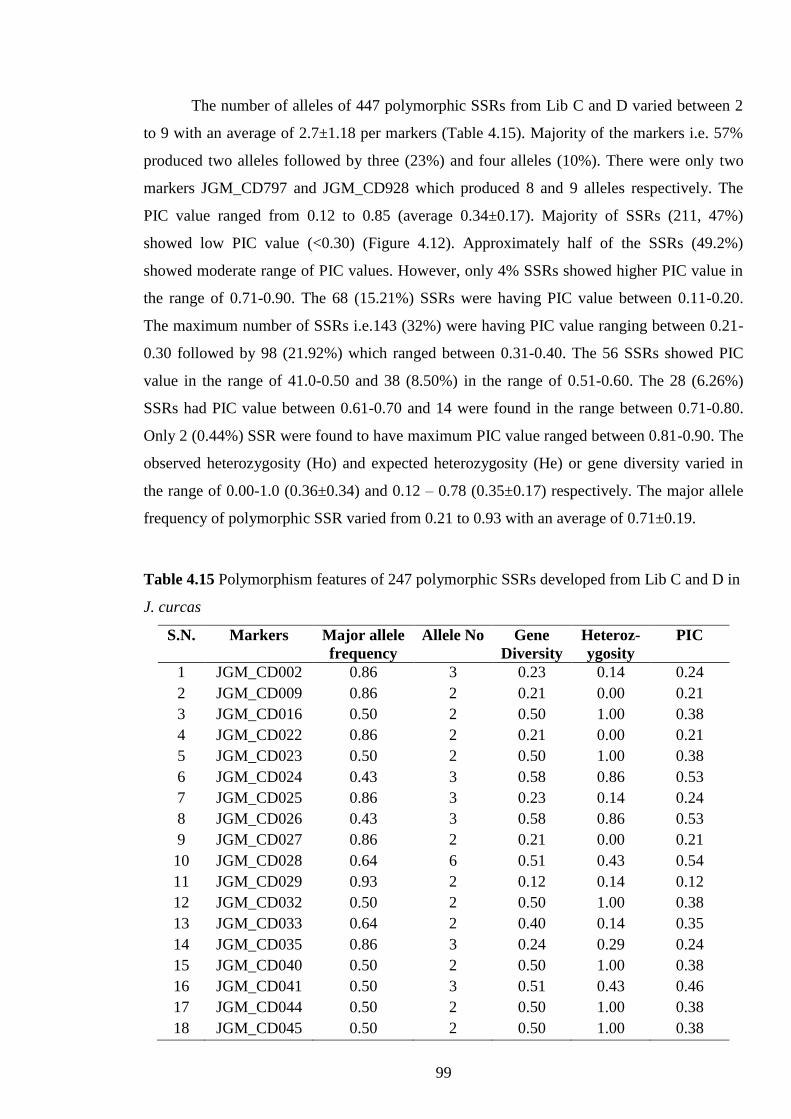
99
The number of alleles of 447 polymorphic SSRs from Lib C and D varied between 2
to 9 with an average of 2.7±1.18 per markers (Table 4.15). Majority of the markers i.e. 57%
produced two alleles followed by three (23%) and four alleles (10%). There were only two
markers JGM_CD797 and JGM_CD928 which produced 8 and 9 alleles respectively. The
PIC value ranged from 0.12 to 0.85 (average 0.34±0.17). Majority of SSRs (211, 47%)
showed low PIC value (<0.30) (Figure 4.12). Approximately half of the SSRs (49.2%)
showed moderate range of PIC values. However, only 4% SSRs showed higher PIC value in
the range of 0.71-0.90. The 68 (15.21%) SSRs were having PIC value between 0.11-0.20.
The maximum number of SSRs i.e.143 (32%) were having PIC value ranging between 0.21-
0.30 followed by 98 (21.92%) which ranged between 0.31-0.40. The 56 SSRs showed PIC
value in the range of 41.0-0.50 and 38 (8.50%) in the range of 0.51-0.60. The 28 (6.26%)
SSRs had PIC value between 0.61-0.70 and 14 were found in the range between 0.71-0.80.
Only 2 (0.44%) SSR were found to have maximum PIC value ranged between 0.81-0.90. The
observed heterozygosity (Ho) and expected heterozygosity (He) or gene diversity varied in
the range of 0.00-1.0 (0.36±0.34) and 0.12 – 0.78 (0.35±0.17) respectively. The major allele
frequency of polymorphic SSR varied from 0.21 to 0.93 with an average of 0.71±0.19.
Table 4.15 Polymorphism features of 247 polymorphic SSRs developed from Lib C and D in
J. curcas
S.N. Markers Major allele
frequency
Allele No Gene
Diversity
Heteroz-
ygosity
PIC
1 JGM_CD002 0.86 3 0.23 0.14 0.24
2 JGM_CD009 0.86 2 0.21 0.00 0.21
3 JGM_CD016 0.50 2 0.50 1.00 0.38
4 JGM_CD022 0.86 2 0.21 0.00 0.21
5 JGM_CD023 0.50 2 0.50 1.00 0.38
6 JGM_CD024 0.43 3 0.58 0.86 0.53
7 JGM_CD025 0.86 3 0.23 0.14 0.24
8 JGM_CD026 0.43 3 0.58 0.86 0.53
9 JGM_CD027 0.86 2 0.21 0.00 0.21
10 JGM_CD028 0.64 6 0.51 0.43 0.54
11 JGM_CD029 0.93 2 0.12 0.14 0.12
12 JGM_CD032 0.50 2 0.50 1.00 0.38
13 JGM_CD033 0.64 2 0.40 0.14 0.35
14 JGM_CD035 0.86 3 0.24 0.29 0.24
15 JGM_CD040 0.50 2 0.50 1.00 0.38
16 JGM_CD041 0.50 3 0.51 0.43 0.46
17 JGM_CD044 0.50 2 0.50 1.00 0.38
18 JGM_CD045 0.50 2 0.50 1.00 0.38

100
19 JGM_CD046 0.50 2 0.50 1.00 0.38
20 JGM_CD062 0.86 3 0.23 0.14 0.24
21 JGM_CD064 0.86 2 0.21 0.00 0.21
22 JGM_CD066 0.50 2 0.50 1.00 0.38
23 JGM_CD071 0.86 2 0.21 0.00 0.21
24 JGM_CD073 0.50 2 0.50 1.00 0.38
25 JGM_CD076 0.71 4 0.40 0.14 0.43
26 JGM_CD077 0.64 4 0.47 0.29 0.48
27 JGM_CD079 0.86 3 0.23 0.14 0.24
28 JGM_CD083 0.50 2 0.50 1.00 0.38
29 JGM_CD091 0.71 2 0.35 0.00 0.32
30 JGM_CD092 0.86 2 0.21 0.00 0.21
31 JGM_CD102 0.50 2 0.50 1.00 0.38
32 JGM_CD104 0.86 2 0.21 0.00 0.21
33 JGM_CD105 0.86 2 0.21 0.00 0.21
34 JGM_CD109 0.86 3 0.23 0.14 0.24
35 JGM_CD116 0.71 2 0.35 0.00 0.32
36 JGM_CD128 0.86 2 0.21 0.00 0.21
37 JGM_CD134 0.86 2 0.21 0.00 0.21
38 JGM_CD146 0.93 2 0.12 0.14 0.12
39 JGM_CD147 0.86 3 0.23 0.14 0.24
40 JGM_CD150 0.86 2 0.21 0.00 0.21
41 JGM_CD151 0.86 2 0.23 0.29 0.21
42 JGM_CD152 0.86 3 0.24 0.29 0.24
43 JGM_CD154 0.86 2 0.21 0.00 0.21
44 JGM_CD155 0.64 3 0.44 0.14 0.43
45 JGM_CD172 0.86 2 0.21 0.00 0.21
46 JGM_CD182 0.86 2 0.21 0.00 0.21
47 JGM_CD191 0.86 2 0.21 0.00 0.21
48 JGM_CD193 0.86 2 0.21 0.00 0.21
49 JGM_CD197 0.86 2 0.21 0.00 0.21
50 JGM_CD200 0.50 2 0.50 1.00 0.38
51 JGM_CD201 0.50 2 0.50 1.00 0.38
52 JGM_CD202 0.86 2 0.21 0.00 0.21
53 JGM_CD203 0.86 2 0.21 0.00 0.21
54 JGM_CD209 0.86 2 0.21 0.00 0.21
55 JGM_CD214 0.86 3 0.23 0.14 0.24
56 JGM_CD215 0.86 2 0.21 0.00 0.21
57 JGM_CD216 0.86 2 0.21 0.00 0.21
58 JGM_CD217 0.36 4 0.65 0.71 0.65
59 JGM_CD224 0.86 2 0.21 0.00 0.21
60 JGM_CD229 0.86 2 0.21 0.00 0.21
61 JGM_CD231 0.50 2 0.50 1.00 0.38
62 JGM_CD244 0.50 2 0.50 1.00 0.38
63 JGM_CD249 0.50 2 0.50 1.00 0.38

101
64 JGM_CD278 0.86 2 0.21 0.00 0.21
65 JGM_CD284 0.50 3 0.55 1.00 0.46
66 JGM_CD285 0.50 2 0.50 1.00 0.38
67 JGM_CD302 0.50 2 0.50 1.00 0.38
68 JGM_CD307 0.50 2 0.50 1.00 0.38
69 JGM_CD310 0.86 3 0.23 0.14 0.24
70 JGM_CD323 0.93 2 0.12 0.14 0.12
71 JGM_CD325 0.86 2 0.21 0.00 0.21
72 JGM_CD329 0.71 3 0.38 0.00 0.41
73 JGM_CD330 0.86 2 0.21 0.00 0.21
74 JGM_CD338 0.71 3 0.38 0.00 0.41
75 JGM_CD345 0.86 2 0.21 0.00 0.21
76 JGM_CD346 0.86 2 0.21 0.00 0.21
77 JGM_CD351 0.86 2 0.21 0.00 0.21
78 JGM_CD353 0.86 2 0.21 0.00 0.21
79 JGM_CD359 0.86 2 0.21 0.00 0.21
80 JGM_CD362 0.86 2 0.21 0.00 0.21
81 JGM_CD367 0.50 2 0.50 1.00 0.38
82 JGM_CD368 0.50 2 0.50 1.00 0.38
83 JGM_CD370 0.43 5 0.65 1.00 0.62
84 JGM_CD386 0.71 3 0.40 0.43 0.39
85 JGM_CD387 0.57 3 0.52 0.86 0.45
86 JGM_CD388 0.93 2 0.12 0.14 0.12
87 JGM_CD391 0.93 2 0.12 0.14 0.12
88 JGM_CD394 0.57 2 0.48 0.86 0.37
89 JGM_CD404 0.93 2 0.12 0.14 0.12
90 JGM_CD406 0.64 3 0.48 0.57 0.46
91 JGM_CD411 0.93 2 0.12 0.14 0.12
92 JGM_CD414 0.71 3 0.40 0.29 0.41
93 JGM_CD416 0.86 2 0.21 0.00 0.21
94 JGM_CD418 0.43 4 0.60 1.00 0.55
95 JGM_CD420 0.64 4 0.49 0.43 0.50
96 JGM_CD421 0.86 2 0.21 0.00 0.21
97 JGM_CD422 0.64 5 0.51 0.57 0.52
98 JGM_CD423 0.64 2 0.44 0.71 0.35
99 JGM_CD425 0.71 2 0.35 0.00 0.32
100 JGM_CD432 0.57 2 0.48 0.86 0.37
101 JGM_CD433 0.86 2 0.21 0.00 0.21
102 JGM_CD435 0.71 3 0.41 0.57 0.39
103 JGM_CD445 0.93 2 0.12 0.14 0.12
104 JGM_CD452 0.86 2 0.21 0.00 0.21
105 JGM_CD453 0.86 2 0.21 0.00 0.21
106 JGM_CD454 0.71 3 0.38 0.00 0.41
107 JGM_CD455 0.71 4 0.41 0.29 0.43
108 JGM_CD457 0.50 3 0.56 0.71 0.52

102
109 JGM_CD461 0.50 3 0.55 1.00 0.46
110 JGM_CD463 0.57 3 0.51 0.29 0.50
111 JGM_CD464 0.86 2 0.23 0.29 0.21
112 JGM_CD467 0.71 3 0.38 0.00 0.41
113 JGM_CD469 0.36 4 0.65 0.71 0.65
114 JGM_CD470 0.93 2 0.12 0.14 0.12
115 JGM_CD476 0.71 2 0.39 0.57 0.32
116 JGM_CD477 0.93 2 0.12 0.14 0.12
117 JGM_CD480 0.86 2 0.21 0.00 0.21
118 JGM_CD481 0.86 2 0.21 0.00 0.21
119 JGM_CD486 0.50 3 0.56 0.71 0.52
120 JGM_CD494 0.93 2 0.12 0.14 0.12
121 JGM_CD505 0.86 2 0.21 0.00 0.21
122 JGM_CD510 0.64 2 0.42 0.43 0.35
123 JGM_CD511 0.79 3 0.32 0.14 0.33
124 JGM_CD513 0.57 2 0.48 0.86 0.37
125 JGM_CD515 0.93 2 0.12 0.14 0.12
126 JGM_CD516 0.79 2 0.30 0.14 0.28
127 JGM_CD517 0.93 2 0.12 0.14 0.12
128 JGM_CD518 0.86 2 0.23 0.29 0.21
129 JGM_CD519 0.86 2 0.21 0.00 0.21
130 JGM_CD521 0.86 2 0.21 0.00 0.21
131 JGM_CD522 0.93 2 0.12 0.14 0.12
132 JGM_CD523 0.93 2 0.12 0.14 0.12
133 JGM_CD525 0.93 2 0.12 0.14 0.12
134 JGM_CD538 0.86 2 0.21 0.00 0.21
135 JGM_CD541 0.50 2 0.50 1.00 0.38
136 JGM_CD543 0.93 2 0.12 0.14 0.12
137 JGM_CD544 0.43 3 0.58 0.86 0.53
138 JGM_CD546 0.86 2 0.23 0.29 0.21
139 JGM_CD547 0.50 3 0.56 0.71 0.52
140 JGM_CD559 0.93 2 0.12 0.14 0.12
141 JGM_CD560 0.50 2 0.50 1.00 0.38
142 JGM_CD564 0.93 2 0.12 0.14 0.12
143 JGM_CD566 0.86 2 0.21 0.00 0.21
144 JGM_CD567 0.86 2 0.21 0.00 0.21
145 JGM_CD575 0.93 2 0.12 0.14 0.12
146 JGM_CD580 0.86 2 0.23 0.29 0.21
147 JGM_CD582 0.79 2 0.30 0.14 0.28
148 JGM_CD584 0.93 2 0.12 0.14 0.12
149 JGM_CD587 0.50 2 0.50 1.00 0.38
150 JGM_CD593 0.86 2 0.21 0.00 0.21
151 JGM_CD598 0.86 2 0.23 0.29 0.21
152 JGM_CD600 0.64 4 0.50 0.57 0.50
153 JGM_CD601 0.64 3 0.47 0.43 0.46

103
154 JGM_CD602 0.86 2 0.21 0.00 0.21
155 JGM_CD605 0.57 2 0.46 0.57 0.37
156 JGM_CD610 0.86 2 0.21 0.00 0.21
157 JGM_CD611 0.57 5 0.55 0.29 0.59
158 JGM_CD616 0.93 2 0.12 0.14 0.12
159 JGM_CD617 0.86 2 0.21 0.00 0.21
160 JGM_CD618 0.79 3 0.33 0.43 0.33
161 JGM_CD619 0.71 4 0.41 0.29 0.43
162 JGM_CD620 0.86 3 0.23 0.14 0.24
163 JGM_CD621 0.79 3 0.32 0.14 0.33
164 JGM_CD622 0.93 2 0.12 0.14 0.12
165 JGM_CD623 0.93 2 0.12 0.14 0.12
166 JGM_CD624 0.50 3 0.55 1.00 0.46
167 JGM_CD628 0.57 3 0.51 0.71 0.45
168 JGM_CD630 0.67 2 0.30 0.00 0.35
169 JGM_CD631 0.79 3 0.32 0.29 0.33
170 JGM_CD632 0.36 5 0.67 0.86 0.67
171 JGM_CD633 0.57 3 0.47 0.14 0.45
172 JGM_CD634 0.86 2 0.21 0.00 0.21
173 JGM_CD635 0.50 3 0.54 0.43 0.52
174 JGM_CD636 0.50 2 0.50 1.00 0.38
175 JGM_CD640 0.57 2 0.48 0.86 0.37
176 JGM_CD643 0.86 2 0.21 0.00 0.21
177 JGM_CD644 0.38 4 0.57 0.50 0.63
178 JGM_CD645 0.50 4 0.60 0.71 0.58
179 JGM_CD648 0.50 4 0.60 0.43 0.62
180 JGM_CD649 0.93 2 0.12 0.14 0.12
181 JGM_CD650 0.29 6 0.73 0.71 0.77
182 JGM_CD651 0.86 2 0.23 0.29 0.21
183 JGM_CD659 0.93 2 0.12 0.14 0.12
184 JGM_CD663 0.50 2 0.50 1.00 0.38
185 JGM_CD665 0.50 3 0.54 0.86 0.46
186 JGM_CD674 0.93 2 0.12 0.14 0.12
187 JGM_CD675 0.36 4 0.66 0.86 0.65
188 JGM_CD676 0.86 2 0.21 0.00 0.21
189 JGM_CD677 0.86 2 0.23 0.29 0.21
190 JGM_CD678 0.33 4 0.63 0.33 0.67
191 JGM_CD681 0.86 2 0.21 0.00 0.21
192 JGM_CD683 0.64 2 0.44 0.71 0.35
193 JGM_CD684 0.86 2 0.23 0.29 0.21
194 JGM_CD687 0.86 2 0.21 0.00 0.21
195 JGM_CD688 0.43 3 0.58 0.86 0.53
196 JGM_CD691 0.88 2 0.19 0.25 0.19
197 JGM_CD697 0.57 2 0.42 0.00 0.37
198 JGM_CD698 0.79 3 0.32 0.14 0.33

104
199 JGM_CD700 0.50 5 0.62 0.71 0.63
200 JGM_CD706 0.86 2 0.21 0.00 0.21
201 JGM_CD712 0.64 2 0.44 0.71 0.35
202 JGM_CD714 0.86 2 0.21 0.00 0.21
203 JGM_CD716 0.75 2 0.28 0.00 0.30
204 JGM_CD719 0.86 2 0.21 0.00 0.21
205 JGM_CD724 0.93 2 0.12 0.14 0.12
206 JGM_CD725 0.93 2 0.12 0.14 0.12
207 JGM_CD727 0.71 2 0.39 0.57 0.32
208 JGM_CD734 0.86 2 0.21 0.00 0.21
209 JGM_CD740 0.93 2 0.12 0.14 0.12
210 JGM_CD741 0.71 2 0.39 0.57 0.32
211 JGM_CD745 0.50 3 0.56 1.00 0.51
212 JGM_CD746 0.93 2 0.12 0.14 0.12
213 JGM_CD747 0.50 2 0.25 0.00 0.38
214 JGM_CD748 0.93 2 0.12 0.14 0.12
215 JGM_CD749 0.64 2 0.44 0.71 0.35
216 JGM_CD750 0.71 3 0.40 0.43 0.39
217 JGM_CD758 0.86 2 0.21 0.00 0.21
218 JGM_CD760 0.93 2 0.12 0.14 0.12
219 JGM_CD762 0.36 5 0.71 1.00 0.72
220 JGM_CD766 0.86 2 0.21 0.00 0.21
221 JGM_CD769 0.86 2 0.21 0.00 0.21
222 JGM_CD770 0.43 3 0.61 0.86 0.57
223 JGM_CD771 0.86 2 0.21 0.00 0.21
224 JGM_CD772 0.57 3 0.52 0.86 0.45
225 JGM_CD774 0.92 2 0.14 0.17 0.14
226 JGM_CD775 0.64 3 0.44 0.14 0.43
227 JGM_CD777 0.50 7 0.63 0.43 0.68
228 JGM_CD778 0.93 2 0.12 0.14 0.12
229 JGM_CD779 0.93 2 0.12 0.14 0.12
230 JGM_CD780 0.86 3 0.24 0.29 0.24
231 JGM_CD782 0.64 3 0.46 0.43 0.43
232 JGM_CD783 0.50 2 0.50 1.00 0.38
233 JGM_CD784 0.86 2 0.21 0.00 0.21
234 JGM_CD786 0.79 3 0.33 0.43 0.33
235 JGM_CD787 0.93 2 0.12 0.14 0.12
236 JGM_CD788 0.71 2 0.37 0.29 0.32
237 JGM_CD790 0.71 3 0.40 0.29 0.41
238 JGM_CD792 0.71 2 0.37 0.29 0.32
239 JGM_CD793 0.50 5 0.59 0.33 0.64
240 JGM_CD794 0.86 2 0.21 0.00 0.21
241 JGM_CD795 0.71 4 0.40 0.14 0.43
242 JGM_CD796 0.64 4 0.50 0.57 0.50
243 JGM_CD797 0.36 8 0.75 0.86 0.79

105
244 JGM_CD798 0.57 5 0.58 0.71 0.59
245 JGM_CD799 0.83 3 0.26 0.17 0.27
246 JGM_CD800 0.90 2 0.16 0.20 0.16
247 JGM_CD801 0.88 2 0.19 0.25 0.19
248 JGM_CD802 0.79 2 0.30 0.14 0.28
249 JGM_CD803 0.93 2 0.12 0.14 0.12
250 JGM_CD807 0.86 2 0.21 0.00 0.21
251 JGM_CD808 0.50 2 0.25 0.00 0.38
252 JGM_CD810 0.43 3 0.57 0.29 0.57
253 JGM_CD811 0.50 5 0.61 0.43 0.65
254 JGM_CD813 0.50 3 0.50 0.50 0.51
255 JGM_CD814 0.93 2 0.12 0.14 0.12
256 JGM_CD815 0.86 2 0.21 0.00 0.21
257 JGM_CD816 0.86 2 0.21 0.00 0.21
258 JGM_CD818 0.86 2 0.21 0.00 0.21
259 JGM_CD819 0.86 2 0.23 0.29 0.21
260 JGM_CD822 0.70 3 0.40 0.40 0.41
261 JGM_CD823 0.43 5 0.66 0.71 0.67
262 JGM_CD826 0.43 4 0.60 1.00 0.55
263 JGM_CD828 0.93 2 0.12 0.14 0.12
264 JGM_CD831 0.86 2 0.21 0.00 0.21
265 JGM_CD832 0.79 4 0.33 0.29 0.35
266 JGM_CD833 0.71 3 0.39 0.14 0.39
267 JGM_CD834 0.86 2 0.21 0.00 0.21
268 JGM_CD835 0.57 4 0.51 0.14 0.52
269 JGM_CD836 0.38 4 0.57 0.50 0.63
270 JGM_CD837 0.75 2 0.28 0.00 0.30
271 JGM_CD838 0.71 2 0.37 0.29 0.32
272 JGM_CD839 0.64 2 0.44 0.71 0.35
273 JGM_CD841 0.86 2 0.21 0.00 0.21
274 JGM_CD844 0.71 4 0.43 0.57 0.43
275 JGM_CD847 0.83 2 0.26 0.33 0.24
276 JGM_CD849 0.86 2 0.23 0.29 0.21
277 JGM_CD850 0.50 2 0.50 1.00 0.38
278 JGM_CD851 0.75 2 0.35 0.50 0.30
279 JGM_CD853 0.50 5 0.61 0.43 0.65
280 JGM_CD855 0.57 3 0.47 0.14 0.45
281 JGM_CD856 0.79 3 0.32 0.14 0.33
282 JGM_CD857 0.33 6 0.70 1.00 0.71
283 JGM_CD858 0.64 3 0.48 0.71 0.43
284 JGM_CD859 0.93 2 0.12 0.14 0.12
285 JGM_CD860 0.86 2 0.21 0.00 0.21
286 JGM_CD862 0.93 2 0.12 0.14 0.12
287 JGM_CD863 0.71 2 0.39 0.57 0.32

106
288 JGM_CD864 0.71 2 0.37 0.29 0.32
289 JGM_CD866 0.71 4 0.41 0.29 0.43
290 JGM_CD867 0.64 3 0.48 0.71 0.43
291 JGM_CD868 0.93 2 0.12 0.14 0.12
292 JGM_CD869 0.50 3 0.55 1.00 0.46
293 JGM_CD870 0.86 3 0.24 0.29 0.24
294 JGM_CD871 0.67 4 0.45 0.33 0.48
295 JGM_CD872 0.86 3 0.24 0.29 0.24
296 JGM_CD873 0.33 6 0.70 1.00 0.71
297 JGM_CD874 0.57 6 0.60 0.86 0.60
298 JGM_CD875 0.36 7 0.73 0.71 0.77
299 JGM_CD876 0.64 3 0.47 0.43 0.46
300 JGM_CD877 0.50 5 0.58 0.29 0.60
301 JGM_CD878 0.71 4 0.42 0.43 0.43
302 JGM_CD879 0.36 6 0.71 1.00 0.72
303 JGM_CD880 0.86 3 0.24 0.29 0.24
304 JGM_CD881 0.79 3 0.32 0.14 0.33
305 JGM_CD882 0.43 5 0.65 1.00 0.62
306 JGM_CD886 0.86 2 0.21 0.00 0.21
307 JGM_CD887 0.33 6 0.67 0.33 0.75
308 JGM_CD888 0.86 2 0.21 0.00 0.21
309 JGM_CD889 0.36 5 0.70 1.00 0.69
310 JGM_CD890 0.50 4 0.58 0.14 0.62
311 JGM_CD892 0.86 2 0.21 0.00 0.21
312 JGM_CD893 0.57 3 0.53 0.57 0.50
313 JGM_CD894 0.57 2 0.48 0.86 0.37
314 JGM_CD895 0.93 2 0.12 0.14 0.12
315 JGM_CD896 0.93 2 0.12 0.14 0.12
316 JGM_CD897 0.86 3 0.24 0.29 0.24
317 JGM_CD899 0.93 2 0.12 0.14 0.12
318 JGM_CD902 0.93 2 0.12 0.14 0.12
319 JGM_CD903 0.50 3 0.52 0.57 0.46
320 JGM_CD904 0.79 3 0.33 0.43 0.33
321 JGM_CD905 0.86 2 0.23 0.29 0.21
322 JGM_CD906 0.50 2 0.25 0.00 0.38
323 JGM_CD907 0.42 5 0.63 0.33 0.68
324 JGM_CD908 0.86 2 0.23 0.29 0.21
325 JGM_CD909 0.83 2 0.26 0.33 0.24
326 JGM_CD910 0.83 3 0.27 0.33 0.27
327 JGM_CD911 0.29 6 0.71 0.29 0.78
328 JGM_CD912 0.83 3 0.27 0.33 0.27
329 JGM_CD913 0.64 5 0.51 0.57 0.52
330 JGM_CD914 0.29 6 0.72 0.71 0.75
331 JGM_CD915 0.57 4 0.55 0.71 0.52
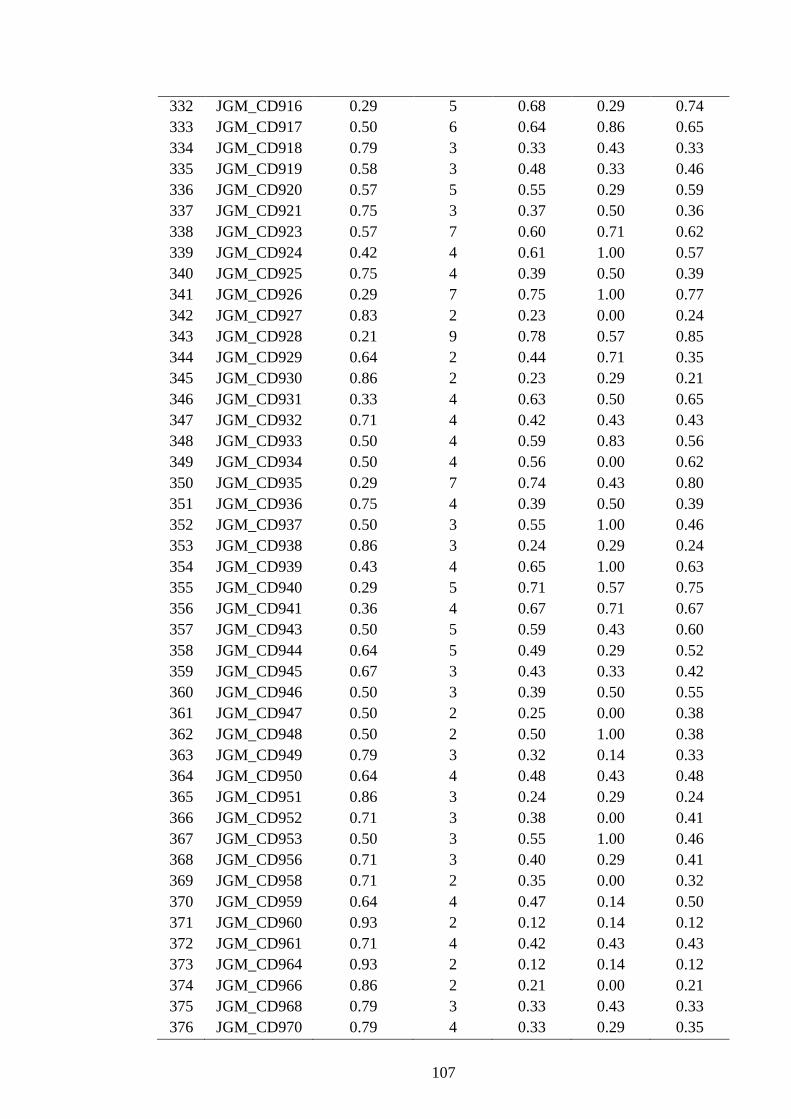
107
332 JGM_CD916 0.29 5 0.68 0.29 0.74
333 JGM_CD917 0.50 6 0.64 0.86 0.65
334 JGM_CD918 0.79 3 0.33 0.43 0.33
335 JGM_CD919 0.58 3 0.48 0.33 0.46
336 JGM_CD920 0.57 5 0.55 0.29 0.59
337 JGM_CD921 0.75 3 0.37 0.50 0.36
338 JGM_CD923 0.57 7 0.60 0.71 0.62
339 JGM_CD924 0.42 4 0.61 1.00 0.57
340 JGM_CD925 0.75 4 0.39 0.50 0.39
341 JGM_CD926 0.29 7 0.75 1.00 0.77
342 JGM_CD927 0.83 2 0.23 0.00 0.24
343 JGM_CD928 0.21 9 0.78 0.57 0.85
344 JGM_CD929 0.64 2 0.44 0.71 0.35
345 JGM_CD930 0.86 2 0.23 0.29 0.21
346 JGM_CD931 0.33 4 0.63 0.50 0.65
347 JGM_CD932 0.71 4 0.42 0.43 0.43
348 JGM_CD933 0.50 4 0.59 0.83 0.56
349 JGM_CD934 0.50 4 0.56 0.00 0.62
350 JGM_CD935 0.29 7 0.74 0.43 0.80
351 JGM_CD936 0.75 4 0.39 0.50 0.39
352 JGM_CD937 0.50 3 0.55 1.00 0.46
353 JGM_CD938 0.86 3 0.24 0.29 0.24
354 JGM_CD939 0.43 4 0.65 1.00 0.63
355 JGM_CD940 0.29 5 0.71 0.57 0.75
356 JGM_CD941 0.36 4 0.67 0.71 0.67
357 JGM_CD943 0.50 5 0.59 0.43 0.60
358 JGM_CD944 0.64 5 0.49 0.29 0.52
359 JGM_CD945 0.67 3 0.43 0.33 0.42
360 JGM_CD946 0.50 3 0.39 0.50 0.55
361 JGM_CD947 0.50 2 0.25 0.00 0.38
362 JGM_CD948 0.50 2 0.50 1.00 0.38
363 JGM_CD949 0.79 3 0.32 0.14 0.33
364 JGM_CD950 0.64 4 0.48 0.43 0.48
365 JGM_CD951 0.86 3 0.24 0.29 0.24
366 JGM_CD952 0.71 3 0.38 0.00 0.41
367 JGM_CD953 0.50 3 0.55 1.00 0.46
368 JGM_CD956 0.71 3 0.40 0.29 0.41
369 JGM_CD958 0.71 2 0.35 0.00 0.32
370 JGM_CD959 0.64 4 0.47 0.14 0.50
371 JGM_CD960 0.93 2 0.12 0.14 0.12
372 JGM_CD961 0.71 4 0.42 0.43 0.43
373 JGM_CD964 0.93 2 0.12 0.14 0.12
374 JGM_CD966 0.86 2 0.21 0.00 0.21
375 JGM_CD968 0.79 3 0.33 0.43 0.33
376 JGM_CD970 0.79 4 0.33 0.29 0.35

108
377 JGM_CD972 0.50 4 0.58 0.43 0.58
378 JGM_CD973 0.57 5 0.55 0.29 0.59
379 JGM_CD976 0.86 2 0.23 0.29 0.21
380 JGM_CD977 0.93 2 0.12 0.14 0.12
381 JGM_CD978 0.50 3 0.55 1.00 0.46
382 JGM_CD979 0.71 3 0.40 0.29 0.41
383 JGM_CD980 0.79 2 0.32 0.43 0.28
384 JGM_CD981 0.86 3 0.24 0.29 0.24
385 JGM_CD983 0.71 2 0.35 0.00 0.32
386 JGM_CD984 0.86 3 0.23 0.14 0.24
387 JGM_CD985 0.93 2 0.12 0.14 0.12
388 JGM_CD986 0.79 3 0.32 0.14 0.33
389 JGM_CD987 0.43 4 0.65 0.86 0.64
390 JGM_CD988 0.71 3 0.40 0.43 0.39
391 JGM_CD991 0.86 2 0.21 0.00 0.21
392 JGM_CD993 0.64 3 0.48 0.71 0.43
393 JGM_CD995 0.57 2 0.48 0.86 0.37
394 JGM_CD996 0.86 2 0.21 0.00 0.21
395 JGM_CD997 0.50 2 0.50 1.00 0.38
396 JGM_CD998 0.64 2 0.44 0.71 0.35
397 JGM_CD1001 0.43 4 0.63 0.86 0.60
398 JGM_CD1006 0.86 2 0.21 0.00 0.21
399 JGM_CD1008 0.93 2 0.12 0.14 0.12
400 JGM_CD1009 0.86 2 0.21 0.00 0.21
401 JGM_CD1014 0.50 3 0.60 1.00 0.55
402 JGM_CD1016 0.79 3 0.32 0.29 0.33
403 JGM_CD1018 0.93 2 0.12 0.14 0.12
404 JGM_CD1020 0.79 3 0.32 0.14 0.33
405 JGM_CD1022 0.93 2 0.12 0.14 0.12
406 JGM_CD1023 0.50 3 0.39 0.50 0.55
407 JGM_CD1026 0.57 6 0.59 0.71 0.60
408 JGM_CD1027 0.64 2 0.44 0.71 0.35
409 JGM_CD1028 0.93 2 0.12 0.14 0.12
410 JGM_CD1031 0.86 2 0.21 0.00 0.21
411 JGM_CD1032 0.86 2 0.21 0.00 0.21
412 JGM_CD1033 0.64 5 0.50 0.43 0.52
413 JGM_CD1035 0.93 2 0.12 0.14 0.12
414 JGM_CD1038 0.50 2 0.50 1.00 0.38
415 JGM_CD1042 0.93 2 0.12 0.14 0.12
416 JGM_CD1043 0.86 2 0.21 0.00 0.21
417 JGM_CD1047 0.90 2 0.16 0.20 0.16
418 JGM_CD1054 0.43 5 0.65 0.57 0.67
419 JGM_CD1057 0.64 3 0.48 0.71 0.43
420 JGM_CD1059 0.57 3 0.51 0.29 0.50
421 JGM_CD1060 0.86 3 0.23 0.14 0.24
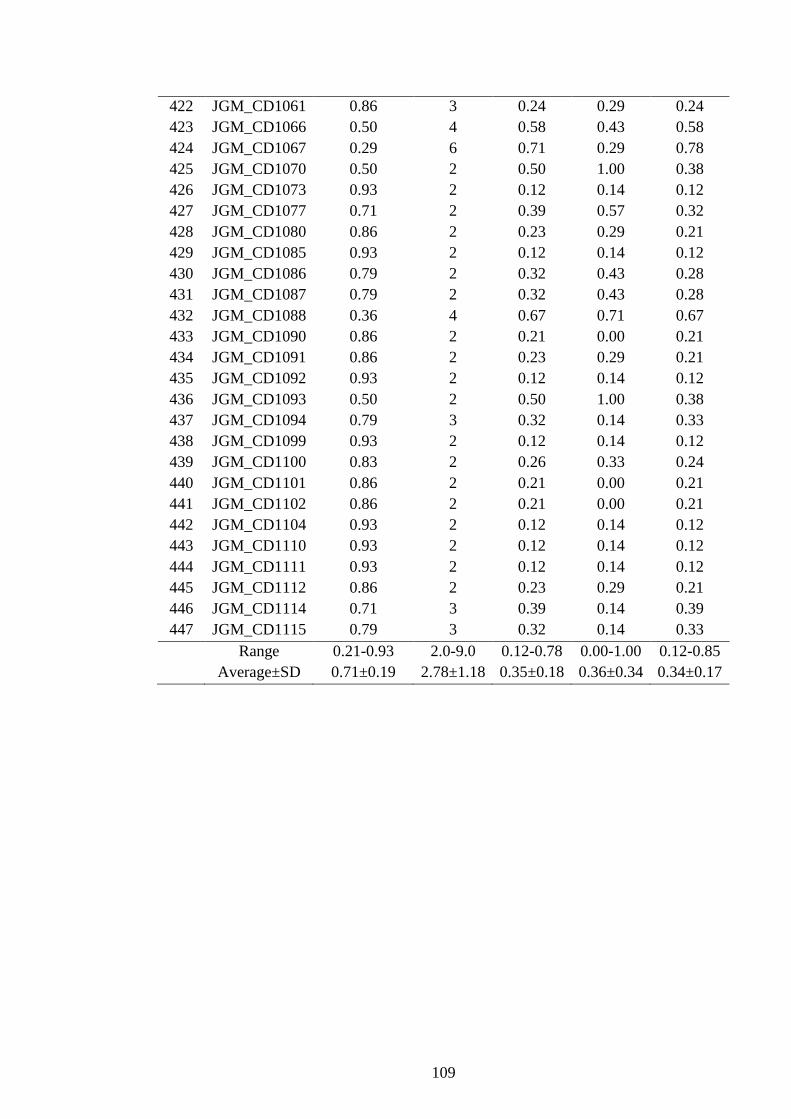
109
422 JGM_CD1061 0.86 3 0.24 0.29 0.24
423 JGM_CD1066 0.50 4 0.58 0.43 0.58
424 JGM_CD1067 0.29 6 0.71 0.29 0.78
425 JGM_CD1070 0.50 2 0.50 1.00 0.38
426 JGM_CD1073 0.93 2 0.12 0.14 0.12
427 JGM_CD1077 0.71 2 0.39 0.57 0.32
428 JGM_CD1080 0.86 2 0.23 0.29 0.21
429 JGM_CD1085 0.93 2 0.12 0.14 0.12
430 JGM_CD1086 0.79 2 0.32 0.43 0.28
431 JGM_CD1087 0.79 2 0.32 0.43 0.28
432 JGM_CD1088 0.36 4 0.67 0.71 0.67
433 JGM_CD1090 0.86 2 0.21 0.00 0.21
434 JGM_CD1091 0.86 2 0.23 0.29 0.21
435 JGM_CD1092 0.93 2 0.12 0.14 0.12
436 JGM_CD1093 0.50 2 0.50 1.00 0.38
437 JGM_CD1094 0.79 3 0.32 0.14 0.33
438 JGM_CD1099 0.93 2 0.12 0.14 0.12
439 JGM_CD1100 0.83 2 0.26 0.33 0.24
440 JGM_CD1101 0.86 2 0.21 0.00 0.21
441 JGM_CD1102 0.86 2 0.21 0.00 0.21
442 JGM_CD1104 0.93 2 0.12 0.14 0.12
443 JGM_CD1110 0.93 2 0.12 0.14 0.12
444 JGM_CD1111 0.93 2 0.12 0.14 0.12
445 JGM_CD1112 0.86 2 0.23 0.29 0.21
446 JGM_CD1114 0.71 3 0.39 0.14 0.39
447 JGM_CD1115 0.79 3 0.32 0.14 0.33
Range 0.21-0.93 2.0-9.0 0.12-0.78 0.00-1.00 0.12-0.85
Average±SD 0.71±0.19 2.78±1.18 0.35±0.18 0.36±0.34 0.34±0.17
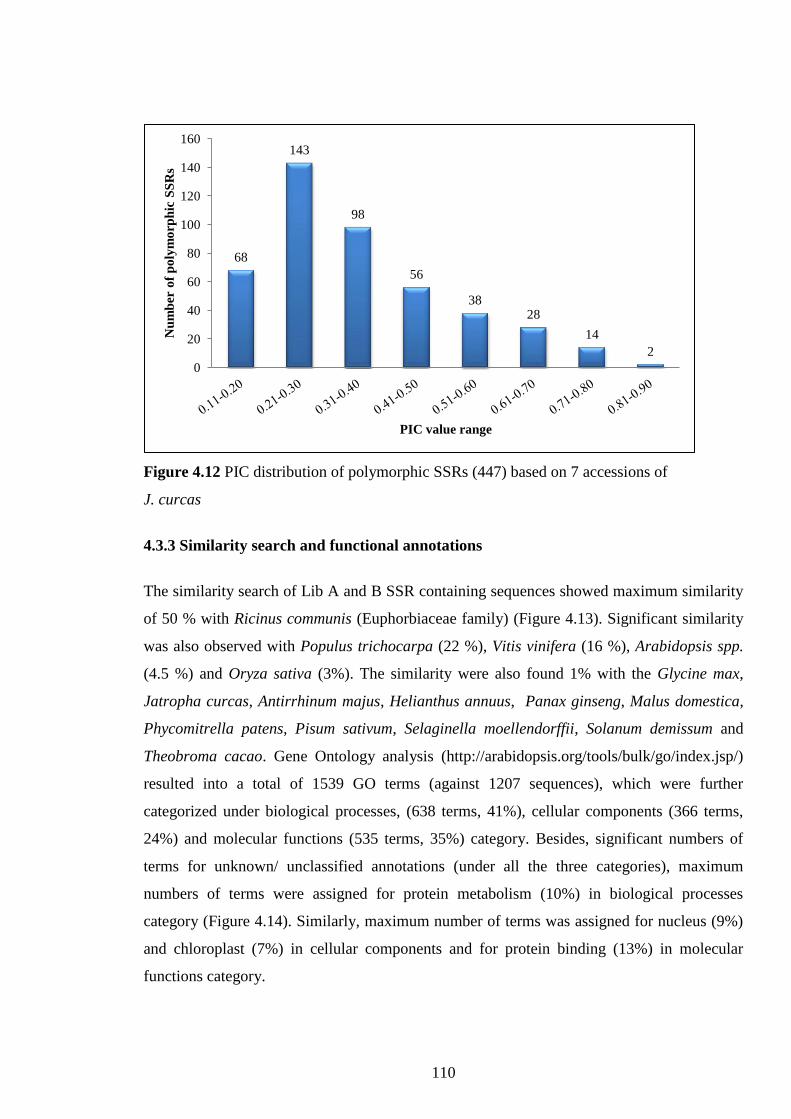
110
Figure 4.12 PIC distribution of polymorphic SSRs (447) based on 7 accessions of
J. curcas
4.3.3 Similarity search and functional annotations
The similarity search of Lib A and B SSR containing sequences showed maximum similarity
of 50 % with Ricinus communis (Euphorbiaceae family) (Figure 4.13). Significant similarity
was also observed with Populus trichocarpa (22 %), Vitis vinifera (16 %), Arabidopsis spp.
(4.5 %) and Oryza sativa (3%). The similarity were also found 1% with the Glycine max,
Jatropha curcas, Antirrhinum majus, Helianthus annuus, Panax ginseng, Malus domestica,
Phycomitrella patens, Pisum sativum, Selaginella moellendorffii, Solanum demissum and
Theobroma cacao. Gene Ontology analysis (http://arabidopsis.org/tools/bulk/go/index.jsp/)
resulted into a total of 1539 GO terms (against 1207 sequences), which were further
categorized under biological processes, (638 terms, 41%), cellular components (366 terms,
24%) and molecular functions (535 terms, 35%) category. Besides, significant numbers of
terms for unknown/ unclassified annotations (under all the three categories), maximum
numbers of terms were assigned for protein metabolism (10%) in biological processes
category (Figure 4.14). Similarly, maximum number of terms was assigned for nucleus (9%)
and chloroplast (7%) in cellular components and for protein binding (13%) in molecular
functions category.
68
143
98
56
38 28
14
2
0
20
40
60
80
100
120
140
160
Nu
mb
er o
f p
oly
mo
rph
ic S
SR
s
PIC value range
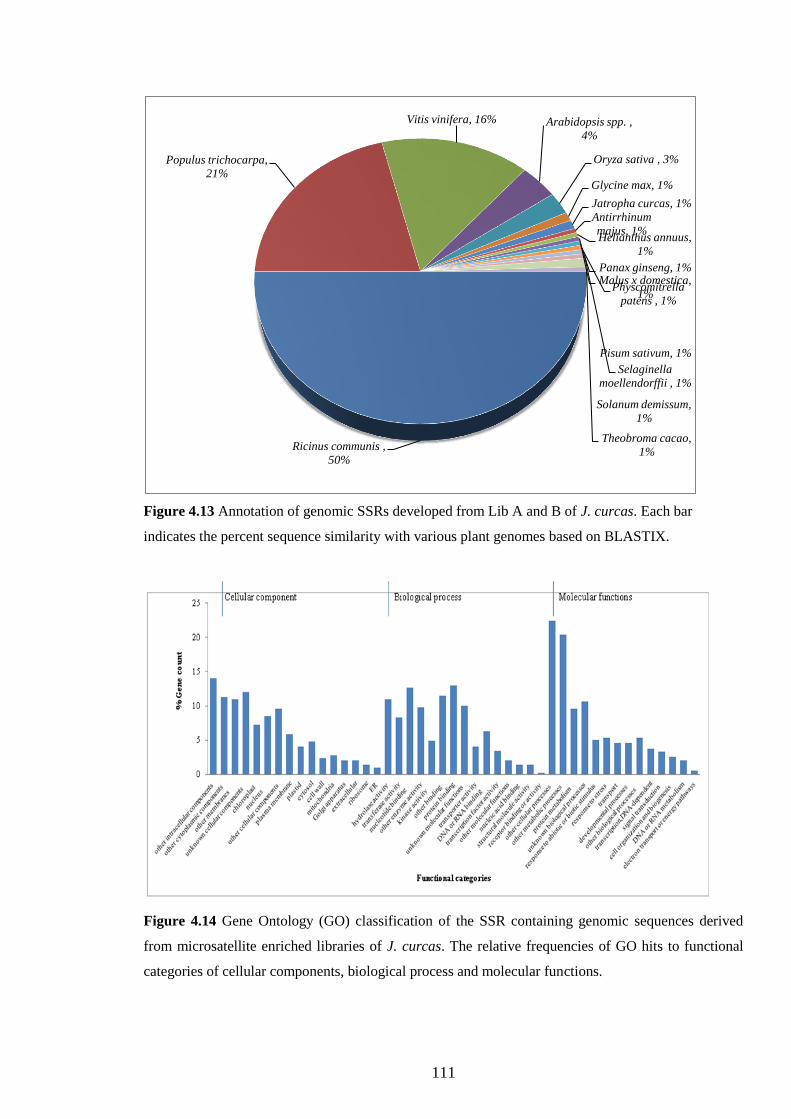
111
Figure 4.13 Annotation of genomic SSRs developed from Lib A and B of J. curcas. Each bar
indicates the percent sequence similarity with various plant genomes based on BLASTIX.
Figure 4.14 Gene Ontology (GO) classification of the SSR containing genomic sequences derived
from microsatellite enriched libraries of J. curcas. The relative frequencies of GO hits to functional
categories of cellular components, biological process and molecular functions.
Ricinus communis ,
50%
Populus trichocarpa,
21%
Vitis vinifera, 16% Arabidopsis spp. ,
4%
Oryza sativa , 3%
Glycine max, 1%
Jatropha curcas, 1%
Antirrhinum
majus, 1% Helianthus annuus,
1%
Malus x domestica,
1%
Panax ginseng, 1%
Physcomitrella
patens , 1%
Pisum sativum, 1%
Selaginella
moellendorffii , 1%
Solanum demissum,
1%
Theobroma cacao,
1%

112
The sequence similarity search of SSR containing sequences from Lib C and D was also
carried out against the Nr database (E-value<1e-5
) using the BLASTx algorithm.
The
similarity search of SSR containing sequences showed maximum similarity of 63% with
Ricinus communis (F. Euphorbiaceae) (Fig 4.15). Significant similarity was also observed
with Populus trichocarpa (19%), Vitis vinifera (9%), Glycine max (3%), J. curcas (2%) and
Medicago truncatula (2%). The similarity was also observed 1% with Arabidopsis byrata and
Arabidopsis thaliana.
Figure 4.15 Annotation of genomic SSRs developed from enriched libraries of J. curcas.
Each pie indicates the percent sequence similarity with various plant genomes based on
BLASTX

113
4.4 Study of molecular genetic diversity among indigenous and exotic
accessions of J. curcas.
4.4.1 Allelic diversity
A subset of 41 randomly selected polymorphic SSRs was amplified with 96 accessions of J.
curcas which include 70 indigenous (collections from different states of India) and 26 exotic
collections including 3 non- toxic accessions. A total of 152 alleles were produced by these
41 SSRs among the 96 accessions. A considerable variability was noticed with respect to
allele diversity as the number of alleles varied from 2 to 9 with an average of 4.0±1.9
alleles/SSR (Table 4.16). The PIC value for these 41 polymorphic SSRs with respect to 96
accessions varied from 0.01 to 0.80 with an average of 0.22±0.19 (Table 4.16). Maximum
PIC value was noticed for JGM_CD055 (0.80) followed by JGM_CD097 (0.73) and
JGM_CD094, while the lowest PIC value (0.01) was noticed for JGM_CD158, JGM_CD165,
and JGM_CD185. Majority of the SSRs (71%) showed low PIC value (<0.30) (Figure 4.16)
and there were only three SSRs which showed PIC value in between 0.61 and 0.80. The
observed heterozygosity (Ho) varied between 0.00 and 0.99 with an average of 0.16±0.27 and
expected heterozygosity (He) or gene diversity varied from 0.01 to 0.82 with an average of
0.24±0.21.
Table 4.16 Polymorphism features of 41 SSR markers surveyed over 96 accessions of
J. curcas
Sl.
No. SSR Loci
No. of
alleles PIC MAF Ho
He
1 JGM_CD002 2 0.14 0.92 0.03 0.15
2 JGM_CD007 2 0.08 0.96 0.00 0.08
3 JGM_CD010 4 0.07 0.96 0.07 0.07
4 JGM_CD011 5 0.06 0.97 0.06 0.06
5 JGM_CD021 6 0.23 0.87 0.04 0.24
6 JGM_CD026 8 0.32 0.81 0.05 0.33
7 JGM_CD029 2 0.07 0.96 0.07 0.07
8 JGM_CD031 2 0.23 0.84 0.07 0.27
9 JGM_CD033 5 0.31 0.81 0.16 0.33
10 JGM_CD036 3 0.39 0.49 0.99 0.51
11 JGM_CD041 2 0.03 0.98 0.03 0.03
12 JGM_CD044 4 0.10 0.95 0.07 0.1
13 JGM_CD046 3 0.40 0.51 0.30 0.52
14 JGM_CD048 2 0.22 0.85 0.03 0.26
15 JGM_CD050 3 0.05 0.97 0.01 0.05
16 JGM_CD055 9 0.80 0.24 0.77 0.82
17 JGM_CD069 3 0.17 0.90 0.08 0.19
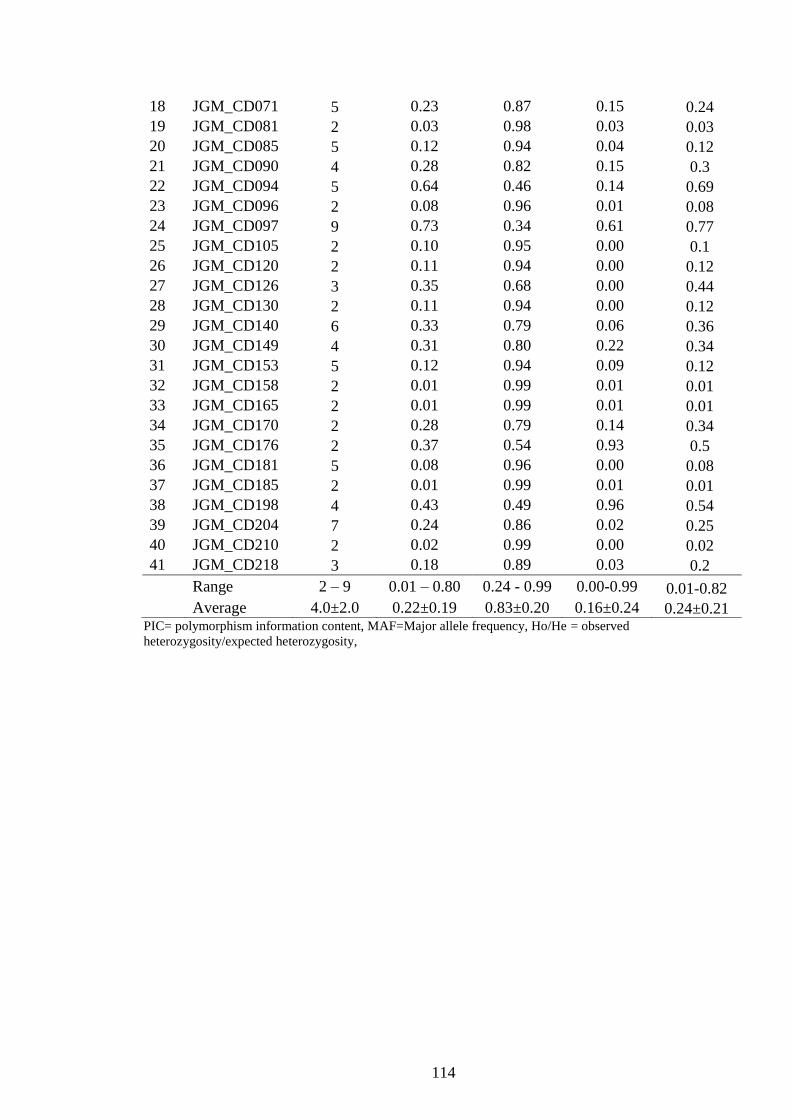
114
PIC= polymorphism information content, MAF=Major allele frequency, Ho/He = observed
heterozygosity/expected heterozygosity,
18 JGM_CD071 5 0.23 0.87 0.15 0.24
19 JGM_CD081 2 0.03 0.98 0.03 0.03
20 JGM_CD085 5 0.12 0.94 0.04 0.12
21 JGM_CD090 4 0.28 0.82 0.15 0.3
22 JGM_CD094 5 0.64 0.46 0.14 0.69
23 JGM_CD096 2 0.08 0.96 0.01 0.08
24 JGM_CD097 9 0.73 0.34 0.61 0.77
25 JGM_CD105 2 0.10 0.95 0.00 0.1
26 JGM_CD120 2 0.11 0.94 0.00 0.12
27 JGM_CD126 3 0.35 0.68 0.00 0.44
28 JGM_CD130 2 0.11 0.94 0.00 0.12
29 JGM_CD140 6 0.33 0.79 0.06 0.36
30 JGM_CD149 4 0.31 0.80 0.22 0.34
31 JGM_CD153 5 0.12 0.94 0.09 0.12
32 JGM_CD158 2 0.01 0.99 0.01 0.01
33 JGM_CD165 2 0.01 0.99 0.01 0.01
34 JGM_CD170 2 0.28 0.79 0.14 0.34
35 JGM_CD176 2 0.37 0.54 0.93 0.5
36 JGM_CD181 5 0.08 0.96 0.00 0.08
37 JGM_CD185 2 0.01 0.99 0.01 0.01
38 JGM_CD198 4 0.43 0.49 0.96 0.54
39 JGM_CD204 7 0.24 0.86 0.02 0.25
40 JGM_CD210 2 0.02 0.99 0.00 0.02
41 JGM_CD218 3 0.18 0.89 0.03 0.2
Range 2 – 9 0.01 – 0.80 0.24 - 0.99 0.00-0.99 0.01-0.82
Average 4.0±2.0 0.22±0.19 0.83±0.20 0.16±0.24 0.24±0.21
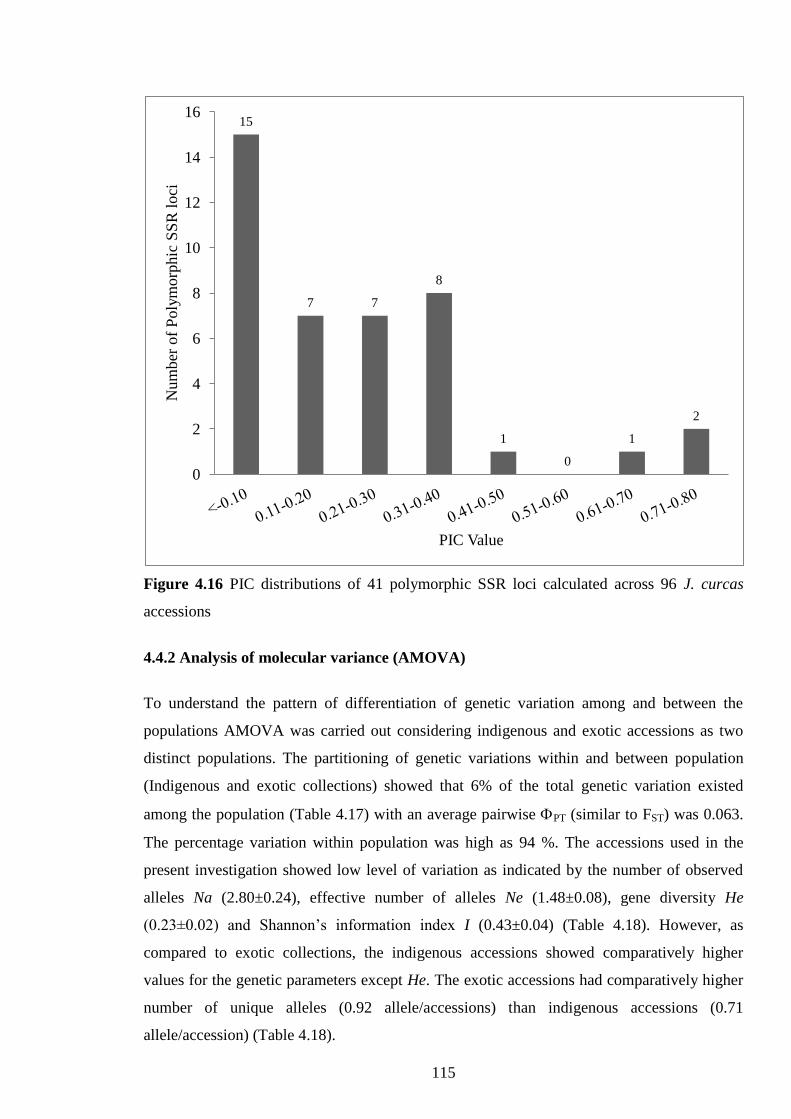
115
Figure 4.16 PIC distributions of 41 polymorphic SSR loci calculated across 96 J. curcas
accessions
4.4.2 Analysis of molecular variance (AMOVA)
To understand the pattern of differentiation of genetic variation among and between the
populations AMOVA was carried out considering indigenous and exotic accessions as two
distinct populations. The partitioning of genetic variations within and between population
(Indigenous and exotic collections) showed that 6% of the total genetic variation existed
among the population (Table 4.17) with an average pairwise PT (similar to FST) was 0.063.
The percentage variation within population was high as 94 %. The accessions used in the
present investigation showed low level of variation as indicated by the number of observed
alleles Na (2.80±0.24), effective number of alleles Ne (1.48±0.08), gene diversity He
(0.23±0.02) and Shannon’s information index I (0.43±0.04) (Table 4.18). However, as
compared to exotic collections, the indigenous accessions showed comparatively higher
values for the genetic parameters except He. The exotic accessions had comparatively higher
number of unique alleles (0.92 allele/accessions) than indigenous accessions (0.71
allele/accession) (Table 4.18).
15
7 7
8
1
0
1
2
0
2
4
6
8
10
12
14
16
Num
ber
of
Poly
mo
rphic
SS
R l
oci
PIC Value
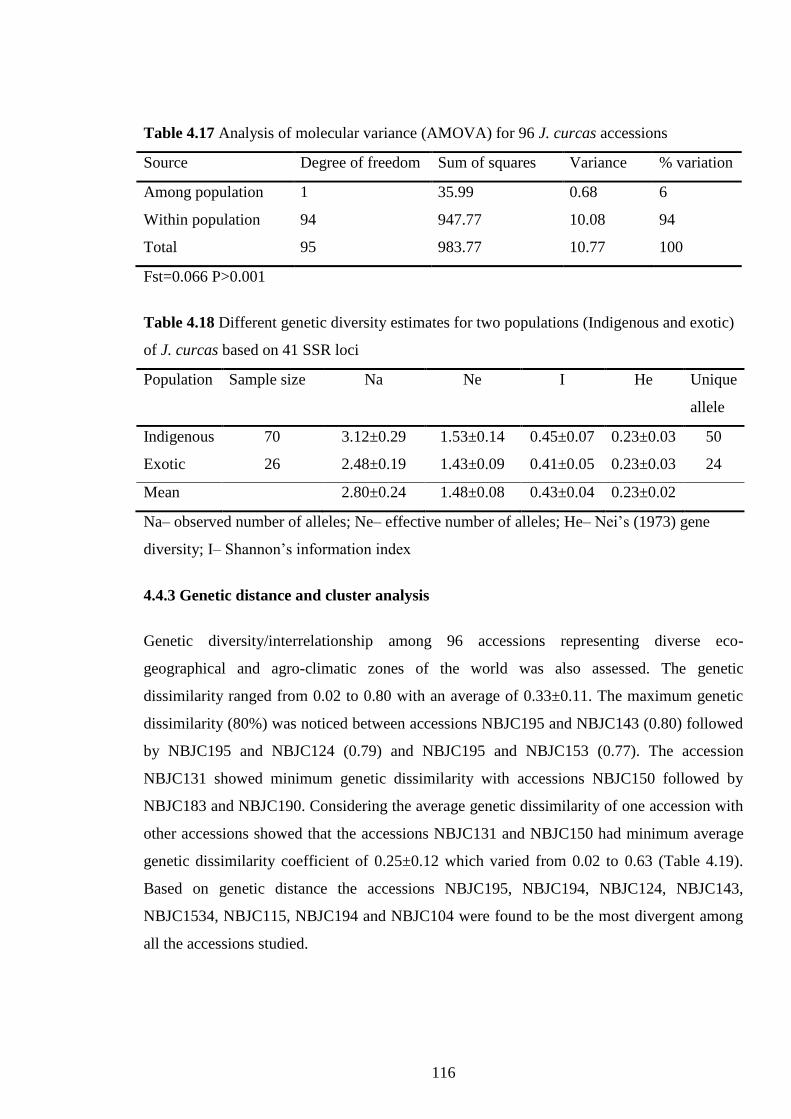
116
Table 4.17 Analysis of molecular variance (AMOVA) for 96 J. curcas accessions
Source Degree of freedom Sum of squares Variance % variation
Among population 1 35.99 0.68 6
Within population 94 947.77 10.08 94
Total 95 983.77 10.77 100
Fst=0.066 P>0.001
Table 4.18 Different genetic diversity estimates for two populations (Indigenous and exotic)
of J. curcas based on 41 SSR loci
Population Sample size Na Ne I He Unique
allele
Indigenous 70 3.12±0.29 1.53±0.14 0.45±0.07 0.23±0.03 50
Exotic 26 2.48±0.19 1.43±0.09 0.41±0.05 0.23±0.03 24
Mean 2.80±0.24 1.48±0.08 0.43±0.04 0.23±0.02
Na– observed number of alleles; Ne– effective number of alleles; He– Nei’s (1973) gene
diversity; I– Shannon’s information index
4.4.3 Genetic distance and cluster analysis
Genetic diversity/interrelationship among 96 accessions representing diverse eco-
geographical and agro-climatic zones of the world was also assessed. The genetic
dissimilarity ranged from 0.02 to 0.80 with an average of 0.33±0.11. The maximum genetic
dissimilarity (80%) was noticed between accessions NBJC195 and NBJC143 (0.80) followed
by NBJC195 and NBJC124 (0.79) and NBJC195 and NBJC153 (0.77). The accession
NBJC131 showed minimum genetic dissimilarity with accessions NBJC150 followed by
NBJC183 and NBJC190. Considering the average genetic dissimilarity of one accession with
other accessions showed that the accessions NBJC131 and NBJC150 had minimum average
genetic dissimilarity coefficient of 0.25±0.12 which varied from 0.02 to 0.63 (Table 4.19).
Based on genetic distance the accessions NBJC195, NBJC194, NBJC124, NBJC143,
NBJC1534, NBJC115, NBJC194 and NBJC104 were found to be the most divergent among
all the accessions studied.
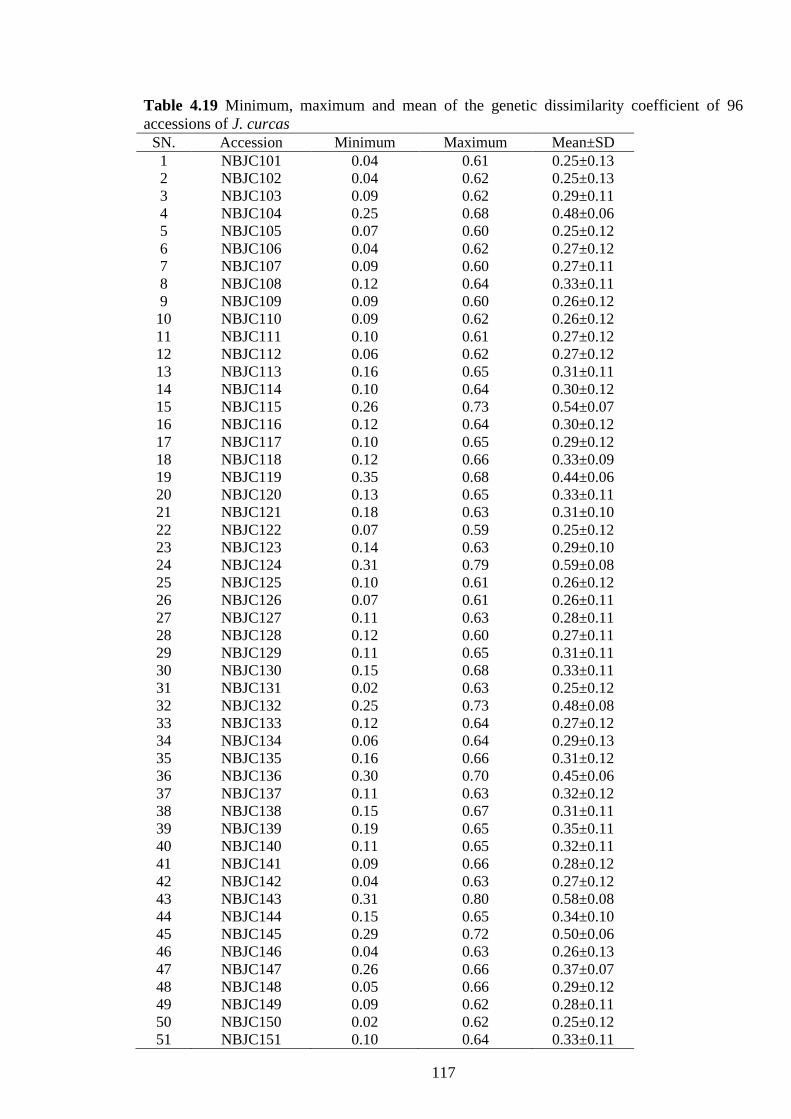
117
Table 4.19 Minimum, maximum and mean of the genetic dissimilarity coefficient of 96
accessions of J. curcas
SN. Accession Minimum Maximum Mean±SD
1 NBJC101 0.04 0.61 0.25±0.13
2 NBJC102 0.04 0.62 0.25±0.13
3 NBJC103 0.09 0.62 0.29±0.11
4 NBJC104 0.25 0.68 0.48±0.06
5 NBJC105 0.07 0.60 0.25±0.12
6 NBJC106 0.04 0.62 0.27±0.12
7 NBJC107 0.09 0.60 0.27±0.11
8 NBJC108 0.12 0.64 0.33±0.11
9 NBJC109 0.09 0.60 0.26±0.12
10 NBJC110 0.09 0.62 0.26±0.12
11 NBJC111 0.10 0.61 0.27±0.12
12 NBJC112 0.06 0.62 0.27±0.12
13 NBJC113 0.16 0.65 0.31±0.11
14 NBJC114 0.10 0.64 0.30±0.12
15 NBJC115 0.26 0.73 0.54±0.07
16 NBJC116 0.12 0.64 0.30±0.12
17 NBJC117 0.10 0.65 0.29±0.12
18 NBJC118 0.12 0.66 0.33±0.09
19 NBJC119 0.35 0.68 0.44±0.06
20 NBJC120 0.13 0.65 0.33±0.11
21 NBJC121 0.18 0.63 0.31±0.10
22 NBJC122 0.07 0.59 0.25±0.12
23 NBJC123 0.14 0.63 0.29±0.10
24 NBJC124 0.31 0.79 0.59±0.08
25 NBJC125 0.10 0.61 0.26±0.12
26 NBJC126 0.07 0.61 0.26±0.11
27 NBJC127 0.11 0.63 0.28±0.11
28 NBJC128 0.12 0.60 0.27±0.11
29 NBJC129 0.11 0.65 0.31±0.11
30 NBJC130 0.15 0.68 0.33±0.11
31 NBJC131 0.02 0.63 0.25±0.12
32 NBJC132 0.25 0.73 0.48±0.08
33 NBJC133 0.12 0.64 0.27±0.12
34 NBJC134 0.06 0.64 0.29±0.13
35 NBJC135 0.16 0.66 0.31±0.12
36 NBJC136 0.30 0.70 0.45±0.06
37 NBJC137 0.11 0.63 0.32±0.12
38 NBJC138 0.15 0.67 0.31±0.11
39 NBJC139 0.19 0.65 0.35±0.11
40 NBJC140 0.11 0.65 0.32±0.11
41 NBJC141 0.09 0.66 0.28±0.12
42 NBJC142 0.04 0.63 0.27±0.12
43 NBJC143 0.31 0.80 0.58±0.08
44 NBJC144 0.15 0.65 0.34±0.10
45 NBJC145 0.29 0.72 0.50±0.06
46 NBJC146 0.04 0.63 0.26±0.13
47 NBJC147 0.26 0.66 0.37±0.07
48 NBJC148 0.05 0.66 0.29±0.12
49 NBJC149 0.09 0.62 0.28±0.11
50 NBJC150 0.02 0.62 0.25±0.12
51 NBJC151 0.10 0.64 0.33±0.11
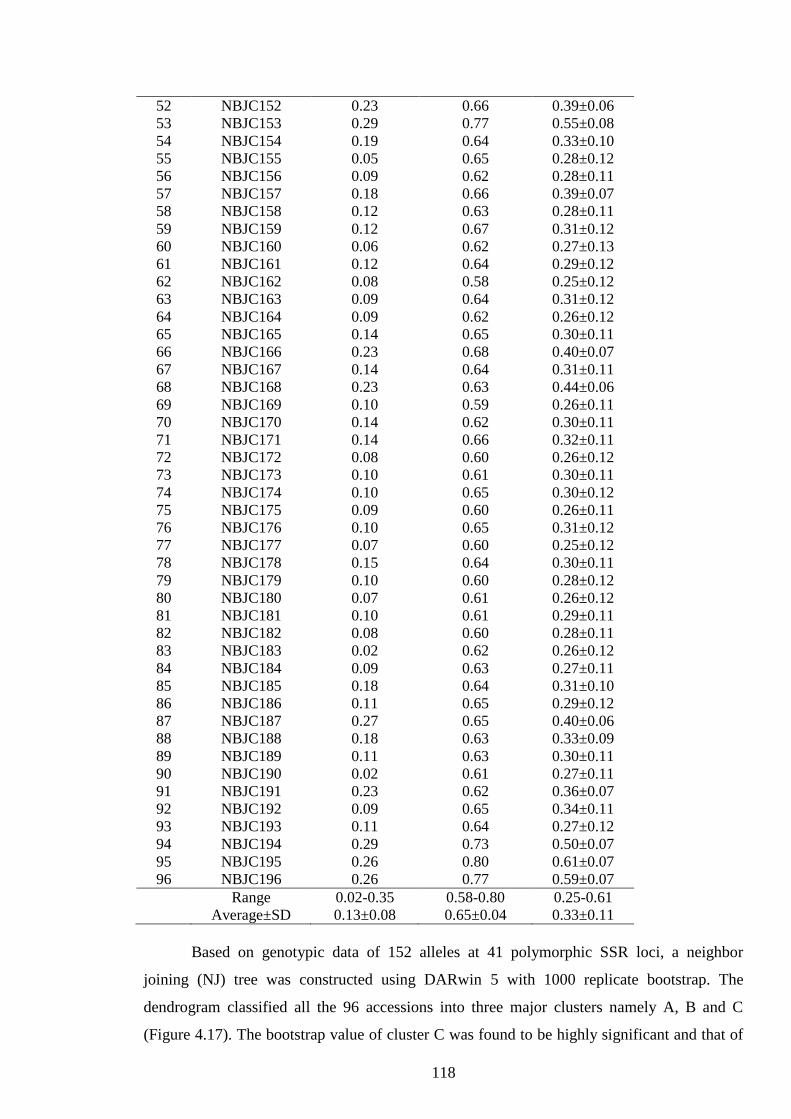
118
52 NBJC152 0.23 0.66 0.39±0.06
53 NBJC153 0.29 0.77 0.55±0.08
54 NBJC154 0.19 0.64 0.33±0.10
55 NBJC155 0.05 0.65 0.28±0.12
56 NBJC156 0.09 0.62 0.28±0.11
57 NBJC157 0.18 0.66 0.39±0.07
58 NBJC158 0.12 0.63 0.28±0.11
59 NBJC159 0.12 0.67 0.31±0.12
60 NBJC160 0.06 0.62 0.27±0.13
61 NBJC161 0.12 0.64 0.29±0.12
62 NBJC162 0.08 0.58 0.25±0.12
63 NBJC163 0.09 0.64 0.31±0.12
64 NBJC164 0.09 0.62 0.26±0.12
65 NBJC165 0.14 0.65 0.30±0.11
66 NBJC166 0.23 0.68 0.40±0.07
67 NBJC167 0.14 0.64 0.31±0.11
68 NBJC168 0.23 0.63 0.44±0.06
69 NBJC169 0.10 0.59 0.26±0.11
70 NBJC170 0.14 0.62 0.30±0.11
71 NBJC171 0.14 0.66 0.32±0.11
72 NBJC172 0.08 0.60 0.26±0.12
73 NBJC173 0.10 0.61 0.30±0.11
74 NBJC174 0.10 0.65 0.30±0.12
75 NBJC175 0.09 0.60 0.26±0.11
76 NBJC176 0.10 0.65 0.31±0.12
77 NBJC177 0.07 0.60 0.25±0.12
78 NBJC178 0.15 0.64 0.30±0.11
79 NBJC179 0.10 0.60 0.28±0.12
80 NBJC180 0.07 0.61 0.26±0.12
81 NBJC181 0.10 0.61 0.29±0.11
82 NBJC182 0.08 0.60 0.28±0.11
83 NBJC183 0.02 0.62 0.26±0.12
84 NBJC184 0.09 0.63 0.27±0.11
85 NBJC185 0.18 0.64 0.31±0.10
86 NBJC186 0.11 0.65 0.29±0.12
87 NBJC187 0.27 0.65 0.40±0.06
88 NBJC188 0.18 0.63 0.33±0.09
89 NBJC189 0.11 0.63 0.30±0.11
90 NBJC190 0.02 0.61 0.27±0.11
91 NBJC191 0.23 0.62 0.36±0.07
92 NBJC192 0.09 0.65 0.34±0.11
93 NBJC193 0.11 0.64 0.27±0.12
94 NBJC194 0.29 0.73 0.50±0.07
95 NBJC195 0.26 0.80 0.61±0.07
96 NBJC196 0.26 0.77 0.59±0.07
Range 0.02-0.35 0.58-0.80 0.25-0.61
Average±SD 0.13±0.08 0.65±0.04 0.33±0.11
Based on genotypic data of 152 alleles at 41 polymorphic SSR loci, a neighbor
joining (NJ) tree was constructed using DARwin 5 with 1000 replicate bootstrap. The
dendrogram classified all the 96 accessions into three major clusters namely A, B and C
(Figure 4.17). The bootstrap value of cluster C was found to be highly significant and that of

119
cluster A and B was very low. Considering the cluster wise genetic dissimilarity, accessions
of cluster B showed higher mean genetic dissimilarity (0.40±0.02) followed by cluster C
(0.29±0.05) and cluster A (0.25±0.01) and thus the accessions from cluster B can be
considered comparatively diverse than those of cluster A. The clustering of accessions
revealed that the cluster A accommodated maximum of 77 (80%) accessions followed by
cluster B (26 accessions) and cluster C (3 accessions). The cluster A could be further divided
into three sub-clusters i.e. AI (51 accessions) AII (25 accessions) and AIII (1accession
NBJC188). The sub-cluster AI included 16 accessions of exotic origin including 4 each from
South America (NBJC175, NBJC176, NBJC179 and NBJC181) and Western Africa
(NBJC173, NBJC183, NBJC185, NBJC186) 3 from Eastern Africa (NBJC174, NBJC189 and
NBJC190) and one each from Central America (NBJC182), Middle Africa (NBJC184),
Southern Asia (NBJC172), South-East Asia (NBJC193) and Eastern China (NBJC171). Apart
from the exotic accessions, it contained indigenous accessions from 16 different states of
India including 4 each from Uttaranchal (NBJC105, NBJC106, NBJC107, NBJC108) and
Jharkhand (NBJC109, NBJC110, NBJC111, NBJC112) 3 each from Rajasthan (NBJC101,
NBJC102, NBJC103) Bihar (NBJC113, NBJC114, NBJC116) Himachal Pradesh (NBJC121,
NBJC123, NBJC122) Chhattisgarh (NBJC117, NBJC118, NBJC120) 2 each from West
Bengal (NBJC144, NBJC145),Orissa (NBJC151, NBJC154), Arunachal Pradesh (NBJC159,
NBJC160), Haryana (NBJC125, NBJC126), Madhya Pradesh (NBJC134, NBJC135) and one
each from Manipur (NBJC169), Andhra Pradesh (NBJC139), Tripura (NBJC165), Kerala
(NBJC170) and Uttar Pradesh (NBJC130). Sub-cluster AII had 25 accessions and among
these 4 (16.0%) were of exotic origin and rest 21 were represented by indigenous accessions
from 10 different states of India. The cluster B contained 16 (26%) accessions (NBJC143,
NBJC124, NBJC153, NBJC132, NBJC115, NBJC104, NBJC145, NBJC168, NBJC165,
NBJC152, NBJC119, NBJC157, NBJC136, NBJC187, NBJC191, NBJC147) with maximum
of indigenous origin (87%) representing 12 states of India. The cluster C was found to be
very unique and had 3 non-toxic accessions (NBJC194, NBJC195 and NBJC196) of J. curcas
from Mexico, Central America. The neighbor joining clustering showed that most of the
exotic accessions (81.0%, 21 out of 26) were grouped in single cluster i.e. cluster A along
with the indigenous accessions indicating low level of genetic diversity across the global
collections of J. curcas.
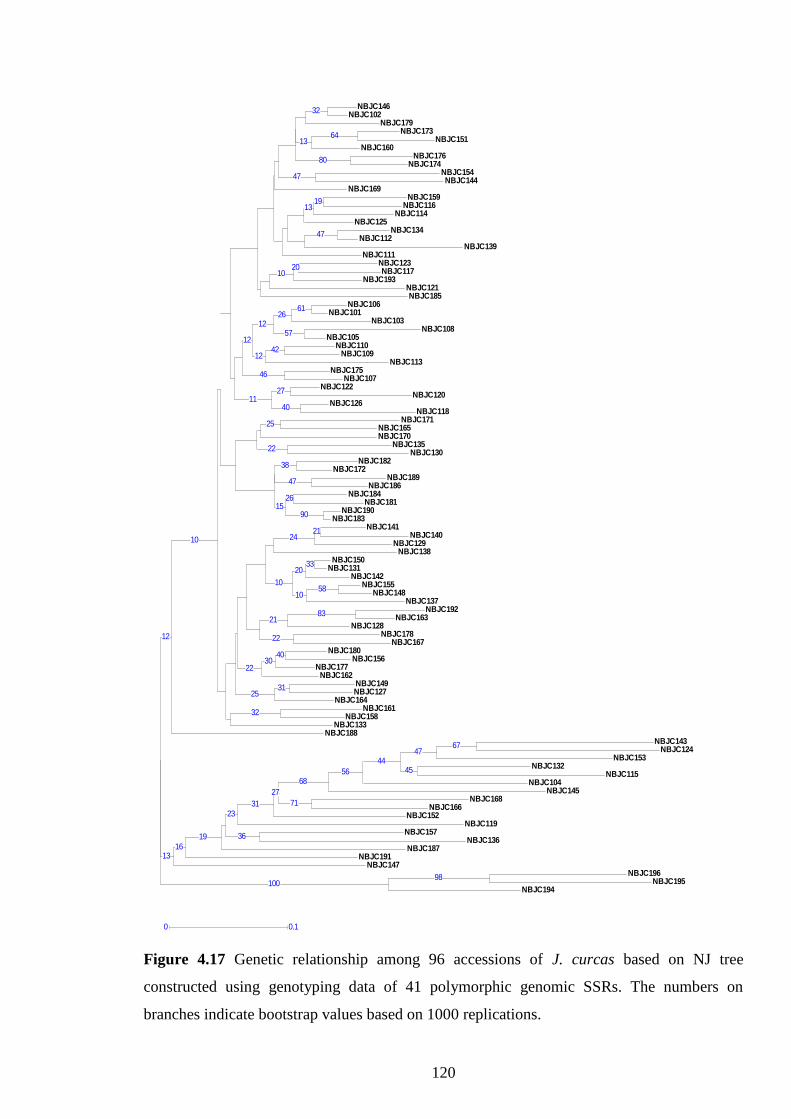
120
Figure 4.17 Genetic relationship among 96 accessions of J. curcas based on NJ tree
constructed using genotyping data of 41 polymorphic genomic SSRs. The numbers on
branches indicate bootstrap values based on 1000 replications.
0 0.1
NBJC101
NBJC102
NBJC103
NBJC104
NBJC105
NBJC106
NBJC107
NBJC108
NBJC109NBJC110
NBJC111
NBJC112
NBJC113
NBJC114
NBJC115
NBJC116
NBJC117
NBJC118
NBJC119
NBJC120
NBJC121
NBJC122
NBJC123
NBJC124
NBJC125
NBJC126
NBJC127
NBJC128
NBJC129
NBJC130
NBJC131
NBJC132
NBJC133
NBJC134
NBJC135
NBJC136
NBJC137
NBJC138
NBJC139
NBJC140NBJC141
NBJC142
NBJC143
NBJC144
NBJC145
NBJC146
NBJC147
NBJC148
NBJC149
NBJC150
NBJC151
NBJC152
NBJC153
NBJC154
NBJC155
NBJC156
NBJC157
NBJC158
NBJC159
NBJC160
NBJC161
NBJC162
NBJC163
NBJC164
NBJC165
NBJC166
NBJC167
NBJC168
NBJC169
NBJC170
NBJC171
NBJC172
NBJC173
NBJC174
NBJC175
NBJC176
NBJC177
NBJC178
NBJC179
NBJC180
NBJC181
NBJC182
NBJC183
NBJC184
NBJC185
NBJC186
NBJC187
NBJC188
NBJC189
NBJC190
NBJC191
NBJC192
NBJC193
NBJC194NBJC195
NBJC196
61
32
26
56
57
46
42
47
12
13
45
19
20
40
23
27
67
31
21
24
22
33
36
10
21
20
47
68
13
58
64
31
47
40
32
13
22
83
25
25
71
22
38
80
30
26
90
47
19
12
16
10
10098
44
27
15
10
11
12
10
12

121
4.4.4 Population structure analysis
In order to determine the genetic structure and define the number of cluster (gene pool),
model-based cluster analysis was performed using software STRUCTURE version 2.3.3
(Pritchard et al. 2000). The model based cluster analysis also showed almost similar result as
obtained in dendrogram. All the 96 accessions of J. curcas grouped into 4 genetically distinct
subpopulations (K=4) based on maximum K values (Figure 4.18 a, b). Based on the
membership probability, 29 accessions assigned to subpopulation 1 with mixed accessions of
indigenous (77%) and exotic (23%) collections and 51 accessions with 70% indigenous and
30% exotic collections assigned to subpopulation 2. The subpopulation 1 had total 14
accessions (NBJC116, NBJC117, NBJC134, NBJC146, NBJC159, NBJC102, NBJC176,
NBJC112, NBJC125, NBJC160, NBJC174, NBJC139, NBJC114 and NBJC169) maintain
their identity without admixture of allele of other accessions while 3 accessions (NBJC179,
NBJC144 and NBJC155) showed admixture with sub population 3. The 7 accessions
(NBJC171, NBJC111, NBJC135, NBJC106, NBJC130, NBJC161 and NBJC109) showed
admixture with sub population 2 and 5 accessions (NBJC114, NBJC169, NBJC151,
NBJC173 and NBJC123) showed admixture of subpopulation 2 and 3. The accessions 93 and
85 showed admixture with subpopulation 4 (non-toxic) and 2. In the subpopulation 2, a total
of 16 accessions (NBJC141, NBJC148, NBJC131, NBJC155, NBJC163, NBJC178,
NBJC129, NBJC149, NBJC150, NBJC180, NBJC127, NBJC172, NBJC128, NBJC182,
NBJC158 and NBJC126) showed no admixture while 22 accessions (NBJC142, NBJC162,
NBJC164, NBJC105, NBJC138, NBJC133, NBJC110, NBJC177, NBJC120, NBJC113,
NBJC156, NBJC181, NBJC183, NBJC122, NBJC103, NBJC121, NBJC175, NBJC170,
NBJC190, NBJC101, NBJC176 and NBJC165) showed admixture with subpopulation 1. The
5 accessions (NBJC192, NBJC137, NBJC140, NBJC186 and NBJC189) showed the
admixture with subpopulation 4 (non-toxic). The 3 accessions (NBJC18, NBJC118 and
NBJC147) showed the admixture with subpopulation 2 and 3 and one accession (NBJC191)
with subpopulation 3 and 4. The three accessions (NBJC188, NBJC157 and NBJC167)
showed admixture with subpopulation 3. The subpopulation 3 had 13 accessions and all
belonging to the indigenous collections except NBJC187. The 7 accessions (NBJC145,
NBJC166, NBJC152, NBJC168, NBJC136, NBJC187 and NBJC119) were found to show the
admixture with subpopulation 1 and 2. The subpopulation 4 is quite unique having 3
exclusive exotic and non-toxic accessions (NBJC194, NBJC195 and NBJC196). The
clustering of both exotic and indigenous accessions in the same subpopulation indicated low
genetic differentiation.

122
Figure 4.18 Population structure analysis showing; a) Delta K showing highest probability of
four (K=4) subpopulation and b) Structural plot of 96 accessions of J. curcas.
a
b
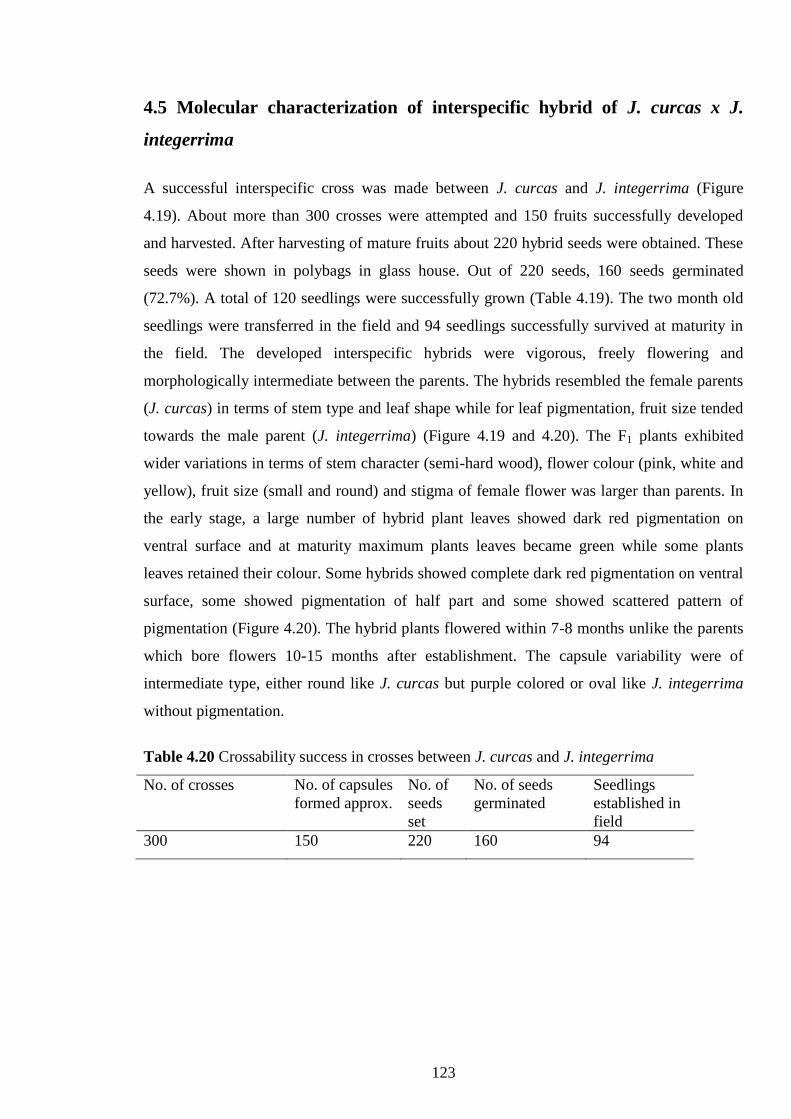
123
4.5 Molecular characterization of interspecific hybrid of J. curcas x J.
integerrima
A successful interspecific cross was made between J. curcas and J. integerrima (Figure
4.19). About more than 300 crosses were attempted and 150 fruits successfully developed
and harvested. After harvesting of mature fruits about 220 hybrid seeds were obtained. These
seeds were shown in polybags in glass house. Out of 220 seeds, 160 seeds germinated
(72.7%). A total of 120 seedlings were successfully grown (Table 4.19). The two month old
seedlings were transferred in the field and 94 seedlings successfully survived at maturity in
the field. The developed interspecific hybrids were vigorous, freely flowering and
morphologically intermediate between the parents. The hybrids resembled the female parents
(J. curcas) in terms of stem type and leaf shape while for leaf pigmentation, fruit size tended
towards the male parent (J. integerrima) (Figure 4.19 and 4.20). The F1 plants exhibited
wider variations in terms of stem character (semi-hard wood), flower colour (pink, white and
yellow), fruit size (small and round) and stigma of female flower was larger than parents. In
the early stage, a large number of hybrid plant leaves showed dark red pigmentation on
ventral surface and at maturity maximum plants leaves became green while some plants
leaves retained their colour. Some hybrids showed complete dark red pigmentation on ventral
surface, some showed pigmentation of half part and some showed scattered pattern of
pigmentation (Figure 4.20). The hybrid plants flowered within 7-8 months unlike the parents
which bore flowers 10-15 months after establishment. The capsule variability were of
intermediate type, either round like J. curcas but purple colored or oval like J. integerrima
without pigmentation.
Table 4.20 Crossability success in crosses between J. curcas and J. integerrima
No. of crosses No. of capsules
formed approx.
No. of
seeds
set
No. of seeds
germinated
Seedlings
established in
field
300 150 220 160 94

124
(A) (B)
(C) (D)
(E) (F)
(G) (H)
Figure 4.19 Photograph showing (A) J. curcas (Female parent) (B) J. integerrima (Male
parent) selected for interspecific hybridization (C) Developing successful fruits after crossing
(D) Seedling of F1 interspecific hybrids in glasshouse, (E) Transplanted F1 hybrid plants
growing in field, (F) Close up view of F1 hybrid plant (G) Close up view of inflorescence of
hybrid plant and (H) Hybrid plant showing fruits

125
Figure 4.20 (A) Dorsal side and (B) ventral side showing morphological variation in leaf
shape and pigmentation of parents (J. curcas and J. integerrima) and hybrid plants.
4.5.1 Confirmation of hybridity using SSR markers
The hybrid identification based on morphological characters is influenced by environmental
factors and frequently lacks the resolving power to identify hybrids at the juvenile stage. For
the identification of true hybrids at early stage, 15 polymorphic SSRs were randomly selected
from Lib A and B which had been screened previously with 7 accessions of J. curcas and one
accession of J. integerrima. These selected SSRs were used to confirm the hybridity and
characterize the 94 interspecific hybrids alongwith their parents (J. curcas and J.
integerrima). The polymorphic microsatellite banding pattern of the parents compared with
hybrid was able to clearly recognize the true hybrid as shown in Figure 4.21. All the 15 SSR
primers were clearly distinguished the hybrid from the parents. A representative snap shot
from GeneMapper showing the parental allele of J. curcas, J. integerrimma and hybrid are
shown in Figure 4.21.
The J. curcas and J. integerrima are reported to be cross-pollinated species and
therefore we could expect genetic variability and segregation in large population F1 hybrid as
in case of tree plants. The amplified primers generated different types of allelic patterns
(Table 4.21) viz. some alleles shared pattern of parents and showed true hybrid, some of the
alleles were segregated in the hybrids but absent in both parents, some alleles were common
to one parent and other to another parent, some alleles showed more similarity to the female

126
parents and some showed more similarity to the male parents (Table 4.21). Out of 94
interspecific hybrids, the maximum number of hybrids sharing parental alleles were detected
with SSR JGM_B334 (93), JGM_A 182 (89) and JGM_A247 (80) followed by JGM_A109
(75) and JGM_A162 (56). On the other hand, the SSR JGM_A291 (1), JGM_A147 (1) and
JGM _A335 (1) showed lowest numbers of hybrids sharing both the parental alleles. The
maximum similarities of hybrid alleles with female parents was found with the JGM B576
(93) and JGM_B368 (88) followed by JGM_A179 (81) and JGM_A335 (62). The minimum
similarities of hybrid alleles with female parents were found with JGM_B334 (1) and
JGM_A182 (2) followed by JGM_B278 (3) and JGM_A247 (6). The similarity of male
parent with hybrids was found less than female parents. The maximum similarities of hybrids
alleles with male parent was found with JGM_A291 (55), JGM_ B 278 (28) followed by
JGM_ A162 (13) and JGM_ A296 (11). The minimum allelic similarities of male parents
with hybrids were found with JGM_A182 (1), JGM_B576 (1) followed by JGM_B335 (2)
and JGM_A247 (3). The number of alleles showed non-parental type of alleles with hybrid
genotypes. The maximum non-parental type of allelic pattern was found with JGM_A295
(51), JGM_ A120 (42) and JGM_ B278 (38) followed by JGM_ A296 (37) and JGM_ A335
(29). The minimum non-parental types of alleles were found with JGM_B369 (1) and JGM_
A182 (2) followed by JGM_ A 162 (3) and JGM_ A 109 (4).
Figure 4.21 A snapshot of GeneMapper showing the allelic pattern of J. curcas,
J. integerrimma and their hybrid
J. curcas
J. integerrima
Hybrid (J. curcas X J. integerrima)

127
Tab
le 4.2
1 G
enoty
pin
g d
etails of 1
5 p
oly
morp
hic p
rimers w
ith 9
4 in
terspecific h
yb
rids an
d its p
arents (J. cu
rcas an
d J. in
tegerrim
a)
SS
R N
ame
Allele size
J. curca
s
Allele size
J. integ
errima
Num
ber o
f hybrid
s with
differen
t allele com
bin
ations
Hyb
rids b
oth
paren
tal type
Hyb
rids fem
ale
paren
tal type
Hyb
rids m
ale
paren
tal type
Non- p
arental
type
JGM
_A
109
244
263
75
9
6
4
JGM
_A
120
252
245
10
36
6
42
JGM
_A
162
275
285
56
22
13
3
JGM
_A
179
175
263
4
81
3
6
JGM
_A
182
178
166
89
2
1
2
JGM
_A
247
288
301
80
6
3
5
JGM
_A
291
290/3
03
298/3
03
1
14
55
18
JGM
_A
295
239
212
13
20
10
51
JGM
_A
296
192
184
15
31
11
37
JGM
_B
244
185
183
20
48
6
20
JGM
_B
278
155
142
25
3
28
38
JGM
_B
334
167
142
93
1
JGM
_B
369
147
142/1
47
1
88
4
1
JGM
_B
576
251
243/2
68
93
1
JGM
_A
335
320
291
1
62
2
29

128
The allelic data of interspecific hybrids alongwith their parental lines were converted
into 0-1 data matrix and used to calculate genetic similarity among hybrids and their parents
according to Jaccord’s similarity coefficient using NTSYS-PC software v2.02 (Exeter
software, New York). The similarity matrix was then used to generate dendrogarm depicting
clustering patterns of hybrids using unweighted pair group method with arithmetic average
(UPGMA) method. Jaccard’s pairwise similarity coefficient values ranged from 0.06 to 0.99.
The dendrogram shows two clades, one major and one minor (Figure 4.22). In the cluster -I
the maximum hybrids grouped with J. curcas that showed more similarity with female
parents. The minimum genetic similarity coefficient was found between J. curcas and J.
integerrima (0.06%). The maximum similarity coefficients (0.99%) were found among
hybrid NBJIS17, NBJIS22, NBJIS25, NBJIS28 and NBJIS21, NBJIS32, and NBJIS53,
NBJIS57, NBJIS83, and NBJIS72, NBJIS90. In cluster-II, male parent, J. integerrima, was
out- grouped with the hybrids-NBJIS1, NBJIS2, NBJIS15, NBJIS48 and NBJIS14. The 2-D
PCA clustering was also in agreement with the clustering depicted in dendrogram. The J.
integerrima occupied a distinct and far position in the plot alongwith some hybrids near by it.
However, J. curcas was found to be closer towards the larger numbers of hybrids (Figure
4.23).

129
Fig
ure 4
.22 D
endro
gram
show
ing clu
stering o
f 94
intersp
ecific hyb
rids alo
ngw
ith th
eir paren
tal lines J. cu
rcas (JC
) and J. in
tegerrim
a (JI).
Coefficient
0.200.40
0.600.80
1.00
JC
NB
JIS3 N
BJIS7
NB
JIS4 N
BJIS17
NB
JIS22 N
BJIS25
NB
JIS28 N
BJIS35
NB
JIS75 N
BJIS34
NB
JIS52 N
BJIS60
NB
JIS62 N
BJIS64
NB
JIS85 N
BJIS38
NB
JIS92 N
BJIS51
NB
JIS77 N
BJIS94
NB
JIS45 N
BJIS91
NB
JIS23 N
BJIS8
NB
JIS79 N
BJIS16
NB
JIS19 N
BJIS33
NB
JIS18 N
BJIS21
NB
JIS32 N
BJIS86
NB
JIS30 N
BJIS44
NB
JIS59 N
BJIS36
NB
JIS20 N
BJIS69
NB
JIS39 N
BJIS42
NB
JIS53 N
BJIS57
NB
JIS83 N
BJIS41
NB
JIS76 N
BJIS71
NB
JIS82 N
BJIS29
NB
JIS37 N
BJIS61
NB
JIS50 N
BJIS84
NB
JIS43 N
BJIS65
NB
JIS81 N
BJIS89
NB
JIS6 N
BJIS27
NB
JIS78 N
BJIS67
NB
JIS88 N
BJIS93
NB
JIS49 N
BJIS55
NB
JIS63 N
BJIS68
NB
JIS24 N
BJIS26
NB
JIS54 N
BJIS47
NB
JIS5 N
BJIS11
NB
JIS10 N
BJIS9
NB
JIS12 N
BJIS13
NB
JIS46 N
BJIS66
NB
JIS56 N
BJIS58
NB
JIS74 N
BJIS72
NB
JIS90 N
BJIS73
NB
JIS31 N
BJIS70
NB
JIS87 N
BJIS40
NB
JIS80 N
BJIS1
NB
JIS2 N
BJIS15
NB
JIS48 N
BJIS14
JI

130
Fig
ure 4
.23
Tw
o- D
imen
sional p
lot b
y P
CA
show
ing clu
stering o
f 94 in
terspecific h
yb
rids alo
ngw
ith th
eir paren
tal lines J. cu
rcas (JC
) and J.
integ
errima
(JI).
0.2
50.4
30.6
10.8
00.9
8
-0.3
0
-0.1
3
0.0
5
0.2
2
0.4
0
JC
JI
NB
JIS1
NB
JIS2
NB
JIS3
NB
JIS4
NB
JIS5
NB
JIS6
NB
JIS7
NB
JIS8
NB
JIS9
NB
JIS10
NB
JIS11
NB
JIS12
NB
JIS13
NB
JIS14
NB
JIS15
NB
JIS16
NB
JIS17
NB
JIS18
NB
JIS19
NB
JIS20
NB
JIS21
NB
JIS22
NB
JIS23
NB
JIS24
NB
JIS25
NB
JIS26
NB
JIS27
NB
JIS28
NB
JIS29 NB
JIS30
NB
JIS31
NB
JIS32
NB
JIS33
NB
JIS34
NB
JIS35
NB
JIS36
NB
JIS37N
BJIS
38
NB
JIS39
NB
JIS40
NB
JIS41
NB
JIS42
NB
JIS43
NB
JIS44
NB
JIS45
NB
JIS46
NB
JIS47
NB
JIS48
NB
JIS49
NB
JIS50
NB
JIS51
NB
JIS52
NB
JIS53
NB
JIS54
NB
JIS55
NB
JIS56
NB
JIS57
NB
JIS58
NB
JIS59
NB
JIS60
NB
JIS61
NB
JIS62
NB
JIS63
NB
JIS64
NB
JIS65
NB
JIS66
NB
JIS67
NB
JIS68
NB
JIS69
NB
JIS70
NB
JIS71
NB
JIS72
NB
JIS73
NB
JIS74
NB
JIS75
NB
JIS76
NB
JIS77
NB
JIS78
NB
JIS79
NB
JIS80
NB
JIS81
NB
JIS82
NB
JIS83
NB
JIS84
NB
JIS85
NB
JIS86
NB
JIS87
NB
JIS88
NB
JIS89
NB
JIS90
NB
JIS91
NB
JIS92
NB
JIS93
NB
JIS94
131
4.6 Heterozygosity assessment of J. curcas
In order to assess the level of heterozygosity of J. curcas, 56 SSRs (14 each 4 four SSR
libraries) were selected. These SSRs were selected on the basis of polymorphism, PIC value
and allelic data over 7 J. curcas accessions. These SSRs were used to genotype 48 progeny
derived from selfed seeds of a single plant. Out of 56, 7 SSRs could not produce sufficient
and significant data as they failed to amplify in more than 70% samples and thus not
considered for further analysis. Therefore, genotypic data of 49 SSRs were used for
heterozygosity assessment. Out of 49 SSRs, 31 SSRs were found to be monomorphic
indicating that all the plants were homozygous at those loci. The rest, 18 SSRs were found
polymorphic producing more than one allele and thus indicating heterozygous condition on
these loci (Table 4.22). The polymorphic SSRs showed allele variation from 2 to 9 with an
average of 3.56 alleles per SSRs (Table 4.22). The SSR JGM_CD232 showed maximum of 9
alleles followed by SSR JGM_CD348, JGM_CD421, JGM_CD092 with 5 alleles and
JGM_B034, JGM_B038 with 4 alleles. The rest 8 and 4 SSR produces 3 and 2 alleles
respectively. The heterozygosity, calculated as proportion of heterozygous individuals in
population, varied from 0.00 to 1.00 with an average of 0.37. However, majority of the
markers (61%, 11 out of 18) showed heterozygosity variation from 0.00 to 0.22 indicating
low level of heterozygosity at these loci. The rest 7 SSRs showed heterozygosity from 0.6 to
1.0 (mean 0.84) indicating higher proportion of heterozygosity at these loci.
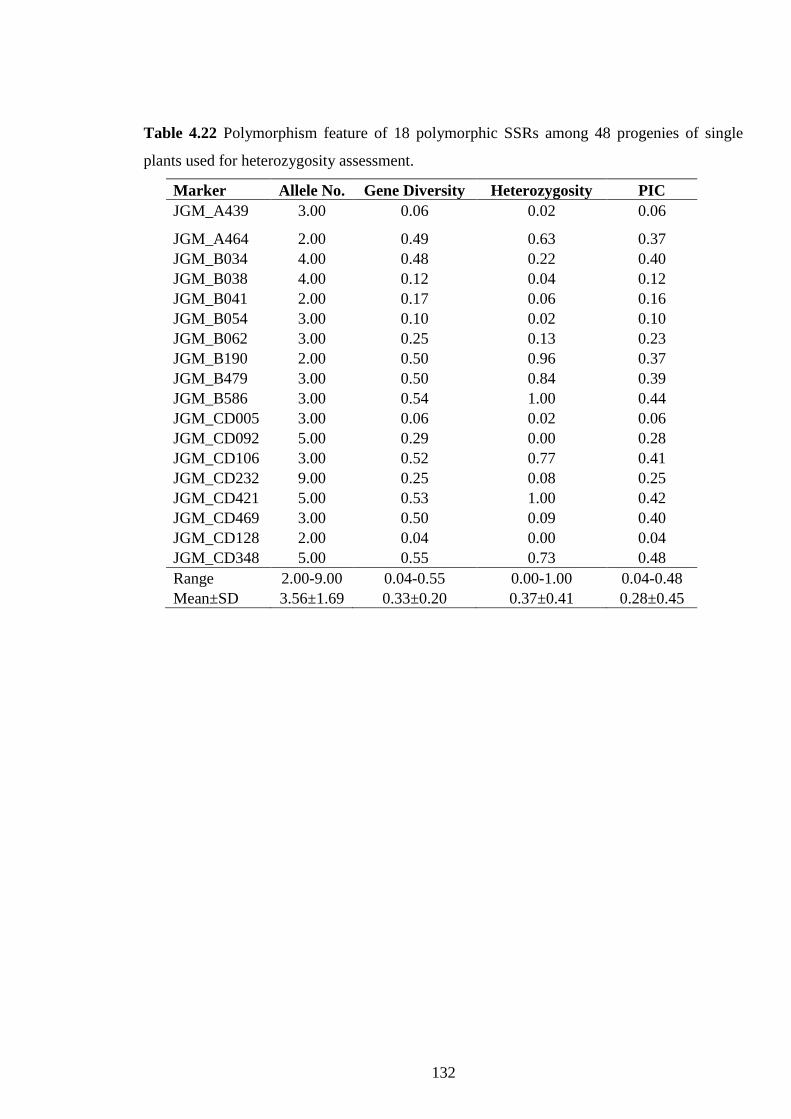
132
Table 4.22 Polymorphism feature of 18 polymorphic SSRs among 48 progenies of single
plants used for heterozygosity assessment.
Marker Allele No. Gene Diversity Heterozygosity PIC
JGM_A439 3.00 0.06 0.02 0.06
JGM_A464 2.00 0.49 0.63 0.37
JGM_B034 4.00 0.48 0.22 0.40
JGM_B038 4.00 0.12 0.04 0.12
JGM_B041 2.00 0.17 0.06 0.16
JGM_B054 3.00 0.10 0.02 0.10
JGM_B062 3.00 0.25 0.13 0.23
JGM_B190 2.00 0.50 0.96 0.37
JGM_B479 3.00 0.50 0.84 0.39
JGM_B586 3.00 0.54 1.00 0.44
JGM_CD005 3.00 0.06 0.02 0.06
JGM_CD092 5.00 0.29 0.00 0.28
JGM_CD106 3.00 0.52 0.77 0.41
JGM_CD232 9.00 0.25 0.08 0.25
JGM_CD421 5.00 0.53 1.00 0.42
JGM_CD469 3.00 0.50 0.09 0.40
JGM_CD128 2.00 0.04 0.00 0.04
JGM_CD348 5.00 0.55 0.73 0.48
Range 2.00-9.00 0.04-0.55 0.00-1.00 0.04-0.48
Mean±SD 3.56±1.69 0.33±0.20 0.37±0.41 0.28±0.45

Chapter 5 Discussion
133
Jatropha curcas L. (2n=22), a perennial shrub producing non-edible oil, has emerged as a
renewable source of biodiesel production. J. curcas was distributed by Portuguese seafarers from
the Caribbean via the Cape Verde Islands and Bissau Guinea to other countries as in Africa and
Asia (Heller 1996). Among the potential biofuel crops, J. curcas has been gaining importance as
the most promising oilseed plant as it does not compete with the edible oil supplies (Johnson et
al. 2011; Achten et al. 2008; Fairles 2007). It attracts worldwide attention of research
communities to study and analyze its potential for biodiesel production. Various research
programs have been initiated on different aspects of crop improvement including agronomy,
conventional breeding, molecular breeding, genetic engineering etc (Kaushik et al. 2007; Rao et
al. 2008; Sunil et al. 2009; Liu et al. 2011; Wang et al. 2011; Shabanimofrad et al. 2011; Sun et
al. 2012; King et al. 2013) As per previous reports, J. curcas is still considered as an
undomesticated/semi-domesticated plant which needs further genetic improvement through
intervention of both conventional as well as molecular breeding approaches.
Therefore, there is a serious need to take initiative for its genetic improvement for
adaptability, agronomically desirable traits, yield and oil content. To initiate any genetic
improvement or breeding program the knowledge of the amount of genetic variability existing in
the material, type of gene action governing the yield and its components and a clear-cut
understanding of other important genetic parameters are essential. Based on these genetic
parameters successful exploitation of the available genetic variability and formulation of
efficient breeding program could be exercised. The assessment of the level and pattern of genetic
relationship among germplasm accessions is an important component of genetic improvement
program. The informations obtained could be utilized for (i) analysis of genetic variability (Cox
et al. 1986) (ii) identification of diverse parental combinations to create genetic variability for
further selection (Barrett and Kidwell 1998) and (iii) introgression of desirable genes from
diverse germplasm into the available genetic base (Thompson et al. 1998). Several types of data
sets (morphological, biochemical and molecular markers) and tools have been used for studying
genetic variability and relationship among accessions.
Genetic diversity can be assessed using either morphological traits or molecular markers
or a combination of both. The study of genetic diversity based on morphological traits has not
been always reliable as they are highly influenced by environment as compared to diversity
based on DNA markers which has been shown to be more reliable and independent of
environmental factors. The application of molecular markers for various genetic studies in a
134
particular plant depends upon the availability and types of molecular markers. If there is limited
number or complex markers available, then their application might be limited to that particular
plant. Thus, it would very important to develop large number and simple marker system to be
implemented for various genetic studies. There is a surge of interest in identifying a large
number of molecular markers for rapid application in the assessment of genetic diversity and the
selection of desired genotypes. Among the various molecular markers employed to assess
genetic diversity and other genetic studies, PCR-based molecular markers such as random
amplified polymorphic DNA (RAPD), amplified fragment length polymorphism (AFLP), inter
simple sequence repeats (ISSR), microsatellite or simple sequence repeats (SSRs) and single
nucleotide polymorphism (SNP) are the important ones. The plant of J. curcas has been
projected as potential source of biodiesel production, however very limited genetic studies have
been reported including marker based diversity assessment in larger population. A few marker
based diversity studies reported low level of genetic variability in J. curcas. Thus, in view of the
previous report of low level of genetic diversity and limited number of validated markers, there
is a need to enrich the genetic pool, develop and validate large number of polymorphic markers
and evaluate larger population for variability and new alleles. Therefore, the present
investigation was undertaken to develop a large set of SSR from four microsatellite enriched
genomic libraries and their characterization, validation, identification of polymorphic SSRs,
assessment of genetic diversity in global population. In addition, phenotypic evaluation of large
collections from various part of the India was also carried out to assess the variability in various
important quantitative traits associated with yield and its contributing traits. Efforts have also
been made to develop interspecific hybrid between J. curcas x J. integerrima and their
characterization based on SSR marker. Further, level of heterozygosity was also assessed using
SSR markers. The results obtained on the above various aspects are discussed below.
5.1 Phenotypic characterization of indigenous accessions of J. curcas
The morphological characterization is the first and important step in the description and
classification of germplasm (Smith and Smith 1989). The systematic work on germplasm
exploration, characterization, utilization and documentation is of paramount importance to
identify genetic variability for the desired traits. There are a very few reports on genetic
characterization of J. curcas and even fewer on systematic assessment of phenotypic characters
of different accessions. Most of the morpho-metric trait based genetic studies carried out earlier
135
were restricted to smaller number of accessions collected from limited areas. However, to
explore and exploit the available genetic resources, an extensive survey, collection and
evaluation was required to find out potential genetic material for further genetic improvement.
The basic genetic studies related to various statistical parameters such as range value of trait,
coefficient of variability, variances, heritability and genetic advance guides plant breeders to
devise suitable breeding strategies. The genetic studies based on the multivariate analysis is a
powerful tool for determining the degree of divergence between populations, the relative
contribution of different components to the total divergence and the nature of forces operating at
different levels. Additionally, the selection parameter such as correlation and path coefficient
also provides direction for selected desired plant types. Thus, in the present investigation, 80
accessions of J. curcas collected from different states of India were undertaken to evaluate
genetic variability, assess genetic divergence, correlation and path coefficient among various
traits. The major traits evaluated and studied include female flowers/plant, male flowers/plant,
male/female ratio, no. of fruits/plant, no. of seeds/plant, fruit weight/plant (g), seed weight/plant
(g) seed length (mm), seed width (mm) and oil content (%).
(a) Genetic variability and divergence
The genetic variability studies are the prerequisite and significant for developing genetic
improvement strategies (Gairola et al. 2011). The genetic divergence has been of considerable
importance and powerful tool for determining the degree of divergence between population,
relative contribution of different components to the total divergence and the nature of forces
operating at different levels. The measurement of genetic divergence helps the breeder to select
genotypes to be utilized in hybridization program for creating genetic variability, heterosis or
identification of donor parents for useful agronomic traits and select desirable segregants (Patra
1985, Singh et al. 2003, Singh 1991, Singh and Mittal 1993). Yield is an ultimate expression of
various yield contributing characters; direct selection for yield could be misleading (Islam and
Rasul 1998; Nath and Alam 2002). This is difficult to judge what proportion is non-heritable,
that is, environmental. If variability in population is largely due to genetic causes with least
environmental effect, probability of isolating superior genotype is a prerequisite for obtaining
higher yield. The process of breeding such population is primarily conditioned by magnitude and
nature of interaction of genotypic and environmental variations in plant characters. So, it
becomes necessary to partition the observed variability into its different components and to have
136
an understanding of parameter such as genetic coefficient of variation, heritability and genetic
advance. There are few reports on genetic characterization and assessment of phenotypic
characteristics of different accessions of J. curcas. Comparatively larger variations in seed traits
have been reported from various parts of the world (Gairola et al. 2011, Ghosh and Singh 2011,
Ginwal et al. 2005, Kaushik et al. 2007, Rao et al. 2008, Mohapatra and Panda 2010, Biabani et
al. 2012, Ouattara et al. 2013, Guan et al. 2013, Christo et al. 2014), while other traits exhibited
high genetic similarity. Singh et al. (2013b) found substantial amount of genetic variability
among the seed yield, oil content and its contributing traits in 24 accessions of J. curcas. Das et
al. (2010) revealed the considerable genetic variability in most component traits and seed yield,
except primary branches/plant, fruits/bunch and seeds/fruit among 16 J. curcas genotypes.
In the present investigation, the genetic variability and divergence analysis was estimated
among 80 accessions of J. curcas for 10 quantitative characters (Table 4.1). The genetic
variability of 80 accessions of J. curcas showed that the oil content varied from 20.8 to 36.1%
with an average of 26.2±0.38. Out of 80 accessions, 26 accessions were found to have oil content
above average value of 26.2% and only 3 accessions namely NBJC1055, NBJC1051 and
NBJC1048 were found to have oil content above 35%. So, majority of the accessions studied in
the present investigation were found to be low oil yielding. Contrary to this, Foidl et al. (1996)
and Berchmans and Hirata (2008) reported high oil content upto 40%. Kaushik et al (2007)
studied on 24 accessions of J. curcas and found the oil content varied from 28% to 38.80%. Rao
et al. (2008) studied on 32 wild accessions of J. curcas and found the oil content ranged from
29.85% to 37.05%. Likewise, only 37 accessions had seed weight/plant above average value
(i.e.180.2g) and of which only 4 accessions had seed weight/plant above 250g with maximum in
accession NBJC1078 (273.08g). This study showed that the accessions of J. curcas had low seed
and oil yield. Similarly, Das et al. (2010) recorded seed yield/plant above average value
(i.e.>84.7 g) of 16 J. curcas genotypes, which is lower than our result, average value of seed
yield/plant (i.e. 180.2 g). Rao et al. (2008) recorded 263.97 g as maximum seed yield/plant.
In order to assess the heritable portion of total variability, the phenotypic variance (2p)
was partitioned into genotypic (2g) and error variance (
2e). The values of error variance were
found to be higher than those of genotypic variance (2g) for number of female flowers/plant,
male/female ratio, number of fruits/plant, number of seeds/plant and seed weight/plant
suggesting much influence of environmental factors on these traits. The phenotypic coefficient of
variation (PCV) and genotypic coefficient of variation (GCV) varied from 7.51 to 25.48 and 7.05

137
to 17.87% respectively. Maximum PCV and GCV were noticed for seed weight/plant followed
by fruit weight/plant, number of male flowers/plant, number of seeds/plant. The PCV was found
higher than that of respective GCV for all the traits with remarkable differences in their values.
Similar finding of higher PCV over GCV for various traits in J. curcas has also reported
previously by several researchers (Rao et al. 2008, Kaushik et al 2007, Singh et al 2013b). The
traits as seed length, seed width and oil content have insignificant differences in PCV and GCV
values. Similar findings of small differences in PCV and GCV values were also been reported
earlier by Kaushik et al. (2007) and Rao et al. (2008) for these traits. The genetic improvement of
these traits with small differences in PCV and GCV values can easily be achieved by selection of
promising plant types and also through crossing the desirable accessions among themselves
followed by selection in segregating generations.
The estimate of genetic variability alone is considered as not much helpful in determining
the heritable portion of total genetic variation unless until coupled with the estimate of
heritability. The estimate of heritability along with variability can provide more insight towards
the amount of genetic advance to be expected from the selection process. Thus, the knowledge
of heritability of a character become important as it indicates the possibility and extent to which
improvement is possible through selection (Robinson et al. 1949). It measures the genetic
relationship between parents and progeny and has been widely used in determining the degree to
which a character may be transmitted from parent to offspring. However, the most important
function of heritability in the genetic studies is its predictive role, expressing the reliability of
phenotypic value as a guide to breeding value that determines the influence on the next
generation. Therefore, if a breeder chooses individuals to be parents according to their
phenotypic values, the success in changing the characteristics of population can be predicted
only from knowledge of the degree of correspondence between phenotypic values and breeding
values. Broad sense heritability varied from 20% to 90% and maximum was observed for oil
content (90%) followed by seed length (88%) and seed width (87%). The lowest heritability
(20%) was noticed for male/female ratio and other traits have moderate heritability ranging from
38% to 54%. High heritability was recorded for oil content (99.00%) and seed weight (96.00%)
by Kaushik et al. (2007). High heritability for seed traits was also reported by Rao et al (2008).
However, low heritability (77.956%) was reported for oil content by Singh et al. (2013b).The
high heritability noticed for oil content, seed length and seed width indicates that these characters
are under genotypic control. However, heritability estimates may differ widely in the same crop
138
and same trait (Rasmuson 2002) because heritability always refers to a defined population and a
specific experimental set up (Holland et al. 2002, Nyquist 1991).
Considering high heritability alone is not enough in making efficient selection in advance
generation unless accompanied by substantial amount of genetic advance (GA), which provides
the information about the degree of gain in a character obtained under a particular selection
pressure (Johnson et al. 1955). Expected genetic advance, as a function of selection intensity,
phenotypic variance and heritability has an added advantage over heritability as a guiding factor
to the breeders in a selection program (Singh and Singh 1981). The genetic advance as percent of
mean varied from 8.45 for male/female ratio to 25.81 for seed weight/plant. The higher genetic
advance for seed weight/plant, oil content, and number of fruits/plant was might be due to the
presence of variation in these traits. High heritability coupled with high GA and GCV for oil
content suggests that this trait was primarily controlled by additive gene action and any simple
selection model would be advantageous to obtain the desired genetic gain. Low heritability with
high GA for seed weight/plant, fruit weight/plant and number of seeds/plant and high heritability
with low GA for seed length and seed width indicates that these traits might be largely governed
by non–additive gene actions and hence much improvement cannot be achieved through
selection. Similar to the present findings, high heritability and low GA for seeds length and seed
width was also reported by Kaushik et al. (2007) and Rao et al. (2008). Das et al. (2010) reported
moderate to high heritability accompanied with high genetic advance for seed yield/plant,
fruits/plant and flowering bunches/plant indicated additive gene action. Singh et al. (2013b)
reported the higher heritability with GA for plant height (74.101%, 80.171), oil content
(77.956%, 16.120) and fruit set (57.430%)
Further, the potential accessions could be identified by analyzing genetic diversity in the
genetic resources collected/available, which will further facilitate various genetic improvement
programs. The accurate assessment of the level and pattern of genetic diversity is an important
component of breeding for crop improvement program. It has diverse applications viz. i) analysis
of genetic variability (Smith 1984; Cox et al. 1986), ii) identification of diverse parental
combinations to create genetic variability for further selection (Barrett and Kidwell 1998) and iii)
introgression of desirable genes from diverse germplasm into the available genetic base
(Thompson et al. 1998). Multivariate analysis techniques, which simultaneously analyze multiple
measurements on each individual under investigation, are widely used in analysis of genetic
diversity.

139
The multivariate analysis for diversity assessment results showed that the simultaneous
testing of significance based on Wilk’s lambda criterion for pooled effect of all the characters
have significant differences among the population (2 = 790 df = 3079.06**). A hierarchical
cluster analysis based on Wards minimum variance grouped all the 80 accessions into 4 clusters
(Table 4.2, Figure 4.1). The number of accessions per clusters varied from 6 (cluster III) to 29
(cluster II). The cluster II was largest with 29 accessions collected from 11 states of India
followed by the cluster I which was second largest comprising 27 accessions collected form
Uttar Pradesh, Gujarat, West Bengal, Rajasthan, Tamil Nadu, Himachal Pradesh, Bihar,
Chhattisgarh, Haryana, Punjab, Madhya Pradesh, Uttaranchal, Jharkhand and Kerala. The cluster
III was the smallest with 6 accessions collected from 3 states i.e. Uttaranchal (4), Jharkhand (1)
and Rajasthan (1). The cluster IV had 18 accessions collected from Chhattisgarh, Uttar Pradesh,
Tamil Nadu, Himachal Pradesh, Haryana, Orissa, Andhra Pradesh and West Bengal. The
clustering of the accessions based on multivariate analysis showed that majority of accessions
i.e. 56 accessions (70%) were genetically close to each other and grouped only into two clusters
i.e. cluster I and II. The distribution of accessions from same origin/geo-graphical region into
different clusters or vice-versa indicated that the geographical origin is not related to genetic
divergence. Similar findings were also reported earlier by Rao et al. (2008) and Sudheer et al.
(2010) based on morphological traits and molecular marker studies respectively. The tendency of
accessions occurring in clusters cutting across the eco-geographical boundaries demonstrate that
geographical isolation need not necessarily be related to genetic diversity and was at random
(Murty and Arunachalam1966; Ramanujam et al. 1974). Such unparallelism between
geographical distribution and genetic divergence might be due to some forces other than
geographical distance as ancestral relationship, genetic drift, free exchange of genetic material
from one place to another and variable degree of selection in different regions.
The maximum intra cluster distance was noticed in cluster IV (30.15) followed by cluster
I (28.61), cluster II (25.89) and cluster III (24.77). The accessions of cluster IV had
comparatively more diversity as compared to other clusters as indicated by its intra cluster
distance. The inter cluster distance varied from 47.59 (between cluster I and cluster II) to 211.27
(between cluster III and cluster I). Based on cluster distance, the cluster III showed maximum
genetic distance with cluster I, followed by cluster IV and cluster II suggesting comparatively
wider genetic diversity among them (Table 4.3). The accessions from these clusters could be
utilized in hybridization program to get desirable transgressive segregants in their offspring, as

140
there is a higher probability that unrelated genotypes would contribute unique desirable alleles at
different loci (Beer et al. 1993; Peeters and Martinelli 1989). Considering the cluster means
(Table 4.4), the cluster I showed highest mean value for all the traits except oil content. On
contrary, the cluster III had lowest mean value for number of male flowers/plant, male/female
ratio, fruit weight/plant, seed weight/plant, seed length and seed width. The cluster I and cluster
III seems to be unique in having highest and lowest cluster mean value for most of the traits
respectively and also had highest inter cluster distance between them. The crossing among the
accessions of these two clusters may yield hybrids with desirable traits.
In order to assess the patterns of variation, principal component analysis (PCA) was also
carried out by considering all the 10 variables simultaneously. The first four principal
components (PCs) accounted for more than 93% of the total variation (Table 4.5). PCA is a
multivariate technique that allows to find the major patterns within a multivariate data set.
Associations between traits emphasized by this method may correspond to genetic linkage
between loci controlling traits or a pleiotropic effect (Iezzoni and Pritts 1991). The first principal
components accounted for 42.5% of the total variation due to seed length, seed width, seed
weight/plant and number of seeds/plant which had maximum and positive weight on this
component. Oil content had negative weight on PC1. Thus, PC1 related to the accessions with
thick seeds, moderate to high seed yielder with low oil content. The PC2 concentrated 32% of
total variation and was positively associated with seed weight/plant, number of seeds/plant and
female flower/plant. The oil content had highest negative weight on PC2 also followed by seed
length, seed width and male female ratio. The third PC accounted for 12% variation was mainly
due to seed weight/plant, number of seeds/plant, number of fruits/plants and seed width had
negative weight. The seed weight/plant invariably had almost equal and positive weight on all
four components.
(b) Correlation and path coefficient analyses
Correlation studies provide reliable information on the nature, extent and direction of selection.
A breeder is always concerned with selection of genotypes whose performance is dependent on
the phenotypic performance. In general, the selection based on phenotypic performance does not
always lead to the expected genetic advance due to the presence of genotype x environmental
interaction. Dewey and Lu (1959) emphasized to recognize the nature of population under
consideration as the magnitude of correlation coefficient could often be influenced by the choice
141
of individuals upon which the observations are made. However, there was no way in which yield
could be changed without changing one or more of the components (Grafius 1964; Singh and
Singh 1979; Singh and Khanna 1993). The phenotypic correlation is a function of genotypic and
environmental correlations. Partitioning of phenotypic correlation into these two components, is
therefore important to breeders as it is only the genetic component which decides the usefulness
of such associations between the characters as it indicates the degree to which various traits of
the plant are associated with economic productivity. Correlation study thus provides information
on correlated response of important plant traits and therefore leads to a directional model for
yield response. So, in the present study genotypic and phenotypic correlation between the yield
and its various contributing traits had been calculated in 80 diverse accessions of J. curcas over
pooled data of two years and are presented in Table 4.1. The values of phenotypic and genotypic
correlations were of the same sign except for few such as female flowers/plant vs male
flowers/plant, male female ratio vs fruit weight/plant. In general, the magnitude of genotypic
correlations was slightly higher than the corresponding phenotypic correlation, which might be
due to modifying effect of environment (Singh et al. 2003, 2004). In some cases, where the
magnitude of genotypic and phenotypic correlations were nearly the same, the environmental
covariance was very small, which indicates that the influence of environment on these
correlations was minimal (Falconer 1989). The seed weight/plant was significantly and
positively associated with female flowers/plant, male flowers/plant, number of flower/plant,
number of seeds/plant, fruit weight/plant, seed width and negatively associated with oil content.
Positive and significant correlation of seed yield with male female ratio and flower number was
also reported earlier by Rao et al. (2008). Negative association of seed length with oil content
was also reported by Kaushik et al. (2007) and Rao et al. (2008). On contrary to the present
investigation, positive and significant association of seed yield with oil content was reported by
Kaushik et al. (2007). The oil content was found to be negatively and significantly correlated
with all the traits studied with strong negative association with female flower/plant followed by
male flowers/plant, number of seeds/plant, fruit weight/plant and seed weight/plant. Positive
association of seed yield/plant with fruits/plant was also reported by Das et al. (2010).
Among component traits, female flower/plants was significantly and positively correlated
with male flowers/plant, number of fruits/plants, number of seeds/plants, fruit weight/plants and
seed length and negative association with oil content. Male flower/plant had significant and
positive correlation with male female ratio, number of fruits/plant and fruit weight/plant. Male
142
female ratio had significant and negative correlation with fruit weight/plant. The negative
association of male female ratio with seed yield was also reported earlier by Singh et al. (2013b).
Number of fruits/plant had significant and positive correlation with number of seeds/plant, fruit
weight/plant, seed length and seed width. Number of seeds/plant had significant and positive
correlation with fruit weight/plant and negatively correlated with oil content. Fruit weight/plant
had significant and positive correlation with seed length and seed width, while negatively
correlated with oil content. Seed length had significant and positive correlation with seed width
which was also previously reported by Kaushik et al. (2007) and Guan et al. (2013). The positive
and significant association of major component traits among themselves in general and with seed
weight/plant in particular suggests that selection of component traits jointly or individually may
enhance the seed yield. However, oil yield could be compromised upto some extent as it showed
negative association with most of the component traits. Therefore, precaution should be taken
while selecting plant type, based on component traits so that both seed yield and oil yield could
be optimized to its maximum potential.
Correlation coefficient reveals over all relationship between two traits which may be
negative or positive in nature and it is the net result of direct effect of a particular trait and
indirect effects via other traits. It does not permit the cause and effect relationship of traits
contributing directly and indirectly towards economic yield. In order to predict the direct and
indirect effect of traits on correlation among various traits, the path coefficient analysis studies
are being carried out. The path analysis is a statistical technique used primarily to examine the
comparative strength of direct and indirect relationship among variables and thus permits a
critical examination of components that influence a given correlation and can be helpful in
formulating an efficient selection strategy (Shipley 1997; Scheiner et al. 2000). This approach
quantifies the relationship among variables based on a priori assumptions, which traits are to be
included in analysis. Such assumptions are somewhat subjective but path coefficient may allow a
better understanding of the interrelationships between traits than correlation tables with all
possible combinations between all the traits. The path analysis data specifies the causal and non-
causal paths between independent and dependent variables.
The path coefficient analysis for seed yield in J. curcas germplasm was performed and
results are presented in Table 4.7. The male flowers per plant had the maximum direct effect on
seed yield, followed by number of seeds/plant, seed width, number of fruits/plant and oil content.
On the other hand female flowers/plant, male female ratio, fruit weight/plant, seed length

143
exhibited negative direct path effect on seed yield but showed positive and significant correlation
on seed yield except male female ratio. Similarly, Singh et al. (2013b) also reported negative
direct effect of path coefficient and negative correlation of male female ratio on seed yield/plant
in J. curcas. The negative direct effect of female flowers/plant, fruit weight/plant, seed length on
seed yield/plant was counterbalanced by indirect positive effect via male flowers/plant, number
of fruits/plant, number of seeds/plant, and seed width. The apparent contradiction was probably
due to the fact that the total correlation simply measures mutual association without considering
the causation, whereas the path analysis specifies the causes and measures their relative
importance (Bhatt 1973). Male flowers/plant, number of fruits/plant, number of seeds/plant, seed
width had indirect positive effect and influenced female flowers which indirectly affect yield.
Male female ratio showed negative indirect effect and negative correlation with yield. Oil
content had positive direct effect on seed yield/plant though it had negative association which
was due to negative indirect effect via male flowers/plant, number of seeds/plant, number of
fruit/plant and seed width. The positive direct effect of male flowers/plant, number of
fruits/plant, number of seeds/plant, seed width and oil content for seed yield/plant indicated that
plant types with larger seeds, higher number of male flowers, fruits and seeds would be desirable
trait for improving seed yield in J. curcas. The results of the present investigation suggests that
selection in J. curcas based on male flowers/plant, number of fruits/plant, number of seeds/plant,
seed width and oil content would be advantageous to achieve the desirable goals. The indirect
selection through other component traits would also be rewarding to improve the seed yield.
5.2 Development of large scale genomic derived SSRs from di- and tri-
nucleotide enriched genomic libraries
Microsatellites or simple sequence repeat (SSR) has been widely preferred and used in recent
years for various genetic studies in plants including diversity analysis, linkage map construction,
QTL/association mapping (Wang et al. 2011; Liu et al. 2011; Sun et al. 2012; King et al. 2013;
Yue et al. 2013) and marker assisted selection. Among different approaches of developing
molecular markers, the use of microsatellite enriched genomic libraries has been widely used for
SSRs development. Construction and screening of partial genomic libraries and sequencing of
SSR positive clones have been reported to be an effective method for SSR isolation (Rafalski et
al. 1996; Lench et al. 1996; Lunt et al. 1999; Chen et al. 2005). However, the process of SSR
marker development and characterization of J. curcas is still very limited. In the present

144
investigation, 2329 SSRs (1207 from di-nucleotide enriched libraries, Lib A and B, and 1122
from tetranucleotide enriched libraries, Lib C and D) were developed, characterized, evaluated
for polymorphism. Traditional methods for the identification of microsatellite markers usually
demand the construction of small-insert genomic libraries, colony selection and plasmid isolation
and sequencing of selected clones, primer design for suitable flanking regions and assessments
on the marker polymorphism by PCR analysis on a germplasm sample. The advent and
advancement in next-generation sequencing (NGS) technology offers fast and cheap mode of
genome-wide and gene based SSR development more efficiently (Zalapa et al. 2012). More
recently, researchers are being applying next-generation sequencing technologies to generate
sequence data for the genome identification of microsatellite regions and primer design
(Abdelkrim et al. 2009; Castoe et al. 2010; Csencsics et al. 2010; Zhu et al. 2012). A few
preliminary studies were conducted in the past for the development of molecular markers and
diversity analysis in J. curcas. Thus, in view of the previous report of low level of genetic
diversity and limited number of validated markers we applied next generation Roche 454 GS
FLX sequencer for the development of genomic SSRs from two tri-nucleotide (AAC and AAT)
enriched genomic libraries of J. curcas. The newly identified SSRs were characterized,
validated, analyzed for polymorphism and were used to evaluate the global collection of J.
curcas for variability and new alleles.
(a) SSRs developed from Lib A and B
The microsatellite enrichment level was reported to vary from 11 to 99% in previous studies in
different crop plants (Techen et al. 2010). In the present investigation, the microsatellite
enrichment efficiency was noticed upto 87.9% and a total of 1315 unique sequences were
recovered from both the libraries at 44.2% recovery rate (Table 4.8). The primers were designed
for 1207 SSR containing sequences with 92% of success for primer designing. Wang et al.
(2008) developed SSRs for flowering dogwood (Cornus florida L.) and approximately 94.6%
primers were designed from 351 unique SSR sequences. Sun et al. (2008) have also reported
almost similar enrichment efficiency (89.5%) in J. curcas, however, Sudheer et al. (2010) found
lower enrichment efficiency (39.0%). Most of the SSRs recovered were of perfect types (77%)
which were found to be higher than reported earlier 44.6% in Solanum melongena L. by Nunome
et al. (2009). Das et al. (2012) recovered 62.03% of perfect SSRs in Jute (Corchorus). Wang et
al. (2008) found 43.5% perfect SSRs in Cornus florida. Since, the libraries were enriched with

145
CA and GA repeats, the frequency of core repeats was found to be high for dinucleotide motif,
though other repeat motif were also recovered. The maximum number of clones of CA enriched
library had AC/GT repeat motif and GA enriched library had AG/CT repeat (Figure 4.4). The
non-targeted AT motifs were also recovered in significant number and were the major part of
compound SSRs with targeted repeat motifs. Similar findings have also been reported in other
plant genomes like Maize (Taramino and Tingey 1996), sunflower (Paniego et al. 2002), and
safflower (Hamdan et al. 2011). The AT repeats motifs among DNRs are reported to be most
common in genomic sequences of Arabidopsis (Cardle et al. 2000). Recently, Sato et al. (2011)
also reported high frequency of AT repeat motif (71%) among DNR and AAT (60%) among
TNR in the genome sequence of J. curcas. The appearance of AT motif in the present
investigation might be due to its higher frequency in J. curcas genome. Considering the repeat
length of SSR motif, it was noticed that most of the SSRs (65%) showed short repeat length in
the range of 4-10 and only 37 (2.2%) were found to have repeat length of more than 20 (Figure
4.3).
(b) SSRs developed from Lib C and D
New and revolutionary sequencing methods, referred to as next-generation sequencing (NGS)
are extremely high-throughput technology that produce thousands or millions of sequences at
once at a fraction of the cost of traditional Sanger methods (Shendure and Ji 2008; Ekblom and
Galindo 2011). A specific application of this new technology in plants is the possibility of rapid
and cost-effective discovery of simple sequence repeat (SSR) or microsatellite loci. In the
present investigation, we used Roche 454 GS-FLX sequencer for developing genomic SSRs
from tri-nucleotide repeat motif (AAT and AAG) enriched genomic libraries of J. curcas. The
assembled sequences data yielded a total of 5,142 unique sequences having 5,844 putative SSRs.
In total only 1,122 flaking primers were successfully designed. The SSR recovery rate (23%) and
success of primer designing (22%) was quite low as compared to the SSRs developed from Lib
A and B using Sanger sequencing. The low rate of primer designing might be due to the
existence of marginal SSRs as the sequences generated from 454 sequences were shorter than
those generated from Sanger sequencing. As the libraries were enriched with trinucleotide
repeats, 59.0% of the SSRs recovered were of trinucleotide repeat type followed by
tetranucleotide repeats (25.0%). The other repeat motifs, i.e. DNR, PNR and HNR were also
recovered with less than 6% frequency. Among the TNR, the repeat motif AAT/ATT and

146
AAG/CTT were found in major frequency (73.2%) followed by ATC/ATG (7.0%) and
ACC/GGT (6.0%). Although, we have targeted TNR SSRs but significant amount of TtNR SSRs
was also recovered and among them AAAT/ATTT motif was found in maximum frequency
(51.0%). Considering the repeat length of SSR motif, it was noticed that most of the SSRs (95%)
showed short repeat length in the range of 4-10 and only 16 (0.3%) were found to have repeat
length of more than 20. Pootakham et al. (2012) developed genomic derived SSR markers in
Hevea brasiliensis using 454 pyrosequencing. They identified a total of 24674 SSRs, of which
the frequency of mononucleotide repeats (47.12%) and dinucleotide repeats (29.72%) comprise
of the two largest groups of repeat motifs. Less commonly found were trinucleotide repeats
(13.42%), followed by tetranucleotide repeats (6.07%) and pentanucleotide repeats (2.94%), with
hexanucleotide repeats being the least abundant at merely (0.71%). Yang et al. (2012) developed
microsatellite markers for Faba bean using 454 pyrosequencer. They identified a total of 250,393
SSRs and most common SSR motifs comprised trinucleotide and dinucleotide. The dinucleotide
repeats (AC/GT)n and (AG/CT)n were predominant, representing 99.2% of all the dinucleotide
characterized. Trinucleotide (AAC/GTT)n repeats were the most abundant (96.5%) which
showed higher enrichment than our results.
(c) Similarity search and functional annotation
A sequence similarity search SSR containing sequences derived from di-nucleotide enriched
libraries showed 50% similarity with Ricinus communis and a total of 1539 GO term assigned
based on Gene Ontology. A significant putative function could be assigned for 17% of
sequences. Likewise, the similarity search of trinucleotide SSR containing sequences showed
maximum similarity of 63% with Ricinus communis (F. Euphorbiaceae). Significant similarity
was also observed with Populus trichocarpa (19%), Vitis vinifera (9%), Glycine max (3%) and
Medicago truncatula (2%).

147
5.3 PCR optimization, polymorphism detection and characterization of
developed SSRs for various attributes
With the help of Sanger and next generation sequencing a total of 2,329 genomic derived SSRs
have been developed for J. curcas. The discovery and development of SSR markers is not of
much use until unless characterized and studied for polymorphism. The characterization and
polymorphism analysis helps to identify suitable markers which will be deployed in various
genetic studies. Therefore, all the SSRs developed in the present investigation were subjected to
PCR optimization for proper amplification protocol, polymorphism detection and studies on
various marker attributes. The results obtained are discussed below.
All the 1,207 SSRs developed from Lib A and B were amplified with 7 accessions of
J. curcas and one accession of J. integerrima for PCR optimization and polymorphism detection.
J. integerrima was included in the polymorphism screening panel to check the cross species
transferability of the newly developed SSRs and also to identify polymorphic SSRs between
J. curcas and J. integerrima which were used as parental lines for developing an interspecific
mapping population. J. integerrima is the only reported species of the genus Jatropha which
showed hybridization compatibility. Previously, researchers have used it to develop interspecific
hybrids for genetic improvement, linkage mapping and other genetic studies (Sujatha and
Prabhakaran 2003; Wang et al. 2011). The PCR amplification results showed that approximately
90% of the primers (1089 out of 1207 SSRs) have been successfully amplified with expected
amplicon. This was comparatively higher proportion of successful primer amplification than
reported earlier in J. curcas by Yadav et al. (2011, 78%) and Sudheer et al. (2010, 74%).
However, it was comparable to results obtained by Sato et al (2011, 88%). The polymorphism
rate among different accessions of J. curcas was found to be low (23%) as compared to the
previous studies in Jatropha (Yadav et al. 2011; Sudheer et al. 2010), however it was higher than
that reported by Sun et al (2008). We observed ~52% polymorphism reduction when non toxic
accession (NBJC195) was excluded from the analysis (only 129 polymorphic out of 1089) which
showed that the maximum polymorphism was due to non toxic accession. The diverse nature of
non toxic accession has also been reported in earlier studies (Basha et al. 2009; Makkar et al.
1998). Further, the polymorphism analysis with respect to parental lines of intra and interspecific
mapping population showed low among intraspecific parental lines (Lib A SSRs ~12%; Lib B
SSRs ~19%) as compared to interspecific parental lines (Lib A SSRs ~25%; Lib B SSRs ~33%).
The cross species transferability of SSRs to J. integerrima was ~52%. The 248 polymorphic

148
SSRs could be potential markers for future genetic studies in Jatropha as they showed
considerable amount of allelic variation (2-5 alleles per locus) among limited accession of J.
curcas.
The PIC value reveals the informativeness level and accordingly defined into high
(PIC>0.5), moderate (0.5>PIC >0.25) and low (PIC<0.25) categories (Botstein et al. 1980). The
SSRs developed exhibited low level of informativeness with an average PIC value of 0.24±0.10
and 0.28±0.13 of Lib A and Lib B respectively. The majority of the SSRs (71.0%) showed lower
PIC value (<0.30) which might be due to either low level of genetic diversity available in the
germplasm or less number of accessions studied. This is further supported by the fact that
exclusion of NBJC195 (non-toxic accession) further reduces the PIC value. No specific
correlation between number of repeats and number of alleles or PIC value was observed in J.
curcas. Similar findings were also reported in previous studies (Ferguson et al 2004; Hossain et
al. 2000; Gupta et al. 2012b). However, a positive correlation was reported in grape (Bowers et
al. 1996) and Arachis (Moretzsohn et al. 2005). The low average PIC value and number of
alleles observed suggests narrow genetic diversity available in the gene pool of J. curcas. Based
on the PIC value and other parameters the SSRs JGM_A281, JGM_A326, JGM_A244,
JGM_A107, JGM_A577, JGM_B300, JGM_B361, JGM_B595, JGM_B176, JGM_B330 and
JGM_B248 were found to be highly informative and could be potential markers for various
genetic studies in J. curcas.
Similarly, all the 1,122 SSRs developed from Lib C and D were also evaluated with the 7
accession of J. curcas and on accession of J. integerrima for PCR optimization and
polymorphism detection. Out of 1122 SSRs, 447 (40%) were found to be polymorphic among 7
accessions of J. curcas, 570 (51%) were monomorphic and the rest 105(9%) either failed to
amplify or gave non-specific amplification. The genotypic data showed that 273 SSR primers
failed to amplify with J. integerrima and 226 found to be monomorphic. However, the
polymorphic SSRs increases from 447 to 623 (73%) with respect to J. integerrima and J. curcas.
In this way, approximately 91% primers amplified among the different accessions of J. curcas
and 76% between J. curcas and J. integerrima which was in accordance with our previous report
with dinucleotide SSRs (Maurya et al. 2013). SSR polymorphism among 7 accessions was found
to be substantially higher (44%) as compared to earlier report of Maurya et al. (2013), Ouattara
et al. (2014) but less than that reported by Yadav et al. (2011), Mastan et al. (2012), Salvador-
Figueroa et al. (2014) and Osorio et al. (2014). The transferability of SSRs from one species to
149
another species might be useful for various genetic analyses and such studies have been reported
in various plants (Castillo et al. 2010; Ince et al. 2010; Chai et al. 2013, Yu et al. 2013). The
SSRs developed in the present investigation showed a higher transferability rate (76%) to J.
integerrima in comparison to reported earlier (Maurya et al. 2013), where it was noticed 52%
with dinucleotide repeat SSRs.
The allele diversity of all the 447 polymorphic SSRs among 7 accessions of J. curcas
varied from 2 to 9 with an average of 2.7±1.18 per markers. The average number of alleles
produced by trinucleotide SSRs in the present investigation was found to be higher than that
reported by Maurya et al. (2013) with dinucleotide SSRs and Salvador-Figueroa et al. (2014).
The majority of the markers, i.e. 57% produced two alleles followed by three (23%) and four
alleles (10%). There were only two markers JGM_CD797 and JGM_CD928 which produced 8
and 9 alleles respectively. The PIC value ranged from 0.12 to 0.85 (average 0.34±0.17). Most of
the SSRs (211, 47%) showed low PIC value (<0.30) (Figure 2). The average PIC value was
found to be higher as compared to previous reports (Ricci et al. 2012; Maurya et al. 2013, Osorio
et al. 2014) suggesting usefulness of the SSRs developed in the present investigation.
Approximately half of the SSRs (49.2%) showed a moderate range of PIC value. However, only
4% SSRs showed higher PIC value in the range of 0.71 – 0.90. The higher interspecific
transferability rate and average PIC value (0.34±0.17) was calculated based on 7 accessions of J.
curcas as compared to earlier reports (Maurya et al. 2013) which indicates that trinucleotide
SSRs are more useful in J. curcas for cross species transferability and comparative genetic
studies. Based on the PIC value and other parameters the SSRs JGM_CD928, JGM_CD1067,
JGM_CD911, JGM_CD650, JGM_CD926, JGM_CD887, JGM_CD914, JGM_CD940,
JGM_CD916, JGM_CD857 and JGM_CD873 were found to be highly informative and could be
potential markers for various genetic studies in J. curcas.
Based on polymorphism analysis of all the newly developed SSRs (2,329), 2,016
working SSRs (1089 from Lib A and B, 1017 from Lib C and D) have been identified to enrich
the repertoire of SSR marker for J. curcas. A total of 695 polymorphic SSRs have been
identified for J. curcas and characterized for various attributes. These newly developed SSRs
may facilitate construction of high density linkage map, diversity analysis, and QTL/association
mapping and may be further utilized in making strategies for marker assisted breeding towards
developing high seed and oil yielding cultivars of J. curcas.

150
5.4 Study of molecular genetic diversity among indigenous and exotic
accessions of J. curcas L.
A few studies on SSR based diversity assessment have been reported in J. curcas for Indian
accessions. Sujatha et al. (2005) investigated diversity among toxic Indian accessions and non-
toxic Mexican accessions using RAPD markers. Reddy et al. (2007) used AFLP and RAPD on
20 Indian accessions while Basha and Sujatha (2007) used RAPD and ISSR primers on 42
accessions from different regions of India. They also included the non-toxic Mexican accessions
in their analysis and although it could be easily differentiated from the Indian accessions. Ranade
et al. (2008) used single-primers amplification reaction (SPAR) to compare 21 accessions from
different parts of India and demonstrated that 3 North-East accessions were different among
them and from other accessions analyzed. Ganesh Ram et al. (2008) and Pamidimarri et al.
(2009) compared J. curcas with additional Jatropha species from India and demonstrated clear
divergence. Apart from these, several other genetic diversity studies have been reported in J.
curcas using different types of molecular markers like RAPD, AFLP, ISSR and SSR (details
summarized in review of literature). In all these studies, J. curcas accessions from different eco-
geographic regions of India were shown to be 60 to 80% similar. It is therefore important to
evaluate J. curcas accessions from wider eco-geographic regions to obtain more genetic
information. Therefore, in the present investigation, a random set of 41 polymorphic SSRs have
been utilized to evaluate 96 accessions of J. curcas including 70 Indigenous and 26 exotic
collections for genetic diversity/interrelationship and new alleles.
A total of 152 alleles produced at 41 SSR loci ranging from 2 to 9 with an average of
4.0±1.9 alleles/SSR (Table 4.16). The majority of the SSRs (71%) showed low PIC value
(<0.30) and there were only three SSRs which showed PIC value in between 0.61 and 0.80. The
range of PIC value obtained here was found to be comparable to previous report (Salvador-
Figueroa et al. 2014) and higher than reported by Ricci et al (2012). The observed heterozygosity
(Ho) varied between 0.00 and 0.99 with an average of 0.16±0.27 and expected heterozygosity
(He) or gene diversity varied from 0.01 to 0.82 with an average of 0.24±0.21. The AMOVA was
carried out considering indigenous and exotic as two distinct populations to understand the
pattern of differentiation of genetic variation among and between the populations. The
partitioning of genetic variations within and between populations (indigenous and exotic
collections) showed that 6% of the total genetic variation exists among the population and 94%
within populations with an average pairwise PT (similar to FST) was 0.063. The study carried

151
out by Salvador et al. (2014) with 93 accessions of J. curcas native to Chiapas, Mexico using
SSR markers also showed that the population were structured and moderately differentiated (FST
0.087). Likewise, Osorio et al (2014) performed AMOVA on 182 accessions collected from
Asia, Africa, South America and Central America and indicated high genetic variation within
population as compared to between populations. In contrast, Pecina-Quintero et al. (2014)
showed higher variance among population than variance within populations while studying
genetic diversity among 175 accessions from 9 Central and South-Estern Mexican states
including toxic and non-toxic accessions of J. curcas with AFLP markers. The accessions used
in the present investigation showed low level of variation as indicated by Na, Ne, He and I.
However, as compared with exotic collections, indigenous accessions showed comparatively
higher values for these genetic parameters except He. The exotic accessions had comparatively
higher number of unique alleles (0.92 allele/accessions) than indigenous accessions (0.71
alleles/accessions) which might be due to the fact that exotic accessions were collected from a
wider range of geographic and climatic conditions.
Further, the data of 152 alleles of 41 loci produced on 96 accessions were utilized to
prepare distance matrix based of Jaccard’s coefficient. The genetic dissimilarity ranged from
0.02 to 0.80 with an average of 0.32±0.11 and maximum was noticed between accession
NBJC195 and NBJC143 (0.80) followed by NBJC195 and NBJC124 (0.79) and NBJC195 and
NBJC153 (0.77). The intra-specific crosses among these accessions could be useful for
developing mapping population in J. curcas as well as genetic improvement through selection of
desirable hybrids. In agreement to the present investigation, the low level of genetic diversity in
J. curcas was also reported earlier by Rosado et al. (2010), Sudheer et al. (2010), Sato et al.
(2011), Shen et al. (2012) and Ouattara et al. (2014). However, higher genetic diversity were
reported by Pecina-Quintero et al. (2014), and Salvador-Figueroa et al. (2014) among Mexican
accessions. Tatikonda et al. (2009) and Wen et al. (2010) also reported high level of genetic
diversity in J. curcas.
The genetic distance matrix produced was used to create a neighbor joining (NJ) tree
using DARwin 5 with 1,000 replicate bootstrap. The dendrogram classified all the 96 accessions
into 3 major clusters, namely A, B and C (Figure 4.17). The bootstrap value of cluster C was
found to be highly significant and that of cluster A and B was very low. The cluster A
accommodated maximum of 77 (80%) accessions, followed by cluster B (26 accessions) and
cluster C (3 accessions). The cluster A could be further divided into 3 subclusters i.e. AI (51

152
accessions), AII (25 accessions) and AIII (1 accession). The sub-cluster AI included 16 (31.0%)
exotic accessions from different countries such as South America, Western Africa, Eastern
Africa, Central America, Middle Africa, Southern Asia, South-East Asia and Eastern China.
Besides, it also contained indigenous accessions from 16 different states of India. Sub-cluster AII
had 25 accessions and among these 4 (16.0%) were of exotic origin from South America,and
Southeastern Asia. The rest 21 were represented by indigenous accessions from 10 different
states of India. The subcluster AIII had only one accession from South Africa. The cluster B
contained 16 (26%) accessions with maximum of indigenous accessions (87%) representing 12
states of India. The cluster C was very unique and had three non-toxic accessions of J. curcas
from Mexico, Central America (NBJC 194, NBJC 195 and NBJC 196). The neighbor joining
clustering showed that most of the exotic accessions (81.0%, 21 out of 26) were grouped in
single cluster i.e. cluster A along with the indigenous accessions indicating low levels of genetic
diversity across the global collections of J. curcas. On the other hand, three non-toxic accessions
grouped into a single and distant cluster (cluster C) indicating that these accessions are widely
distinct from toxic accessions at genetic level too. The higher bootstrap value of cluster C
strongly supported the distinct group, however, the low bootstrap value of cluster A and B
indicated that the relative positions of the accessions of these clusters may vary if the
dendrogram is rebuilt. In contrary to Tatikonda et al. (2009) the clustering pattern in the present
investigation was not in accordance to geographical distribution. Considering the cluster wise
genetic dissimilarity, accessions of cluster B showed higher mean genetic dissimilarity
(0.40±0.02) followed by cluster C (0.29±0.05) and cluster A (0.25±0.01) and thus the accessions
from cluster B can be considered comparatively diverse than those of cluster A.
The clustering pattern indicated that the maximum genetic similarity found among
various accessions might be due to the ancestral closeness or duplication of the accessions.
Since, J. curcas is mainly propagated through cuttings (vegetative propagation) the possibility of
duplication of accessions and distribution in different parts of the country becomes high. Thus,
analysis of genetic diversity using molecular markers becomes more important to avoid wrong
selection of accessions for hybridization and genetic improvement programs. The vegetative
mode of reproduction could also be one of the reasons for low genetic diversity in J. curcas.
According to the review by Ellstrand and Roose (1987), the plant species with predominantly
vegetative reproduction generally, have lower level of genetic diversity than species that
successfully produce progeny solely by sexual reproduction. It is interesting to note that the

153
cluster A comprises at least one representative indigenous accession from all the 23 states of
India used in the study except Meghalaya and 81.0% exotic accessions. This further illustrates
the existence of low level of genetic diversity not only in indigenous accessions but also in exotic
accessions.
Further, in order to determine the genetic structure and define the number of cluster (gene
pool), model-based clustering was also carried out which showed almost similar pattern as
obtained in neighbor joining based dendrogram. All the 96 accessions were differentiated into
four genetically distinct subpopulations (K=4) based on maximum K values (Figure 4.18 a, b).
Based on membership probability, 29 accessions were assigned to subpopulation 1 with mixed
accessions of indigenous (77%) and exotic (23%) collections and 51 accessions with 70%
indigenous and 30% exotic collections assigned to subpopulation 2. The subpopulation 3 had 13
accessions and all belonged to the indigenous collections except one (NBJC187). The
subpopulation 4 is quite unique having three exclusive non-toxic accessions indicating their
diverse genetic makeup. The clustering of both exotic and indigenous accessions in the same
subpopulation indicated low genetic differentiation. Earlier, Sato et al. (2011) has also reported
significant phylogenetic relationship among Asian and African lines using SSR markers. Basha
and Sujatha (2007) also showed a unique pattern of non-toxic accession while studying genetic
diversity among 42 accessions of J. curcas using RAPD and ISSR markers and developed SCAR
markers that can differentiate non-toxic accessions. Basha et al. (2009) further evaluated 72 J.
curcas accessions from 13 countries using RAPD, ISSR and SSR markers and showed that 12
SSR markers differentiated the non-toxic Mexican accessions and disclosed novel alleles.
Pamidimarri et al. (2009) characterized toxic and non-toxic accession of J. curcas through
RAPD and AFLP markers and identified polymorphic markers that can differentiate toxic and
non-toxic accessions. Tanya et al. (2011) developed new EST-SSRs and identified 5
polymorphic SSRs which clearly displayed distinct banding pattern between non-toxic Mexican
and toxic Asian accessions. Furthermore, high molecular genetic diversity among J. curcas
population from Mexico has been reported earlier by Pecina-Quintero et al. (2011, 2014), Shen
et al. (2012), Pamidimarri and Reddy (2014) and Salvador-Figueroa et al. (2014). It is interesting
to note that the newly developed SSR markers also have the ability to differentiate toxic and non-
toxic accessions. Further, apart from utilization in the development of mapping population, the
non-toxic accessions will also serve as a potential genetic resource for further genetic
improvement of J. curcas.

154
5.5 Molecular characterization of interspecific hybrid of J. curcas x J.
integerrima
Almost every study carried out to evaluate the genetic variability in J. curcas either based on
morphological traits or on molecular markers showed low genetic divergence. Therefore, it was
an urgent need to search an alternative way to create genetic variation which could be later
exploited for various genetic studies and improvement of J. curcas. Previously, Sujatha and
Prabakaran (2003) and Parthiban et al. (2009) have reported the development of hybrid progeny
by interspecific crosses between J. curcas and J. integerrima. Therefore, an interspecific cross
was developed between J. curcas and J. intergerrima and large number of F1 hybrids raised.
These F1 hybrids were characterized using SSR markers and results obtained are discussed here.
More than 300 crosses were attempted and able to develop and establish 94 F1 hybrids in the
field. The crosses were made by taking J. curcas as female and J. intergerrima as male. The
reciprocal crosses were not successful. It has previously been also shown that crosses were
unsuccessful when J. integerrima was used as female parent (Dhillon et al. 2009). The reason for
unsuccessful reciprocal crosses has not been explored yet. The developed interspecific hybrids
were found to be vigorous in appearance, freely flowering and morphologically intermediate
between the parents. The most of the hybrids resembled the female parents in terms of stem type
and leaf shape while for flower color, pigmentation, fruit size tended towards the male parent.
The hybrid plants flowered much early than J. curcas. This trait might be governed by the
genetic loci coming from J. integerrima as it has early flowering than J. curcas. The SSR based
characterization of all the 94 F1 hybrids showed variation at various loci. The allelic pattern of
parents was shared in the hybrids showing true hybrids. However, some new allelic pattern was
also observed having no similarities with the parents which might be due to new allelic
recombination developed during crossing of genome of two different species. The different
allelic pattern in different F1 hybrid was expected as the parental lines were reported to be
heterozygous in nature due to cross pollination behavior as in case of tree plants. The clustering
of F1 hybrid based on SSR data showed that the maximum number of interspecific hybrids had
similarities with the female parents while few were grouped with male parents. Likewise,
Sujatha and Prabakaran (2003) and Dhillon et al. (2009) reported similar results. J. integerrima
does not exhibit most agronomic or commercially useful traits. However, interspecific
hybridization with compatible species leads to generation of valuable material due to
heterozygosity at several loci. A large number of genes express differential alleles in a hybrid,

155
which if resulting from genetically diverse parents permits large numbers of permutations and
combinations, in turn resulting in pronounced range of differences in the progeny in comparison
to the parents. The developed interspecific population can be used in the future for linkage and
QTL mapping. Several researchers have utilized interspecific population for linkage and QTL
mapping. Wang et al. (2011) constructed first generation linkage map of J. curcas with 216 SSRs
and 290 SNPs. King et al. (2013) developed linkage map from four F2 mapping populations that
reveals a locus controlling the biosynthesis of phorbol esters. Sun et al. (2012) developed linkage
map and reported QTLs associated with growth and seed in J. curcas. Liu et al. (2011) identified
18 QTL underlying the oil traits and 3 eQTLs of the oleosin genes using backcrossing population
(286) derived from crosses with J. curcas and J. integerrima. The interspecific population
developed in the present investigation could also be utilized for linkage and QTL mapping for
identification of additional markers related to various agronomic important traits. The trait
associated markers could be used for marker assisted breeding (MAB) in Jatropha genetic
improvement programs.
5.6 Assessment of heterozygosity in J. curcas L.
The tree breeding is more difficult by the changes that occur during the transition from juvenility
to maturity. Breeding populations can be characterized by quantifying the levels and
organization of genetic variation within and between different breeding groups. Under the
appropriate conditions, markers can replace phenotypic selection, thereby removing the need for
growing or rearing of individuals (Chen et al. 2010). Markers- based systems have been used to
study and compare the levels of random genetic variation throughout the different cycles of a
breeding programme, thus allowing much greater flexibility and control over the rate of
reduction of genetic variability (Lia and Wua 2007). A correlation between individual
heterozygosities of parents and their offspring arises from the fact that, at most allelic
frequencies, heterozygous parents produce higher proportion of heterozygous progeny than do
homozygous parents (Mitton et al. 1993). Microsatellite markers are an efficient tool for the
assessment of heterozygosity and homozygosity. In the present investigation, the heterozygosity
was assessed in J. curcas using SSR markers. Majority of the SSRs (64%) used to assess the
heterozygosity were found to be monomorphic and 36% polymorphic. Majority of the markers
(61%, 11 out of 18) showed heterozygosity variation from 0.00 to 0.22 indicating low level of
heterozygosity at these loci.

Chapter 6 Summary
156
The present investigation entitled “Development and application of microsatellite markers
for diversity analysis in Jatropha curcas L.” was undertaken with the following objectives:
1. Phenotypic characterization of indigenous accessions of J. curcas.
2. Development of large scale genomic derived SSRs from four microsatellite enriched
genomic libraries.
3. PCR optimization, polymorphism detection and characterization of developed SSRs for
various attributes.
4. Study of molecular genetic diversity among indigenous and exotic accessions of
J. curcas.
The outcome and conclusion of the research work done during the present investigation
are summarized as under:
The material for the phenotypic characterization of J. curcas was collected from the
different states of India and represented by 80 accessions. The genetic variability of 80
accessions were recorded for the 10 agronomically important traits i.e. Male flowers/plant,
Male/female ratio, Number of fruits/plant, Number of seeds/plant, Fruit weight/plant (g),
Seed weight/plant (g), Seed length (mm), Seed width (mm) and Oil content (%)
The analysis of variance revealed significant differences for all the traits. The oil
content varied between 20.8 to 36.1% with an average of 26.2±0.38. Out of 80 accessions, 37
accessions had seed weight/plant above average value (i.e.180.2g) and of which only 4
accessions had seed weight/plant above 250g with maximum in accession NBJC1078
(273.08g). Likewise, 26 accessions had oil content above average value of 26.2% and only 3
accessions namely NBJC1055, NBJC1051 and NBJC1048 having oil content above 35%.
The genetic variance showed that the traits as male flowers/plant, fruit weight/plant,
seed length, seed width and oil content were not much influenced by environmental factors as
these traits showed lower error variance than the genotypic variance. The PCV was found to
higher than that of GCV for all the traits with remarkable differences in their values.
However, the traits as seed length, seed width and oil content had very insignificant
differences in PCV and GCV values. Higher broad sense heritability was observed for oil
content (90%), seed length (88%), and seed width (87%) which indicates that these characters
are under genotypic control.
The hierarchical clustering based on morphological traits grouped all the accessions
into 4 clusters. The majority of accessions (70%) were genetically close to each other and
grouped in two clusters. The cluster II was largest with 29 accessions collected from 11 states
India. The cluster I is second largest comprising 27 accessions. The cluster III was the

157
smallest with 6 accessions. The cluster III showed maximum genetic distance with cluster I,
followed by cluster IV and cluster II suggesting comparatively wider genetic diversity among
them. The accessions from these clusters could be utilized in hybridization program to get
desirable transgressive segregants in their offspring, as there is a higher probability that
unrelated genotypes would contribute unique desirable alleles at different loci
The Principal Component Analysis (PCA) showed that first four principal
components (PCs) accounting for more than 93% of the total variation. The first principal
components accounted for 42.5% of the total variation mainly due to seed length, seed width,
seed weight/plant and number of seeds/plant which had maximum and positive weight on this
component. Oil content had negative weight on PC1. Thus, PC1 related to the accessions
with thick seeds, moderate to high seed yielder with low oil content.
Correlation analysis showed that seed weight/plant was significantly and positively
associated with female flowers/plant, male flowers/plant, number of flowers/plant, number of
seeds/plant, fruit weight/plant, seed width and negatively associated with oil content. Oil
content was negatively and significantly correlated with all the traits studied with strong
negative association with female flowers/plant followed by male flowers/plant, number of
seeds/plant, fruit weight/plant and seed weight/plant. The positive and significant association
of major component traits among themselves in general and with seed weight/plant in
particular suggests that selection of component traits jointly or individually may enhance the
seed yield. However, oil yield could be compromised upto some extent as it showed negative
association with most of the component traits. Therefore, precaution should be taken while
selecting a plant type based on component traits so that both seed yield and oil yield could be
optimized to its maximum potential.
Path coefficient showed that the male flowers/plant had the maximum positive direct
effect on seed yield while female flowers/plant, male female ratio, fruit weight/plant, seed
length exhibited negative direct effect on seed yield. The oil content had negative correlation
for all the traits. The positive direct effect of male flowers/plant, number of fruits/plant,
number of seeds/plant, seed width and oil content for seed yield/plant. The results of the
present investigation suggests that selection in J. curcas based on male flowers/plant, number
of fruits/plant, number of seeds/plant, seed width and oil content would be advantageous to
achieve the desirable goals.
Four SSR enriched genomic libraries (Lib A, Lib B, Lib C and Lib D) were developed
from genomic DNA of J. curcas including two di-nucleotide enriched and two tri-nucleotide
enriched SSR motifs. Among di-nucleotide a total of 639 (46.1%) and 676 (50.3%) SSR

158
containing sequences were developed from Lib A and B respectively. Out of 1,315 SSRs
(48.2%), 1207 (44.2%) were found to be suitable for primer designing from both the libraries.
From Lib A, 152 sequences and from Lib B, 191 sequences were found to have >1
SSRs. In total, 343 sequences were found to have >1 SSRs from the both libraries. Among
the total SSRs identified, the perfect SSRs were found to be 928 from both the libraries. The
enrichment percentage was found to be higher for GA repeat motif (87.9%) than CA repeat
motif (79.6%). The SSR repeat length analysis revealed that the majority of identified SSRs
i.e. 557 from Lib A and 500 from Lib B were of short length varied from 4 to 10 repeat units.
The AC/GT and AG/CT motif, the targeted motif, were recovered in higher frequency from
Lib A and Lib B respectively.
Out of 1207, a total of 248 polymorphic SSR were identified with a panel of 7
accessions of J. curcas. Furthermore, 179 and 331 SSR were found polymorphic among
parental lines of NBRI-J05 (NBJC132) x EC643912 (NBJC195) and Chhatrapati (NBJC147)
x J. integerrima used for development of two mapping populations respectively. The rate of
polymorphism was quite low among intra-specific parental lines (Lib A SSRs ~12%, Lib. B
SSRs~ 19%) as compared to interspecific parental lines (Lib. A SSRs ~25%, Lib B SSRs
~33%). The majority of the SSRs (71%) showed lower PIC value. The cross species
transferability of SSRs to J. integerrima was ~52%.
The trinucleotide enriched libraries (Lib C and D) were subjected to Roche 454 GS-
FLX sequencing for SSR development. A total of 25,495 raw reads (6.79 Mb) were generated
including 2,845 contigs and 22,650 singletons. A total of 5,844 putative microsatellites were
identified in 5,141 sequences with 23% SSR recovery. Six hundred nine sequences have
more than one SSR loci and 485 SSRs were found to be present in compound form. Out of
5,141 microsatellites containing sequences, 1,122 primer pairs were designed and synthesized
for validation and characterization.
The tri-nucleotide repeat SSRs was found in maximum numbers (59%) which was as
per expectation and among which AAT/ATT and AAG/CTT were found in major frequency
(73.2%) followed by ATC/ATG (7.0%) and ACC/GGT (6.0%). Most of the SSRs (5,559;
59%) had short repeat length varied in the range of 4-10.
The 1,122 SSRs were genotyped with a subset of 7 accessions of J. curcas and one
accession of J. integerrima. Out of 1,122 SSRs, 447 (39.83%) were found to be polymorphic
among 7 accessions of J. curcas. The number of alleles varied between 2 to 9 with an
average of 2.7±1.18 per markers. The PIC values of polymorphic SSRs ranged from 0.12 to
0.85 (average 0.34±0.17). Majority of SSRs (211, 47%) showed low PIC value (<0.30).
Approximately half of the SSRs (49.2%) showed moderate range of PIC value. However,

159
only 4% SSRs showed higher PIC value in the range of 0.71 – 0.90. The developed SSRs
showed higher transferability rate (76%) to J. integerrima.
Based on the PIC value and other parameters the SSRs JGM_A281, JGM_A326,
JGM_A244, JGM_A107, JGM_A577, JGM_B300, JGM_B361, JGM_B595, JGM_B176,
JGM_B330, JGM_B248 from Lib A and B and JGM_CD928, JGM_CD1067, JGM_CD911,
JGM_CD650, JGM_CD926, JGM_CD887, JGM_CD914, JGM_CD940, JGM_CD916,
JGM_CD857, JGM_CD873 from Lib C and D were found to be highly informative and could
be potential markers for various genetic studies in J.curcas.
The similarity search of SSR containing sequences showed maximum similarity of
63% with Ricinus communis (F. Euphorbiaceae). Significant similarity was also observed
with Populus trichocarpa (19%), Vitis vinifera (9%), Glycine max (3%) and Medicago
truncatula (2%).
The polymorphism analysis of all the newly developed SSRs (2,329) resulted in
identification of 2,016 working SSRs (1089 from Lib A and B, 1017 from Lib C and D) to
enrich the repertoire of SSR marker for J. cu/cas. A total of 695 polymorphic SSRs have been
identified for J. curcas and have been characterized for various attributes. These newly
developed SSRs may facilitate construction of high density linkage map, diversity analysis,
and QTL/association mapping and may be further utilized in making strategies for marker
assisted breeding towards developing high seed and oil yielding cultivars of J. curcas.
A total of 96 accessions of J. curcas which comprises 70 indigenous collections from
different states of India and 26 exotic collections were used for the genetic diversity analysis
with a set of 41 selected polymorphic SSR markers. Based on genotypic data of 152 alleles at
41 polymorphic SSR loci, a neighbor joining (NJ) tree was constructed using DARwin5 with
1,000 replicate bootstrap. The dendrogram classified all the 96 accessions into 3 major
clusters namely A, B and C. The cluster A accommodated maximum of 77 (80%) accessions
followed by cluster B (26 accessions) and cluster C (3 accessions). The cluster A could be
further divided into 3 subclusters i.e. AI (51 accessions), AII (25 accessions) and AIII (1
accession).
The neighbor joining clustering showed that most of the exotic accessions (81.0%, 21
out of 26) were grouped in single cluster i.e. cluster A along with the indigenous accessions
indicating low level of genetic diversity across the global collections of J. curcas. On the
other hand, three non-toxic accessions grouped into a single and distant cluster (cluster C)
indicating that these accessions are widely distinct from toxic accessions at genetic level too.

160
The model based cluster analysis also showed almost similar result as obtained in
dendrogram and grouped 96 accessions of J. curcas into four genetically distinct
subpopulations (K=4) based on maximum K values. Based on membership probability, 30
accessions assigned to subpopulation 1 with mixed accessions of indigenous (77%) and
exotic (23%) collections and 50 accessions with 70% indigenous and 30% exotic collections
assigned to subpopulation 2. The subpopulation 2 had 30 accessions. The subpopulation 3
had 13 accessions and all belonging to the indigenous collections except NBJC187. The
subpopulation 4 is quite unique having 3 exclusive exotic and non-toxic accessions
(NBJC194, NBJC195 and NBJC196).
In addition, a successful interspecific hybrid between J. curcas and J. integerrima
developed and 94 seedlings successfully raised in the field. The developed interspecific
hybrids were found to be vigorous in appearance, freely flowering and morphologically
intermediate between the parents. The 94 F1 hybrids were characterized using SSR markers
which showed variation at various SSR loci. The interspecific population could be utilized for
linkage and QTL mapping for identification of additional markers related to various
agronomic important traits.
The heterozygosity assessment of J. curcas using SSR markers showed majority of
the markers (61%, 11 out of 18) varied from 0.00 to 0.22 indicating low level of
heterozygosity in J. curcas. The heterozygosity assessment will also facilitate for the
selection of desired parent in the hybridization program for the genetic improvement of
J. curcas.

Chapter 7 References
161
Abdelkrim J, Robertson B, Stanton JA, Gemmell N (2009) Fast, cost-effective development of species-
specific microsatellite markers by genomic sequencing. Biotechniques 46:185-192.
Achten WMJ, Verchot L, Franken YJ, Mathijs E, Singh VP, Aerts R, Muys B (2008) Jatropha bio-
diesel production and use. Biomass and Bioenergy 32:1063-1084.
Agarwal M, Shrivastava N, Padh H (2008) Advances in molecular marker techniques and their
applications in plant sciences. Plant Cell Reports 27:617-631.
Agbogidi OM, Akparobi SO and Eruotor PG (2013) Health and environmental benefits of Jatropha
curcas linn. Applied Scientific Report 1: 36-39.
Akkaya MS, Bhagwat AA and Cregan PB (1992) Length polymorphisms of simple sequence repeat DNA
in Soybean. Genetics 132:1131-1139.
Alkimim ER, Sousa TV, Soares BO, Souza DA, Juhasz ACP, Nietsche S, Costa MR (2013) Genetic
diversity and molecular characterization of physic nut genotypes from the active germplasm bank
of the Agricultural Research Company of Minas Gerais, Brazil. African Journal of Biotechnology
12:907-913.
Allard RW (1999) Principles of Plant Breeding, 2nd
edn. New York, Wiley.
Alves AA, Bhering LL, Rosado TB, Laviola BG, Formighieri EF, Cruz CD (2013) Joint analysis of
phenotypic and molecular diversity provides new insights on the genetic variability of the Brazilian
physic nut germplasm bank. Genetics and Molecular Biology 36:371-381.
Ambrosi DG, Galla G, Purelli M, Barbi T, Fabbri A, Lucretti S (2010) DNA markers and FCSS analyses
shed light on the genetic diversity and reproductive strategy of Jatropha curcas L. Diversity 2:
810-836.
Andersen JR, Liberstedt T (2003) Functional markers in plants. Trends in Plant Science 8:554-560.
Anderson JA, Churchill GA, Autrique JE, Tanksley SD and Sorrells ME (1993) Optimizing parental
selection for genetic linkage maps. Genome 36:181-186.
Arcot SS, Wang Z, Weber JL, Deininger L and Batzer MA (1995) Alu repeats: A source for the genesis
of primate micro-satellites. Genomics 29:136-144.
Armour JAL, Alegre SA, Miles S, Williams LJ, Badge RM (1999) Minisatellites and mutation
processes in tandemly repetitive DNA. In: Goldstein DB, Schlotterer C (eds) Microsatellites:
evolution and applications. Oxford University Press, Oxford, pp. 24-33.
Armour JAL, Neumann R, Gobert S and Jefferys AJ (1994) Isolation of human simple repeat loci by
hybridization selection. Human Molecular Genetics 3: 599-605.
Arolu IW, Rafii MY, Hanafi MM, Mahmud TMM, Latif MA (2012) Molecular characterization of
Jatropha curcas germplasm using inter simple sequence repeat (ISSR) markers in Peninsular
Malaysia. Australian Journal of Crop Science 6: 1666-1673.
Atabani AE, Silitonga AS, Ong HC, Mahlia TMI, Masjuki HH, Irfan AB (2013) Non-edible vegetable
oils: a critical evaluation of oil extraction, fatty acid compositions, biodiesel production,
characteristics, engine performance and emissions production. Renewable and Sustainable
Energy Reviews 8:211-245.
Barkley NA, Dean RE, Pittman RN, Wang ML, Holbrook CC, Pederson GA (2007) Genetic diversity of
cultivated and wild-type peanuts evaluated with M13-tailed SSR markers and sequencing.
Genetical Research 89:93-106.
Barkley NA, Newman ML, Wang ML, Hotchkiss MW, Pederson GA (2005) Assessment of the genetic
diversity and phylogenetic relationships of a temperate bamboo collection by using transferred
EST-SSR markers. Genome 48:731-737.
Barkley NA, Roose ML, Krueger RR, Federici CT (2006) Assessing genetic diversity and population
structure in a Citrus germplasm collection utilizing simple sequence repeat markers (SSRs).
Theoretical and Applied Genetics 112:1519-1531.
Barreneche T, Casasoli M, Russell K, Akkak A, Meddour H,Plomion C, Villani F, Kremer A (2004)
Comparative mapping between Quercus and Castanea using simple-sequence repeats (SSRs).
Theoretical and Applied Genetics 108:558-566.

162
Barrett BA and Kidwell KK (1998) AFLP-based genetic diversity assessment among wheat cultivars
from the pacific North-West. Crop Science 38: 1261-1271.
Basha SD, Francis G, Makkar HPS, Becker K, Sujatha M (2009) A comparative study of biochemical
traits and molecular markers for assessment of genetic relationships between Jatropha curcas L.
germplasm from different countries. Plant Science 6:812-823.
Basha SD, Sujatha EM (2007) Inter and intra-population variability of Jatropha curcas (L.) characterized
by RAPD and ISSR markers and development of population specific SCAR markers. Euphytica
156: 375-386.
Beckmann JS, Weber JL (1992) Survey of human and rat microsatellites. Genomics 12:627-631.
Beer SC, Goffreda J, Phillips TD, Murphy JP, Sorrells ME (1993) Assessment of genetic variation in
Avena sterilis using morphological traits, isozymes and RFLPs. Crop Science 33:1386-1393.
Belewu MA, Adekola FA, Adebayo GB, Ameen OM, Muhammed NO, Olaniyan AM, Adekola OF and
Musa AK (2010) Physcio-Chemical characteristics of oil and Biodiesel from Nigerian and Indian
Jatropha curcas seeds. International Journal of Biological and Chemical Science 4:524-529.
Berchmans HJ, Hirata S (2008) Biodiesel production from crude Jatropha curcas L. seed oil with a high
content of free fatty acids. Bioresource Technology 99:1716-1721.
Bhatt GM (1973) Significance of path coefficient analysis in determining the nature of character
association. Euphytica 2:338-343.
Biabani A, Rafii MY, Saleh GB, Shabanimofrad M, Latif MA (2012) Phenotypic and genetic variation of
Jatropha curcas L. populations from different countries. Maydica 57:164-171.
BiabaniA, Rafii MY, Saleh GB, Latif MA (2013) Inter- and intra-population genetic variations in
Jatropha curcas populations revealed by inter-simple sequence repeat molecular markers. Maydica
58:111-118.
Billotte N, Lagoda PJL, Risterucci AM, Baurens FC (1999) Microsatellite-enriched libraries: applied
methodology for the development of SSR markers in tropical crops. Fruits 54:277-288.
Birnboim HC and Doly JA (1979) A rapid alkaline extraction procedure for screening recombinant
plasmid DNA. Nucleic Acid Research 7:1513-1523.
Boder P, Deak T, Bacso R, Velich I, Bisztray GD, Fascar G, Gyulai P (2006) Morphological and genetic
investigation of medieval grape seeds. Acta Horticulture (ISHS) 713-718.
Botstein D, White RL, Skolnick M, Davis RW (1980) Construction of genetic linkage map in man using
restriction fragment length polymorphisms. American Journal of Human Genetics 32:314-331.
Bowers JE, Dangl GS, Vignani R, Meredith CP (1996) Isolation and characterization of new
polymorphic simple sequence repeat loci in grape (Vitis vinifera L.). Genome 39: 628-633.
Brasileiro BP, Silva SA, Souza DR, Santos PA, Oliveira RS, Lyra DH (2013) Genetic diversity and
selection gain in the physic nut (Jatropha curcas). Genetics and Molecular Research 12:2341-
2350.
Breseghello F, Sorrells ME (2006a) Association analysis as a strategy for improvement of quantitative
traits in plants. Crop Science 46: 1323-1330.
Breseghello F, Sorrells ME (2006b) Association analysis as a strategy for improvement of quantitative
traits in plants. Crop Science 46:1323-1330.
Bressan EA, Scotton DC, Ferreira RR, Jorge EC, Sebbenn, AM, Gerald L, Figueira A (2012)
Development of microsatellite primers for Jatropha curcas (Euphorbiaceae) and transferability to
congeners. American Journal of Botany 99:237-239.
Bretting PK, Widrlechner MP (1995) Genetic markers and horticultural germplasm management. Hort
Science 30:1349-1356.
Brittaine R and Lutaladio Ne B (2010) Jatropha: A smallholder bioenergy crop the potential for Pro-poor
development. Integrated Crop Management Vol. 8-2010.
Brohele J, Ellegren H (1999) Microsatellite evolution: polarity of substitution within repeats and
neutrality of flanking sequences. Proceedings of Royal Society of London B, Biological Sciences
266: 825-833.
Brookfield JFY (1992) DNA Fingerprint in clonal organisms. Molecular Ecology 1:21-26.

163
Buerstmayr H, Lemmens M, Hartl L, Doldi L, Steiner B, Stierschneider M, Ruckenbauer P (2002)
Molecular mapping of QTLs for Fusarium head blight resistance in spring wheat. I. Resistance to
fungal spread (Type II resistance). Theoretical and Applied Genetics 104: 84-91.
Cai HW, Yuyama N, Tamaki H, Yoshizawa A (2003) Isolation and characterization of simple sequence
repeat markers in the hexaploid forage grass timothy (Phleum pretense L.). Theoretical and
Applied Genetics 107:1337-1349.
Cai Y, Sun D, Wu G, Peng J (2010) ISSR based genetic diversity of Jatropha curcas germplasm in
China. Biomass and Bioenergy 34:1739-50.
Camellia NA, Thohirah LA and Abdullah NAP (2012) Genetic relationships and diversity of Jatropha
curcas accessions in Malaysia. African Journal of Biotechnology 11: 3048-3054.
Cao Z, Wang P, Zhu X, Chen H, Zhang T (2014) SSR marker‑ assisted improvement of fiber qualities in
Gossypium hirsutum using G. barbadense introgression lines. Theoretical Applied Genetics DOI
10.1007/s00122-013-2241-3.
Cardle L, Ramsay L, Milbourne D, Macaulay M, Marshall D, Waugh R (2000) Computational and
experimental characterization of physically clustered simple sequence repeats in plants. Genetics
156:847-854.
Carvalho CR, Clarindo WR, Prac MM FS, Araujo Carels N (2008) Genome size base composition and
karyotype of Jatropha curcas L.: an important biofuel plant. Plant Science 174: 613-617.
Castillo A, Budak H, Martin AC, Dorado G, Borner A, Roder M, Hernandez P (2010) Interspecies and
intergenus transferability of barley and wheat D-genome microsatellite markers. Annals of Applied
Biology 156:347-356.
Castoe TA, Poole AW, Gu W, de Koning AP J, Daza JM, Smith EN, Pollock DD (2010) Rapid
identification of thousands of copperhead snake (Agkistrodon contortrix) microsatellite loci from
modest amounts of 454 shotgun genome sequence. Molecular Ecology Resources 10:341-347.
Chambers GK and MacAvoy ES (2000) Microsatellites: consensus and controversy. Comparative
Biochemistry and Physiology 126: 455-476.
Chai L, Biswas MK, Yi H, Guo W, Deng X (2013) Transferability, polymorphism and effectiveness for
genetic mapping of the Pummelo (Citrus grandis Osbeck) EST-SSR markers. Scientia
Horticulturae 155:85-91.
Charlesworth B, Sniegowski P, Stephan W (1994) The evolutionary dynamics of repetitive DNA in
eukaryotes. Nature 371: 215-220.
Chen K, Knorr C, Bornemann KK, Ren J, Huang L, Rohrer GA, Brenig B (2005) Targeted
oligonucleotide-mediated microsatellite identification (TOMMI) from large-insert library clones.
BMC Genetics 6:54.
Chen SY, Lin YT, Lin CW, Chen WY, Yang CH, Ku HM (2010) Transferability of rice SSR markers to
bamboo. Euphytica 175:23-33.
Chen X and Sullivan PF (2003) Single nucleotide polymorphism genotyping: biochemistry, protocol, cost
and throughput. Pharmacogenomics Journal 3: 77-96.
Christo LF, Colodetti TV, Rodrigues WN, Martins LD, Brinate SB, Amaral JFT, Laviola BG, Tomaz MA
(2014) Genetic variability among genotypes of physic nut regarding seed biometry. American
Journal of Plant Sciences 5:1416-1422.
Cifarelli RA, Gallitelli M and Cellini F (1995) Random amplified hybridization microsatellites (RAHM):
isolation of a new class of microsatellite-containing DNA clones. Nucleic Acids Research
23:3802-3803.
Condit R, Hubbell SP (1991) Abundance and DNA sequence of two-base repeat regions in tropical tree
genomes. Genome 34: 66-71.
Connell JP, Pammi S, Iqbal MJ, Huizinga T, Reddy AS (1998) A high throughput procedure for capturing
microsatellites from complex plant genomes. Plant Molecular Biology Report 16:341-49.
Cooper S, Bull CM, Gardner MG (1997) Characterization of microsatellite loci from the socially
monogamous lizard Tiliqua rugosa usisng a PCR-based isolation technique. Molecular Ecology
6:793-795.
164
Cordeiro GM, Casu R, McIntyre CL, Manners JM, Henry RJ (2001) Microsatellite markers from
sugarcane (Saccharum spp.) ESTs across transferable to Erianthus and Sorghum. Plant Science
160:1115-1123.
Costa HPS, Oliveira JTA, Sousa DOB, Morais JKS, Moreno FB, Monteiro-Moreira ACO, Viegas RA and
Vasconcelos IM (2014) JcTI-I: a novel trypsin inhibitor from Jatropha curcas seed cake with
potential for bacterial infection treatment. Frontier in Microbiology 5:1-12.
Cox TS, Murphy JP and Rodgers DM (1986) Changes in genetic diversity in the red winter wheat regions
of the United States. Proceeding of National Academy Science (USA) 83:5583-5586.
Crossa J, Burgueno J, Dreisigacker S, Vargas M, Herrera FSA, Lillemo M, Singh RP, Trethowan R,
Warburton M, Franco J (2007) Association analysis of historical bread wheat germplasm using
additive genetic covariance of relatives and population structure. Genetics 177: 1889-1913.
Csencsics D, Brodbeck S, Holderegger R (2010) Cost-effective, species-specific microsatellite
development for the endangered Dwarf Bulrush (Typhaminima) using next-generation sequencing
technology. Journal of Heredity 101:789-793.
Cubry P, Pujade-Renaud V, Garcia D, Espeout S, Le Guen V, Granet F, Seguin M (2014) Development
and characterization of a new set of 164 polymorphic EST-SSR markers for diversity and breeding
studies in rubber tree (Hevea brasiliensis Mull. Arg.). Plant Breeding DOI: 10.1111/pbr.12158.
Cuc LM, Mace ES, Crouch JH, Quang VD, Long TD, Varshney RK (2008) Isolation and characterization
of novel microsatellite markers and their application for diversity assessment in cultivated
groundnut (Arachis hypogaea). BMC Plant Biology 8: 55.
Cui F, Fan X, Zhao C, Zhang W, Chen M, Ji J, Li J (2014) A novel genetic map of wheat: utility for
mapping QTL for yield under different nitrogen treatments. BMC Genetics 15:57.
Dahake R, Roy S, Patil D, Chowdhary A, Deshmukh RA (2012) Evaluation of anti-viral activity of
Jatropha curcas leaf extracts against potentially drug-resistant HIV isolates. BMC Infectious
Diseases 12:P14.
Das S, Misra RC, Mahapatra AK, Gantayat BP, Pattnaik RK (2010) Genetic variability, character
association and path analysis in Jatropha Curcas. American-Eurasian Journal of Sustainable
Agriculture 4:147-151.
Dehgan B (1984): Phylogenetic significance of interspecific hybridization in Jatropha (Euphorbiaceae).
Systematics Botany 9:467- 478.
Dewey JR and Lu KH (1959) A correlation and path co-efficient analysis of components of crested wheat
seed production. Agronomy Journal 51:515-518.
Dhillon RS, Hooda MS, Jattan M, Chawla V, Bhardwaj M, Goyal SC (2009) Development and molecular
characterization of interspecific hybrids of Jatropha curcas and J. integerrima. Indian Journal of
Biotechnology 8:384-390.
Dhillon RS, Saharan RP, Jattan M, Rani T, Sheok RN, Dalal V and Von Wuehlisch G (2014) Molecular
characterization of induced mutagenesis through gamma radiation using RAPD markers in
Jatropha curcas L. African Journal of Biotechnology 13:807-813.
Dieringer D & Schlotterer C (2003) Two distinct modes of microsatellite mutation processes: evidence
from the complete genomic sequences of nine species. Genome Research 13:2242-2251.
Ding JQ, Ma JL, Zhang CR, Dong HF, Xi ZY, Xia ZL, Wu JY (2011) QTL mapping for test weight by
using F2:3 population in maize. Journal of Genetics 90:75-80.
Divakara BN, Upadhyaya HD, Wani SP, Gowda LCL (2010) Biology and genetic improvement of
Jatropha curcas L.: A review. Applied Energy 87:732-742.
Earl DA, vonHoldt BM (2012) STRUCTURE HARVESTER: a website and program for visualizing
STRUCTURE output and implementing the Evanno method. Conservation Genetics Resources
4:359-361.
Edwards KJ, Barker JHA, Daly A, Jones C, and Karp A (1996) Microsatellite libraries enriched for
several microsatellite sequences in plants. Biotechniques 20: 758-760.
Ekblom R and Galindo J (2011) Application of next generation sequencing in molecular ecology of non-
model organisms. Heredity 107:1-15.

165
Ellegren Hans (2004) Microsatellites: simple sequences with complex evolution. Nature Reviews 5: 435-
445.
Ellstrand NC and Roose ML (1987) Patterns of genotypic diversity in clonal plant species. American
Journal of Botany 74: 123-131.
Ender A, Schwenk K, Stdler T, Streit B, Schierwater B (1996) RAPD identification of microsatellites in
Daphnia. Molecular Ecology 5:437-441.
Erschadi S, Haberer G, Schoniger M, TorresRuiz RA (2000) Estimating genetic diversity of Arabidopsis
thaliana ecotypes with amplified fragment length polymorphisms (AFLP). Theoretical and
Applied Genetics 100: 633-640.
Evanno G, Regnaut S, Goudet J (2005) Detecting the number of clusters of individuals using the software
STRUCTURE: a simulation study. Molecular Ecology 14:2611-2620.
Excoffier L, Smouse PE, Quattro JM (1992) Analysis of molecular variance inferred from metric
distances among DNA haplotypes: Application to human mitochondrial DNA restriction data.
Genetics 131:479-491.
Fairless D (2007) Biofuel: the little shrub that could-maybe. Nature 449: 652-655.
Falconer DS (1989) Introduction to quantitative genetics. 3rd
ed. Longman Sci. and Techn, London.
Feng N, Hea Z, Zhanga Y, Xia X, Zhang Y (2013) QTL mapping of starch granule size in common wheat
using recombinant inbred lines derived from a PH82-2/Neixiang 188 cross. The crop Journal
1:166-171.
Ferguson ME, Burow MD, Schultz SR, Bramel PJ, Paterson AH, Kresovich S, Mitchell S (2004)
Microsatellite identification and characterization in peanut (A. hypogaea L.). Theoretical and
Applied Genetics 108:1064-1070.
Fisher D, Bachmann K (1998) Microsatellite enrichment in organisms with large genomes (Allium cepa
L.). BioTechniques 24:796-802.
Fisher PJ, Gardner RC and Richardson TE (1996) Single locus microsatellites isolated using 5′anchored
PCR. Nucleic Acids Research 24:4369-4371.
Flachowsky H, Schumann E, Weber WE, Peil A (2001) Application of AFLP for the detection of sex-
specific markers in hemp. Plant Breeding120:305-309.
Foidl N, Foidl G, Sanchez M, Mittelbach M, Hackel S (1996) Jatropha curcas L. as a source for the
production of biofuel in Nicaragua. Bioresour Technology 58:77-82.
Gairola KC, Nautiyal AR, Sharma G, Dwivedi AK (2011) Variability in seed characteristics of Jatropha
curcas Linn. from hill region of Uttarakhand. Bulletin of Environment, Pharmacology and Life
Sciences 1:64-69.
Ganesh Ram S, Parthiban KT, Kumar RS, Thiruvengadam V, Paramathma M (2008) Genetic diversity
among Jatropha species as revealed by RAPD markers. Genetic Recourses Crop Evolution
55:803-809.
Gao SQ, Qu J, Chua NH, Ye J (2010) A new strain of Indian cassava mosaic virus causes a mosaic
disease in the biodiesel crop Jatropha curcas. Archives of Virology 155:607-612.
Ghosh L and Singh L (2011) Variation in seed and seedling characters of Jatropha curcas L. with varying
zones and provenances. Tropical Ecology 52:113-122.
Ginwal HS, Phartyal SS, Rawat PS, Srivastava RL (2005) Seed source variation in morphology,
germination and seedling growth of Jatropha curcas Linn. in central India. Silvae Genetica 54:76-
80.
Gmunder S, Singh R, Pfister S, Adheloya A and Zah R (2012) Environmental impacts of J. curcas
biodiesel in India. Journal of Biomedicine and Biotechnology Volume 2012.
Godt MJ, Hamrick JL (1999) Population genetic analysis of Elliottia racemosa (Ericaceae), a rare
Georgia shrub. Molecular Ecology 8:75-82.
Goldstein DB and Schlotterer C (1999) “Microsatellites: Evolution and Applications.” Oxford Press,
Oxford UK.
Goldstein DB, Pollock DD (1997) Launching microsatellites: a review of mutation processes and
methods of phylogenetic inference. Journal of Heredity 88:335-342.

166
Gopale KD and Zunjarrao RS (2013) Evaluation of genetic diversity of Jatropha Curcas L. using RAPD
markers in Maharashtra. International Journal of Pure and Applied Science and Technology14:
12-24.
Grafius JE (1964) A geometry for plant breeding. Crop Science 4:241-246.
Grativol C, Fonseca D, Lira-MC, Hemerly AS, Ferreira PC (2011) High efficiency and reliability of inter-
simple sequence repeats (ISSR) markers for evaluation of genetic diversity in Brazilian cultivated
Jatropha curcas L. accessions. Molecular Biological Report 38:4245-4256.
Grodzicker T, Williams J, Sharp P, Sambrook J (1975) Physical mapping of temperature sensitive
mutants of adenovirus. Cold Spring Harbor Symposia on Quantitative Biology 39:439-446.
Guan J, Yu H, Zhang J, Yang R, Fan Y-h (2013) Study on seed morphology and genetic diversity of
Jatropha curcas L. from different provenances. Advance Journal of Food Science and
Technology 5:169-173.
Guo Y, Yang X, Chander S, Yana J, Zhang J, Song T, Li J (2013) Identification of unconditional and
conditional QTL for oil, protein and starch content in maize. The Crop Journal 1:34-42.
Gupta PK, Rustgi S, Sharma S, Sing R, Kumar N, Balyan HS (2003)Transferable EST-SSR
markers for the study of polymorphism and genetic diversity in bread wheat. Molecular
Genetics and Genomics 270:315-323.
Gupta P, Idris A, Mantri S, Asif MH, Yadav HK, Roy JK, Tuli R, Mohanty CS, Sawant SV (2012a)
Discovery and use of single nucleotide polymorphic (SNP) markers in Jatropha curcas L.
Molecular Breeding 30:1325-1335.
Gupta S, Kumari K, Sahu PP, Vidapu S, Prasad M (2012b) Sequence-based novel genomic microsatellite
markers for robust genotyping purposes in foxtail millet [Setaria italica (L.) P Beauv]. Plant
Cell Reports 31:323-337.
Gupta PK, Roy JK, Prasad M (2001) Single nucleotide polymorphisms: A new paradigm for molecular
marker technology and DNA polymorphism detection with emphasis on their use in plants.
Current Science 80:524-535.
Haimei C, Linzhi L, Xianyun W, Sishen L, Tiandong L, Haizhou H., Honggang W, Xiansheng Z (2005)
Development, chromosome location and genetic mapping of EST-SSR markers in wheat. Chinese
Science Bulletin 50: 2328-2336.
Hamada H, Petrino MG, Kakunaga T (1982) A novel repeated element with Z-DNA-forming potential is
widely found in evolutionarily diverse eukaryotic genomes. Proceeding of the National Academy
of Sciences USA 79:6465-6469.
Hamdan YAS, García-Moreno MJ, Redondo-Nevado J, Velasco L, Pérez-Vich B (2011) Development
and characterization of genomic microsatellite markers in safflower (Carthamus tinctorius L.).
Plant breeding 130:237-241.
Hamilton MB, Pincus EL, Di Fiore A, and Fleischer RC (1999) Universal linker and ligation procedures
for construction of genomic DNA libraries enriched for microsatellites. BioTechniques 27: 500-
507.
Hamrick JL, Godt MJ (1990) Allozyme diversity in plant species. Pages 43-63 in Brown AHD, MT
Clegg, AL Kahler and BS Weir eds. Plant population genetics, breeding and genetic resources.
Sinauer Associates Inc, Sunderland.
Hancock JM (1995) The contribution of slippage like process to genome evaluation. Journal of
Molecular Evolution 41:1038-1047.
Hancock JM (1999) Microsatellites and other simple sequences: genomic context and mutational
mechanisms. In: Goldstein DB, Schlotterer C (eds) Microsatellites: evolution and applications.
Oxford University Press, Oxford, pp. 1-9.
Hao X, Li X, Yang X, Li J (2014) Transferring a major QTL for oil content using marker-assisted
backcrossing into an elite hybrid to increase the oil content in maize. Molecular Breeding DOI
10.1007/s11032-014-0071-x.
Harding RM, Boyce AJ and Clegg JB (1992) The evolution of tandemly repetitive DNA: recombination
rules. Genetics 132: 847-859.

167
He C, Poysa V, Yu K (2003) Development and characterization of simple sequence repeat (SSR) markers
and their use in determining relationships among Lycopersicon esculentum cultivars. Theoretical
and Applied Genetics 106:363-373.
He W, Guo L, Wang L, Yang W, Tang L, Cheng F (2007) ISSR analysis of genetic diversity of J. curcas
L. Chinese. Journal of Applied and Environmental Biology 13:466–70.
Helentjaris T, Slocum M, Wright S, Schaefer A, Nienhuis J (1986) Construction of genetic
linkage maps in maize and tomato usingrestriction fragment length polymorphisms.
Theoretical and Applied Genetics 61:650-658.
Heller J (1996) Physic Nut- Jatropha curcas L.-Promoting the conservation and use of underutilized and
neglected crops. PhD dissertation at the Institute of Plant Genetic and Crop Plant Research,
Gatersleben, Germany & International Plant Genetic Resource.
Hill J, Becker HC and Tigerstedt PMA (1998) Quantitative and ecological aspects of Plant Breeding.
Chapman and Hall, London.
Holland JB, Nyquist WE, Cervantes-Martinez CT (2002) Estimation and interpreting heritability for plant
breeding: An update. Plant Breeding Reviews 22: 9-112.
Hossain KG, Kawai H, Hayashi M, Hoshi M, Yamanaka N, Harada K (2000) Characterization and
identification of (CT)n microsatellites in soybean using sheared genomic libraries. DNA
Research7:103-110.
Hu Z, Zhang D, Zhang G, Kan G, Hong D, Yu D (2014) Association mapping of yield-related traits and
SSR markers in wild soybean (Glycine soja Sieb. and Zucc.). Breeding Science 63:441-449.
Huang X, Madan A (1999) CAP3: A DNA sequence assembly program. Genome research 9:868-877.
Iezzoni AF, Pritts MP (1991) Applications of principal components analysis to horticultural research.
HortScience 26:334-338.
Ikbal BKS, Dhillon RS (2010) Evaluation of genetic diversity in Jatropha curcas L. using RAPD
markers. Indian Journal of Biotechnology 9:50-57.
Ince AG, Karaca M, Onus AN (2010) Polymorphic microsatellite markers transferable
across Capsicum species. Plant Mol Biol Report 28:285-291.
Islam MS, Rasul MG (1998) Genetic parameters, correlation and path coefficient analysis in groundnut
(Arachis hypogeal L.). Bangladesh Journal of Science and Industrial Research 33:250-254.
Jain N, Patil GB, Bhargava P, Nadgauda RS (2014) In Silico Mining of EST-SSRs in Jatropha curcas L.
towards assessing genetic polymorphism and marker development for selection of high oil yielding
clones. American Journal of Plant Sciences 5:1521-1541.
Jakse J, Javornik B (2001) High throughput isolation of microsatellites in hop (Humulus lupulus L.).
Plant Molecular Biology Report 19:217-226.
Jakupciak JP, Wells RD (2000) Gene conversion (recombination) mediates expansions of CTG.CAG
repeats. Journal of Biological Chemistry 275:4003-4013.
Jarne P and Lagoda PJL (1996) Microsatellites, from molecules to populations and back. Tree 11: 424-
429.
Jeffreys AJ, Wilson V, Thein SL (1985) Individual- specific fingerprints’ of human DNA. Nature 316:
76-79.
Johnson HW, Robinson HF and Comstock RE (1955) Estimates of genetic and environmental variability
in Soybean. Agronomy Journal 47: 314-318.
Johnson TS, Eswaran N, Sujatha M (2011) Molecular approaches to improvement of Jatropha curcas L.
as a sustainable energy crop. Plant Cell Reports 30: 1573-1591.
Jones ES, Dupal MP, Kolliker R, Drayton MC, Forster JW (2001) Development and characterization of
simple sequence repeat (SSR) markers for perennial ryegrass (Lolium perenne L.). Theoretical and
Applied Genetics 102: 405-415.
Jones N, Ougham H, Thomas H (1997) Markers and mapping: We are all geneticists now. New
Phytologist 137:165-177.
Jones N, Ougham H, Thomas H, Pasakinskiene I (2009) Markers and mapping revisited: finding your
gene. New Phytologist 183:935-966.
168
Joshi SP, Ranjekar PK, Gupta VS (1999) Molecular markers in plant genome analysis. Current Science
77:230-240.
Jubera MA, Janagoudar BS, Biradar DP, Ravikumar RL, Koti RV, Patil SJ (2009) Genetic diversity
analysis of elite Jatropha curcas (L.) genotypes using randomly amplified polymorphic DNA
markers. Karnataka Journal of Agricultural Sciences 22:293-295.
Kalendar R, Grob T, Regina MT, Suoniemi A, Schulman A (1999) IRAP and REMAP: two new
retrotransposon-based DNA fingerprinting techniques. Theoretical and Applied Genetics 98:704-
711.
Kalia RK, Rai MK, Kalia S, Singh R, Dhawan AK (2011) Microsatellite markers: an overview of the
recent progress in plants. Euphytica 177: 309-334.
Kandpal RP, Kandpal G and Weissman SM (1994) Construction of libraries enriched for sequence
repeats and jumping clones, and hybridization selection for region-specific markers. Proceeding of
the National Academy of Science, USA 91: 88-92.
Kantety RV, Rota ML, Matthews DE, Sorrells ME (2002) Data mining for simple sequence repeats in
expressed sequence tags from barley, maize, rice, sorghum and wheat. Plant Molecular Biology
48:501-510.
Karagyozov L, Kalcheva ID and Chapman VM (1993) Construction of random small-insert genomic
libraries highly enriched for simple sequence repeats. Nucleic Acids Research 21: 3911-3912.
Karp A, Edwards KJ (1997) DNA markers: a global overview. Pages 1-13 in Caetano-Anolles G and PM
Greshoff eds. DNA markers: protocols, application and overviews. Wiler-VCH, New York.
Katwal RPS, Soni PL (2003) Biofuels: an opportunity for socioeconomic development and cleaner
environment. Indian Forester 129:939-949.
Kaushik N, Kumar K, Kumar S, Kaushik N and Roy S (2007) Genetic variability and divergence studies
in seed traits and oil content of Jatropha (Jatropha curcas L.) accessions. Biomass and
Bioenergy 31: 497-502.
Khurana-Kaul V, Kachhwaha S, and Kothari SL (2012) Characterization of genetic diversity in Jatropha
curcas L. germplasm usisng RAPD and ISSR markers. Indian Journal of Biotechnology11:54-61.
Kijas JMH, Fowler JCS, Garbett CA and Thomas MR (1994). Enrichment of microsatellites from the
citrusgenome using biotinylated oligonucleotide sequences bound to streptavidin-coated magnetic
particles. BioTechniques 16: 656-662.
King AJ, Montes LR, Clarke JG, Affleck J, Li Y, Witsenboer H, van der Vossen E, van der Linde P,
Tripathi Y, Tavares E, Shukla P, Rajasekaran T, van Loo EN and Graham IA (2013) Linkage
mapping in the oilseed crop Jatropha curcas L. reveals a locus controlling the biosynthesis of
phorbol esters which cause seed toxicity. Plant Biotechnology Journal 11:986-996.
King K, He W, Cuevas JA, Freudenberger M, Ramiaramanana D, Graham IA (2009) Potential of
Jatropha curcas as a source of renewable oil and animal feed. Journal of Experimental Botany
60: 2897-2905.
Kliebenstein DJ, Gershenzon J, Mitchell-Olds T (2001) Comparative quantitative trait loci mapping of
aliphatic, indolic and benzylic glucosinolate production in Arabidopsis thaliana leaves and seeds.
Genetics 159:359-370.
Koblizkova A, Dolezel J, and Macas J (1998) Subtraction with 3’ modified oligonucleotides eliminates
amplification artifacts in DNA libraries enriched for microsatellites. BioTechniques 25:32-38.
Kolliker R, Jones ES, Drayton MC, Dupal MP, Forster JW (2001) Development and characterization of
simple sequence repeat (SSR) markers for white clover (Trifolium repens L.). Theoretical and
Applied Genetics 102:416-424.
Kuleung C, Baenziger PS, Dweikat I (2004) Transferability of SSR markers among wheat, rye, and
triticale. Theoretical and Applied Genetics 108:1147-1150.
Kumar P, Gupta VK, Misra AK, Modi DR and Pandey BK (2009) Potential of molecular markers in plant
biotechnology. Plant Omics Journal 2:141-162.

169
Kumar S, Kumar V, Sharma MK, Kumar N, Kumar A, Sengar RS, Jaiswal N (2013) Assessment of
genetic diversity in Jatropha (Jatropha Curcus L.) by using RAPD markers. International
Journal of Biotechnology and Bioengineering Research 4:383-394.
Kumari M, Grover A, Yadav PV, Arif M and Ahmed Z (2013) Development of EST-SSR markers
through data mining and their use for genetic diversity study in Indian accessions of Jatropha
curcas L.: a potential energy crop. Genes Genome 35:661-670.
Kumpatla S and Mukhopadhyay S (2005) Mining and survey of simple sequence repeat in expressed
sequence tags of dicotyledonous species. Genome 48:985-998.
Kwon S, Hong S, Son J, Lee JK, Cha Y, Eun M, Kim N (2006) CACTA and MITE transposon
distributions on a genetic map of rice using F15 RILs derived from Milyang 23 and Gihobyeo
hybrids. Molecules and Cells 21: 360-366.
Lagercrantz U, Ellegren H, Andresson L (1993) The abundance of various polymorphic microsatellite
motifs differ between plants and vertebrates. Nucleic Acids Research 21:1111-1115.
Laido G, Marone D, Russo MA, Colecchia SA, Mastrangelo AM, Vita PD, Papa R (2014) Linkage
disequilibrium and genome-wide association mapping in tetraploid wheat (Triticum turgidum L.).
Plos One 9(4): e95211.
Laosatit K, Tanya P, Saensuk C, Srinives P (2013) Development and characterization of EST-SSR
markers from Jatropha curcas EST database and their transferability across Jatropha-related
species/genus. Biologia 68:41-47.
Lawson MJ and Zhang L (2006) Distinct patterns of SSR distribution in the Arabidopsis thaliana and rice
genomes. Genome Biology7:R14.
Lench NJ, Norris A, Bailey A, Booth A and Markham AF (1996) Vectorette PCR isolation of
microsatellite repeat sequences using anchored dinucleotide repeat primers. Nucleic Acids
Research 24: 2190-2191.
Lerceteau E, Szmidt AE (1999) Properties of AFLP markers in inheritance and genetic diversity studies
of Pinus sylvestries L. Heredity 82:252-260.
Levinson G and Gutman GA (1987) Slipped strand mispairing: A major mechanism for DNA sequence
evolution. Molecular and Biology Evolution 4:203-221.
Li XY (2005) Cutting technique of Jatropha curcas. Autumn Agri Techn Ser 7:10-12.
Li YC, Fahima T, Roder MS, Kirzhner VM, Beiles A, Korol AB and Nevo E (2003) Genetic effects on
micro-satellite diversity in wild emmer wheat, Triticum dicoccoides, at Yehudiyya microsite.
Heredity 90:150-156.
Li YC, Korol AB, Fahima T, Beiles A, Nevo E (2002) Microsatellites: genomic distribution, putative
functions and mutational mechanisms: a review. Molecular Ecology 11:2453-2465.
Li YC, Korol AB, Fahima T, Nevo E (2004) Microsatellites within genes: structure, function, and
evolution. Molecular Biology and Evolution 21:991-1007.
Lia L and Wua LC (2007) Genetic diversity and molecular markers of five snapper species. Chinese
Journal of Agricultural Biotechnology 4:39-46.
Liebhard R, Gianfranceschi L, Koller B, Ryder CD, Tarchini R, Van De Weg E, Gessler C (2002)
Development and characterization of 140 new microsatellites in apple (malus×domesticaBorkh.).
Molecular Breeding 10:217-241.
Lim JH, Yang HJ, Jung KH, Yoo SC, Paek NC (2014) Quantitative trait locus mapping and candidate
gene analysis for plant architecture traits using whole genome re-Sequencing in rice. Molecules
and Cells 37:149-160.
Linman MJ, Yu H, Chen X and Cheng Q (2009) Fabrication and characterization of a sialoside-based
carbohydrate microarray biointerface for protein binding analysis with surface plasmon resonance
imaging. American Chemical Society 1:1755-76209.
Linnaeus C. (1753) Species plantarum. In: Jatropha. Impensis Stockholm: Laurentii Salvii; 1006-1007.
Litt M and Luty JA (1989) A hypervariable microsatellite revealed by in vitro amplification of a
dinucleotide repeat within the cardiac muscle actin gene. American Journal of Human Genetics
44:397-401.

170
Liu K, Muse SV (2005) PowerMarker: an integrated analysis environment for genetic marker analysis.
Bioinformatics 21:2128-2129.
Liu P, Wang CM, LiL, Sun F, Liu P and Yue GH (2011) Mapping QTLs for oil traits and eQTLs for
oleosin genes in Jatropha. BMC Plant Biology11:132.
Liu Y, Wang L, Sun C, Zhang Z, Zheng Y, Qiu F (2014) Genetic analysis and major QTL detection for
maize kernel size and weight in multi-environment. Theoretical and Applied Genetics 127:1019-
1037.
Lunt DH, Hutchinson WF, Carvalho GR (1999) An efficient method for PCR-based isolation of
microsatellite arrarys (PIMA). Molecular Ecology 8:891-894.
Lynch M and Walsh B (1998) Genetics and analysis of quantitative traits, Sinauer.
Mace ES, Gebhardt CG, Lester RN (1999) AFLP analysis of genetic relationship in the tribe Datureae
(Solanaceae). Theoretical and Applied Genetics 99:634-641.
Machua J, Muturi G, Omondi SF, Gicheru J (2011) Genetic diversity of Jatropha curcas L. populations
in Kenya using RAPD molecular markers: Implication to plantation establishment. African
Journal of Biotechnology 10:3062-3069.
Makkar HPS, Aderibigbe AO, Becker K (1998) Comparative evaluation of non-toxic and toxic
varieties of Jatropha curcas for chemical composition, digestibility, protein degradability and
toxic factors. Food Chemistry 62:207-215.
Manen JF, Bouby L, Dalnoki O, Marinval P, Turgay M, Schlumbaum A (2003) Microsatellites from
archaeological Vitis vinifera seeds allow a tentative assignment of the geographical origin of
ancient cultivars. Journal of Archaeological Science 30: 721-729.
Marinoni D, Akkak A, Bounous G, Edwards K, Botta R (2003) Development and characterization of
microsatellite markers in Castanea sativa (Mill.). Molecular Breeding 11:127-136.
Martinez EA, Destombe C, quilled MC, Valero M (1999) Identification of random amplified polymorphic
DNA (RAPD) markers highly linked to sex determination in the red alga Gracilaria gracilis.
Molecular Ecology 8:1533-1538.
Mastan SG, Sudheer PDVN, Rahman H, Ghosh A, Rathore MS, Prakash CR, Chikara J (2012)
Molecular characterization of intra-population variability of Jatropha curcas L. using DNA based
molecular markers. Molecular Biology Report 39:4383-4390.
Maurya R, Gupta A, Singh SK, Rai KM, Chandrawati, Sawant SV, Yadav HK (2013) Microsatellite
polymorphism in Jatropha curcas L.-A biodiesel plant. Industrial Crops and Products 49:136-
142.
Medina IO, Garcia FJE, Farfan JSN and Figueroa MS (2011) State of the art of genetic diversity research
in Jatropha curcas. Scientific Research and Essays 6: 1709-1719.
Merdinoglu D, Butterlin G, Bevilacqua L, Chiquet V, Adam-Blondon AF, Decroocq S (2005)
Development and characterization of a larger set of microsatellite markers in grapevine (Vitis
vinifera L.) suitable for multiplex PCR. Molecular Breeding 15:349-366.
Messier W, Li SH, Stewart CB (1996) The birth of microsatellites. Nature 381:483.
Miesfeld R, Krystal M, Arnheim N (1981) A member of a new repeated sequence family which is
conserved throughout the eukaryotic evolution is found between the human globin genes. Nucleic
Acids Research 9:5931-5947.
Mitton JB (1993) Theory and data pertinent to the relationship between heterozygosity and fitness. In the
natural history of inbreeding and outbreeding: Theoretical and empirical perspectives (Thornhill, N.
W., ed.), pp. 352–374. Chicago, IL: University of Chicago Press.
Mofijur M, Masjuki HH, Kalam MA, Hazrat MA, Liaquat AM, Shahabuddin M (2012) Prospects of
biodiesel from Jatropha in Malaysia. Renewable and Sustainable Energy Reviews 16:5007-
5020.
Mohapatra S, Panda PK (2010) Genetic variability on growth, phenological and seed characteristics of
Jatropha curcas L. Notulae Scientia Biologicae 2:127-132.
Montes JM, Technow F, Martin M, Becker K (2014) Genetic diversity in Jatropha curcas L. assessed
with SSR and SNP markers. Diversity 6: 551-566.

171
Moretzsohn MC, Leoi L, Proite K, Guimaraes PM, Leal-Bertioli SC, Gimenes MA, Martins WS,
Valls JF, Grattapaglia D, Bertioli DJ (2005) A microsatellite-based, gene-rich linkage map for
the AA genome of Arachis (Fabaceae). Theoretical and Applied Genetics 111:1060-1071.
Morgante M, Hanafey M, Powell W (2002) Microsatellites are preferentially associated with non-
repetitive DNA in plant genomes. Nature Genetics 30:194-200.
Morgante M, Olivieri AM (1993) PCR amplified microsatellites as markers in plant genetics. Plant
Journal 3:175-182.
Morgante M, Rafalski A, Biddle P, Tingey S, Olivieri AM (1994) Genetic mapping and variability of
seven soybean simple sequence repeat loci. Genome 37:763-769.
Moursy AA, Aziz HAA and Mostafa AZ (2014) The effect of irradiated and non-irradiated sewage sludge
application on Uptake of Heavy Metals by Jatropha curcas L. plants. International Journal of
Advanced Research 2:1072-1080.
Mullis K, Faloona F, Scharf S, Saiki R, Horn G, Erlich H (1986) Specific enzymatic amplification Of
DNA in vitro: The polymerase chain reaction. Cold Spring Harbor Symposia on Quantitative
Biology 51: 263-273.
Murty SG, Patel F, Punwar BS, Patel M, Singh AS, Fougat RS (2013) Comparison of RAPD, ISSR, and
DAMD markers for genetic diversity assessment between accessions of Jatropha curcas L. and its
related species. Journal of Agriculture Science and Technology 15:1007-1022.
Murty BR and Arunachalam V (1966) The nature of genetic divergence in relation to breeding system in
crop plants. Indian Journal of Genetics 26:188-198.
Nadir E, Margalit H, Gallily T, Ben-Sasson SA (1996) Microsatellite spreading in the human genome:
evolu-tionary mechanisms and structural implications. Proceeding of the Natural Academy
Science, USA 93:6470-6475.
Na-ek Y, Wongkaew A, Phumichai T, Kongsiri N, Kaveeta R, reewongchai T, Phumichai C (2011)
Genetic diversity of physic nut (Jatropha curcas L.) revealed by SSR markers. Journal of Crop
Science and Biotechnology14:105-110.
Narayana DSA, Shankarappa KS, Govindappa MR, Prameela HA, Gururay Rao MR, Rangaswamy KT
(2006) Natural occurrence of Jatropha mosaic virus disease in India. Current Science 91:584-
586.
Nath UK and Alam MS (2002) Genetic variability, heritability and genetic advance of yield and related
traits of groundnut (Arachis hypogaea L.). Journal of Bioscience Science 2:762-764.
Neeraja C, Maghirang-Rodriguez R, Pamplona A, Heuer S, Collard B, Septiningsih EM, Vergara G,
Sanchez D, Xu K, Ismail AM (2007) A marker-assisted backcross approach for developing
submergence-tolerant rice cultivars. Theoretical and Applied Genetics 115: 767-776.
Negussie A, Achten MJW, Verboven AFH, Hermy M, Muys B (2013) Potential pollinators and floral
visitors of introduced tropical biofuel tree species Jatropha curcas L. (Euphorbiaceae), in
Southern Africa. African Crop Science Journal 21:149 -158.
Nunome T, Negoro S, Miyatake K, Yamaguchi H and Fukuoka H (2006) A protocol for the construction
of microsatellite enriched genomic library. Plant Molecular Biology Reporter 24:305-312.
Nunome T, NegoroS, KonoI, KanamoriH, MiyatakeK, YamaguchiH, OhyamaA, FukuokaH (2009)
Development of SSR markers derived from SSR-enriched genomic library of eggplant (Solanum
melongena L.).Theoretical and Applied Genetics 119:1143-1153.
Nyquist WE (1991) Estimation of heritability and prediction of selection response in plant populations.
Critical Reviews in Plant Science 10: 235-322.
Oliveira EJ, Pdua JG, Zucchi MI, Vencovsky R and Vieira MLC (2006) Origin, evolution and genome
distribution of microsatellites. Genetics and Molecular Biology 29: 294-307.
Ong HC, Mahlia TMI, Masjuki HH, Norhasyima RS (2011) Comparison of palm oil, Jatropha curcas and
Calophyllum inophyllum for biodiesel: a review. Renewable and Sustainable Energy
Reviews15:3501-3515.
Openshaw KA (2000) Review of Jatropha curcas: an oil plant of unfulfilled promise. Biomass and
Bioenergy 19:1-15.

172
Osorio LRM, Salvador AFT, Jongschaap REE, Perez CAA, Sandoval JEB, Trindade LM, Visser RGF,
van Loo EN (2014) High level of molecular and phenotypic biodiversity in Jatropha curcas from
Central America compared to Africa, Asia and South America. BMC Plant Biology 14:77.
Ostrander EA, Jong PM, Rine J and Duyk G (1992) Construction of small-insert genomic DNA libraries
highly enriched for microsatellite repeat sequences. Proceeding of the National Academy of
Science 89:3419-3423.
Ouattara B, Diedhiou I, Ndir KN, Agbangba EC, Cisse N, Diouf D, Akpo EL Zongo JD (2013) Variation
in seed traits and distribution of Jatropha curcas L. in Senegal. International Journal of Current
Research 5:17-21.
Ouattara B, Ndir KN, Gueye MC, Diedhiou I, Barnaud A, Fonceka D, Cisse N, Akpo EL, Diouf D (2014)
Genetic diversity of Jatropha curcas L. in Senegal compared with exotic accessions based on
microsatellite markers. Genetic Resources and Crop Evolution DOI 10.1007/s10722-014-0106-5.
Ovando-Medina I, Sanchez-Gutierrez A, Adriano-Anaya L, Espinosa-Garcia F, Nunez-Farfan J,
Salvador-Figueroa M (2011) Genetic diversity in Jatropha curcas populations in the state of
Chiapas, Mexico. Diversity 3:641-659.
Paetkau D (1999) Microsatellites obtained using strand extension: an enrichment protocol. Biotechniques
26: 694-697.
Palacios C, Kresovich S, Gonzales-Candelas F (1999) A population genetic study of the endangered plant
species Limonium dufourii (Plumbaginaceae) based on amplified fragment length polymorphism
(AFLP). Molecular Ecology 8:645-657.
Pamidimarri DVNS, Mastan SG, Rahman H, Ravi Prakash Ch, Singh S, Reddy MP (2011) Cross species
amplification ability of novel microsatellites isolated from Jatropha curcas and genetic relationship
with sister taxa. Molecular Biology Reports 38:1383-1388.
Pamidimarri DVNS, Reddy MP (2014) Phylogeography and molecular diversity analysis of Jatropha
curcas L. and the dispersal route revealed by RAPD, AFLP and nrDNA-ITS analysis. Molecular
Biology Report 41:3225-3234.
Pamidimarri DVNS, Singh S, Mastan SG, Patel J, Reddy MP (2009) Molecular characterization and
identification of markers for toxic and non-toxic varieties of Jatropha curcas L. using RAPD,
AFLP and SSR markers. Molecular Biology Report 36:1357-1364.
Pandey VC, Singh K, Sigh JS, Kumar A, Sigh B and Sigh RP (2012) Jatropha curcas: A potential biofuel
plant for sustainable environmental development. Renewable and Sustainable Energy
Reviews16:2870-2883.
Paniego N, Echaide M, Munoz M, Fernandez L, Torales S, Faccio P, Fuxan I, Carrera M, Zandomeni R,
Suarez EY and Hopp HE (2002) Microsatellite isolation and characterization in sunflower
(Helianthus annuus L.). Genome 45:34-43.
Pardue ML, Gall JG (1970) Chromosomal localization of mouse satellite DNA. Science 168: 1356-1358.
Parida SK, Raj Kumar KA, Dalal V, Singh NK, Mohapatra T (2006) Unigene derived microsatellite
markers for the cereal genomes. Theoretical and Applied Genetics 112:808-817.
Park YJ, Ju KL and Nam-Soo K (2009) Simple sequence repeat polymorphisms (SSRPs) for evaluation
of molecular diversity and germplasm classification of minor crops. Molecules 14: 4546-4569.
Parthiban KT, Kumar RS, Thiyagarajan P, Subbulakshmi V, Vennila S, Rao MG (2009) Hybrid progenies
in Jatropha – a new development. Current Science 96:815-23.
Patil SVR (2004) Jatropha oil-As an alternative to diesel. Agriculture and Industry Survey 13:17-22.
Patra NK (1985) Genetic diversity in relation to oil content potential in mint. Genetics 12:173-177.
Peakall R, Gilmore S, Keys W, Morgante M, Rafalski A (1998) Cross-species amplification of soybean
(Glycine max) simple sequence repeats within the genus and other legume genera: Implications for
the transferability of SSRs in plants. Molecular Biology and Evolution 15:1275 -1287.
Pearson CE, Edamura NK, Cleary JD (2005) Repeat instability: mechanisms of dynamic mutations.
Nature Reviews Genetics 6:729-742.

173
Pecina-Quintero V, Anaya JL, Zamarripa A, Montes N, Nunez C, Solis J (2011) Molecular
characterization of Jatropha curcas L. genetic resources from Chiapas, Mexico through AFLP
markers. Biomass and Bioenergy 35:1897-905.
Pecina-Quintero V, Anaya-Lopez JL, Zamarripa-Colmenero A, Nunez-Colın CA, Montes-Garcıa N,
Solıs-Bonilla JL, Jimenez-Becerril MF (2014) Genetic structure of Jatropha curcas L. in Mexico
and probable centre of origin. Biomass and Bioenergy 60:147-155.
Peeters JP and Martinelli JA (1989) Hierarchical cluster analysis as a tool to manage variation in
gremplasm collections. Theoretical and Applied Genetics 78:42-48.
Pepin L, Amigues Y, Lepingle A, Berthier J, Bensaid A and Vaiman D (1995) Sequence conservation of
microsatellites between Bos Taurus (cattle), Capra hircus (goat) and related species. Examples of
use in parentage testing and phylogeny analysis. Heredity 74:53-61.
Perrier X, Flori A, Bonnot F (2003) Data analysis methods. In: Hamon P, Seguin M, Perrier X,
Glaszmann JC (eds) Genetic diversity of cultivated tropical plants. Enfield Science Publishers,
Montpellier, pp 43-76.
Phan J, Reue K, and Peterfy M (2000) MS-IRS: A simple method for the isolation of microsatellites.
BioTechniques 28:18-20.
Pootakham W, Chanprasert J, Jomchai N, Sangsrakru D, Yoocha T, Ragoonrung S, Tangphatsornruang S
(2012) Development of genomic-derived simple sequence repeat markers in Hevea brasiliensis
from 454 genome shotgun sequences. Plant Breeding 131: 555-562.
Powell W, Machray G, Provan J (1996) Polymorphism revealed by simple sequence repeats. Trends in
Plant Sciences 1:215-222.
Primmer CR, Moller AP and Ellengren H (1996) A wide-range survey of cross species microsatellite
amplifications in birds. Molecular Ecology 5: 365-378.
Pritchard JK, Stephens M, Donnelly P (2000) Inference of population structure using multilocus genotype
data. Genetics 155:945-959.
Provan J, Powell W, Hollingsworth PM (2001) Chloroplast microsatellites: new tools for studies in plant
ecology and evolution. Trends in Ecology and Evolution 16: 142-147.
Qu J and Liu J (2013) A genome-wide analysis of simple sequence repeats in maize and the development
of polymorphism markers from next-generation sequence data. BMC Research Notes 6:403.
Rafalski JA, Vogel JM, Morgante M, Powell W, Andre C, Tingey SV (1996) Generating and using DNA
markers in plants. In: non mammalian genomic analysis: a practical guide (eds Birren B, Lai E), pp.
75–134, Academic Press, New York.
Rafii MY, Shabanimofrad M, Edaroyati PMW, Latif MA (2012) Analysis of the genetic diversity of
physic nut, Jatropha curcas L. accessions using RAPD markers. Molecular Biology Report
39:6505-6511.
Rajkumar, Fakrudin B, Kavil SP, Girma Y, Arun SS, Dadakhalandar D, Gurusiddesh BH, Patil AM,
Thudi M, Bhairappanavar SB, Narayana YD, Krishnaraj PU, Khadi BM, Kamatar MY (2013)
Molecular mapping of genomic regions harbouring QTLs for root and yield traits in sorghum
(Sorghum bicolor L. Moench). Physiol Mol Biol Plants 19:409-419.
Raju AJS, Ezradanam V (2002) Pollination ecology and fruiting behaviour in a monoecious species,
Jatropha curcas L. (Euphorbiaceae). Current Science 83:1395-1398.
Ramanujam S, Tewari AS and Mehra RB (1974) Genetic divergence and hybrid performance in
mungbean. Theoretical and applied Genetics 45:211-214.
Ranade SA, Srivastava AP, Rana TS, Srivastava J, Tuli R (2008) Easy assessment of diversity in
Jatropha curcas L. plants using two single-primer amplification reaction (SPAR) methods.
Biomass and Bioenergy32: 533-540.
Rao AC, Maya MM, Duque MC, Tohme J, Allem AC, Bonierable MW (1997) AFLPs analysis of
relationship among cassava other Manihot species. Theoretical and Applied Genetics 95: 741-
750.
Rao CR (1952) Advanced statistical methods in biometric research. John Wiley, New York.

174
Rao GR, Korwar GR, Shanker AK, Ramakrishna YS (2008) Genetic associations, variability and
diversity in seed characters, growth, reproductive phenology and yield in Jatropha curcas (L.)
accessions. Trees 22: 697-709.
Rasmuson M (2002) The genotype-phenotype link. Hereditas 136:1-6.
Reddy MP, Chikara J, Patolia JS, Ghosh A (2007) Genetic improvement of J. curcas L. adaptability and
oil yield. In: Fact seminar on J. curcas L., agronomy and genetics, 26-28 march 2007, wageningen,
the Netherlands, published by FACT foundation.
Ricci A, Chekhovskiy K, Azhaguvel P, Albertini E, Falcinelli M, Saha M (2012) Molecular
characterization of Jatropha curcas resources and identification of population-specific markers.
Bioenergy Research 5:215-224.
Richard GF, Paques F (2000) Mini- and microsatellite expansions: the recombination connection. EMBO
Reports 11:122-126.
Richardson T, Cato S, Ramser J, Kahl G, Weising K (1995) Hybridization of microsatellites to RAPD :
a new source of polymorphic markers. Nucleic Acids Research 23:3798-3799.
Robinson HF, Comstock RE, Harvey PH (1949) Estimates of heritability and the degree of dominance in
corn. Agronomy Journal 41:353-359.
Romero G, Adeva C, Battad Z (2009) Genetic fingerprinting: advancing the frontiers of crop biology
research. Philippine Science Letter 2:8-13.
Rosado TB, Laviola BG, Faria DA, Pappas MR, Bhering LL, Quirino B, Grattapaglia D (2010) Molecular
marker reveal limited genetic diversity in large germplasm collection of the biofuel crop Jatropha
curcas L. in Brazil. Crop Science 50:2372-2382.
Rose O and Falush D (1998) A threshold size for microsatellite expansion. Molecular Biology and
Evolution 15:613-615.
Rossetto M, McLauchlan A, Harriss FCL, Henry RJ, Baverstock PR, Lee LS, Maguire TL, Edwards KJ
(1999) Abundance and polymorphism of microsatellite markers in the tea tree (Melaleuca
alternifolia, Myrtaceae). Theoretical and Applied Genetics 98:1091-1098.
Rustgi S, Shafqat MN, Kumar N, Baenziger PS, Ali ML, Dweikat I, Campbell BT, Gill (2013) Genetic
dissection of yield and its component traits using high-density composite map of wheat
chromosome 3A: bridging gaps between QTLs and underlying genes. PLoS One 8(7): e70526.
Saghai-Maroof MA, Soliman KM, Jorgensen RA, Allard RW (1984) Ribosomal DNA spacer-length
polymorphisms in barley: Mendelian inheritance, chromosomal location and population
dymnamics. Proceeding of the National Academy of Science USA 81:8014-8018.
Saha MC, Mian MA, Eujayl I, Zwonitzer JC, Wang L, and May GD (2004) Tall fescue EST-SSR markers
with transferability across several grass species. Theoretical and Applied Genetics 109: 783-791.
Sahai K, Srivastava V, Rawat KK (2011) Impact assessment of fruit predation by Scutellera perplexa
Westwood on the reproductive allocation of Jatropha. Biomass and Bioenergy 35:4684-4689.
Salvador-Figueroa M, Magana-Ramos J, Vazquez-Ovando JA, Adriano-Anaya ML, Ovando-Medina I
(2014) Genetic diversity and structure of Jatropha curcas L. in its centre of origin. Plant Genetic
Resources: characterization and utilization 1–9, doi:10.1017/S1479262114000550.
Sambrook J, Fritsch EF and Maniatis T (1989) Molecular cloning: A Laboratory Manual, Ed 2. Cold
Spring Harbor Laboratory Press, New York.
Santos C, Antonio F, Marcos AD, Marciene AR and Marcio RVE (2010)Genetic similarity of Jatropha
curcas accessions based on AFLP markers. Crop Breeding and Applied Biotechnology10: 364-
369.
Sathya M, Jayamani P (2013) Cross species amplification of Adzukibean derived microsatellite loci and
diversity analysis in green gram and related Vigna Species. Molecular Plant Breeding 4:89-95.
Sato S, Hirakawa H, Isobe S (2011) Sequence analysis of the genome of an oil-bearing tree, Jatropha
curcas L. DNA Research 18: 65-76.
Scheiner SM, Mitchell RJ, Callahan HS (2000) Using path analysis to measure natural selection. Journal
of Evolutionary Biology 13:423-433.

175
Schlotterer C (1998) Microsatellites. In: Hoelzel AR (ed) Molecular genetic analysis of populations: A
practical approach. IRL Press, Oxford, pp. 237-261.
Schlotterer C (2004) The evolution of molecular markers- just a matter of fashion? Genetics 5:63-6.
Schranz ME, Song BH, Windsor AJ, Mitchell-Olds T (2007) Comparative genomics in the Brassicaceae:
a family-wide perspective. Current Opinion in Plant Biology 10:168-175.
Schuelke M (2000) An economic method for the fluorescent labeling of PCR fragments. Nature
Biotechnology 18:233-234.
Scott KD, Eggler P, Seaton G, Rossetto M, Ablett EM, Lee LS, Henry RJ (2000) Analysis of SSRs
derived from grape ESTs. Theoretical and Applied Genetics 100: 723-726.
Segura MPS, Oomah BD, Drover JCG, Heredia JB, Enciso TO, Torres JBV, Villa ES, Landeros FS,
Escalante MAA (2014) Physical and chemical characterization of three non-toxic oilseeds from the
Jatropha genus. Journal of Food and Nutrition Research 2: 56-61.
Semagn K, Bjornstad A and Ndjiondjop MN (2006) An overview of molecular marker methods for
plants. African Journal of Biotechnology 5: 2540-2568.
Shabanimofrad M, Yusop MR, Saad MS, Wahab PEM, Biabanikhanehkahdani A, Latif MA (2011)
Diversity of physic nut (Jatropha curcas) in Malaysia: application of DIVA-geographic
information system and cluster analysis. Australian Journal of Crop Science 5:361-368.
Sharma A and Chauhan RS (2011) Repertoire of SSRs in the castor bean genome and their utilization in
genetic diversity analysis in Jatropha curcas. Comparative and Functional Genomics. Volume
2011, Article ID 286089, 9 pages.
Shen J, Jia X, Ni H, Sun P, Niu S, Chen X (2010) AFLP analysis of genetic diversity of Jatropha curcas
grown in Hainan, China. Trees 24: 455-462.
Shen J, Khongsak P, David B, Xiaoyang C (2012) AFLP-based molecular characterization of 63
populations of Jatropha curcas L. grown in provenance trials in China and Vietnam. Biomass and
Bioenergy 37:265-274.
Shendure J and Ji H (2008) Next-generation DNA sequencing. Nature Biotechnology 26:135- 1145.
Shin JH, Kwon SJ, Lee JK, Min HK, Kim NS (2006) Genetic diversity of maize kernel starch synthesis
genes with SNAPs. Genome 49: 1287-1296.
Shipley B (1997) Exploratory path analysis with applications in ecology and evolution. Am. Nat. 149:
1113-1138.
Shoemaker RC, Grant D, Olson T, Warren WC, Wing R, Yu Y, Kim H, Cregan P, Joseph B, Futrell-
Griggs M, Nelson W, Davito J, Walker J, Wallis J, Kremitski C, Scheer D, Clifton SW, Graves T,
Nguyen H, Wu X, Luo M, Dvorak J, Nelson R, Cannon S, Tomkins J, Schmutz J, Stacey G,
Jackson S (2008) Microsatellite discovery from BAC end sequences and genetic mapping to anchor
the soybean physical and genetic maps. Genome 51:294-302.
Shultz JL, Kazi S, Bashir R, Afzal JA, Lightfoot DA (2007)The development of BAC-end sequence-
based microsatellite markers and placement in the physical and genetic maps of soybean.
Theoretical and Applied Genetics 114:1081-1090.
Silitonga AS, Atabani AE, Mahlia TMI, Masjuki HH, Badruddin Irfan Anjum, Mekhilef S (2011) A
review on prospect of Jatropha curcas for biodiesel in Indonesia. Renewable and Sustainable
Energy Reviews15:3733-3756.
Singh VK, Singh A, Singh SP, Ellur RK, Singh D, Krishnan SG, Bhowmick PK, Nagarajan M, Vinod
KK, Singh UD, Mohapatra T, Prabhu KV, Singh AK (2013a) Marker-assisted simultaneous but
stepwise backcross breeding for pyramiding blast resistance genes Piz5 and Pi54 into an elite
Basmati rice restorer line ‘PRR78’. Plant Breeding 132:486-495.
Singh R, Pandey RM and Singh B (2013b) Genetic association, divergence and variability studies for
seed yield and oil content and its contributing traits in Jatropha (Jatropha curcas L.). Journal of
Medicinal Plants Research 7:1931-1939.
Singh RK and Chaudhary BD (1985) Biometrical methods in quantitative genetic analysis. Kalyani
Publishers. New Delhi.

176
Singh SP (1991) Genetic divergence and canonical analysis in hyacinth bean. Journal of Genetics 45:7-
12.
Singh SP and Kahana KR (1993) Path coefficient analysis for opium and seed yield in opium poppy (P.
somniferum L.). Genetika 25:119-128.
Singh SP and Mittal RK (1993) Geographical divergence in relation to genetic diversity in potato
(Solanum tuberosum). Genetika 25:63-70.
Singh SP and Singh HN (1979) Path coefficient analysis for yield component in Okra. Indian Journal of
Agricultural Science 36:166-170.
Singh SP and Singh HN (1981) Gene system involved and their implication in breeding lablab bean
(Dolichos lablab). Zeitschriftfur Pflanzenzüchtung 87: 240-247.
Singh SP, Shukla S, Yadav HK (2004) Multivariate analysis in relation to breeding system in opium
poppy (Papaver somniferum L.). Genetika 36:111-120.
Singh SP, Shukla S, Yadav HK, Chatterjee A (2003) Multivariate and canonical analyses in opium poppy
(Papaver somniferum). Journal of Medcinal and Aromtic Plant science 25:380-384.
Sinha P, Tripathi SB (2013) Molecular characterization of Jatropha genetic resources through amplified
fragment length polymorphism (AFLP) markers. International Journal of Chemical and
Technical Research 5:735-740.
Slavov GT, Howe GT, Gyaourova AV, Birkes DS, Adams WT (2005) Estimating pollen flow using SSR
markers and paternity exclusion: Accounting for mistyping. Molecular Ecology 14: 3109-3121.
Smith JSC (1984) Genetic variability within U.S. hybrid maize: Multivariate analysis of isozyme data.
Crop Science 24:1041-1046.
Smith JSC and Smith OS (1989) The description and assessment of distances between inbred lines of
maize: The utility of morphological, biochemical and genetic descriptors and a scheme for the
testing of distinctiveness between inbred lines. Maydica 34:151-161.
Snehi SK, Raj SK, Khan MS, Prasad V (2011) Molecular identification of a new begomovirus associated
with yellow mosaic disease of Jatropha gossypifoliain India. Archives of Virology 156:2303-2307.
Solomon RAJ and Ezradanam V (2002) Pollination ecology and fruiting behaviour in a monoecious
species, Jatropha curcas L. (Euphorbiaceae). Current science 83:1395-1398.
Spritz RA (1981) Duplication/deletion polymorphism 5'- to the human beta globin gene. Nucleic Acids
Research 9:5037-5047.
Stansfield WD (1986) Theory and problems of genetics. McGraw-Hill Book Company, New York.
Stein N, Prasad M, Scholz U, Thiel T, Zhang H, Wolf M, Kota R, Varshney RK, Perovic D, Grosse I,
Graner A (2007) A1,000-loci transcript map of the barley genome: new anchoring points for
integrative grass genomics. Theoretical and Applied Genetics 114:823-839.
Stephan W, Kim Y (1998) Persistence of microsatellite arrays in finite populations. Molecular Bology
and Evolution 15: 1332-1336.
Subirana J and Messeguer (2008) Structural families of genomic microsatellites. Gene 408:124-132.
Subramanyam K, Rao DM, Devanna N, Aravinda A, Pandurangadu (2010) Evaluation of genetic
diversity among Jatropha curcas (L.) by RAPD analysis. Indian Journal of Biotechnology 9:283-
288.
Sudheer DVNP, Mastan SG, Rahman H, Reddy MP (2010) Molecular characterization and genetic
diversity analysis of Jatropha curcas L. in India using RAPD and AFLP analysis. Molecular
Biology Report 37:2249-2257.
Sujatha M and Prabakaran AJ (2003) New ornamental Jatropha hybrids through interspecific
hybridization. Genetic Resources and Crop Evolution 50:75-82.
Sujatha M, Makkar HPS, Becker K (2005) Shoot bud proliferation from axillary nodes and leaf sections
of non-toxic Jatropha curcas L. Plant Growth Regulation 47:83-90.
Sujatha M, Reddy TP, Mahasi MJ (2008) Role of biotechnological interventions in the improvement
of castor (Ricinus communis L.) and Jatropha curcas L. Biotechnology Advance 26:424-35.
Sujatha M and Prabakaran AJ (1997) Characterization and utilization of Indian Jatropha curcas. Indian
Journal of Plant Genetic Resource 10:123-128.
177
Sun F, Liu P, Ye J, Lo L, Cao S, Li L, Yue G and Wang C (2012) An approach for Jatropha
improvement using pleiotropc QTLs regulating plant growth and seed yield. Biotechnology for
Biofuels 5:12.
Sun JX, Mullikin JC, Patterson N and Reich DE (2009) Microsatellites are molecular clocks that support
accurate inferences about history. Molecular Biology and Evolution 26:1017-1027.
Sun QB, Li LF, Li Y, Wu GJ, Ge XJ (2008) SSR and AFLP markers reveal low genetic diversity in the
biofuel plant Jatropha curcas in China. Crop Science 48:1865-1871.
Sunil N, Sujatha M, Kumar V, Vanaja M, Basha SD, Varaprasad KS (2011) Correlating the phenotypic
and molecular diversity in Jatropha curcas L. Biomass and Bioenergy 35 :1085 1096.
Sunil N, Sivaraj N, Anitha K, Abraham B, Kumar V, Sudhir E, Vanaja M, Varaprasad KS (2009)
Analysis of diversity and distribution of Jatropha curcas L. germplasm using Geographic
Information System (DIVA-GIS). Genet Resour Crop Evol 56:115-119.
Surwenshi A, Kumar V, Shanwad UK and Jalageri BR (2011) Critical review of diversity in Jatropha
curcas for crop improvement: A candidate biodiesel crop. Research Journal of Agricultural
Sciences 2:193-198.
Szalma SJ, Buckler ES, Snook ME, McMullen MD (2005) Association analysis of candidate genes for
maysin and chlorogenic acid accumulation in maize silks. Theoretical and Applied Genetics
110:1324-1333.
Tang J, Gao L, Cao Y, Jia J (2006) Homologous analysis of SSR-ESTs and transferability of wheat SSR-
EST markers across barley, rice and maize. Euphytica 151: 87-93.
Tanya P, Taeprayoon P, Hadkam Y, Srinives P (2011) Genetic diversity among Jatropha and Jatropha
related species based on ISSR markers. Plant Molecular Biology Reports 29:252-264.
Taramino G and Tingey SV (1996) Simple sequence repeats for germplasm analysis and mapping in
maize. Genome 39:277-287.
Tatikonda L, Wani PS, Kannan S, Beerelli N, Sreedevi KT, Hoisington AD (2009) AFLP-based
molecular characterization of an elite germplasm collection of Jatropha curcas L. biofuel plant.
Plant Science 176:505-513.
Tautz D (1989) Hyper variability of simple sequences as a general source for polymorphic DNA markers.
Nucleic Acids Research 17:6463-6471.
Tautz D, Renz M (1984) Simple sequence repeats are ubiquitous repetitive components of eukaryotic
genomes. Nucleic Acid Research 12:4127-4138.
Tautz D, Schlotterer C (1994) Simple Sequences. Current Opinion in Genetics Development 4:832-
837.
Techen N, Arias RS, Glynn NC, Pan Z, Khan IA, Scheffler BE (2010) Optimized construction of
microsatellite-enriched libraries. Mol Ecol Resour 10:508-515.
Temnykh S, DeClerck G, Lukashova A, Lipovich L, Cartinhour S, McCouch S (2001) Computational and
experimental analysis of microsatellites in rice (Oryza sativa L.): Frequency, length variation,
transposon associations, and genetic marker potential. Genome Research 11:1441-1452.
Tewari JP, Dwivedi HD, Pathak M, Srivastava SK (2007) Incidence of mosaic disease in Jatropha
curcas L. from eastern Uttar Pradesh. Current Science 93:1048-1049.
Thiel T, Michalek W, Varshney RK, Graner A (2003) Exploiting EST databases for the development of
cDNA derived microsatellite markers in barley (Hordeum vulgare L.). Theoretical and Applied
Genetics 106:411-422.
Thompson JA, RL Nelson, Vodkin LO (1998) Identification of diverse soybean germplasm using RAPD
markers. Crop Science 38:1348-1355.
Thoren PA, Paxton RJ, Estoup A (1995) Unusually high frequency of (CT)n and (GT)n microsatellite loci
in a yellow jacket wasp, Vespula rufa (L.) (Hymenoptera: Vespidae). Insect Molecular Biology
4:141-148.
Toth G, Gaspari Z, Jurka J (2000) Microsatellites in different eukaryotic genomes: survey and analysis.
Genome Research 10:967-981.
178
Tyagi S, Mir RR, Kaur H, Chhuneja P, Ramesh B, Balyan HS, Gupta PK (2014) Marker-assisted
pyramiding of eight QTLs/genes for seven different traits in common wheat (Triticum aestivum L.).
Molecular Breeding DOI 10.1007/s11032-014-0027-1.
Uga Y, Yamamoto E, Kanno N, Kawai S, Mizubayashi T, Fukuoka S (2013) A major QTL controlling
deep rooting on rice chromosome 4. Scientific Reports 3:3040.
Varshney RK, Graner A, Sorrells ME (2005) Genic microsatellite markers in plants: features and
applications. Trends in Biotechnology 23:48-55.
Varshney RK, Thiel T, Stein N, Langridge P, Graner A (2002) In silico analysis on frequency and
distribution of microsatellites in ESTs of some cereal species. Cellular and Molecular Biology
Letter 7:537-546.
Vijayanand V, Senthil N, Vellaikumar S, Paramathama M (2009) Genetic diversity of Indian Jatropha
species as revealed by morphological and ISSR markers. Journal of Crop Science and
Biotechnology 12:115-120.
Vischi M, Raranciuc S, Baldini M (2013) Evaluation of genetic diversity between toxic and non toxic
Jatropha curcas L. accessions using a set of simple sequence repeat (SSR) markers. African
Journal of Biotechnology12: 265-274.
Vos P, Hogers R, Bleeker M, Reijans M, van de Lee T, Hornes M, Frijters A, Pot J, Peleman J, Kuiper M
and Zabeau M (1995) AFLP: a new technique for DNA fingerprinting. Nucleic Acids Research
23:4407-4414.
Vuylsteke M, Mank R, Antonise R, Bastiaans E, Senior ML, Stuber CW, Melchinger AE, Lbberstedt T,
Xia XC, Stam P (1999) Two high-density AFLP® linkage maps of Zea mays L.: Analysis of
distribution of AFLP markers. Theoretical and Applied Genetics 99: 921-935.
Wang A, Li Y and Zhang C (2012) QTL mapping for stay-green in maize (Zea mays). Canadian Journal
of Plant Science 92: 249-256.
Wang CM, Li LH, Zhang XT, Gao Q, Wang RF and An DG (2009a) Development and application of
EST-STS markers specific to chromosome 1RS of Secale cereal. Cereal Research
Communication 37:13-21.
Wang ML, Barkley NA, Jenkins TM (2009b) Microsatellite markers in plants and insects. Part I.
Applications of biotechnology. Genes Genomes Genomics 3:54-67.
Wang CM, Liu P, Yi C, Gu K, Sun F, Li L, Lo LC, Liu X, Feng F, Lin G, Cao S, Hong Y, Yin Z, Yue
GH (2011) A first generation microsatellite and SNP based linkage map of Jatropha. PLoS ONE
6(8): e23632.
Wang R, Hanna MA, Zhou W-W, Bhadury PS, Chen Q, Song BA (2011) Production and selected fuel
properties of biodiesel from promising non-edible oils: Euphorbia lathyris L., Sapium sebiferum L.
and Jatropha curcas L. Bioresource Technology 102:1194-1199.
Wang H, Li X, Jin WGX, Zhang X, Lin Z (2014) Comparison and development of EST-SSRs from two
454 sequencing libraries of Gossypium barbadense. Euphytica DOI 10.1007/s10681-014-1104-6.
Wang X, Trigiano R, Windham M, Scheffler B, Rinehart T, Spiers J (2008) Development and
characterization of simple sequence repeats for flowering dogwood (Cornus florida L.). Tree
Genetics and Genomes 4:461-468.
Wang XW, Kaga A, Tomooka N, Vaughan DA (2004) The development of SSR markers by a new
method in plants and their application to gene flow studies in azuki bean Vigna angularis (Willd.)
Ohwi and Ohashi. Theoretical and Applied Genetics109:352-360.
Wang Z, Weber JL, Zhang G, Tanksley SD (1994) Survey of plant short tandem DNA repeats.
Theoretical and Applied Genetics 88:1-6.
Wani SP, Chander G, Sahrawt KL, Rao Ch. S, Raghvendra G, Susanna P, Pavani M (2012a) Carbon
sequestration and land rehabilitation through Jatropha curcas (L.) plantation in degraded lands.
Agriculture, Ecosystem and Environment 161:112-120.
Wani TA, Kitchlu S, Ram G (2012b) Genetic variability studies for morphological and qualitative
attributes among Jatropha curcas L. accessions grown under subtropical conditions of North India.
South African Journal of Botany 79:102-105.
179
Wani SP, Osman M, D’Silva E, Sreedevi TK (2006) Improved livelihoods and environmental
protection through biodiesel plantations in Asia. Asian Biotechnology Development Review
8:11-29.
Ward JH (1963) Hierarchical grouping to optimize an objective function. Journal of the American
Statistical Association 58: 236-244.
Weber D and Helentjaris (1989) Mapping RFLP loci in Maize using B-A translocations. Genetics
121:583-590.
Weber JL (1990) Informativeness of human (dC-dA)n (dGdT)n polymorphisms. Genomics 7:524-530.
Weber JL and May PE (1989) Abundant class of human DNA polymorphisms which can be typed using
the polymerase chain reaction. American Journal of Human Genetics 44: 388-396.
Weissenbach J, Gyapay G, Dib C, Vignal A, Morissette J, Millasseau P, Vaysseix G and Lathrop M
(1992). A second-generation linkage map of the human genome. Nature 59: 794-801.
Wen M, Wang H, Xia Z, Zou M, Lu C and Wang W (2010) Development of EST-SSR and genomic-SSR
markers to assess genetic diversity in Jatropha Curcas L. BMC Research Notes 3:42.
Williams JGK, Kubelik AR, Livak KJ, Rafalski JA and Tingey SV (1990) DNA polymorphisms
amplified by arbitrary primers are useful as genetic markers. Nucleic Acids Research 18:6531-
6535.
Winter P and Kahl G (1995) Molecular marker technologies for plant improvement. World Journal of
Microbiology and Biotechnology 11: 438-448.
Wolff RK, Plaetke R, Jeffreys AJ, White R (1991) Unequal crossing over between homologous
chromosomes is not the major mechanism involved in the generation of new alleles at VNTR loci.
Genomics 5: 382-384.
Wu KS, Jones R, Danneberger L and Scolnik PA (1994) Detection of microsatellite polymorphisms
without cloning. Nucleic Acids Research 22: 3257-3258.
Wu KS, Tanksley SD (1993) Abundance, polymorphism and genetic mapping of microsatellites in rice.
Molecular and General Genetics 241:225-235.
Xiao Y, yu C, Yabes JM, Lei J, Wang X, Wang Z, Chen H, Tabanao DA (2013) Linkage disequilibrium
in a diversity and stress adaptation rice panel for association mapping. Molecular Plant Breeding
4:297-303.
Yadav HK, Ranjan A, Asif MH, Mantri S, Sawant SV, Tuli R (2011) EST-derived SSR markers in
Jatropha curcas L.: development, characterization, polymorphism, and transferability across the
species/genera. Tree Genetics and Genomes 7:207-219.
Yang T, Bao S, Ford R, Jia T, Guan J, He Y, Sun X, Jiang J, Hao J, Zhang X, Zong X (2012) High-
throughput novel microsatellite marker of faba bean via next generation sequencing. BMC
Genomics13:602.
Ye M, Li C, Francis G, Makkar HPS (2009) Current situation and prospects of Jatropha curcas as a
multipurpose tree in China. Agroforestry System 76:487-497.
Yu J, Zhao H, Zhu T, Chen L, Peng J (2013) Transferability of rice SSR markers to Miscanthus sinensis,
a potential biofuel crop. Euphytica 191:455-468.
Yue GH, Lo LC, Sun F, Cao SY, Yi CX, Hong Y, Sun WB (2013) No variation at 29 microsatellites in
the genome of Jatropha curcas. Journal of Genomics 2:59-63.
Zabeau M and Vos P (1993) Selective restriction fragment amplification: a general method for DNA
fingerprinting. European Patent 0534858 A1.
Zalapa JE, Cuevas H, Zhu H, Steffan S, Senalik D, Zeldin E, Mccown B, Harbut R, Simon P (2012)
Using next-generation sequencing approaches to isolate simple sequence repeat (SSR) loci in the
plant sciences. American Journal of Botany 99:193-208.
Zane I, Bergelloni L and Patarnello T (2002) Strategies for microsatellite isolation: a review. Molecular
Ecology 11:1-16.
Zapico FL, Nival SK, Aguilar CH, Eroy MN (2011) Phenotypic diversity of Jatropha curcas L. from
diverse origins. Journal of Agricultural Science and Technology 5:215-219.
180
Zeng Y, Yang S, Cui H, Yang X, Xu L, Du J, Pu X, Li Z, Cheng Z, Huang X (2009) QTLs of cold-related
traits at the booting stage for NIL-RILsin rice revealed by SSR. Genes and Genomics 31: 143-154.
Zhao X, Kochert G (1993) Phylogenetic distribution and genetic mapping of a (GGC) n microsatellite
from rice (Oryza sativa L.). Plant Molecular Biology 21:607-614.
Zhao Y, Wang H, Chen W, Li Y (2014) Genetic structure, linkage disequilibrium and association
mapping of verticillium wilt resistance in elite cotton (Gossypium hirsutum L.) germplasm
population. PLoS ONE 9:e86308.
Zhu H, Senalik D, McCown BH, Zeldin EL, Speers J, Hyman J, Bassil N, Hummer K, Simon PW, Zalapa
JE (2012) Mining and validation of pyrosequenced simple sequence repeats (SSRs) from American
cranberry (Vaccinium macrocarpon Ait.). Theoretical and Applied Genetics 124:87-96.
Zhu Y, Queller DC and Strassmann JE (2000) A phylogenetic perspective on sequence evolution in
microsatellite loci. Journal of Molecular Evolution 50:324-338.
Zietkiewicz E, Rafalski A and Labuda D (1994) Genome fingerprinting by simple sequence repeat (SSR)-
anchored polymerase chain reaction amplification. Genomics 20:176-183.

Appendix I. Details of chemicals and kits used
Table 1. Composition of suspension buffer used in the genomic DNA isolation
Suspension buffer (pH 8.0) Molecular weight Stock conc. Final conc.
EDTA 372.24 0.5M 50mM
Tris HCl 121.12 1M 100 mM
NaCl 58.44 5M 0.8M
Sucrose 342.3 1M 0.5M
Triton X-100 100% 2%
βME 0.1%
Table 2. Composition of extraction buffer used in the genomic DNA isolation
Extraction buffer (pH 8.0) Molecular weight Stock conc. Final conc.
EDTA 372.24 0.5M 20mM
Tris HCl 121.12 1M 100mM
NaCl 58.44 5M 1.5M
CTAB 2%
βME 0.1%
Table 3. Composition of buffers and solution used in plasmid isolation
Solution I Solution II Solution III
Glucose 50 mM NaOH 10 N Potassium acetate 5 mM
EDTA 10 mM SDS 10% Glacial acetic acid absolute
Tris HCl 25 mM
Table 4. Composition of buffer for agarose gel electrophoresis
Recipe for 1 liter 5X TBE buffer Recipe for 1 liter 50 X TAE buffer
Tris base 54 g Tris base 242 g
Boric Acid 27.5 g Acetic acid 57.1 mL
EDTA 4.65 g EDTA (0.5 M) (pH 8.0) 100 mL
Appendix II. Chemicals and reagents used
Table 5 List of chemicals used in the study
S.N. Name Chemicals S.N. Name Chemicals
1. Agarose 27. Glycerol
2. Acrylamide 28. Formaldehyde
3. Bis-Acrylamide 29. Chloroform
4. Luria agar (LA) 30. Isoamyl alcohol
5. Luria broth (LB) 31. Isopropyl alcohol
6. Luria broth agar (LBA) 32. Phenol
7. Sodium chloride 33. IPTG
8. β-mercaptoethanol 34. X-gal
9. Tris 35. PVP
10. Boric acid 36. Labolene
11. EDTA 37. SOC media
12. Silver nitrate 38. HiDi Formamide
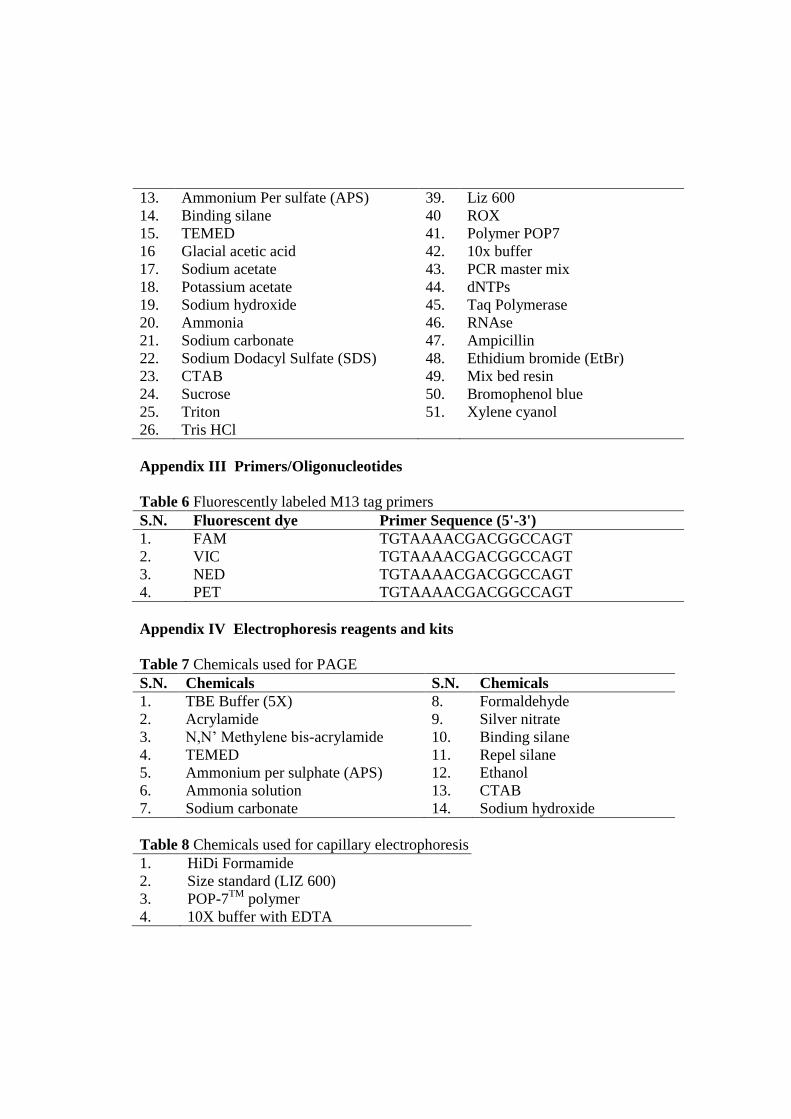
13. Ammonium Per sulfate (APS) 39. Liz 600
14. Binding silane 40 ROX
15. TEMED 41. Polymer POP7
16 Glacial acetic acid 42. 10x buffer
17. Sodium acetate 43. PCR master mix
18. Potassium acetate 44. dNTPs
19. Sodium hydroxide 45. Taq Polymerase
20. Ammonia 46. RNAse
21. Sodium carbonate 47. Ampicillin
22. Sodium Dodacyl Sulfate (SDS) 48. Ethidium bromide (EtBr)
23. CTAB 49. Mix bed resin
24. Sucrose 50. Bromophenol blue
25. Triton 51. Xylene cyanol
26. Tris HCl
Appendix III Primers/Oligonucleotides
Table 6 Fluorescently labeled M13 tag primers
S.N. Fluorescent dye Primer Sequence (5'-3')
1. FAM TGTAAAACGACGGCCAGT
2. VIC TGTAAAACGACGGCCAGT
3. NED TGTAAAACGACGGCCAGT
4. PET TGTAAAACGACGGCCAGT
Appendix IV Electrophoresis reagents and kits
Table 7 Chemicals used for PAGE
S.N. Chemicals S.N. Chemicals
1. TBE Buffer (5X) 8. Formaldehyde
2. Acrylamide 9. Silver nitrate
3. N,N’ Methylene bis-acrylamide 10. Binding silane
4. TEMED 11. Repel silane
5. Ammonium per sulphate (APS) 12. Ethanol
6. Ammonia solution 13. CTAB
7. Sodium carbonate 14. Sodium hydroxide
Table 8 Chemicals used for capillary electrophoresis
1. HiDi Formamide
2. Size standard (LIZ 600)
3. POP-7TM
polymer
4. 10X buffer with EDTA

Appendix V. Major Equipments used
Table 9 Major equipments used in the study
S.N. Equipment Model/type Company
1. Centrifuges Mini spin, Ultra centrifuge,
96-well plate centrifuge
Eppendorf, Thermo Fisher,
Sorvall fresco, Sigma svi
Biosolutions Pvt. Ltd.
2. Nano drop Spectrophotometer ND1000 Nanodrop Technologies, DE,
USA
3. PCR machines DNA Engine Tetrad 2 and
Verti 96 well thermo cycler
Bio-Rad Inc. USA, and
Applied Biosystems
4. Agarose gel
system
Horizontal Takara and GeneiTM
5. Gel Doc Gel DocTM
XR with Image
LabTM
Bio-Rad, USA
6. PAGE system Bio-Rad Sequi Gen gel
apparatus
Bio-Rad, USA.
7. Sequencing
platform
DNA analyzer ABI 3730 xl
GS FLX 454 pyrosequencer
Applied Biosystem Inc. USA)
Roche’s life science
8. High
throughput
electrophoresis
system
DNA analyzer ABI 3730 xl Applied Biosystem Inc. USA)

List of publications
(A) RESEARCH PAPERS PUBLISHED AND COMMUNICATED
1. Maurya R, Gupta A, Singh SK, Rai KM, Chandrawati, Sawant SV, Yadav HK (2013)
Microsatellite polymorphism in Jatropha curcas L.- a biodiesel plant. Industrial Crops and
Products. 49:136-142.
2. Maurya R, Verma S, Gupta A, Singh B, Yadav HK (2013) Genetic variability and
divergence analyses in Jatropha Curcas L. based on floral and yield traits. Genetika 45:
655-666.
3. Gupta A, Maurya R, Roy RK, Sawant SV, Yadav HK (2013) AFLP genetic relationship
and population structure analysis of Canna-an ornamental plant. Scientia Horticulturae
154:1-7.
4. Chandrawati, Maurya R, Singh PK, Ranade SA, Yadav HK (2014) Diversity analysis in
Indian genotypes of linseed (Linum usitatissimum L.) using AFLP markers. Gene 549:171-
178.
5. Maurya R, Kumar U, Katiyar R, Yadav HK (2014) Correlation and path coefficient analysis
in J. curcas. Genetika (Accepted).
6. Maurya R#, Gupta A
#, Singh SK, Rai KM, Chandrawati, Ktiyar R, Sawant SV, Yadav HK
(2014) Development of microsatellite markers for Jatropha curcas using 454 sequencing and
its application for diversity analysis. (Communicated). # Equal contribution
(B) SCIENTIFIC PRESENTATIONS
1. Yadv HK, Maurya R, Gupta A, Singh S, Rai KM, Tuli R and Sawant SV (2011)
Development of microsatellite markers and their application for diversity analysis in
Jatropha curcas L. (All India Botanical conference held at Lucknow University, October
10-12, 2011). Page N. 195.
2. Gupta A, Maurya R, Singh SK, Rai KM and Yadav HK (2011) Development of large scale
genomic SSRs from microsatellite enriched libraries of Jatropha curcas L”. - a biofuel plant,
(Society of Biotechnological chemist Conference, 12-15 November, 2011, held on CSIR-
CIMAP, Lucknow). Page N. 59. 3. Maurya R, Gupta A, Kumar U, Chandrawati and Yadav HK (2013) Development and
characterization of trinucleotide repeat (TNR) motif microsatellite markers in Jatropha
curcas L. (SAB-Society for Applied Biotechnology held on 28th
-29th
, June, 2013, at
Tirupati, Andhra Pradesh. First International and Third National Conference). Page N.
28.
4. Chandrawati, Maurya R, Singh PK and Yadav HK (2013) AFLP based genetic diversity in
linseed (Linum usitatissimum L.). (SAB-Society for Applied Biotechnology held on 28th
-
29th
, June, 2013, at Tirupati, Andhra Pradesh. First International and Third National
Conference). Page N. 199. 5. Maurya R, Gupta A, Katiyar R, Ranade SA and Yadav HK (2014) Development of
interspecific hybrid of Jatropha curcas L. and its characterization using SSR markers.
(2nd UP Agricultural Science Congress held on June 14th
-16th
June, 2014 at IISR,
Lucknow). Page N. 313-314. 6. Chandrawati, Maurya R, Singh PK, Ranade SA and Yadav HK (2014) Molecular diversity
in Indian genotypes of linseed (Linum usitatissimum L.). (2nd
UP Agricultural Science
Congress held on June 14th
-16th
June, 2014 at IISR, Lucknow). Page N. 312-313.

Industrial Crops and Products 49 (2013) 136– 142
Contents lists available at SciVerse ScienceDirect
Industrial Crops and Products
journa l h om epa ge: www.elsev ier .com/ locate / indcrop
Microsatellite polymorphism in Jatropha curcas L.—A biodiesel plant
Ramanuj Maurya, Astha Gupta, Sunil Kumar Singh, Krishan Mohan Rai, Chandrawati,Samir V. Sawant, Hemant Kumar Yadav ∗
CSIR-National Botanical Research Institute, Rana Pratap Marg, Lucknow 226001, India
a r t i c l e i n f o
Article history:Received 5 February 2013Received in revised form 19 April 2013Accepted 19 April 2013
Keywords:Jatropha curcasEnriched libraryGenomic SSRBiodieselGenetic diversity
a b s t r a c t
We developed and characterized 1207 SSRs to enrich the validated markers repertoire of Jatropha curcas.A total of 248 polymorphic SSRs were identified with a panel of 7 accessions of J. curcas including someexotic accessions. Furthermore, 179 and 331 SSRs were found polymorphic among parental lines ofNBRI-J05 × EC643912 and Chhatrapati × Jatropha integerrima used in developing two mapping populationrespectively. The number of alleles varied from 2 to 5 with an average of 2.24 ± 0.55 and 2.42 ± 0.62alleles/SSR for CA and GA enriched library respectively. Most of the SSRs had lower PIC value (less than0.30) and the maximum PIC value was observed for JGM A281, JGM A326 (0.63) followed by JGM B300(0.62), JGM B361 (0.58), JGM A244 (0.55), JGM B595 (0.55) and JGM B176 (0.55). The genetic similaritycoefficient among the accessions of J. curcas and one accession of J. integerrima ranged from 0.11 to 0.92with an average of 0.57 ± 0.31. The phenogram classified all the 7 accessions of J. curcas in one cluster andthe J. integerrima remained as an out group. The BLASTX analysis of SSR containing sequences showedmaximum similarity of 50% with Ricinus communis (Euphorbiaceae) followed by Populus trichocarpa (22%),Vitis vinifera (16%) and Arabidopsis spp. (4.5%). This study may enrich the validated repertoire of SSRmarkers in J. curcas and could be used in various genetic studies including construction of linkage map,diversity analysis, and QTL/association mapping.
© 2013 Elsevier B.V. All rights reserved.
1. Introduction
Jatropha curcas L., commonly known as physic nut, belongs tothe family Euphorbiaceae and has small genome size of 416 Mb(Carvalho et al., 2008). It is reported to be native to tropical Amer-ica, but also widely distributed in other tropical and sub-tropicalareas of the world, especially in Africa, India and Southeast Asia(Heller, 1996; Rao et al., 2008). Traditionally, this plant is used asa fence plant, to prevent and/or control erosion and reclaim land.Recently, J. curcas has been projected as a promising and poten-tial source of biodiesel as crude oil from its seeds meets the fuelquality of rapeseed (www.fact-foundation.com) which can be eas-ily converted to biodiesel with US and European standards (Azamet al., 2005). However, J. curcas is still considered as undomes-ticated/semi domestic plant with various negative features withmajor knowledge gaps regarding basic genetics, ecological andagronomic properties (Achten et al., 2008; Fairless, 2007). Consid-ering the importance of the crop, there is a need for a betterunderstanding of various basic and applied aspects of this plant soas to improve or develop stable high yielding varieties. Traditionalapproaches for genetic improvement of polygenic traits mainly rely
∗ Corresponding author. Tel.: +91 522 2297938; fax: +91 522 2205836.E-mail address: [email protected] (H.K. Yadav).
on phenotypic and pedigree information (Falconer et al., 1996) thatare labor and time intensive. Therefore, the molecular breedingapproach is being considered for genetic improvement for mostof the economically important crop plants as faster alternatives.The basic requirements of any marker assisted breeding programto be successful include availability of reliable molecular markersystem, and markers tightly linked to QTLs of desired traits. Amongvarious DNA markers, SSRs and SNPs have been widely applied forestimation of genetic diversity, construction of linkage map andassociation/QTL mapping to tag the target traits. As far as J. curcasis concerned, a limited number of SSRs and SNPs marker are avail-able as the information on quantitative genetics. Although, Satoet al. (2011) reported genome sequence of J. curcas and identifiedlarge number of SSRs, but the details of these SSRs are not avail-able with the public domain. Further, they characterized only 100SSRs (<0.3% reported) over 12 accessions. So, there is still need oflarger numbers of validated markers. In recent past, various effortshave been made to develop and utilize different molecular mark-ers in J. curcas which majorly include RAPD (Ganesh et al., 2008;Rafii et al., 2012), SPAR (Ranade et al., 2008), ISSR (Grativol et al.,2010; Kumar et al., 2009) and AFLP (Tatikonda et al., 2009; Shenet al., 2010) markers. However, some reports on SSRs and SNPsmarkers are also available (Sudheer et al., 2010; Yadav et al., 2011;Wang et al., 2011; Gupta et al., 2012a). Wang et al. (2011) have con-structed linkage map of J. curcas with 216 SSRs and 290 SNPs using
0926-6690/$ – see front matter © 2013 Elsevier B.V. All rights reserved.http://dx.doi.org/10.1016/j.indcrop.2013.04.034
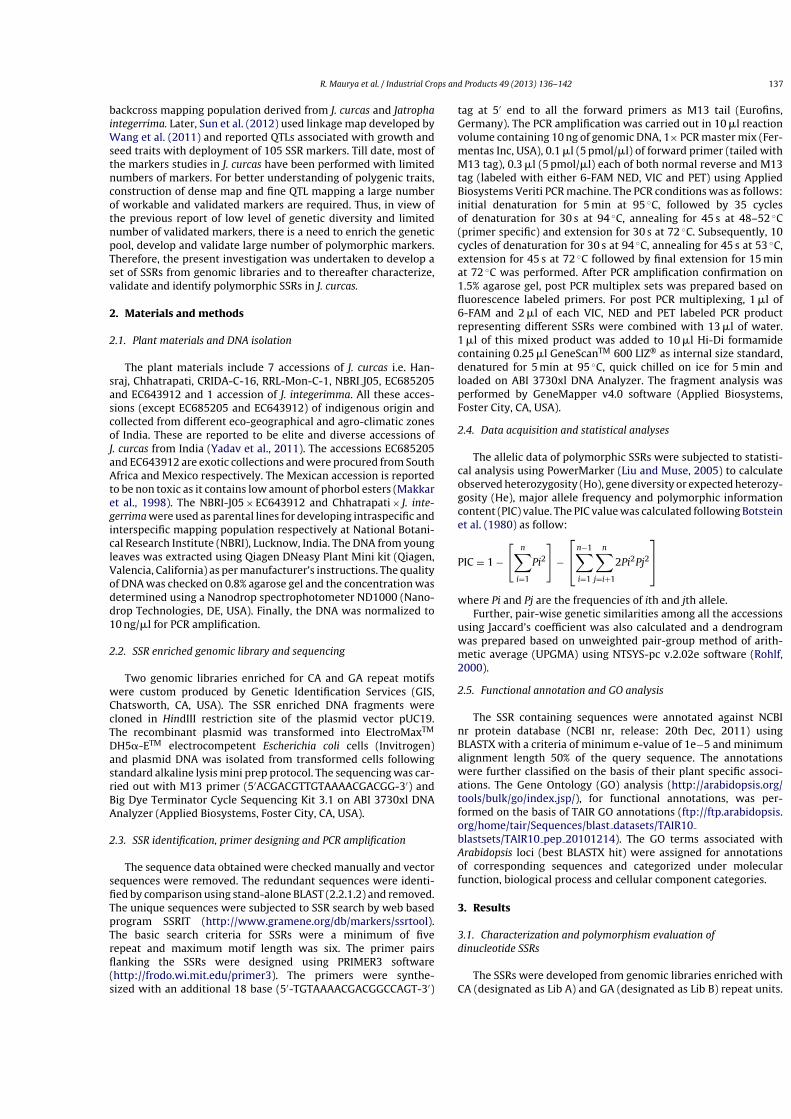
R. Maurya et al. / Industrial Crops and Products 49 (2013) 136– 142 137
backcross mapping population derived from J. curcas and Jatrophaintegerrima. Later, Sun et al. (2012) used linkage map developed byWang et al. (2011) and reported QTLs associated with growth andseed traits with deployment of 105 SSR markers. Till date, most ofthe markers studies in J. curcas have been performed with limitednumbers of markers. For better understanding of polygenic traits,construction of dense map and fine QTL mapping a large numberof workable and validated markers are required. Thus, in view ofthe previous report of low level of genetic diversity and limitednumber of validated markers, there is a need to enrich the geneticpool, develop and validate large number of polymorphic markers.Therefore, the present investigation was undertaken to develop aset of SSRs from genomic libraries and to thereafter characterize,validate and identify polymorphic SSRs in J. curcas.
2. Materials and methods
2.1. Plant materials and DNA isolation
The plant materials include 7 accessions of J. curcas i.e. Han-sraj, Chhatrapati, CRIDA-C-16, RRL-Mon-C-1, NBRI J05, EC685205and EC643912 and 1 accession of J. integerimma. All these acces-sions (except EC685205 and EC643912) of indigenous origin andcollected from different eco-geographical and agro-climatic zonesof India. These are reported to be elite and diverse accessions ofJ. curcas from India (Yadav et al., 2011). The accessions EC685205and EC643912 are exotic collections and were procured from SouthAfrica and Mexico respectively. The Mexican accession is reportedto be non toxic as it contains low amount of phorbol esters (Makkaret al., 1998). The NBRI-J05 × EC643912 and Chhatrapati × J. inte-gerrima were used as parental lines for developing intraspecific andinterspecific mapping population respectively at National Botani-cal Research Institute (NBRI), Lucknow, India. The DNA from youngleaves was extracted using Qiagen DNeasy Plant Mini kit (Qiagen,Valencia, California) as per manufacturer’s instructions. The qualityof DNA was checked on 0.8% agarose gel and the concentration wasdetermined using a Nanodrop spectrophotometer ND1000 (Nano-drop Technologies, DE, USA). Finally, the DNA was normalized to10 ng/�l for PCR amplification.
2.2. SSR enriched genomic library and sequencing
Two genomic libraries enriched for CA and GA repeat motifswere custom produced by Genetic Identification Services (GIS,Chatsworth, CA, USA). The SSR enriched DNA fragments werecloned in HindIII restriction site of the plasmid vector pUC19.The recombinant plasmid was transformed into ElectroMaxTM
DH5�-ETM electrocompetent Escherichia coli cells (Invitrogen)and plasmid DNA was isolated from transformed cells followingstandard alkaline lysis mini prep protocol. The sequencing was car-ried out with M13 primer (5′ACGACGTTGTAAAACGACGG-3′) andBig Dye Terminator Cycle Sequencing Kit 3.1 on ABI 3730xl DNAAnalyzer (Applied Biosystems, Foster City, CA, USA).
2.3. SSR identification, primer designing and PCR amplification
The sequence data obtained were checked manually and vectorsequences were removed. The redundant sequences were identi-fied by comparison using stand-alone BLAST (2.2.1.2) and removed.The unique sequences were subjected to SSR search by web basedprogram SSRIT (http://www.gramene.org/db/markers/ssrtool).The basic search criteria for SSRs were a minimum of fiverepeat and maximum motif length was six. The primer pairsflanking the SSRs were designed using PRIMER3 software(http://frodo.wi.mit.edu/primer3). The primers were synthe-sized with an additional 18 base (5′-TGTAAAACGACGGCCAGT-3′)
tag at 5′ end to all the forward primers as M13 tail (Eurofins,Germany). The PCR amplification was carried out in 10 �l reactionvolume containing 10 ng of genomic DNA, 1× PCR master mix (Fer-mentas Inc, USA), 0.1 �l (5 pmol/�l) of forward primer (tailed withM13 tag), 0.3 �l (5 pmol/�l) each of both normal reverse and M13tag (labeled with either 6-FAM NED, VIC and PET) using AppliedBiosystems Veriti PCR machine. The PCR conditions was as follows:initial denaturation for 5 min at 95 ◦C, followed by 35 cyclesof denaturation for 30 s at 94 ◦C, annealing for 45 s at 48–52 ◦C(primer specific) and extension for 30 s at 72 ◦C. Subsequently, 10cycles of denaturation for 30 s at 94 ◦C, annealing for 45 s at 53 ◦C,extension for 45 s at 72 ◦C followed by final extension for 15 minat 72 ◦C was performed. After PCR amplification confirmation on1.5% agarose gel, post PCR multiplex sets was prepared based onfluorescence labeled primers. For post PCR multiplexing, 1 �l of6-FAM and 2 �l of each VIC, NED and PET labeled PCR productrepresenting different SSRs were combined with 13 �l of water.1 �l of this mixed product was added to 10 �l Hi-Di formamidecontaining 0.25 �l GeneScanTM 600 LIZ® as internal size standard,denatured for 5 min at 95 ◦C, quick chilled on ice for 5 min andloaded on ABI 3730xl DNA Analyzer. The fragment analysis wasperformed by GeneMapper v4.0 software (Applied Biosystems,Foster City, CA, USA).
2.4. Data acquisition and statistical analyses
The allelic data of polymorphic SSRs were subjected to statisti-cal analysis using PowerMarker (Liu and Muse, 2005) to calculateobserved heterozygosity (Ho), gene diversity or expected heterozy-gosity (He), major allele frequency and polymorphic informationcontent (PIC) value. The PIC value was calculated following Botsteinet al. (1980) as follow:
PIC = 1 −[
n∑i=1
Pi2
]−
⎡⎣ n−1∑
i=1
n∑j=i+1
2Pi2Pj2
⎤⎦
where Pi and Pj are the frequencies of ith and jth allele.Further, pair-wise genetic similarities among all the accessions
using Jaccard’s coefficient was also calculated and a dendrogramwas prepared based on unweighted pair-group method of arith-metic average (UPGMA) using NTSYS-pc v.2.02e software (Rohlf,2000).
2.5. Functional annotation and GO analysis
The SSR containing sequences were annotated against NCBInr protein database (NCBI nr, release: 20th Dec, 2011) usingBLASTX with a criteria of minimum e-value of 1e−5 and minimumalignment length 50% of the query sequence. The annotationswere further classified on the basis of their plant specific associ-ations. The Gene Ontology (GO) analysis (http://arabidopsis.org/tools/bulk/go/index.jsp/), for functional annotations, was per-formed on the basis of TAIR GO annotations (ftp://ftp.arabidopsis.org/home/tair/Sequences/blast datasets/TAIR10blastsets/TAIR10 pep 20101214). The GO terms associated withArabidopsis loci (best BLASTX hit) were assigned for annotationsof corresponding sequences and categorized under molecularfunction, biological process and cellular component categories.
3. Results
3.1. Characterization and polymorphism evaluation ofdinucleotide SSRs
The SSRs were developed from genomic libraries enriched withCA (designated as Lib A) and GA (designated as Lib B) repeat units.

138 R. Maurya et al. / Industrial Crops and Products 49 (2013) 136– 142
Table 1Summary of genomic SSRs developed from enriched libraries of J. curcas.
Lib A (CA enriched) Lib B (GA enriched) Total
Clones Sequenced 1740 1530 3270Sequences containing SSR motifs 1385 (79.6%) 1345 (87.9%) 2730 (83.5%)SSR containing unique sequences 639 (46.1%) 676(50.3%) 1315 (48.2%)Primers designed for 574(41.4%) 633(47.1%) 1207(44.2%)Total number of SSRs identified 759 857 1616Sequences with > 1 SSRs 152 (26.5%) 191 (30.2%) 343 (28.4%)Compound SSRs 115(20.0%) 154(24.0%) 269 (22.0%)Perfect 455 (79.0%) 473 (75.0%) 928 (77.0%)Interrupted 4 (1.0%) 6(1.0%) 10 (1.0%)
More than 3500 clones were sequenced and a total of 1740 and1530 good quality sequences were selected from Lib A and B respec-tively (Table 1). A total of 1385(79.6%) sequence from Lib A and1530 (87.9%) sequences from Lib B were found to have SSR motifs.After removing redundant sequences, a total of 639 (46.1%) and 676(50.3%) SSR containing sequences were found to be unique from LibA and B respectively. Primers were successfully designed for 574(out of 639 of Lib A) SSR containing sequences while the remaining65 primers could not be designed due to either marginal SSRs orflanking sequences not suitable for primer designing criteria. Like-wise, out of 674 sequences of Lib B, primers were designed for 633sequences. Thus, a total of 1207 (44.2%) primer pairs flanking 1616SSRs were successfully designed and synthesized (SupplementaryTable 1). These 1207 SSR containing sequences were submitted toNCBI under GSS (Acc. No. JM427845–JM429048). The enrichmentpercentage was found to be higher for GA repeat motif (87.9%)than CA repeat motif (79.6%). As expected, dinucleotide repeats(DNR) were recovered in higher proportion from both the libraries(Supplementary Fig. 1a). However, other SSR repeat types such astrinucleotide repeat (TNR) and tetranucleotide repeat (TNR) werealso obtained but in limited numbers. The majority of identifiedSSRs (65.4%) were of short length, in the range of 4–10 repeat unitsfrom both the libraries (Supplementary Fig. 1b). However, 37 longerSSRs were also found with more than 20 repeat unit. Consider-ing the frequencies of different SSR motifs, the AC/GT and AG/CTrecovered in higher frequency of 32.5% and 45.3% of Lib A and Brespectively (Supplementary Fig 2).
Out of 574 Lib A SSRs, 106 (18.5%) were found to be polymorphicamong 7 accessions of J. curcas, 420 (73.2%) were monomorphic andthe rest 48 (8.3%) failed to amplify. Further, exclusion of EC643912(non-toxic accession) reduces the polymorphic SSRs to 55 (9.6%)(Table 2). The intraspecific mapping population parental screeningof Lib A SSRs revealed that 71 (12.4%) were polymorphic and 446were monomorphic among NBRI-J05 × EC643912, while 57 werenot amplified in both the accessions. In case of the parents of inter-specific population i.e. Chhatrapati × J. integerrima, 144 (25%) SSRswere polymorphic and 177 (30.8%) were monomorphic. Similarly,251 and 2 SSRs were not amplified with J. integerrima and Chhatra-pati respectively. Furthermore, the results obtained with Lib B SSRsshowed that 70 were not amplified with any accession of J. curcasand out of rest 563, 421 (75.0%) were found to be monomorphic and142 (25.0%) were polymorphic. The number of polymorphic SSRs
reduced from 142 to 74 when EC643012 (non-toxic accession) wasexcluded from the analysis. The polymorphism screening of Lib BSSRs with parental lines showed that 108 (19.2%) and 187 (33.2%)were polymorphic with NBRI-J05 × EC643912 and Chhatrapati × J.integerrima respectively (Table 2).
In addition to polymorphism detection with respect to map-ping populations, the genotypic data of polymorphic SSRs with 7accessions of J. curcas was also subjected to various statistical anal-yses to assess the potential of newly developed SSRs for furthergenetic studies. The 106 polymorphic Lib A SSRs showed differentdegree of variability at each locus as the number of alleles variedfrom 2 to 5 (JGM A281) with an average of 2.24 ± 0.55 alleles/SSR(Supplementary Table 2). The PIC value of these polymorphic SSRsranged between 0.12–0.63 with an average of 0.24 ± 0.10. The max-imum PIC was noticed for JGM A281 and JGM A326 (0.63) followedby JGM A244 (0.55) and JGM A107 (0.52). Most of the SSRs (85;53.1%) showed lower PIC value less than 0.3 (Fig. 1). There wereonly three SSRs showing PIC value in between 0.51 – 0.70. Theobserved heterozygosity (Ho) and expected heterozygosity (He)or gene diversity varied in the range of 0.00–1.0 (0.12 ± 0.23) and0.12–0.65 (0.24 ± 0.11) respectively (Supplementary Table 2). Themajor allele frequency of polymorphic SSRs varied from 0.43 to 0.93with an average of 0.83 ± 0.11. The detailed analysis of 142 poly-morphic Lib B SSRs revealed considerable variability at each locusand showed allele range from 2 to 5 with an average of 2.42 ± 0.62alleles/SSR. The PIC value varied between 0.12 – 0.62 with an aver-age of 0.28 ± 0.13 per SSR (Supplementary Table 2). Also in caseof Lib B, most of the SSRs (92; 65%) had lower PIC value (<0.30)(Fig. 1). There were only 9 SSRs which showed PIC value in rangeof 0.51–0.70. The maximum PIC value was observed for JGM B300(0.62) followed by JGM B361 (0.58), JGM B595 (0.55) and JGM B176(0.55). Major allele frequency of polymorphic SSRs of Lib B rangedfrom 0.43 to 0.93 with an average of 0.78 ± 0.15. The observed het-erozygosity (Ho) varied between 0.00 and 1.00 with an averageof 0.31 ± 0.21 and expected heterozygosity (He) or gene diversityvaried from 0.12 to 0.65 with an average of 0.28 ± 0.14 (Supple-mentary Table 2). Further, to study the extent of allelic diversityand potential of the developed SSRs for toxic accessions, the PICvalue was also calculated based on 6 accessions of J. curcas exclud-ing EC643912 (non-toxic accession). The PIC value of polymorphicLib A and Lib B SSRs varied from 0.14 to 0.64 (0.22 ± 0.11) and 0.14to 0.57 (0.56 ± 0.12) respectively (data not shown).
Table 2Polymorphism screening details of SSRs with different accession of J. curcas and mapping populations.
Lib A SSRs Lib B SSRs
Polymorphic Monomorphic Fail Polymorphic Monomorphic Fail
Seven acc. of J. curcas 106 420 48 142 421 70Six acc. J. curcas (excluding EC643912) 55 471 48 74 489 70NBRI-J05 x EC643912a 71 446 57 108 450 75Chhatrapati x J. integerrimab 144 177 253 187 228 218
a Parental lines of intraspecific mapping population.b Parental lines of inter-specific mapping population.

R. Maurya et al. / Industrial Crops and Products 49 (2013) 136– 142 139
Fig. 1. PIC distribution of polymorphic SSR loci calculated from 7 accessions of J. curcas including non-toxic accessions.
3.2. Similarity search and functional annotations
The similarity search of SSR containing sequences showed max-imum similarity of 50% with Ricinus communis (Euphorbiaceae)(Fig. 2). Significant similarity was also observed with Populus tri-chocarpa (22%), Vitis vinifera (16%) and Arabidopsis spp. (4.5%). GeneOntology analysis (http://arabidopsis.org/tools/bulk/go/index.jsp/)resulted into a total of 1539 GO terms (against 1207 sequences),which were further categorized under biological processes, (638terms, 41%), cellular components (366 terms, 24%) and molecularfunctions (535 terms, 35%) category. Besides, significant numbersof terms for unknown/unclassified annotations (under all the threecategories), maximum numbers of terms were assigned for proteinmetabolism (10%) in biological processes category (Fig. 3). Simi-larly, maximum number of terms was assigned for nucleus (9%)and chloroplast (7%) in cellular components and for protein binding(13%) in molecular functions category.
3.3. Phylogenetic analyses
The genotypic data of all the polymorphic SSRs over 7 acces-sions of J. curcas and 1 accession of J. integerrima was used toevaluate the genetic diversity/interrelationship among the selectedaccessions. The genetic similarity coefficient ranged from 0.11to 0.92 with an average of 0.57 ± 0.31. The phenogram classi-fied all the 7 accessions of J. curcas into one cluster and the J.integerrima remained as an out group (Fig. 4). The two acces-sions i.e. Hansraj and Chhatrapati were found to be very closewith 92% of genetic similarity. Among exotic accessions, theEC643912 (non-toxic accession) showed higher degree of diver-sity and EC685202 (toxic accession) was grouped with NBRI-J05.The genetic diversity among the parental lines of intraspecificmapping population i.e. Chhatrapati × EC643912 was found to be51% while in case of interspecific mapping population it was89%.
Fig. 2. Annotation of genomic SSRs developed from enriched libraries of J. curcas. Each bar indicates the percent sequence similarity with various plant genomes based onBLASTN.

140 R. Maurya et al. / Industrial Crops and Products 49 (2013) 136– 142
0
5
10
15
20
25
% G
ene
cou
nt
Functional categories
Cellular co mponent Molecular func tionsBiological proc ess
Fig. 3. Gene Ontology (GO) classification of the SSR containing genomic sequences derived from microsatellite enriched libraries of J. curcas. The relative frequencies of GOhits to functional categories of cellular components, biological process, and molecular functions.
4. Discussion
Jatropha curcas (2n = 22), a perennial shrub producing non edibleoil, has emerged as a renewable source of biodiesel production. Itattracts worldwide attention of research communities to study andanalyze its potential for biodiesel production. Various research pro-grams have been initiated on different aspects of crop improvementincluding agronomy, conventional breeding, molecular breeding,genetic engineering etc. As per previous reports, the J. curcas isstill considered as an undomesticated/semi-domesticated plantwhich needs further genetic improvement through intervention
of both conventional as well as molecular breeding approaches.The advent of various molecular tools and further advances inmolecular marker technologies offers fast and targeted geneticimprovement through genomic assisted breeding. Various typesof molecular markers have been widely used to track loci tightlylinked with the different agronomic and disease resistance traits inseveral crop species (Phillips and Vasil, 2001; Jain et al., 2002; Guptaand Varshney, 2000). Among different approaches of developingmolecular markers, the use of microsatellite enriched genomiclibraries has been widely used for SSRs development. In the presentinvestigation SSRs were developed from CA and GA repeat enriched
Fig. 4. Genetic relationship among 7 accessions of J. curcas and 1 of J. integerrima based on UPGMA clustering derived from 248 polymorphic genomic SSRs.

R. Maurya et al. / Industrial Crops and Products 49 (2013) 136– 142 141
genomic libraries of J. curcas (NBRI J05). The microsatellite enrich-ment level was reported to vary from 11 to 99% in previous studiesin different crop plants (Techen et al., 2010). Here, the enrich-ment efficiency was noticed upto 87.9% and a total of 1207 uniquesequences were recovered from both the libraries at 44.2% recoveryrate. Sun et al. (2008) have also reported almost similar enrich-ment efficiency (89.5%) in J. curcas. However, Sudheer et al. (2009)found lower enrichment efficiency (39.0%). Since, the libraries wereenriched with CA and GA repeats, the frequency of core repeatswas found to be high for dinucleotide motif, though other repeatmotif were also recovered. The maximum number of clones of CAenriched library has AC/GT repeat motif and GA enriched libraryhas AG/CT repeat. The non-targeted AT motifs were also recoveredin significant number and were the major part of compound SSRswith targeted repeat motifs. Similar findings are also reported inother plant genomes like Maize (Taramino and Tingey, 1996), sun-flower (Paniego et al., 2002), and safflower (Hamdan et al., 2011).The AT repeat motifs among DNRs are reported to be most com-mon in genomic sequences of Arabidopsis (Cardle et al., 2000).Recently, Sato et al. (2011) also reported high frequency of ATrepeat motif (71%) among DNR and AAT (60%) among TNR in thegenome sequence of J. curcas. The appearance of AT motif in thepresent investigation might be due to its higher frequency in J.curcas genome.
Approximately 90% amplification of primers from both thelibraries was observed which is comparatively higher in propor-tion than earlier reports in J. curcas by Sudheer et al. (2010, 74%)and Yadav et al. (2011, 78%). However, it was comparable to resultsobtained by Sato et al. (2011, 88%). The rate of polymorphism wasquite low among intraspecific parental lines (Lib A SSRs ∼12%; Lib BSSRs ∼19%) as compared to interspecific parental lines (Lib A SSRs∼25%; Lib B SSRs ∼33%). The cross species transferability of SSRs toJ. integerrima was ∼52%. It was noticed that majority of intraspecificpolymorphism among 7 accessions of J. curcas was due to accessionEC643912 (non-toxic). We observed ∼52% polymorphism reduc-tion when EC643912 accession was excluded from analysis. Thepolymorphism rate among different accessions of J. curcas wasfound to be low (23%) as compared to the previous studies in Jat-ropha (Sudheer et al., 2010; Yadav et al., 2011), however it washigher than that reported by Sun et al. (2008). The 248 polymorphicSSRs could be potential markers for future genetic studies in Jat-ropha as they showed considerable amount of allelic variation (2–5alleles per locus) among limited accession of J. curcas. The PIC valuereveals the informativeness level and accordingly defined into high(PIC > 0.5), moderate (PIC > 0.25 and < 0.5) and low (PIC < 0.25) cat-egories (Botstein et al., 1980). The SSRs developed exhibited lowlevel of informativeness with an average PIC value of 0.24 ± 0.10and 0.28 ± 0.13 of Lib A and Lib B respectively. The majority of theSSRs (71.0%) showed lower PIC value which might be due to eitherlow level of genetic diversity available in the germplasm or lessnumber of accessions studied. This is further supported by the factthat exclusion of EC643912 (non-toxic accession) further reducesthe PIC value. No specific correlation between number of repeatsand number of alleles or PIC value was observed in J. curcas. Similarfindings were also reported in previous studies (Hossain et al., 2000;Ferguson et al., 2004; Gupta et al., 2012b). However, a positive cor-relation was reported in grape (Bowers et al., 1996) and Arachis(Moretzsohn et al., 2005). The low average PIC value and number ofalleles observed suggests narrow genetic diversity available in thegene pool of J. curcas. Therefore, the study suggests collection andevaluation of more number of accessions especially from the centerof origin and also to develop larger number of polymorphic mark-ers in order to facilitate genetic improvement of J. curcas throughmarker assisted breeding programs.
Further, significant putative function could be assigned for 17%(200) of the newly developed SSR containing sequences and 50%
of that showed homology with Ricinus communis, a member ofEuphorbiaceae followed by Populus trichocarpa, Vitis vinifera andArabidopsis spp. The genetic relationship among 7 J. curcas accessionand 1 accession of J. integerrima based on 248 polymorphic markers,depicts a clear distinctness of J. integerrima from J. curcas. Among J.curcas, the accession EC643912 (non-toxic) was found to be highlydiverse, which is also reported in earlier studies (Makkar et al.,1998; Basha et al., 2009). The clustering of the accessions suggeststhat the parental lines selected for developing mapping population(both intra specific and interspecific) was a right approach whichmay be useful in future genetic studies.
5. Conclusions
Here, we reported 1207 genomic SSRs (1089 working SSR) fromCA and GA repeat motif enriched genomic libraries of J. curcas.Polymorphic SSRs for both intraspecific and interspecific mappingpopulations have been identified and characterized for variousstatistical attributes. These newly developed SSRs may facilitateconstruction of high density linkage map, diversity analysis, andQTL/association mapping and may be further utilized in makingstrategies for marker assisted breeding toward developing highseed and oil yielding cultivars.
Acknowledgements
The authors thank the Department of Biotechnology, Ministryof Science, Government of India, for financial support. Authors alsothank Dr. S.A. Ranade, Chief Scientist, CSIR-NBRI for his critical eval-uation of manuscript and useful suggestions.
Appendix A. Supplementary data
Supplementary data associated with this article can be found,in the online version, at http://dx.doi.org/10.1016/j.indcrop.2013.04.034.
References
Achten, W.M.J., Verchot, L., Franken, Y.J., Mathijs, E., Singh, V.P., Aerts, R., Muys, B.,2008. Jatropha biodiesel production and use. Biomass Bioenergy 32, 1063–1084.
Azam, M.M., Waris, A., Nahar, N.M., 2005. Prospects and potential of fatty acidmethyl esters of some non-traditional seed oils for use as biodiesel in India.Biomass Bioenergy 4, 293–302.
Basha, S.D., Francis, G., Makkar, H.P.S., Becker, K., Sujatha, M., 2009. A comparativestudy of biochemical traits and molecular markers for assessment of geneticrelationships between Jatropha curcas L. germplasm from different countries.Plant Sci. 176, 812–823.
Botstein, D., White, R.L., Skolnick, M., Davis, R.W., 1980. Construction of geneticlinkage map in man using restriction fragment length polymorphisms. Am. J.Hum. Genet. 32, 314–331.
Bowers, J.E., Dangl, G.S., Vignani, R., Meredith, C.P., 1996. Isolation and characteri-zation of new polymorphic simple sequence repeat loci in grape (Vitis viniferaL.). Genome 39, 628–633.
Cardle, L., Ramsay, L., Milbourne, D., Macaulay, M., Marshall, D., Waugh, R., 2000.Computational and experimental characterization of physically clustered simplesequence repeats in plants. Genetics 156, 847–854.
Carvalho, C.R., Clarindo, W.R., Prac, M.M., Araujo, F.S., Carels, N., 2008. Genome size,base composition and karyotype of Jatropha curcas L. an important biofuel plant.Plant Sci. 174, 613–617.
Fairless, D., 2007. Biofuel: the little shrub that could – maybe. Nature 449 (7163),652–655.
Falconer, D.S., Mackay, T.F.C., Frankham, R., 1996. Introduction to quantitative genet-ics (4th edn). Trends Genet. 12 (7), 280.
Ferguson, M.E., Burow, M.D., Schultz, S.R., Bramel, P.J., Paterson, A.H., Kresovich, S.,Mitchell, S., 2004. Microsatellite identification and characterization in peanut(A. hypogaea L.). Theor. Appl. Genet. 108, 1064–1070.
Ganesh, R.S., Parthiban, K.T., Senthil Kumar, R., Thiruvengadam, V., Paramathma,V.M., 2008. Genetic diversity among Jatropha species as revealed by RAPD mark-ers. Genet. Resour. Crop Evol. 55, 803–809.
Grativol, C., da Fonseca Lira-Medeiros, C., Hemerly, A.S., Ferreira, P.C., 2010. Highefficiency and reliability of inter-simple sequence repeats (ISSR) markers forevaluation of genetic diversity in Brazilian cultivated Jatropha curcas L. acces-sions. Mol. Biol. Rep. 38, 4245–4256.

142 R. Maurya et al. / Industrial Crops and Products 49 (2013) 136– 142
Gupta, P.K., Varshney, R.K., 2000. The development and use of microsatellite mark-ers for genetic analysis and plant breeding with emphasis on bread wheat.Euphytica 113, 163–165.
Gupta, P., Idris, A., Mantri, S., Asif, M.H., Yadav, H.K., Roy, J.K., Tuli, R., Mohanty, C.S.,Sawant, S.V., 2012a. Discovery and use of single nucleotide polymorphic (SNP)markers in Jatropha curcas L. Mol. Breed. 30, 1325–1335.
Gupta, S., Kumari, K., Sahu, P.P., Vidapu, S., Prasad, M., 2012b. Sequence-based novelgenomic microsatellite markers for robust genotyping purposes in foxtail millet[Setaria italica (L.) P Beauv]. Plant Cell Rep. 31, 323–337.
Hamdan, Y.A.S., García-Moreno, M.J., Redondo-Nevado, J.R., Velasco, L., Pérez-Vich,B., 2011. Development and characterization of genomic microsatellite markersin safflower (Carthamus tinctorius L.). Plant Breed. 130, 237–241.
Heller, J., PhD dissertation 1996. Physic Nut – Jatropha curcas L. – Promotingthe Conservation and Use of Underutilized and Neglected Crops. Institute ofPlant Genetic and Crop Plant Research, Gatersleben/International Plant GeneticResource Institute, Germany/Rome, Italy.
Hossain, K.G., Kawai, H., Hayashi, M., Hoshi, M., Yamanaka, N., Harada, K., 2000.Characterization and identification of (CT)n microsatellites in soybean using
sheared genomic libraries. DNA Res. 7, 103–110.Jain, S.M., Brar, D.S., Ahloowalia, B.S., 2002. Molecular Techniques in Crop Improve-
ment. Kluwer Academic Publishers, The Netherlands.Kumar, S., Parthiban, K.T., Govinda Rao, M., 2009. Molecular characterization of
Jatropha genetic resources through Inter Simple Sequence Repeats (ISSR) forcomparative analysis of genetic diversity. Mol. Biol. Rep. 36, 1951–1956.
Liu, K., Muse, S.V., 2005. Power marker: integrated analysis environment for geneticmarker data. Bioinformatics 21, 2128–2129.
Makkar, H.P.S., Aderibigbe, A.O., Becker, K., 1998. Comparative evaluation ofnon-toxic and toxic varieties of Jatropha curcas for chemical composition,digestibility, protein degradability and toxic factors. Food Chem. 62, 207–215.
Moretzsohn, M.C., Leoi, L., Proite, K., Guimaraes, P.M., Leal-Bertioli, S.C., Gimenes,M.A., Martins, W.S., Valls, J.F., Grattapaglia, D., Bertioli, D.J., 2005. Amicrosatellite-based, gene-rich linkage map for the AA genome of Arachis(Fabaceae). Theor. Appl. Genet. 111, 1060–1071.
Paniego, N., Echaide, M., Munoz, M., Fernandez, L., Torales, S., Faccio, P., Fuxan, I.,Crrera, M., Zandomeni, R., Syarez, E.Y., Hopp, E., 2002. Microsatellite isolationand characterization in sunflower (Helianthus annuus L.). Genome 45, 34–43.
Phillips, R.L., Vasil, I.K., 2001. DNA-based markers in plants. In: Phillips, R.L., Vasil, I.K.(Eds.), DNA-based Markers in Plants. Kluwer Academic Publishers, Dordrecht,The Netherlands, p. 497.
Rafii, M.Y., Shabanimofrad, M., Edaroyati, M.W.P., Latif, M.A., 2012. Analysis of thegenetic diversity of physic nut, Jatropha curcas L. accessions using RAPD markers.Mol. Biol. Rep. 39, 6505–6511.
Ranade, S.A., Srivastava, A.P., Rana, T.S., Srivastava, J., Tuli, R., 2008. Easy assessmentof diversity in Jatropha curcas L. plants using two single-primer amplificationreaction (SPAR) methods. Biomass Bioenergy 32, 533–540.
Rao, G.R., Korwar, G.R., Shanker, A.K., Ramakrishna, Y.S., 2008. Genetic asso-ciations,variability and diversity in seed characters, growth, reproductivephenology and yield in Jatropha curcas (L.) accessions. Trees 22, 697–709.
Rohlf, F.J., 2000. NTSYS-pc Numerical Taxonomy and Multivariate Analysis System,Version 2.1. Exeter Publ, New York.
Sato, S., Hirakawa, H., Isobe, S., Fukai, E., Watanabe, A., Kato, M., Kawashima, K.,Minami, C., Muraki, A., Nakazaki, N., et al., 2011. Sequence analysis of the genomeof an oil-bearing tree, Jatropha curcas L. DNA Res. 18, 65–76.
Shen, J., Jia, X., Ni, H., Sun, P., Niu, S., Chen, X., 2010. AFLP analysis of genetic diversityof Jatropha curcas grown in Hainan, China. Trees 24, 455–462.
Sudheer, D.V.N.P., Sinha, R., Kothari, P., Reddy, M.P., 2009. Isolation of novelmicrosatellites from Jatropha curcas L. and their cross-species amplification. Mol.Ecol. Resour. 9, 431–433.
Sudheer, P.D.V.N., Rahman, H., Mastan, S.G., Reddy, M.P., 2010. Isolation of novelmicrosatellites using FIASCO by dual probe enrichment from Jatropha curcas L.and study on genetic equilibrium and diversity of Indian population revealed byisolated microsatellites. Mol. Biol. Rep. 37, 3785–3793.
Sun, F., Liu, P., Ye, J., Lo, L., Cao, S., Li, L., Yue, G., Wang, C., 2012. An approach forJatropha improvement using pleiotropc QTLs regulating plant growth and seedyield. Biotechnol. Biofuels 5, 12.
Sun, Q.B., Li, L., Li, Y., Wu, G.J., Ge, X.J., 2008. SSR and AFLP markers reveal lowgenetic diversity in the biofuel plant Jatropha curcas in China. Crop Sci. 48, 1865–1871.
Taramino, G., Tingey, S.V., 1996. Simple sequence repeats for germplasm analysisand mapping in maize. Genome 39, 277–287.
Tatikonda, L., Wani, S.P., Kannan, S., Beerelli, N., Sreedevi, T.K., Hoisington, D.A.,Devi, P., Varshney, R.K., 2009. AFLP-based molecular characterization of anelite germplasm collection of Jatropha curcas L., a biofuel plant. Plant Sci. 176,505–513.
Techen, N., Arias, R., Glynn, N.C., Pan, Z., Khan, I.A., Sceffler, B.E., 2010. Opti-mized construction of microsatellite-enriched libraries. Mol. Ecol. Resour. 10,508–515.
Wang, C.M., Liu, P., Yi, C., Gu, K., Sun, F., Li, L., Lo, L.C., Liu, X., Feng, F., Lin, G., Cao, S.,Hong, Y., Yin, Z., Yue, G.H., 2011. A first generation microsatellite and SNP basedlinkage map of Jatropha. PLoS ONE 6, e23632.
Yadav, H.K., Ranjan, A., Asif, M.H., Mantri, S., Sawant, S.V., Tuli, R., 2011. EST-derivedSSR markers in Jatropha curcas L.: development, characterization, polymor-phism, and transferability across the species/genera. Tree Genet. Genom. 7,207–219.

___________________________
Corresponding author: Hemant Kumar Yadav, CSIR-National Botanical Research Institute,
Lucknow-226001, India, Tel.: +91-522-2297982, Fax: +91-522-2205836, E-mail:
UDC 575 DOI: 10.2298/GENSR1303655M
Original scientific paper
GENETIC VARIABILITY AND DIVERGENCE ANALYSES IN Jatropha curcas
BASED ON FLORAL AND YIELD TRAITS
Ramanuj MAURYA1, Saurabh VERMA
1, Astha GUPTA
1, Bajrang SINGH
1
and Hemant KUMAR YADAV1,2
*
1CSIR-National Botanical Research Institute, Lucknow-226001, India.
2Academy of Scientific and Innovative Research (AcSIR), New Delhi, India
Maurya R., S. Verma, A. Gupta, B.Singh, and H. Kumar Yadav
(2013): Genetic variability and divergence analyses in Jatropha curcas based
on floral and yield traits -. Genetika, Vol 45, No. 3, 655-666.
Genetic variability of 80 accessions of Jatropha curcas showed that
oil content varied between 20.8-36.1% (X=26.2±0.38). Thirty seven accessions
showed seed weight/plant above average mean value (180.2g) and 26
accessions showed oil content above average mean (26.2%). The hierarchical
clustering grouped all the accessions into 4 clusters. Clustering showed that
majority of accessions i.e. 56 (70%) were genetically close to each other and
grouped in two clusters. The maximum intra cluster distance was recorded in
cluster IV (30.15). The inter cluster distance varied from 47.59 (between
cluster I and cluster II) to 211.27 (between cluster III and cluster I). The cluster
III showed maximum genetic distance with cluster I, followed by cluster IV
and cluster II suggesting comparatively wider genetic diversity among them.
The Principal Component Analysis (PCA) showed that first four principal
components (PCs) accounted for more than 93% of the total variation. The first
principal components accounted for 42.5% of the total variation mainly due to
seed length, seed width, seed weight/plant and number of seeds/plant which
had maximum and positive weight on this component. Oil content had negative
weight on PC1. Thus, PC1 related to the accessions with thick seeds, moderate
to high seed yielder with low oil content.
Key words: Divergence, Genetic variability, Genetic advance,
Heritability, Jatropha curcas
INTRODUCTION
Jatropha curcus, also known as physic nut or purging nut, is a perennial shrub
belonging to family Euphorbiaceae. It is a diploid (2n=22) with relatively smaller genome size of
656 GENETIKA, Vol. 45, No.3,655-666, 2013
416 Mb (CARVALHO et al., 2008) and contains about 175 species worldwide. It is native to
tropical America but widely distributed in other tropical and subtropical areas of the world,
especially in Africa, India, and Southeast Asia (OPENSHAW 2000, SUJATHA and PRABHAKARAN,
1997). The Portuguese settlers are believed to have introduced Jatropha to India during the
sixteenth century (GINWAL et al., 2005). Traditionally, the plant is used as fence, to control
erosion and reclaim land, and as animal feed and manufacturing of lubricants, soaps, candles,
purgative agents, astringents, and coloring dyes (OPENSHAW, 2000). Recently, it gains popularity
worldwide as an alternative and renewable source of biodiesel production. The plant can rapidly
grow in a wide range of agro-climatic conditions and is not grazed by animals (SUBRAMANIAN et
al., 2005). Its hardy nature and high oil content make it a promising oil crop for biodiesel
(HENNING, 1998). However, J. curcas is still an undomesticated plant and its response to yield
and oil content found to be erratic with different agro-climatic zones. Therefore, there is a
serious need to take initiative for its genetic improvement for adaptability, agronomically
desirable traits, yield and oil content. The assessment of the level and pattern of genetic
relationship among germplasm accessions is an important component of genetic improvement
program. The informations obtained could be utilized for i) analysis of genetic variability ii)
identification of diverse parental combinations to create genetic variability for further selection
(BARNETT and KIDWELL, 1998) and iii) introgression of desirable genes from diverse germplasm
into the available genetic base (THOMSON et al., 1998). Several types of data sets (morphological,
biochemical, molecular markers) and tools have been used for studying genetic variability and
relationship among accessions. Currently DNA based molecular markers are being widely used
for genetic analysis. In past several genetic diversity studies have also been reported in J. curcas
using different types of molecular markers like RAPD (GANESH et al., 2008), KUAMR et al.,
2009; SUBRAMANYAM et al., 2009), AFLP (QUINTERO et al., 2011; SUN et al., 2008), ISSR
(SENTHIL et al., 2009; TANYA et al., 2011) and SSR (WEN et al., 2010). However, the
morphological characterization is the first and important step in the description and classification
of germplasm. Few preliminary studies based on quantitative genetic variations were reported in
J. curcas. GINWAL et al. (2005) reported some preliminary quantitative genetic variations in seed
morphology, germination and seedling growth among ten accessions collected mainly from
Madhya Pradesh, India. KAUSHIK et al. (2007) evaluated 24 accessions for seed oil content
variations and divergence. Genetic association, variability and diversity in seed traits, growth,
reproductive and yield traits were reported by RAO et al. (2008) among 32 wild accessions of J.
curcas collected from Andhra Pradesh, India. Most of the morphometric trait based genetic
studies carried out earlier were restricted to smaller number of accessions collected from limited
areas. However, to explore and exploit the available genetic resources, an extensive survey,
collection and evaluation required to find out potential genetic material for genetic improvement
of J. curcas. Genetic studies based on the multivariate analysis is a powerful tool for determining
the degree of divergence between populations, the relative contribution of different components
to the total divergence and the nature of forces operating at different levels. Thus, the present
investigation was undertaken with 80 accessions of J. curcas collected from different states of
the India to evaluate genetic variability, assess genetic divergence and identify diverse
accessions/groups to facilitate the future breeding strategies and genetic improvement of J.
curcas.

R. MAURYA et al: VARIABILITY AND DIVERSITY IN Jatropha 657
MATERIALS AND METHODS
A total of eighty accessions of J. curcas representing different eco-geographical and
agro-climatic zone of India (Fig.1) were selected from germplasm bank maintained at Banthra
Research Center (BRC) of National Botanical Research Institute, Lucknow India. Fifteen
cuttings of each accession were raised in polybags filled with soil, cowdung manure and sand in
equal proportion during March 2008. The six rooted cuttings of each accession were then
transplanted in experimental plot in Randomized Block Design (RBD) with 3 replications and
two plants/replication during July 2008. The experimental plot is situated between 260
40’N
latitude and 800
45’ E longitude and at an altitude of 129 m above sea level. The distances
between rows and plants were kept 2 meter. The field was irrigated as and when required.
Pruning of plants was practiced 2 feet above the ground in the first week of March 2009 and
2010. Data on different morphometric traits were recorded during November 2010- January
2011. Following traits were considered for data recording: Female flower/plant: Number of
female flower counted during flowering period (November – January), male flower/plant:
Number of male flower counted per plant, male/female ratio: ratio between female and male
flower per plant, Number of fruits/plant: total number of fruits counted per plant at harvesting
time, Number of seeds/plant: Total number of seeds counted per plant, Fruit weight/plant: total
fruit weight measured in gram per plant, Seed weight/plant: total seed weight measured in gram
per plant, Seed length and width: twenty seeds per plant randomly selected and length and width
measured in middle with vernier caliper (mm), Oil content: twenty five to thirty seeds randomly
selected per plant and used to measure oil content in percent through Nuclear Magnetic
Resonance (NMR) spectrometer.
Figure1. Map of India showing collection site of Jatropha curcas from different states.

658 GENETIKA, Vol. 45, No.3,655-666, 2013
The mean values for each trait were used for statistical analysis and subjected to
analysis of variance and covariance using WINDOSTAT software (www.windostat.org).
Variance components were estimated from mean square of ANOVA (SINGH and CHAUDHARY,
1985). Heritability in broad sense (hB) was estimated on genotypic mean basis as described by
Allard (1999). Expected genetic advance (%) of mean was estimated according to JOHNSON et al.
(1955). Phenotypic correlation (rp) was calculated using analysis of variance and covariance
values as suggested by JOHNSON et al. (1955). For divergence studies the variability among
population was tested by Wilk’s lambda criterion for pooled effect of all the characters.
Hierarchical clustering was carried to find out the pattern of similarity/dissimilarity among
accessions using ward’s minimum variance method (WARD, 1963). The relationships among the
clusters were assessed by estimating the intercluster distances using Mahalanobis distance (D2)
statistics (RAO, 1952).
RESULTS AND DISCUSSION
The range and mean value of different traits along with various statistical parameters is
presented in Table 1. The number of female flowers/plant varied from 72.6 to 118.0 with an
average of 94.6±1.39 and the number of male flowers/plant varied from 16.27.2 to 2960.0 with
an average of 2240.8±42.92. Male/female flower ratio was found variable between 17.2 - 32.1
with an average of 24.0±0.37. The number of fruits/plant and number of seeds/plant varied
between 63.4 -112.9 and 169.6-297.0 with an average of 80.5±1.31 and 218.3±3.89 respectively.
The range of seed weight/plant (g), seed length (mm) and seed width (mm) were 102.7 - 273.8,
13.3 - 18.5 and 7.8 - 11.8 with an average of 180.2±4.20, 16.4±0.13 and 10.7±0.09 respectively.
The oil content varied between 20.8 - 36.1% with an arithmetic mean of 26.2±0.38. Out of 80
accessions, 37 accessions have seed weight/plant above average value (i.e.180.2g) and of which
only 4 accessions have seed weight/plant above 250g with maximum in accession NBJC1078
(273.08g). Likewise, 26 accessions have oil content above average value of 26.2% and only
three accessions namely NBJC1055, NBJC1051 and NBJC1048 having oil content above 35%.
So, majority of the accessions in the present investigation were found to be low oil yielder.
However, FOIDL et al. (1996) and BERCHMANS and HIRATA, (2008) reported oil content upto
40%. In order to assess the heritable portion of total variability, the phenotypic variance (δ2p)
was partitioned into genotypic (δ2g) and error variance (δ2
e). The values of error variance were
found to be higher than those of genotypic variance (δ2g) for number of female flowers/plant,
male/female ratio, number of fruits/plant, number of seeds/plant and seed weight/plant
suggesting much influence of environmental factors on these traits. The phenotypic coefficient of
variation (PCV) and genotypic coefficient of variation (GCV) varied from 7.51 to 25.48 and 7.05
to 17.87% respectively. Maximum PCV and GCV were noticed for seed weight/plant followed
by fruit weight/plant, number of male flower/plant, number of seeds/plant. The PCV was found
to higher than that of GCV for all the traits with remarkable differences in their values. The traits
seed length, seed width and oil content has very small differences in PCV and GCV values.
Similarly, KAUSHIK et al. (2007) and RAO et al. (2008) also noticed higher PCV over GCV with
small differences for seed length, seed width and oil content. The genetic improvement in the
traits with small differences in PCV and GCV values can easily be achieved by selection of
promising plant types and also through crossing the desirable accessions among themselves
followed by selection in segregating generations.

R. MAURYA et al: VARIABILITY AND DIVERSITY IN Jatropha 659
Table 1. Range, mean, estimates of variance components, broad sense heritability and genetic advance in Jatropha
curcas
The estimate of genetic variability alone is considered as not much helpful in
determining the heritable portion of variation unless until coupled with the estimate of
heritability. The estimate of heritability along with variability can provide more insight towards
the amount of genetic advance to be expected from the selection process. Thus, the knowledge
of heritability of a character become important as it indicates the possibility and extent to which
improvement is possible through selection. Broad sense heritability varied from 20% to 90% and
maximum was observed for oil content (90%) followed by seed length (88%) and seed width
(87%). The lowest heritability (20%) was noticed for male/female ratio and other traits have
moderate heritability ranging from 38% to 54%. The high heritability noticed for oil content,
seed length and seed width indicates that these characters are under genotypic control. However,
heritability estimates may differ widely in the same crop and same trait (RASMUSON, 2002)
because heritability always refers to a defined population and a specific experimental set up
(HOLLAND et al., 2002). Considering high heritability alone is not enough in making efficient
selection in advance generation unless accompanied by substantial amount of genetic advance
(GA), which provides the information about the degree of gain in a character obtained under a
particular selection pressure (JOHNSON et al., 1955). Expected genetic advance, as a function of
selection intensity, phenotypic variance and heritability, has an added advantage over heritability
as a guiding factor to breeders in a selection program. The genetic advance as percent of mean
varied from 8.45 for male/female ratio to 25.81 for seed weight/plant. The higher genetic
advance for seed weight/plant, oil content, and number of fruits/plant was might be due to
presence of variation in these traits. High heritability coupled with high GA and GCV for oil
content suggests that this trait was primarily controlled by additive gene action and any simple
selection model would be advantageous to obtain the desired genetic gain. Low heritability with
high GA for seed weight/plant, fruit weight/plant and number of seeds/plant and high heritability
with low GA for seed length and seed width indicates that these traits might be largely governed
by non–additive gene actions and hence much improvement cannot be achieved through
Min Max Mean ±SD F value σ2g σ
2p σ2e GCV PCV Hb GA GA%
Female
flower
/plant
72.6
118.0
94.6±1.39
2.82**
99.55
263.10
163.5
10.54
17.13
38.0
12.64
13.35
Male flower
/plant
1627.2
2960.0
2240.8±42.92
4.06**
109448.18
216787.51
107339.3
14.76
20.78
50.0
484.24
21.61
male/female
ratio
17.2
32.1
24±0.37
1.76**
4.79
23.69
18.89
9.12
20.27
20.0
2.03
8.45
No. of fruits
/plant
63.4
112.9
80.5±1.31
2.86**
88.95
232.08
143.13
11.72
18.93
38.0
12.03
14.95
No. of seeds
/plant
169.6
297.0
218.3±3.89
3.43**
850.42
1898.14
1047.72
13.35
19.94
45.0
40.21
18.40
Fruit weight
/plant
301.1
575.2
397±8.18
4.5**
4128.07
7665.63
3537.56
16.15
22.01
54.0
97.13
24.42
Seed weight
/plant (g)
102.7
273.8
180.2±4.20
3.90**
1040.43
2116.22
1075.79
17.87
25.48
49.0
46.59
25.81
Seed length
(mm)
13.3
18.5
16.4±0.13
23.32**
1.34
1.52
0.18
7.05
7.51
88.0
2.24
13.64
seed width
(mm)
7.8
11.8
10.7±0.09
20.69**
0.61
0.70
0.09
7.28
7.82
87.0
1.50
13.97
Oil content
(%)
20.8
36.1
26.2±0.38
27.10**
10.84
12.09
1.25
12.60
13.30
90.0
6.42
24.58

660 GENETIKA, Vol. 45, No.3,655-666, 2013
selection. Similar to the present findings, high heritability and low GA for seed length and seed
width was also reported by KAUSHIK et al. (2007) and RAO et al. (2008).
Table 2. Distribution of 80 accessions of Jatropha curcas in 4 clusters based on their 10 quantitative traits
Further, the potential accessions could be identified by analyzing genetic diversity in the
genetic resources collected/available, which will further facilitate various genetic improvement
programs. The simultaneous testing of significance based on Wilk’s lambda criterion for pooled
effect of all the characters showed significant differences among the population (χ2 = 790 df =
3079.06**). A hierarchical cluster analysis (Wards minimum variance) grouped all the 80
accessions into 4 clusters (Table 2, Fig. 2). The number of accessions per clusters varied from 6
(cluster III) to 29 (cluster II). The cluster II was largest with 29 accessions collected from 11
states India i.e. Andhra Pradesh (6 accessions), Rajasthan (5), Jharkhand (4), Uttar Pradesh (2),
Chhattisgarh (2), Bihar (2), Punjab (2), Gujarat (1), Haryana (1), Kerala (1) and Tamil Nadu (1).
The cluster I is second largest comprising 27 accessions including 5 accessions collected from
Uttar Pradesh, 4 from Gujarat, 3 from West Bengal, 2 each from Rajasthan, Tamil Nadu,
Himachal Pradesh, Bihar, Chhattisgarh, Haryana, and 1 each from Punjab, Madhya Pradesh,
Uttaranchal, Jharkhand and Kerala. The cluster III was the smallest with 6 accessions collected
from Uttaranchal (4), Jharkhand (1) and Rajasthan (1). The cluster IV had 18 accessions
collected from Chhattisgarh (4), Uttar Pradesh (4), Tamil Nadu (3), Himachal Pradesh (2),
Haryana (2), Orissa (1), Andhra Pradesh (1), and West Bengal (1). The clustering of accessions
based on multivariate analysis showed that majority of accessions i.e. 56 accessions (70%) were
genetically close to each other and grouped only into two clusters. The distribution of accessions
from same origin/geo-graphical region into different clusters or vice versa indicated that the
geographical origin is not related to genetic divergence.
Cluster Number of
accessions
Accessions name
Cluster I 27 NBJC1001, NBJC1034, NBJC1044, NBJC1005, NBJC1039, NBJC1054, NBJC1004,
NBJC1045,NBJC1060, NBJC1121, NBJC1007, NBJC1031,NBJC1137, NBJC1107,
NBJC1127,NBJC1023, NBJC1097, NBJC1008, NBJC1033,NBJC1129, NBJC1064,
NBJC1022, NBJC1058,NBJC1124,NBJC1078, NBJC1122, NBJC1130.
Cluster II 29 NBJC1006, NBJC1093, NBJC1083, NBJC1057, NBJC1133, NBJC1082, NBJC1087,
NBJC1135, NBJC1003, NBJC1035, NBJC1112, NBJC1036, NBJC1050, NBJC1020,
NBJC1021, NBJC1085, NBJC1080, NBJC1131, NBJC1063, NBJC1067, NBJC1065,
NBJC1073, NBJC1052, NBJC1071, NBJC1084, NBJC1101, NBJC1138,
NBJC1094,NBJC1072.
Cluster III 6 NBJC1009, NBJC1014, NBJC1013, NBJC1019, NBJC1017, NBJC1025.
Cluster IV 18 NBJC1048, NBJC1051, NBJC1055, NBJC1049, NBJC1081, NBJC1089, NBJC1092,
NBJC1079, NBJC1141, NBJC1053, NBJC1123, NBJC1069, NBJC1088, NBJC1075,
NBJC1076, NBJC1070, NBJC1090, NBJC1077.
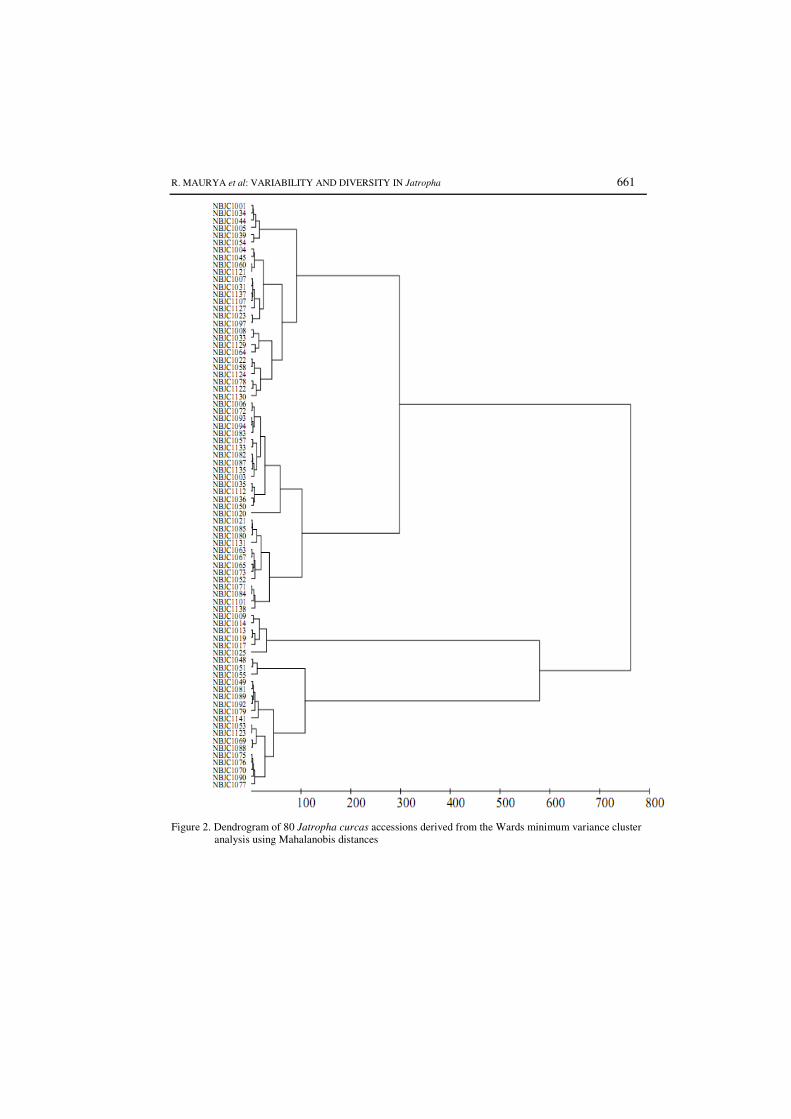
R. MAURYA et al: VARIABILITY AND DIVERSITY IN Jatropha 661
Figure 2. Dendrogram of 80 Jatropha curcas accessions derived from the Wards minimum variance cluster
analysis using Mahalanobis distances

662 GENETIKA, Vol. 45, No.3,655-666, 2013
Similar findings were also reported earlier by RAO et al. (2008) and SUDHEER, et al.
(2010) based on morphological traits and molecular marker studies respectively. The maximum
intra cluster distance was noticed in cluster IV (30.15) followed by cluster I (28.61) and cluster II
(25.89). The inter cluster distance varied from 47.59 (between cluster I and cluster II) to 211.27
(between cluster III and cluster I). Based on cluster distance, the cluster III showed maximum
genetic distance with cluster I, followed by cluster IV and cluster II suggesting comparatively
wider genetic diversity among them. The accessions from these clusters could be utilized in
hybridization program to get desirable transgressive segregants in their offspring, as there is a
higher probability that unrelated genotypes would contribute unique desirable alleles at different
loci. Considering the cluster means, the cluster I showed highest mean value for all the traits
except oil content. On contrary, the cluster III had lowest mean value for number of male
flower/plant, male/female ratio, fruit weight/plant, seed weight/plant, seed length and seed width.
The cluster I and cluster III seems to be unique with having highest and lowest cluster mean
value for most of the traits respectively and also had highest inter cluster distance among them.
The crossing among the accessions of these two clusters may yield hybrids with desirable traits.
Table 3. Intra- (diagonal bold) and inter-cluster Mahalanobis distances for 80 accessions in Jatropha
curcas Cluster I Cluster II Cluster III Cluster IV
Cluster I 28.61 47.59 211.27 91.62
Cluster II 25.89 129.47 66.51
Cluster III 24.77 153.24
Cluster IV 30.15
Table 4a. Cluster means and standard errors of the means of different traits in Jatropha curcas L.
Female
flower/plant
Male
flower/plant
male/female
ratio
No. of
fruits/plant
Fruit
weight/plant
(g)
Cluster I 103.12±2.18 2471.53±68.74 24.30±0.70 89.31±2.37 432.88±14.52
Cluster II 91.71±1.82 2200.53±67.26 24.06±0.65 77.77±1.75 390.95±14.18
Cluster III 91.44±4.54 2018.00±1114.06 22.29±1.07 75.50±3.55 347.50±11.85
Cluster IV 85.91±2.26 2033.94±66.70 24.04±0.68 73.20±1.42 372.94±12.19
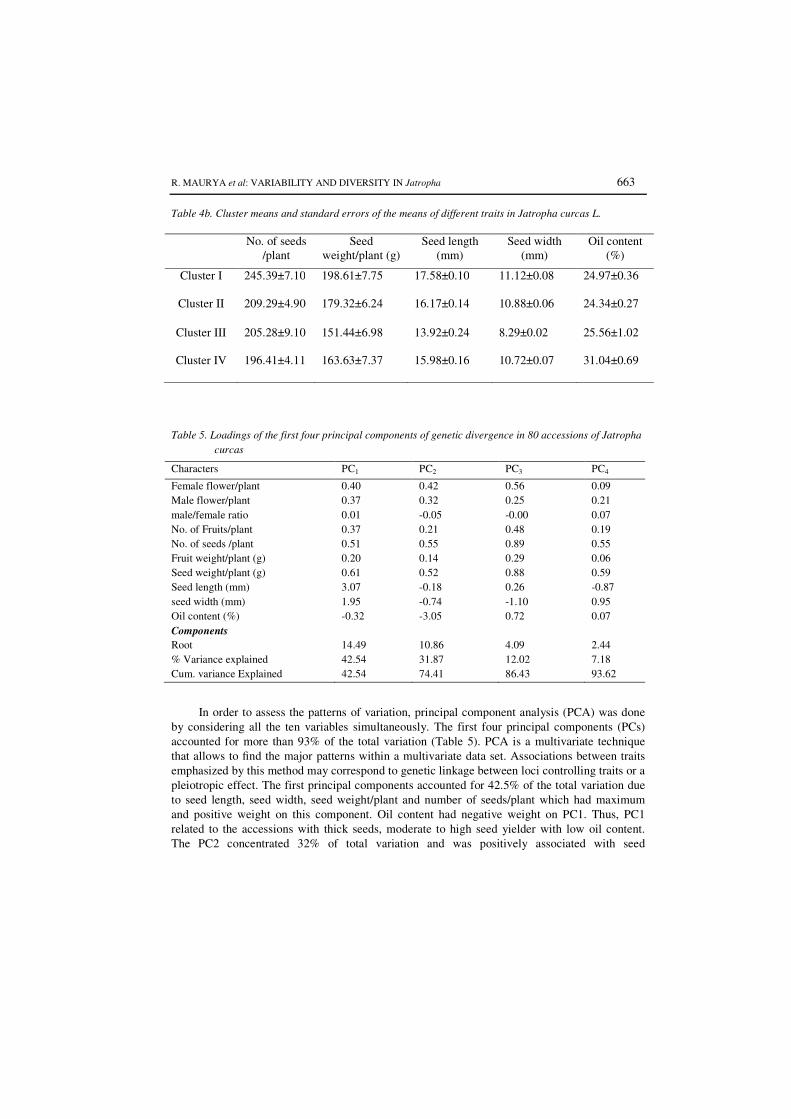
R. MAURYA et al: VARIABILITY AND DIVERSITY IN Jatropha 663
Table 4b. Cluster means and standard errors of the means of different traits in Jatropha curcas L.
Table 5. Loadings of the first four principal components of genetic divergence in 80 accessions of Jatropha
curcas
In order to assess the patterns of variation, principal component analysis (PCA) was done
by considering all the ten variables simultaneously. The first four principal components (PCs)
accounted for more than 93% of the total variation (Table 5). PCA is a multivariate technique
that allows to find the major patterns within a multivariate data set. Associations between traits
emphasized by this method may correspond to genetic linkage between loci controlling traits or a
pleiotropic effect. The first principal components accounted for 42.5% of the total variation due
to seed length, seed width, seed weight/plant and number of seeds/plant which had maximum
and positive weight on this component. Oil content had negative weight on PC1. Thus, PC1
related to the accessions with thick seeds, moderate to high seed yielder with low oil content.
The PC2 concentrated 32% of total variation and was positively associated with seed
No. of seeds
/plant
Seed
weight/plant (g)
Seed length
(mm)
Seed width
(mm)
Oil content
(%)
Cluster I 245.39±7.10 198.61±7.75 17.58±0.10 11.12±0.08 24.97±0.36
Cluster II 209.29±4.90 179.32±6.24 16.17±0.14 10.88±0.06 24.34±0.27
Cluster III 205.28±9.10 151.44±6.98 13.92±0.24 8.29±0.02 25.56±1.02
Cluster IV 196.41±4.11 163.63±7.37 15.98±0.16 10.72±0.07 31.04±0.69
Characters PC1 PC2 PC3 PC4
Female flower/plant 0.40 0.42 0.56 0.09
Male flower/plant 0.37 0.32 0.25 0.21
male/female ratio 0.01 -0.05 -0.00 0.07
No. of Fruits/plant 0.37 0.21 0.48 0.19
No. of seeds /plant 0.51 0.55 0.89 0.55
Fruit weight/plant (g) 0.20 0.14 0.29 0.06
Seed weight/plant (g) 0.61 0.52 0.88 0.59
Seed length (mm) 3.07 -0.18 0.26 -0.87
seed width (mm) 1.95 -0.74 -1.10 0.95
Oil content (%) -0.32 -3.05 0.72 0.07
Components
Root 14.49 10.86 4.09 2.44
% Variance explained 42.54 31.87 12.02 7.18
Cum. variance Explained 42.54 74.41 86.43 93.62
664 GENETIKA, Vol. 45, No.3,655-666, 2013
weight/plant, number of seeds/plant and female flower/plant. The oil content had highest
negative weight on PC2 also followed by seed length, seed width and male female ratio. The
third PC accounted for 12% variation was mainly due to seed weight/plant, number of
seeds/plant, number of fruits/plants and seed width had negative weight. The seed weight/plant
invariably had almost equal and positive weight on all four components.
CONCLUSION
In conclusion, the phenotypic evaluation and characterization of wide range of J. curcas
accessions showed that the most of the traits have low variability as revealed by various
statistical parameters. Though, some sort of variations was noticed and cluster analysis indicated
that the accessions from the clusters I and II have some potential towards the development of
high oil yielding accessions of J. curcas. A planned hybridization programme based on inter
crossing of promising accessions of different cluster may facilitate to accumulate favorable
genes in hybrids.
ACKNOWLEDGEMENT
The authors thank the Director, NBRI for providing the necessary facilities during the
investigation
Received August 03th, 2013
Accepted October 05th, 2013
REFERENCES
ALLARD, R.W. (1999): Principles of Plant Breeding, 2nd edn. New York, Wiley.
BARNETT, B.A. and K.K. KIDWELL (1998): AFLP-based genetic diversity assessment among wheat cultivars from the
Pacific Northwest. Crop Sci., 38,1261–1271.
BERCHMANS, H.J. and S. HIRATA (2008): Biodiesel production from crude Jatropha curcas L. seed oil with a high content
of free fatty acids. Bioresour. Tech., 99, 1716-1721.
CARVALHO, C.R., W.R. CLARINDO, M.M. PRAC, F.S. ARAUJO and N. CARELS (2008): Genome size, base composition and
karyotype of Jatropha curcas L.: an important biofuel plant. Plant Sci., 174, 613–617.
FOIDL, N., G. FOIDL, M. SANCHEZ, M. MITELBACH and S. HECKEL (1996): Jatropha curcas L. as a source for the production
of biofuel in Nicaragua. Bioresour.Tech., 58,77-82.
GANESH, R.S., K.T. PARTHIBAN, R. SENTHIL KUMAR, V. THIRUVENGADAM and V.M. PARAMATHMA (2008): Genetic
diversity among Jatropha species as revealed by RAPD markers. Genetic Resour. Crop Evol., 55,803–809.
GINWAL, H.S., S.S. PHARTYAL, P.S. RAWAT and R.L. SRIVASTAVA (2005): Seed source variation in morphology,
germination and seedling growth of Jatropha curcas L. in central India. Silvae Genetica, 54,76–80.
HENNING, R (1998): Use of Jatropha curcas – household perspective and its contribution to rural employment creation.
In: Proceedings of the regional workshop on the ‘‘potential of Jatropha curcas in rural development and
environmental protection’’ May 13–15, Harare, Zimbabwe
HOLLAND, J.B., W.E. NYQUIST and C.T. CERVANTES-MARTINEZ (2002): Estimating and interpreting heritability for
plant breeding: An update. Plant Breed. Review, 22, 9-112.
KAUSHIK, N., K. KUMAR, S. KUMAR, N. KAUSHIK and S. ROY (2007) Genetic variability and divergence studies in seed
traits and oil content of Jatropha (Jatropha curcas L.) accessions. Biomass Bioenergy, 31,497–502.
KUMAR, R.V., Y.K. TRIPATHI, S. SHUKLA, S.P. AHLAWAT and V.K. GUPTA (2009): Genetic diversity and relationships
among germplasm of Jatropha curcas L. revealed by RAPD. Trees, 23,1075-1079.
R. MAURYA et al: VARIABILITY AND DIVERSITY IN Jatropha 665
OPENSHAW, K (2000): A review of Jatropha curcas: an oil plant of unfulfilled promise. Biomass Bioenergy, 19,1–15.
QUINTERO, V.P., J.L.A. LOPEZ, A.Z. COLMENERO, N.M. GARCIA, C.A.N. COLIN, J.L.S. BONILLA, M.R.A. RANGEL, H.R.G.
LANGARICA and D.J.M. BUSTAMANTE (2011): Molecular characterization of Jatropha curcas L. genetic resources
from Chiapas, Mexico through AFLP markers. Biomass Bioenergy, 35, 1897-1905.
RAO, G.R., G.R. KORWAR, A.K. SHANKER and Y.S. RAMAKRISHNA (2008): Genetic associations,variability and diversity in
seed characters, growth, reproductive phenology and yield in Jatropha curcas (L.) accessions. Trees, 22, 697–
709.
RASMUSON, M. (2002) The genotype-phenotype link. Heriditas, 136, 1-6.
SENTHIL KUMAR, R., K.T. PARTHIBAN and M. GOVINDA RAO (2009): Molecular characterization of Jatropha genetic
resources through inter-simple sequence repeat (ISSR) markers. Mol. Biol. Rep. 36, 1951-1956.
SUBRAMANIAN, K.A., S.K. SINGAL, M. SAXENA and S. SINGHAL (2005): Utilization of liquid biofuels in automotive diesel
engines: an Indian perspective. Biomass Bioenergy, 29,65–72.
SUBRAMANYAM, K., D. MURALIDHARARAO and N. DEVANNA (2009): Genetic diversity assessment of wild and cultivated
varieties of Jatropha curcas (L.) in India by RAPD analysis. African J. Biotech. 8,1900-1910.
SUDHEER. D.V.N.P., S.G. MASTAN, H. RAHMAN and M.P. REDDY (2010): Molecular characterization and genetic diversity
analysis of Jatropha curcas L. in India using RAPD and AFLP analysis. Mol.Biol. Rep. 37, 2249–57.
SUJATHA, M. and A.J. PRABAKARAN (1997): Characterization and utilization of Indian Jatropha curcas. Indian J. Plant
Genet. Resour., 10,123–28.
SUN, Q.B., L.F. LI, Y. LI, G.J. WU, and X.J. GE (2008): SSR and AFLP markers reveal low genetic diversity in the biofuel
plant Jatropha curcas in China. Crop Sci.,48,1865-71.
TANYA, P., P. TAEPRAYOON, Y. HADKAM and P. SRINIVES (2011): Genetic diversity among Jatropha and Jatropha-related
species based on ISSR markers. Plant Mol. Biol. Repor. 29,252-264.
THOMPSON, J.A., R.L. NELSON and L.O. VODKIN (1998): Identification of diverse soybean germplasm using RAPD
markers. Crop Sci., 38,1348–1355.
WEN, M., H. WANG, Z. XIA, M. ZOU, C. LU and W. WANG (2010): Development of EST-SSR and genomic-SSR markers to
assess genetic diversity in Jatropha Curcas L. BMC Res. Notes, 3, 42.
666 GENETIKA, Vol. 45, No.3,655-666, 2013
ANALIZA GENETIČKE VARIJABILNOSTI I DIVERGNTNOSTI Jatropha curcas
NA OSNOVU OSOBINA CVETA I PRINOSA
Ramanuj MAURYA
1, Saurabh VERMA
1, Astha GUPTA
1, Bajrang SINGH
1
i Hemant Kumar YADAV1,2
*
1CSIR-Nacionalni botanički istraživački Institute, Lucknow-226001, India.
2 Akademija naučnih i inovativnih istraživanja (AcSIR), New Delhi, India
Izvod Utvrđena je genetička varijabilnost sadržaja ulja u 80 genotipova Jatropha curcas u rasponu u
rasponu od 20.8-36.1% (X=26.2±0.38) a prosečan sadržaj je 26.2%. Hijerarhijskom analizom
grupisanja ispitivani genotipovi su se grupisali u četiri grupe (klastera). Utvrđenaa je različita
distanca unutar i između klastera. Analiza osnovnih komponenata variranja (PCA) je pokazala da
prve četiri komponente (PCs) učestvuju sa više od 93 % ukupne varijabilnosti.
Primljeno 03. VIII.2013.
Odobreno 05. X. 2013.