determination of toxic elements concentration and ... · determination of toxic elements...
TRANSCRIPT
JKAU: Eng. Sci., Vol. 22 No. 2, pp: 153-170 (2011 A.D./1432 A.H.)
DOI: 10.4197 / Eng. 22-2.8
153
Determination of Toxic Elements Concentration and
Radioactivity Levels in Fruit Juice in Jeddah,
Saudi Arabia
M.A. Enani and S.M. Farid
Department of Nuclear Engineering, King Abdulaziz University, P. O.
Box 80204, Jeddah-21589, Saudi Arabia
Abstract. Fruit juices have become a significant component of the
diet of many households in Saudi Arabia. Essential minerals and trace
minerals present in fruit juices play an important role in human
growth and well being. A number of other chemical elements occur in
fruit juices, e.g., aluminum, cadmium, lead, tin, mercury and many of
them are toxic. In this study, three types of fruit juice (orange, apple,
mango) of 15 different brands available in the market in and around
Jeddah were analyzed for their contents of the toxic elements,
aluminum (Al), lead (Pb) and cadmium (Cd) using a Graphite Furnace
Atomic Absorption Spectrometer. The mean (±SD) elemental
concentration values in ppb of Al, Pb and Cd in apple juice are:
(144.00±12.51); (2.64±0.97) and (1.07±0.44) respectively. The mean
(±SD) concentration values in ppb of Al, Pb and Cd in orange juice
are: (122.20±11.36); (2.00±0.93) and (1.13±0.48) respectively.
Finally, the mean (±SD) concentration values in ppb of Al, Pb and Cd
in mango juice are: (115.28±10.84); (2.50±0.95) and (1.57±0.60)
respectively. These values are compared with tolerable daily intake
values and also with the corresponding values of different countries
available in the literature.
Knowledge of radioactivity levels in human diet is of
particular concern for the estimation of possible radiological hazards
to human health. A total of 86 fruit juice samples were analyzed for
radioactivity measurements. The mean radioactivity concentration
values in (Bq/l) in apple, orange and mango juice are : (17.66±2.95),
(19.85±3.15), (11.93±3.04) respectively. The reported values of
activity concentrations of different countries compare reasonably well
with the corresponding values obtained in the present study. The
M.A. Enani and S.M. Farid 154
levels of trace elements and radioactivity are acceptably low and pose
no threat to the health of the population. The sources of these
contaminants are unclear and merit further investigation.
Keywords: Atomic absorption spectrometer, fruit juice, toxic
elements, aluminum, lead, cadmium.
1. Introduction
Many current human health problems relate to diets. Trace heavy metals
are significant in nutrition, either for their essential nature or their
toxicity. The minerals that are considered essential in the human diet are
sodium, potassium, magnesium, iron, copper, zinc, manganese,
chromium, cobalt, molybdenum, nickel, silicon and boron. A number of
other chemical elements occur in food, e.g., aluminum, strontium, lead,
tin, mercury, cadmium and many of them are toxic. Toxic metals are
widely found in our environment. Humans are exposed to these metals
from numerous sources, including contaminated air, water, soil and food.
The compositions of various metals in different food types of various
countries have been the subject of many studies[1-3]
.
The future of any nation depends on the health, prosperity and
progress of the forthcoming generation. In the present era of
industrialization and development, one concern should be the health of
future generation. Children are the most vulnerable age group to any kind
of contamination in the food chain. Arsenic (As), cadmium (Cd),
mercury (Hg), aluminum (Al) and lead (Pb) are widely dispersed in the
environment. These elements have no beneficial effects in humans, and
there is no known homeostasis mechanism for them[1]
. Although toxicity
and the resulting threat to human health of any contaminant are, of
course, a function of concentration, it is well-known that chronic
exposure to As, Cd, Hg, and Pb at relatively low levels can cause adverse
effects. Although some individuals are primarily exposed to these
contaminants in the workplace, for most people the main route of
exposure to these toxic elements is through the diet [1]
.Consequently,
information about dietary intake is very important to assess risks to
human health. To evaluate the health risks to consumers, it is necessary
to determine the specific dietary intake of each pollutant for comparison
with toxicologically acceptable levels[1,2]
.
Cadmium toxicity came in the headlines after “Itai-Itai” disease
was found to be caused by high intakes of cadmium in Japan [3]
. After
Determination of Toxic Elements Concentration… 155
the incident, there has been a growing interest in assessing the levels of
toxic heavy metals such as cadmium (Cd), lead (Pb), mercury (Hg), and
arsenic (As), in foods. When Cd is ingested in excess amounts, it induces
toxicity symptoms like gastrointestinal pains, nausea, respiratory distress,
diarrhea, impaired reproductivity, kidney damage and hypertension[4-6]
.
Cadmium in foods is mostly derived from various sources of
environmental contamination and naturally occurring elevated levels of
the metal in local soils[7,8]
.
Today almost everyone is exposed to environmental lead (Pb) [5]
.
Exposure to Pb and Pb chemicals can occur through inhalation, ingestion
or occasionally dermal contact. Lead exposure in the general population
(including children) occurs primarily through ingestion, although
inhalation also contributes to lead body burden and may be the major
contributor for workers in lead-related occupations[9]
. Ingested lead
accumulates in the different organs of the body. The adverse effects
associated with lead are under-development of central nervous system in
the fetus and newborn babies. It is especially dangerous because it can
damage the brain and peripheral nerves. Lead affects everyone, but
children are at high risk as they are still growing. This may disrupt the
function of mitochondria in the developing brain. It is important for
energy production within a neuron, and a change in their function may
damage the cell. Lead may also affect brain function by interfering with
neurotransmitter release and synapse formation[10]
. Exposure to lead has
been associated with reduced IQ, learning disabilities, slow growth,
hyperactive, antisocial behavior and impaired hearing. Lead is known to
damage the kidney, liver and reproductive system, basic cellular
processes and brain function[11]
.
Aluminum (Al) is widespread throughout nature, air, water, plants
and consequently in all food chain. During recent years, interest
concerning Al has considerably increased because of its potential toxic
effects [12]
. The possible connection between elevated tissue Al content
and problems such as osteomalacia and neurodegenerative disorders has
awakened interest in Al intake via diet, decreased renal function
increases human risk of Al-induced accumulation and toxicity. An
abundance of research has continued to link Al with Alzheimer’s
disease[12-15]
.
M.A. Enani and S.M. Farid 156
Natural radioactivity is present everywhere (and has been since the
formation of the earth). In fact, radioactivity is all around us – every
single one of us is being bombarded with naturally occurring radiation,
some of it in the ground, some of it from the outer space, and some of it
even in our bodies[16]
.
Foodstuffs are known to contain natural and man-made
radionuclides which after ingestion, contribute to an effective internal
dose. The naturally occurring radionuclides especially 40
K and the
radionuclides of 238
U and 232
Th series are the major source of natural
radiation exposure to man. It has been estimated that at least one-eighth
of the mean annual effective dose due to natural sources is caused by the
consumption of foodstuffs[17-19]
.
Man-made radionuclides, produced by human activities also
contribute to the environmental radioactivity, one of these important
radionuclides of environmental concern, is 137
Cs[20,21]
.
The worldwide average background dose for a human being is
about 2.4 millisievert (mSv)per year. This exposure is mostly from
cosmic radiation and natural radionuclide in the environment. This is far
greater than human-caused background radiation exposure, which in the
year 2000 amounted to an average of about 5 µSv per year from
historical nuclear weapons testing, nuclear power accidents and nuclear
industry operations combined, and is greater than the average exposure
from medical tests, which ranges from 0.04 to 1 mSv per year. The level
of natural background radiation varies depending on location, and in
some areas the level is significantly higher than average [22]
.
For contamination assessment of the foodstuff consumed by the
population, it is very important to know the baseline value, or the level of
radiation dose of both natural and synthetic radionuclides received by
them[19-21]
.
The present study was conducted to determine the contents of toxic
elements, namely Al, Cd and Pb, and radioactivity concentrations in fruit
juices of three different types (apple, orange and mango) available
commercially in and around Jeddah city. This work is a part of our
comprehensive program undertaken to determine toxic elements
concentration and radioactivity levels in foodstuffs in Saudi Arabia. The
Determination of Toxic Elements Concentration… 157
results obtained are compared with the corresponding values of different
countries available in the literature.
2. Materials and Methods
2.1 Collection of Fruit Juice Samples
For the present study, commercially available fruit juice samples of
three different types (apple, orange and mango) of 15 different brands
were bought from different supermarkets in Jeddah City; the most
frequently consumed brands were selected. A total of 129 juice samples
were analyzed in the present study for the determination of toxic
elements in fruit juice. Out of 129 samples, 42 were apple juice samples,
45 were orange juice samples and 42 were mango juice samples. A total
of 86 samples were analyzed for radioactive measurements, out of which
28 were apple juice, 30 were orange juice and 28 were mango juice.
2.2 Reagents and Glass ware
Atomic Absorption Spectroscopic Standard solutions for Al, Pb
and Cd were purchased from Fisher Scientific Company, USA. Working
standard solutions were prepared by diluting the stock solution. All
solutions were prepared with double - distilled deionized water obtained
by filtering distilled water through a Milli- Q purifier system (Millipore,
Direct-Q 5, France) immediately before use. Samples were mineralized
with 68% nitric acid (HNO3) (Merck Suprapure) and vanadium pentoxide
(V2O5) (Merck, analytic grade). All glass ware (conical flask, volumetric
flask, watch glass, pipette, measuring cylinder, etc.) were of borocylicate
(England). All glass ware, before and after use, were washed with double
- distilled water, then soaked in nitric acid solution at 30% (v/v) during
24 h, rinsed several times in double - distilled de-ionized water and dried
in air. Items were kept in a clean place to avoid contamination.
2.3 Sample Digestion and Preparation of Analyte Solution for AAS
Prior to quantitation of analyte by Atomic Absorption Spectrometry
it is usually necessary to destroy the organic matrix and bring the element
into clear solution. For this reason the juice sample was first digested
with chemicals where the organic matrix of juice was destroyed and left
the element into a clear solution. “Wet Digestion” method[9,10,12,14,15]
has
been used in the present study. All homogenized samples ( 5 ml ) were
M.A. Enani and S.M. Farid 158
treated with 1 ml of HNO3 and a few micrograms of V2O5 in a multiplace
mineralization block. Digestion was completed in 90 minutes at 1200
C.
When cool, the digest was diluted to a 10 ml volume with double -
distilled de-ionized water.
2.4 Apparatus and Calibration
We used the VARIAN Graphite Furnace Atomic Absorption
Spectrometer (GFAAS), Model Spectra AA 30P, equipped with a
deuterium background corrector. The description of the machine and the
method to calibrate the GFAAS for determining the elemental
concentration were reported in our earlier paper[23]
. The sensitivity of the
GFAAS machine was also tested & reported earlier [23]
.
2.5 Measurement of Elemental Concentration in Fruit Juice Samples
Amount of 10 µl aliquot of each juice sample, obtained after wet
digestion was injected into the graphite tube of the AAS with the help of an
auto-sampler, and the elemental concentration was read from the output of the
printer connected to the computer associated with the GFAAS machine. Each
sample was repeated several times for each element and the average was
recorded. The concentration of Al, Pb and Cd were determined for each sample
of fruit juice.
2.6 Quality Control
The reliability of the method for estimation of Al, Pd and Cd
concentration in juice samples by AAS technique has been checked by
analyzing standard reference milk samples (A-11) obtained from
International Atomic Energy Agency (IAEA). Appropriate quality
assurance procedures and precautions were carried out to ensure
reliability of the results and were reported earlier[23]
. All samples were
carefully handled to avoid contamination. The recovery test of the total
analytical procedure was also carried out for some of the metals in
selected samples by spiking analyzed samples with aliquots of metal
standards and then reanalyzing the samples[12,14,15]
. Acceptable recoveries
of 91 and 93% were obtained for lead and cadmium respectively.
2.7 Measurement of Radioactivity in Fruit Juice Samples
The majority of radioactive isotopes encountered in foodstuffs emit
gamma-radiation. The energies of the gamma-rays are always
characteristic of the radioisotope concerned. All 86 juice samples were
Determination of Toxic Elements Concentration… 159
measured by a gamma spectroscopy system, manufactured by Canberra
(USA) using a High Purity Germanium (HPGe) detector with 40%
relative efficiency. The detector was shielded by 10 cm lead on all sides,
with cadmium-copper in the inner sides. The system was equipped with
software for data acquisition and analysis. Spectrum analysis was
performed by the spectrum – AT iV.4.3 software. The counting time was
250,000 seconds and a background spectrum was also collected for the
same period of time and subtracted from sample spectra.
The detector was calibrated[16-21,24]
using a standard radioactive
source, 152
Eu (t1/2 =13.3 years) having activity 2371.7 Bq/ml mixed with
400 ml of juice sample in Marinelli beaker. The different gamma-ray
peaks were recorded for 250,000 s. The efficiency for each peak was
determined from the relation[16-21,24]
:
Efficiency = Full energy peak counts / Activity (Bq) × time × yield (1)
Energy vs. efficiency curve was drawn. The equation for the best fit of
the curve was determined and it was fed into a computer.
The equation for the curve can be given by
y = - 0.0395 x3 + 0.1382 x
2 - 0.167 x + 0.0834
R2 = 0.9967
The efficiency at any energy could be determined by this equation.
The beakers were completely filled, weighed, sealed, and aged 21
days before counting with gamma spectrometry, in order to ensure that
radioactive equilibrium was reached between radium and its short-lived
daughter products[16-18,24]
. The counting time for the samples and
background was 250,000 s. All measurements were made with the
samples in contact with the detector housing. The total count was
recorded for different isotopes. The same procedure was followed for
apple, orange and mango juice samples of different brands. The activity
of radioisotope (disintegration per sec., Bq) for the sample was calculated
from the relation[16-21,24]
:
yieldefficiencytime
countphotopeakenergyfullBqActivity
)( (2)
M.A. Enani and S.M. Farid 160
3. Results and Discussions
The results of our measurements of the elemental concentrations in
standard reference milk sample (A-11) obtained from IAEA were
reported earlier [23]
. The result agreed within 7% of the certified values.
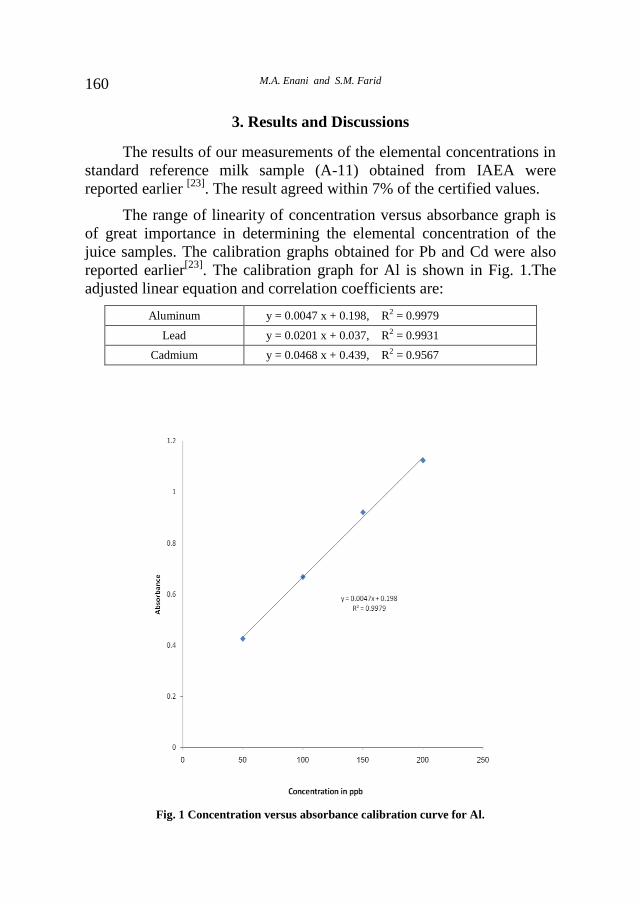
The range of linearity of concentration versus absorbance graph is
of great importance in determining the elemental concentration of the
juice samples. The calibration graphs obtained for Pb and Cd were also
reported earlier[23]
. The calibration graph for Al is shown in Fig. 1.The
adjusted linear equation and correlation coefficients are:
Aluminum y = 0.0047 x + 0.198, R2 = 0.9979
Lead y = 0.0201 x + 0.037, R2 = 0.9931
Cadmium y = 0.0468 x + 0.439, R2 = 0.9567
Fig. 1 Concentration versus absorbance calibration curve for Al.
Determination of Toxic Elements Concentration… 161
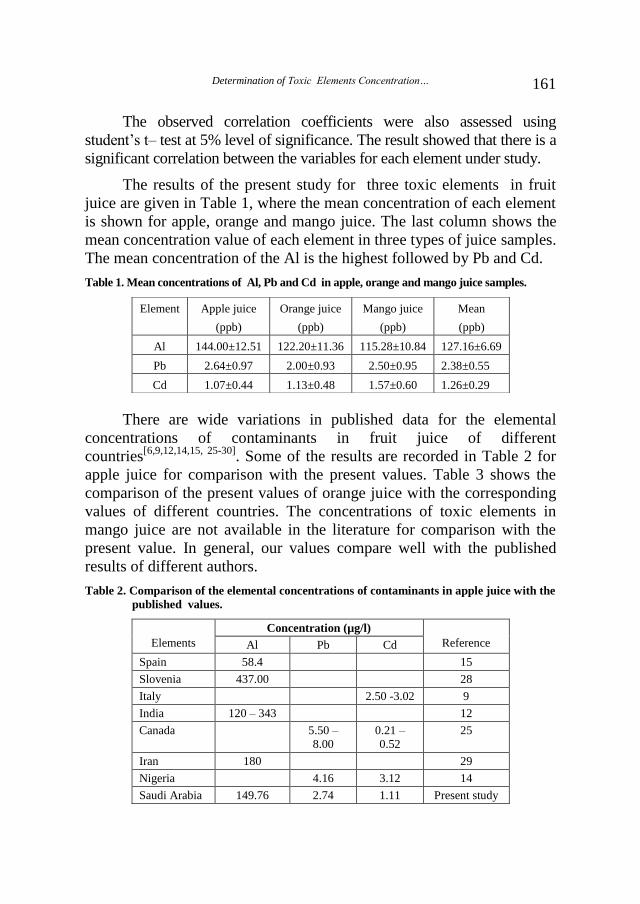
The observed correlation coefficients were also assessed using
student’s t– test at 5% level of significance. The result showed that there is a
significant correlation between the variables for each element under study.
The results of the present study for three toxic elements in fruit
juice are given in Table 1, where the mean concentration of each element
is shown for apple, orange and mango juice. The last column shows the
mean concentration value of each element in three types of juice samples.
The mean concentration of the Al is the highest followed by Pb and Cd.
Table 1. Mean concentrations of Al, Pb and Cd in apple, orange and mango juice samples.
There are wide variations in published data for the elemental
concentrations of contaminants in fruit juice of different
countries[6,9,12,14,15, 25-30]
. Some of the results are recorded in Table 2 for
apple juice for comparison with the present values. Table 3 shows the
comparison of the present values of orange juice with the corresponding
values of different countries. The concentrations of toxic elements in
mango juice are not available in the literature for comparison with the
present value. In general, our values compare well with the published
results of different authors.
Table 2. Comparison of the elemental concentrations of contaminants in apple juice with the
published values.
Elements
Concentration (µg/l)
Reference Al Pb Cd
Spain 58.4 15
Slovenia 437.00 28
Italy 2.50 -3.02 9
India 120 – 343 12
Canada 5.50 –
8.00
0.21 –
0.52
25
Iran 180 29
Nigeria 4.16 3.12 14
Saudi Arabia 149.76 2.74 1.11 Present study
Element Apple juice
(ppb)
Orange juice
(ppb)
Mango juice
(ppb)
Mean
(ppb)
Al 144.00±12.51 122.20±11.36 115.28±10.84 127.16±6.69
Pb 2.64±0.97 2.00±0.93 2.50±0.95 2.38±0.55
Cd 1.07±0.44 1.13±0.48 1.57±0.60 1.26±0.29
M.A. Enani and S.M. Farid 162
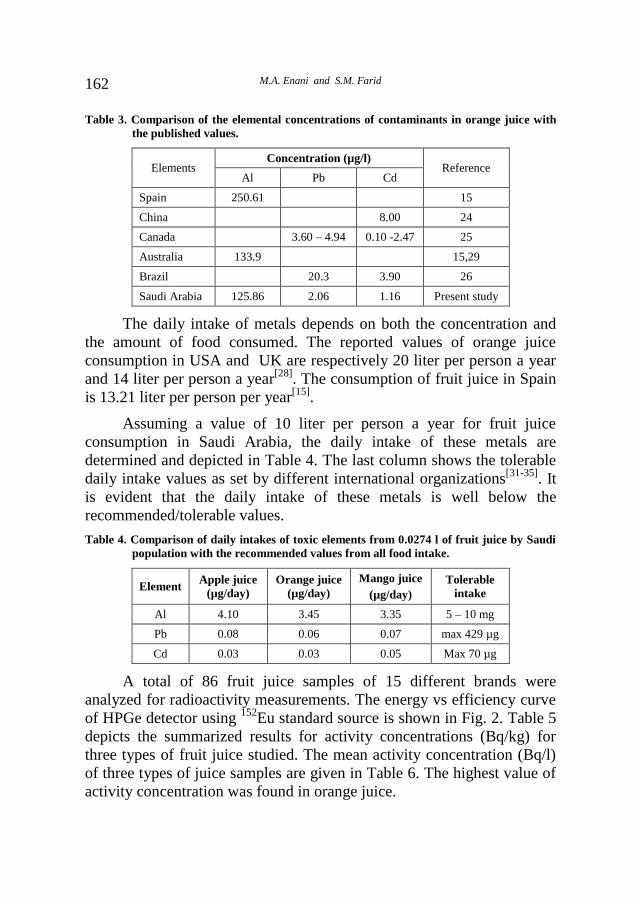
Table 3. Comparison of the elemental concentrations of contaminants in orange juice with
the published values.
Elements Concentration (µg/l)
Reference Al Pb Cd
Spain 250.61 15
China 8.00 24
Canada 3.60 – 4.94 0.10 -2.47 25
Australia 133.9 15,29
Brazil 20.3 3.90 26
Saudi Arabia 125.86 2.06 1.16 Present study
The daily intake of metals depends on both the concentration and
the amount of food consumed. The reported values of orange juice
consumption in USA and UK are respectively 20 liter per person a year
and 14 liter per person a year[28]
. The consumption of fruit juice in Spain
is 13.21 liter per person per year[15]
.
Assuming a value of 10 liter per person a year for fruit juice
consumption in Saudi Arabia, the daily intake of these metals are
determined and depicted in Table 4. The last column shows the tolerable
daily intake values as set by different international organizations[31-35]
. It
is evident that the daily intake of these metals is well below the
recommended/tolerable values.
Table 4. Comparison of daily intakes of toxic elements from 0.0274 l of fruit juice by Saudi
population with the recommended values from all food intake.
Element Apple juice
(µg/day)
Orange juice
(µg/day)
Mango juice
(µg/day)
Tolerable
intake
Al 4.10 3.45 3.35 5 – 10 mg
Pb 0.08 0.06 0.07 max 429 µg
Cd 0.03 0.03 0.05 Max 70 µg
A total of 86 fruit juice samples of 15 different brands were
analyzed for radioactivity measurements. The energy vs efficiency curve
of HPGe detector using 152
Eu standard source is shown in Fig. 2. Table 5
depicts the summarized results for activity concentrations (Bq/kg) for
three types of fruit juice studied. The mean activity concentration (Bq/l)
of three types of juice samples are given in Table 6. The highest value of
activity concentration was found in orange juice.

Determination of Toxic Elements Concentration… 163
Table 5. Summary of the results for radioactivity concentrations in different fruit juice
samples.
Brand Name
Radioactivity (Bq/kg) for different type of fruit juices
Apple Juice Mango Juice Orange Juice
Afandi 20.2 12.4 27.8
Al-Marai 21.0 8.8 14.5
Al-Rabie 16.6 10.3 16.9
Al-Taif 15.9 15.1 18.5
Caesar 19.0 9.6 20.3
Ceres (South Africa) 13.8 16.3 18.0
Fawakeh 9.5 8.4 19.1
Florida - - 16.4
Karim 17.8 12.4 19.2
KDD (Kuwait) 18.6 10.5 17.7
Nada 15.1 7.7 20.6
Nadec 18.4 7.6 18.9
Najdiya 16.3 9.1 20.0
Original 19.0 14.6 23.7
Tropicana 16.3 14.7 17.5
Fig. 2. Efficiency calibration curve of HPGe detector using 152Eu standard source.

M.A. Enani and S.M. Farid 164
Table 6. The mean radioactivity concentrations of three types of fruit juice.
Fruit
Juice
No. of
Samples
Mean
Radioactivity
(Bq/l)
Standard
deviation
Median
(Bq/l)
Range (Bq/l)
Min – Max
Apple
Juice 28 17.66 2.95 18.51 9.88 – 21.84
Orange
Juice 30 19.85 3.15 19.47 14.93 – 28.63
Mango
Juice 28 11.93 3.04 11.13 8.06 – 17.28
All samples showed predominantly 40
K, a naturally occurring
radionuclide whose presence in food is normal. No samples has shown
the presence of 137
Cs which is also the case as reported by different
authors[16,19,36]
. This radionuclide is found in soil and vegetation which is
usually from radioactive fall out due to nuclear accidents or weapons test.
The presence of other radionuclides like Ac-228, Bi-212, Bi-214, Pb-212,
Pb-214 and Tl-208 were minimal or zero. Their concentration values
range from 0 Bq/l in most of the samples to 5.51 Bq/l in one apple juice
sample. These radionuclides are all daughters of 238
U and 232
Th.
The radioactivity concentrations in fruit juices obtained in the
present study are 8.06 – 28.63 Bq/l. For comparative purposes, the
activity concentrations in UK[ 33]
for beverages including fruit juice and
fruit drink were found to be 3.95 – 92.72 Bq/l while the activity
concentrations obtained by Yu and Mao[ 36]
in Hong Kong for water-
based fruit drinks were 0.6 – 61 Bq / l.
The average dose from all sources of natural radioactivity in the
UK ranges from 2.2 to 7.8 mSv/yr, depending on location, of which
about 0.3 mSv comes from natural radioactivity in food [37]
. The total
daily intake of the naturally occurring radioisotopes from typical Korean
foods was found to be 39.46 Bq/day. The total annual internal dose
resulting from ingestion of radioisotopes in Korean food was calculated
to be 109.83 µSv/yr [38]
. The committed effective dose received by
general public living in high-background radiation area of southwest
India due to the consumption of foods of different kinds was found to be
852.45 µSv/yr. The daily radionuclide intake by an adult in that area
through ingestion of of foods was found to be 127.71 Bq/day and daily
dose was calculated to be 2.33 µSv/day [39 ]
.
The total daily intake of the naturally occurring radioisotopes
determined in this study from fruit juice is 5.82x10⁻³
µSv/d. The total
Determination of Toxic Elements Concentration… 165
annual internal dose resulting from ingestion of radioisotopes in fruit
juice is 2.12 µSv/yr, and the radioisotope with the highest daily intake
is 40
K .
An important limitation of this study is our inability in the
speciation of these metals and inaccessibility of the factories to
investigate the possible sources of these contaminants. However the
present study provides important data on metal pollution in fruit juice and
consumption of fruit juices of these brands pose no known threat to the
health of the population.
4. Conclusions
The present study was performed to determine the concentrations
of toxic elements – aluminum, lead and cadmium in fruit juice samples
collected from supermarkets in Jeddah and also to determine the
radioactivity concentrations in juice samples.
The mean elemental concentration values in ppb of Al, Pb and Cd
in apple juice are (144.00±12.51); (2.64±0.97) and (1.07±0.44)
respectively.
The mean concentration values in ppb of Al, Pb and Cd in orange
juice are (122.20±11.36); (2.00±0.93) and (1.13±0.48) respectively,
while those in mango juice are (115.28±10.84); (2.50±0.95) and
(1.57±0.60) respectively.
The mean radioactivity concentration values in (Bq/l) in apple,
orange and mango juice are (17.66±2.95), (19.85±3.15), (11.93±3.04)
respectively.
It is observed that the elemental concentration levels and the
radioactivity concentration values in fruit juice in Saudi Arabia compare
favorably with those reported elsewhere by different authors. It is evident
from the results obtained in this study that the levels of these toxic
elements and radioactivity in fruit juice consumed in the Kingdom are
acceptably low and pose no threat to the health of the population.
Acknowledgement
The authors would like to thank King Abdulaziz University,
Jeddah, Saudi Arabia for the financial support for this study ( Project #
115 / 428 ).
M.A. Enani and S.M. Farid 166
References
[1] Llobet, J.M, Falco, G., Casas, C., Teixido, A. and Domingo, J.L., Concentration of
arsenic, cadmium, mercury, and lead in common foods of Catalonia, Spain, J. Agric. Food
Chem., 51: 838-842 (2003).
[2] Leblanc, J.C., Malmauret, L., Guerin, T., Brodet, F., Boursier, B. and Verger, P.,
Estimation of the dietary intake of pesticide residues, lead, cadmium, arsenic and
radionuclides in France, Food Addit. Contam., 17: 925-932 (2000).
[3] Grawe, K.P., Thierfelder, T., Jorhem, L. and Oskarsson, A., Cadmium level in kidneys
from Swedish pigs in relation to environmental factors – temporal and spatial trends, Sci.
Total Envrion., 208: 111-122(1999).
[4] Wilhelm, M., Wittsiepe, J., Schrey, P., Budde, U. and Idel, H., Dietary intake of
cadmium by children and adults from Germany using duplicate portion sampling, Sci. Total
Environ., 285: 11-19 (2002).
[5] Dahiya, S., Karpe, R., Hedge, A.G. and Sharma, R.M., Lead, cadmium and nickel in
chocolates and candies from suburban areas of Mumbai, India, J. Food Comp. Anal., 18:
517-522 (2005).
[6] Onianwa, P.C., Lawal, J.A., Ogunkey, A.A. and Orejimi, B.M., Cadmium and nickel
composition of Nigerian foods, J. Food Compos. Anal., 13: 961-969 (2000).
[7] Ward, N.I., Trace elements. In Environmental Analytical Chemistry (F.W. Fifield Eds.)
Blackie, London (1995).
[8] Al-Saleh, I. and Shinwari, N., Report of the levels of Cd, Pb, and Hg in imported rice grain
samples, Bio. Trace Elem. Res., 83: 91-96 (2001).
[9] Coco, F.L., Monotti, P., Cozzi, F. and Adami, G., Determination of Cd and Pb in fruit
juices, Food Control, 17: 966-971(2006).
[10] Mo, S.C., Choi, D.S. and Robinson, J.W., A study of the uptake by duckwaeed of
aluminum, copper and lead from aqueous solution, J. Environ. Sci. and Health, 23: 139-156
(1988).
[11] US EPA, Cost and benefit of reducing lead in gasoline. Draft Final Report, Office of Policy
Analysis, US EPA 230-03-84-005, Washington, DC (1984).
[12] Tripathi, R. M., Mahapatra, S., Raghunath, R., Kumar, A.V and Sadasivan, S., Daily
intake of aluminum by adult population of Mumbai, India, Sci. Total Environ., 299: 73-77
(2002).
[13] Tokman, N., Akman,S. and Ozeroglu, C., Determination of lead, copper and manganese
by graphite furnace atomic absorption spectrometry after separation/concentration using
water-soluble polymer, Talanta, 63:699-703(2004).
[14] Onianwa, P.C., Adetola, I.G., Iwegbue, C.M.A., Ojo, M.F. and Tella, O.O., Trace heavy
metals composition of some Nigerian beverages and food drinks, Food Chem., 66: 275-279,
(1999).
[15] Lopez, F.F., Cabrera, C., Lorenzo, M.L. and Lopez, M.C., Aluminum Content of
drinking waters, fruit juices and soft drinks: contribution to dietary intake, Sci. Total
Environ., 292: 205-213 (2002).

Determination of Toxic Elements Concentration… 167
[16] Scheibel, V. and Appoloni, C.B., Radioactive trace measurements of some exported foods
from south Brazil. J. Food Comp. Annal., 26: 650-653 (2007).
[17] Asefi, M., Fathivand, A.A. and Amidi, J., Estimation of annual effective dose from 226
Ra and 228Ra due to consumption of foodstuff by inhabitants of Ramasar City, Iran, Iran J.
Radiat. Res., 3: 47-51 (2005).
[18] Hosseini, T., Fathivand, A.A., Barati, H. and Karimi, M. Assessment of radionuclides in
imported foodstuffs in Iran, Iran J. Radiat. Res., 4: 149-153(2006).
[19] Venturini, L. and Sordi G.A.A. Radioactivity and committed effective dose from some
Brazilian Foodstuffs. Health Phys., 76: 311-313(1999).
[20] Saleh, I.H., Hafez, A.F., Elanany, N.H., Motaweh, H.A. and Niam, M.A., Radiological
study on soil, foodstuffs and fertilizers in the Alexandria Region, Egypt, Turkish J. Eng.
Env. Sci., 31: 9-17(2007).
[21] Al-Masri, M.S., Mukallati, H., Khalil, H., Hassan, M., Amin, Y. and Nashawati A.,
Natural radionuclides in Syrian diet and their intake, J.Radioanal. Nucl. Chem., 260: 405-
412 (2004).
[22] Wikipedia, Background radiation, 2010 (http//en.wikipedia.org/wiki/ Background_radiation).
[23] Kinsara, A., Farid, S.M., Wajid, S.A. and Sadi, A., Longitudinal variation of trace
elements concentration in Human Milk in Jeddah, Saudi Arabia, JKAU: Eng. Sci., 17:75-
94(2006).
[24] Nasreddine, L., Samad, D.E., Hwalla, N., Baydoun, R., Hamze, H. and Massin, D.P.,
Activity concentration and mean annual effective dose from gamma-emitting radio-nuclides
in the Lebanese diet, Radiot. Proct. Dosim., 25: 107-112(2008).
[25] Zhou, H. and Liu, J., The simultaneous determination of 15 toxic elements in foods.
Atomic Spectroscopy, 18: 115-121(1997).
[26] Dabeka, R.W., Mckenzie, A.D. and Lacroix, M.A.,Lead and cadmium levels in
commercial infant foods and dietary intake by infants 0-1 year old, Food Addi. & Contam.,
5: 333-338 (1988).
[27] Martin, G.J., Fournier, J.B., Allain, P., Mauras, Y. and Aguile, L., Optimization of
analytical methods for assessment of orange juices, Analusis ( Elsevier,Paris), 25: 7-14
(1997).
[28] Hickman, L., "It is OK to drink orange juice?" "The Guardian", January 10, 2006.
[29] Scancar, J., Stibilj, V. and Milacic, R., Determination of aluminum in Slovenian
foodstuffs and its leachability from aluminum – cookware, Food Chem., 85: 151-157
(2004).
[30] Tabrizi, A.B., Determination of aluminum and Zinc in foodstuffs and water samples, Food
Chem., 100, 1698-1703(2007).
[31] FAO/WHO, Report of the Joint FAO/ WHO Expert Committee on Food and Additives.
WHO Technical Report Series, 837,Geneva, WHO (1989).
[32] EC – European Council, Council Regulation EEC 2392/89. Official Journal of the
European Committees L261: 1-2(1991).
[33] MAFF – Ministry of Agriculture, Fisheries and Food. Lead, Arsenic, Cadmium, Mercury
and other elements in Food. Food Surveillance Paper NO. 52 & 53, UK (1998).

M.A. Enani and S.M. Farid 168
[34] Food and Nutrition Board, National Research Council, National Academy of Sciences.
RDA, 10th ed., Washington, D.C., National Academy Press (1989).
[35] NFA – National Food Agency of Denmark. Food monitoring in Denmark, Nutrients and
Contaminants Publication No. 187, Copenhagen: Ministry of Health (1990).
[36] Yu, K.N. and Mao, S.Y., Assessment of radionuclide contents in Food in Hong Kong.
Health Phys., 77: 686-690(1999).
[37] Food Standards Agency, Analysis of the natural radioactivity content of bottled
waters(2004) ( www.food.gov.uk/science/survillance/ fsis2004branch/fsis6704.
[38] Choi, M.S., Lin, X.J., Lee, S.A., Kim, W., Kang, H.D., Doh, S.H., Kim, D.S. and Lee,
D.M., Daily intakes of naturally occurring radioisotopes in typical Korean foods. J.
Environ. Radioactivity, 99:1319 –1323 ( 2008 ) .
[39] Shanthi , G., Maniyan, C.G., Raj, G.A.G. and Kumaran, J.T.T., Radioactivity in food
crops from high-background radiation area in southwest India. Current Sci., 97: 1331-1335
(2009).
Determination of Toxic Elements Concentration… 169
إيجاد تركيز العناصر السامة والنشاط اإلشعاعي في عصير الفواكو بمدينة جدة بالمممكة العربية السعودية
سيد محمد فريد ومحمد عبدالصمد عناني ، النووية، كمية اليندسة، جامعة الممك عبدالعزيزقسم اليندسة
جدة ، المممكة العربية السعودية
أصبح عصير الفواكو عنصرًا لو أىميتو في غذاء العديدد .المستخمصكمددا أنيددا تعدددد مشددروبًا لدددو . مددن ارسددر فدددي المممكددة العربيددة السدددعودية
شددددعبية فددددي ىددددذا البمددددد، وتمعددددل المعددددادن ارساسددددية والمعددددادن دددد يمة ،الوجدددود فدددي عصددديرا الفواكدددو دورًا ىامدددًا فدددي نمدددو اإلنسدددان وصددد تو
عتبدددر عددددد مدددن العناصدددر الكيميا يدددة ارخدددر الموجدددودة فدددي عصدددير يو –الكددددددددادميوم –ارلمنيددددددددوم :مثددددددددل مددددددددن العناصددددددددر السددددددددامة الفواكددددددددو .والز بق وغيره –الخارصين –الرصاص
كددو واع مددن عصددير الفوافددي ىددذه الدراسددة، تددم ت ميددل ث ثددة أنددو وذلك لخمسة عشر منتج مختمف موجدود ( المانجوو التفاح، و البرتقال، )
: فدددي أسدددواق جددددة ومدددا وليدددا، وذلدددك لمعرفدددة وجدددود العناصدددر السدددامةارلمنيوم، الرصاص، والكادميوم وذلدك باسدتخدام مطيداف اصمتصداص
وكدددان متوسدددط قددديم التركيدددز (: الجرافيتدددي) الدددذري ذي الفدددرن الكربدددوني الرصداص، والكددادميوم و الجدزء مددن البميدون ليلمنيدوم، العنصدري بو ددة
؛ (45.84± 477.00): كالتدددالي( عمدددل التدددوالي)فدددي عصدددير التفددداح ومتوسدددددط قددددديم التركيدددددز العنصدددددري (0.77±:4.0)و (:>.0±5.97)و
بو دددة الجددزء مددن البميددون ليلمنيددوم والرصدداص والكددادميوم فددي عصددير (;0.7±4.46)و ،(6>.0±5.00)و، (44.69±455.50): البرتقدددددددددددال
M.A. Enani and S.M. Farid 170
±;448.5) :المددانجو فددي وأخيددرًا متوسددط قدديم التركيددز. عمددل التددوالي . عمل التوالي (0.90±:4.8 )و ، (8>.0±5.80)و، (7;.40
وكدذلك مدع ،وقد قورن ىذه القيم مع قيم ال ددود المسدموح بيدا .ىذا الب ثسياق القيم المماثمة في دول مختمفة في
شددعاعي فددي غددذاء اإلنسددان لددو إن معرفددة مسددتويا النشدداط اإلأىميددددة خاصددددة لتقدددددير المخدددداطر اإلشددددعاعية الم تممددددة عمددددل صددددد ة
عيندددة مدددن عصدددير الفواكدددو 9; ولقدددد تدددم ت ميدددل مدددا مجموعددد. اإلنسدددانو كددددان متوسددددط قدددديم تركيددددز النشدددداط . لقيدددداس النشدددداط اإلشددددعاعي بيددددا
: في عصدير التفداح، البرتقدال، والمدانجو( لتر/بيكرل)اإلشعاعي بو دة عمددددددددددددددددددددددل ) (6.07±6>.44)و، (6.48±8;.>4)و، (8>.±5...:4)
و كاند قديم التركيدزا النشدداط اإلشدعاعي التدي تدم ال صددول (. التدوالي .ارنة مع مثي تيا في دول مختمفةعمييا من ىذا الب ث معقولة بالمق