determination of accurate l4lfe3+, t6lfe3+, 41fl l6lf'sz+ ... · these populations suggest...
TRANSCRIPT
American Mineralogist, Volume 79, pages 51-62, 1994
Determination of accurate l4lFe3+, t6lFe3+, 41fl l6lf'sz+ site populations insynthetic annite by Miissbauer spectroscopy
D. G. R-lNcounr, I.A.D. CHnrsrro, M. RoynnDepartment of Physics, University of Ottawa, Ottawa, Ontario KlN 6N5, Canada
H. KoollraCentre for I-and and Biological Resources Research, Research Branch, Agriculture Canada, Central Experimental Farm,
Ottawa, Ontario KIA 0C6, Canada
J.-L. RosrnrCentre de Recherches sur la Synth0se et Chimie des Min6raux, CNRS, F-45071 Orl6ans C6dex 2, France
A. E. L.cl.oNonOttawa-Carleton Geoscience Centre, Department of Geology, University of Ottawa, Ottawa, Ontario KIN 6N5, Canada
E. Mun-c.oBayerisches Geologisches Landesamt, ConcordiastraBe 28, D-96049 Bamberg, Germany
AssrRAcr
we report accurate I4lFe3+, t6lFe3+, and I61Fe2+ site populations in synthetic annite. Theyare achieved by detailed analysis of high-quality Miissbauer spectra collected at roomtemperature, liquid N, temperature, and liquid He temperature. The experimental diffi-culties related to (l) site-specific recoilless fractions, (2) absorber thickness and polarizationeffects, and (3) absorber texture effects are rigorously addressed. A new quadrupole splittingdistribution method that allows arbitrary shape distributions for each site is used for thespectral analysis. It resolves the three sites in accordance with visible spectral features andreveals a needed defect I6rFe2* site.
Whereas subspectral areas are generally believed to have optimal accuracies of a fewpercent of total spectral areas, we obtain site population to +0.2o/o for Ni + NiO bufferedsyntheticannite: t41Fe3+/Fe:4.00 + 0. 150/0, t61Fe3+/Fe:7.00 + 0.20o/o, andt6lFe2+/Fe:89.00 + 0.20o/o. These populations suggest thar 16.50/o of the H in the ideal structuralformula, KFerAlSirO,o(OH)r, is missing because of charge-balance requirements: I6lFe2++OH- = l 6 lFe3+ +02 * H l whe re t6 lFe3+ + t 4 lA l3+ + t41Fe3+ + t61A13+a lSOOCCurS .
INrnooucnoN
Several recent advances in the methodology of Mdss-bauer spectroscopy have a direct bearing on the accuracywith which site populations can be determined in Fe-bearing minerals. These include (l) thickness effect eval-uations for absorbers with intrinsically broad lines (Pingand Rancourt,19921, Rancourt et al., 1993), (2) ideal ab-sorber thickness determinations (Long et al., 1983; Ran-court et al., 1993), (3) analytic methods for removing thespectral distortions of the thickness effect (Rancourt,1989), (4) Voigt-based spectral line shapes for absorberswith quadrupole splitting distributions (QSD) (Rancourtand Ping, l99l; Ping et al., 1991), (5) criteria for identi-fuing distinct spectral contributions (Rancourt et al., 1992;Rancourt, 1993), and (6) methods for determining site-specific recoilless fractions (Royer, 199 l). Here, we reportthe first application of these methods in an attempt toobtain the best possible accuracy of site populations inan Fe-bearing mineral. We demonstrate that an accuracyof 0.2o/o of Fe,o, is possible, whereas the generally acceptedlimit is 2-50lo of Fe.,.
0003-o04x/94l0102-0051$02.00 5l
We choose annite because of the predominant role ofFe in its overall crystal chemistry, with talFer+, t01ps3+,and t6lFe2+ populations being controlled by both struc-tural constraints and thermodynamic conditions (Hazenand Wones, 1972). Better site populations here give animproved evaluation of early annite crystal-chemistrymodels.
In applying the above methods to annite, we illustrateone of the major difficulties in obtaining site populationsusing Mdssbauer spectroscopy: a given fitting model ap-plied to a given spectrum does not, in general, produceunique populations. This is an intrinsic limitation of non-linear least-squares minimization problems that is oftennot recognized by spectroscopists. Instead of a uniquesolution, one obtains a domain of possible values in thespace of the resolved site populations. Spectra collectedat different temperatures give rise to solution domainsthat may have relatively small intersections, thereby sig-nificantly constraining the possible site populations.
We have obtained four solution domains from (l) modelfits to the room-temperature (R?') spectrum, (2) model
52 RANCOURT ET AL.: MOSSBAUER SPECTROSCOPY OF SYNTHETIC ANNITE
fits to the liquid N, temperature (LNZ) spectrum, (3)analysis independent of line-shape model of the RZ di-mensionless, intrinsic-absorber, resonant cross section,and (4) analysis independent ofline-shape model oftheliquid He temperature (LHeQ spectrum. Since the Fe,o,is known, combining any two of the above solution do-mains gives unique t4lFe3+, t6lpg3+, and I6lFe2+ popula-tions, with different associated errors. In this sense, thesite populations have been obtained by several indepen-dent methods. In particular, we stress that the LHeIevaluation is a truly independent measurement becauseannite is magnetically ordered at LHIT (Christie et al.,l99l), and the hyperfine structure of the spectrum col-lected at this temperature is magnetically resolved.
The structural formula unit for ideal annite (includingformal charges and 2:l layer cation coordinations) is
K+t6lFe2+r4rAl:*torSil*O?t(oH)t. (l)
Although the ideal analogue end-members in larhish tetpsz+is replaced by I6lNi2+,l6lMg'z+ (phlogopite end-member),l6lcu2+ or I6lCo2+ are believed to occur, Hazen and Wones(1972) argued that the ideal annite end-member does notoccur because ofstructural constraints involving the mis-match oftetrahedral and octahedral sheets.
They argued that in annite this mismatch is primarilyalleviated by the oxyannite reaction
I6lFe2+ + OH -t6tFe3+ + Or- + H t Q)
which replaces relatively large I6lFe2+ cations by telps:+.They stated that this theory was supported by a subse-quent study employing Mcissbauer spectroscopy (Wonesetal., l97l) and that the latter study "confirmed that atleast l0 mole percent of octahedral iron in all syntheticannites is in the trivalent state." Our synthetic annitecontains 7.3 molo/o of t6rFe in the trivalent state,
An earlier Mcissbauer study (Hiiggstrdm et al., 1969)had already observed a large amount of Fe3* in a syn-thetic annite sample, and the only other Mdssbauer studyof synthetic annite (Ferrow, 1987a, 1987b) also clearlyobserves Fe3* (both I6lFe3+ and I41Fe3+ ) in a room-tem-perature spectrum. The presence of t41Fe3+ was not ex-plained in the latter study, and accurate site populationswere not attempted. Dyar and Burns (1986) studied threeannite samples, with the most Fe-rich of these having840/o of the amount of Fe contained in a synthetic annitesample. They reported t4lFe3+/Fe : 0-l0o/o and Fe3+/Fe: I l-550/0.
If a tetrahedral-octahedral mismatch is a major factorcontrolling site populations in annite, then the Fe3+/A13+exchange
r6tFei+ + r4tAl3+ + 161413+ + r1tFe3+ (3)
is a more effective mechanism for reducing the relativelylarge lateral extension ofthe I61Fe2+ sheet than the oxyan-nite reaction alone. That suggests that once the structuralconstraints are satisfied, the relative amounts of t4lFe3+and {61Fe3+ depend on the reducing ability of the environ-ment at synthesis. The essential step in testing these
and other ideas concerning the cause of site popula-tions in annite is to obtain accurate I41Fe3+ and t6lFe3+populations.
S.q.NIpI,n SYNTHESIS AND CHARACTERIZATION
The synthesis was performed by J.-L. Robert at Or-l6ans and was achieved in the following way.
The starting material was a fine mechanical mixture ofa specially prepared silicate gel and metallic Fe powder.Such a mixture allows fast and reproducible equilibrationunder the experimental conditions used (Jull iot eta l . , 1987).
The gel contained half of the Fe,", and was prepared bythe method of Hamilton and Henderson (1968) using thefollowing reagents: high-grade KrCO3 transformed intoKNO. by reaction with HNO', a titrated nitrate solutionof Al, a titrated nitrate solution of Fe, and tetraethylor-thosilicate (T.E.O.S.), for silica.
The starting mixture and 20 wto/o of distilled HrO weresealed into a Pt tube by arc welding. The synthesis wasperformed at 600 + 5 "C and Pr,o of 2.00 t 0.05 kbar,in a cold-seal Tuttle-type externally heated pressure ves-sel, with an experiment duration of 3 weeks.
The /o, was controlled by the Ni + NiO buffer, usingthe double capsule (Au,Pt) method devised by Eugster(1957). Under our experimental conditions, this buffersets an /o, of 10-'t' bars (Huebner and Sato, 1970). This
/o, is approximately that set by the alloy constituting thepressure vessel.
Powder X-ray diffraction (XRD) indicated that the ex-periment product was entirely a single phase of mica. Thedata were consistent with the lMpolytype structure hav-ing unit-cell parameters of a: 5.393(2), b : 9.342(l), c: 10.332(3) A, B : 100.1(2)" and V: 512.5 A'. Theseare similar to those given by Hazen and Burnham (1973)for annite from Pikes Peak (a: 5.3860, b : 9.3241, c :
10.2683 A. A : 100.63 ' . a td V :506.8 A.) .Fe-bearing impurities were not detected in any of the
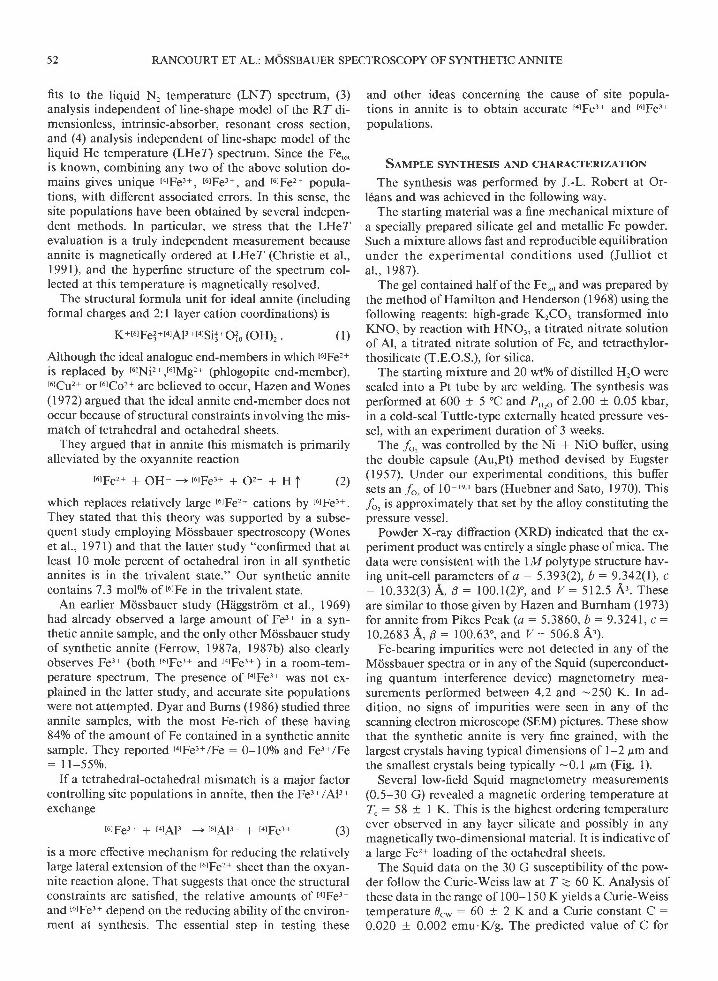
Mdssbauer spectra or in any of the Squid (superconduct-ing quantum interference device) magnetometry mea-surements performed between 4.2 and -250 K. In ad-dition, no signs of impurities were seen in any of thescanning electron microscope (SEM) pictures. These showthat the synthetic annite is very fine grained, with thelargest crystals having typical dimensions of l-2 pm andthe smallest crystals being typically -0. I pm (Fig. 1).
Several low-field Squid magnetometry measurements(0.5-30 G) revealed a magnetic ordering temperature at4 : 58 + I K. This is the highest ordering temperatureever observed in any layer silicate and possibly in anymagnetically two-dimensional material. It is indicative ofalarge Fe2+ loading ofthe octahedral sheets.
The Squid data on the 30 G susceptibility of the pow-der follow the Curie-Weiss law at T z 60 K. Analysis ofthese data in the range of 100- I 50 K yields a Curie-Weisstemperature d.* : 60 + 2 Kand a Curie constant C :
0.020 + 0.002 emu.K,/g. The predicted value of C for
RANCOURT ET AL.: MOSSBAUER SPECTROSCOPY OF SYNTHETIC ANNITE 53
ideal annite (r61Fe2+/Fe : 1000/0) having the cell volumeV: 512.5 A'and corresponding ideal density p: 3.317g,/cm3 is (6/Y) Qt.np"1z/3k"p :0.021 emu'K/g, where triuis the Bohr magneton, ku is the Boltzmann constant, andp"n: 5.4 is the effective Bohr magneton number for anFe2* ion (Ashcroft and Mermin, 19'76). Letting 110/o ofthe Fe be Fert implies z p.n = 5.46 and gives a predictedC : 0.022 emu.K./g. The Squid magnetometry resultstherefore give an upper limit for Fe3*/Fe of - 100/0.
Infrared absorption in the OH-ion stretching mode re-gion showed the expected dominant N band at 3665 cm ',
with a full width at half maximum of 30 cm '. The Nband arises from OH ions for which the three immedi-ately neighboring octahedral sites are filled with divalentions (Vedder, 1964), here Fe2*-Fe2+-Fe2+. In addition,two small bands of comparable intensity having widthsof -30 cm-rare present at 3580 and 3545 cm r . Weinterpret these as I bands, which are caused by OH ionshaving one of the three closest octahedral sites occupiedby a trivalent ion (Vedder, 1964), and refer to them as I.and Ib, respectively. This assignment is supported by thefact that Io grows dramatically (remaining at 3545 cm ')
and becomes comparable in intensity to the N band whenthe annite sample is oxidized by heating in air (Christieet al., 1993). We therefore attribute I" and In to Fe2+-Fe2+-Al3+ and Fe2*-Fe2+-Fer+ configurations, respective-ly. Their relative intensities are consistent with theamounts of 1614lr+ and I6lFe3+ obtained by Mossbauerspectroscopy in the present study. When V bands (causedby OH ions close to octahedral vacancies) are present,they occur at lower frequencies than I bands (Vedder,1964). No other distinct bands are present down to 3000cm-' that might be attributed to V bands. Thus, the in-frared absorption spectrum indicates the presence of16lA13+ and I6lFe3+ and the relative absence of octahedralvacancres.
ExpnnrnmNTAL METHODS AND ANALySIS
Collection and calibration
Transmission 5'Fe Mcissbauer spectra were obtained,calibrated, and folded in the usual way (e.g., Rancourt etal., 1992). Folding is essential to produce flat back-grounds with parameters that do not trade off with thoseof the absorption patterns when least-squares fitting isperformed.
The Rl" center shifts (with RZ : 22 "C\ are referencedto metallic Fe at R7; however, the center shifts at LNZand LHeZdepend on the 57Fe center shifts of the sTCo-Rh
source at LNZand LHeI, respectively, and are thereforenot known accurately.
All the spectra except one were collected at Ottawa.Two LHeZ spectra were collected: one at 7": 7.0 K wascollected at Ottawa, and one aI T :4.2 K was collectedat Technische Universitdt Miinchen by Murad. TheMiinchen data were collected in the sine mode ratherthan in the constant acceleration mode of the transduc-er. No sienificant difference can be seen between these
,*dt'l
Fig. 1. Scanning electron microscope pictures of the syn-thetic annite at high (top) and low (bottom) magnifications. Thethin white horizontal bars represent I pm.
two LHe?" spectra, and both were analyzed for the pres-ent study.
The low-temperature experiments were done in a Heexchange gas cryostat, with the source and absorber atthe same temperature, although the source temperaturewas not measured directly.
The cryogenic absorber was prepared as follows andwas also used at RZ in the cryostat. A Cu holder withultra-pure Al windows 1.40 cm in diameter was uniform-ly loaded with 81.5 mg of the annite powder. The powderwas hand pressed between the two Al windows to ensuremechanical stability and thermal contact. The holder isnot gas-tight and allows exchange gas to penetrate.
Rancourt (1989) recently described all of the factorsthat need to be considered when accurate site populationsfrom Mossbauer spectroscopy are required. We next ad-dress each ofthese that are relevant to the present case.
Spectrum quality: Signal to noise ratio
Fitting models must rely on distinct observed spectralfeatures. Therefore. the best possible statistics should be
.ffi
..e$e
54 RANCOURT ET AL.: MOSSBAUER SPECTROSCOPY OF SYNTHETIC ANNITE
G
f
jo@+cfoO
1.005
0.995
0.985
0.975
0.965- 2 0 2 4
Velocily (--/9
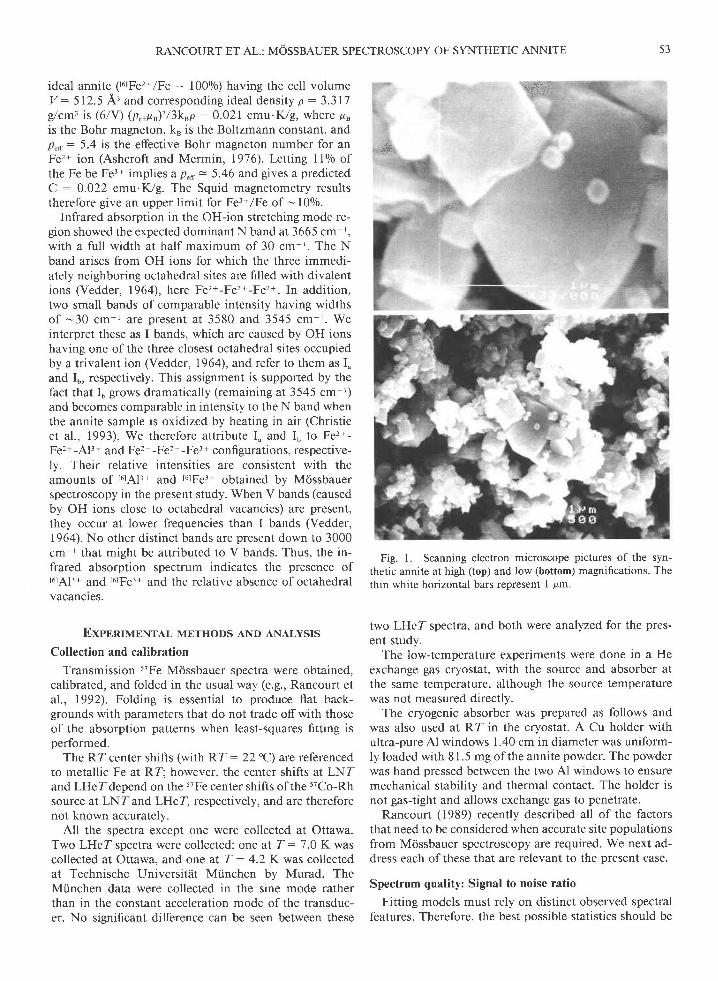
Fig. 2. Two experimental spectra (dots) and one calculatedspectrum (solid line) are scaled to the same signal depth andcompared. They are also taken to have the same arbitrary BGlevel of 1.0 (solid horizontal line). The spectrum with the broad-est lines corresponds to the 90-mg/cm2 absorber. The other ex-perimental spectrum corresponds to the 53-mg,/cm2, nearly idealthickness absorber. The calculated spectrum is a simulation basedon the extracted dimensionless, intrinsic-absorber, resonant crosssection [using ""(E)
: d,(E)/ f n, in Eq. 2 of Ping and Rancourt,19921 and shows the spectrum that would be measured in thethin absorber limit if this limit could be attained.
obtained. To achieve this we use the ideal absorber thick-ness for annite. This thickness gives the largest signal tonoise (S/N) ratio in a given accumulation time and is - 50mg/cm2 for annite (Rancourt et" al., 19931- Long et al.,1983). RZ spectra were also collected at 35,61, and 90mgcm2 to gauge the impact of thickness effects on fittedspectral areas.
Absorber thickness effects
At a given absorber thickness, thickness effects are par-ticularly severe for spectra containing small numbers ofintrinsically thin absorption lines but are much less sig-nificant when the absorption is divided into many andintrinsically broad lines. New methods for calculating theexpected thickness attenuation of intrinsically broad lineshave recently been developed (Rancourt et al., I 993; Pingand Rancourt, 1992). These suggest that, for annite, sig-nificant thickness attenuation should occur at the thick-nesses we have used. This implies that a full thicknesscorrection procedure (Rancourt, 1989) should be appliedto yield the intrinsic absorber cross section.
We have applied this procedure to our 53-mg/cm, R?"spectrum and have analyzed the extracted intrinsic ab-sorber cross section. We find that the site-specific relativesubspectral areas are the same within uncertainties as thoseobtained from fitting the raw 53-mg/cm2 spectral data. Itseems therefore that, in this case, the non-negligiblethickness-related spectral distortions and main peak at-tenuations do not significantly affect the extracted sub-spectral relative areas with the fitting model line shapes
that we have used. This is true despite the noticeablethickness distortions that are shown to increase system-atically with thickness in Figure 2. The simulated spec-trum for the thin-sample limit is also shown for compar-ison. Representative extracted Fer'/Fe values are I 1.0-l l.2o/o at 0-53 mg/cm2, -l l .5o/o at 6l mg/cm2, and-ll.7o/o at90 mg/cm2.
That we are effectively in the thin limit for those quan-tities that interest us is supported by the additional factsthat (l) the LN?"spectrum (53 mg/cm2 absorber) is thick-er because of larger recoilless fractions and has a differentline shape because of larger quadrupole splittings (QS),yet it gives the same relative subspectral areas as the Rl"spectra; and (2) the LHef hyperfine spectra are magnet-ically split and consist ofvery broad lines from hyperfinefield distributions coupled with quadrupole splitting dis-tributions, yet they also give the same subspectral areas.The latter point is significant because such a hyperfinestructure should dramatically reduce the effective absorb-er thickness.
Polarization effects
Polarization effects can occur in addition to ordinarythickness effects when the Miissbauer radiation is polar-ized, as it is resonantly absorbed on traversing the finitethickness absorber. This, in general, can occur in single-crystal or textured absorbers but will not occur in suffi-ciently fine and nontextured absorbers (see section on ab-sorber texture below).
For a given amount per squared centimeter of a polar-izing material or mineral, a textured or single-crystalsample gives rise to greater spectral distortions than anontextured fine powder absorber of the same material.For this reason, an absorber that is expected to be thinon the basis ofcalculations ofthe effect ofordinary thick-ness (e.g., Ping and Rancourt, 1992) may, in fact, be thickif it contains polarizing material.
These considerations are important to the present ap-plication because (l) all materials that give rise to quad-rupole doublets are Mdssbauer polarizing materials, and(2) no general and practical procedure presently exists tocorrect for polarization effecls arising from real absorberswith intrinsically broad absorption lines, such as thosefound in all Fe-bearing silicate minerals.
Fortunately, our annite is a very fine powder (a clay infact, see Fig. l) and our absorbers are nontextured (nextsection) such that polarization effects are negligible in thisapplication. This is supported by the fact that exact or-dinary absorption corrections of the Rln spectrum gaveconsistent results (previous section).
Absorber texture
A nontextured absorber is a powder or polycrystallinesample in which all of the crystal orientations are repre-sented with equal probabilities. Ifthere is a preferred ori-entation, then the absorber is textured.
If the Goldanskii-Karyagin effect and dynamic lineshape effects are barred, nontextured absorbers have

RANCOURT ET AL.: MOSSBAUER SPECTROSCOPY OF SYNTHETIC ANNITE 55
spectra composed of elemental quadrupole doublets thathave equal intensities of their high- and low-energy Lo-rentzian line components. This supplies welcome con-straints for the fitting models that are applied to the spec-tral data. In this study, these constraints were essential.
Texture is particularly difrcult to avoid in layer sili-cates where the cleavage gives rise to flakes that preferthe plane of the absorber. However, with the claylike na-ture of our annite (Fig. l), using a relatively thick ab-sorber (of near ideal thickness 53 mg/cm'z) gave a com-plete absence of texture.
We checked this by rotating our 53-mg,/cm2 absorberby 30 and 54", which gave thicknesses of 61 and 90 mglcm2, respectively. All of the spectral changes (Fig. 2) canbe attributed to thickness effects alone, with no change inintrinsic doublet symmetries. Furthermore, our fittingmodels that assume complete absence of texture gave sta-tistically ideal and physical fits and no evidence of sys-tematic differences that could be attributed to a smallamount of texture.
The 35-mg/cm2 absorber also showed a total absenceof texture; however, a 6.2-mg/cm2 absorber showed ob-vious signs of texture. Using the near ideal thickness of53 rng/cm'ztherefore has the double advantage of givinggood spectrum quality and ensuring that, with this clay-like sample, there is no texture. Having to account forthickness effects is a worthwhile compromise in view ofthese advantages.
Quadrupole splitting distributions (QSD)
In modeling the spectra, it is advantageous to use asmany physical constraints as can be rigorously justified.Here, the choice of the model line shape is the first con-sideration. Although elemental lines that are due to singlegroups of identical probe environments must, in the ab-sence ofthickness effects and other artifacts, be Lorentz-ian lines, absorption lines that are made up of severaloverlapping Lorentzians are not Lorentzian in shape.
A given species in a given anion coordination, t6tFsu+say, has many different local environments that are de-fined by local distortions, local charge distributions, thetypes and positions ofnearest neighbor anions, next near-est neighbor cations, etc. Each local environment givesrise to a single elemental quadrupole doublet such that acontinuous distribution of quadrupole splittings can beused to model the overall absorption doublet.
A powerful new method for fitting with distributionshas been developed (Rancourt and Ping, l99l) and hasbeen applied to quadrupole splittings recently (Ping et al.,1991). We use this method here and therefore briefly de-scribe it.
Each local environment has its own quadrupole split-ting (A) and also has its own center shift (6). Since, for agiven species and anion coordination, A depends muchmore strongly on the local environment than does 6, weassume that 6 and A are linearly coupled:
and distribute only A. That is, by optimization we obtaina distribution, P(A), of quadrupole splittings that auto-matically has an associated distribution of 6 throughEquation 4.
The coupling parameters 6o and 6, are characteristic ofa particular group ofprobe ions (e.g., ofa particular spe-cies or of a particular species and anion coordination,etc.). Rancourt and Ping (1991) referred to such a group,one that has its own P(A) and its own values of 6o and 6,,as a site. In the present applications to annite at RZ andLNZ(above the magnetic ordering temperature), it turnsout that only three such sites with independent A distri-butions are required and that these correspond to talFe3*,t61Fe3+, and t6lFe2*, that is, only the valence state andcoordination number give rise to distinct spectral com-ponents. All other information concerning more subtlestructural features [e.g., cis and trans octahedral sites,FeO? and FeO(-OH- coordinations rather thanFeO?-(OH-), at octahedral sites, etc.l is taken into ac-count by the A distributions. Rancourt (unpublishedmanuscript) has established that quantitative populationsfor cis and trans t61Fe2+ sites cannot be obtained by Mdss-bauer spectroscopy in trioctahedral micas. The cis andtrans sites are not resolved but only contribute to theoverall QSD, P(A).
We assume that a true P(A) can be expressed as a sumof Gaussian components:
P(A) : f p,G,(to,, o^,; t) (5)
where the p, is a weight factor such that >p t : I and eachGaussian, G,, is normalized to an area of l. Each Gauss-ian has a center position, Ao,, and a Gaussian half-width,oo,. Only as many Gaussians, N, as are required by thedata are used: most often N: I or N: 2 is sufficient.This is because the Gaussians are intrinsically suitablefor describing real distributions.
The power of the technique lies in that the correspond-ing line shape, Q@), for a given site can be shown ana-lytically to be a sum of Voigts (Rancourt and Ping, l99l):
N
Q@:2 P, ) v , r16o + D,aoi + k!o, /2,
16, I Yrloo,, 1, h*i v) (6)
where 7 is the underlying Lorentzian full width at halfmaximum (FWHM) and ho is the underlying Lorentzianheight. For nontextured thin absorbers we should haveh* : h- (symmetric elemental doublets) and 7 : 0'194mm/s (Heisenberg value for 57Fe);
Using this line shape QQ) in a configuration of one siteand one component (N: l) with hn : h- and t : 0.194mm/s requires six free parameters: h,60,6t, Ao, oo, and aflat background level, BG. By comparison, two equal-area Lorentzian lines that are allowed to have diferentwidths [the two Voigt lines in the N : I QQ) have dif-ferent widths through D,] also require six free parameters:two centers, two "y's, one area, and a BG.d : 6 0 * 6 r ' 4 (4)
56 RANCOURT ET AL.: MOSSBAUER SPECTROSCOPY OF SYNTHETIC ANNITE
Trau 1. Rf spectrum fit parameters
60(3+ ) do[3+] do[2+] d, [2+] A"(3+) o . (3+) &[3+] o.[3+]
1-1-2 0.27981-13a 0.28431-1-3b 0.28441-1-3c 0.28481-1-3d 0.28531-1-3e 0.28561-1-3f 0.28561-1-39 0.28581-1-3h 0.28591-1-3i 0.28611-1-3i 0.28651-1-3k 0.28621-1-31 0.2817
720.33720.71720.70720.69720.69720.69720.69720.69720.69720.68720.69720.69720.69
269.65273.O0272.89272.87272.85272.89272.86272.89272.85272 85272.89272.86272.71
0.2s230.16410.1 6670.1687o.17120.1706o.17210.17320.17410.1 7650.17480.17700.1762
0.43630.418s0.42270.4256o.4273o.4262o.4275o.42810.4281o.428r'.0.41730.41380.4048
1.23221.22501.22731 .23161.23681.24161.24211.24361.24551.24851 .26181.26501.2734
0.00760.00010.00010.00010.00010.00010.00010.00010.00010.00010.00010.00010.0001
-0.0459 0.5440-0.0422 0.5438-0.0431 0.5397-0.0449 0.5365-0.0470 0.5327-0.0489 0.5347-0.0491 0.5327-0.0497 0.5311-0.0505 0.5302-0.0518 0.5279-0.0569 0.5315-0.0582 0.5296- 0.0615 0.5317
0.9682 0.54840.9135 0.54980.9207 0.53670.9293 0.52060.9381 0.50260.9468 0.49210.9475 0.48430.9493 0.47540.9517 0.46570.9519 0.44430.9815 0.42030.9806 0.39500.9840 0.3610
Note.'symmetric elemental doublets are assumed (h* : h ) for all sites. Parameters 7, 60, Ao, and or are in millimeters per second. The (3+), [3+],and [2+] refer, respectively, to ralFe3+-, t61Fe3+-, and l6rF#t-specific parameters. BG is in kilocounts. The total absorption area
3 i l
A,^=' lz"yA4 Z.r,nr
(Eq. 6) is in kilocounts times millimeters per second. Parameter 61 (Eq. 4) is dimensionless. The site- and component-specific areas (a(3+), etc.) are inpercentages of 4,.,. Except in the 1-1-2 fit, a(3+) and o"(3+) are frozen parameters that are not adiusted in the fitting process.
The Qv line shapes in a one-site, N-component config-uration with h* : h and free 7 require 4 + 3N freeparameters. Our final fits to RZ and LNZ spectra requirethree SiteS attributable to ratFe3+, r6Jp9:+, and r6tFe2+. EaChsite gives distinct, characteristic, visible features in thespectra (e.g., Rancourt et al., 1992). Both t4lFe3+ and I61Fe3+require only N: l; however, the [6lFez+ site requires N: 3. The resulting model is referred to as a 1-1-3 model.For the Fe3+ sites, we always set 6, : 0, and the 7 isalways common to all sites. This gives a maximum of 2lfree parameters in our l-l-3 model fits.
Parameter tradeoffs
As mentioned above, even for a given fitting modelthat uses physically correct line shapes and that intro-duces only as many free parameters as are required toobtain statistically acceptable fits, a fundamental problempersists: the solution obtained by minimization is usuallynot unique. Entire regions in the parameter space giveequally good and acceptable fits. This problem is partic-ularly severe in cases like the present one, where consid-erable line overlap occurs.
Since we are mainly concerned with subspectral (i.e.,site-specific) areas to obtain site populations, we examinehow these areas trade off with each other. We find thatthe Mdssbauer solution, for, say, l-l-3 fits to the R?"spectrum, corresponds to an entire line segment of finitelength in the three dimensional space of the populationsI4 lFe3+, I6 lFe3+, and I61Fe2+.
All the points on this line segment give equally goodl-l-3 fits at RZby changing (i.e., trading off) the valuesof several of the fitting parameters that are dependent oneach other through the spectrum shape. Such a solutiondomain (Rancourt et al., 1985) of equivalent Miissbauersolutions can always be mapped out completely by im-posing fixed values on some of the dependent parameters.
The LNZ spectmm yields its own solution domain. If
the latter intersects the RZ domain, then the Mdssbauersolution can be signif,cantly reduced, in our case to asingle point in the population space. A third measure-ment, such as a very different LHeI spectrum, can fur-ther reduce the solution or. in our case. corroborate thealready unique solulion.
That is the main idea. Once a line shape model hasbeen carefully chosen based on physical and statisticalconsiderations, we identify the solution domains and at-tempt to reduce the Mrissbauer solution by using severalmeasurements.
Recoilless fractions
In the absence ofthickness and polarization effects, thesubspectral area, Ai, for site I is related to the correspond-ing site population as
A, :%4.f,oolofo,no, Q)
where 4, is the part of the BG level that corresponds toMossbauer (14.4 keV) y-rays, I is the recoilless fractionof the source, oo is the cross section at resonance for theMossbauer transition, lo is the natural FWHM of theMdssbauer transition (I0 : 0.097 mm,/s), f, is the site-specific recoilless fraction of the absorber, and n,, is thenumber of 57Fe nuclei in site i per unit area of the uniformthickness absorber.
The total spectral area is then a sum over all sites
A,^: 2 A,
such that the relative site populations are given by
Fe, - n"' : [- /t (8)Fe na fl,A,o,
where
,": 4 n.,
RANCOURT ET AL.: MOSSBAUER SPECTROSCOPY OF SYNTHETIC ANNITE 57
TABLE 1.-Continued
Fit ao1[2+] o,,f2+) 4"12+l oelz+l 46[2+] o,"12+l a(3+ ) a[3+] al2+) a"l2+l a"l2+l x?a
1-1-2 2.5527 0.10251-1-3a 2.5924 0.06891-1-3b 2 5919 0.06951-1-3c 2.5912 0.07021-1-3d 2.5889 0.07261-1-3e 2.5896 0.07121-1-3f 2.5895 0.O7141-139 2.5894 0.07131-1-3h 2.5892 0.07131-1-3i 2.s889 0.07't41-1-3' 2.5888 0.07041-1-3k 2.5886 0.07061-1-3r 2.5891 0.0730
2.2352232242.32082.31772.30802.31082.31052.31032.31002.30912.30612.30472.3019
o.28120.17300.17560.17780.17730.1 7940 .18120.18320.1 8490.18810.1 893o.19220.1 938
1.67851.66851 65041.62721 .61921 .61251.59641.58391 56751.5369t . c J o c
1.6869
0.43640.46080.48260.50400.51290.53180.s463o.56220.60500.61650.67890.8173
3.221.641.962.302.632.792.963.133.293.623.964.284.54
9.6510.269.859.449.018.818.598.368 .13/ . oo7.286.816.45
54 1743.0543.1543.4944.9744.3544.3044.2444.2044.1844.0944.0143.14
32.9638.7238.7038.4937 1637.8037.8838.0438.1538.2238.3738.3437.71
3.356.33 1 .126.33 1.086.29 1.066.22 1.056.25 1.046.28 1.046.23 1.046.23 1.046.32 1.056.31 1.056.56 1.088 . 1 6 1 . 1 0
and the average recoilless fraction is given by
T=L) .n . r , . (e )no
1/ "'Lu'
Equation 8 shows that even relative site populationscan only be obtained from spectral areas if site-specificabsorber recoilless fractions are known. These recoillessfractions depend on local bonding strengths and config-urations and must be measured. They also depend ontemperature.
Royer (1991) has made an extensive study of site-spe-cific recoilless fractions in Fe-bearing trioctahedral micasand found that, whereas all the biotite samples studiedhad larger Fe3* recoilless fractions than Fe2+ recoillessfractions in varying degrees, the same synthetic annitesample as studied here had recoilless fractions that wereequal for all sites, within experimental accuracy. Thisfinding is corroborated by our study, which finds the sameFe3+/Fe2+ spectral area ratios at R7., LNln, and LHeL
Rnsur-rs AND DrscussroN
RI spectrum
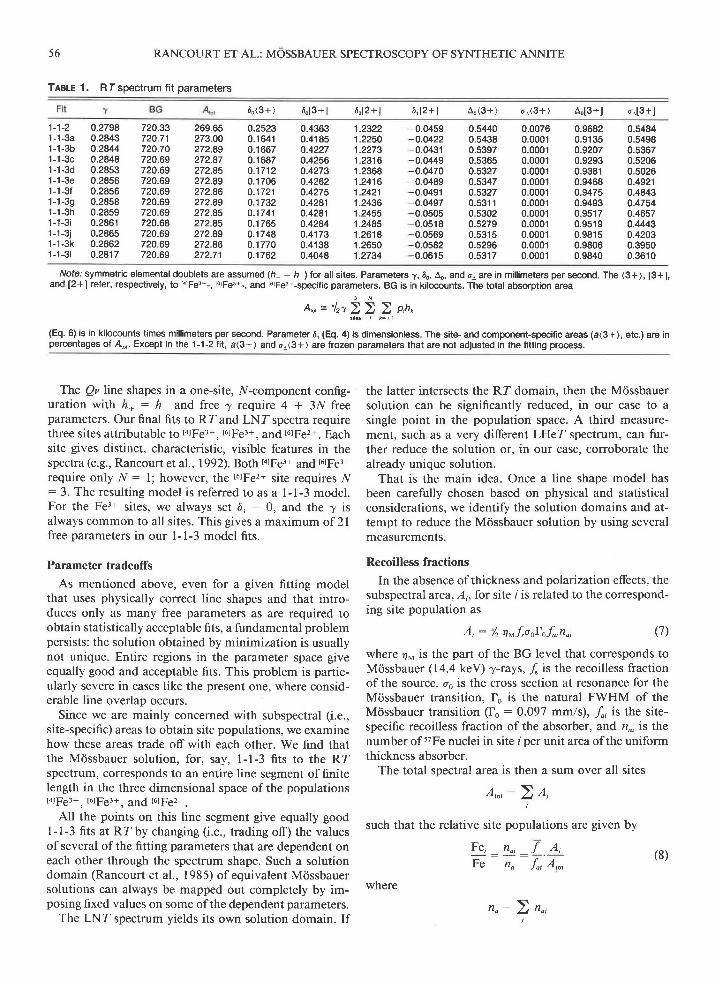
The Fe2+ spectral contribution has sufficient structureto require at least two Gaussian components in its QSD.The best l-l-2 fit that resolves the t4lFe3+, t6lFe3+, andI6lFe2+ sites is shown in Figure 3, and the correspondingfit parameters are given in Table l.
The two Fe2* Gaussian components should not simplybe ascribed to cis and trans sites. They are part of onecontinuous distribution that cannot be unambiguouslyresolved into cis and trans contributions. Indeed, equiv-alent fits can be obtained for an entire range ofcis-transpopulation ratios that actually correspond to essentiallyidentical QSD. This topic will be the subject of a futurepublication.
The difference spectrum (Fig. 3) ofthe l-l-2 fit showssignificant discrepancies in the region ofthe visible Fe3*features (0. l-1.1 mm/s) and, most notabiy, at -1.7 mm/s. The latter discrepancy is also seen in other Fe-bearingtrioctahedral micas (e.g., Hargraves et al., 1990) and sug-gests the existence of a small family of Fe2+ sites thathave relatively small QS. This, in turn, suggests that al-l-3 fitting model is appropriate. If so, it should also
remove the other discrepancies.The discrepancy observed at - 1.7 mm/s (Fig. 3) is real
and does not disappear when the spectrum is correctedfor thickness (e.g., Hargraves et al., 1990). It is essentialthat this inconsistency be resolved since, in our annite, itrepresents a spectral area comparable in magnitude withthe Fe3+-specific subspectral areas. A l-l-2 fit overesti-mates Fe3*/Fe, especially t6lFe3+/Fe.
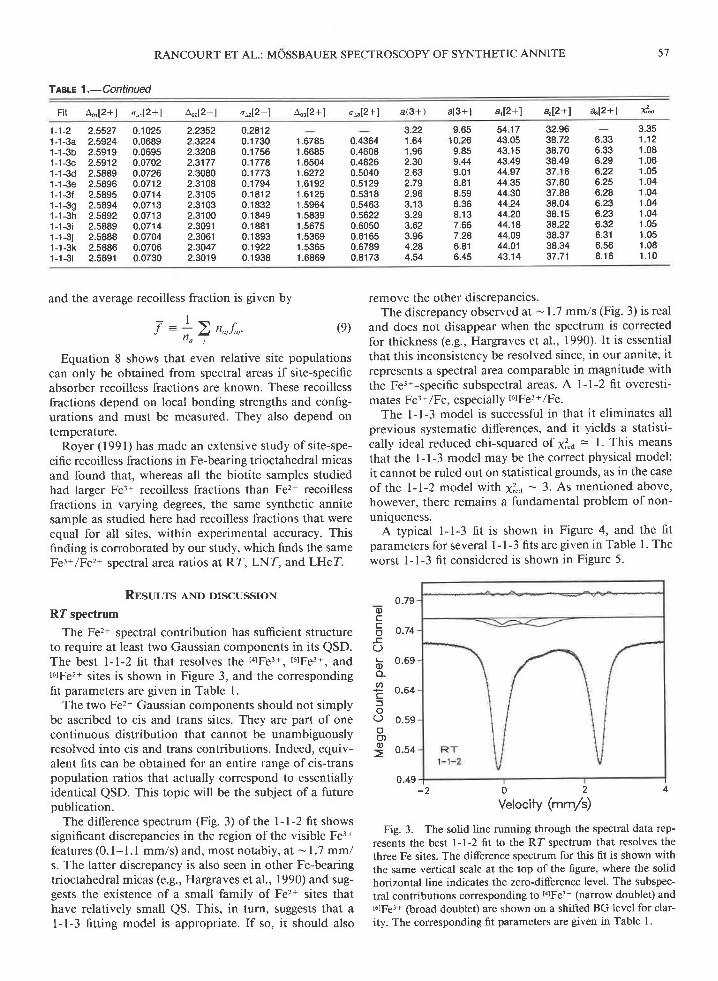
The 1-l-3 model is successful in that it eliminates allprevious systematic differences, and it yields a statisti-cally ideal reduced chi-squared of x3"a = l. Thrs meansthat the l-l-3 model may be the correct physical model:it cannot be ruled out on statistical grounds, as in the caseof the l-1-2 model with x?"o - 3.As mentioned above,however, there remains a fundamental problem of non-uniqueness.
A typical l-l-3 f,t is shown in Figure 4, and the fitparameters for several l-l-3 fits are given in Table l. Theworst l-l-3 fit considered is shown in Figure 5.
0.49- 2 0 2 4
Velocity (--/9
Fig. 3. The solid line running through the spectral data rep-resents the best l-l-2 fit to the RZ spectrum that resolves thethree Fe sites. The difference spectrum for this fit is shown withthe same vertical scale at the top of the figure, where the solidhorizontal line indicates the zero-difference level. The subspec-tral contributions corresponding to t4rFer+ (narrow doublet) and1olpsr+ (broad doublet) are shown on a shifted BG level for clar-ity. The corresponding fit parameters are given in Table l.
0.79(Dcf; o.t+_cO
b 0.6eo-
+ 0.64f,oo o.sgoo,E o.s4
58 RANCOURT ET AL.: MOSSBAUER SPECTROSCOPY OF SYNTHETIC ANNITE
TleLe 2. LNf spectrum fit parameters
7 BG A'., do(3+) 60[3+] 60[2+] d,[2+] Ao(3+) r^(3+) .\[3+] ro[3+]' t -1-2
1 -1 -3a1-1-3b1 -1 -3c1-1-3d1 -1 -3e
+0.0175+0 0128+0.0140+0.0158+0.0173+0.0181
0.2348 39272 182.33 0.38230.1990 392.95 183 62 0.37440.2037 392.97 183 86 0.37390.2104 393.00 184.24 0.37340.2157 393.02 184.54 0.37350.2184 393.04 184.75 0.3740
0.6521 1.20280.6015 1 .21 680.6055 1.21310.6128 1.20760.6217 1.20310.6288 1.2008
0.4739 0 0000 0.6560 0.40520.4574 0.0001 0.6531 0.42750.4601 0.0001 0.6553 0.40340.4655 0.0001 0.6572 0.36460.4723 0.0001 0.6581 0.32590.4776 0.0001 0.6582 0.2990
Note; symmetric elemental doublets are assumed (h.: h ) for all sites. Parameters 7,60, Ao, and qr are in millimeters per second. The (3+), [3+],and [2+] refer, respectively, to [4rFep+-, 1olpgs+-, dnd l6rFe,+-specific parameters. BG is in kilocounts. The total absorption area
(Eq.6) is in kilocounts times millimeters per second. Parameter6l (Eq. 4) is dimensionless. The site- and component-specific areas (a(3+), etc.) are inperoentages of Ab,. Except in the 1-1-2 fit, a(3+) and o,(3*) arefrozen parameters that are not adiusted in the fitting process.
3 N
A, .= "12722 2 p ,n rs i r6 , *=ar
The l-l-3 fits differ in the partitioning of the spectralarea among the three sites of interest. We illustrate thesetradeoffeffects by plotting t6lFe3+/Fe vs. t4lFe3+/Fe for ac-ceptable l-1-3 fits of the RZspectrum (Fig. 6). This figurealso shows the analogous tradeoffcurve for l-l-3 fits ofthe LNZ spectrum and the Fe,3;l constraint obtained fromboth the LHeZ spectra and the thickness-corrected RZspectrum, as explained below.
On both the RZ and LN?" trade-off curves shown inFigure 6, the 12 remains ideal within approximately 2 sdof its statistically predicted mean value for a correct fit-ting model.
As we move on these trade-offcurves, we also observesome trade-off between the Fei;l and the Fefil. For ex-ample, on the R?"curve we go from Fe3+/Fe : ll.9o/o atthe low ta1Fe3+ end to Fe3+/Fe : I l.0o/o at the high lalFs:+end (Table l). The LNZtrade-offcurve has a more con-strained behavior, with Fe3+/Fe varying between 11.25and 10.890/o (see below).
LNZ spectrum
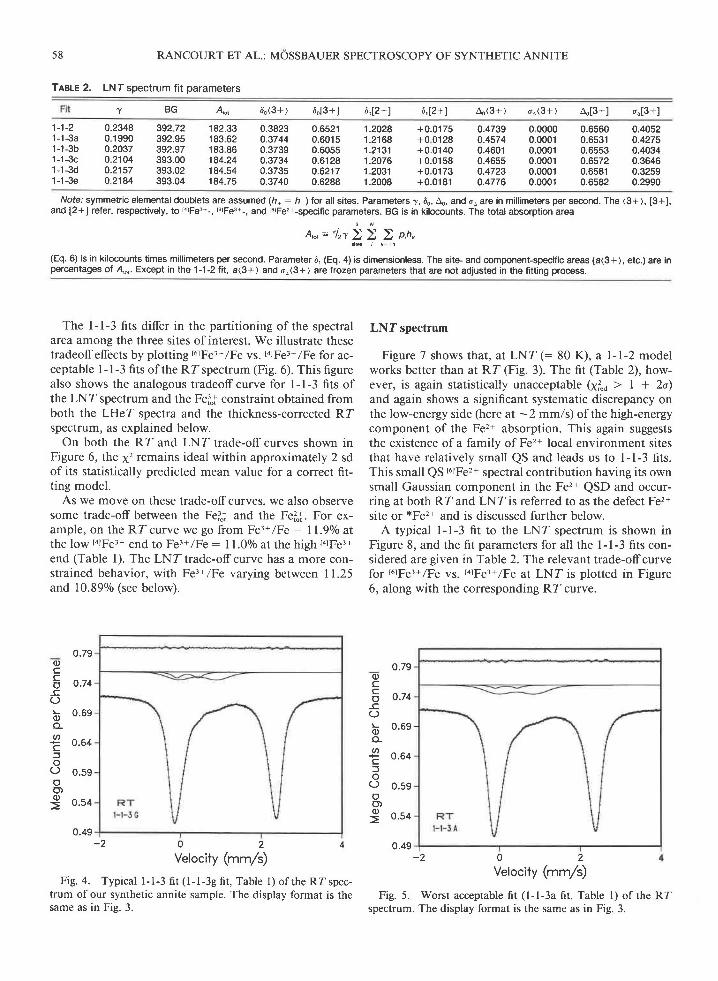
Figure 7 shows that, at LNZ(: 80 K), a l-l-2 modelworks better than at RZ (Fig. 3). The fit (Table 2), how-ever, is again statistically unacceptable (1lo > | + 2o)and again shows a significant systematic discrepancy onthe low-energy side (here at -2 mm/s) of the high-energycomponent of the Fe2* absorption. This again suggeststhe existence of a family of Fe2* local environment sitesthat have relatively small QS and leads us to l-l-3 fits.This small QS t0tpez+ spectral contribution having its ownsmall Gaussian component in the Fe'z+ QSD and occur-ring at both RZand LNZis referred to as the defect Fe2+site or *Fe2* and is discussed further below.
A typical l-l-3 fit to the LN?" spectrum is shown inFigure 8, and the fit parameters for all the l-l-3 fits con-sidered are given in Table 2. The relevant trade-offcurvefor {6lFe3+/Fe vs. talFe3+/Fe at LNT. is plotted in Figure6, along with the corresponding RZ curve.
q)cco
-c(JLq)
ov,co
oo,o
Q)cco_cc)
oo-a+cf
()
o,Q)
0.79
o.74
0.69
0.64
0.59
0.54
0.49- 2 0 2 4
Velocity (--/r)
Fig. 4. Typical 1-1-3 fit (l-l-3e fit, Table 1) of the RZspec-trum of our synthetic annite sample. The display format is thesame as in Fig. 3.
0.79
o.74
0.69
0.64
0.59
0.54
0.49- 2 0 2
Velocity (--/9
Fig. 5. Worst acceptable fit (l-l-3a fit, Table l) of thespectrum. The display format is the same as in Fig. 3.
RT

RANCOURT ET AL.: MOSSBAUER SPECTROSCOPY OF SYNTHETIC ANNITE
Taste 2.-Continued
Fit &,t2+l o,, [2+] Lo2I2+l o,,12+l ao3[2+] os[2+] a(3+ ) a[3+] a1l2+l a2[2+l a3l2+) ^ ,2
1-1-2 3.0012 0.12731-1-3a 3.0027 0.14941-1-3b 3.0055 0.14511-1-3c 3.0100 0.13821-1-3d 3.0142 0.13211-1-3e 3.0166 0.1287
2.74392.77032.77482.78302.78952.7931
0.20950.24150.2339o.22380.21560.21 13
2.61002.53552.39012.21322.0664
1.39651.47471.62451.80501.9606
4.002.723.133.784.414.83
57.4649.4648.9547.7346.5545.82
30.1 231.6932.7434.7336.5037.52
8.428.s38.027.236.486.00
1.347.59 0.977. ' t6 0.916.54 0.876.05 0.905.83 0.97
On examining these curves (Fig. 6) and the correspond-ing data (Tables I and 2\, we note that the LNZ curvegives a relatively narrow range of possible populationscompared with the range given by the RZ curve alone.This situation arises because the site-specific contribu-tions are better resolved in the LNZ spectrum. In partic-ular, the visible l+lps:+ sottl.ibution goes from being ashoulder at Rf (0.4 mm/s in Fie. 3) to being a distinctpeak at LNf (0.6 mm/s in Fig. 7).
We also note that if these RZand LNZtradeoffcurvesare plotted (not shown) in the full three-dimensional pop-ulation space of I6lFe2+ vs. I6lFe3+ and t4iFe3+, then theycontinue to be represented by line segments, and theseline segments come closest to intersecting at their larget4lFe3+ ends, where Fe3+/Fe = I1.00/0. This is in contrastto the plot of t6rFe3+/Fe vs. t4lFe3+/Fe, where the projec-tions of the true tradeoffcurves appear as almost parallelline segments.
This shows that, in the present application, combiningR?n and LNZresults leads to a unique solution. This so-lution is corroborated by the LHeI measurements andby an independent method that gives a measurement ofFe3*/Fe from a thickness-corrected spectrum.
The thickness-corrected R? spectrum
The RI spectrum was corrected for thickness usingprocedures that have been described elsewhere (Ran-court, 1989; Royer, 1991). In this way, the dimensionlessintrinsic absorber resonant cross section, oi(E), is ob-tained from the measured absorption spectrum by decon-voluting the transmission integral.
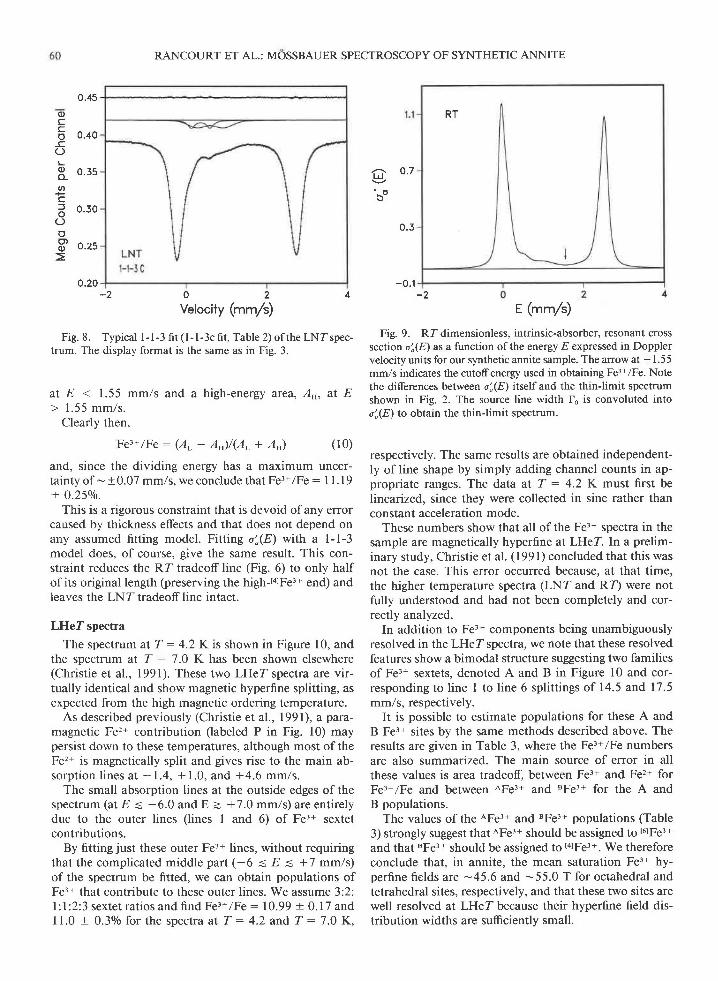
This cross section has an area of I d,Eo'"(E) : floolon,fand is free ofthe artifacts from (l) thickness effects and(2) source line width. This means that the spectral fea-tures in o'"(E) are much narrower than the correspondingfeatures in the absorption spectrum, by at least fo. Thisis seen in Figure 9, where the RZ o'"(E) is plotted.
Here we see that the visible Fe3+ contributions are muchmore resolved than in the raw data and that the high-energy Fe2* line is much sharper. The level at 1.55 mm/sis close to the zero-resonance BG level such that the crosssection can be clearly divided into two areas, irrespectiveof any fitting model. These are a low-energy area, AL,
0./t5
0.40
0.35
0.30
o.25
0.20- 2 0 2 4
Velocity (--/9
Fig. 7. The l-l-2 fit of the LNI spectrum of our syntheticannite sample. Corresponding fit parameters are given in Table2. The display format is the same as in Fig. 3.
qJ
+m
c.)
Iq)cco
-cc)Loo-ocfo
Ooo)o
lnlF.t* 7 o"
Fig. 6. Plots of I5lFe3+/Fe vs. I4rFe3+/Fe (both expressed inpercentages) from acceptable I - I -3 fits for both the R ?" spectrum(Table l) and the LNI spectrum (Table 2). The dashed linerepresents the Fe3+/Fe : 11.0olo constraint that is summarizedin Table 3. The two line segments (i.e., tradeoffcurves) are pro-jections onto the t6lFe3+-l4lFe3+ plane of the t6lFe3+-l4lFe3+-Fer+solution domains for R?'and LNZ. The value of Fe3+/Fe variescontinuously along each segment. See text for details.
occo
OLoo-o+cf
OoO)o)
0.45
0.40
0.35
0.30
o.25
0.20- 2 0 2 4
Velocity (--/")
Fig. 8. Typical 1 - I -3 fit ( l - l -3c fit, Table 2) of the LNl" spec-trum. The display format is the same as in Fig. 3.
at E < 1.55 mm/s and a high-energy area, Ar, at E> 1.55 mm/s.
Clearly then,
Fe3*/Fe : (A, - A)/(AL + AH) (10)
and, since the dividing energy has a maximum uncer-tainty of - -r 0.07 mm/s, we conclude that Fe3+/Fe : I l. I 9+ 0.25o/o.
This is a rigorous constraint that is devoid ofany errorcaused by thickness effects and that does not depend onany assumed fitting model. Fitting o',(E) with a l-l-3model does, of course, give the same result. This con-straint reduces the RZ tradeoff line (Fig. 6) to only halfof its original length (preserving the high-t+rpsr* end) andleaves the LNZtradeof line intact.
LHeZ spectra
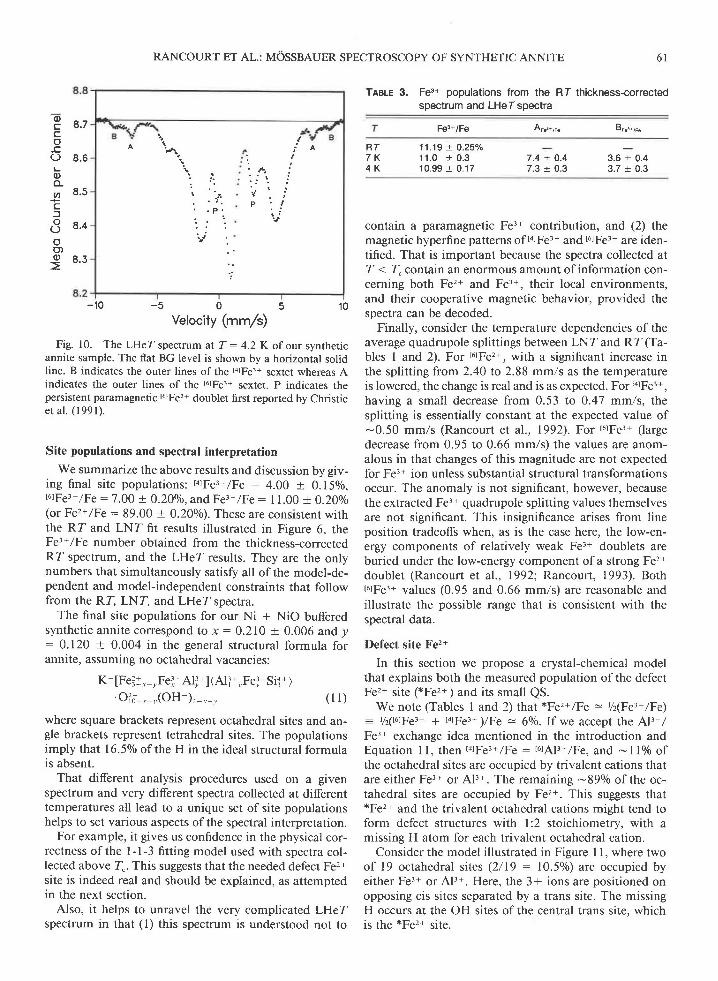
The spectrum at T : 4.2 K is shown in Figure 10, andthe spectrum at T : 7.0 K has been shown elsewhere(Christie et al., 1991). These two LHeZ spectra are vir-tually identical and show magnetic hyperfine splitting, asexpected from the high magnetic ordering temperature.
As described previously (Christie et al., l99l), apata-magnetic Fe'z* contribution (labeled P in Fig. l0) maypersist down to these temperatures, although most of theFe2+ is magnetically split and gives rise to the main ab-sorption l ines at -1.4, + 1.0, and +4.6 mm/s.
The small absorption lines at the outside edges of thespectrum (at E = -6.0 and E - +7.0 mm/s) are entirelydue to the outer lines (lines I and 6) of Fe3* sextetcontributions.
By fitting just these outer Fe3+ lines, without requiringthat the complicated middle part (-6 = E = +7 mm/s)of the spectrum be fitted, we can obtain populations ofFe3+ that contribute to these outer lines. We assume 3:2:l: l :2:3 sextet ratios and find Fe3+/Fe : 10.99 + 0. I 7 andI1.0 + 0.30/o for the spectra at T : 4.2 and T : 7.0 K,
RANCOURT ET AL.: MOSSBAUER SPECTROSCOPY OF SYNTHETIC ANNITE
o o'7
b"
0 .3
-0 .1-2
E (mmls)
Fig. 9. RI dimensionless, intrinsic-absorber, resonant crosssection o!(,8) as a function ofthe energy E expressed in Dopplervelocity units for our synthetic annite sample. The arrow at * 1.55mm/s indicates the cutoffenergy used in obtaining Fe3*/Fe. Notethe differences between oi(E) itself and the thinlimit spectnrmshown in Fig. 2. The source line width fo is convoluted intoo'.(E) to obtain the thinlimit spectrum.
respectively. The same results are obtained independent-ly of line shape by simply adding channel counts in ap-propriate ranges. The data at T : 4.2 K must first belinearized, since they were collected in sine rather thanconstant acceleration mode.
These numbers show that all of the Fe3* spectra in thesample are magnetically hyperfine atLHeT. In a prelim-inary study, Christie et al. (1991) concluded that this wasnot the case. This error occured because, at that time,the higher temperature spectra (LN?" and RT) were notfully understood and had not been completely and cor-rectly analyzed.
In addition to Fe3 | components being unambiguouslyresolved in the LHeI spectra, we note that these resolvedfeatures show a bimodal structure suggesting two familiesof Fe3* sextets, denoted A and B in Figure 10 and cor-responding to line I to line 6 splittings of 14.5 and 17.5mm/s, respectively.
It is possible to estimate populations for these A andB Fe3+ sites by the same methods described above. Theresults are given in Table 3, where the Fe3*/Fe numbersare also summarized. The main source of error in allthese values is area tradeofr between Fe3+ and Fe2* forFe3*/Fe and between AFe3* and BFe3+ Ibr the A andB populations.
The values of the AFe3+ and BFe3* populations (Table3) strongly suggest that AFe3+ should be assigned to l6lFer+
and that BFe3* should be assigned to talFe3+. We thereforeconclude that, in annite, the mean saturation Fe3+ hy-perfine fields are -45.6 and -55.0 T for octahedral andtetrahedral sites, respectively, and that these two sites arewell resolved at LHIT because their hyperfine field dis-tribution widths are sufficiently small.
RT
? ' .
. . t :' . P .
. . i
t
' . !
' + .. . . :{ ;P r
A
RANCOURT ET AL.: MOSSBAUER SPECTROSCOPY OF SYNTHETIC ANNITE 61
TABLE 3. Fe3+ populations from the Rf thickness-correctedspectrum and LHef spectra
Fes* lFe Be".*76"P a.7cos() 8.6t-oo-r,l 8.5
+cf
8 8.4oC')g 8'3
- 1 0 - t , 0 5 1 0Velocity (--/9
Fig. 10. The LHeT spectrum at T : 4.2 K of our syntheticannite sample. The flat BG level is shown by a horizontal solidline. B indicates the outer lines of the latFer+ sextet whereas Aindicates the outer lines of the t6rFer+ sextet. P indicates thepersistent paramagnetic t6rFer+ doublet first reported by Christieet a l . (1991).
Site populations and spectral interpretation
We summarize the above results and discussion by giv-ing final site populations: t41Fe3+/Fe : 4.00 + 0. l5ol0,t61Fe3+/Fe : 7.00 + 0.20o/o, and Fe3*/Fe : I 1.00 + 0.20o/o(or Fe2+/Fe : 89.00 + 0.20o/o). These are consistent withthe RI and LN?" fit results illustrated in Figure 6, theFe3+/Fe number obtained from the thickness-correctedR7" spectrum, and the LHeI results. They are the onlynumbers that simultaneously satisfy all of the model-de-pendent and model-independent constraints that followfrom the RZ, LNZ, and LHeI spectra.
The final site populations for our Ni + NiO bufferedsynthetic annite correspond to x : 0.210 + 0.006 and /: 0.120 + 0.004 in the general structural formula forannite, assuming no octahedral vacancies:
K* [Fe]1_, "Fel* All*l (Alll
"Fej*Sij * )
'OI;,*,,(OH ),-_,-, (l l)
where square brackets represent octahedral sites and an-gle brackets represent tetrahedral sites. The populationsimply that 16.50/o of the H in the ideal structural formulais absent.
That different analysis procedures used on a givenspectrum and very different spectra collected at differenttemperatures all lead to a unique set of site populationshelps to set various aspects ofthe spectral interpretation.
For example, it gives us confidence in the physical cor-rectness of the l-l-3 fitting model used with spectra col-lected above 2.. This suggests that the needed defect Fe2+site is indeed real and should be explained, as attemptedin the next section.
Also, it helps to unravel the very complicated LHeIspectrum in that (l) this spectrum is understood not to
3.6 + 0.43.7 + 0.3
contain a paramagnetic Fe3* contribution, and (2) themagnetic hyperfine patterns of talFe3+ and I6lFe3+ are iden-tified. That is important because the spectra collected atT < T.contain an enonnous amount of information con-cerning both Fe2* and Fe3*, their local environments,and their cooperative magnetic behavior, provided thespectra can be decoded.
Finally, consider the temperature dependencies of theaverage quadrupole splittings between LNIand R7"(Ta-bles I and 2). For t6lFe2+, with a significant increase rnthe splitting from 2.40 to 2.88 mm/s as the temperatureis lowered, the change is real and is as expected. For [alFes*,having a small decrease from 0.53 to 0.47 mm/s, thesplitting is essentially constant at the expected value of-0.50 mm/s (Rancourt et al., 1992). For t6lFe3+ (largedecrease from 0.95 to 0.66 mm/s) the values are anom-alous in that changes ofthis magnitude are not expectedfor Fe3+ ion unless substantial structural transformationsoccur. The anomaly is not significant, however, becausethe extracted Fe3* quadrupole splitting values themselvesare not significant. This insignificance arises from lineposition tradeoffs when, as is the case here, the low-en-ergy components of relatively weak Fe3+ doublets areburied under the low-energy component of a strong Fe2+doublet (Rancourt eI al., 1992; Rancourt, 1993). Botht6lFe3+ values (0.95 and 0.66 mm/s) are reasonable andillustrate the possible range that is consistent with thespectral data.
Defect site Fe2+
In this section we propose a crystal-chemical modelthat explains both the measured population of the defectFe2+ site (*Fe,*; and its small QS.
We note (Tables I and 2) that *Fe2*/Fe = Vz(Fe3* /Fe): 72(r6lFe3+ + t4lFe3+ )/Fe = 60/0. lf we accept the Al3*/Fe3* exchange idea mentioned in the introduction andEquation 11, then t4lFer+/Fe: t61Al3+/Fe, and -l l0lo ofthe octahedral sites are occupied by trivalent cations thatare either Fe3* or Al3+. The remaining -890/o of the oc-tahedral sites are occupied by Fe2*. This suggests thatxFe2* and the trivalent octahedral cations might tend toform defect structures with l:2 stoichiometry, with amissing H atom for each trivalent octahedral cation.
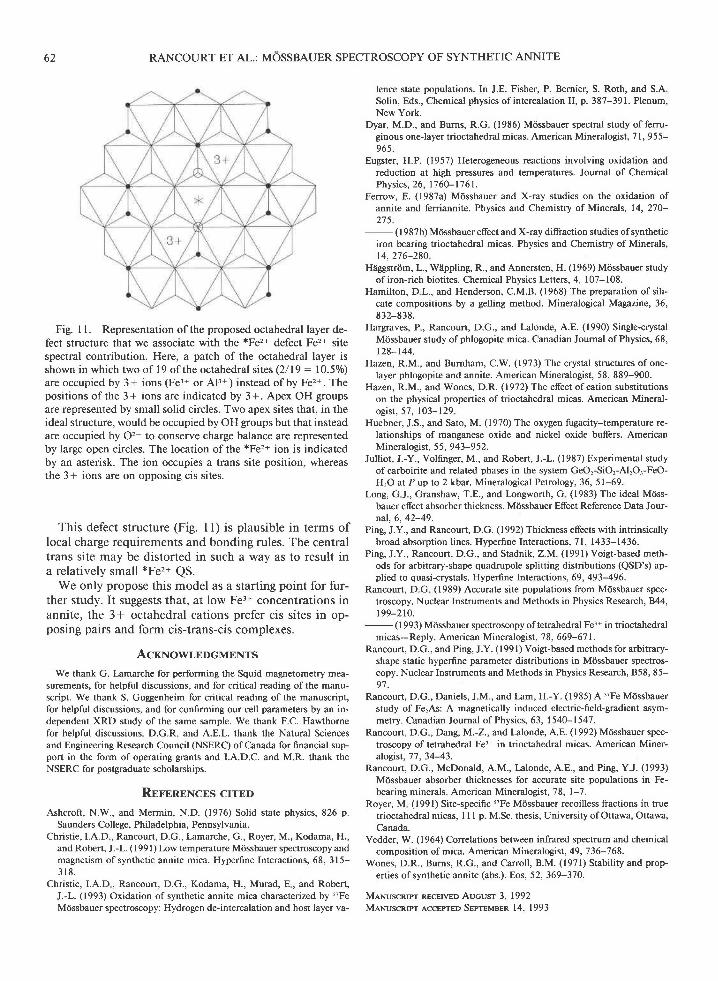
Consider the model illustrated in Figure I I, where twoof 19 octahedral sites (2/19 : 10.50/o) are occupied byeither Fe3* or Al3+. Here, the 3+ ions are positioned onopposing cis sites separated by a trans site. The missingH occurs at the OH sites of the central trans site, whichis the *Fe2* site.
R T7 K4 K
11.19 + O.25k11.0 + 0 .310.99 + 0 .17
7.4 + O.47.3 + 0.3
62 RANCOURT ET AL.: MOSSBAUER SPECTROSCOPY OF SYNTHETIC ANNITE
Fig. I l. Representation ofthe proposed octahedral layer de-fect structure that we associate with the *Fe'?* defect Fe'?* sitespectral contribution. Here, a patch of the octahedral layer isshown in which two of 19 of the octahedral sites (2/19 : 10.50/o)are occupied by 3+ ions (Fe3+ or AF* ) instead ofby Fe'?t. Thepositions of the 3+ ions are indicated by 3+. Apex OH groupsare represented by small solid circles. Two apex sites that, in theideal structure, would be occupied by OH groups but that insteadare occupied by O'? to conserve charge balance are representedby large open circles. The location ofthe *Fet* ion is indicatedby an asterisk. The ion occupies a trans site position, whereasthe 3+ ions are on opposing cis sites.
This defect structure (Fig. 1l) is plausible in terms oflocal charge requirements and bonding rules. The centraltrans site may be distorted in such a way as to result ina relatively small *Fe'z* QS.
We only propose this model as a starting point for fur-ther study. It suggests that, at low Fe3* concentrations inannite, the 3+ octahedral cations prefer cis sites in op-posing pairs and form cis-trans-cis complexes.
Acxnowr-nncMENTs
We thank G. Lamarche for performing the Squid magnetometry mea-surements, for helpful discussions, and for critical reading of the manu-script. We thank S. Guggenheim for critical reading of the manuscript,for helpful discussions, and for confirming our cell parameters by an in-dependent XRD study of the same sample. We thank F.C. Hawthornefor helpful discussions. D.G.R and A.E.L. thank the Natural Sciencesand Engineering Research Council (NSERC) of Canada for financial sup-port in the form of operating grants and I.A.D.C. and M.R. thank theNSERC for postgraduate scholarships.
RprnnBNcns crrED
Ashcroft, N.W., and Mermin, N.D. (1976) Solid state physics, 826 p.Saunders College, Philadelphia, Pennsylvania.
Christie, LA.D , Rancourt, D.G., I-amarche, G., Royer, M., Kodama, H.,and Robert, J.-L. (l 99 1) Low temperature Maissbauer spectroscopy andmagnetism ofsynthetic annite mica. Hyperfine Interactions, 68, 315-3 1 8 .
Christie, I.A.D, Rancoun, D.G., Kodama, H., Murad, E, and Robert,J.-L. (1993) Oxidation of synthetic annite mica characterized by sTFe
Mbssbauer spectroscopy: Hydrogen de-intercalation and host layer va-
lence state populations. In J.E. Fisher, P. Bernier, S. Roth, and S.ASolin, Eds., Chemical physics ofintercalation II, p. 387-391. Plenum,New York.
Dyar, M.D., and Burns, R.G (1986) Miissbauer spectral study of femr-ginous oneJayer trioctahedral micas American Mineralogist, 7 l, 9 55-96s.
Eugster, H.P. (1957) Heterogeneous reactions involving oxidation andreduction at high pressures and temperatures. Journal of ChemicalPhysics, 26, 1760-1761.
Ferrow, E. (1987a) Miissbauer and X-ray studies on the oxidation ofannite and ferriannite. Physics and Chemistry of Minerals, 14, 270-27 5 .
- (l 987b) Mdssbauer effect and X-ray diffraction studies ofsyntheticiron bearing trioctahedral micas. Physics and Chemistry of Minerals,r4,276-280
Heggstriim, L., Wnppling, R., and Annersten, H. (1969) Mdssbauer studyofiron-rich biotites. Chemical Physics l€tters, 4, 107-108.
Hamilton, D L., and Henderson, C.M.B. (1968) The preparation of sili-cate compositions by a gelling method. Mineralogical Magazine, 36,832-838.
Hargraves, P, Rancoun, D.G., and Lalonde, A.E. (1990) Single-crystalMiissbauer study ofphlogopite mica. Canadian Journal ofPhysics, 68,t28-144.
Hazen, R.M., and Bumham, C.W. (1973) The crystal structures of one-layer phlogopite and annite. American Mineralogist, 58, 889-900.
Hazen, R.M., and Wones, D.R. (1972) The efect of cation substitutionson the physical properties of trioctahedral micas. American Mineral-ogist,57, lO3-129
Huebner, J.S., and Sato, M. (1970) The oxygen fugacity-temperature re-lationships of manganese oxide and nickel oxide buffers. AmericanMineralogist, 55, 943-952.
Julliot, J.-Y., Volfinger, M., and Robert, J.-L. (1987) Experimental studyof carboirite and related phases in the system GeO,-SiOr-A!O,-FeO-HrO at P up to 2 kbar. Mineralogical Petrology, 36,51-69.
Long, G J., Granshaw, T.E., and Longworth, G (1983) The ideal Miiss-bauer effect absorber thickness. Miissbauer Effect Reference Data Jour-nal .6.42-49.
Ping, J.Y., and Rancourt, D.G. (1992) Thickness effects with intrinsicallybroad absorption lines. Hyperfrne Interactions, 71, 1433-1436.
Ping, J.Y., Rancourt, D.G., and Stadnik, Z.M. (1991) Voigt-based meth-ods for arbitrary-shape quadrupole splitting distributions (QSD's) ap-plied to quasi-crystals. Hyperfine Interactions, 69, 493-496.
Rancourt, D.G (1989) Accurate site populations from Mdssbauer spec-troscopy. Nuclear Instruments and Methods in Physics Research, 844,t99-21O.
- (l 993) Mdssbauer spectroscopy oftetrahedral Fer* in trioctahedralmicas-Reply. American Mineralogist, 7 8, 669-67 l.
Rancourt, D.G., and Ping, J.Y. (1991) Voigt-based methods for arbitrary-shape static hyperfine parameter distributions in Mtissbauer spectros-copy. Nuclear Instruments and Methods in Physics Research, B58, 85-97 .
Rancourt, D.G., Daniels, J.M., and lam, H.-Y. (1985) A 5'Fe Mdssbauerstudy of FerAs: A magnetically induced electric-field-gradient asym-metry. Canadian Journal of Physics, 63, I 540-1 547.
Rancourt, D.G., Dang, M.-2., and lalonde, A.E. (1992) Mdssbauer spec-troscopy of tetrahedral Fe3* in trioctahedral micas. American Miner-alog;st,77 , 34-43.
Rancourt, D.G., McDonald, A.M., Ialonde, A.E., and Pine, Y.J. (1993)Miissbauer absorber thicknesses for accurate site populations in Fe-bearing minerals American Mineralogist, 78, l-7.
Royer, M (t991) Site-specific 57Fe Mdssbauer recoilless fractions in truetrioctahedral micas, I I I p. M.Sc. thesis, University of Ottawa, Ottawa,Canada.
Vedder, W. (1964) Correlations between infrared spectrum and chemicalcomposition of mica. American Mineralogist, 49,736-768.
Wones, D.R., Burns, R.G., and Carroll, B.M. (1971) Stability and prop-erties of synthetic annite (abs.). Eos, 52, 369-37O.
MeNuscnrm REcETVED Aucusr 3, 1992MeNuscnrvr AccEmD Srprei"rsen 14, 1993