determinants of anthropometric measurement use amongst dietitians… › download › pdf ›...
TRANSCRIPT

- 1 -
DETERMINANTS OF ANTHROPOMETRIC MEASUREMENT USE AMONGST DIETITIANS.
A thesis submitted by Laura Mash (RD)
0200644
In partial fulfilment of the requirements for the degree of:
Masters of Science Nutrition and Dietetics (BI7038)
University of Chester
Submission: 1: November 2010
Word Count: 17,155

- 2 -
ACKNOWLEDGEMENTS
I wish to acknowledge and thank all participants for their time and efforts, without their
contribution this research would not have been possible.
I would also like to thank my work colleagues and friends for their support and
understanding.
My supervisor, Dr Eva Almiron-Roig, has been an inspiration and excellent support
throughout the whole project – thank you - I hope to have done you proud.
And, of course, to Stephen. Thank you for being you.
- 3 -
ABSTRACT
Background: Nutritional assessment, including the measurement and interpretation
of anthropometric data, is a pivotal part of the dietitian’s role. However, the extent to
which dietitians use anthropometry in their day-to-day activities is poorly documented.
Anecdotal evidence suggests that this is below ideal levels. Attitudes and perceived
barriers towards the use of anthropometry may further differ by work setting and
patient group (e.g. between acute and community-based dietitians). In order to
evaluate factors influencing the use of anthropometry amongst dietitians, sensitive,
validated tools are needed. Visual analogue scales (VAS) are easily used and
interpreted, but have not been validated for assessing confidence levels, in particular
when taking body measurements.
Aims: This study investigated the use of, and barriers/attitudes towards taking
anthropometric measurements amongst dietitians using a cross-sectional survey.
For this, a new type of confidence scale (VAS-based) was validated against two
other commonly used scales (the Likert and the general-labelled magnitude scale,
gLMS).
Design and procedure: A pre-piloted questionnaire including confidence scales and
attitudinal scales was sent to all NHS dietitians in the North West of England between
March-April 2010. The pilot sample (n=32) rated their perceived confidence at taking
various anthropometric measures using VAS, Likert and gLMS scales on 2 separate
occasions, with scale order randomised.

- 4 -
Results: ANOVA and Bland-Altman plot tests indicated VAS to be as sensitive and
as reproducible as Likert; VAS also had greater level of agreement with Likert than
gLMS, therefore VAS were chosen for the final questionnaire. Of the 397
questionnaires posted, 213 (54%) were returned. Highest confidence ratings were
for BMI, height and weight, and lowest for BodPod and head circumference
measurements. Average confidence scores across all measurements were lower for
community dietitians compared with acute dietitians (mean + SEM scores for
community: 54.21 + 14.78 mm; vs. acute: 60.27 + 12.11 mm; p<0.05). The majority of
anthropometric measures were reported to be taken on an infrequent basis
(‘Never’/’Less than monthly’). Height, weight and BMI were the most commonly used.
Significantly more acute than community dietitians used ‘estimated’ (50% vs. 11.3%)
and ‘recalled’ weight (50% vs. 11.4%) on a daily basis. The most common barriers
against taking measurements were ‘Not appropriate for patient’, ‘Lack of equipment’
and ‘Time/work load constraints’. Significantly more acute responders reported ‘Time’
(81.4%, α=0.003) and ‘Confidence’ (75.5%, α=0.05) to be barriers to anthropometry
use. Beyond half of the sample (61%) would attend future training, primarily to
increase confidence and competency.
Conclusions: Regardless of the importance/reported benefits of anthropometry, it is
performed to a very limited degree by dietitians in the North West and is often limited
to estimates, BMI, heights and weights. There are numerous barriers to
anthropometry use for acute and community dietitians, namely time, equipment and
confidence. It may therefore be unrealistic to expect many anthropometric measures
to be taken and training should be adapted to reflect the reality of practice. This study
also supports the use of VAS scales when assessing dietitians’ confidence at taking
anthropometric measurements as a sensitive and reliable tool compared to the more
widely used, however less sensitive, Likert scales.

- 5 -
DECLARATION OF ORIGINAL WORK
“I hereby declare that work contained herewith is original and is entirely my own work
(unless indicated otherwise). It has not been previously submitted in support of a
Degree, qualification or other course.”
Signed:………………………………………………………………………………..
Name:…………………………………………………………………………………
Date:……………………………………………………………………………………………

- 6 -
CONTENTS
1. INTRODUCTION ………………………………………………………………………12 1.1. Background……………………………………………………...…………….12
1.1.1. BMI…………………………………………………………………..18
1.1.2. WC and WHR………………………………………………………19
1.1.3. Research gap ………………………………………………………20
1.1.3.1. Attitudinal scales…………………………………………21
1.2. Aims and objectives……….…………………………………………………..24
1.3. Hypotheses…………………………………………………………………….25
2. METHODS ……………………………………………………………………………...26 2.1. Study design…………………………………………………………………...26
2.1.1. Design and validation of the questionnaire……………………... 26
2.2. Population and sample……………………………….……………………….29
2.3. Procedures: Questionnaire administration…...…………………………..…32
2.4. Data management and statistical analysis..………………………………..35
2.5. Ethical and cost implications…………………………………………………37
3. RESULTS ……………………………………………………………………………….39 3.1. Pilot study ……..……………………………………………………………… 39
3.2. Validation study: Scales to assess confidence…………...………… …….40
3.2.1. Sensitivity……………………………………………………………40
3.2.1.1. Measures of agreement………………………………...41
3.2.2. Reproducibility………………………………………………………46
3.3. Main study……………………………………………………………………...49
3.3.1. Sample demographics…….……………………………...……..…49
3.3.2. Nutritional screening tools…………………………………………57
3.2.3. Perceived confidence……………………………………………...59
3.2.4. Frequency of use…………………………………………………...62
3.2.5. Perceived barriers………………………………………………….67
3.2.6. Attitudes towards anthropometry………………………………….70
3.2.7. Training………………………………………………………………72
3.2.7.1. Training received…………………...…………………...72
3.2.7.2. Future training……………………...…………………... 74
4. DISCUSSION …………………………………………………………………………..77 4.1. Summary of findings………..…………………………………………………77
4.2. Validation study discussion……………………...……………………… .....79
4.3. Main study discussion…………………………………………………………81

- 7 -
4.3.1. Response rate………………………………………………………81
4.3.2. Sample demographics……………………………………………..81
4.3.3. Screening tool use………………………………………………….84
4.3.4. Barriers and confidence towards anthropometry………………..84
4.3.5. Frequency of use…………………………………………………...90
4.3.6. Attitudes towards anthropometry………………………………….91
4.3.7. Training………………………………………………………………92
4.4. Study strengths and limitations………………………………………………95
4.5. Implications for practice……………………………………………………….98
4.6. Future research possibilities………………………………………………...100
5. CONCLUSIONS……………………………………………………………………… 101 6. REFERENCES ……..………………………………………………………………….103 7. APPENDICES ..………………………………………………………………………..113 7.1. Appendix 1: Questionnaires:
- Pilot study questionnaire with validation questions
- Validation questionnaire: scales to assess confidence booklet
- Main study questionnaire, with cover letter and PIS.
7.2. Appendix 2: Ethics:
- University of Chester Research Ethics Committee letter
- NRES and IRAS exemption letter
- Letter of consent from SRFT manager
7.3. Appendix 3: Dietetic Departments:
- List of all NHS trusts within North West of England
- Telephone script
- 8 -
LIST OF FIGURES
Figure 1: Study design time line ......................................................................................... 28
Figure 2: Means (+2 SEM) for VAS, Likert and gLMS scales used to assess perceived
confidence at taking all anthropometric measurements (n = 32) ........................... 41
Figure 3: Mean differences against average confidence, measured with Likert and VAS
scales ............................................................................................................................ 45
Figure 4: Mean differences against average confidence, measured with Likert and
gLMS scales ................................................................................................................. 45
Figure 5: Difference against average confidence scores measured by Likert scales
(n = 32) .......................................................................................................................... 47
Figure 6: Difference against average confidence scores measured by VAS scales
(n = 32) .......................................................................................................................... 47
Figure 7: Difference against average confidence scores measured by gLMS scales
(n = 32) .......................................................................................................................... 48
Figure 8: Proportion of dietitians by main area of work for the study sample (n = 213)
....................................................................................................................................... 50
Figure 9: Gender distribution of dietitians by area of work (n = 212) ............................. 50
Figure 10: Percentage of dietitians for years qualified by area of work (n = 213) ......... 52
Figure 11: Percentage of dietitians for grade/banding by area of work (n = 213) ......... 53
Figure 12: Percentage of dietitians for number of hours employed by area of work
(n = 213) ........................................................................................................................ 54
Figure 13: The 6 most prevalently chosen sub-areas of worka for the study sample
(n=213) .......................................................................................................................... 55
Figure 14: Number of responses for sub-area of worka for acute and community
dietitians for the study sample (n = 213) ................................................................... 56
Figure 15: Average confidence scores when taking anthropometric measurements by
area of work (n = 206) .................................................................................................. 61
Figure 16: Percentage of dietitians for frequency of anthropometric use for all
measurements by area of work (n = 210) .................................................................. 62

- 9 -
Figure 17: Percentage of acute dietitians for ‘Daily’ anthropometry use (n = 140) ....... 63
Figure 18: Percentage of community dietitians for ‘Daily’ anthropometry use (n = 73)…
....................................................................................................................................... 64
Figure 19: Percentage of dietitians for anthropometry ‘Never’ used by area of work (n
= 210) ............................................................................................................................ 65
Figure 20: Percentage of frequency of use for ‘Estimated weight’ by area of work
(n = 210) ........................................................................................................................ 66
Figure 21: Percentage of frequency of use for ‘Recalled weight’ by area of work
(n = 210) ........................................................................................................................ 67
Figure 22: Distribution of attitude scores towards anthropometry for the study sample
(n = 205) ........................................................................................................................ 70
Figure 23: Comparison of mean attitude scores towards anthropometry use by acute
and community dietitians (n = 205) ........................................................................... 71
Figure 24: Percentage of dietitians for each location of receiving training by area of
work (n =212) ............................................................................................................. 74
Figure 25: Percentage of dietitians indicating interest/decline for future training by
area of work (n =209) ................................................................................................... 75

- 10 -
LIST OF TABLES
Table 1: Consequences of malnutrition ............................................................................ 14
Table 2: A brief list of nutritional screening tools and anthropometric measurements
involved ....................................................................................................................... 16
Table 3: Names of Trust and number of questionnaires posted per department ......... 31
Table 4: Mean differences and averages of confidence scores for VAS, Likert and
gLMS scales used to assess perceived confidence at taking anthropometric
measurements (n = 32) ............................................................................................... 44
Table 5: Count and percentage of years qualified for the study sample (n = 213) ....... 51
Table 6: Comparison of nutritional screening tools employed by acute and community
dietitians (n = 213) ....................................................................................................... 58
Table 7: Mean and SEM of perceived confidence scores (100mm VAS) for taking
various anthropometric measurements for the study sample and by area of work
(n = 206) ........................................................................................................................ 60
Table 8: Perceived barriers of anthropometric use by acute and community dietitians
(n = 213) ........................................................................................................................ 68
- 11 -
LIST OF ABBREVIATIONS
ANOVA - Analysis of Variance
BAPEN - British Association of Parenteral and Enteral Nutrition
BMI - Body Mass Index
CVD- Cardiovascular Disease
DEXA - Dual Energy X-ray Absorptiometry
DoH - Department of Health
gLMS - General labeled magnitude scale
H0 - Null hypothesis
H1 – Alternative hypothesis
HPC - Health Professions Council
IRAS - Integrated Research Application System
LMS – Labeled Magnitude Scale
MAC - Mid Arm Circumference
MAG – Malnutrition Advisory Group
MNA - Mini Nutritional Assessment
MUAMC - Mid Upper Arm Muscle Circumference
‘MUST' - Malnutrition Universal Screening Tool
NHS - National Health Service
NICE - National Institute for Health and Clinical Excellence
NIH -National Institution for Health
NPSA - National Patient Safety Agency
NRES - National Research Ethic Service
NRI - Nutritional Risk Index
PCT - Primary Care Trust
PENG - Parenteral and Enteral Nutrition Group
PNI - Prognostic Nutritional Index
SGA - Subjective Global Assessment
UK - United Kingdom
VAS - Visual Analogue Scale
WC - Waist Circumference
WHO - World Health Organisation
WHR - Waist to Hip Ratio

- 12 -
1. INTRODUCTION
1.1. Background
A fundamental component of the practice of a dietitian is the assessment of
nutritional status and associated risks. There is no one standard way of assessing
nutritional status, but the process typically involves the consideration and
interpretation of physiological requirements, nutritional intake, body composition and
function, as nutritional status is not a static entity (Thomas & Bishop, 2007).
Methods and parameters investigated will vary according to individual
circumstances (Charney, 1995 cited in Thomas & Bishop, 2007) and may need to
include: clinical, physical, dietary, anthropometric and biochemical and/or
haematological considerations (Baxter, 1999).
Anthropometry is the study/assessment of body composition in living people and
indicates health and nutritional status. It is used to predict performance, health and
survival (World Health Organisation [WHO], 1995; Thomas & Bishop, 2007).
Anthropometric measurements can be used to detect moderate and severe forms of
malnutrition (both under and over nutrition), and are of particular use when chronic
protein and energy imbalances have occurred – although cannot identify specific
nutrient deficiencies (Gibson, 2005). Both under- and over-nutrition carry significant
health implications (discussed later) and increase the risk of morbidities and
mortality, thus costs. Hence, early detection and regular monitoring of patients’
nutritional status is a necessity.

- 13 -
Methods of assessing body composition in population studies were recognised as
possible means of assessing and monitoring nutritional statuses approximately 50
years ago, by Fletcher in 1962, and subsequently recommended for use within the
clinical setting (Blackburn, 1977 cited in Bastow, 1982).
Types of anthropometric measurements include weight and height, and as a result
Body Mass Index (BMI) (kg/m2) can be calculated, as well as head circumference
(cm) and supine length (cm) in infants – all of which are used to assess body size.
Body composition, which can be further subdivided to measure the two major
components of body mass (body fat and fat free mass), can be measured by using
anthropometric measurements such as skinfold thickness, waist-to-hip ratio (WHR),
waist circumference (WC), mid-upper arm circumference (MAC) and mid-upper arm
muscle circumference (MUAMC) (Gibson, 2005).
When standardised methods (Lohman & Roche, 1988) and calibrated equipment
are implemented measurements are often quick, easy and reliable (Gibson, 2005).
Technological advancements allow the use of portable more scientific and accurate
equipment. Anthropometry is said to be the single most portable, universally
applicable, inexpensive and non-invasive method available to assess the
proportions, size and composition of the human body (Gibson, 2005).
Although there is no universally accepted definition, malnutrition is literally
interpreted as, and used synonymously with, ‘bad nutrition’. The Malnutrition
Advisory Group (MAG), a standing committee for the British Association for
Parenteral and Enteral Nutrition (BAPEN), have suggested a definition of
malnutrition as follows:

- 14 -
“A state of nutrition in which a deficiency, excess or imbalance of energy,
protein, and other nutrients causes measurable adverse effects on tissue
(shape, size, composition), function and clinical outcome” (BAPEN, 2003).
The adverse consequences of malnutrition are well documented, and are becoming
increasingly publicised, perhaps linked to the now known associated costs of the
condition. According to BAPEN (2008a) the costs associated with malnutrition, in
the United Kingdom (UK), exceeded £13 billion in 2007. Whatever the cause of
malnutrition, be it social, physical, psychological or medical, consequences of
malnutrition can be severe (table 1).
Table 1: Consequences of malnutrition (Thomas & Bishop, 2007)
General and specific consequences
Physical Impaired immune function
Increased susceptibility to infection
Delayed wound healing
Muscle wasting
Reduced respiratory function – increasing susceptibility to
chest infections
Reduced cardiac function – increasing risk of heart failure
Decreased muscle strength
Reduced mobility – reducing independence and increasing
risk of falls, thus fractures, bed sores and thromboembolism
Small intestine structure altered – may affect absorption
Increased post-operative complications
Psychological Apathy – increasing low morale and general sense of
weakness and illness affecting appetite further
Depression
Societal Increased visits to health care professionals
Increased dependency on nursing care
Increased length of stay
Increased costs

- 15 -
Ultimately, prolonged and chronic malnutrition can be life threatening (National
Institute for Health and Clinical Excellence [NICE], 2006). BAPEN’s Combating
Malnutrition: Recommendations for Action (2008a) report discussed the
socioeconomic and health inequalities links with malnutrition. In the UK three million
people are in a state of, or are at risk of, malnutrition. Approximately 93% of which
are resident in the community. Previous research, and indeed media focus, seemed
to highlight the malnourished population in hospital or acute environments. Although,
as BAPEN (2008a) encourages, all settings must be vigilant towards malnutrition.
Nutritional screening is used to identify those at nutritional risk or in need of
intervention. It can be applied on mass as it involves the use of simple and cheap
measurements. These measurements are compared with predetermined cut-off
points in order to categorize the patient’s level of malnutrition risk; often categories
such as low, medium or high risk are used (Gibson, 2005). Many nutritional
screening tools exist, most of which include at least one anthropometric measure
(see table 2). Validated nutrition screening tool use is encouraged by the National
Patient Safety Agency (NPSA), the National Institute for Health and Clinical
Excellence (NICE) and the Department of Health (DoH). However, according to
BAPEN (2008b) hospitals, care homes and primary care settings are failing to
screen all patients, with only 82% of hospitals (n = 130) having nutrition screening
policies to comply with. Consequently, malnutrition remains under-detected and
hence under-treated.
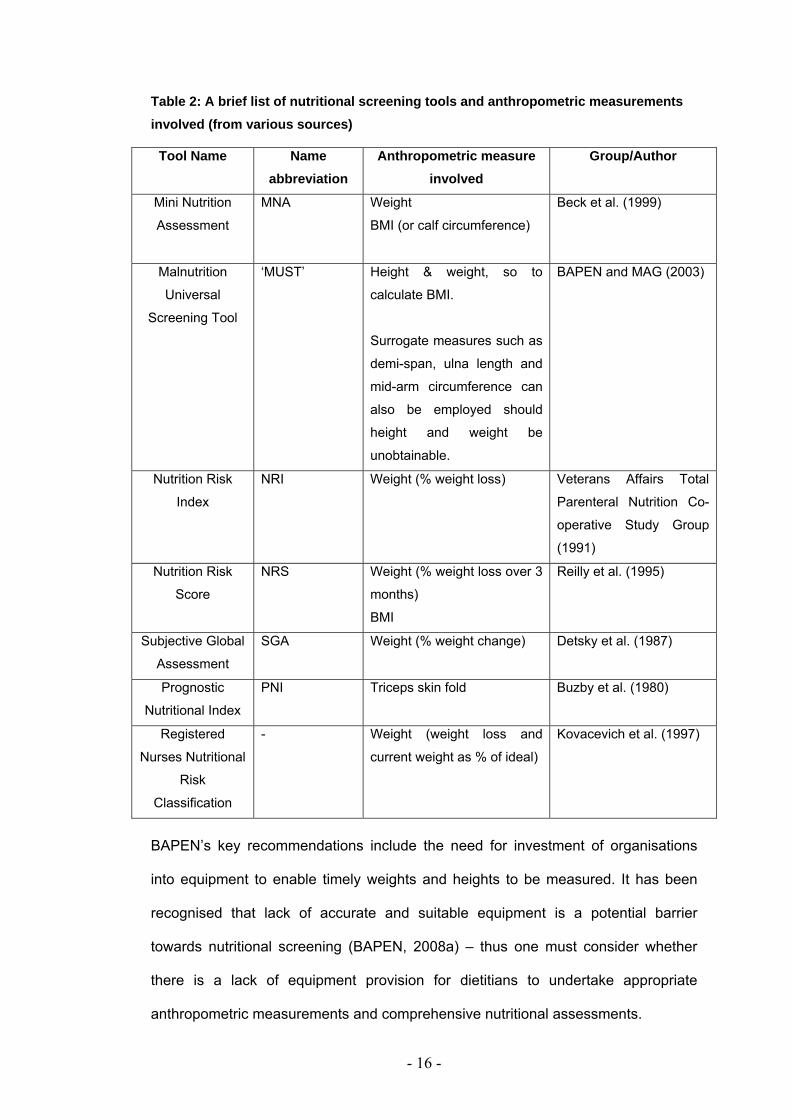
- 16 -
Table 2: A brief list of nutritional screening tools and anthropometric measurements involved (from various sources)
Tool Name Name abbreviation
Anthropometric measure involved
Group/Author
Mini Nutrition
Assessment
MNA Weight
BMI (or calf circumference)
Beck et al. (1999)
Malnutrition
Universal
Screening Tool
‘MUST’ Height & weight, so to
calculate BMI.
Surrogate measures such as
demi-span, ulna length and
mid-arm circumference can
also be employed should
height and weight be
unobtainable.
BAPEN and MAG (2003)
Nutrition Risk
Index
NRI Weight (% weight loss) Veterans Affairs Total
Parenteral Nutrition Co-
operative Study Group
(1991)
Nutrition Risk
Score
NRS Weight (% weight loss over 3
months)
BMI
Reilly et al. (1995)
Subjective Global
Assessment
SGA Weight (% weight change) Detsky et al. (1987)
Prognostic
Nutritional Index
PNI Triceps skin fold Buzby et al. (1980)
Registered
Nurses Nutritional
Risk
Classification
- Weight (weight loss and
current weight as % of ideal)
Kovacevich et al. (1997)
BAPEN’s key recommendations include the need for investment of organisations
into equipment to enable timely weights and heights to be measured. It has been
recognised that lack of accurate and suitable equipment is a potential barrier
towards nutritional screening (BAPEN, 2008a) – thus one must consider whether
there is a lack of equipment provision for dietitians to undertake appropriate
anthropometric measurements and comprehensive nutritional assessments.

- 17 -
Morbidity and mortality risks are also increased with over-nutrition (i.e. being over-
weight or obese). Significant health implications such as: arthritis, increased risk of
cancers, cardio-vascular disease (including hypertension, heart disease and stroke),
and diabetes are among the most common chronic conditions reported among older
obese and overweight adults, as well as an increased risk of physical and cognitive
disability (Houston, Nicklas & Zizza, 2009). It is clear, therefore, that not only under-
but over-nutrition must be correctly and timely identified and thus treated. Screening
tools such as ‘MUST’ emphasize their ability to recognise both anomalies to a
healthy weight (BAPEN, 2003).
Once those who are at nutritional risk have been identified interventions may be put
into place. Anthropometry can then be used as a set of objective measurements to
monitor patients’ progress and/or the effectiveness of the intervention (Gibson,
2005).
Guidelines for anthropometric use within various populations and settings have been
produced. WHO (1995) describe the use of anthropometric measurements in
reflecting population-level health, social and economic status as well as use
throughout the life cycle in terms of individual assessment. Similarly, NICE (2006)
recommend the use and frequency of use of anthropometric measures
such as weight, BMI, mid-arm circumference and triceps skinfold thickness
when monitoring patients requiring nutritional support. NICE further recommends
the use of BMI and WC measurements when assessing overweight patients (i.e.
those patients classified as having a BMI <35kg/m2).

- 18 -
A wealth of research considers how anthropometry can be used to assess not only
nutritional but also health status, i.e. various medical conditions and/or one’s risk of
these conditions. A brief overview of various anthropometric tools and their use for
detecting or monitoring numerous health conditions is detailed below, although to
consider this topic area in greater detail is beyond the scope of this project.
1.1.1. BMI
Body Mass Index (BMI) indicates body weight in relation to height, calculated as the
ratio of weight in kilograms divided by height in meters squared [kg/m2] (Gibson,
2005).
Many screening tools use BMI as a criterion for identifying malnutrition – typically
under nutrition. Despite this, BMI is deemed to not have high sensitivity, and thought
not to always detect central obesity, which is often taken as an indicator for chronic
disease risks (Chakraborty & Chakraborty, 2007). Also BMI may fail to detect small
yet clinically significant weight changes, i.e. a patient’s BMI may be within a ‘healthy’
range but the weight loss may be of a clinically significant amount thus increasing
the risk of mortality (Cook et al., 2005). It has been recommended to interpret BMI
with caution as it does not directly measure adiposity but the body as a whole, and
clinical judgement should be used when applying BMI to certain subgroups; for
example, those with greater than average muscle mass (athletes/body builders),
those <18 years or >65 years of age and those with fluid disturbances
(dehydrations/ascites) to name a few (NICE, 2006; Thomas & Bishop, 2007).
Despite this, BMI is thought to be widely used in clinical, practical and community
areas of work because of its practicality and ease of use (Akpinar et al., 2007).
- 19 -
BMI used to detect overweight or obesity is regularly associated with cardiovascular
disease (CVD) risk (Visscher et al., 2001; Paniagua et al., 2008), including
ischaemic heart disease (Chen et al., 2006) as well as type 2 diabetes development
risk (NICE, 2006). A large (n = ~20,000) prospective cohort study with a 10 year
follow-up indicated that fatal and non-fatal CVD risk is greater for those identified as
overweight or obese (Dis et al., 2009). Self-reporting, self-measuring and under
reporting are typical errors with such studies, however, Dis and colleagues used
measured weights and heights to accurately calculate BMI and WC scores and
found that for young to middle aged (20-65 years) Dutch adults CVD risk could be
correctly or reasonably well predicted by this method.
1.1.2. WC and WHR
Waist circumference (WC) is a simple measure of the circumference around the
waist between the lowest rib and the iliac crest. The ratio between the
circumferences of the waist and hips represents the waist-to-hip ratio (WHR) (WHO,
1995; Thomas & Bishop, 2007).
Numerous studies have reported that WC measurements are similar if not more
accurate at predicting mortality risk (Visscher et al., 2001), CVD risk (Lean & Han,
2002; Zhu et al., 2002; Zhu et al., 2005) and health outcomes (Woo et al., 2002)
compared with BMI. Ross et al. (2008) considered the practicalities of measuring
WC. Despite WC appearing to be widely recommended for practical and clinical use
as a relatively easy concept it was suggested that no gold standard protocol for
measuring WC yet exits. Studies are therefore using a range of protocols that are
derived from numerous forms of guidance including National Institutes of Health
(NIH): The Practical Guide to the Identification, Evaluation and Treatment of
Overweight and Obesity in Adults (2000), and WHO (1995): Physical Status. The
Use and Interpretation of Anthropometry. Experts in obesity assessment,

- 20 -
management and epidemiology research from the University of Laval, Canada,
reviewed 120 studies and found that the association between WC and
CVD/diabetes morbidities, all cause or CVD mortalities are not influenced
significantly by site or technique of WC measurement. WC implementation,
regardless of measurements site, was recommended, with the NIH protocol
suggested as being more practical and easier to use due to descriptions involving
bony landmarks (Ross et al., 2008). Such findings should be reflected upon when
considering practical barriers to anthropometric use amongst dietitians. It may be
logical to consider that lack of confidence and/or knowledge of guidance, or
confusion over recommended protocols may deter anthropometric use.
Conflicting evidence exists for the use of WHR. Woo et al. (2002) describe WHR as
an un-useful predictor of health outcomes; whereas Price et al. (2006) recently
described how a high WHR is associated, more closely than BMI and especially WC,
with a greater mortality risk in the elderly. This is similarly described by Seidell et al.
(2001) who considered that waist and hip circumferences measure different aspects
and compositions of the body yet the independent effect of these measurements
may not be as strong when provided as a ratio.
1.1.3. Research gap
Despite the volume of research in the area of anthropometry including advantages,
disadvantages, comparisons of the individual measurements and recommendations
to use anthropometry by health organisations, there is very limited research on
current or practical use of anthropometry. When assessing nutritional status Baxter
(1999) detailed the need for anthropometric and biochemical data to be considered
and advocated the role of dietitians. She proposed potential limitations to taking
measurements in the clinical setting. A recent reflection of Australian nurses’ use
and thoughts of nutritional screening highlighted barriers and negative attitudes,

- 21 -
primarily towards its documentation, yet could not detail dietitians’ views (Porter et
al., 2009). Similarly, a study, limited in sample size (n = 25) thus generalisability, did
consider nursing and medical staff’s knowledge and use of anthropometry within
children wards in one hospital in Glasgow. This, however, included just two
dietitians and the documentation of weight, height and percentiles only (Bunting &
Weaver, 1997).
Thus, literature searches failed to find substantive research investigating the
attitudes of clinicians’, or people taking the measurements, towards anthropometry
and specifically of dietitians. There also appears to be very limited published data
that consider the frequency and the practicality of use of anthropometric
measurements, i.e. enablers and barriers of implementation. An additional problem
encountered was the lack of validated methods used to evaluate attitudes and
beliefs towards the use of clinical measurements including anthropometry. This is
discussed in the following section.
1.1.3.1. Attitudinal scales
An attitude may be thought of as a complex mental state involving beliefs, feelings,
values and dispositions to act in certain ways (Cambridge Advanced Learner's
Dictionary, 2008). One specific attitude that is likely to directly affect behaviour (i.e.
whether anthropometric measurements are taken or not) is that of confidence.
Confidence may be defined as “the quality of being certain of your abilities or of
having trust in people, plans, or the future” (Cambridge Advanced Learner's
Dictionary, 2008).
- 22 -
In order to quantitatively assess subjective feelings or attitudes such information
must be translated into quantitative data using ‘psychometric’ or scale-based
methods. Early examples of such methods originate from pain, pleasure, taste,
effect of drugs/medication research (Freyd, 1923; Ohnhaus & Alder, 1975; Downies
et al., 1978; Rogers & Blundell, 1979). Freyd (1923) reported the need to assess
the practical and statistical validity of scales in order to validate their use. Validity
refers to how repeatable the measure is, the spread and normality of the data and
how it compares to other measures. Practical validity considers the ease of use and
interpretation.
Categorical scales often involve tick-boxes, numbers or ordering/ranking of variables,
on which the subject is asked to indicate one option in response to a question.
Examples include the nine-point hedonic scale (Peryam & Pilgrim, 1957) and the
Likert scale. The latter was originally developed to measure attitudes (Likert, 1932
cited in Bartoshuk, et al., 2004) and has long been used in areas of psychology and
sports psychology (Taylor & Wilson, 2005). However, there appears to be no
validation studies for their use in testing confidence when taking measurements – or
anthropometry specifically - as apposed to performing gross motor skills, tasks or
activities.
The psychometric measure known as Visual Analogue Scale (VAS) was originally
used to study pain (Ohnhaus & Alder, 1975). A VAS typically consists of a 100mm
or 150mm horizontal linear scale (in paper or now electronic version) with anchoring
labels at each end indicating the extremes of the issue/topic involved. The subject
marks a vertical line/trait across the horizontal line to indicate their feeling to the
variable in question, which is measured in millimetres from the left hand anchor,
hence quantifying feelings. These scales are easy to interpret, with low burden on
the subject and thought to be able to be transferred to numerous experimental
- 23 -
conditions with low variability (Stubbs et al., 2000). These scales have been
validated for the measurement of pain and appetite dimensions (Flint et al., 2000;
Whybrow et al., 2006; Almiron-Roig et al., 2009). The VAS is an example of an
unlabelled continuous linear scale, but linear scales can also be labelled with
descriptors placed at intervals indicating gradation of feelings. The Labelled
Magnitude Scale (LMS) is a labelled linear scale and was developed by Green,
Shaffer and Gilmore (1993). LMS often include a ‘maximal’ or ‘strongest imaginable’
label at the most right or vertical anchor. The effect of such statement on scale
validity is debated (Bartoshuk et al., 2004; Cardello et al., 2005).
VAS have the advantage over other Likert/categorical and labelled scales of not
assuming that each responder perceives interval gaps as equal size, distance or
weighting. Similarly, by not having several labels along the scale (numerical/word
markings) the responder is not prompted or influenced as to where to place their
mark. Although LMS or continuous scales allow greater responder choice, than
Likert or categorical scales, they are thought to be less sensitive than non-labelled
tools due to the labels and feeling magnitudes not directly relating to each other.
This issue was further considered by Bartoshuk et al. (2004) who created and
validated an extended form of the Labelled Magnitude Scale – the General Label
Magnitude Scale (gLMS). The vertical rule was extended to 230mm, labels were
adapted to not directly relate to the sensation involved and included the maximum
label of “strongest imaginable sensation of any kind” allowing for responders
sensations to be moderated or normalised, facilitating group comparison.
There appears, however, to be no validated tool to assess attitudes and feelings, in
a quantitative manner, when using anthropometric measurements; hence this
project also considered validation of a scale for anthropometry related attitude
assessment use.
- 24 -
1.2. Aims and objectives
There are many anthropometric measurements and screening tools available, yet no
specific research has been found that investigates the practicalities of using such
tools neither on various patient groups nor in different dietetic working groups. It is
therefore thought that value will be gained by exploring the use of anthropometric
measurements, which tools are most commonly used and potential reasons of why
such objective measures may not be taken in the practical setting. It is possible to
consider that due to differences in work settings and patient groups seen, there may
be differences in working practice between community and acute (hospital) based
dietitians. This study will consider acute and community working dietitians as two
separate groups.
The aim of this study is to investigate the use of and barriers and attitudes towards
using anthropometric measurements by NHS working dietitians in the North West of
England, using validated attitudinal scales.
It is hoped that this research will provide an evidence base for the re-evaluation of
anthropometry recommendations, use and training within the NHS to improve
consistency and accuracy of nutritional assessments. In addition, it is expected that
a sensitive and reliable tool for assessing confidence at taking anthropometric
measurements amongst dietitians will be developed, for use within future research
or within other area topics.

- 25 -
1.3. Hypotheses
The primary alternative hypotheses (H1) under study for this work are:
There will be a significant difference in:
(a) the type or frequency of use,
(b) the attitudes towards,
and (c) the barriers towards anthropometric measurement use between
community and acute working dietitians.
Secondary to this, it is suggested the present study may allow exploration into
whether there are differences in the type, frequency of use and attitudes/barriers
towards anthropometric measurements within sub-groups of dietitians (i.e. acute vs.
community weight management or renal specialist dietitians etc.). It is predicted that
a sufficient number of dietitians will not be available from the targeted population by
area of work or numerous variables thus this part of the study will be explorative
rather than hypotheses testing.

- 26 -
2. METHODS
2.1. Study design
This was an exploratory, cross-sectional study, based on a mailed survey.
2.1.1. Design and validation of the questionnaire
The questionnaire was constructed considering various areas of dietetics and array
of anthropometric tools (see appendix 1). Questions explored anthropometric
measurement and screening tool use in practice (questions 2 and 4), the frequency
of use of various anthropometric measures (question 4), potential barriers
(questions 3, 5 and 7) and attitudes towards using anthropometric measurements
(questions 6 and 8). Question 1 was included to ensure that two groups could be
determined to allow for comparison of answers (i.e. acute vs. community). By
including four answers the participants who work across both community and acute
settings were not excluded from the study. Questions 9 - 13 inclusive allowed
description of the sample to be formed.
Figure 1 depicts the time frame and outline of the study. The questionnaire was
piloted using a convenience sample of acute and community working dietitians. The
pilot questionnaire (see appendix 1) was completed by acute and community
practicing dietitians based at Salford Royal NHS Foundation Trust and Salford PCT
(see appendix 2 for letter of consent) and other dietitians known to the author.
Dietitian volunteers from a department outside of the North West (University
Hospital of North Staffordshire) were also recruited for the piloting. Biasing was
reduced by ensuring a wide range of bands/post levels for both acute and
community responders from several departments, which were thought to be similar
in characteristics hence comparable to the main trial population.

- 27 -
Pilot volunteers were asked to complete the thirteen question survey, followed by
eight pilot feedback-questions relating to the format and layout plus provided
opportunity for other suggestions or comments to be made regarding the
questionnaire. A further series of questions, which considered their confidence on
using various anthropometric measurements followed. For this section each
question was repeated three times, each time utilising a different scale: a Visual
Analogue Scale [VAS] (Ohnhaus & Alder, 1975), a Likert scale (Likert, 1932) and a
General Labelled Magnitude Scale [gLMS] (Bartoshuk et al., 2004). The VAS and
gLMS used the original research labels and adapted to relate to confidence (i.e. ‘not
at all…confident’) and the Likert scale was adapted to include the primary question
of ‘I lack tools/knowledge to effectively measure/calculate my patient’s…’. This
phrase was adapted from Bush, Cherkin and Barlow (1993) questionnaire, who
considered practitioner’s self-confidence and attitudes towards treating patients with
lower back pain. It was thought relevant to take the first Likert question from this
tool as literature searches failed to find other papers that attempted to assess Health
Professional’s confidence/attitudes using Likert scales.
The pilot study participants were asked to re-answer the latter set of questions
(validation booklet) six weeks later to validate the use of VAS, gLMS and Likert
scales for assessing confidence when taking anthropometric measurements. The
order in which the scales were distributed within the validation booklet (see
appendix 1) was randomised using random number generator tables.
Adaptations and editions to the thirteen-question survey took place as indicated
following pilot study participant’s feedback (see appendix 1 for pilot study
questionnaire which includes feedback questions).
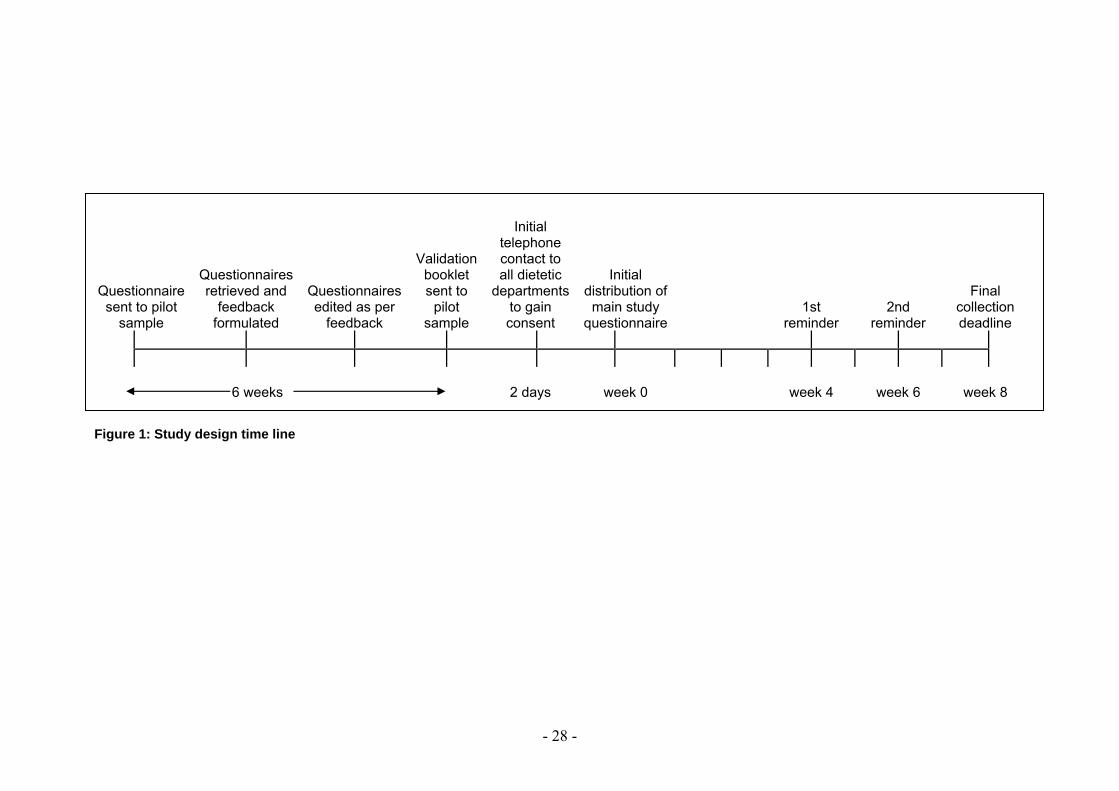
- 28 -
Questionnaire sent to pilot
sample
Questionnaires retrieved and
feedback formulated
Questionnaires edited as per
feedback
Validation booklet sent to
pilot sample
Initial telephone contact to all dietetic
departments to gain consent
Initial distribution of main study
questionnaire 1st
reminder 2nd
reminder
Final collection deadline
6 weeks
2 days week 0 week 4 week 6 week 8 Figure 1: Study design time line

- 29 -
2.2. Population and sample
All NHS working dietitians and dietetic assistants (n = 515) across the North West
region were targeted (see appendix 3 for a comprehensive list of all NHS and
Primary care trusts (PCT) in the North West). Both Primary and Acute trusts were
targeted to ensure that a mix of community and hospital based (‘acute’) dietitians,
and dietetic assistants, responded to the questionnaire. Table 2 highlights the trusts
where dietetic departments consented to accept the postal questionnaire. Any
dietitian registered with the Health Professions Council (HPC), or dietetic assistant,
who is employed by the NHS, working within any area of dietetics and contracted for
any number of hours was able to complete the survey. Please note that the terms
responders/ participants/ dietitians will be used interchangeably throughout this
report. It is acknowledged that responders may also include assistants or non-
registered dietitians.
Exclusion criteria consisted of:
- Any registered dietitian or assistant who is not employed by the NHS.
- Any registered dietitian or assistant employed by the NHS, working outside of
the North West area of the UK.
Those departments that declined the acceptance of the questionnaire or failed to
respond to messages and emails, or trusts/centres that do not have access to
dietitians were also excluded from the study.

- 30 -
A recent unpublished MSc thesis (Whyand, 2007) conducted a survey to investigate
NHS dietitians’ knowledge and confidence of promoting physical activity to patients.
Between 500 and 800 questionnaires were distributed across the UK. A 24%
response rate was achieved, which is within other published response rates of 21-
27% when using dietitians as the sample (McKenna et al., 2004). Similarly, a power
analysis typically suggests the need to achieve 20-30 responses per group for a
sufficient sample within questionnaire research (Burgess, 2003). It was therefore
estimated, that within the present study, at least 300 questionnaires would need to
be distributed to achieve similar and acceptable response rates. However, this study
was confined to the North West of England, therefore the number of dietitians
available was fixed. Data sources revealed that in 2007 five hundred and fifteen
dietitian therapists (excluding managers) were employed by the NHS in the North
West area of England (The Health and Social Care Information Centre, 2010). It
was, therefore, predicted that if all dietetic departments were contacted within the
North West region, a response rate of greater than or equal to 30% could be
achieved (i.e. 150 responses) and that findings could be representative of the
practices and attitudes of dietitians working in the North West of the England.
Future research would then be indicated to consider dietitians at a national level
across the UK.

- 31 -
Table 3: Names of Trust and number of questionnaires posted per department
Name of Trust No of
questionnaires requested/posted
Knowsley PCT 35 East Lancashire Hospitals NHS Trust: Royal Blackburn Hospital 30 The Mid/East Cheshire NHS Trust: Leighton Hospital 30 Aintree University Hospitals NHS Foundation Trust: University Hospital Aintree 23
Manchester PCT 23 Central Lancashire PCT 20 University Hospitals of Morecambe Bay NHS Trust: Westmorland General Hospital 20
Salford NHS: PCT and Salford Royal NHS Foundation Trust 19 Wirral Hospital NHS Trust: Arrowe Park Hospital 17 East Lancashire PCT 15 Royal Liverpool and Broadgreen University Hospitals NHS Trust: Royal Liverpool University Hospital 15
University Hospital of South Manchester NHS Foundation Trust: Wythenshawe Hospital 15
Blackpool, Fylde and Wyre Hospital NHS Trust: Victoria Hospital 14 Heywood, Middleton, Oldham and Rochdale PCT 14 Royal Liverpool Children’s NHS Trust: Alder Hey Hospital 13 St Helen's and Knowsley Hospitals NHS Trust: Whiston Hospital 10 Bolton Hospitals NHS Trust: The Royal Bolton Hospital 9 Cumbria PCT 9 Christie Hospital NHS Trust 8 Royal Manchester Children's University Hospitals NHS Trust 8 Stockport NHS Foundation Trust: Stepping Hill Hospital 7 Halton and St Helens PCT 6 North Lancashire PCT: St Anne's 5 Southport and Ormskirk Hospitals NHS Trust 5 Stockport PCT 5 Tameside and Glossop PCT 5 Wrighton, Wigan and Leigh NHS Trust: The Elms, Royal Albert Edward Infirmary 5
Ashton Leigh and Wigan PCT 4 North Cumbria Acute Hospitals NHS Trust: West Cumberland Hospital 4 Liverpool Women's NHS Foundation Trust: Liverpool Women's Hospital 2 Tameside and Glossop Acute Services NHS Trust: Tameside General Hospital 2
Totals: 31 bases 397

- 32 -
2.3. Procedures: Questionnaire administration
All NHS and PCT trusts across the North West of England were contacted via
telephone or e-mail over a two consecutive day period in February 2010. A
telephone script or standard e-mail was used (see appendix 3) to ensure
standardised information was provided to each department. The telephone or
e-mail contact enabled the survey to be introduced and for department’s preferred
mode of future contact to be noted, i.e. e-mail or telephone, for future reminder
contacts.
All consenting departments were provided with the number of questionnaires
requested (i.e. 1 per dietitian or individually consenting dietitian/assistant) via the
post, along with a self-addressed freepost envelope.
The cover letter and participant information sheet, included with each questionnaire,
clearly stated the final submission date and details about the study, including their
right to withdraw at any time and the anonymity of answers (see appendix 1).
The first of 2 follow-ups (phone calls or e-mail contact) took place four weeks
following the first dispatch of questionnaires; at this time an electronic form of the
questionnaire was also offered to the department should additional questionnaires
be needed (electronic questionnaires were encouraged to be printed out and
returned to the researcher via post). Two weeks after this (i.e. 6 weeks post dispatch
of the original questionnaires) the second and final reminder took place, requesting
questionnaires to be completed and returned, emphasising the final submission and
acceptance date (see figure 1).

- 33 -
It is acknowledged that the time demand on pilot participants was greater than for
those completing the main questionnaire as the piloting took place over two
separate time periods. The amount of time required to complete the main
questionnaire was highlighted on the cover letter and determined from the pilot
sample feedback answers (i.e. they were asked to record the duration taken to
complete the main questionnaire). The number of questions included in both the
pilot and main questionnaires were minimised and most required tick box answers
only to reduce participant burden (Smeeth & Fletcher, 2002).
Participants were encouraged to self-select their designation when completing the
questionnaire, to determine if they were community- or acute- based dietitians, and
asked to answer the whole questionnaire in relation to this designation. When
referring to community work, or being a community dietitian, this indicates that the
individual’s work time is predominantly not based within a hospital (i.e. not
determined by sector of employment e.g. PCT or NHS but by the area in which they
work). This supports the definition provided within the Role Paper of the Dietitians of
Canada, Community Dietitians in Health Centres Network (2004):
“Community Dietitians are Registered Dietitians. Distinct from Public Health
Dietitians/Nutritionists, Community Dietitians work in a variety of settings such as
Community Health Centres, resource centres, social service agencies and
recreation centres”.
Conversely when referring to acute dietitians or acute working this regards the care
of patients based within a hospital to be treated for acute illnesses.

- 34 -
Consent was deemed to have been gained by the participant completing and
submitting a questionnaire. At the end of the questionnaire each participant was
notified that their involvement in the present study was complete and they were
thanked for their time.
- 35 -
2.4. Data management and statistical analysis
Once the final submission date was reached the returned questionnaires were
analysed using Statistical Package for the Social Sciences software (SPSS UK Ltd
1999, V17.0 (PC)).
Data was explored using the Descriptive statistics option of SPSS. To test the
association between area of work (acute/community) and trust screening tool
(Question 2), the type/frequency of anthropometric measurement (Question 4),
barriers (Questions 3, 5 and 7) and attitudes (Questions 6 and 8) towards
anthropometry, Chi-squared ( χ 2) tests were used. Differences in perceived
confidence levels for different measurements between acute and community
dietitians were analysed with t-tests for independent samples (Question 3), tested
via VAS.
Please note that for Question 6, attitude assessment, the 5 point Likert scale
questions were screened and negatively worded items (i.e. sub-questions d, e, f, i, j,
k, l, m, and n, please see appendix 1) were reversed to ensure continuity of rating
across all questions; i.e. the lower the score the more positive the attitude towards
the question. Total attitude was considered for the study sample overall and for
acute and community groups only (i.e. responders could choose 1-5 [‘strongly agree’
— ‘strongly disagree’ respectively] on the 5 point Likert scale for each of the 15 sub-
questions thus, overall, the scale range was 15-75). This was necessary as the
minimal cell frequency assumption (>5) was violated when considering Chi-squared
tests for the individual attitude questions (Pallant, 2007).
- 36 -
Validation of the VAS and gLMS scales as measures of confidence when taking
anthropometric measurements was performed by measuring the sensitivity and
reproducibility of the VAS and gLMS in comparison to the Likert scale that is more
commonly used. For this, the Likert categorical data were converted to continuous
data and all scales results were calibrated to a 100 point scale to allow comparison
(i.e. the 230mm gLMS scale results were divided by 2.3; Likert responses were
transformed to a 0-4 point scale and each answer multiplied by 25 thus all scale
responses were comparable to a 100-point scale). Analysis of variance (ANOVA)
with post hoc tests were used to assess sensitivity of VAS and gLMS against Likert
scales. Bland-Altman Plots and standard deviations were used to assess
reproducibility and confirm comparison amongst scales (Bland & Altman, 1986; Flint
et al., 2000; Bartoshuk et al., 2004; Whybrow et al., 2006).
The level of significance, alpha (α), for all statistical tests was set to p < 0.05.

- 37 -
2.5. Ethical and cost implications
The study protocol was reviewed by the National Health Service (NHS) National
Research Ethics Service (NRES) and Integrated Research Application System
(IRAS) who deemed it to be a service evaluation/audit (appendix 2). Ethical
approval was applied for and granted by the University of Chester Research Ethics
Committee (see appendix 2).
The questionnaires were only provided in typed English documentation as all
dietitians working for the NHS must be registered with the Health Professions
Council (HPC), who request a minimal level of communication in the English
language (HPC, 2008). As the targeted sample were registered dietitians and
dietetic assistants in the North West no level of discrimination is likely to have arisen
from this research project.
The potential for discomfort, distress, inconvenience or changes in lifestyle for
participants was limited (Department of Health, 2003). Subjects were asked to self-
complete the questionnaire within an eight week time frame and self-addressed,
freepost envelopes were also included to minmise cost and burden to participants.
Despite this, it is recognised that time and case load demands on dietitians are high
and the questionnaire would have inevitabley required a level of time and
commitment from each participant. Follow-up reminders may also have induced a
small level of demand on the department. However, as the questionnaire was
designed to be as quick and as simple to complete as possible and the option of
consent and withdrawal made clear to the participants it is hoped that any distress
was lessened. This study did not involve patients/clients and anonymity of
questionnaire responses was upheld.
- 38 -
No monetary or financial reward was offered via this research project decreasing
bias (Smeeth & Fletcher, 2002). There were no other relevant ethical issues
involved for this study.
No bursary, thus no conflict of interest, has been incurred by the researcher.
The present project had relatively low cost implications. Costs included printing of
the questionnaires, envelopes and postage to the departments as a batch, and one
additional self-addressed pre-paid envelope per questionnaire sent for their return to
the researcher and cost of telephone contact to each department. Costs have been
subsidised utilising University of Chester’s post-graduate studies fund only.

- 39 -
3. RESULTS
3.1. Pilot study
The questionnaire was piloted on a convince sample of 32. Dietitians employed at
Salford Royal, Salford PCT and University Hospital of North Staffordshire were
targeted. Twenty three (72%) reported working in/mainly in the acute setting and 9
(28%) reported working in/mainly in the community setting. All but 1 responder (n = 1,
3%) was female. Two responders (6%) reported working part-time, 30 (94%) work full
time hours. Experience ranged from <1 – over 20 years.
Feedback suggested that the average time to complete the questionnaire was 10
minutes (5 - 20 minutes). 100% of responders found the length, layout and font of the
questionnaire as acceptable and understandable. The main study questionnaire was
amended as follows: More anthropometric measurements were included in the
questions considering confidence (question 3) and frequency of use (question 4);
more options were included as reasons for not using anthropometry (question 5) as
well as additions to the attitude questions (question 6) as a result of pilot feedback.

- 40 -
3.2. Validation study: Scales to assess confidence
3.2.1. Sensitivity
A one-way between-groups Analysis of Variance (ANOVA) with post-hoc tests were
conducted to compare average confidence when taking various anthropometric
measures (see validation questionnaire, appendix 1) using three forms of
confidence scales: VAS, gLMS and Likert by the pilot sample (n = 32).
The homogeneity of variance assumption was not violated (p > 0.05).
There was a significant difference in confidence ratings amongst the three scales,
F(2, 149) = 24.97 (p <0.0001). Post-hoc comparisons using the Tukey HSD test
indicated that the mean score for confidence using the gLMS scale was significantly
different from the mean score for confidence using Likert and VAS scales. Mean
(SEM) confidence scores were: for gLMS 36.9mm (2.54mm), for Likert 55.7 (2.98)
and for VAS 55.1mm (2.49mm) (figure 2).
Therefore the VAS was equally sensitive as the Likert, but the gLMS were able to
detect lower scores.

- 41 -
* Differs significantly from gLMS (p <0.05).
Figure 2: Means (+2 SEM) for VAS, Likert and gLMS scales used to assess perceived confidence at taking all anthropometric measurements (n = 32)
3.2.1.1. Measures of agreement
Bland-Altman tests (Bland & Altman, 1986) were conducted to assess the
reproducibility of the Likert, VAS and gLMS scales when assessing confidence at
taking anthropometric measurements in a test re-test experiment.
Any two methods that are designed to measure the same parameter should have a
good correlation. However, a high correlation does not automatically imply that there
is good agreement between the two methods. Bland-Altman plots can be used to
compare a new measurement technique or method with a gold standard (Glantz,
2005). In the present study’s case comparing VAS and gLMS to the well referenced
and used Likert scale (as our gold standard).
(0–
100m
m)
**

- 42 -
Bland-Altman method also allows for mean of the differences between the two
scales to be calculated. This, known as confidence limits, provides insight into how
much random variation may be influencing the results. If the two scales that are
being compared tend to agree, the mean will be near zero. If one scale is
consistently higher, or lower, than the other, the mean will be far from zero, but the
confidence interval will be narrow. If the scales tend to disagree, but without a
consistent pattern, the mean will be near zero but the confidence interval will be
wide. This is illustrated visually using the Bland-Altman plots. These graphs plot
the mean difference, and the confidence limits on the vertical against the average of
the two ratings on the horizontal; demonstrating not only the overall degree of
agreement, but also whether the agreement is related to the underlying value of the
item. For instance, two scales might agree closely when confidence ratings are low,
but disagree on high confidence ratings (Glantz, 2005).
Responders were requested to indicate their level of confidence for 12
anthropometric measurements. Each responder answered these 12 ‘confidence
questions’ three times, once using the VAS, once using the gLMS and once with
Likert. At a later stage, each responder indicated their confidence level for the same
12 anthropometric measurements, again repeated three times so to use VAS, gLMS
and Likert scales, i.e. a test re-test experiment. Histograms illustrated that the mean
differences were normally distributed, i.e. the fewer number of points outside the 2
standard deviation (SD) limit indicates higher level of agreement between the two
scales. Hence, justifying the use of Bland-Altman plots and measures of agreement
calculations (figures 3 and 4).

- 43 -
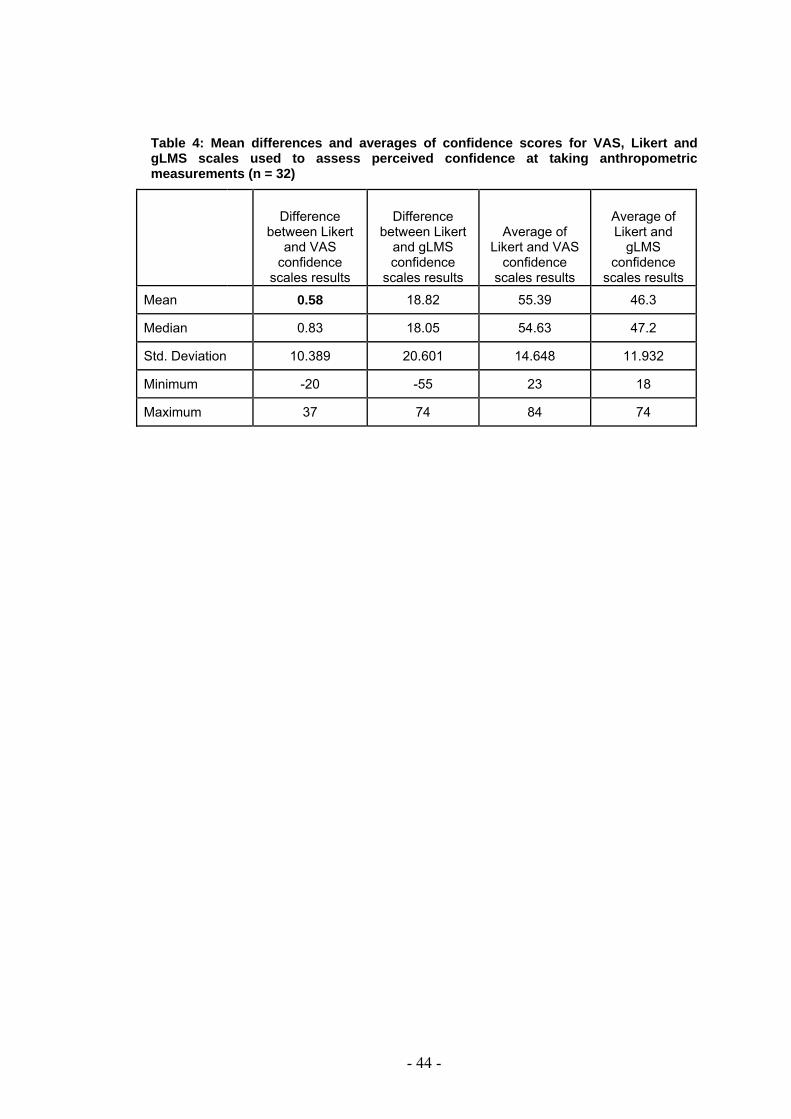
An average for each of the anthropometric measurements was calculated (i.e. all
responder’s answers for confidence when taking a patient’s height for test 1 and 2
when using VAS were added together and divided by total number of responses to
reach an “average confidence score for height measurements using VAS”). This
was repeated for all 12 anthropometric measurements and then repeated for all
three scales.
The difference between these average confidence results for each anthropometric
measure was calculated to indicate the disagreement between two scales used (i.e.
average confidence for height using Likert minus average confidence for height
using VAS). The mean and standard deviation (SD) of these differences in average
confidence were calculated to indication the bias and variation between two
scales/tools used, i.e. mean and SD for differences between Liket and VAS, and
then for Likert and gLMS. Results showed that the Likert and VAS scales were the
most comparable (mean difference 0.58), as the closer the mean difference is to
zero the better the two methods compare (Pallant, 2007) all other comparisons were
>1 (table 4). The ‘average confidence scores’ for each of the anthropometric
measurement questioned were combined to get a ‘total average confidence score’
for each scale (Likert, VAS and gLMS), thus allowing for an average of Likert and
VAS, then for Likert and gLMS confidence scores to be computed (table 4). These
results are considered to be the best estimate of the true value of confidence being
measured.
The difference between Likert and VAS scores were plotted against the average of
Likert and VAS scores to form Bland-Altman plots, indicating any systematic
differences between the scales used when assessing confidence. This was
repeated for Likert and gLMS results (figure 3 and 4).
- 44 -
Table 4: Mean differences and averages of confidence scores for VAS, Likert and gLMS scales used to assess perceived confidence at taking anthropometric measurements (n = 32)
Difference
between Likert and VAS
confidence scales results
Difference between Likert
and gLMS confidence
scales results
Average of Likert and VAS
confidence scales results
Average of Likert and
gLMS confidence
scales results
Mean 0.58 18.82 55.39 46.3
Median 0.83 18.05 54.63 47.2
Std. Deviation 10.389 20.601 14.648 11.932
Minimum -20 -55 23 18
Maximum 37 74 84 74
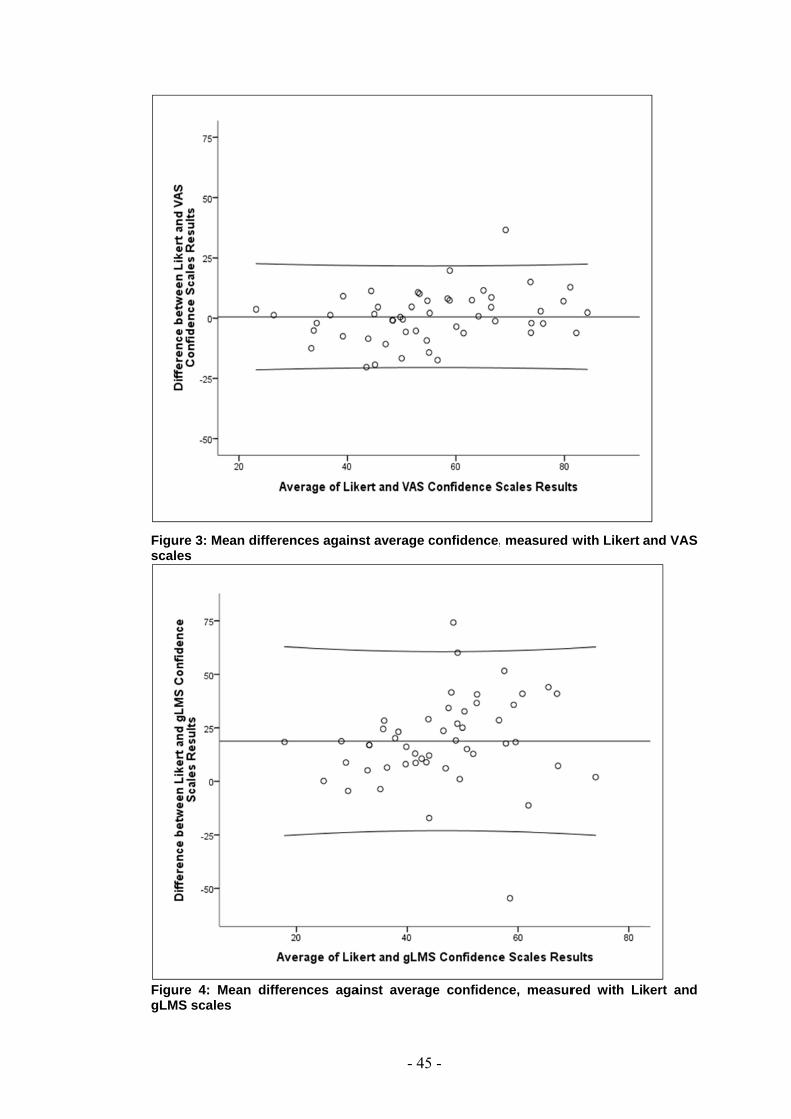
Figure 3: Mscales
Figure 4: gLMS scal
Mean differe
Mean diffeles
ences again
rences aga
- 45
nst average c
ainst averag
5 -
confidence,
ge confiden
measured w
nce, measur
with Likert
red with Li
and VAS
kert and

- 46 -
The limits of agreement calculations were as follows:
Likert – VAS:
Lower: Mean difference – (2 x SD of difference) = 0.58 – (2 x 10.389) = -20.2
Upper: Mean difference + (2 x SD of difference) = 0.58 + (2 x 10.389) = 21.4
Coefficient of reproducibility (CF) = 100 x SD of difference / Mean =
(100 x 10.389)/55.39 = 18.8%
Likert – gLMS:
Lower: Mean difference – (2 x SD of difference) = 18.82 – (2 x 20.601) = -22.4
Upper: Mean difference + (2 x SD of difference) = 18.82 + (2 x 20.601) = 60.0
Coefficient of reproducibility (CF) = 100 x SD of difference / Mean =
(100 x 20.601)/46.30 = 44.5%
The lower CF result demonstrates a greater level of reproducibly between Likert and
VAS than between Likert and gLMS. This confirms the similarity of Likert vs. VAS.
3.2.2. Reproducibility
As the pilot sample participants were asked to complete the sets of scales on two
separate occasions it has been possible to complete repeatability tests for VAS,
gLMS and Likert as scales to measure confidence when taking anthropometric
measurements (Bland & Altman, 1986). Figures 5-7 demonstrate that 95% of
difference scores are less than 2 standard deviations (SD) from the means, which
falls within the definition of repeatability coefficient in line with the British Standards
Institution (British Standards Institution, 1975 cited in Bland & Altman, 1986). The
smaller the SD the more agreement between the two repeated tests, this happened
equally for all three scales measured, indicating each scale is reliable.
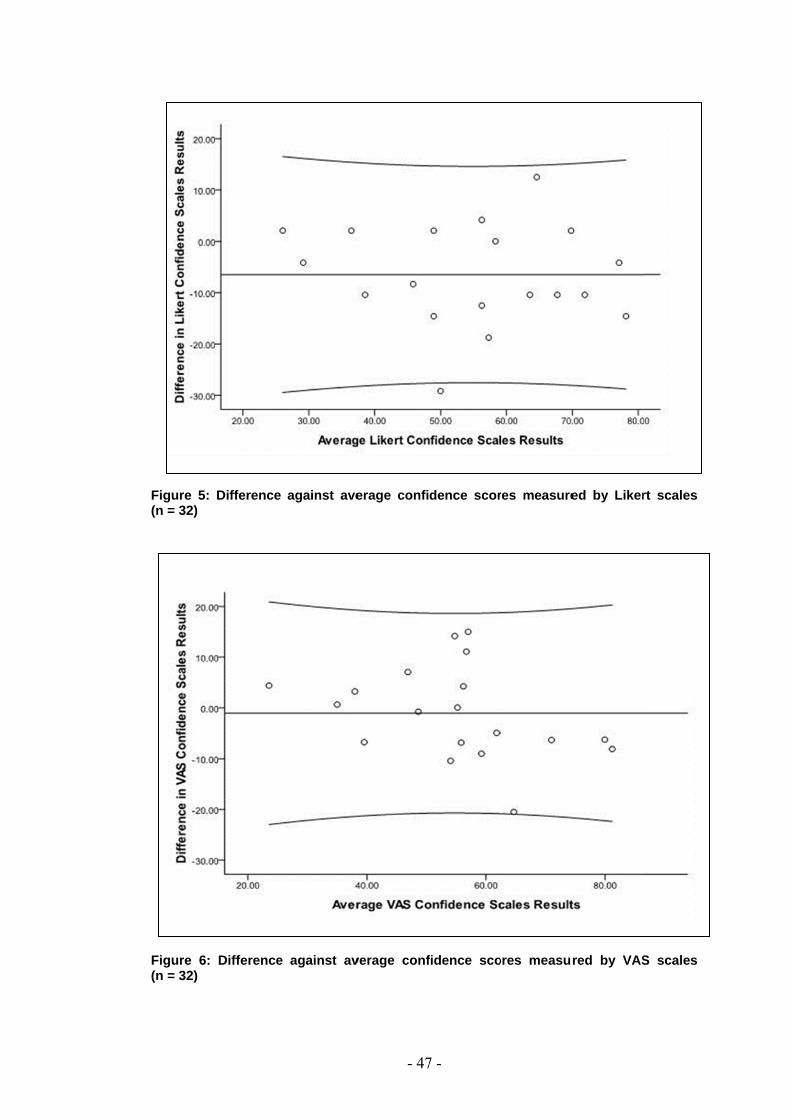
Figure 5: (n = 32)
Figure 6: (n = 32)
Difference
Difference
against ave
against av
- 47
erage confi
verage conf
7 -
dence scor
fidence sco
res measure
ores measur
ed by Liker
red by VAS
rt scales
S scales

Figure 7:
(n = 32)
In summa
Likert, and
attitude wi
The gLMS
considerin
and respo
as paper
chosen for
Difference
ry, as the s
d were rep
thin the ma
S did not giv
ng practicali
onder, as lab
space and
r further use
against ave
ensitivity of
producible.
in study que
ve as close
ties, i.e. like
bels contain
printing be
e within the
- 48
erage confi
f the VAS re
The VAS
estionnaire.
e results to
elihood to t
n extreme st
eing less e
present stu
8 -
dence scor
esults were
tool was c
Likert, so n
take longer
tatements (B
efficient – h
dy.
res measure
comparable
chosen for
ot as comp
to interpret
Bartoshuk e
hence the g
ed by gLMS
e, if not high
the assess
parable. Wh
t by the res
et al., 2004)
gLMS tool
S scales
her, than
sment of
hen also
searcher
), as well
was not
- 49 -
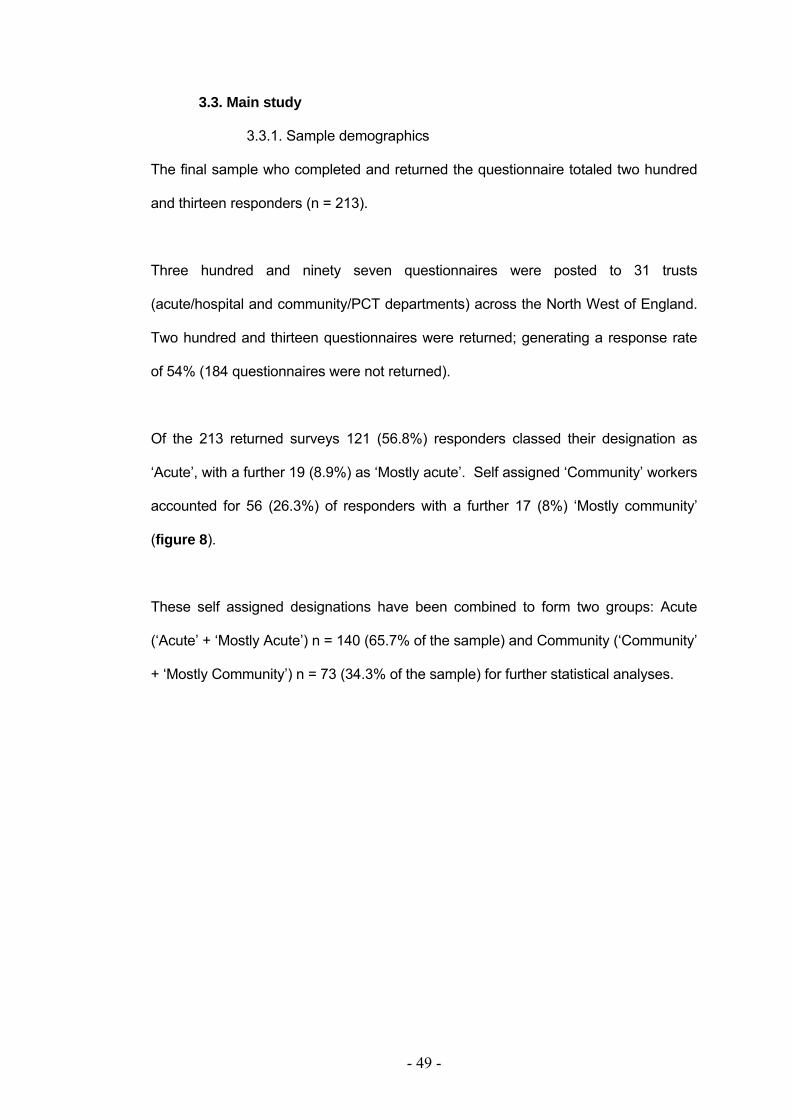
3.3. Main study
3.3.1. Sample demographics
The final sample who completed and returned the questionnaire totaled two hundred
and thirteen responders (n = 213).
Three hundred and ninety seven questionnaires were posted to 31 trusts
(acute/hospital and community/PCT departments) across the North West of England.
Two hundred and thirteen questionnaires were returned; generating a response rate
of 54% (184 questionnaires were not returned).
Of the 213 returned surveys 121 (56.8%) responders classed their designation as
‘Acute’, with a further 19 (8.9%) as ‘Mostly acute’. Self assigned ‘Community’ workers
accounted for 56 (26.3%) of responders with a further 17 (8%) ‘Mostly community’
(figure 8).
These self assigned designations have been combined to form two groups: Acute
(‘Acute’ + ‘Mostly Acute’) n = 140 (65.7% of the sample) and Community (‘Community’
+ ‘Mostly Community’) n = 73 (34.3% of the sample) for further statistical analyses.
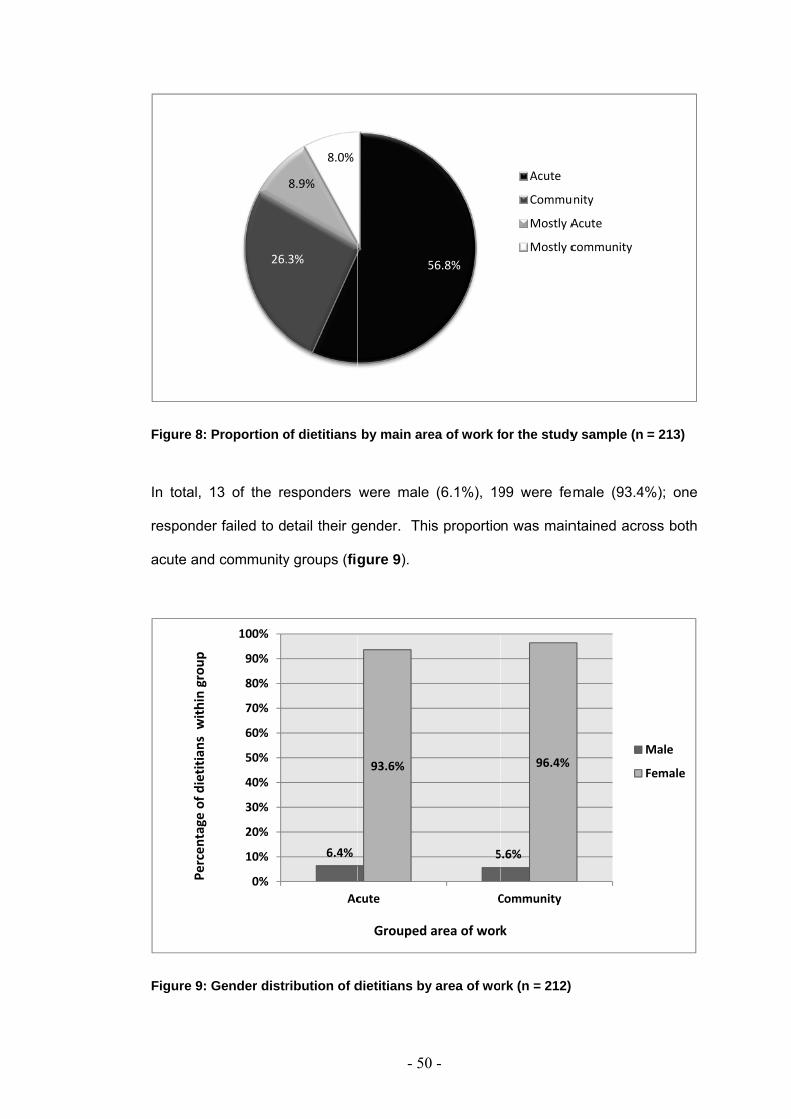
Figure 8: P
In total, 1
responder
acute and
Figure 9: G
Percen
tage of d
ietitians w
ithin group
Proportion o
3 of the re
r failed to d
community
Gender distr
26.
0%
10%
20%
30%
40%
50%
60%
70%
80%
90%
100%
of dietitians
esponders
etail their g
y groups (fig
ribution of d
.3%
8.9%
8.0%
6.4%
Ac
- 50
by main are
were male
gender. Th
gure 9).
dietitians by
5
93.6%
cute
Grouped
0 -
ea of work f
(6.1%), 19
is proportio
y area of wo
56.8%
5
C
area of wor
for the study
99 were fe
n was main
rk (n = 212)
Acute
Commu
Mostly A
Mostly c
5.6%
96.4%
Community
k
y sample (n
male (93.4
ntained acro
unity
Acute
community
= 213)
4%); one
oss both
Male
Female

- 51 -
When considering the sample as a whole, the majority of responders (65.7%) had
been qualified for 10 years or less; with the greatest number of responders (n = 81,
38%) being qualified for >1-5 years. One responder failed to report the number of
years they had been qualified (table 5).
Table 5: Count and percentage of years qualified for the study sample (n = 213)
Years qualified Frequency Percent
0 - 1 year 20 9.4 >1 - 5 years 81 38 >5 - 10 years 39 18.3
>10 - 15 years 32 15 >15 - 20 years 14 6.6
>20 years 26 12.2 Missing data 1 0.5
Total 213 100
This pattern was also seen when considering acute and community groups. Ninety six
acute responders (68.7%) and 44 (60.3%) of community responders had been
qualified between 0 and 10 years, with the greatest proportion of acute and
community (41.4% and 31.5% respectively) responders reporting being qualified
within the >1-5 year category (figure 10).

- 52 -
an = 1 (1.4%) missing data
Figure 10: Percentage of dietitians for years qualified by area of work (n = 213)
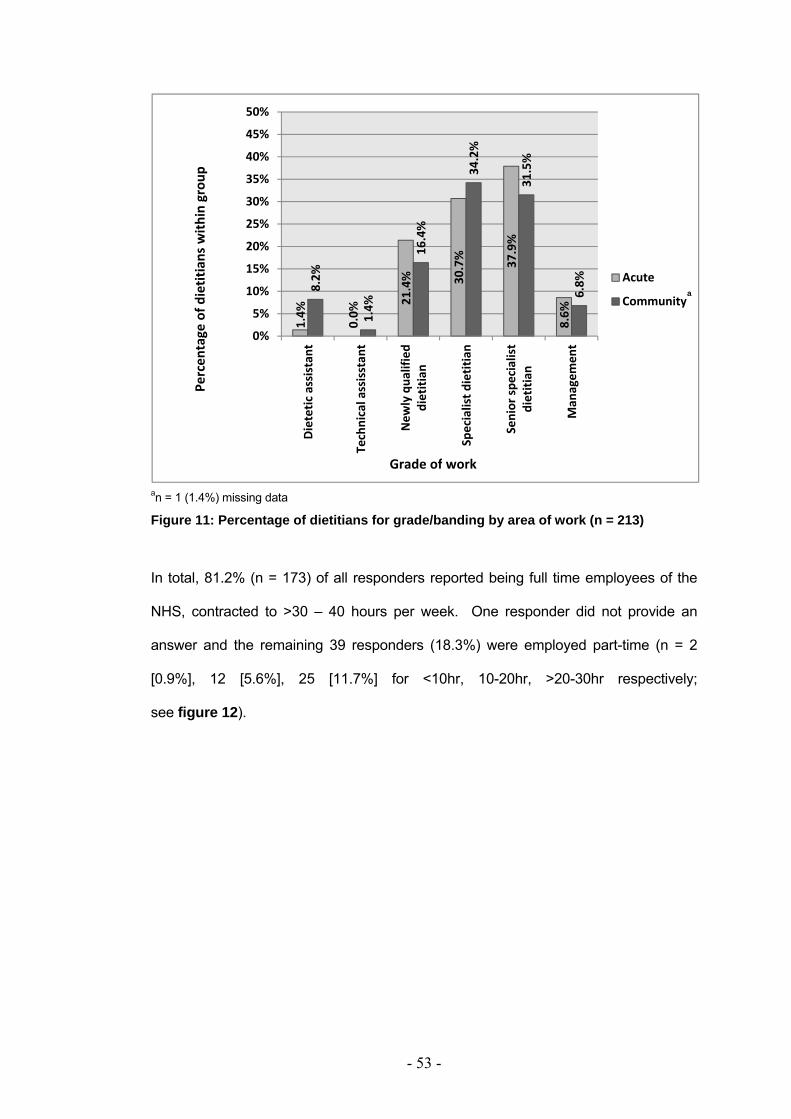
One hundred and eighty six (87.3%) of those completing the survey reported being
employed at Band 5-7 level (i.e. newly qualified to specialist dietitian). The majority of
responders reported being employed as specialist dietitians i.e. Band 6 and 7 (n = 68
[31.9%] and 76 [35.7%] respectively). This is true for the sample as a whole and
when considering acute and community groups (figure 11). One responder reported
being employed at Band 4 (1.4%) i.e. technical/dietetic assistant. Band 3 (i.e. dietetic
assistant) responders accounted for 3.8% (n=8). Eight percent were at band 8a (i.e.
managers) or higher (n=17). One responder failed to report an answer.
7.9%
41.4%
12.1%
7.9% 11.4%
12.3%
31.5%
20.5%
13.7%
19.3%
16.4%
4.1%
0%5%
10%15%
20%25%
30%35%
40%45%
50%
0 ‐ 1 year >1 ‐ 5years
>5 ‐ 10years
>10 ‐ 15years
>15 ‐ 20years
>20 years
Acute
Community
Percen
tage
of d
ietitians with
in group
Years Qualified
a
- 53 -
an = 1 (1.4%) missing data
Figure 11: Percentage of dietitians for grade/banding by area of work (n = 213)
In total, 81.2% (n = 173) of all responders reported being full time employees of the
NHS, contracted to >30 – 40 hours per week. One responder did not provide an
answer and the remaining 39 responders (18.3%) were employed part-time (n = 2
[0.9%], 12 [5.6%], 25 [11.7%] for <10hr, 10-20hr, >20-30hr respectively;
see figure 12).
1.4%
0.0%
21.4% 30.7% 37.9%
8.6%
8.2%
1.4%
16.4%
34.2%
31.5%
6.8%
0%
5%
10%
15%
20%
25%
30%
35%
40%
45%
50%
Dietetic
assistant
Technical assisstan
t
New
ly qua
lified
dietitian
Specialist d
ietitian
Senior spe
cialist
dietitian
Man
agem
ent
Acute
Community
Percen
tage of d
ietitians with
in group
Grade of work
a

- 54 -
an = 1 (1.4%) missing data
Figure 12: Percentage of dietitians for number of hours employed by area of work (n = 213)
Responders were asked to indicate their main sub-areas of work (multiple
responses were allowed). The most common sub-area of work overall was Nutrition
Support with 117 (55%) responders noting that they worked within this area in some
capacity. Figure 13 illustrates the top 6 areas of working for all responders. The top
6 areas of working account for more than half of all responses.
Chi squares analysis was unable to be conducted for individual sub-areas of
working for acute vs. community groups due to violation of the minimal cell
frequency assumption. Figure 14 represents the distribution of responses for sub-
area of working for acute and community dietitians.
0.7%
4.3%
10.7%
84.3%
1.4% 8.
2% 13.7%
75.3%
0%
10%
20%
30%
40%
50%
60%
70%
80%
90%
100%
< 10hrs
10 ‐ 20hrs
> 20
‐ 30hrs
> 30
‐ 40hrs
Acute
Community
Percen
tage of d
ietitians w
ithin group
Number of hours employed per week
a

- 55 -
a Sub-areas of working are not mutually exclusive (multiple responses allowed)
Figure 13: The 6 most prevalently chosen sub-areas of worka for the study sample (n=213)
48 51 54 58 60
117
0
20
40
60
80
100
120
140
Oncology
Gastro
Elde
rly
Diabe
tes
Weight
man
agem
ent
Nutritiona
lsupp
ort
Sub‐areas of work
Num
ber o
fDietitians

- 56 -
a Sub-areas of working are not mutually exclusive (multiple responses allowed)
Figure 14: Number of responses for sub-area of worka for acute and community dietitians for the study sample (n = 213)
0
10
20
30
40
50
60
70
80
Nutritional support
Surgical
Gastro
Oncology
Elde
rly
Diabetes
General m
edicine
Weight m
anagem
ent
Critial care
Liver d
isease
Paediatrics
Renal dise
ase
CVD
HETF
Palliative care
Neurosciences
Allergies
Infectious dise
ase
Cystic fibrosis
Eatin
g disorders
HIV
Metabolic dise
ase
Health promotion
Mental health
Other
Acute
Community
No of dietetitans w
ithin group
- 57 -
3.3.2. Nutritional screening tools
Responders were asked to note the nutritional screening tool used within their Trust.
The most commonly used screening tool was reported to be the Malnutrition
Universal Screening Tool (‘MUST’) (BAPEN, 2003). One hundred and forty six
responders (68.5%) reported using ‘MUST’ (n = 87 and 59 for acute and community
responders respectively). Chi-squared ( χ 2) analysis indicates that there was a
statistically significant greater number of acute, compared with community, dietitians
who reported using ‘MUST’ (α = 0.005, p < 0.05).
Similarly, a statistically significant greater number of acute dietitians reported using
their own screening tool compared with community dietitians (n= 45 (32%) and 9
(13%) respectively; α = 0.002, p < 0.05).
For all other screening tools there were no statistical differences between acute and
community dietitians reported use.
The least reported used screening tools were the Mini Nutritional Assessment
(MNA), Nutrition Risk Index (NRI), Subjective Global Assessment (SGA), The
Nursing Nutritional Screening Form (NNSF) and Prognostic Nutritional Index (PNI).
Seven responders reported not using a nutritional screening tool at all. Table 6
describes screening tool usage by acute and community dietitian groups.
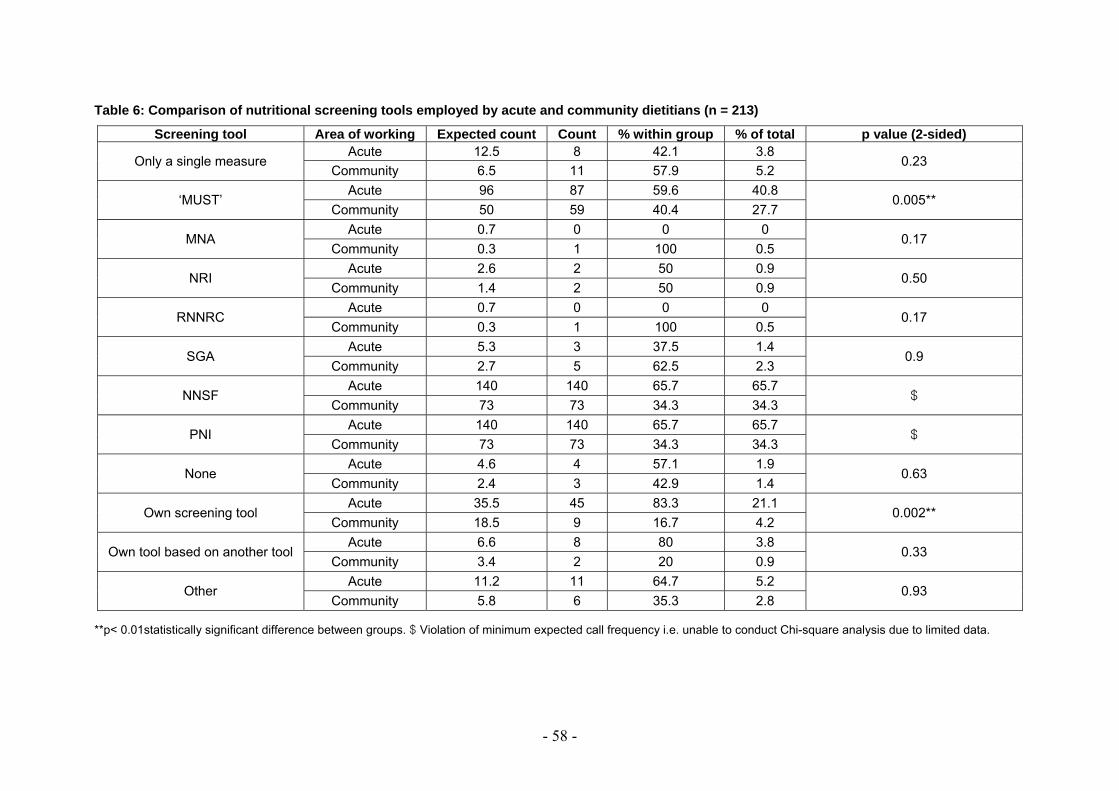
- 58 -
Table 6: Comparison of nutritional screening tools employed by acute and community dietitians (n = 213)
Screening tool Area of working Expected count Count % within group % of total p value (2-sided)
Only a single measure Acute 12.5 8 42.1 3.8
0.23 Community 6.5 11 57.9 5.2
‘MUST’ Acute 96 87 59.6 40.8
0.005** Community 50 59 40.4 27.7
MNA Acute 0.7 0 0 0
0.17 Community 0.3 1 100 0.5
NRI Acute 2.6 2 50 0.9
0.50 Community 1.4 2 50 0.9
RNNRC Acute 0.7 0 0 0
0.17 Community 0.3 1 100 0.5
SGA Acute 5.3 3 37.5 1.4
0.9 Community 2.7 5 62.5 2.3
NNSF Acute 140 140 65.7 65.7
$ Community 73 73 34.3 34.3
PNI Acute 140 140 65.7 65.7
$ Community 73 73 34.3 34.3
None Acute 4.6 4 57.1 1.9
0.63 Community 2.4 3 42.9 1.4
Own screening tool Acute 35.5 45 83.3 21.1
0.002** Community 18.5 9 16.7 4.2
Own tool based on another tool Acute 6.6 8 80 3.8
0.33 Community 3.4 2 20 0.9
Other Acute 11.2 11 64.7 5.2
0.93 Community 5.8 6 35.3 2.8
**p< 0.01statistically significant difference between groups. $ Violation of minimum expected call frequency i.e. unable to conduct Chi-square analysis due to limited data.

- 59 -
3.3.3. Perceived confidence
When confidence scores for taking anthropometric measurements are considered
as an average or overall confidence score (n = 206), via VAS assessment, results
appear to be normally distributed for both acute and community working dietitians.
This is shown via histograms and by the scores following closely the expected line
on normal probability plots (Normal Q-Q Plots) (Pallant, 2007).
Two hundred and six responders completed the confidence questions section (7
failed to fully complete this section). For the study sample confidence was greatest
for calculating BMI (96.4 + 7.7mm on 100mm VAS scale) followed by weight (94.6 +
9.5mm on 100mm VAS scale) and height (89.2 + 14.1mm on 100mm VAS scale).
Confidence for measuring head circumference and body mass via BodPod were
lowest of all the 13 anthropometric questions asked. Table 7 shows mean
confidence scores and descriptive statistics for all anthropometric measurements
assessed.
An independent samples t-test was conducted to compare the confidence scores
between acute and community working dietitians for each of the anthropometric
measures questioned. There were statistically significant differences between the
mean confidence scores for acute and community dietitians when taking skin fold
(α=0.000; p<0.01), MAC (α=0.000; p<0.01), demi-span (α=0.001; p<0.01), knee
height (α=0.001; p<0.01) and head circumference (α=0.002; p<0.01) measurements
(table 7).
There was no statistically significant difference in average confidence ratings for
taking height, weight, BMI, ulna length, WC, hip circumference, WHR, and BodPod
measurements between acute and community working dietitians.
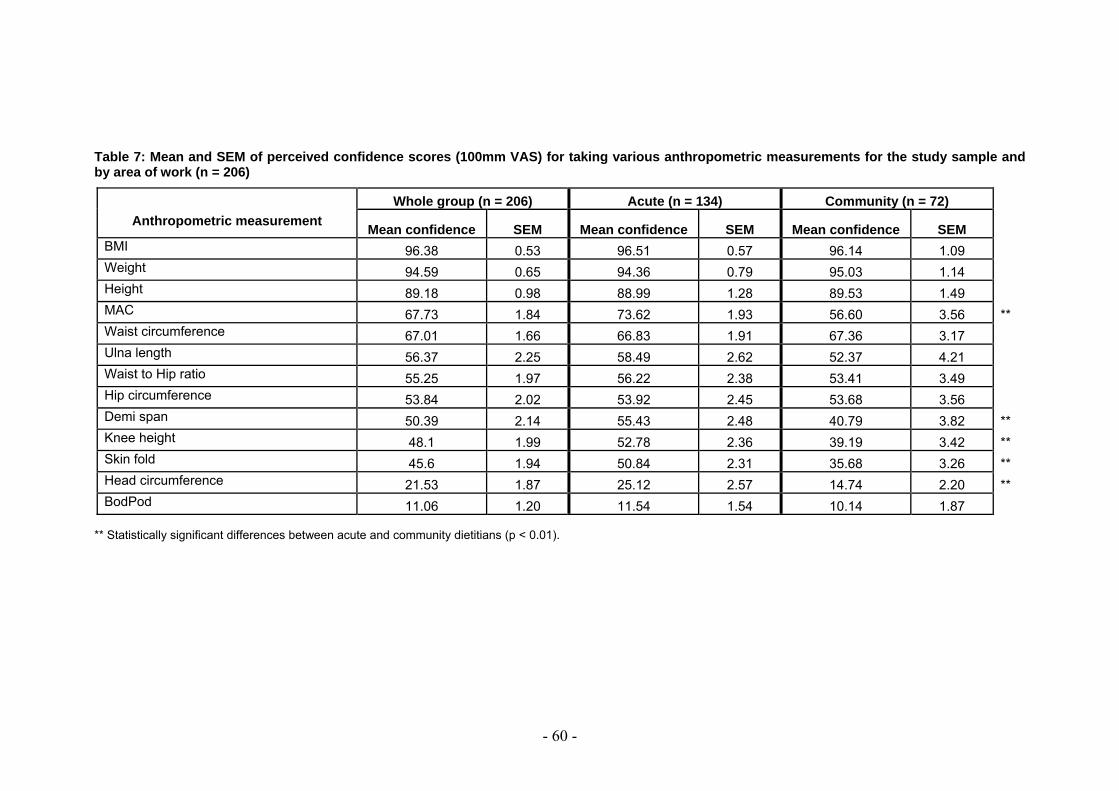
- 60 -
Table 7: Mean and SEM of perceived confidence scores (100mm VAS) for taking various anthropometric measurements for the study sample and by area of work (n = 206)
Anthropometric measurement
Whole group (n = 206) Acute (n = 134) Community (n = 72)
Mean confidence SEM Mean confidence SEM Mean confidence SEM BMI 96.38 0.53 96.51 0.57 96.14 1.09 Weight 94.59 0.65 94.36 0.79 95.03 1.14 Height 89.18 0.98 88.99 1.28 89.53 1.49 MAC 67.73 1.84 73.62 1.93 56.60 3.56 ** Waist circumference 67.01 1.66 66.83 1.91 67.36 3.17 Ulna length 56.37 2.25 58.49 2.62 52.37 4.21 Waist to Hip ratio 55.25 1.97 56.22 2.38 53.41 3.49 Hip circumference 53.84 2.02 53.92 2.45 53.68 3.56 Demi span 50.39 2.14 55.43 2.48 40.79 3.82 ** Knee height 48.1 1.99 52.78 2.36 39.19 3.42 ** Skin fold 45.6 1.94 50.84 2.31 35.68 3.26 ** Head circumference 21.53 1.87 25.12 2.57 14.74 2.20 ** BodPod 11.06 1.20 11.54 1.54 10.14 1.87
** Statistically significant differences between acute and community dietitians (p < 0.01).

An indepe
confidence
dietitians’
α = 0.002
(communi
12.11mm
17-85mm
**p <0.01, st
Figure 15:area of wo
endent sam
e of comm
confidence
2; p< 0.01).
ty mean: 5
on 100mm
for acute a
tatistically sign
Average coork (n = 206)
mples t-tes
munity dietiti
e scores at
Both group
54.21 + 14
VAS) with
nd commun
nificant differe
onfidence s)
- 61
st (equal v
ians was s
taking anth
ps have a w
.78mm on
no outliers
nity dietitian
ence between
scores when
60.27
1 -
variance as
statistically
hropometric
wide range
100mm VA
or extreme
ns respectiv
acute and com
n taking ant
ssumed) sh
significantly
c measures
of average
AS and acu
e points ran
vely), see fig
mmunity mean
thropometric
howed that
y lower tha
s (significan
e confidence
ute mean:
nges: 32-92
gure 15.
n confidence s
c measurem
54.21**
t overall
an acute
nce level
e scores
60.27 +
mm and
scores
ments by

- 62 -
In summary, community dietitians reported significantly lower confidence ratings
when measuring anthropometry in general than acute dietitians. Acute dietitians
were more confident when taking skin fold, MAC, demi-span, knee height and head
circumference measurements specifically.
3.3.4. Frequency of use
The majority of anthropometric measurements questioned were reported to be taken,
by both community and acute working dietitians, on an infrequent basis i.e. “Never”
or “Less than monthly”. Although not statistically tested, due to small numbers per
response option, there appears to be a significantly higher proportion of acute
dietitians taking measurements frequently i.e. “Daily” (14.8%) than community (7.9%)
dietitians (figure 16). Three responders failed to complete all frequency of use
questions.
Figure 16: Percentage of dietitians for frequency of anthropometric use for all measurements by area of work (n = 210)
53.0%60.4%
18.0%16.3%
5.4%6.2%8.8%9.2%
14.8%7.9%
0%
10%
20%
30%
40%
50%
60%
70%
80%
90%
100%
Acute Community
Daily
At least weekly
At least monthly
Less than monthly
Never
Grouped area of work
Percen
tage of d
ietitians with
in group

- 63 -
The measurements reported to be taken on a ‘Daily’ basis were the same for both
acute and community dietitians. Figures 17 and 18 illustrate that weights and
heights were the most commonly ‘Daily’ used anthropometric measurements
including: measured, estimated and recalled weight, measured and recalled height,
and BMI. Figure 19 highlights the most prevalently rated ‘Never’ used
anthropometric measures for all responders by area of work, in order of prevalence
of acute responses.
Figure 17: Percentage of acute dietitians for ‘Daily’ anthropometry use (n = 140)
0.0%
0.5%
1.0%
1.5%
2.0%
2.5%
3.0%
3.5%
Percen
tage
of d
ietitians w
ithin group
Anthropometric Measurement
*Other including: estimated height from demi span/knee height/ulna length, other skin fold, MAC, Head circumference, BIA, Hand grip, DEXA, all used 0% daily

- 64 -
Figure 18: Percentage of community dietitians for ‘Daily’ anthropometry use (n = 73)
0.0%
0.5%
1.0%
1.5%
2.0%
2.5%
3.0%
3.5%
Percen
tage
of d
ietitians w
ithin group
Anthropometric Measurement
*Other including: estimated height from knee height, Other skin fold, Waist circumference, Hip circumference, Waist:hip ratio, BIA, DEXA - all used 0% daily
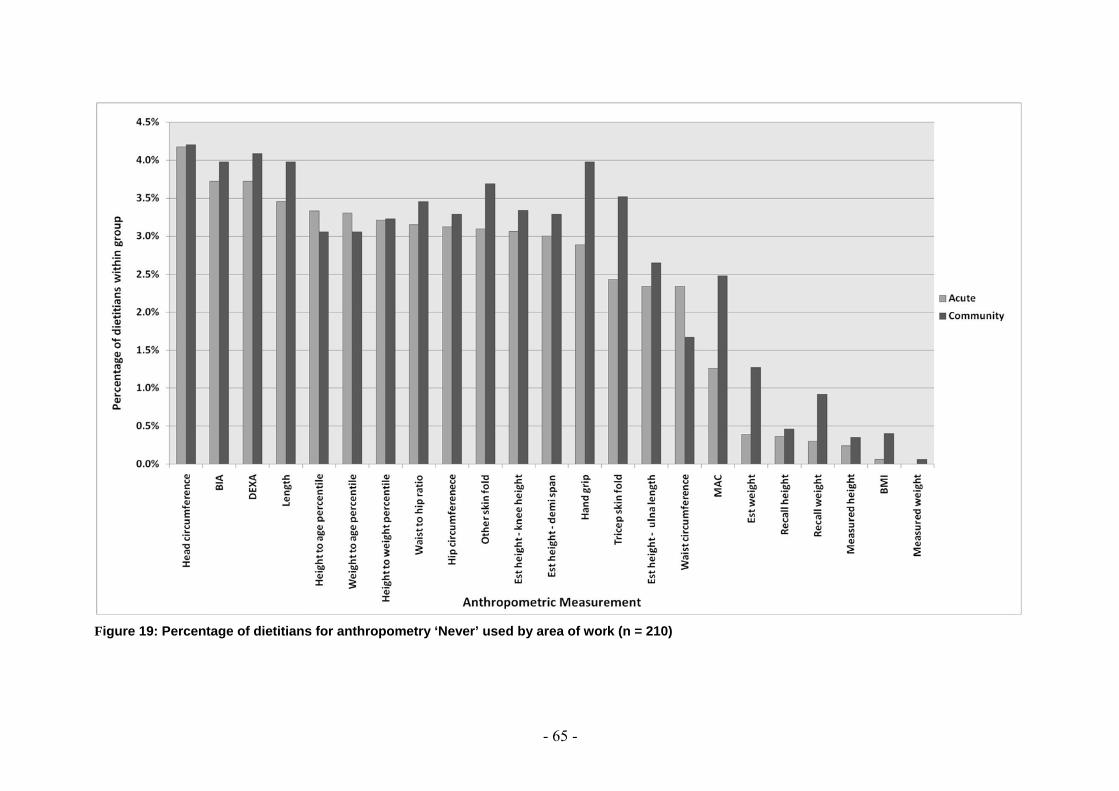
FFigure 19: Percenntage of dietitians for anthropommetry ‘Never’ used
- 65 -
d by area of worrk (n = 210)
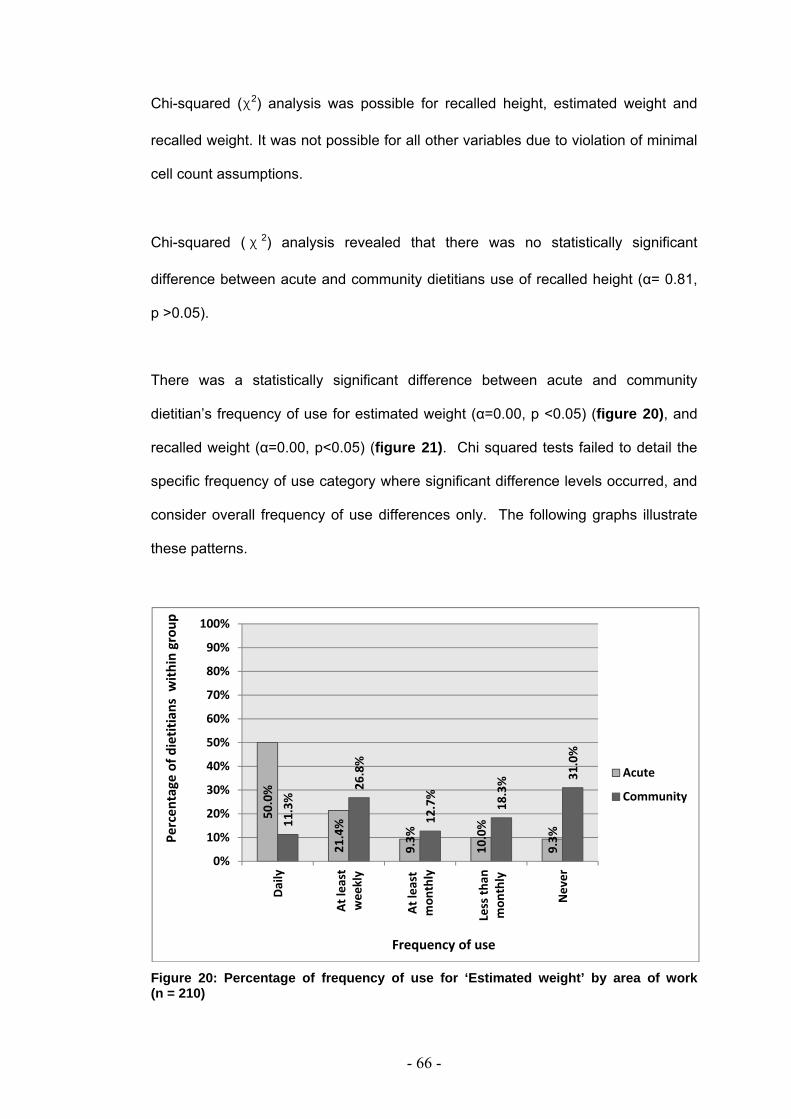
- 66 -
Chi-squared (χ2) analysis was possible for recalled height, estimated weight and
recalled weight. It was not possible for all other variables due to violation of minimal
cell count assumptions.
Chi-squared ( χ 2) analysis revealed that there was no statistically significant
difference between acute and community dietitians use of recalled height (α= 0.81,
p >0.05).
There was a statistically significant difference between acute and community
dietitian’s frequency of use for estimated weight (α=0.00, p <0.05) (figure 20), and
recalled weight (α=0.00, p<0.05) (figure 21). Chi squared tests failed to detail the
specific frequency of use category where significant difference levels occurred, and
consider overall frequency of use differences only. The following graphs illustrate
these patterns.
Figure 20: Percentage of frequency of use for ‘Estimated weight’ by area of work (n = 210)
50.0%
21.4%
9.3%
10.0%
9.3%
11.3%
26.8%
12.7%
18.3% 31
.0%
0%
10%
20%
30%
40%
50%
60%
70%
80%
90%
100%
Daily
At least
weekly
At least
mon
thly
Less th
anmon
thly
Never
Acute
Community
Percen
tage of d
ietitians
with
in group
Frequency of use

- 67 -
Figure 21: Percentage of frequency of use for ‘Recalled weight’ by area of work (n = 210)
The summary of this analysis suggests that anthropometry in general is taken on an
infrequent basis as estimated and recalled weights do not make use of any
measurements. Acute dietitians reported taking measurements on a ‘Daily’ basis
more frequently than community colleagues with heights, weights and BMI being
most commonly used measures. There is a significant difference between groups in
the use of estimated and recalled weight (p <0.05).
3.3.5. Perceived barriers
The most commonly chosen reason as a barrier towards taking anthropometric
measurements for the whole group was “not appropriate for patient” which
accounted for over 15% of all indicated reasons; followed by “lack of equipment” and
“time constraints / work load”, which accounted for 13.3% and 10.7% respectively of
all indicated barriers.
50.7%
25.7%
7.9%
8.6%
7.1%
11.4% 24
.3%
21.4%
20.0%
22.9%
0%
10%
20%
30%
40%
50%
60%
70%
80%
90%
100%
Daily
At least
weekly
At least
mon
thly
Less th
anmon
thly
Never
Acute
Community
Percen
tage
of dietitians
with
in group
Frequency of use

- 68 -
When considering acute and community dietitians separately, both groups indicated
that “not appropriate for patient” was the most commonly chosen barrier (9.9% and
5.8% within group respectively). Similarly, “lack of equipment” was the second most
prevalent barrier choice (9.2% for acute and 4.1% for community). The third most
commonly indicated barrier towards anthropometry differed between the groups.
“Time constraints / work load” was more commonly chosen by acute (11.7%) than
community responders (8.4%); whereas “Don’t feel I need to” was more commonly
chosen by community (12.3%) than acute (7.9%) colleagues (table 8).
Table 8: Perceived barriers of anthropometric use by acute and community dietitians (n = 213)
Count (% within group total)
Barriers (Multiple choice) 'Acute' 'Community' Total Not appropriate for patient 91 (14.4%) 53 (18.6%) 144 (15.7%)
Lack of equipment 84 (13.3%) 38 (13.3%) 122 (13.3%)
Time constraint/work load 74 (11.7%) 24 (8.4%)* 98 (10.7%)
Lack of training 60 (9.5%) 29 (10.2%) 89 (9.7%)
Don't need to 50 (7.9%) 35 (12.3%) 85 (9.3%)
Lack of confidence 48 (7.6%) 11 (3.9%)** 59 (6.4%)
Lack of competency 42 (6.6%) 20 (7.0%) 62 (6.8%)
Too invasive 41 (6.5%) 10 (3.5%) 51 (5.6%)
Not required by department policy 38 (6.0%) 10 (3.5%) 48 (5.2%)
Taken by other health professionals 24 (3.8%) 15 (5.3%) 39 (4.2%)
No accurate equipment 22 (3.5%) 9 (3.2%) 31 (3.4%)
Patients do not like it 19 (3.0%) 11 (3.9%) 30 (3.3%)
Other 16 (2.5%) 2 (0.7%) 18 (2.0%)
Lack of evidence 14 (2.2%) 14 (4.9%) 28 (3.1%)
Useful in research only 10 (1.6%) 4 (1.4%) 14 (1.5%)
TOTAL 633 (100%) 285 (100%) 918 (100%) * Statistically significant differences between groups (p < 0.05) ** Statistically significant differences between groups (p < 0.01)
- 69 -
A chi-squared ( χ 2) analysis for the difference in perceived barriers towards
anthropometric measurements between acute and community dietitians revealed a
statistically significant difference for “lack of confidence” and “time constraints / work
load” as indicated barriers.
For “lack of confidence” acute dietitians expected counts were 38.8, whereas actual
count was 48, and for community expected count was 20.2, whereas actual count
was 11. Pearson χ2 analysis indicated a significance level (2 sided) of 0.003;
p < 0.01.
For “time constraints” acute dietitian’s expected and actual counts were 64.4 and 74
respectively and community dietitian’s were 33.6 and 24 respectively. Pearson χ2
analysis indicates a significance level of 0.05 (p < 0.05).
A Chi squared analysis was unable to be conducted for the barrier “useful in
research only” as the minimum expected cell frequency was violated. All other
barriers were not significantly different between acute and community dietitians
(p >0.05).
The conclusion of this analysis is that a statistically significant greater proportion of
acute dietitians rated ‘lack of confidence’ and ‘time constraints’ as barriers towards
anthropometry than community colleagues. Therefore, the alternative hypothesis
can be accepted as there was a significant difference between area of work in
perceived barriers (namely, ‘lack of confidence’ and ‘time constraint / work load’).

- 70 -
3.3.6. Attitudes towards anthropometry
The results for all the 15 attitude items, rated on a 5 point Likert scale, were
combined to investigate the total attitude towards anthropometry. Descriptive
statistics and a histogram (figure 22) indicate that there was a slight bias towards
“positive attitudes” to anthropometry for the study sample overall (n = 205; 8
responders failed to complete all 15 sub-questions). The average score was 38.9
(i.e. closer to 15 than 75), with a SD of 5.51 (median 38.0, mode 37.0, minimum
value 27 and maximum value 64) for the study sample.
Figure 22: Distribution of attitude scores towards anthropometry for the study sample (n = 205)
There is no significant difference between acute (38.64; SD 5.2, min = 30, max = 53)
and community (39.31; SD 6.08, min = 27, max = 64) responders overall (mean)
attitude scores towards anthropometry (p >0.05), figure 23.
0
1
2
3
4
5
6
7
8
9
10
15 17 19 21 23 25 27 29 31 33 35 37 39 41 43 45 47 49 51 53 55 57 59 61 63 65 67 69 71 73 75Attitud
e score as a percentage of re
spon
ses
Total Attitude Score (Likert scale range 15 ‐ 75)Positive Negative

- 71 -
Figure 23: Comparison of mean attitude scores towards anthropometry use by acute and community dietitians (n = 205)
Chi-squared analysis was not possible for individual attitude questions as the
minimum cell frequency assumption had been violated. Statistically significant
differences between acute and community responder’s perception of attitude towards
such questions could therefore not be assessed, an exploration of the results,
however, is presented below.
When considering the group as a whole it was found that there was not a majority
positive or negative attitude towards the following, with an approximate equal
distribution of those ‘agreeing’ and ‘disagreeing’ or the majority of responders
reporting being ‘uncertain’:
- ‘Skin fold measurements provide little additional information beyond weight’,
- ‘Patients do not like invasive measurements’,
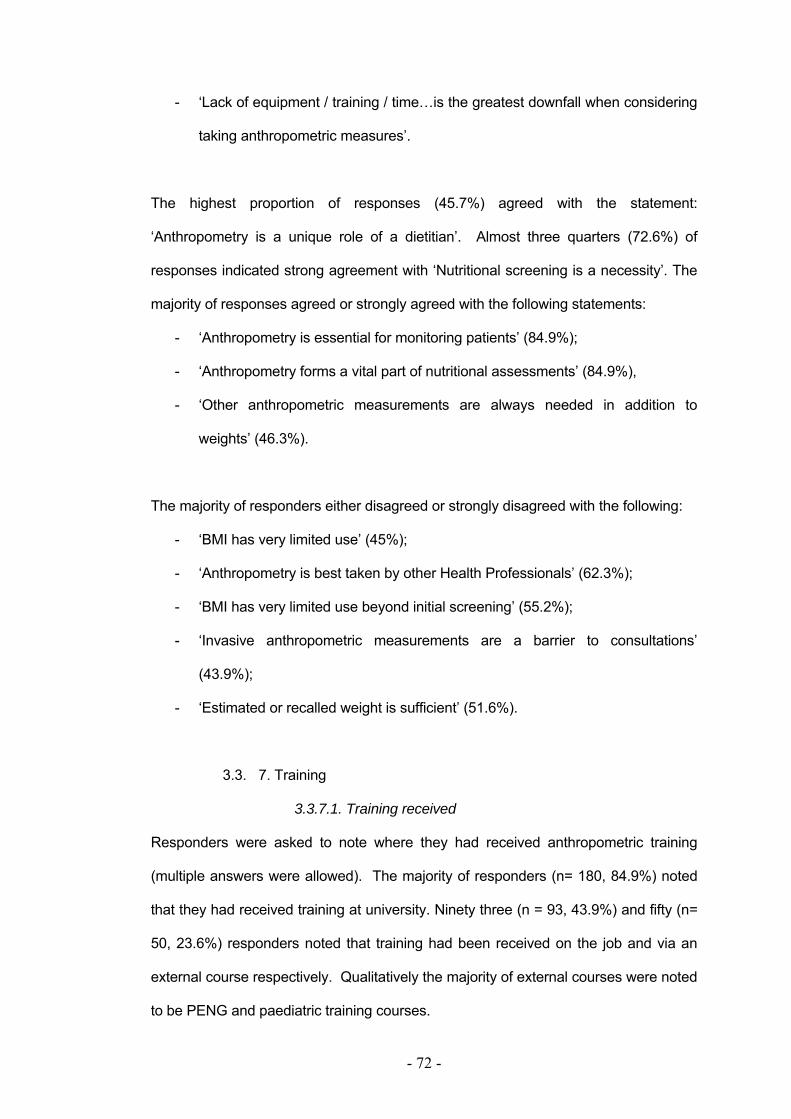
- 72 -
- ‘Lack of equipment / training / time…is the greatest downfall when considering
taking anthropometric measures’.
The highest proportion of responses (45.7%) agreed with the statement:
‘Anthropometry is a unique role of a dietitian’. Almost three quarters (72.6%) of
responses indicated strong agreement with ‘Nutritional screening is a necessity’. The
majority of responses agreed or strongly agreed with the following statements:
- ‘Anthropometry is essential for monitoring patients’ (84.9%);
- ‘Anthropometry forms a vital part of nutritional assessments’ (84.9%),
- ‘Other anthropometric measurements are always needed in addition to
weights’ (46.3%).
The majority of responders either disagreed or strongly disagreed with the following:
- ‘BMI has very limited use’ (45%);
- ‘Anthropometry is best taken by other Health Professionals’ (62.3%);
- ‘BMI has very limited use beyond initial screening’ (55.2%);
- ‘Invasive anthropometric measurements are a barrier to consultations’
(43.9%);
- ‘Estimated or recalled weight is sufficient’ (51.6%).
3.3. 7. Training
3.3.7.1. Training received
Responders were asked to note where they had received anthropometric training
(multiple answers were allowed). The majority of responders (n= 180, 84.9%) noted
that they had received training at university. Ninety three (n = 93, 43.9%) and fifty (n=
50, 23.6%) responders noted that training had been received on the job and via an
external course respectively. Qualitatively the majority of external courses were noted
to be PENG and paediatric training courses.

- 73 -
Almost 1.4% of responders (n = 3), all of which were noted to be community
responders, reported that they had received no anthropometric training.
Chi-squared (χ2) analysis was conducted to investigate if there was a relationship
between area of work and training received. The minimum expected cell frequency
was violated for the ‘No training’ and ‘Other’ categories. Analysis could therefore not
take place for these categories but was performed for training received at university,
on the job and at an external course (figure 24).
Using Yates’ Correct for Continuity (2 by 2 design) a statistically significant difference
was detected (Correction for Continuity significance level (2 sided) was 0.002 [p <
0.01]) when considering area of work and training at university. The effect of Yates'
correction is to prevent overestimation of statistical significance for small data, which
is argued to occur if employing Pearson’s χ2. This formula is chiefly used when at
least one cell of the table has an expected count smaller than 5 (i.e. with 2 x 1 and 2
x 2 contingency tables - when variables are limited and fixed) (Pallant, 207).
Significantly more acute (90.7%) than community (73.6%) dietitians had received
training at university. This held when considering area of work and external training
courses, with more acute dietitians (28.6%) than community dietitians (13.9%)
attending external courses (α= 0.027, p<0.05).
Chi-squared (χ2) analysis did not show any significant differences between acute
(39.3%) and community (52.8%) dietitians for training location for ‘training on the job’
(figure 24).
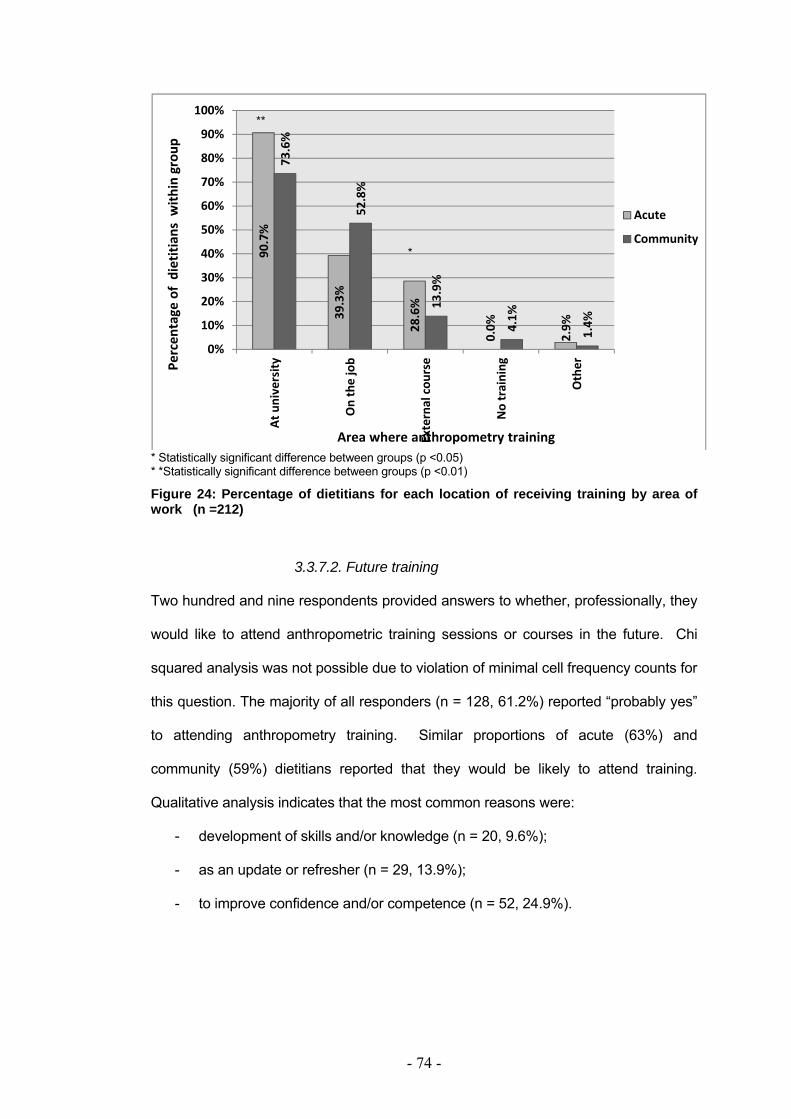
- 74 -
* Statistically significant difference between groups (p <0.05) * *Statistically significant difference between groups (p <0.01)
Figure 24: Percentage of dietitians for each location of receiving training by area of work (n =212)
3.3.7.2. Future training
Two hundred and nine respondents provided answers to whether, professionally, they
would like to attend anthropometric training sessions or courses in the future. Chi
squared analysis was not possible due to violation of minimal cell frequency counts for
this question. The majority of all responders (n = 128, 61.2%) reported “probably yes”
to attending anthropometry training. Similar proportions of acute (63%) and
community (59%) dietitians reported that they would be likely to attend training.
Qualitative analysis indicates that the most common reasons were:
- development of skills and/or knowledge (n = 20, 9.6%);
- as an update or refresher (n = 29, 13.9%);
- to improve confidence and/or competence (n = 52, 24.9%).
90.7%
39.3%
28.6%
0.0%
2.9%
73.6%
52.8%
13.9%
4.1%
1.4%
0%
10%
20%
30%
40%
50%
60%
70%
80%
90%
100%
At university
On the job
External cou
rse
No training
Other
Acute
Community
Percen
tage of dietitian
s with
in group
Area where anthropometry training
**
*

- 75 -
Fifty one (n = 51, 24.4%) of responders reported that they would “probably not” attend
future anthropometry training, with slightly higher rates of community dietitians (30%)
compared with acute dietitians (22%). Qualitative analysis revealed the most
commonly reported reasons were: already trained (e.g. PENG, ISAK) (n = 8), have
received sufficient on the job training/happy with own skills (n = 9), would not change
practice/affect patient care (n = 2) and not relevant to job/role/not priority/for research
(n = 27). It should be noted that many of those reporting that further anthropometric
training would not be relevant to job/role also indicated working within weight
management, paediatrics, critical care and community settings (however, these jobs
do involve anthropometric measurement use).
Twenty nine (n = 29, 14%) respondents reported that they may consider further
training in the future, with slightly higher rates of acute (15%) compared with
community (11%) dietitians (figure 25).
Figure 25: Percentage of dietitians indicating interest/decline for future training by area of work (n =209)
62.6%
21.6%
15.1%
58.6%
30.0%
11.4%
0%
10%
20%
30%
40%
50%
60%
70%
80%
90%
100%
Probably yes Probably no Possibly in future
Acute
Community
Percen
tage of d
ietitians w
ithin group
Response options

- 76 -
In summary, there was a significant difference between area of work and training
received: acute dietitians appeared to have received more training at university and
on external courses than community dietitians. More community dietitians appeared
to have received training ‘on the job’. The majority of all responders would attend
future anthropometric training, with slightly greater numbers of acute dietitians than
community responders.
- 77 -
4. DISCUSSION
4.1. Summary of findings
The aim of this study was to investigate the use of and barriers and attitudes
towards using anthropometric measurements by NHS dietitians in the North West of
England. For this, a questionnaire assessing anthropometric use, barriers and
attitudes was designed, piloted and validated amongst a sample of 32 dietitians.
Analysis of confidence scales indiacted that the VAS was comparible to Likert, in
terms of sensitivity and reproducibility, hence supporting the use of the VAS as a tool
for assessing confidence when taking anthropometric measurements by dietitians.
The primary, null, hypothesis was that there would be no significant differences in
the type, frequency of, and attitudes/barriers towards, anthropometric measurement
use between community and acute working dietitians.
A summary of the findings include: a response rate of 54% (n=213) was achieved,
140 (65.7%) of which were acute and 73 (34.5%) community based; and 6.1% (n=13)
were male. The majority of responders were qualified >1-5years (n=81, 38%),
reported being band 5-7 (n=186, 87.5%) and were in full time employment with the
NHS (n=173, 81.2%). Over half of responders reported working within nutritional
support (n=117, 55%). The most commonly used nutritional screening tool was
‘MUST’ (n=146, 54.7%). The use of ‘MUST’ was statistically significantly higher
amongst acute compared with community dietitians (n=87 vs. 59 respectively; p<0.05).
Highest confidence ratings were for BMI, height and weight, and lowest for BodPod
and head circumference, with significant differences between groups’ average, overall,
confidence scores (community: 54.21 + 14.78mm; acute: 60.27 + 12.11mm; p<0.05).

- 78 -
The majority of anthropometric measures were reported to be taken on an infrequent
basis (‘Never’/’Less than monthly’). Height, weight, BMI were most commonly used;
especially recalled/estimated, which were both statistically different between groups
(p<0.05), with acute responders using more frequently than community responders.
The most prevalent barrier was ‘Not appropriate for patient’, followed by ‘Lack of
equipment’ and ‘Time/work load constraints’. Significantly more acute responders
reported ‘Time’ (81.4%) and ‘Confidence’ (75.5%) to be barriers to anthropometry use.
The majority of responders (84.9%) reported receiving anthropometry training at
university: with a significantly (p<0.05) higher proportion of acute (90.7%) than
community (73.6%) dietitians; similarly, more acute (28.6%) compared with
community (13.9%) responders reported receiving external courses on anthropometry
(p < 0.05). One hundred and twenty eight (61.2%) of dietitians reported a preference
to attend future anthropometry training, primary reasons being to increase confidence
and competence.

- 79 -
4.2. Validation study discussion
The Likert scale is a commonly used scale applied to assess thoughts, attitudes and
preferences (Likert, 1932 cited in Bartoshuk et al., 2004). It is a scale that is able to
assess one’s level of agreement with a sentence. It is thought to be simple to replicate
to many scenarios and easily understood and completed by participants. This scale
generates data which is easily interpreted and analysed due to the use of categorical
data with only 5 response options available. As aforementioned in the introduction,
this ‘ease of use’ can however also be a limitation, offering responders a limited 1 in 5
option scale, decreasing its’ sensitivity. Continuous (linear) scales such as the
100mm VAS offer greater choice of answers so increases sensitivity and do not
assume each responder perceives that interval gaps are of equal size; similarly by
not having several labels along the scale the responders’ answer is not influenced.
The General Label Magnitude Scale (gLMS) (Bartoshuk et al., 2004), a longer,
vertical scale, allows sensations to be moderated or normalised, facilitating group
comparisons, by having labels along the scale and an extreme, maximum label to
allow sensations to be moderated. There may be however a greater error due to
misinterpretation of the scale and confusion of how to use this (Cardello et al., 2003).
This study’s analysis indicates that the VAS and the Likert scales, tested for attitude
have similar sensitivity, with the VAS having a slightly smaller SD range, potentially
indicating it as a preferred choice to assess confidence at taking anthropometric
measures. Flint et al. (2000) suggested also that the VAS could be a reliable means
of assessing appetite feelings. They similarly applied Bland-Altman analysis to test
reproducibility, although accentuated that parameters and study power (sample size),
need to be considered if VAS are to be used to asses appetite feelings.
- 80 -
On the other hand, the gLMS is not as commonly seen or used as the Likert and VAS
scales, with anecdotal reports of difficulty to understand and use. The gLMS was
originally designed and reported to be a valid tool to assess taste sensations, with the
advantage of being able to compare responses amongst participants as labels are not
proportionally displayed but based on actual feelings (Bartoshuk et al., 2004). The
present study analysis revealed that the gLMS for confidence was the least sensitive
tool to assess confidence at taking anthropometric measures of the three scales
tested. Statistically significant differences (p<0.05) were detected in means [SEM]
(VAS 55.1 [2.49], for gLMS 36.9 [2.54] and for Likert 55.7 [2.98]), a greater
difference in mean scores with Likert (18.82) and a greater coefficient of
reproducibility (44.5%) when using gLMS compared with Likert and VAS; meaning
increased variability and reduced reproducibility of gLMS as a scale to assess
confidence at taking anthropometry by dietitians. It must be considered, however, that
gLMS may still be a sensitive tool (SD and SEM scores are comparable to the two
other scales tested), but perhaps due to the extreme anchor labels results are biased
to a lower mean – which has been interpreted via the tests applied within this study as
lower sensitivity. The ranges of limits of agreement, in comparison to the commonly
used Likert scale, were significantly smaller when using VAS compared with gLMS.
This can be interpreted as showing that the Likert and VAS could be used
interchangeably, namely due to comparable SD scores (Likert 16.8 and VAS 14.1).
All three scales, however, do appear to be reliable, with scores falling within the British
Standards Institution guidelines (1975) for repeatability, as 95% of scores fall within 2
SD of the mean limit when repeated tests were conducted.
In conclusion, VAS was thought to be a user-friendly tool, which was reliable and
sensitive, thus selected as the tool to assess confidence at taking anthropometric
measurements by dietitians within the main questionnaire design.
- 81 -
4.3. Main study discussion
4.3.1. Response rate
A postal questionnaire was sent to all consenting NHS dietetic departments in the
North West of England. The response rate to the questionnaire (54%, n = 213 out of
the 397 questionnaires posted) exceeded expectations. Other survey based studies
targeting UK dietitians have generated a response rate of ~30% (Burgess, 2003;
McKenna et al., 2004; Whyand, 2007). The higher response rate of this study could
be due to its robust methodology of piloting, short questionnaire with non-ambiguous
questions, contact with departments via phone call and two reminder follow up
contacts (Edwards et al., 2001; Smeeth & Fletcher, 2002; Streiner & Normal, 2008).
4.3.2. Sample demographics
More acute working dietitians, or those primarily based within a hospital setting,
responded to the survey compared with those working within the community
environment. This may be related to a large number of dietitians working within the
hospital setting compared with community in this sample, or that community dietitians
may be more difficult to target due to the nature of their job (non-fixed location) and
may have more than one base. Despite this, statistical tests allowed for differences
within group size, and results have been quoted as ‘percentage within group’ to allow
for group comparisons.
Only six percent of responders were male which was expected; anecdotal evidence
and experience indicates that the majority of HPC registered dietitians are female.
NHS data also supports this, with figures for 2009 indicating that only 17% of all
scientific, therapeutic and technical staff were male across the whole NHS (The health
and social care centre, 2009). There was an equal distribution of male responders in
both acute and community settings therefore it may be said that answers are unlikely
to have been biased by gender trends (i.e. if males are more confident than females).

- 82 -
The survey was offered to all dietitians and dietetic assistants working in the North
West of England in an NHS trust. The majority of responders reported being
employed at band 5 to 7 level (i.e. newly qualified to specialist/senior specialist
dietitians). It may therefore be assumed that the majority of responders are qualified
and registered dietitians (i.e. not dietetic assistants). Dietitians are likely to be
involved with patient face-to-face contact and are likely to perform nutritional
assessments and monitoring of treatment plans as part of their everyday role. Hence,
responders are likely to be aware of and/or use anthropometric measures (Baxter,
1999). Often those employed at band 8a or above are involved in managerial roles
thus may have less exposure to patients and therefore it can be assumed that they
may have less opportunity to take anthropometric measures.
Interestingly, there were more responders banded 3 and 4 (i.e. dietetic assistants, or
non-registered dietitians) in the community setting. The job roles and responsibilities
of this participant group are likely to differ across trusts. However, it may be possible
that dietetic assistants are appropriately placed to monitor and review patients thus
increasing their exposure to anthropometric use hence involvement within the current
study was encouraged. Conversely, due to possible variations in training provision
this participant group may not use and/or are not confident at taking anthropometry.
More detailed exploration of this was beyond the scope of this work.
Porter et al. (2009) recently considered factors that impact on nutritional screening
occurrences, namely workload, uncertainty of the nutrition policies and individual skill
in using suggested screening tools. Albeit a small study using quantitative data (retro-
and prospective counts of patient nutrition screening rates) and qualitative data
(convenience sample of 18 staff nurses in a focus group) it highlighted that staff
nurses and/or nutrition assistants are ideally placed to conduct simple screening tools
- 83 -
that often involve height, weight and BMI measures across all patient groups.
Dietitians are then able to apply more complex assessment, perhaps including other
anthropometric tools e.g. grip strength, skin folds, circumferences and/or ratio
measures which are likely to detail a dietetic assessment including nutritional
requirement calculations (Gibson, 2005).
Over half of responders were involved with providing nutritional support therapy to
patients. This patient group is likely to be malnourished, or at risk of malnutrition
(NICE, 2006, BAPEN, 2008a). It is logical therefore to assume that NICE (2006)
guidelines for nutritional support in adults are known to the majority of responders.
NICE guidelines detail the use of anthropometry within this patient group. Guidance
includes the recommendation for daily weights, BMI to be calculated on the initial
assessment and monthly thereafter and the use of MAC and triceps skin fold on a
monthly basis should measured weights be unobtainable. Indeed, their description of
malnutrition itself involves the use of BMI (thus weight and height) and percentage
weight loss (i.e. repeated measurements of weight over time).
Despite this, MAC and triceps skin folds were not reported as being conducted on a
frequent basis amongst our sample of dietitians. Perhaps the dietitians sampled are
relying on estimated or recalled information from the patient, friends, family members,
more than on measured weight or alternative objective measures such as MAC and
triceps skin folds. This is supported by recalled weight and height being reported
within the top 5 ‘daily’ used measures for both community and acute responders and
by ‘lack of time’ also being a highly prevalently chosen barrier. There is, however,
a lack of literature available regarding frequency of use of anthropometry and use of
measured vs. estimated anthropometry available to support this finding.

- 84 -
4.3.3. Screening tools used
‘MUST’ was reported as the most commonly employed nutrition screening tool, not
surprisingly due to its validity, reliability and ease of use (BAPEN, 2006). ‘MUST’ is a
well publicized screening tool with training literature being available to aid its role out
into trusts across the UK (BAPEN, 2006). ‘MUST’ also provides details on appropriate
surrogate measures of weight and height such as knee height, ulna length, demi-span
and MAC, to ensure objective data are used to screen patients as accurately as
possible. It would, therefore, be logical to predict that these surrogate measures, as
well as height, weight and BMI would be routinely used by dietitians. Despite this
neither community nor acute responders reported using knee height, ulna length,
demi-span or MAC on a frequent basis. No responders reported using knee height
daily, 1 responder(s) reported demi-span, ulna length and MAC use daily, with weekly
use ranging from 2-22 responders for these methods. All of these methods were
most prevalently rated as ‘Never’ used. These measurements are of course more
time consuming and more difficult to perform (Gibson, 2005). Seven participants
reported that they do not use a screening tool; it is possible that this is due to lack of
awareness of local policy (Porter et al., 2009), or it not being a priority or part of their
job role. It is possible that if a nutritional screening tool is not employed,
anthropometry is not likely to be part of routine assessment.
4.3.4. Barriers and confidence towards anthropometry
Based on the alternative hypothesis that there is a difference between acute and
community working dietitians’ perception of barriers towards anthropometric use, it
was predicted that confidence levels would significantly impact on anthropometry use
thus act as a barrier. A 100mm visual analogue scale (VAS) was thus employed to
explore confidence rating of responders when taking such measures.
- 85 -
Descriptive statistics and χ2 analysis suggested that there was a significant difference
between average confidence scores for community (54.2 + 14.8mm) and acute (60.3
+ 12.1mm) participants, with community reporting lower confidence scores.
Interestingly, community responders did not perceive lack of confidence as a barrier
towards anthropometry as highly as their acute working colleagues. Community
responders ranked nine other barriers higher than “perceived lack of confidence”
whereas the acute group rated just five other barriers higher, such as ‘do not need to’
and ‘lack of equipment’.
It should also be noted in conjunction with the above that community responder’s
frequency of use of anthropometry was rated on average lower than acute
responders’. However, we have not been able to answer whether it is their low
confidence that impacts on frequency of use, or if it is other barriers such as lack of
equipment, case load and training that reduce frequency of use and consequently
confidence diminishes due to lack of familiarity with the measures. It appears that
although confidence is not the highest rated barrier to taking anthropometric
measurements it is still a significant factor; since the majority of responders both
community (59% within group) and acute workers (63% within group) reported that
they would be likely to attend anthropometric training in the future.
The most commonly reported reasons for attending further training were to improve
competency and to improve confidence.
For all responders estimated, recalled weight and height and BMI calculations
received the highest rating of confidence; this can also be seen when considering
frequency of use across the whole sample group. It may be argued however that
these are not anthropometric measurements as they do not require physical
measurement of body size (Gibson, 2005) and are easier to take than actual

- 86 -
anthropometric measurements. This would suggest that, typically, the dietitians
sampled are not using any physical anthropometric measures routinely within day to
day practice. Although literature searches failed to find other studies considering
anthropometric use by dietitians specifically, it is recognised that estimated or recalled
measures are a frequently encounter. A large systematic review was conducted by
Gorber et al. (2007). It included 64 studies of observational and experimental design,
published between 1979 and 2005. Each study included between 44 and 16,000
patients aged 10 – 89 years, with the majority being >18years. By comparing self
reported and measured data Gorber et al. showed that weights and BMIs are often
underestimated and heights overestimated by varying amounts between gender and
within study design. It was suggested that if a correction factor was applied estimates
or recalled figures could be used, when measured data are not available, (Gorber et
al., 2007) as the inherited error in recalled data would be reduced, potentially
improving calculations and assessments that take place thereafter.
Head circumference and BodPod were rated with the lowest levels of confidence of all
the measures questioned across the sample. This may be due to lack of equipment.
BodPod is often used in research or for academic purposes only and is expensive,
therefore it would not be expected that many responders, especially if not involved
within research, have seen or used such method. Similarly head circumference is
used as an indicator for growth within babies and infants, thus for those responders
not working within paediatrics, confidence levels are expected to be low.
Also, head circumference may be taken by other health professionals, such as mid-
wives, doctors and public health nurses/visitor, (Chiabi et al., 2008; Thomson et al.,
2009) prior to dietetic involvement.
- 87 -
Statistically significant differences between community and acute participants’
confidence scores were seen for skin fold, MAC, demi-span, knee height and head
circumference measurements. These measurements all require skin fold calipers
and/or tape measures and a degree of skill (Gibson, 2005). Community dietitians
may lack needed equipment hence explaining, in part, the differences in confidence
scores (BAPEN, 2008a) and lack of use of such measures. Measures requiring
equipment have a cost implication and when considering infection control policies (i.e.
need for single use equipment) provision of equipment may be a limiting factor. It may
be argued though that weighing scales may be viewed in the same way contradicting
this argument when considering that the majority of responders reported using
measured weight on a daily or at least weekly basis (96% of acute and 88% of
community responders). Weights, however, are often needed for medical
interventions and the provision of scales may be seen more as a necessity than skin
fold calipers and other specialist equipment.
The most commonly chosen barrier to anthropometry use was ‘not appropriate to
patient’. The range of responders (i.e. dietitians and assistants all with varying
experiences, specialties, work location, bandings) completing the survey and the
range of anthropometric measures available may have influenced this result. Often
measures are patient or situation specific, therefore, do not apply to all. For example,
it would often be impossible for critical care dietitians to assess hand grip strength
(Baxter, 1999); those working solely with adults would not use percentile measures,
length or head circumference, nor would paediatric dietitians use height with
babies/infants. Use of anthropometry may depend on a patients’ clinical condition and
may provide rationale for low anthropometric application rates (Bunting & Weaver,
1997).

- 88 -
It has been documented that understanding, knowledge, equipment provision,
accuracy of equipment and skill are potential inhibitors toward anthropometry use
(Baxter, 1999). Within the present study the second most prevalently chosen barrier
was ‘lack of equipment’. This supports BAPEN’s Combating Malnutrition:
Recommendations for Action (2008) paper which recognises that resources are a
barrier to nutritional assessment and the provision of equipment is needed to allow for
accurate, detailed and objective assessment. This superseded the King’s Funded
report which recommended that all wards and clinical areas should have access to
devices to assess weight and height (Lennard-Jones, 1992). Interestingly it seems
that the sampled dietitians did not perceive the problem of equipment as prevalently
as it may be. ‘Lack of accurate equipment’ was rated as a barrier for only 3.5% of
acute and 3.2% of community responders, overall rating this as the 11th most
prevalent barrier to anthropometry use out of the 15 barriers questioned. This may
indicate that the equipment that is available is appropriate and maintained. This is in
support of a small equipment survey across 12 wards and 14 out-patient areas in one
hospital in Glasgow, which revealed that 82% of weighing scales and 43% of height
equipment were within specified accurate limits (Bunting & Weaver, 1997).
The third most prevalently chosen barrier differed between acute and community
responders, with ‘Do not feel I need to’ being indicated as a barrier for 12.3% of
community responses and 7.9% for acute. Interestingly, it may be reasonable to
consider anthropometry to be of more use and importance within the community
setting when considering the lack of other objective markers (e.g. biochemistry, which
are often not readily available to community dietitians). However, there may be a
level of ambiguity with this question and it may have been interpreted interchangeably
with ‘not appropriate for patient’ which is recognised as a limitation within the present
study’s questionnaire design. If it is assumed, however, that it has not been
misinterpreted it may suggest that responders do not see anthropometry taking as

- 89 -
part of their job role or that these data would not further improve their assessment.
According to the literature dietitians are vital in the role of complex patient nutritional
assessment, which typically involves the use, interpretation and evaluation of dietary,
biochemical, functional and anthropometric data (Baxter, 1999; Gibson, 2005). The
literature fails to detail who should be taking anthropometric measures. Dietitians are
able to interpret and evaluate biochemical data, although are not suggested to be
qualified phlebotomists. If anthropometric measurement taking is perceived in the
same way, further research is vital as negative attitudes of staff nurses have been
recorded towards anthropometric use (e.g. weight, height, BMI calculations, nutritional
screening paperwork). Porter et al. (2009) explained this in part due to lack of
understanding, knowledge and time demands as well as a perception that this is not
within their role but that of a dietitian – suggesting ambiguity over anthropometry
responsibility.
The third most prevalently chosen barrier for acute dietitians was ‘time
constraints/work load’ (11.7% acute vs. 8.4% community, p>0.05). This was also
recognised as a barrier to nutritional assessment and compliance with NKF-K/DOQI
renal guidelines by American dietitians surveyed over 5 years ago (Burrowes, Russell
& Rocco, 2005). A 49-question survey was completed by 848 dietitians (50%
response rate). Dietetic working in the USA may not directly be comparable to
dietitians in the North West of England, and within the NHS specifically, and only renal
dietitians were requested to consider their compliance with guidelines and not
anthropometry per se. However, its findings suggest similar barriers such as
resources (e.g. lack of calipers [57%]) and high workloads (40%) as substantial
barriers to dietetic assessments as found within the present study.
- 90 -
NICE guidelines (2006) detail that “height, weight and other anthropometric measures
may be perceived by patients as an invasion of personal space and should be
recorded for future reference to reduce unnecessary repetition”. Private or partially
screened assessment areas were suggested by Himes (2009) to minimise emotional
upset when taking anthropometric measurements in children. Despite these
recognitions, the current study indicates that dietitians’ perceptions disagree in
practice: the barriers ‘patients do not like it’ and ’too invasive’ accounted for just 3.3%
and 5.6% of all responses respectively, rated as the 12th and 8th most prevalently
chosen barriers out of the 15 questioned. Similarly, the majority of responders (43.9%
of the whole sample) disagreed with the statement that ‘invasive’ anthropometry is a
barrier to consultations. Equal proportions of responses were noted for those
agreeing (35.8%) that patients do not like invasive measures and those opposing this
view (34.4%). This indicates that the infrequent use of anthropometry is unlikely to be
due to patient refusal.
4.3.5. Frequency of use
The null hypothesis, that there is no difference between area of work and frequency of
use of anthropometric tools was rejected for estimated and recalled weight only.
Weight, height and BMI were found to be the most commonly used measures; with
over 70% of acute responders using estimated weight on a frequent basis (“at least
weekly”/”daily”) compared with 38% of community responders. Recalled weight was
also reported to be used on a frequent basis by more acute (76%) responders than
community (36%) responders. One must again consider if this is due to differences in
equipment provision, and therefore, alternatives to measured weight must be
employed. Exploration into potential barriers indicated that ‘Lack of equipment’ was
rated as the second most prevalent barrier to anthropometric use by both acute and
community responders, secondary only to “not appropriate for patient”, confirming the
role of equipment provision.

- 91 -
Work load/time constraints was rated as a barrier by proportionally more acute
responders (11.7%) than community (8.4%). This may be due to differences in work
roles and/or responsibilities; speculation also suggests that community based dietetic
therapy may allow for more time per consultation, thus more time for measurements
to take place. It may therefore be surmised that those working within the acute setting
are likely to value the need for measured weights although do not have the time to
conduct these measures hence use estimates as a surrogate. This is supported with
the responses to the attitude questions – the majority of all responders agreed or
strongly agreed with the statements that anthropometry is part of the unique role of a
dietitian and is essential when monitoring patients and forming part of the nutritional
assessments. Positive attitudes were also seen with the majority of responses
indicating that other measures are needed in addition to weight, and that over 50% of
responders reported that it was insufficient to use estimated or recalled weight.
Perplexingly, within the attitude questions lack of training, equipment, nor time were
rated as the ‘greatest downfall to anthropometry use’ by the majority. Indeed,
approximately equal proportions of responders agreed and disagreed with each
statement. This suggests potential barriers are not universal or that a number of
barriers inhibit anthropometry use with a cumulative effect.
4.3.6. Attitude towards anthropometry
Attitude questions were included within the survey to explore thinking towards certain
ideas as well as to consider the null hypothesis that there is no difference between
area of work and attitude towards anthropometry. Based on mean attitude scores for
all questions the null hypothesis can be accepted; mean attitude scores were not
statistically different for acute (38.6 +5.2) and community (39.3 +6.1) responders.
In general there was a slight skew towards positive attitudes for anthropometry used
for the study sample; acute dietitians had a greater positive attitude than community.

- 92 -
4.3.7. Training
Less than half of all responders reported receiving anthropometry training outside the
university environment, potentially highlighting a gap in dietetic training. Surprisingly,
we found a statistically significant difference between area of work and where
anthropometry training was received. All registered dietitians will have attended
university, and area of work (i.e. acute/community) is not likely to have been
determined by where training had been received in practice. It may be pertinent
therefore to consider that a change to training/course content may have occurred over
time, as slightly higher rates of more experienced dietitians (i.e. those with>10 years
experience) reported working in the community setting. This can be supported when
considering that only 89% (when discarding those graded < band 5 as dietetic
university accreditation is not compulsory at this level) of responders reported being
trained on anthropometry at university.
One percent of responders reported receiving no anthropometry training, perhaps
accounted for by dietetic assistants, who were also encouraged to complete this
questionnaire. These staff members do not require a university degree or dietetic
training and unless they are provided with on the job training, and depending on their
job role and responsibilities, this may not be indicated.
If those reporting ‘no anthropometric training’ were registered dietitians, explanations
may include changes to training course content and/or poor quality or remembrance
of training received.
- 93 -
Over half (61.2%) of all participants reported that they would want to attend further
anthropometric training despite significantly fewer rating ‘lack of training’ as a barrier
(9.7%). Slightly fewer community responders reported a likelihood to attend future
anthropometry training. This may be linked to community responders having received
sufficient training (community anthropometry training at university was significantly
higher and ‘lack of training’ was deemed as a lower barrier compared with acute
responses).
Byham-Gray et al. (2005) suggested that dietitians’ implementation of evidence based
practice (EBP) is greatly influenced by education levels, area or level of training,
experience gained within the working environment as well as professional
registration/associations. The survey included a comparable sample size and
demographics to the present study (n = 258, male n = 8) and was completed by acute,
ambulatory-care and ‘other sector’ dietitians to consider their knowledge, attitudes and
perceptions of EBP. It similarly reported resources as one of the primary barriers, in
this case to implementation of EBP overall. Byham-Gray and colleagues recognized
that favorable attitudes towards EBP may not directly translate to practice. Our study
also may suggest this: dietitians have reported positive attitudes to anthropometry yet
frequency of use appears low. Byham-Gray et al. suggested that syllabus or course
content changes must take place for dietitians to practically apply EBP – perhaps the
same can be said for anthropometry.

- 94 -
In summary, the alternative hypotheses (H1) can be accepted; there is a difference
between area of work (acute vs. community) in the frequency of use and barriers
towards anthropometry use. Anthropometric measurements rated as being taken
frequently, i.e. daily or less than weekly, were greater for acute than community
workers. Significantly more acute dietitians used estimated and recalled weights
(p<0.05). Significantly fewer community responders viewed time/work load (8.4% vs.
11.7%) and lack of confidence (3.9% vs. 7.6%) as barriers to anthropometry use
compared with acute dietitians (p<0.05).
Although there also appeared to be slightly greater positive attitudes towards
anthropometry by acute than community dietitians, further exploratory studies should
be conducted in order to statistically accept or reject the H1 regarding attitude.
One must, therefore, consider if job roles differ significantly and if in general
anthropometry is not deemed as a significant part of a community dietitian’s role
compared with those working within a hospital setting.
- 95 -
4.4. Study strengths and limitations
This project’s limitations, as with all self-completed questionnaires, included the
provision of socially desirable answers, lack of opportunity to provide prompts or
probes to answers as well as inability to gather additional data.
However, low interviewer effects/bias and no interviewer variability as well as
greater convenience to responders were advantages (Bryman, 2001). To ensure
that results were as valid and as low in responder bias as possible phrasing and
design of questions were carefully considered. The main study questionnaire was
amended following a pilot, within which the questions were confirmed as being clear,
concise and not ambiguous. To avoid “respondent fatigue” the number of questions
included was limited (Edwards et al., 2001).
Techniques such as keeping the length of the questionnaire short, providing self-
addressed (freepost) envelopes, contacting participants prior to distribution of the
questionnaire and offering additional copies of the questionnaires during the 2
follow-up contacts probably enhanced response rate (Edwards et al., 2001; Smeeth
& Fletcher, 2002; Streiner & Norman, 2008). The response rate of 54% is
substantial for a survey based study, however it is recognised that those that took
time to complete the survey may have substantial/specific views on anthropometry
use, and we are unable to consider the answers of those who failed to respond.
Similarly, we were unable to consider gender differences as only 6% of responders
were male. A larger sample size, or targeting male dietitians across the UK
specifically, would be needed for this exploration. A larger sample size may also
over come the limitation of violation of χ2 assumptions. Tests that violated these
assumptions within this study were discounted from statistical analysis with trends
considered only, hence a limitation of this study.

- 96 -
In this study there were slightly higher numbers of community responders working
part-time than full time. One must consider if reduced working hours would impact on
the frequency of anthropometric use and if this reduced frequency of use, impacted
on confidence levels at taking such measures or vice versa. It is a limitation of this
paper to have not considered the number of hours employed in relation to the
frequency of anthropometry use, as this may be a confounding variable. It may have
been more applicable, therefore, to have considered ‘what proportion of time in your
job role do you spend in face-to-face contact with patients?’
Similarly, it may have been pertinent to have re-phrased the term ‘Daily’ when
considering frequency of use as a response. Given the nature of the job and
differences in patient need/requirements of a community dietitian, patients are not
seen as frequently as with acute dietitian’s case load of patients. This may have
resulted in the interpretation of ‘Daily’ being varied between responders. It may
have provided more clarity and less ambiguity, to allow for improved comparison of
answers, to have used “on each face-to-face contact with a patient” rather than
“daily”.
Literature reviews revealed that previous surveys/questionnaire based studies that
involved dietitians as the sample population had varying sample sizes from 127
(Whelan, 2007) to 500 participants (Taylor, 1998); and piloting surveys included just
20 randomly selected participants. A study by Nelson in 2007 involved 228
questionnaires sent to dietitians via the Regional Dietetic Managers group of the
BDA across 14 regions (i.e. nationally over the UK) producing a response rate of
38%. Healy’s (2002) cross sectional study distributed surveys amongst 345
participants of the Irish Nutrition and Dietetics Institute (i.e. 100% of whole sample
population) gaining a 44% response rate. This study reports piloting the survey
- 97 -
initially on “a small sample of both community and acute dietitians” (specific number
of participants were not detailed). Most survey studies failed to detail information on
sample size calculations, although Harrison (2001) reports that his sample of 220
(from 40 departments) represented all departments/trust/regions of the UK; 140
questionnaires were returned and it was commented that this generated a greater
response rate than the previously achieved 30% by the BDA Member’s Attitudinal
Survey of 1998. A response rate of >50% was obtained in the present study, which
highlights strength of this study in terms of sample size and response rate.
A substantial strength of this present study is the piloting and validation process that
was employed. The questionnaire was deemed to be clear and unambiguous. The
validation process allowed for the involvement of the most appropriate scale tool to
be incorporated within the main study. Albeit using a small sample size (n = 32), it
was sufficient for statistical analysis, it is thought that this provides the first research
of its kind at validating (considering sensitivity and reproducibility) a confidence
scale for use when assessing dietitians use of anthropometric measurements.
As an observational study, this project does not prove cause and consequence but
provides cross-sectional data on current trend, insight into current dietetic and
anthropometric practice and does not intend to claim causation.

- 98 -
4.5. Implications for practice
From the data presented in this work it is hoped that dietitians may reflect on their own
role and practice, e.g. they may consider their frequency of anthropometric use and
reasons behind this. Dietitians may wish to extend their knowledge via reading, CPD
activities and/or increase practical experience to improve anthropometric use in
practice, thus enhancing patient care by providing detailed, informed and holistic
dietetic assessments.
Discussions within dietetic departments to consider ways of reducing inhibitors to
anthropometric use may prove helpful. For example, adapting documentation to
ensure anthropometric measurements are taken and recorded clearly as well as
considering budgets for equipment provision in line with guidelines such as BAPEN
(2008) and the King’s Funded Report (1992).
The present study highlighted discrepancies and potential deficiencies within dietetic
training. It may be suggested that a common approach to anthropometric training is
needed (Byham-Gray et al., 2005); such as university courses becoming regulated for
a common training approach or ‘accredited courses’ being incorporated within
syllabuses to equip newly qualified dietitians with additional qualifications and
knowledge. Alternatively, training sessions within the work environment (external
accredited or peer reviewed) may help increase dietitians’ understanding and
competency and, therefore, confidence of anthropometric measurement technique; as
well as to provide support to other health professionals to ensure accurate and timely
nutritional screening.
- 99 -
This paper may also provide support into the use of VAS as a tool to assess and
monitor confidence when taking anthropometric measurements; this may be of use
should the above point be implemented within departments or within similar areas of
research. VAS may also be of use as an attitudinal scale beyond the confidence remit
for dietitians and potentially other health professionals e.g. nursing staff confidence
when taking anthropometric measurements or dietitian’s attitude towards new
guidelines.
- 100 -
4.6. Future research possibilities
The present study described the trends in attitudes, barriers and use of anthropometry
by dietitians in the North West of England. However, due to limitations within the
study (i.e. time scale, scope, limited sample sizes within sub-groups) as well as by
raising further questions for debate, it may be of interest to consider:
- Replicating a similar study across other areas of England, internationally
and/or beyond the NHS.
- The practical use of anthropometry and/or nutritional assessments compared
with guidelines, such as NICE (2006), via observational studies and/or audit.
- More stringent ways of considering anthropometric use e.g. retrospective
count of frequency of use from patient notes rather than questionnaires.
- The length of time required to perform various anthropometric measurements,
and whether this practically applies to a typical dietetic consultation time allocation.
- How accurate dietitians are at actually estimating parameters such as height
and weights and the implications on nutritional assessment and treatment outcomes.
- Anthropometric use from the patients’ perspective.
- Whether perceived competency levels are more closely related to frequency
of anthropometry use than confidence.
- The impact that various forms of anthropometric training could have on
outcome measures i.e. does training improve measurement accuracy and use.
- Whether trends found (i.e. frequency of use and confidence levels) differ
within sub-groups e.g. level of experience. This could be expanded to an exploration
of differences in use of more recently developed or computerised anthropometric
measures (e.g. BIA, BodPod) with level of experience.

- 101 -
5. CONCLUSIONS
The main findings from this study include:
- Anthropometric measurements appear to be taken infrequently by dietitians in
the North West, particularly measures that could be described as requiring
advanced skills and technique.
- Estimates were being more commonly employed, although by varying degrees
between acute and community dietitians.
- Numerous barriers were apparent, potentially explaining the low
anthropometric use rates. The most prevalently indicated barriers for the
sample as a whole were ‘not appropriate for patient’ and ‘lack of equipment’.
However, significantly more acute responders reported ‘lack of time’, and more
community responders rated ‘do not need to’ as barriers to use; raising the
question of whether significant differences are apparent between acute and
community dietitians’ roles.
- Responders indicated an overall positive trend towards anthropometry use.
There was no statistically significant difference between acute and community
responders for attitude.
- This study indicates that dietitians receive various degrees of anthropometric
training. The majority of responders would choose to attend further training
with confidence being a main motivation. This may reflect perceived or real
weaknesses within many dietitians’ competencies and deficiencies within
dietetic training.
This study also supports the use of VAS scales when assessing dietitians’ confidence
at taking anthropometric measurements. This tool has been found to be sensitive and
reliable compared to Likert, providing support for VAS use when assessing attitude,
towards a particular task.

- 102 -
It is recognised that observational studies (i.e. cross-sectional survey in this case) can
only indicate association; it is therefore hoped that this study has explored and
suggested reasons for trends in anthropometry use as well as highlighting
weaknesses within the anthropometry research and dietetic training field.
In conclusion, regardless of the importance or reported benefits of anthropometry, it is
performed to a very limited degree by dietitians in the North West and is often limited
to estimates, BMI, heights and weights only. The reality of the job of an NHS dietitian
leaves very little time for sophisticated measures that ideally should be performed
(Gibson, 2005). It should, therefore, be considered whether it is realistic to expect
many anthropometry measures to be used and whether training reflects the reality of
practice. Despite this, the mastery and utilisation of anthropometric measurements
has the potential of promoting the role of dietitians and could be seen as a unique skill
in this profession. It is hoped that dietitians will reflect on their own practice, to
consider if and/or how anthropometry use could benefit patient care and enhance
nutritional assessments.

- 103 -
6. REFERENCES
Akpinar, E., Bashan, I., Bozdemir, N., & Saatci, E. (2007). Which is the best
anthropometric technique to identify obesity: body mass index, waist
circumference or waist-hip ratio? Collegium Anthropologicum, 31(2), 387-393.
Almiron-Roig, E., Green, H., Virgili, R., Aeschlimann, J.M., Moser, M. & Erkner, A.
(2009). Validation of a new hand-held electronic appetite rating system
against the pen and paper method. Appetite, 53(3), 465-468.
Bartoshuk, L.M., Duffy, V.B., Green, B.G., Hoffman, H.J., Ko, C.W., Lucchina, L.A.,
Marks, L.E., Snyder, D.J., & Weiffenbach, J.M. (2004). Valid across-group
comparisons with labelled scales: the gLMS versus magnitude matching.
Physiology and Behaviour, 82, 109-114.
Bastow, M.D. (1982). Anthropometrics revisited. Proceeding of the Nutrition Society,
41, 381-388.
Baxter, J.P. (1999). Problems of nutritional assessment in the acute setting.
Proceedings of the Nutrition Society, 58, 39-46.
Bland, M.J., & Altman, D.G. (1986). Statistical methods for assessing agreement
between two methods of clinical measurement. Lancet, i, 307–310.
British Association for Parenteral and Enteral Nutrition (BAPEN). (2003).
Background 2: Malnutrition and the wider context. Definition of Malnutrition.
Retrieved from BAPEN Web site:
http://www.bapen.org.uk/res_press_rel9.html
British Association for Parenteral and Enteral Nutrition (BAPEN). (2006).
Malnutrition Universal Screening Tool. Retrieved from BAPEN Web site:
http://www.bapen.org.uk/nsw.html
British Association for Parenteral and Enteral Nutrition (BAPEN). (2008a). Report
from the Advisory Group on Malnutrition, Led by BAPEN. Combating
Malnutrition: Recommendations for Action. Edited by M. Elia and C.A. Russell.
- 104 -
British Association for Parenteral and Enteral Nutrition (BAPEN). (2008b). BAPEN’s
Nutrition Screening Week. Retrieved from BAPEN Web site:
http://www.bapen.org.uk/nsw.html
Bryman, A. (2001). Social Research Methods. Oxford : Oxford University Press.
Bugess, T.F. (2003). A general introduction to the design of questionnaires for
survey research. Retrieved from the University of Leeds Web site:
http://iss.leeds.ac.uk/info/312/surveys/217/guide_to_the_design_of_questionn
aires
Bunting, J., & Weaver, L.T. (1997). Anthropometry in a children’s hospital: a study of
staff knowledge, use and quality of equipment. Journal of Human Nutrition
and Dietetics, 10, 17-23.
Burrowes, J.D., Russell, G.B. & Rocco, M.V. (2005). Multiple factors affect renal
dietitians’ use of the NKF-K/DOQI adult nutrition guidelines. Journal of Renal
Nutrition, 15, 407-426.
Bush, T., Cherkin, D., & Barlow, W. (1993). The impact of physician attitudes on
patient satisfaction with care for low back pain. Archives of Farmily Medicine,
2, 301-305.
Buzby, G.P., Mullen, J.L., Matthews, D.C., Hobbs, C.L., & Rosato, E.F. (1980).
Prognostic nutritional index in gastrointestinal surgery. The American Journal
of Surgery, 139(1), 160-167.
Byham-Gray, L.D., Gilbride, J.A., Dixon, B.L. & Stage, F.K. (2005). Evidence-based
practice: what are dietitians’ perceptions, attitudes and knowledge? Journal of
the American Dietetic Association, 105, 1574-1581.
Cambridge Advanced Learner's Dictionary. (2008). Cambridge Dictionaries Online.
Cambridge: University Press. Available at: http://dictionary.cambridge.org
Cardello, A.V., Schtz, H.G., Lesher, L.L., & Merril, E. (2005). Development and
testing of a labelled magnitude scale of perceived satiety. Appetite, 44, 1-13.

- 105 -
Charkraborty, B.M., & Chakraborty, R. (2007). Sensitivity and specificity of body
mass as a definition of the obesity component of metabolic syndrome.
Collegium antropologicum, 31 (4), 943-947.
Chen, Z., Yang, G., Zhou, M., Smith, M., Offer, A., Ma, J., Wang, L., Pan, H.,
Whitlock, G., Collins, R., Niu, S., & Peto, R. (2006). Body mass index and
mortality from ischaemic heart disease in a lean population: 10 year
prospective study of 220 000 adult men. International Journal of Epidemiology,
35, 141-150.
Chiabi, A., Tchokoteu, P.F., Takou, V., Fru, F. & Tchouine, F. (2008).
Anthropometric measurements of children attending a vaccination clinic in
Yaounde, Cameroon. African Health Sciences, 8(3), 174-179.
Cook, Z., Kirk, S., Lawrenson, S., & Sandford, S. (2005). BAPEN Symposium 3 on
‘From beginners to zimmers’. Use of BMI in the assessment of undernutrition
in older subjects: reflection on practice. Proceedings of the Nutrition Society,
64, 313-317.
Department of Health [DoH]. (2003). ‘Ethics’. Retrieved from:
http://www.dh.gov.uk/en/Publicationsandstatistics/Publications/PublicationsPol
icyAndGuidance/DH_4005727 [Accessed 24/01/2011].
Detsky, A.S., McLaughlin, J.R., Baker, J.P., Johnston, N., Whittaker, S., Mendelson,
R.A., & Jeejeebhoy, K.N. (1987). What is subjective global assessment of
nutritional status? Journal of Parenteral and Enteral Nutrition, 1(11), 8-13.
Dis, I.V., Kromhout, D., Geleijnse, J.M., Boer, J.M.A., & Verschuren, W.M.M. (2009).
Body mass index and waist circumference predict both 10-year nonfatal and
fatal cardiovascular disease risk: study conducted in 20 000 Dutch men and
women aged 20-65 years. European Journal of Cardiovascular Prevention
and Rehabilitation, 16, 729-734.
Dietitians of Canada (2004). Role Paper of the Community Dietitians in Health
Centres Network. Retrieved from: http://www.dietitians.ca/career/i3_1.htm

- 106 -
Downie, W.W., Leatham, P.A., Rhind, V.M., Wright, V., Brancho, J.A. & Anderson,
J.A. (1978). Studies with pain rating scales. Annals of the Rheumatic
Diseases, 37, 378-381.
Edwards, P., Roberts, I., Clarke, M., et al. (2001). Increasing response rates to
postal questionnaires: a systematic review. British Medical Journal, 324,
1183-1191.
Flint, A., Raben, A., Blundell, J.E., & Astrup, A. (2000). Reproducibility, power and
validity of visual analogue scales in assessment of appetite sensations in
single test meal studies. International Journal of Obesity, 24, 38-48.
Freyd, M. (1923). The graphic rating scale. Journal of Educational Psychology, 14(2),
83-102.
Gibson, R.S. (2005). Principles of Nutritional Assessment. Oxford: University Press.
Glantz, S.A. (2005). Primer of biostatistics. (6th ed.). United States: McGraw Hill.
Gorber, S.C., Tremblay, M., Moher, D., & Gorber, B. (2007). A comparison of direct
vs. self-report measures for assessing height, weight and body mass index: a
systematic review. Obesity Reviews, 8, 307-326.
Green, B.G., Shaffer, G.S. & Gilmore, M.M. (1993). Derivation and evaluation of a
semantic scale of oral sensation magnitude with apparent ratio properties.
Chemical Senses, 18, 683-702.
Hall, T.T., Balneaves, L. & Wong, S. (2009). Waiting to be weighed: a pilot study of
the effect of delayed newborn weighing on breastfeeding outcomes. Canadian
Nurse, 105(6), 24-28.
Harrison, J.A., Brady, A.M., & Kulinskaya, E. (2001). The involvement,
understanding and attitudes of dietitians towards research and audit. Journal
of Human Nutrition and Dietetics, 14, 319-330.
Health Professions council (HPC). (2008). Application requirements & information.
Retrieved from:
http://www.hpc-uk.org/apply/international/requirements/index.asp
- 107 -
Healy, S., & McNamara, E. (2002). Tube feeding controversial patients: what do
dietitians think? Journal of Human Nutrition and Dietetics, 15, 445-453.
Hill, A.J. & Blundell, J.E. (1982). Nutrition and behaviour; research strategies for the
investigation for taste characteristics, food preferences, hunger sensations
and eating patterns in man. Journal of Psychiatric Research, 17(2), 203-212.
Himes, J.H. (2009). Challenges of accurately measuring and using BMI and other
indicators of obesity in children. Pediatrics, 124, S3–S22.
Houston, D.K., Nicklas, B.J., & Zizza, C.A. (2009). Weighty concerns: The growing
prevalence of obesity among older adults. Journal of the American Dietetic
Association, 109, 1886-1895.
Kovacevich, D.S., Boney, A.R., Braunschweig, C.L., Perez, A., & Stevens, M. (1997).
Nutrition risk classification: a reproducible and valid tool for nurses. Nutrition in
Clinical Practice, 12(1), 20-5.
Lean, M.J., & Han, T.S. (2002). Waist Worries. American Journal of Clinical Nutrition,
76, 699-700.
Lennard-Jones, J.E. (1992). A positive approach to nutrition as a treatment. London:
Kings Fund Centre.
Lohman, T.G., & Roche, A.F. (1988). Anthropometry standardised reference manual.
United States: Martorell.
McKenna, J., Henderson, L., & Baic, S. (2004). A survey to assess physical activity
promotion by Registered Dietitians. Journal of Human Nutrition and Dietetics,
17, 63-69.
Nelson, M., Mendoza, N., & McGought, N. (2007). A survey of the provision of
dietetic services for celiac disease in the UK. Journal of Human Nutrition and
Dietetics, 20, 403-411.
National Institute for Health and Clinical Excellence [NICE]. (2006). Obesity
guidance on the prevention, identification, assessment and management of
overweight and obesity in adults and children. Clinical guidelines 43.

- 108 -
National Institute for Health and Clinical Excellence [NICE]. (2006). Nutrition Support
for Adults Oral Nutrition Support, Enteral Tube Feeding and Parenteral
Nutrition. Methods, Evidence and Guidance. Clinical guidelines 32.
National Institutes of Health [NIH]. (2000). The Practical Guide to the Identification,
Evaluation and Treatment of Overweight and Obesity on Adults. National
Institutes of Health: Bethesda, MD. NIH publication no. 00-4084.
National Patient Safety Agency [NPSA]. (n.d.). Nutritional Screening Structured
Investigation Project. Retrieved from:
http://www.nrls.npsa.nhs.uk/resources/?entryid45=59865
Ohnhaus, E.E. & Alder, R. (1975). Methodological problems in the measurement of
pain: A comparison between the verbal rating scale and the visual analogue
scale. Pain, 1(4), 379-384.
Pallant, J. (2007). SPSS survival manual: a step by step guide to data analysis
using SPSS for Windows. [Version 15]. (3rd ed.). Maidenhead: Open
University Press.
Paniagua, L., Lohsoonthorn, V., Lertmaharit, S., Jiamjarasrangsi, W., & Williams,
M.A. (2008). Comparison of waist circumference, body mass index,
percentage body fat and other measure of adiposity in identifying
cardiovascular disease risks among Thai adults. Obesity Research and
Clinical Practice, 2, 215-223.
Peryam, D.R. & Pilgrim, P.J. (1957). Hedonic scale method for measuring food
preferences. Food Technology, 11, 9-14.
Porter, J., Raja, R., Cant, R., & Aroni, R. (2009). Exploring issues influencing the
use of the Malnutrition Universal Screening Tool by nurses in two Australian
hospitals. Journal of Human Nutrition and Dietetics, 22, 203-209.
- 109 -
Price, G.M., Uauy, R., Breeze, E., Bulpitt, C.J., & Fletcher, A.E. (2006). Weight,
shape, and mortality risk on older persons: elevated waist-hip ratio, not body
mass index, is associated with a greater risk of death. American Journal of
Clinical Nutrition, 84, 449-60.
Reilly, H.M., Martineau, J.K., Moran, A., & Kennedy, H. (1995). Nutritional
screening-evaluation and implementation of a simple nutrition risk score.
Clinical Nutrition, 14, 269-273.
Rogers, P.J. & Blundell, J.E. (1979). Effect of anorexic drugs on food intake and the
microstructure of eating in human subjects. Psychopharmacology, 66, 159-
165.
Ross, R., Berentzen, T., Bradshaw, A.J., Janssen, I., Kahn, H.S., Katzmarzyk, P.T.,
Kuk, J.L., Seidell, J.C., Snijder, M.B., Sorensen, T.I.A., & Despres, J-P. (2008).
Does the relationship between waist circumference, morbidity and mortality
depend on measurement protocol for waist circumference? Obesity Reviews,
9, 312-325.
Seidell, J.C., Perusse, L., Despres, J.P., & Bouchard, C. (2001). Waist and hip
circumferences have independent and opposite effects on cardiovascular
disease risk factors: the Quebec family study. American Journal of Clinical
Nutrition, 74, 315-21.
Smeeth, L., & Fletcher, A.E. (2002). Improving the response rates to questionnaires.
British Medical Journal, 324, 1168-1169.
Streiner, D.L. & Norman, G.R. (2008). Health measurement scales. A practical guide
to their development and use. (4th ed.). Oxford: Open University Press.

- 110 -
Stubbs, R.J., Hughes, D.A., Johnstone, A.M., Rowley, E., Reid, C., Elia, M., Stratton,
R., Delargy, H., King, N., & Blundell, J.E. (2000). The use of visual analogue
scales to assess motivation to eat in human subjects: a review of their
reliability and validity with an evaluation of new hand-held computerized
systems for temporal tracking of appetite ratings. British Journal of Nutrition,
84, 405-415.
Taylor, M.A. (1998). Evidence-based practice: are dietitians willing and able?
Journal of Human Nutrition and Dietetics, 11, 461-472.
Taylor, J., & Wilson, G. (2005). Applying sports psychology. Four perspectives.
United States: Human Kinetics.
The Health and Social Care Information Centre. (2010). Statistics and Data
Collection. Retrieved from: http://www.ic.nhs.uk/statistics-and-data-collections
Thomas, B., & Bishop, J. (2007). Manual of Dietetic Practice. (4th ed). Oxford:
Blackwell Publishing.
Veterans Affairs Total Parenteral Nutrition Co-operative Study Group. (1991).
Perioperative total parenteral nutrition in surgical patients. New England
Journal of Medicine, 325, 525-532.
Visscher, T.L.S., Seidell, J.C., Molarius, A., van der Kuip, D., Hofman, A., &
Witteman, J.C.M. (2001). A comparison of body mass index, waist-hip ratio
and waist circumference as predictors of all-cause mortality among the
elderly: the Rotterdam study. International Journal of Obesity, 25, 1730-1735.
Whelan, K., Madden, A.M., & Thomas, J.E. (2007). Student dietitian’s attitudes
towards research and audit: a comparison with registered dietitians. Journal of
Human Nutrition and Dietetics, 20, 121-125.
Whyand, T. (2007). Determinants of Physical Activity Promotion by NHS Dietitians.
Unpublished MSc thesis, University of Chester.

- 111 -
Whybrow, S., Stephen, J.R., & Stubbs, R.J. (2006). The evaluation of an electronic
visual analogue scale system for appetite and mood. European Journal of
Clinical Nutrition, 60, 558-560.
Woo, J., Ho, S.C., Yu, A.L.M., & Sham, A. (2002). Is waist circumference a useful
measure in predicting health outcomes in the elderly? International Journal of
Obesity, 26, 1349-1355.
World Health Organisation [WHO]. (1995). Physical Status: The Use and
Interpretation of Anthropometry. Report of a WHO Expert Committee.
Technical Report Service 854. Geneva: WHO.
Zhu, S., Wang, Z., Heshka, S., Heo, M., Faith, M.S., & Heysfield, S.B. (2002). Waist
circumference and obesity-associated risk factors among whites in the third
National Health and Nutrition Examination Survey: clinical action thresholds.
American Journal of Clinical Nutrition, 76, 743-749.
Zhu, S., Heysfield, S.B., Toyoshima, H., Wang, Z., Pietrobelli, A., & Heshka, S.
(2005). Race-ethnicity-specific waist circumference cut-offs for identifying
cardiovascular disease risk factors. American Journal of Clinical Nutrition, 81,
409-415.
Secondary Citation:
Blackburn, G.L. (1977). Nutritional support of medical practice. New York: Harper
and Rowe. As cited in Bastow, M.D. (1982). Anthropometrics revisited.
Proceeding of the Nutrition Society, 41, 381-388.
British Standards Institution. (1975). Precision of test methods 1: Guide for the
determination and reproducibility for a standard test method (BS 597, Part 1).
London: BSI. As cited in Bland, M.J., & Altman, D.G. (1986). Statistical
methods for assessing agreement between two methods of clinical
measurement. Lancet, i, 307–310.
- 112 -
Charney, P. (1995). Nutritional assessment in the 1990s: where are we now?
Nutrition in Clinical Practice, 10, 131-139. As cited in Thomas, B., & Bishop, J.
(2007). Manual of Dietetic Practice. (4th ed). Oxford: Blackwell Publishing.
Likert, R. (1932). A technique for the measurement of attitude. Archives of
Psychology,140, 140, 5-55. As cited in Bartoshuk L.M., Duffy, V.B., Green,
B.G., Hoffman, H.J., Ko, C.W., Lucchina, L.A., Marks, L.E., Snyder, D.J., &
Weiffenbach, J.M. (2004). Valid across-group comparisons with labelled
scales: the gLMS versus magnitude matching. Physiology and Behaviour, 82,
109-114.

- 113 -
7. APPENDICES
7.1. Appendix 1: Questionnaires:
- Pilot study questionnaire with validation questions
- Validation questionnaire: scales to assess confidence booklet
- Main study questionnaire, with cover letter and PIS.

1
Department of Biological Sciences
University of Chester Parkgate Road
Chester UK
CH1 4BJ
Dear Colleague,
DETERMINANTS OF ANTHROPOMETRIC MEASUREMENT USE AMONGST DIETITIANS
You have been selected to take part in a Pilot Study for my Master’s thesis. Part of my thesis is to investigate dietitians’ use and views of anthropometry in practice via a questionnaire. This shall be offered to all dietitians across the North West of England. Questionnaires shall be statistically analysed comparing results from various specialties (e.g. weight management vs. diabetes) and area of working (i.e. community vs. acute dietitians). It is hoped that this research project will provide evidence in to the practical use of anthropometry and potentially enhance training where necessary. Results may also recommend future research in related areas. Please note the following instructions: Please note that that following Participant information sheet and 13 questions are what participants in the final version of the questionnaire will receive.
1. Please note the length of time taken to complete the questionnaire, and record this where requested within the “Pilot Study Questions” section.
2. Please complete all 13 questions within the questionnaire. 3. Then please spend a few minutes completing the ‘Pilot Study Questions’ that follow the
main body of the questionnaire which ask for feedback relating to the layout, format, wording and content of the questionnaire.
4. Please submit all following papers in the pre-paid envelope provided, by the 22nd November 2009.
If you have anything to discuss further with me surrounding this topic, questionnaire or research project please do not hesitate to contact me on:
[email protected] or 0161 212 4038.
Thank you for your time and input in to this study, it is very much appreciated!

2
DETERMINANTS OF ANTHROPOMETRIC MEASUREMENT USE
AMONGST DIETITIANS This survey asks a series of questions about dietetic practice and anthropometric use. There are no right or wrong answers and we would be very appreciative to hear your views. If you would like to take part in the survey, which shall form part of a Dietetic Masters thesis, please complete the following questions. This should take about ****minutes of your time. Please return in the addressed envelope provided or to the following address:
FAO: Miss L Mash Student, MSc Nutrition and Dietetics University of Chester Department of Biological Sciences Parkgate Road Chester CH1 4BJ
Thank you for your time

3
PARTICIPANT INFORMATION SHEET
“Determinants of Anthropometric Measurement Use Amongst Dietitians”
Dear Participant, I am conducting an audit into dietetic practical use of anthropometry. You are being invited to take part in this research study. Before you decide, it is important for you to understand why the research is being done and what it will involve. Please take time to read the following information and use the contact details if you would like any further information. Thank you for reading this. What is the purpose of the study? To investigate community and acute working dietitians’ use and views of anthropometry in practice. Why have I been chosen? You have been chosen as you are a registered dietitian/dietetic assistant working in the North West of England, employed by the NHS. Do I have to take part? It is up to you to decide whether or not to take part. If you decide to take part you will be given this information sheet to keep. If you decide to take part you are still free to withdraw at any time without giving a reason. What will happen to me if I take part? If you decide to take part, you will be asked to complete the questionnaire that follows, and return this to the researcher using the envelope provided which includes a free post address. By doing this you are giving your consent for the researcher to use your answers as part of the study findings. All information is anonymous and responses will not be identifiable within the final report. What are the possible disadvantages and risks of taking part? There are no disadvantages or risks foreseen in taking part in this study. What are the possible benefits of taking part? By taking part you will be contributing to the development of the dietetic practice and profession thus potentially benefiting patient care in the future. What if something goes wrong? If you wish to complain or have any concerns about any aspect of the way you have been approached or treated during the course of this study, please contact: Professor Sarah Andrew, Dean of the Faculty of Applied and Health Sciences, University of Chester, Parkgate Road, Chester, CH1 4BJ. Tel: 01244 513055. Will my taking part in the study be kept confidential? All information which is collected about you during the course of the research will be kept strictly confidential so that only the researcher carrying out the research will have access to such information. We do not require your name or contact details which ensures confidentiality of responses and no information that could identify an individual will be used in the dissertation or in any publication, which may be written as a result of this research.

4
What will happen to the results of the research study? The results will be written up and contribute to the completion of an MSc dissertation thesis for the University of Chester. Findings may also contribute to published literature. For either case no individuals will be able to be identified. Who is organising and funding the research? The research is funded by the department of Biological Sciences at the University of Chester. The Centre for Public Health Research at the University of Chester has reviewed the study protocol. Who may I contact for further information? If you would like more information about the research before you decide whether or not you would be willing to take part, please contact: Laura Mash MSc Nutrition and Dietetics Student c/o Community Dietitian Sandringham House Castle Courts Windsor Street Salford M5 4DG Tel: 0161 212 4038
Dr. Eva Almiron-Roig MSc Supervisor Department of Biological Sciences University of Chester Parkgate Road Chester CH1 4BJ Tel: 01244 513124
Thank you for your participation.
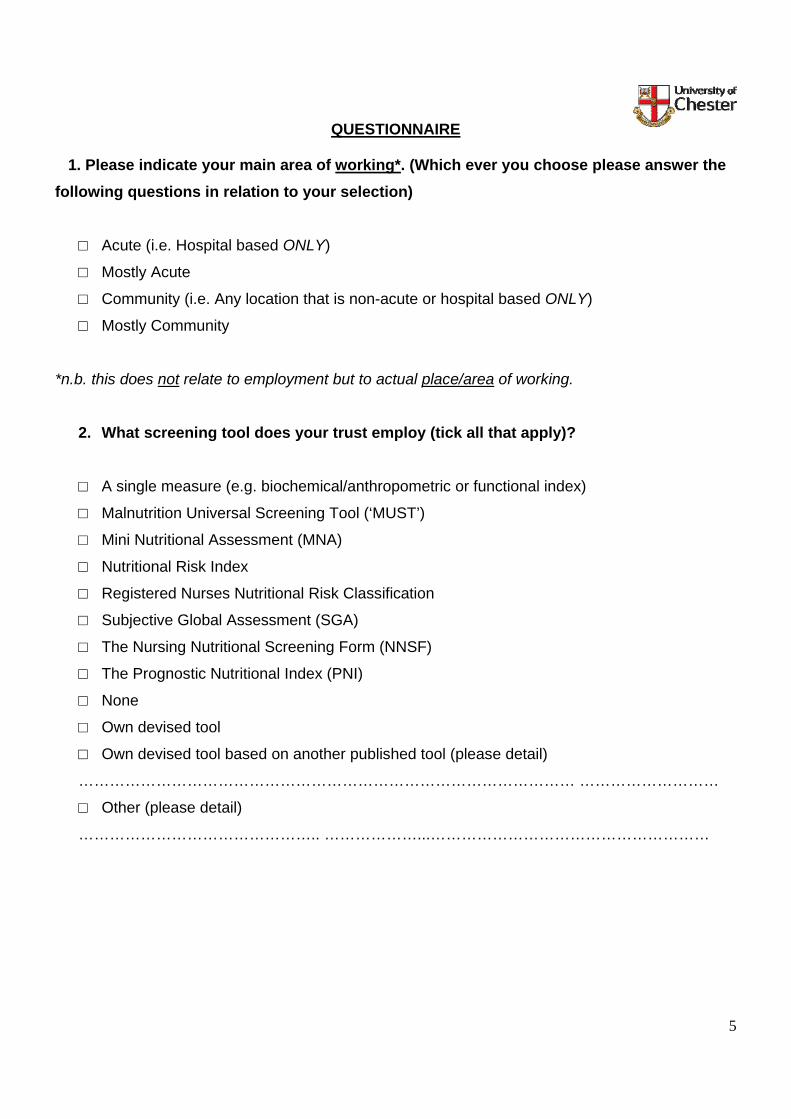
5
QUESTIONNAIRE 1. Please indicate your main area of working*. (Which ever you choose please answer the following questions in relation to your selection)
□ Acute (i.e. Hospital based ONLY)
□ Mostly Acute
□ Community (i.e. Any location that is non-acute or hospital based ONLY)
□ Mostly Community
*n.b. this does not relate to employment but to actual place/area of working.
2. What screening tool does your trust employ (tick all that apply)? □ A single measure (e.g. biochemical/anthropometric or functional index)
□ Malnutrition Universal Screening Tool (‘MUST’)
□ Mini Nutritional Assessment (MNA)
□ Nutritional Risk Index
□ Registered Nurses Nutritional Risk Classification
□ Subjective Global Assessment (SGA)
□ The Nursing Nutritional Screening Form (NNSF)
□ The Prognostic Nutritional Index (PNI)
□ None
□ Own devised tool
□ Own devised tool based on another published tool (please detail)
…………………………………………………………………………………… ………………………
□ Other (please detail)
……………………………………….. ………………...………………………………………………
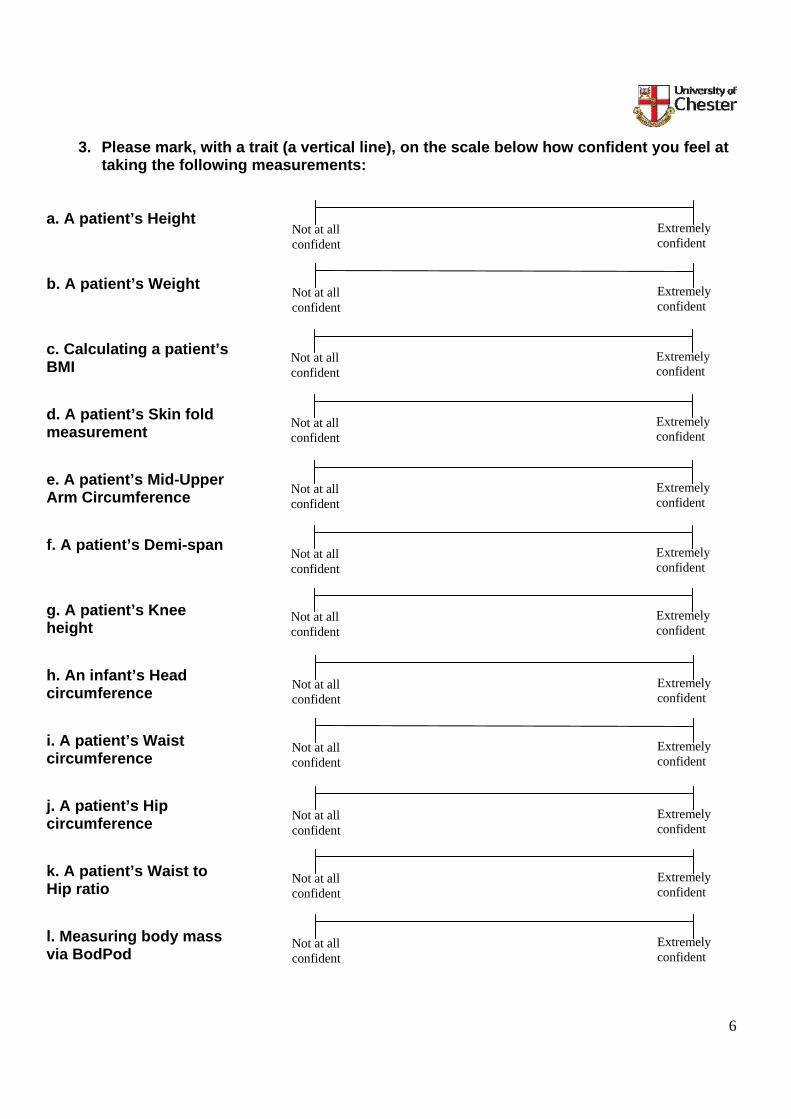
6
3. Please mark, with a trait (a vertical line), on the scale below how confident you feel at
taking the following measurements:
a. A patient’s Height
b. A patient’s Weight
c. Calculating a patient’s BMI
d. A patient’s Skin fold measurement
e. A patient’s Mid-Upper Arm Circumference
f. A patient’s Demi-span
g. A patient’s Knee height
h. An infant’s Head circumference
i. A patient’s Waist circumference
j. A patient’s Hip circumference
k. A patient’s Waist to Hip ratio
l. Measuring body mass via BodPod
Not at all confident
Extremely confident
Not at all confident
Extremely confident
Not at all confident
Extremely confident
Not at all confident
Extremely confident
Not at all confident
Extremely confident
Not at all confident
Extremely confident
Not at all confident
Extremely confident
Not at all confident
Extremely confident
Not at all confident
Extremely confident
Not at all confident
Extremely confident
Not at all confident
Extremely confident
Not at all confident
Extremely confident
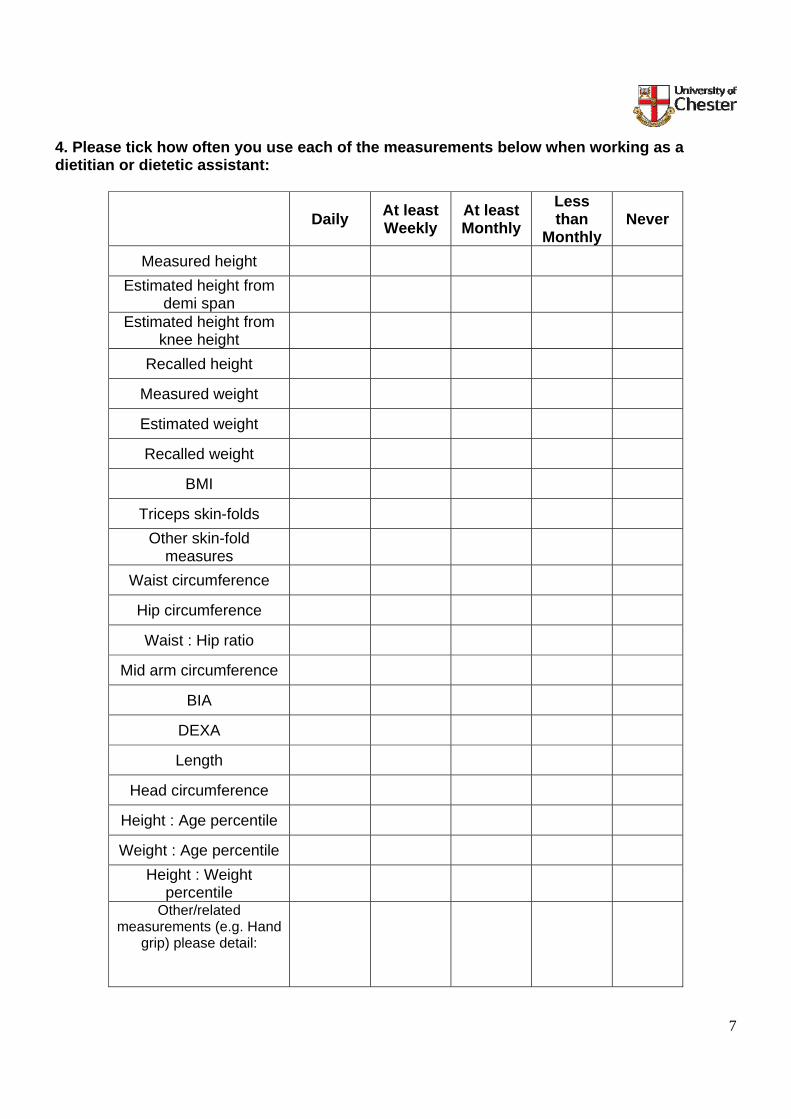
7
4. Please tick how often you use each of the measurements below when working as a dietitian or dietetic assistant:
Daily At least
Weekly At least Monthly
Less than
Monthly Never
Measured height
Estimated height from demi span
Estimated height from knee height
Recalled height
Measured weight
Estimated weight
Recalled weight
BMI
Triceps skin-folds
Other skin-fold measures
Waist circumference
Hip circumference
Waist : Hip ratio
Mid arm circumference
BIA
DEXA
Length
Head circumference
Height : Age percentile
Weight : Age percentile
Height : Weight percentile
Other/related measurements (e.g. Hand
grip) please detail:

8
5. Please tick all the reasons that apply to why you may not take/measure
anthropometric measurements:
□ Don’t feel I need to
□ Lack of competency/confidence
□ Lack of evidence/not part of evidence-based practice
□ Lack of necessary equipment
□ Lack of training
□ Not appropriate for patient
□ Not required by departmental policy
□ Patients do not like it
□ Time constraints of consultations/work load
□ Too invasive
□ Other (please specify)
…………………………………………………………………………………………………
…………………………………………………………………………..………………………
………………………………………………….

9
6. For the following statements (a – j) please tick your level of agreement in the boxes provided:
Strongly agree Agree Uncertain Disagree Strongly
disagree 5 4 3 2 1
a. I believe anthropometry measurement taking is part of the unique role of a dietitian
□ □ □ □ □
b. I believe that nutritional screening is a necessity □ □ □ □ □
c. I believe that BMI has very limited use
□ □ □ □ □
d. I believe that anthropometry forms a vital part of assessing a patients’ nutritional status
□ □ □ □ □
e. I believe that other anthropometric measures are always needed in addition to body weight when assessing a patient status
□ □ □ □ □
f. I believe that skin fold measurements provide little additional information beyond weight alone
□ □ □ □ □
g. I believe that lack of equipment is the greatest downfall to taking anthropometric measurements
□ □ □ □ □
h. For me lack of training is the greatest downfall to taking anthropometric measurements
□ □ □ □ □
i. For me lack of time is the greatest downfall to taking anthropometric measurements
□ □ □ □ □
j. I believe that estimated or recalled weight is sufficiently accurate if actual weight is unobtainable
□ □ □ □ □
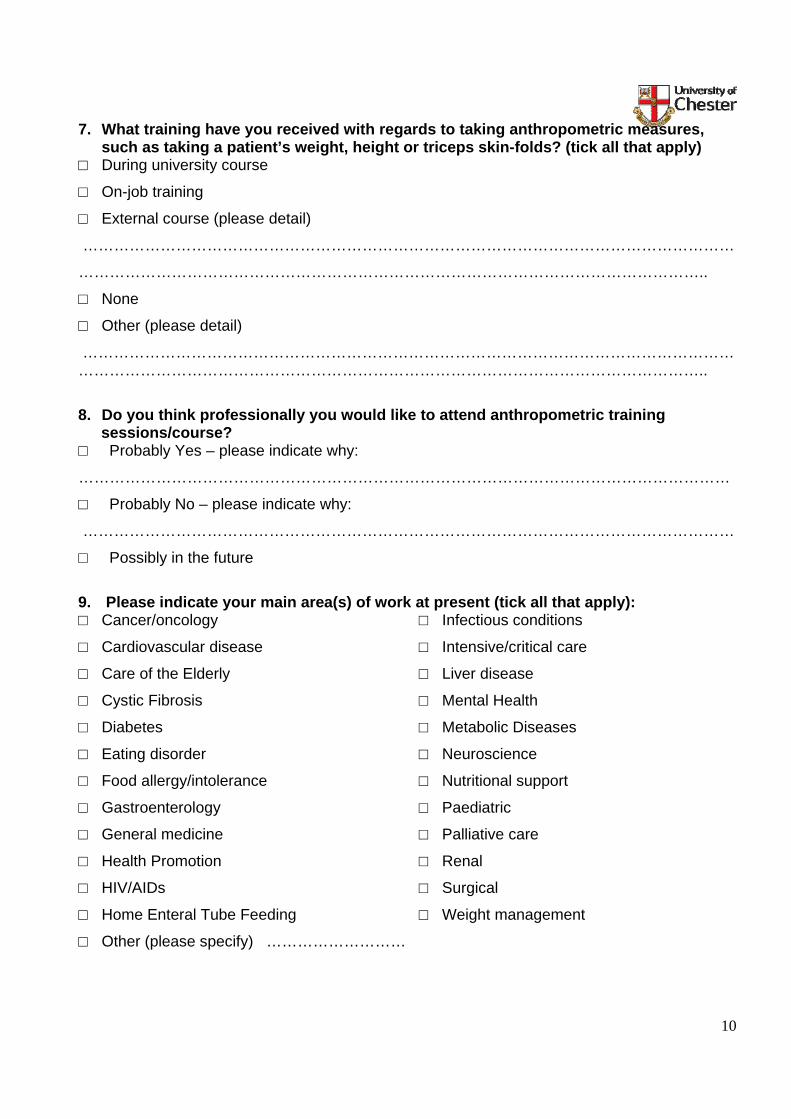
10
7. What training have you received with regards to taking anthropometric measures, such as taking a patient’s weight, height or triceps skin-folds? (tick all that apply)
□ During university course
□ On-job training
□ External course (please detail)
………………………………………………………………………………………………………………
…………………………………………………………………………………………………………..
□ None
□ Other (please detail)
…………………………………………………………………………………………………………………………………………………………………………………………………………………………..
8. Do you think professionally you would like to attend anthropometric training sessions/course?
□ Probably Yes – please indicate why:
………………………………………………………………………………………………………………
□ Probably No – please indicate why:
………………………………………………………………………………………………………………
□ Possibly in the future
9. Please indicate your main area(s) of work at present (tick all that apply): □ Cancer/oncology
□ Cardiovascular disease
□ Care of the Elderly
□ Cystic Fibrosis
□ Diabetes
□ Eating disorder
□ Food allergy/intolerance
□ Gastroenterology
□ General medicine
□ Health Promotion
□ HIV/AIDs
□ Home Enteral Tube Feeding
□ Infectious conditions
□ Intensive/critical care
□ Liver disease
□ Mental Health
□ Metabolic Diseases
□ Neuroscience
□ Nutritional support
□ Paediatric
□ Palliative care
□ Renal
□ Surgical
□ Weight management
□ Other (please specify) ………………………

11
10. Please indicate your gender: □ Male
□ Female
11. Please indicate the number of years since you qualified as a registered dietitian/started work as a dietetic assistant: □ 0 – 1 year
□ >1 – 5 years
□ >5 – 10 years
□ >10 – 15 years
□ >15 – 20 years
□ >20 years
12. Please indicate your current grade of working: □ < or equal to Band 3
□ Band 4
□ Band 5
□ Band 6
□ Band 7
□ Band 8 or above
13. Please indicate the number of contracted hours you are employed to work in your current post for the NHS as a dietitian or dietetic assistant: □ <10hours per week
□ 10 – 20 hours per week
□ >20 – 30 hours per week
□ >30 - 40 hours per week
Thank you for your contribution

12
PILOT STUDY QUESTIONS
1. Please note the length of time it took you to complete the questionnaire (questions 1-13) below: …………..………………………………………………………………………………………………………………………………………………………………………… 2. Do you think the questionnaire is -
□ too long □ just right □ too short □ Any comments:
…………..………………………………………………………………………………………………………………………………………………………………………………………………………………………………………………………………………………………………………………………..... 3. Do you think that instructions/guidelines and purpose of the questionnaire (on the title page) are clear and understandable?
□ Yes □ No □ Any comments:
…………..…………………………………………………………………………………………………………………………………………………………………………………………………………………………………………………………………………………………………………………………………………………………………………………………………………............
4. Please provide any suggestions or comments about:- a. how you use/don’t use anthropometry in day to day practice, b. barriers towards anthropometry, c. any personal views/preferences towards anthropometric measures.
(Please note that these ideas may be incorporated as questions within Question 6 of the questionnaire). …………..……………………………………………………………………………………………………………………………………………………………………………………………………………………………………………………………………………………………………………………………………………………………………………………………………………............…………..……………………………………………………………………………………………………………………………………………………………………………………………………………………………………………………………………………………………………………………………………………………………………………………………………………............
5. Do any of the questions seem ambiguous, difficult to understand or misleading as to how to complete the question i.e. how many to tick, where/how to mark or provide answer etc?
□ Yes, please note question this relates to below □ No □ Any comments:
…………..……………………………………………………………………………………………………………………………………………………………………………………………………………………………………………………………………………………………………………………………………
13
6. Do you think the font type and size is suitable?
□ Yes □ No □ Any comments:
…………..…………………………………………………………………………………………………………………………………………………………………………………………………………………………………………………………………………………………………………………………………………………………………………………………………………............ 7. Where space is left to complete “other” option or to enable the participant to provide further detail – do you think that there is enough room to write/complete responses?
□ Yes □ No □ Any comments:
…………..…………………………………………………………………………………………………………………………………………………………………………………………………………………………………………………………………………………………………………………………………………………………………………………………………………............ 8. Would you change the order of any/all of the questions?
□ Yes - please note which order you would place them in and why □ No □ Any comments:
…………..…………………………………………………………………………………………………………………………………………………………………………………………………………………………………………………………………………………………………………………………………………………………………………………………………………............ Please provide any comments you wish to give about the questionnaire or research topic. …………..……………………………………………………………………………………………………………………………………………………………………………………………………………………………………………………………………………………………………………………………………………………………………………………………………………............…………..…………………………………………………………………………………………………………………………………………………………………………………………………………………………………………………………………………………………………………………………………………………………………………………………………...............................................................................................................................................................................................................................................................................
Many thanks for your time and contributions towards this research project!

14
VALIDATION QUESTIONNAIRE Dear Colleague, Thank you for taking the time to complete the questionnaire and feedback questions. As a subsidiary and final part of the current project please would you take the time to complete the following series of questions, there are 3 groups of questions. Instructions of how to compete each series of questions are provided in turn. The following questions will take less than 5 minutes to complete. As this is a validation study please write your name and address below (please note that your details will not be identifiable within any part of the study*). If you are chosen to complete the validation study you will be contacted in the future, at one point only, to complete the questionnaire.
Name:
Address:
*The above details will be converted into a code by the researcher to ensure anonymity:□ □ □ □ □ □
Thank you once again for your time and co-operation.

15
1. Please mark, with a trait (a vertical line), on the scales below how confident you feel at taking the each of the following measurements:
a. A patient’s Height
b. A patient’s Weight
c. Calculating a patient’s
BMI
d. A patient’s Skin fold
measurement
e. A patient’s Mid-Upper
Arm Circumference
f. A patient’s Demi-span
g. A patient’s Knee
height
Not at all confident
Extremely confident
Not at all confident
Extremely confident
Not at all confident
Extremely confident
Not at all confident
Extremely confident
Not at all confident
Extremely confident
Not at all confident
Extremely confident
Not at all confident
Extremely confident

16
h. An infant’s Head
circumference
i. A patient’s Waist
circumference
j. A patient’s Hip circumference
k. A patient’s Waist to
Hip ratio
l. Measuring body mass
via BodPod
Not at all confident
Extremely confident
Not at all confident
Extremely confident
Not at all confident
Extremely confident
Not at all confident
Extremely confident
Not at all confident
Extremely confident

17
2. On the following pages please mark with a horizontal mark across the scale to indicate how confident you are at taking the following measurements:
a. A patient’s height
Confident
Very confident
Moderately confident
Mildly confident
Barely confident
Strongest imaginable confidence
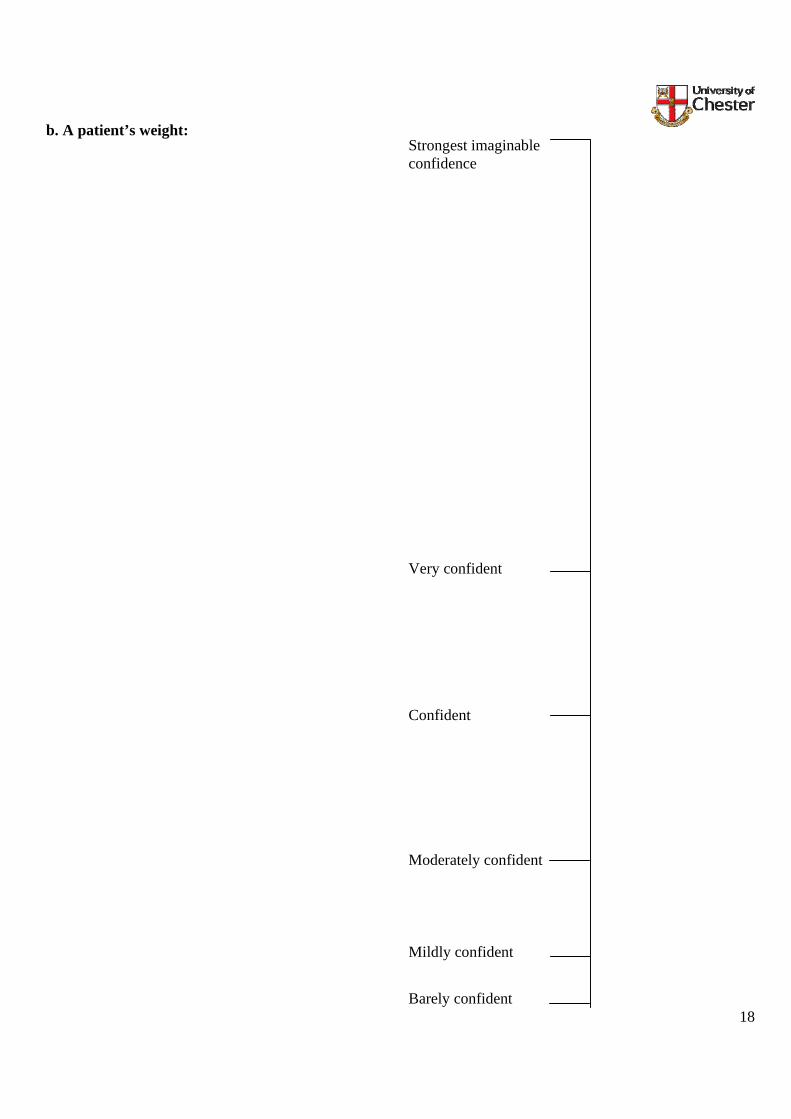
18
b. A patient’s weight:
Confident
Very confident
Moderately confident
Mildly confident
Barely confident
Strongest imaginable confidence

19
c. Calculating a patient’s BMI:
Confident
Very confident
Moderately confident
Mildly confident
Barely confident
Strongest imaginable confidence

20
d. A patient’s skinfold measurement:
Confident
Very confident
Moderately confident
Mildly confident
Barely confident
Strongest imaginable confidence

21
e. A patient’s mid-upper arm circumference:
Confident
Very confident
Moderately confident
Mildly confident
Barely confident
Strongest imaginable confidence

22
f. A patient’s demi-span:
Confident
Very confident
Moderately confident
Mildly confident
Barely confident
Strongest imaginable confidence

23
g. A patient’s knee height:
Confident
Very confident
Moderately confident
Mildly confident
Barely confident
Strongest imaginable confidence

24
h. A patient’s head circumference:
Confident
Very confident
Moderately confident
Mildly confident
Barely confident
Strongest imaginable confidence

25
i. A patient’s waist circumference:
Confident
Very confident
Moderately confident
Mildly confident
Barely confident
Strongest imaginable confidence

26
j. A patient’s hip circumference:
Confident
Very confident
Moderately confident
Mildly confident
Barely confident
Strongest imaginable confidence

27
k. Calculating a patient’s waist to hip ratio:
Confident
Very confident
Moderately confident
Mildly confident
Barely confident
Strongest imaginable confidence

28
l. Measuring a patient’s body mass via BodPod:
Confident
Very confident
Moderately confident
Mildly confident
Barely confident
Strongest imaginable confidence
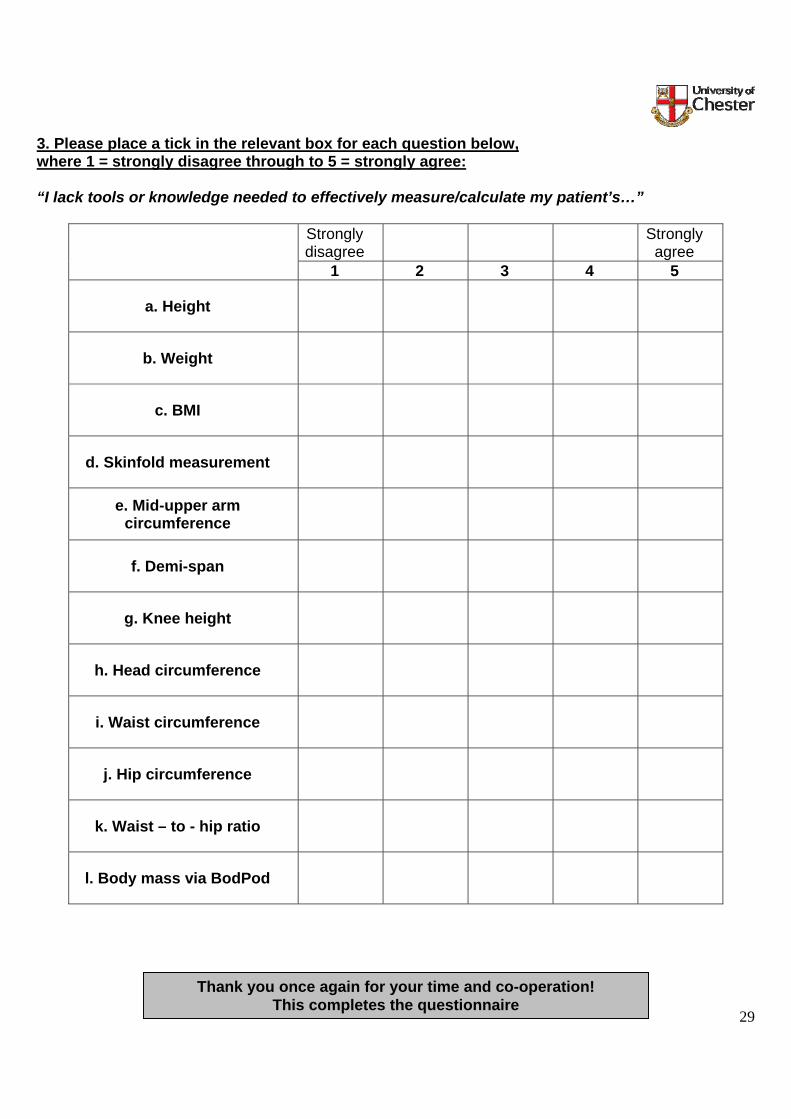
29
3. Please place a tick in the relevant box for each question below, where 1 = strongly disagree through to 5 = strongly agree: “I lack tools or knowledge needed to effectively measure/calculate my patient’s…”
Strongly disagree Strongly
agree 1 2 3 4 5
a. Height
b. Weight
c. BMI
d. Skinfold measurement
e. Mid-upper arm circumference
f. Demi-span
g. Knee height
h. Head circumference
i. Waist circumference
j. Hip circumference
k. Waist – to - hip ratio
l. Body mass via BodPod
Thank you once again for your time and co-operation!
This completes the questionnaire
1
Department of Biological Sciences
University of Chester Parkgate Road
Chester UK
CH1 4BJ
Determinants of Anthropometric Measurement Use Amongst Dietitians
VALIDATION QUESTIONNAIRE Dear Colleague, Thank you for recently taking the time to complete the questionnaire and feedback questions on your use of anthropometry. In order to complete the validation questionnaire please could you take the time to complete your name and address details below*, and then complete the following series of questions, there are 3 groups of questions. Instructions of how to compete each series of questions are provided in turn. Please submit all the pages in the pre-paid addressed envelope provided by the 30th December 2009. The following questions will take less than 5 minutes to complete.
Name:
Address:
*The above details will be converted into a code by the researcher to ensure anonymity:□ □ □ □ □ □
Thank you once again for your time and co-operation. This will complete your
involvement in the present study and you will not be contacted again.
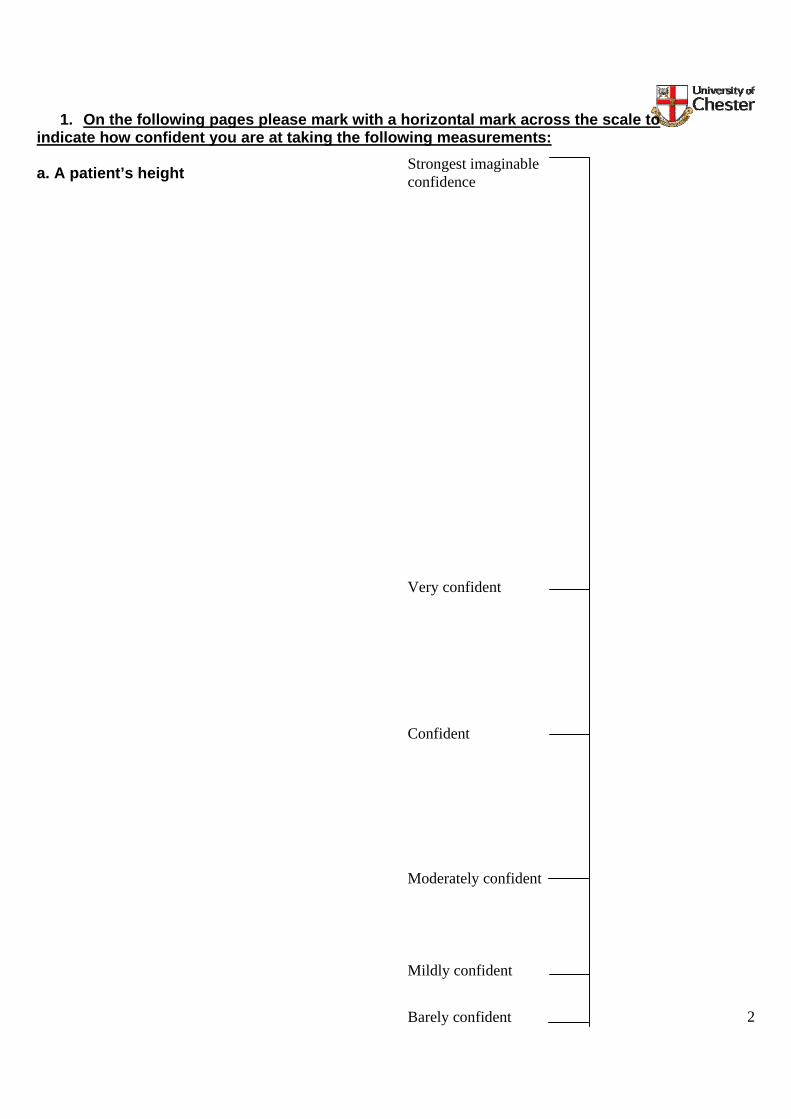
2
1. On the following pages please mark with a horizontal mark across the scale to indicate how confident you are at taking the following measurements:
a. A patient’s height
Confident
Very confident
Moderately confident
Mildly confident
Barely confident
Strongest imaginable confidence

3
b. A patient’s weight:
Confident
Very confident
Moderately confident
Mildly confident
Barely confident
Strongest imaginable confidence
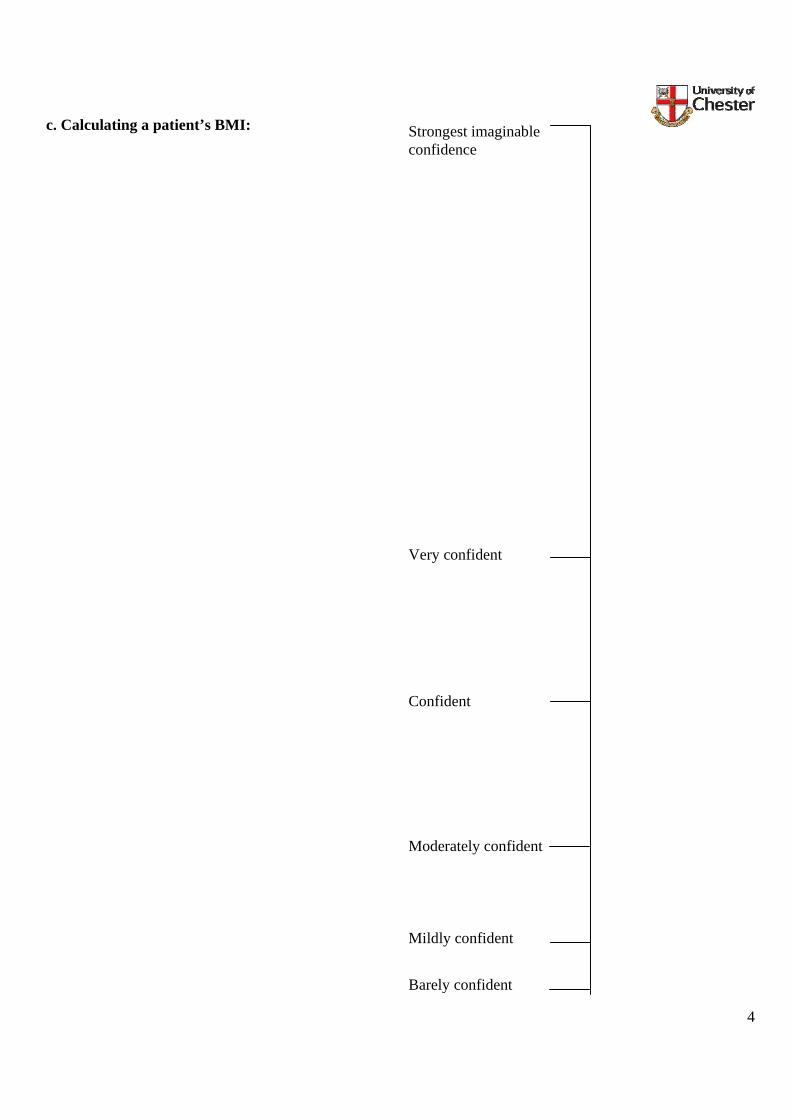
4
c. Calculating a patient’s BMI:
Confident
Very confident
Moderately confident
Mildly confident
Barely confident
Strongest imaginable confidence

5
d. A patient’s skinfold measurement:
Confident
Very confident
Moderately confident
Mildly confident
Barely confident
Strongest imaginable confidence
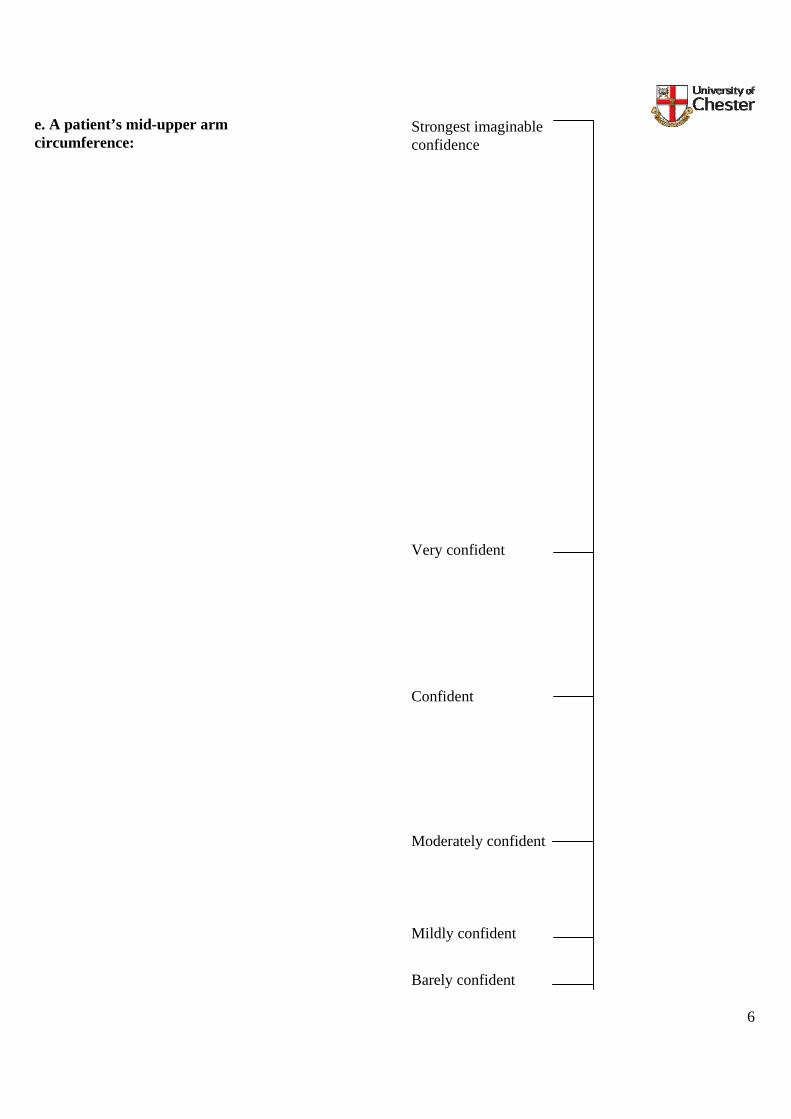
6
e. A patient’s mid-upper arm circumference:
Confident
Very confident
Moderately confident
Mildly confident
Barely confident
Strongest imaginable confidence

7
f. A patient’s demi-span:
Confident
Very confident
Moderately confident
Mildly confident
Barely confident
Strongest imaginable confidence

8
g. A patient’s knee height:
Confident
Very confident
Moderately confident
Mildly confident
Barely confident
Strongest imaginable confidence

9
h. A patient’s head circumference:
Confident
Very confident
Moderately confident
Mildly confident
Barely confident
Strongest imaginable confidence

10
i. A patient’s waist circumference:
Confident
Very confident
Moderately confident
Mildly confident
Barely confident
Strongest imaginable confidence

11
j. A patient’s hip circumference:
Confident
Very confident
Moderately confident
Mildly confident
Barely confident
Strongest imaginable confidence
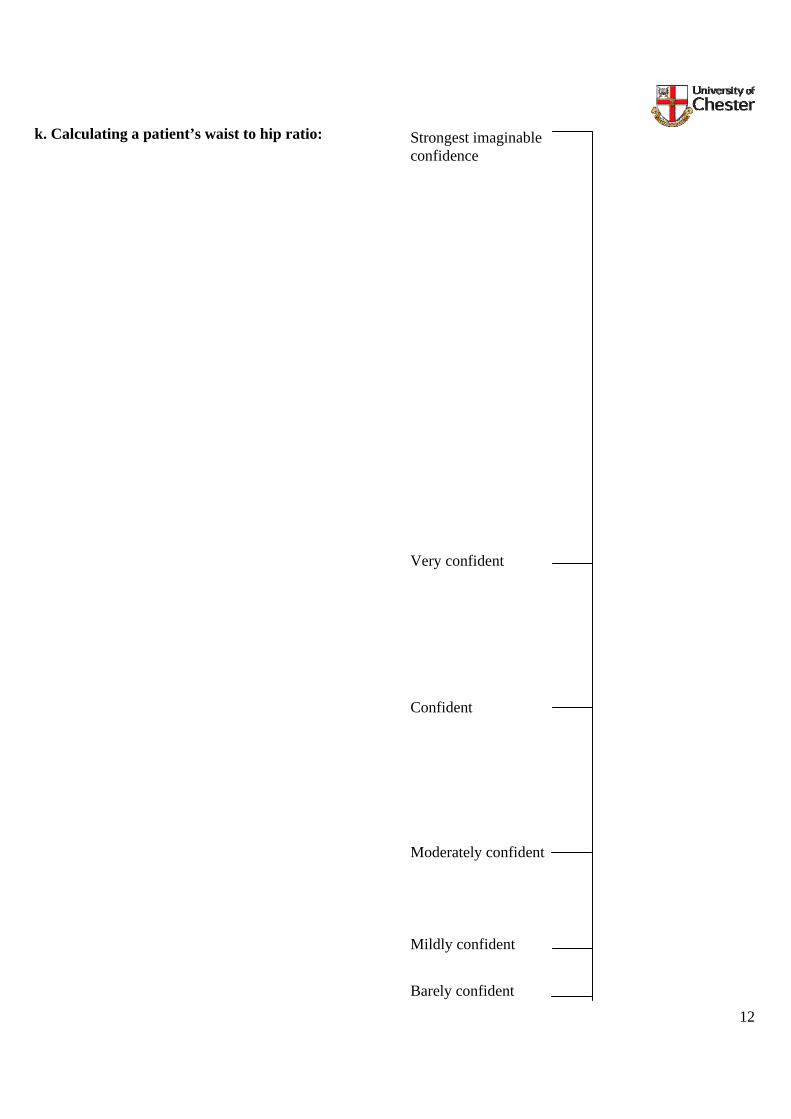
12
k. Calculating a patient’s waist to hip ratio:
Confident
Very confident
Moderately confident
Mildly confident
Barely confident
Strongest imaginable confidence
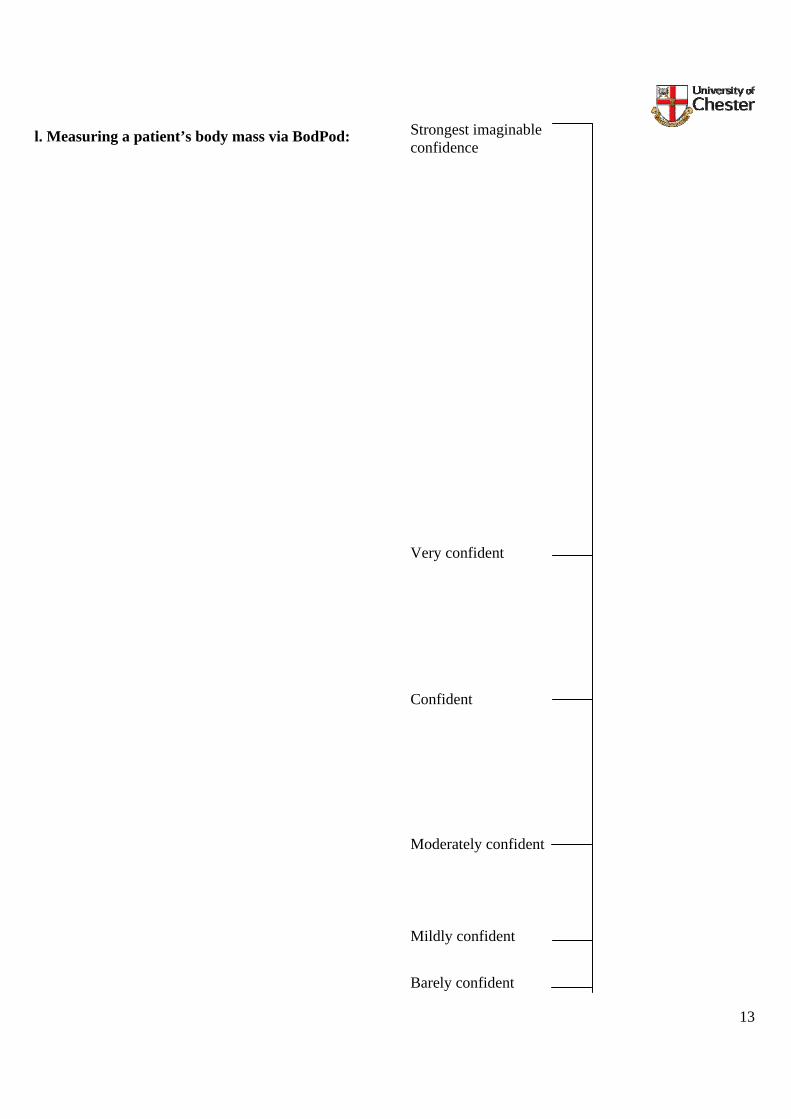
13
l. Measuring a patient’s body mass via BodPod:
Confident
Very confident
Moderately confident
Mildly confident
Barely confident
Strongest imaginable confidence

14
2. Please mark, with a trait (a vertical line), on the scales below how confident you feel at
taking the each of the following measurements:
a. A patient’s Height
b. A patient’s Weight
c. Calculating a patient’s
BMI
d. A patient’s Skin fold
measurement
e. A patient’s Mid-Upper
Arm Circumference
f. A patient’s Demi-span
g. A patient’s Knee
height
Not at all confident
Extremely confident
Not at all confident
Extremely confident
Not at all confident
Extremely confident
Not at all confident
Extremely confident
Not at all confident
Extremely confident
Not at all confident
Extremely confident
Not at all confident
Extremely confident

15
h. An infant’s Head
circumference
i. A patient’s Waist
circumference
j. A patient’s Hip circumference
k. A patient’s Waist to
Hip ratio
l. Measuring body mass
via BodPod
Not at all confident
Extremely confident
Not at all confident
Extremely confident
Not at all confident
Extremely confident
Not at all confident
Extremely confident
Not at all confident
Extremely confident

16
3. Please place a tick in the relevant box for each question below, where 1 = strongly disagree through to 5 = strongly agree: “I lack tools or knowledge needed to effectively measure/calculate my patient’s…”
Strongly disagree Strongly
agree 1 2 3 4 5
a. Height
b. Weight
c. BMI
d. Skinfold measurement
e. Mid-upper arm circumference
f. Demi-span
g. Knee height
h. Head circumference
i. Waist circumference
j. Hip circumference
k. Waist – to - hip ratio
l. Body mass via BodPod
Thank you once again for your time and co-operation! This completes the questionnaire

1
University of Chester Department of Biological Sciences
Parkgate Road Chester
CH1 4BJ
March 2010
Dear Colleague,
DETERMINANTS OF ANTHROPOMETRIC MEASUREMENT USE AMONGST DIETITIANS
You have been selected to take part in a survey which forms part of an MSc thesis. This survey asks a series of questions about dietetic practice and anthropometric use. There are no right or wrong answers and we would be very appreciative to hear your views. All answers will remain anonymous. It is hoped that this research project will provide evidence in to the practical use of anthropometry and potentially enhance training where necessary. Results may also recommend future research in related areas. If you would like to take part in the survey, please complete the following questions. This should take no longer than 10 minutes of your time. Please return the questionnaire no later than 30th April 2010 in the addressed envelope provided or to the above address (FAO: Miss L Mash, Student, MSc Nutrition and Dietetics).
Thank you for your time, it is very much appreciated!
Survey closing date: 30th April 2010
2
PARTICIPANT INFORMATION SHEET
“Determinants of Anthropometric Measurement Use Amongst Dietitians” Dear Participant, I am conducting an audit into dietetic practical use of anthropometry. You are being invited to take part in this research study. Before you decide, it is important for you to understand why the research is being done and what it will involve. Please take time to read the following information and use the contact details if you would like any further information. Thank you for reading this. What is the purpose of the study? To investigate community and acute working dietitians’ use and views of anthropometry in practice. Why have I been chosen? You have been chosen as you are a registered dietitian/dietetic assistant working in the North West of England, employed by the NHS. Do I have to take part? It is up to you to decide whether or not to take part. If you decide to take part you will be given this information sheet to keep. If you decide to take part you are still free to withdraw at any time without giving a reason. What will happen to me if I take part? If you decide to take part, you will be asked to complete the questionnaire that follows, and return this to the researcher using the envelope provided which includes a free post address. By doing this you are giving your consent for the researcher to use your answers as part of the study findings. All information is anonymous and responses will not be identifiable within the final report. What are the possible disadvantages and risks of taking part? There are no disadvantages or risks foreseen in taking part in this study. What are the possible benefits of taking part? By taking part you will be contributing to the development of the dietetic practice and profession thus potentially benefiting patient care in the future. What if something goes wrong? If you wish to complain or have any concerns about any aspect of the way you have been approached or treated during the course of this study, please contact: Professor Sarah Andrew, Dean of the Faculty of Applied and Health Sciences, University of Chester, Parkgate Road, Chester, CH1 4BJ. Tel: 01244 513055. Will my taking part in the study be kept confidential? All information which is collected about you during the course of the research will be kept strictly confidential so that only the researcher carrying out the research will have access to such information. We do not require your name or contact details which ensures confidentiality of responses and no information that could identify an individual will be used in the dissertation or in any publication, which may be written as a result of this research.

3
What will happen to the results of the research study? The results will be written up and contribute to the completion of an MSc dissertation thesis for the University of Chester. Findings may also contribute to published literature. For either case no individuals will be able to be identified. Who is organising and funding the research? The research is funded by the department of Biological Sciences at the University of Chester. The Centre for Public Health Research at the University of Chester has reviewed the study protocol. Who may I contact for further information? If you would like more information about the research before you decide whether or not you would be willing to take part, please contact: Laura Mash MSc Nutrition and Dietetics Student c/o Community Dietitian Sandringham House Castle Courts Windsor Street Salford M5 4DG Tel: 0161 212 4038
Dr. Eva Almiron-Roig MSc Supervisor Department of Biological Sciences University of Chester Parkgate Road Chester CH1 4BJ Tel: 01244 513124
Thank you for your participation.

4
QUESTIONNAIRE 1. Please indicate your main area of working*. (Which ever you choose please answer the following questions in relation to your selection)
□ Acute (i.e. Hospital based ONLY)
□ Mostly Acute
□ Community (i.e. Any location that is non-acute or hospital based ONLY)
□ Mostly Community
*n.b. this does not relate to employment but to actual place/area of working.
2. What screening tool does your trust employ (tick all that apply)? □ A single measure (e.g. biochemical/anthropometric or functional index)
□ Malnutrition Universal Screening Tool (‘MUST’)
□ Mini Nutritional Assessment (MNA)
□ Nutritional Risk Index
□ Registered Nurses Nutritional Risk Classification
□ Subjective Global Assessment (SGA)
□ The Nursing Nutritional Screening Form (NNSF)
□ The Prognostic Nutritional Index (PNI)
□ None
□ Own devised tool
□ Own devised tool based on another published tool (please detail)
…………………………………………………………………………………… ………………………
□ Other (please detail)
……………………………………….. ………………...………………………………………………

5
3. Please mark, with a trait (a single vertical line), on the scale below how confident you feel at taking the following measurements:
a. A patient’s Height
b. A patient’s Weight
c. Calculating a patient’s BMI
d. A patient’s Skin fold measurement
e. A patient’s Mid-Upper Arm Circumference
f. A patient’s Demi-span
g. A patient’s Knee height
h. A patient’s Ulna length
i. An infant’s Head circumference
j. A patient’s Waist circumference
k. A patient’s Hip circumference
l. A patient’s Waist to Hip ratio
m. Measuring body mass via BodPod
Not at all confident
Extremely confident
Not at all confident
Extremely confident
Not at all confident
Extremely confident
Not at all confident
Extremely confident
Not at all confident
Extremely confident
Not at all confident
Extremely confident
Not at all confident
Extremely confident
Not at all confident
Extremely confident
Not at all confident
Extremely confident
Not at all confident
Extremely confident
Not at all confident
Extremely confident
Not at all confident
Extremely confident
Not at all confident
Extremely confident

6
4. Please tick how often you use each of the measurements below when working as a dietitian or dietetic assistant:
Daily At least
Weekly At least Monthly
Less than Monthly Never
Measured height
Estimated height from demi span
Estimated height from knee height
Estimated height from ulna length
Recalled height
Measured weight
Estimated weight (eyeball)
Recalled weight
BMI
Triceps skin-folds
Other skin-fold measures
Waist circumference
Hip circumference
Waist : Hip ratio
Mid arm circumference (MAC)
BIA
DEXA
Length
Head circumference
Height : Age percentile
Weight : Age percentile
Height : Weight percentile
Hand Grip
Other, please detail:

7
5. Please tick all the reasons that apply to why you may not take/measure anthropometric measurements:
□ Don’t feel I need to
□ Lack of competency
□ Lack of confidence
□ Lack of evidence/not part of evidence-based practice
□ Lack of necessary equipment
□ No accurate/calibrated equipment
□ Lack of training
□ Not appropriate for patient
□ Not required by departmental policy
□ Patients do not like it
□ Time constraints of consultations/work load
□ Too invasive
□ It is taken by other health professionals
□ It is useful in research only
□ Other (please specify)
…………………………………………………………………………………………………
…………………………………………………………………………..………………………
………………………………………………….
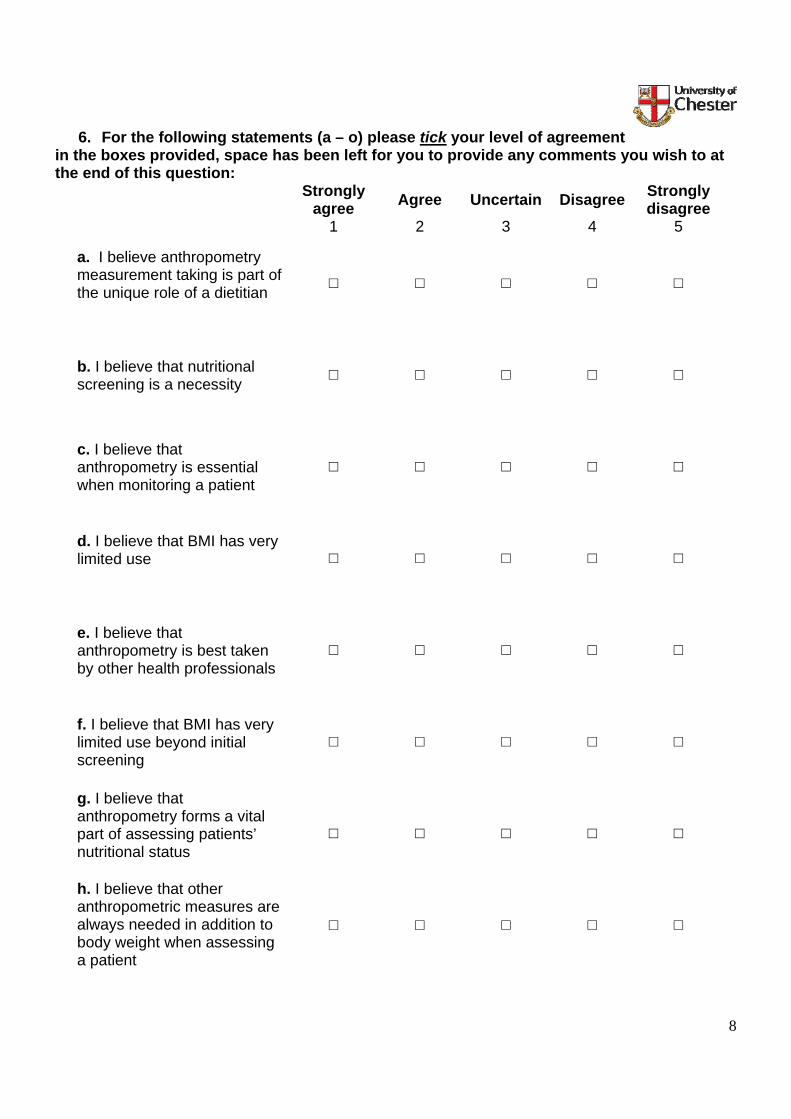
8
6. For the following statements (a – o) please tick your level of agreement in the boxes provided, space has been left for you to provide any comments you wish to at the end of this question:
Strongly agree Agree Uncertain Disagree Strongly
disagree 1 2 3 4 5
a. I believe anthropometry measurement taking is part of the unique role of a dietitian
□ □ □ □ □
b. I believe that nutritional screening is a necessity □ □ □ □ □
c. I believe that anthropometry is essential when monitoring a patient
□ □ □ □ □
d. I believe that BMI has very limited use
□ □ □ □ □
e. I believe that anthropometry is best taken by other health professionals
□ □ □ □ □
f. I believe that BMI has very limited use beyond initial screening
□ □ □ □ □
g. I believe that anthropometry forms a vital part of assessing patients’ nutritional status
□ □ □ □ □
h. I believe that other anthropometric measures are always needed in addition to body weight when assessing a patient
□ □ □ □ □
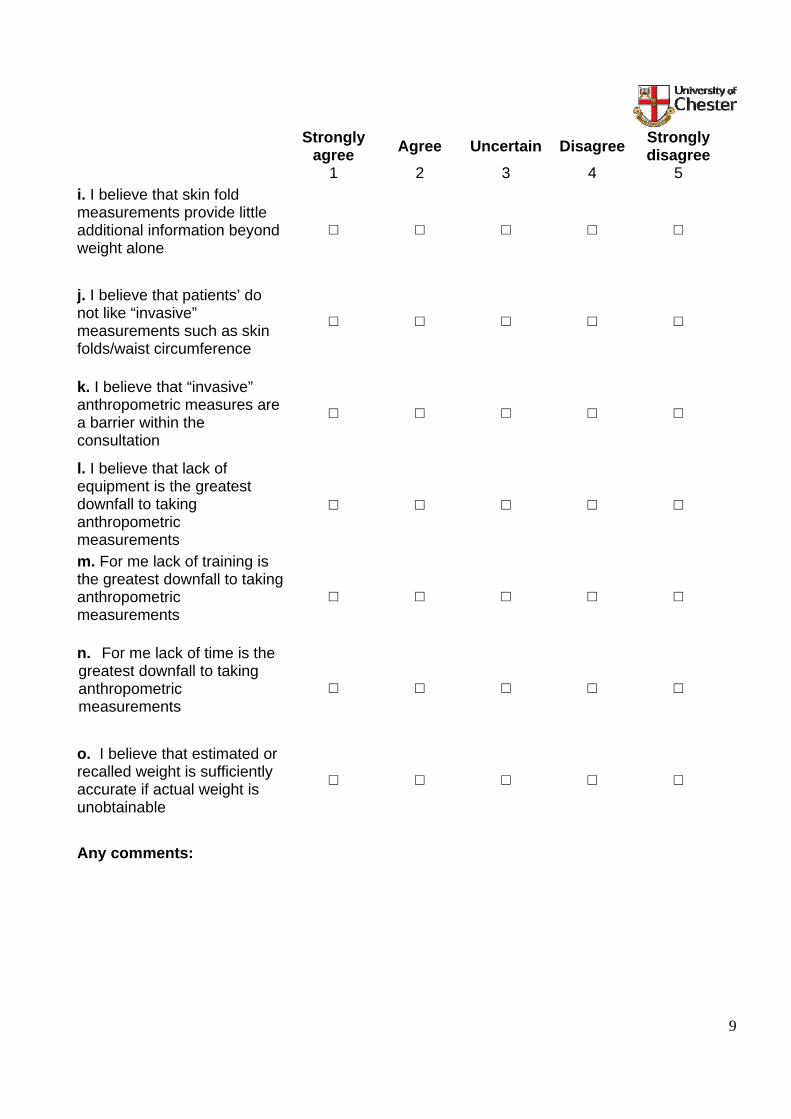
9
Strongly agree Agree Uncertain Disagree Strongly
disagree 1 2 3 4 5
i. I believe that skin fold measurements provide little additional information beyond weight alone
□ □ □ □ □
j. I believe that patients’ do not like “invasive” measurements such as skin folds/waist circumference
□ □ □ □ □
k. I believe that “invasive” anthropometric measures are a barrier within the consultation
□ □ □ □ □
l. I believe that lack of equipment is the greatest downfall to taking anthropometric measurements
□ □ □ □ □
m. For me lack of training is the greatest downfall to taking anthropometric measurements
□ □ □ □ □
n. For me lack of time is the greatest downfall to taking anthropometric measurements
□ □ □ □ □
o. I believe that estimated or recalled weight is sufficiently accurate if actual weight is unobtainable
□ □ □ □ □
Any comments:

10
7. What training have you received with regards to taking anthropometric measures, such as taking a patient’s weight, height or triceps skin-folds? (tick all that apply)
□ During university course
□ On-job training
□ External course (please detail)
………………………………………………………………………………………………………………
…………………………………………………………………………………………………………..
□ None
□ Other (please detail)
…………………………………………………………………………………………………………………………………………………………………………………………………………………………..
8. Do you think professionally you would like to attend anthropometric training sessions/course?
□ Probably Yes – please indicate why:
…………………………………………………………………………………………………………………………………………………………………………………………………………………………..
□ Probably No – please indicate why:
………………………………………………………………………………………………………………………………………………………………………………………………………………………….. □ Possibly in the future
9. Please indicate your main area(s) of work at present (tick all that apply): □ Cancer/oncology
□ Cardiovascular disease
□ Care of the Elderly
□ Cystic Fibrosis
□ Diabetes
□ Eating disorder
□ Food allergy/intolerance
□ Gastroenterology
□ General medicine
□ Health Promotion
□ HIV/AIDs
□ Home Enteral Tube Feeding
□ Infectious conditions
□ Intensive/critical care
□ Liver disease
□ Mental Health
□ Metabolic Diseases
□ Neuroscience
□ Nutritional support
□ Paediatric
□ Palliative care
□ Renal
□ Surgical
□ Weight management
□ Other (please specify) …

11
10. Please indicate your gender: □ Male □ Female
11. Please indicate the number of years since you qualified as a registered dietitian/started work as a dietetic assistant:
□ 0 – 1 year
□ >1 – 5 years
□ >5 – 10 years
□ >10 – 15 years
□ >15 – 20 years
□ >20 years
12. Please indicate your current grade of working: □ < or equal to Band 3
□ Band 4
□ Band 5
□ Band 6
□ Band 7
□ Band 8 or above
13. Please indicate the number of contracted hours you are employed to work in your current post for the NHS as a dietitian or dietetic assistant:
□ < 10 hours per week
□ 10 – 20 hours per week
□ >20 – 30 hours per week
□ >30 – 40 hours per week
This completes the questionnaire.
Once again, thank you for your time!

- 114 -
7.2. Appendix 2: Ethics: - University of Chester Research Ethics Committee letter;
- NRES and IRAS exemption letter;
- Letter of consent from SRFT manager.
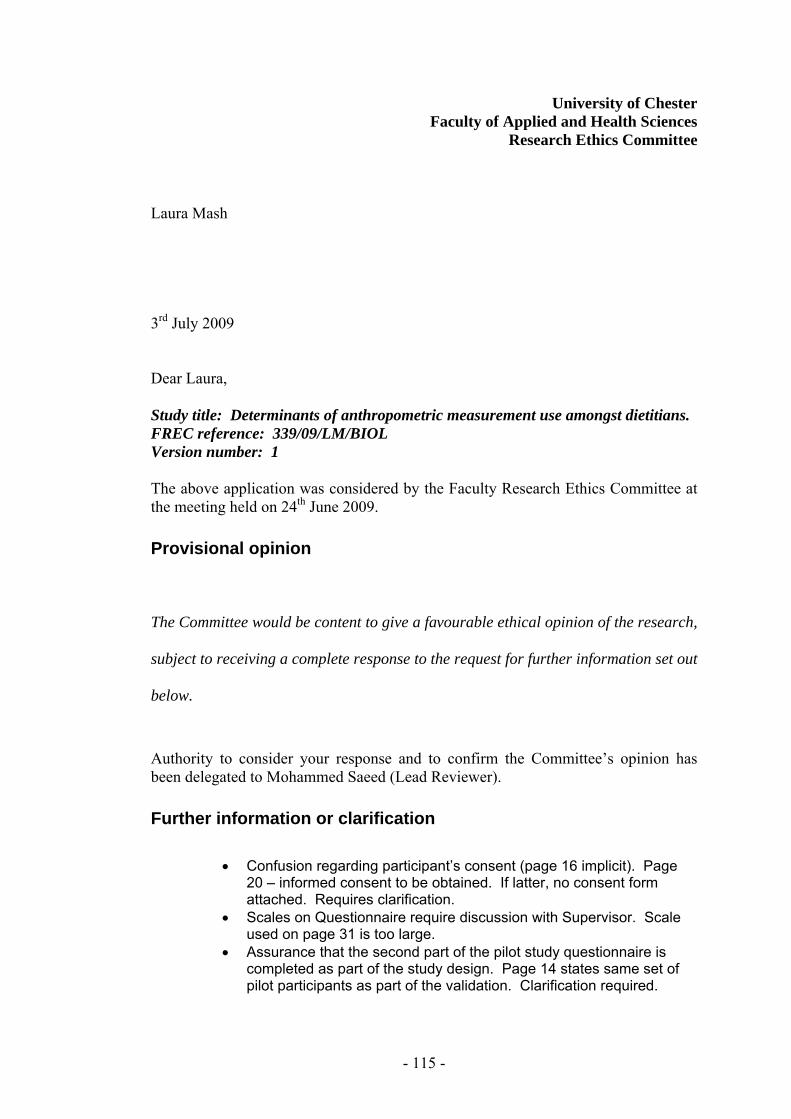
- 115 -
University of Chester Faculty of Applied and Health Sciences
Research Ethics Committee Laura Mash 3rd July 2009 Dear Laura, Study title: Determinants of anthropometric measurement use amongst dietitians. FREC reference: 339/09/LM/BIOL Version number: 1 The above application was considered by the Faculty Research Ethics Committee at the meeting held on 24th June 2009. Provisional opinion
The Committee would be content to give a favourable ethical opinion of the research,
subject to receiving a complete response to the request for further information set out
below.
Authority to consider your response and to confirm the Committee’s opinion has been delegated to Mohammed Saeed (Lead Reviewer). Further information or clarification
• Confusion regarding participant’s consent (page 16 implicit). Page 20 – informed consent to be obtained. If latter, no consent form attached. Requires clarification.
• Scales on Questionnaire require discussion with Supervisor. Scale used on page 31 is too large.
• Assurance that the second part of the pilot study questionnaire is completed as part of the study design. Page 14 states same set of pilot participants as part of the validation. Clarification required.
- 116 -
• Appendix H: Pilot Questionnaire - ‘Patient’ Information Sheet should read ‘Participant Information Sheet’.
• Note statistical review.
When submitting a response to the Committee, please send three copies of your revised documentation, where appropriate, underlining or otherwise highlighting the changes you have made and giving revised version numbers and dates where appropriate. Responses should be submitted within three months of the date of this letter. You do not need to resubmit your application. Please send your response to Mrs. Karen Murray, FREC Secretary, Centre for Public Health Research, University of Chester, Parkgate Road, Chester CH1 4BJ. The Committee will confirm the final ethical opinion on the application within a maximum of 15 working days from receipt of an appropriate and acceptable response.
Membership of the Committee The members of the Faculty Research Ethics Committee who were present at the meeting are listed on the attached sheet. Yours sincerely,
Mohammed Saeed Chair, Faculty Research Ethics Committee
Enclosures: * List of names of members who were present at the meeting and those who
submitted written comments * Statistician’s comments, where applicable * Response to FREC template
c.c.: Supervisor FREC Departmental/Centre Representative
- 117 -
University of Chester Faculty of Applied and Health Sciences
Research Ethics Committee
Statistical Feedback
Application: 339/09/LM/BIOL Study Design: This appears to have been considered in some detail. However, targeting all of the North West region NHS trusts does not justify extrapolating the results to the whole of the UK (see page 13, paragraph 1).
Proposed analysis: A scatter plot requires both variables to be interval measures (see page 15, top of page), so the proposed plot is inappropriate to compare the results for acute and community dietitians. A boxplot would be more suitable.
Sample size: The proposed number of responses (150) could well be necessary for some of the χ2 tests where the questions have a large number (11) of options.

- 118 -
Email Reply from NRES:
Exemption from NRES Ethics Process
Your query was reviewed by our Queries Line Advisers.
Our leaflet “Defining Research”, which explains how we differentiate research from other activities, is published at: http://www.nres.npsa.nhs.uk/rec-community/guidance/#researchoraudit Based on the information you provided, our advice is that the project is not considered to be research according to this guidance. Therefore it does not require ethical review by a NHS Research Ethics Committee.
Service Evaluation
If you are undertaking the project within the NHS, you should check with the relevant NHS care organisation(s) what other review arrangements or sources of advice apply to projects of this type. Guidance may be available from the clinical governance office.
Although ethical review by a NHS REC is not necessary in this case, all types of study involving human participants should be conducted in accordance with basic ethical principles such as informed consent and respect for the confidentiality of participants. When processing identifiable data there are also legal requirements under the Data Protection Act 2000. When undertaking an audit or service/therapy evaluation, the investigator and his/her team are responsible for considering the ethics of their project with advice from within their organisation. University projects may require approval by the university ethics committee.
This response should not be interpreted as giving a form of ethical approval or any endorsement of the project, but it may be provided to a journal or other body as evidence that ethical approval is not required under NHS research governance arrangements.
However, if you, your sponsor/funder or any NHS organisation feel that the project should be managed as research and/or that ethical review by a NHS REC is essential, please write setting out your reasons and we will be pleased to consider further.
Where NHS organisations have clarified that a project is not to be managed as research, the Research Governance Framework states that it should not be presented as research within the NHS.
Regards
Streamline your research application process with IRAS (Integrated Research Application System). To view IRAS and for further information visit www.myresearchproject.org.uk
Queries Line National Research Ethics Service National Patient Safety Agency 4-8 Maple Street London W1T 5HD Website: www.nres.npsa.nhs.uk Email: [email protected] Ref: 04/02

- 119 -

- 120 -
7.3. Appendix 3: Dietetic Departments:
- List of all NHS trusts within North West of England
- Telephone script.

- 121 -
http://www.nhs.uk/England/AuthoritiesTrusts/Acute/mapSearch.aspx?RegionCode=Q31 NHS Primary Care Trusts (PCTs) in North West
1. Ashton, Leigh and Wigan PCT Bryan House, 61-69 Standishgate, Wigan, Lancashire, WN1 1AH Tel: 01942 482711
2. Blackburn With Darwen PCT The Guide Business Centre, School Lane, Guide, Blackburn, Lancashire, BB1 2QH Tel: 01254 267 000
3. Blackpool PCT Seasider's Way, Blackpool, Lancashire, FY1 6JX Tel: 01253 651 200
4. Bolton PCT St. Peters House, Silverwell Street, Bolton, Lancashire, BL1 1PP Tel: 01204 377000
5. Bury PCT 21 Silver Street, Bury, Lancashire, BL9 0EN Tel: 0161 762 3100
6. Central and Eastern Cheshire PCT Barony Road, Nantwich, Cheshire, CW5 5QU Tel: 01270 415300
7. Central Lancashire PCT Jubilee House, Lancashire Enterprise Business, Leyland, Lancashire, PR26 6TR Tel: 01772 644400
8. Cumbria PCT 4 Wavell Drive, Rosehill Industrial Estate, Carlisle, Cumbria, CA1 2SE Tel: 01228 602000
9. East Lancashire PCT 31-33 Kenyon Road, Brierfield, Nelson, Lancashire, BB9 5SZ Tel: 01282 619909
10. Halton and St Helens PCT Victoria House, Holloway, Runcorn, Cheshire, WA7 4TH Tel: 01928 593600
11. Heywood, Middleton and Rochdale PCT 3rd and 5th Floors, Telegraph House, Baillie Street, Rochdale, Lancashire, OL16 1JATel: 01706 652800
12. Knowsley PCT Po Box 23, Nutgrove Villa, Westmorland Road, Huyton, Liverpool, Merseyside, L36 6GA Tel: 0151 443 4900
- 122 -
13. Liverpool PCT 1 Arthouse Square, 67-69 Seel Street, Liverpool, Merseyside, L1 4AZ Tel: 0151 296 7000
14. Manchester PCT Gateway House, Piccadilly South, Manchester, Greater Manchester, M60 7LP Tel: 0161 958 4000
15. North Lancashire PCT Derby Road, Wesham, Preston, Lancashire, PR4 3AL Tel: 01253 306305
16. Oldham PCT Ellen House, Waddington Street, Oldham, Lancashire, OL9 6EE Tel: 0161 622 6500
17. Salford PCT Suite 19, 21-23, Fifth Floor, St. James House, Pendleton Way, Salford, Lancashire, M6 5FW Tel: 0161 212 4800
18. Sefton PCT Burlington House, Crosby Road North, Liverpool, Merseyside, L22 0QB Tel: 0151 920 5056
19. Stockport PCT 8th Floor, Regent House, Heaton Lane, Stockport, Cheshire, SK4 1BS Tel: 0161 426 5000
20. Tameside and Glossop PCT New Century House, Windmill Lane, Denton, Manchester, Greater Manchester, M34 2JF Tel: 0161 304 5300
21. Trafford PCT 2nd Floor, Oakland House, Talbot Road, Old Trafford, Manchester, Greater Manchester, M16 0PQ Tel: 0161 873 9500
22. Warrington PCT 930 - 932 Birchwood Boulevard, Birchwood, Warrington, Cheshire, WA3 7QN Tel: 01925 843600
23. Western Cheshire PCT 1829 Building, The Countess Of Chester Health, Liverpool Road, Chester, Cheshire, CH2 1HJ Tel: 01244 650300
24. Wirral PCT Admin Block, St. Catherines Hospital, Church Road, Birkenhead, Merseyside, CH42 0LQ Tel: 0151 651 0011

- 123 -
NHS Acute (Hospital) Trusts in North West
1. Aintree University Hospitals NHS Foundation Trust University Hospital Aintree, Fazakerley Hospital, Lower Lane, Liverpool, Merseyside, L9 7AL Tel: 0151 525 5980
2. Blackpool, Fylde and Wyre Hospitals NHS Trust Victoria Hospital, Whinney Heys Road, Blackpool, Lancashire, FY3 8NR Tel: 01253 300000
3. Bolton Hospitals NHS Trust The Royal Bolton Hospital, Minerva Road, Farnworth, Bolton, Lancashire, BL4 0JR Tel: 01204 390390
4. Central Manchester and Manchester Children's University Hospitals NHS Trust Trust Headquarters, Cobbett House, Manchester Royal Infirmary, Oxford Road, Manchester, Greater Manchester, M13 9WL Tel: 0161 276 1234
5. Christie Hospital NHS Trust 550 Wilmslow Road, Withington, Manchester, Greater Manchester, M20 4BX Tel: 0845 226 3000
6. Clatterbridge Centre For Oncology NHS Foundation Trust Clatterbridge Road, Bebington, Wirral, Merseyside, CH63 4JY Tel: 0151 334 1155
7. Countess Of Chester Hospital NHS Foundation Trust The Countess Of Chester Health Park, Chester, Cheshire, CH2 1UL Tel: 01244 365 000
8. East Cheshire NHS Trust Macclesfield District Gen Hospital, Victoria Road, Macclesfield, Cheshire, SK10 3BL Tel: 01625 421000
9. East Lancashire Hospitals NHS Trust Royal Blackburn Hospital, Haslingden Road, Blackburn, Lancashire, BB2 3HH Tel: 01254 263555
10. Lancashire Teaching Hospitals NHS Foundation Trust Chief Executive's Office, Royal Preston Hospital, Sharoe Green Lane, Fulwood, Preston, Lancashire, PR2 9HT Tel: 01772 716565/ 01257 261222
11. Liverpool Women's NHS Foundation Trust Liverpool Womens Hospital, Crown Street, Liverpool, Merseyside, L8 7SS Tel: 0151 708 9988
12. North Cheshire Hospitals NHS Trust Warrington Hospital, Lovely Lane, Warrington, Cheshire, WA5 1QG Tel: 01925 635911

- 124 -
13. North Cumbria Acute Hospitals NHS Trust West Cumberland Hospital, Hensingham, Whitehaven, Cumbria, CA28 8JG Tel: 01946 693181
14. Pennine Acute Hospitals NHS Trust Trust Headquarters, North Manchester General Hospital, Delaunays Road, Manchester, Lancashire, M8 5RB Tel: 0161 624 0420
15. Royal Liverpool and Broadgreen University Hospitals NHS Trust Royal Liverpool University Hospital, Prescot Street, Liverpool, Merseyside, L7 8XP Tel: 0151 706 2000
16. Royal Liverpool Childrens NHS Trust Alder Hey Hospital, Eaton Road, West Derby, Liverpool, Merseyside, L12 2AP Tel: 0151 228 4811
17. Salford Royal NHS Foundation Trust Hope Hospital, Stott Lane, Salford, Lancashire, M6 8HD Tel: 0161 789 7373
18. Southport and Ormskirk Hospital NHS Trust Town Lane, Southport, Merseyside, PR8 6PN Tel: 01704 547471
19. St Helens and Knowsley Hospitals NHS Trust Whiston Hospital, Warrington Road, Prescot, Merseyside, L35 5DR Tel: 0151 426 1600
20. Stockport NHS Foundation Trust Stepping Hill Hospital, Poplar Grove, Stockport, Cheshire, SK2 7JE Tel: 0161 483 1010
21. Tameside and Glossop Acute Services NHS Trust Tameside General Hospital, Fountain Street, Ashton-under-Lyne, Lancashire, OL6 9RW Tel: 0161 331 6000
22. The Cardiothoracic Centre - Liverpool NHS Trust Thomas Drive, Liverpool, Merseyside, L14 3PE Tel: 0151 228 1616
23. The Mid Cheshire Hospitals NHS Trust Leighton Hospital, Leighton, Crewe, Cheshire, CW1 4QJ Tel: 01270 255141
24. Trafford Healthcare NHS Trust Trafford General Hospital, Moorside Road, Urmston, Manchester, Greater Manchester, M41 5SL Tel: 0161 748 4022
25. University Hospital Of South Manchester NHS Foundation Trust Wythenshawe Hospital, Southmoor Road, Wythenshawe, Manchester, Greater Manchester, M23 9LT Tel: 0161 998 7070
- 125 -
26. University Hospitals Of Morecambe Bay NHS Trust Westmorland General Hospital, Burton Road, Kendal, Cumbria, LA9 7RG Tel: 01539 795366
27. Walton Centre For Neurology and Neurosurgery NHS Trust Lower Lane, Liverpool, Merseyside, L9 7LJ Tel: 0151 525 3611
28. Wirral Hospital NHS Trust Arrowe Park Hospital, Arrowe Park Road, Upton, Wirral, Merseyside, CH49 5PE Tel: 0151 678 5111
29. Wrightington, Wigan and Leigh NHS Trust The Elms, Royal Albert Edward Infirmary, Wigan Lane, Wigan, Lancashire, WN1 2NNTel: 01942 244000

- 126 -
Telephone script.
Trust:
Introduction Hello my name is Laura, I am a MSc student at the University of chester would it be possible to speak with your manager please?
Manager
Introduce project
I am conducting a dissertation looking at Anthropometry use amongst dietititians. I am hoping to target all NHS working dietitians in the North West of England as so to be able to
compare different dietitian working groups. Would it be possible for me to send your department a short questionnaire to
complete?
Answer
Information re: questionnaire
The questionnaire has 13 questions and will take approx 5-10 mins to complete. I will send one questionnaire to each of your
dietitians and dietetic assistants which will have a self addressed/freepost envelop attached, so you wont have any
associated costs.
How many dieititans are there in your department?
I will provide 2 follow-up reminders, how would you like me to contact you
in the future, Email or telephone?
Confirm contact details
Close Thank you very much for your time.