anthropometric and physical qualities of elite male … · mance, together with ... key points...
TRANSCRIPT
REVIEW ARTICLE
Anthropometric and Physical Qualities of Elite Male YouthRugby League Players
Kevin Till1,2 • Sean Scantlebury1 • Ben Jones1,2,3
Published online: 3 June 2017
� The Author(s) 2017. This article is an open access publication
Abstract Rugby league is a collision team sport played at
junior and senior levels worldwide, whereby players
require highly developed anthropometric and physical
qualities (i.e. speed, change-of-direction speed, aerobic
capacity, muscular strength and power). Within junior
levels, professional clubs and national governing bodies
implement talent identification and development pro-
grammes to support the development of youth (i.e.
13–20 years) rugby league players into professional ath-
letes. This review presents and critically appraises the
anthropometric and physical qualities of elite male youth
rugby league players aged between 13 and 20 years, by age
category, playing standard and playing position. Height,
body mass, body composition, linear speed, change-of-di-
rection speed, aerobic capacity, muscular strength and
power characteristics are presented and demonstrate that
qualities develop with age and differentiate between
playing standard and playing position. This highlights the
importance of anthropometric and physical qualities for the
identification and development of youth rugby league
players. However, factors such as maturity status, vari-
ability in development, longitudinal monitoring and career
attainment should be considered to help understand, iden-
tify and develop the physical qualities of youth players.
Further extensive research is required into the anthropo-
metric and physical qualities of youth rugby league players,
specifically considering national standardised testing bat-
teries, links between physical qualities and match perfor-
mance, together with intervention studies, to inform the
physical development of youth rugby league players for
talent identification and development purposes.
Key Points
Anthropometric and physical qualities develop with
age in junior rugby league players but this is
influenced by maturity status and the individual
variability in the development of such qualities.
Anthropometric and physical qualities differ
between playing standard, with increased physical
qualities related to higher playing levels and future
career success.
Anthropometric and physical qualities differ
between playing positions, with forwards generally
bigger with greater strength, while backs have
greater linear speed, change-of-direction speed and
aerobic capacity.
1 Introduction
Rugby league is a collision team sport played at junior and
senior levels worldwide. Professional teams and game
popularity are most established in the UK, France, Aus-
tralia and New Zealand [1, 2], with the European Super
League and Australasian National Rugby League (NRL)
& Kevin Till
1 Institute for Sport, Physical Activity and Leisure, Leeds
Beckett University, Headingley Campus, Room 108,
Cavendish Hall, West Yorkshire, Leeds LS6 3QS, UK
2 Leeds Rhinos RLFC, Leeds, UK
3 Rugby Football League, Red Hall, Leeds, UK
123
Sports Med (2017) 47:2171–2186
DOI 10.1007/s40279-017-0745-8
the two major professional leagues in the world. Rugby
league teams consist of 13 players commonly split into two
major playing groups (i.e. ‘backs’ and ‘forwards’) or four
subgroups of outside backs (fullback, wing, centre), pivots
(stand-off, scrum-half, hooker), props, and back row (sec-
ond row, loose forward). The playing demands vary by
position, with outside backs involved in more free running,
pivots undertaking greater decision making and ball han-
dling roles, and props and back-row positions involved in
more physical collisions [2, 3].
Rugby league performance may be determined by the
complex interaction of individual players’ technical, tacti-
cal, cognitive and physical qualities [4]. To date, the
majority of available research has focused on the physical
demands of match-play and the physical qualities of
players, which has recently been comprehensively sum-
marised in a review titled ‘Applied Sport Science of Rugby
League’ [5]. Research shows rugby league match-play is
intermittent, involving frequent periods of high-intensity
activity (e.g. high-speed running) separated by lower-in-
tensity activity (e.g. jogging, repositioning) [6–8]. Total
distance covered during match-play can range between
4000 and 8000 m dependent on playing position and
playing standard [6, 9, 10], with up to 1000 m covered at
high-speed distances [8] comprising a large number of
short distance (i.e. 10 m) efforts [11]. As well as the large
high-speed running demands, players are frequently
involved in a large number of collision and wrestling bouts
through defensive (e.g. tackling) and offensive (ball car-
rying) involvements [12]. Due to the high physical
demands of rugby league, players require highly developed
anthropometric and physical qualities (i.e. linear speed,
change-of-direction speed, aerobic capacity, muscular
strength and power) to succeed [3, 5].
Although Johnston and colleagues [5] reviewed rugby
league research, only a brief summary was provided for the
youth rugby league player. However, the identification and
development of the next generation of youth rugby league
players is a major focus of rugby league national governing
bodies and professional clubs. Thus, talent identification
and development programmes are common practice, usu-
ally termed rugby league academies [13, 14], to support the
development and transition of youth rugby league players
aged between 13 and 20 years into senior professional
athletes. The physical development of youth rugby league
players is of vast importance to player development staff,
coaches, sport scientists, and strength and conditioning
practitioners in advancing players to meet the high physical
demands associated with professional rugby league match-
play [5]. Therefore, the use of objective markers of phys-
ical development and evidence-based practices to support
talent identification and development is a very important
consideration in the optimisation of the development of
youth rugby league players, as it is with other sports (i.e.
taekwondo [15] and mixed martial arts [16]). In addition,
understanding factors that may influence the development
of physical characteristics (i.e. growth, maturation) during
this key development period (i.e. adolescence) is important
for optimising long-term development within youth rugby
league players. Therefore, the collation of existing research
to provide a clear understanding of the importance and
development of physical qualities for youth rugby league
players would be beneficial for research and practice.
Therefore, the purpose of this review was to (1) present
the anthropometric and physical qualities of elite male
youth rugby league players aged between 13 and 20 years;
and (2) critically appraise the literature surrounding the
anthropometric and physical qualities of youth rugby lea-
gue players, drawing comparisons between age categories,
playing standards and playing positions while considering
factors such as growth, maturation and longitudinal
development. This review provides a framework to assist
practitioners to effectively prepare youth players for the
physiological demands of professional rugby league while
understanding factors that may affect the physical devel-
opment of the youth rugby league player.
2 Methodological Aspects
A computer literature search of the PubMed, Google
Scholar, and Scopus electronic databases was performed
for English-language, peer-reviewed articles from incep-
tion to April 2016 using the following key words: ‘rugby
league’, ‘youth AND rugby league’, ‘elite AND youth
AND rugby league’, ‘anthropometric AND rugby league’,
‘body composition AND rugby league’, ‘speed AND rugby
league’, ‘agility AND rugby league’, ‘change of direction
speed AND rugby league’, ‘power AND rugby league’,
‘aerobic capacity AND rugby league’, and ‘strength AND
rugby league’. The electronic search was supplemented by
hand searching the reference lists for articles that met the
study inclusion criteria.
The themes of the review represented the major
anthropometric and physical qualities influencing rugby
league performance, including height, body mass, body
composition, linear speed, change-of-direction speed (agi-
lity), aerobic capacity, muscular strength and muscular
power. Only those studies examining the abovementioned
fitness physical qualities using established and accepted
methods in the context of athlete preparation and perfor-
mance were included. Data are presented in tables and
discussed in the text. As the review sought to identify
physical qualities within elite youth rugby league players,
studies that only investigated sub-elite junior rugby league
players were excluded from the data tables but were
2172 K. Till et al.
123
included in the review text. Elite players were defined as
players who were selected for a national governing body
talent identification and development programme or were
members of a professional rugby league club academy
programme. Studies that reported data on elite players
within annual-age categories for all players (regardless of
position) or by positional groups (i.e. forwards vs. backs)
or subcategories (e.g. outside backs, pivots, props, back
row) are presented in the tables. After the exclusion of
articles that did not meet the required criteria, the
tables present the anthropometric characteristics from 12
articles; linear speed, change-of-direction speed, aerobic
capacity and muscular power from 11 articles, while
strength characteristics were reviewed from 4 articles.
Other articles are discussed throughout the text but are not
included in the presentation of data in the tables.
3 Anthropometric Qualities
Due to the physical contact nature of rugby league,
anthropometric qualities are deemed important for perfor-
mance [17, 18]. Table 1 presents the height and body mass
data for elite youth rugby league players by age category
(under 13–20s) and playing position.
Height and body mass have been shown to increase with
age in elite [17, 19–23] and sub-elite players [24, 25], are
greater within elite compared with sub-elite levels
[13, 26–28], and are higher in forwards than backs
[17, 21, 29, 30]. Findings in elite players aged between 13
and 15 years [17] showed that 92.4 and 33.3% of players
were taller and 96.0 and 30.3% were heavier than the UK
50th and 97th growth percentiles, respectively [31]. Similar
findings, although less striking, were apparent in Australian
under 18 players, with 24 and 4% above the 90th and 97th
percentiles for height, respectively, and 25% of players
above the 97th percentile for body mass [32]. Therefore,
youth players are taller and heavier than the general pop-
ulation, with greater size an advantage for participation and
performance in youth rugby league.
Height and body mass increase with age due to the
normal processes related to growth and maturation [33].
Longitudinal data in players aged under 13–15 [20] and
under 16–20 [34] have shown annual increases in height
and body mass into the early 20s, with greater gains
occurring at younger ages (i.e. 13–15 years) [3, 20, 34, 35]
due to maturational processes (see Sect. 10). Interestingly,
currently available research (Table 1) within elite youth
players shows shorter and lighter players in the under 16
compared with under 15 age categories. This occurs due to
the under 15s being a national talent development pro-
gramme, compared with the under 16s being from an elite
club academy, and is a limitation of the current research.
When comparing height and body mass between playing
standards, increased size provided a small advantage for
selection between elite (178.0 ± 5.9 cm, 77.5 ± 10.0 kg)
and sub-elite (175.2 ± 6.9 cm, 72.3 ± 11.7 kg) levels in
players in the under 16 age category [28], and a small to
moderate difference between starters and non-starters in
both elite and sub-elite levels at under 14, 16 (e.g. body
mass 77.5 ± 10.0 vs. 74.3 ± 13.4 kg) and 18 age cate-
gories [25]. Senior professional players from two European
Super League clubs were also taller (183.2 ± 5.8 vs.
179.2 ± 5.7 cm) and heavier (96.5 ± 9.3 vs.
86.5 ± 9.0 kg) than their academy under 19 counterparts
[30]. Such findings suggest that increased size is advanta-
geous for selection to higher playing standards in rugby
league, most probably due to the ability to generate greater
impact forces throughout the frequent contacts involved in
the sport [5, 18]. However, within more homogenous
samples (i.e. regional and national level within the UK
between under 13s and 15s), no differences were observed
for height and body mass between playing standards (see
Table 1) [13]. In addition, when comparing height and
body mass of 13- to 15-year-olds against future career
attainment (i.e. whether players achieved amateur, acad-
emy or professional status in adulthood), no differences
were found between career attainment levels [14, 36], and,
in the under 14 age category, future professionals
(61.7 ± 9.2 kg) had a significantly lower body mass than
amateur (71.1 ± 11.8 kg) and academy (70.0 ± 10.7 kg)
players [36]. These differences may be supported by the
fact that no relationships were observed between height
and body mass and tackling ability in junior players despite
contrasting findings in senior cohorts [37]. Contradictory to
these findings, within players in the under 17–19 age cat-
egories from a professional UK Super League club, height
(e.g. under 17s, 176.9 ± 5.5 vs. 181.8 ± 3.1 cm) and body
mass (e.g. under 19s, 87.5 ± 9.9 vs. 90.8 ± 9.7 kg) did
differentiate between players who achieved professional or
academy status [38]. Therefore, increased body size may
not be advantageous until post 16 years of age, when
increased height and development of body mass may
influence player development and future career success
because of the demands of the sport.
Positional differences in body size are consistent with
findings in senior players, with forwards (i.e. props and
back row, or hit-up forwards) being taller and heavier than
backs (i.e. pivots and outside backs) [17, 21, 30, 39]. These
findings are aligned to the match demands of forwards and
backs in senior competition [6], with increased frequency
of collisions within forward positions alongside the
importance of winning the ruck. However, limited match
characteristics are available by playing position in youth
players and little is known about the impact that this may
have on player development.
Physical Qualities of Youth Rugby League Players 2173
123
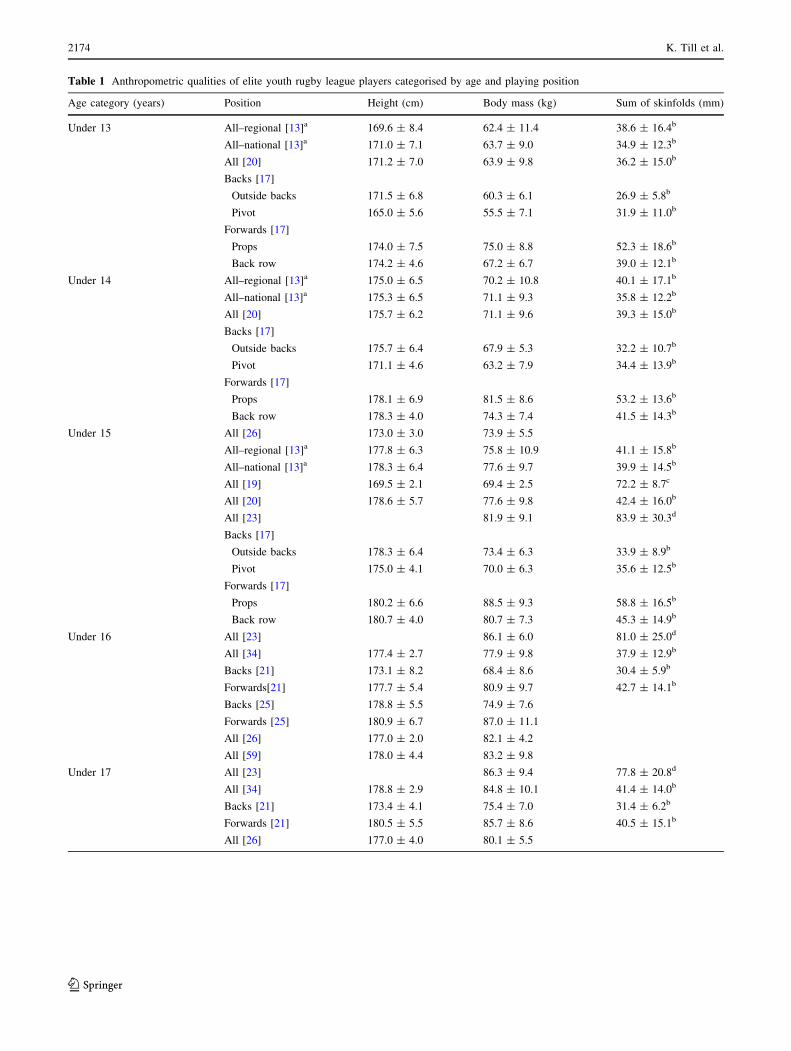
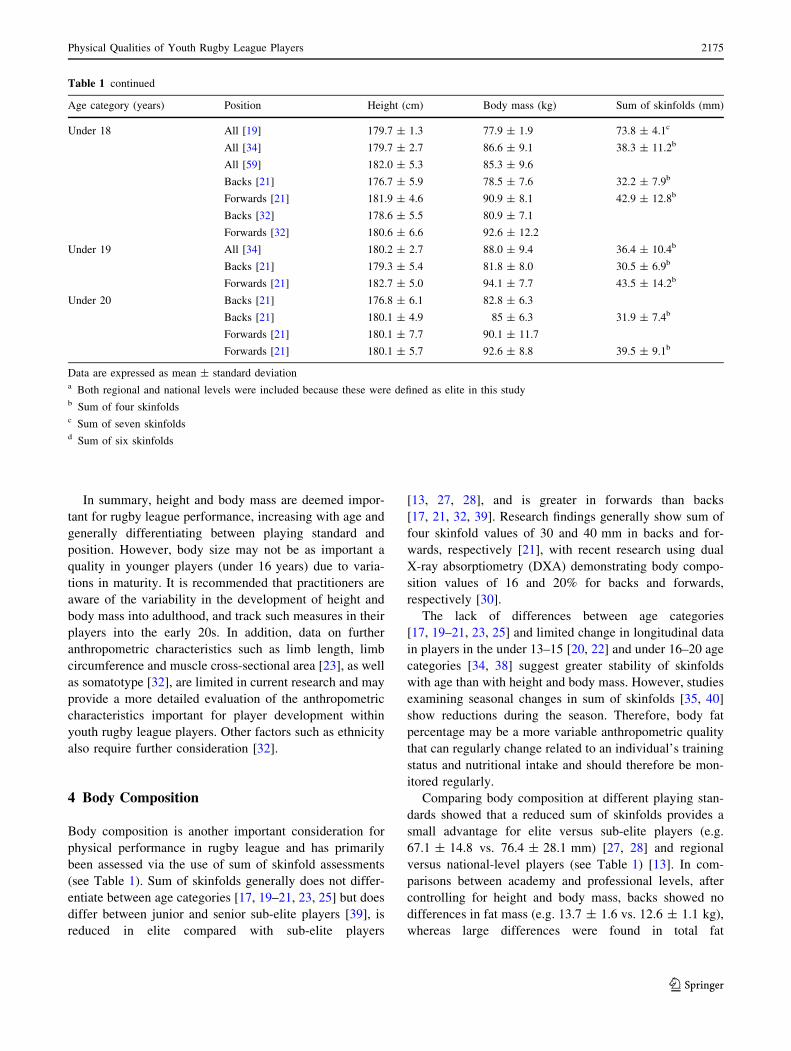
Table 1 Anthropometric qualities of elite youth rugby league players categorised by age and playing position
Age category (years) Position Height (cm) Body mass (kg) Sum of skinfolds (mm)
Under 13 All–regional [13]a 169.6 ± 8.4 62.4 ± 11.4 38.6 ± 16.4b
All–national [13]a 171.0 ± 7.1 63.7 ± 9.0 34.9 ± 12.3b
All [20] 171.2 ± 7.0 63.9 ± 9.8 36.2 ± 15.0b
Backs [17]
Outside backs 171.5 ± 6.8 60.3 ± 6.1 26.9 ± 5.8b
Pivot 165.0 ± 5.6 55.5 ± 7.1 31.9 ± 11.0b
Forwards [17]
Props 174.0 ± 7.5 75.0 ± 8.8 52.3 ± 18.6b
Back row 174.2 ± 4.6 67.2 ± 6.7 39.0 ± 12.1b
Under 14 All–regional [13]a 175.0 ± 6.5 70.2 ± 10.8 40.1 ± 17.1b
All–national [13]a 175.3 ± 6.5 71.1 ± 9.3 35.8 ± 12.2b
All [20] 175.7 ± 6.2 71.1 ± 9.6 39.3 ± 15.0b
Backs [17]
Outside backs 175.7 ± 6.4 67.9 ± 5.3 32.2 ± 10.7b
Pivot 171.1 ± 4.6 63.2 ± 7.9 34.4 ± 13.9b
Forwards [17]
Props 178.1 ± 6.9 81.5 ± 8.6 53.2 ± 13.6b
Back row 178.3 ± 4.0 74.3 ± 7.4 41.5 ± 14.3b
Under 15 All [26] 173.0 ± 3.0 73.9 ± 5.5
All–regional [13]a 177.8 ± 6.3 75.8 ± 10.9 41.1 ± 15.8b
All–national [13]a 178.3 ± 6.4 77.6 ± 9.7 39.9 ± 14.5b
All [19] 169.5 ± 2.1 69.4 ± 2.5 72.2 ± 8.7c
All [20] 178.6 ± 5.7 77.6 ± 9.8 42.4 ± 16.0b
All [23] 81.9 ± 9.1 83.9 ± 30.3d
Backs [17]
Outside backs 178.3 ± 6.4 73.4 ± 6.3 33.9 ± 8.9b
Pivot 175.0 ± 4.1 70.0 ± 6.3 35.6 ± 12.5b
Forwards [17]
Props 180.2 ± 6.6 88.5 ± 9.3 58.8 ± 16.5b
Back row 180.7 ± 4.0 80.7 ± 7.3 45.3 ± 14.9b
Under 16 All [23] 86.1 ± 6.0 81.0 ± 25.0d
All [34] 177.4 ± 2.7 77.9 ± 9.8 37.9 ± 12.9b
Backs [21] 173.1 ± 8.2 68.4 ± 8.6 30.4 ± 5.9b
Forwards[21] 177.7 ± 5.4 80.9 ± 9.7 42.7 ± 14.1b
Backs [25] 178.8 ± 5.5 74.9 ± 7.6
Forwards [25] 180.9 ± 6.7 87.0 ± 11.1
All [26] 177.0 ± 2.0 82.1 ± 4.2
All [59] 178.0 ± 4.4 83.2 ± 9.8
Under 17 All [23] 86.3 ± 9.4 77.8 ± 20.8d
All [34] 178.8 ± 2.9 84.8 ± 10.1 41.4 ± 14.0b
Backs [21] 173.4 ± 4.1 75.4 ± 7.0 31.4 ± 6.2b
Forwards [21] 180.5 ± 5.5 85.7 ± 8.6 40.5 ± 15.1b
All [26] 177.0 ± 4.0 80.1 ± 5.5
2174 K. Till et al.
123
In summary, height and body mass are deemed impor-
tant for rugby league performance, increasing with age and
generally differentiating between playing standard and
position. However, body size may not be as important a
quality in younger players (under 16 years) due to varia-
tions in maturity. It is recommended that practitioners are
aware of the variability in the development of height and
body mass into adulthood, and track such measures in their
players into the early 20s. In addition, data on further
anthropometric characteristics such as limb length, limb
circumference and muscle cross-sectional area [23], as well
as somatotype [32], are limited in current research and may
provide a more detailed evaluation of the anthropometric
characteristics important for player development within
youth rugby league players. Other factors such as ethnicity
also require further consideration [32].
4 Body Composition
Body composition is another important consideration for
physical performance in rugby league and has primarily
been assessed via the use of sum of skinfold assessments
(see Table 1). Sum of skinfolds generally does not differ-
entiate between age categories [17, 19–21, 23, 25] but does
differ between junior and senior sub-elite players [39], is
reduced in elite compared with sub-elite players
[13, 27, 28], and is greater in forwards than backs
[17, 21, 32, 39]. Research findings generally show sum of
four skinfold values of 30 and 40 mm in backs and for-
wards, respectively [21], with recent research using dual
X-ray absorptiometry (DXA) demonstrating body compo-
sition values of 16 and 20% for backs and forwards,
respectively [30].
The lack of differences between age categories
[17, 19–21, 23, 25] and limited change in longitudinal data
in players in the under 13–15 [20, 22] and under 16–20 age
categories [34, 38] suggest greater stability of skinfolds
with age than with height and body mass. However, studies
examining seasonal changes in sum of skinfolds [35, 40]
show reductions during the season. Therefore, body fat
percentage may be a more variable anthropometric quality
that can regularly change related to an individual’s training
status and nutritional intake and should therefore be mon-
itored regularly.
Comparing body composition at different playing stan-
dards showed that a reduced sum of skinfolds provides a
small advantage for elite versus sub-elite players (e.g.
67.1 ± 14.8 vs. 76.4 ± 28.1 mm) [27, 28] and regional
versus national-level players (see Table 1) [13]. In com-
parisons between academy and professional levels, after
controlling for height and body mass, backs showed no
differences in fat mass (e.g. 13.7 ± 1.6 vs. 12.6 ± 1.1 kg),
whereas large differences were found in total fat
Table 1 continued
Age category (years) Position Height (cm) Body mass (kg) Sum of skinfolds (mm)
Under 18 All [19] 179.7 ± 1.3 77.9 ± 1.9 73.8 ± 4.1c
All [34] 179.7 ± 2.7 86.6 ± 9.1 38.3 ± 11.2b
All [59] 182.0 ± 5.3 85.3 ± 9.6
Backs [21] 176.7 ± 5.9 78.5 ± 7.6 32.2 ± 7.9b
Forwards [21] 181.9 ± 4.6 90.9 ± 8.1 42.9 ± 12.8b
Backs [32] 178.6 ± 5.5 80.9 ± 7.1
Forwards [32] 180.6 ± 6.6 92.6 ± 12.2
Under 19 All [34] 180.2 ± 2.7 88.0 ± 9.4 36.4 ± 10.4b
Backs [21] 179.3 ± 5.4 81.8 ± 8.0 30.5 ± 6.9b
Forwards [21] 182.7 ± 5.0 94.1 ± 7.7 43.5 ± 14.2b
Under 20 Backs [21] 176.8 ± 6.1 82.8 ± 6.3
Backs [21] 180.1 ± 4.9 85 ± 6.3 31.9 ± 7.4b
Forwards [21] 180.1 ± 7.7 90.1 ± 11.7
Forwards [21] 180.1 ± 5.7 92.6 ± 8.8 39.5 ± 9.1b
Data are expressed as mean ± standard deviationa Both regional and national levels were included because these were defined as elite in this studyb Sum of four skinfoldsc Sum of seven skinfoldsd Sum of six skinfolds
Physical Qualities of Youth Rugby League Players 2175
123
(19.3 ± 1.6 vs. 15.4 ± 1.1 kg), lean mass, and bone min-
eral content (BMC), whereby these differences were par-
ticularly favourable in the legs of professional-level
forwards [30]. When considering future career attainment
level, future professionals (33.4 ± 9.8 mm) had reduced
skinfolds compared with amateur players
(41.6 ± 18.2 mm) in the under 13–15 age categories
[14, 36]. However, reduced skinfolds did not differentiate
between future professional and academy players in the
under 17–19 age categories (e.g. under 19s, 38.4 ± 15.6
vs. 36.9 ± 8.5 mm) [38]. Generally, such findings for body
composition suggest that reduced body fat percentage
seems advantageous for selection to higher playing stan-
dards in youth rugby league players. This is consistent with
senior players in whom skinfold thickness has been shown
to predict selection [41] and be related to the frequency of
completed and dominant tackles during match-play [42].
Explanations for this finding could be due to physiological
mechanisms (e.g. power-to-mass ratio, thermoregulation)
[2, 3], relationships to physical measures (e.g. speed, agi-
lity) [17], or increased training or playing status at higher
levels, but further evidence is required to substantiate this.
Comparisons between positions suggest forwards tend to
carry more body fat than backs [17, 21, 30, 32, 39], with
props usually having greater body fat than back-row
positions [17]. Consistent with height and body mass, these
findings are aligned with match demands in senior com-
petition [24], including reduced playing minutes but greater
collisions in forwards than backs. It has been suggested that
increased fat may be a protector against injury [24], but no
evidence is available to support this.
In summary, appropriate body fat percentage is impor-
tant for rugby league performance, differentiates between
playing standard and position, and should be a considera-
tion for player development of youth rugby league players.
However, optimum skinfold/body fat percentage scores are
unknown and it may be appropriate to control body fat
levels, with four site skinfolds recommended at approxi-
mately 30 mm in backs and 40 mm in forwards [21].
Practitioners should be aware of large individual variability
in body fat percentage and should monitor body fat levels
regularly in youth players, using internationally standard-
ised methods (i.e. International Society for Assessment of
Kinanthropometry [ISAK] [32] or DXA [30]), which are
lacking within the existing evidence base.
5 Linear Speed
The ability to move fast in attack and defence is an
important aspect of rugby league performance. Linear
speed data for elite youth rugby league players over 10, 20,
30, 40 and 60 m are presented in Table 2. Linear speed has
been shown to differentiate between age categories within
some studies [17, 20, 23–26] but not others [19, 21]. Dif-
ferences between playing level [13, 24–28] and playing
position [17, 21, 24, 26, 39, 43] have consistently been
identified, highlighting greater speed in elite compared to
sub-elite players, and backs compared to forwards.
Current research suggests that linear speed can differ-
entiate between age categories within the younger age
categories (i.e. under 16 years) [17, 23, 24, 26] but is less
likely to differentiate between older age groups (i.e. over
16 years) [21]. Studies assessing linear speed development
longitudinally in younger players [20, 22] demonstrate
improvements between the under 13 and 15 age categories.
This is likely due to the normal adaptations related to
growth and maturation [33], with the changes in height
during this period that influence stride length and rate
improving linear speed. Furthermore, longitudinal speed
development at the 60 m distance according to earlier or
later maturing players demonstrated greater improvement
in later maturing players aged 13–15 years [22]. Studies in
older youth players (i.e. over 16 years of age) showed no
significant changes in speed across 10- [19] and 14-week
[44] training periods, across a season [35, 40], annually,
and long term (i.e. 4 years) [34]. This may occur due to the
process of peak weight velocity, which follows peak height
velocity (PHV), whereby heightened gains in body mass
occur. Gains in body mass and reductions in the changes in
height may reduce speed development, suggesting that the
assessment of momentum (i.e. body mass 9 velocity),
alongside speed, may be an important consideration for
monitoring and evaluation of players, especially post
16 years of age. Momentum has been shown to differen-
tiate between age categories [21] and improve with age
[34], which may be due to increases in mass and mainte-
nance of speed in older youths, but to a combination of
improvements in both sprint speed and mass in younger
players.
Linear speed has differentiated between elite and sub-
elite players [25–28] (e.g. 40 m; under 17, 5.92 ± 0.14 vs.
5.46 ± 0.14 s) [26], national and regional players (see
Table 2) [13], starters and non-starters [25] and future
career attainment levels (e.g. 20 m; professionals
3.21 ± 0.16 vs. amateurs 3.29 ± 0.19 s) [14]. This is
consistent with findings in senior players [24], and suggests
that advanced speed is an important physical quality for
higher playing standard and career attainment. Advanced
acceleration has been associated with enhanced tackling
ability in 16-year-old elite and sub-elite players [28],
suggesting acceleration contributes to successful tackle
performance and proficiency. In addition, the development
of momentum (professionals 47 vs. academy 17 kg s-1)
between under 17s and 19s [38] contributed to attaining
professional status. Momentum may be linked to
2176 K. Till et al.
123
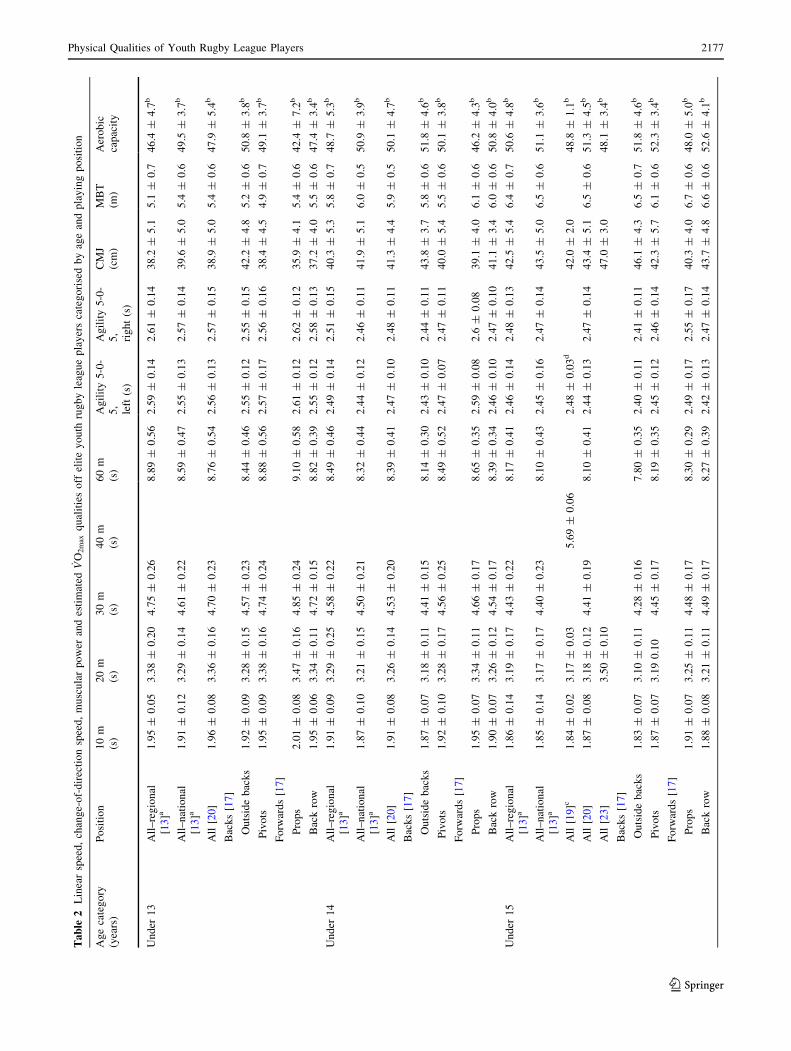
Table
2Linearspeed,change-of-directionspeed,muscularpower
andestimated
_ VO
2max
qualitiesoffeliteyouth
rugbyleagueplayerscategorisedbyageandplayingposition
Agecategory
(years)
Position
10m
(s)
20m
(s)
30m
(s)
40m
(s)
60m
(s)
Agility5-0-
5,
left(s)
Agility5-0-
5,
right(s)
CMJ
(cm)
MBT
(m)
Aerobic
capacity
Under
13
All–regional
[13]a
1.95±
0.05
3.38±
0.20
4.75±
0.26
8.89±
0.56
2.59±
0.14
2.61±
0.14
38.2
±5.1
5.1
±0.7
46.4
±4.7
b
All–national
[13]a
1.91±
0.12
3.29±
0.14
4.61±
0.22
8.59±
0.47
2.55±
0.13
2.57±
0.14
39.6
±5.0
5.4
±0.6
49.5
±3.7
b
All[20]
1.96±
0.08
3.36±
0.16
4.70±
0.23
8.76±
0.54
2.56±
0.13
2.57±
0.15
38.9
±5.0
5.4
±0.6
47.9
±5.4
b
Backs[17]
Outsidebacks
1.92±
0.09
3.28±
0.15
4.57±
0.23
8.44±
0.46
2.55±
0.12
2.55±
0.15
42.2
±4.8
5.2
±0.6
50.8
±3.8
b
Pivots
1.95±
0.09
3.38±
0.16
4.74±
0.24
8.88±
0.56
2.57±
0.17
2.56±
0.16
38.4
±4.5
4.9
±0.7
49.1
±3.7
b
Forw
ards[17]
Props
2.01±
0.08
3.47±
0.16
4.85±
0.24
9.10±
0.58
2.61±
0.12
2.62±
0.12
35.9
±4.1
5.4
±0.6
42.4
±7.2
b
Backrow
1.95±
0.06
3.34±
0.11
4.72±
0.15
8.82±
0.39
2.55±
0.12
2.58±
0.13
37.2
±4.0
5.5
±0.6
47.4
±3.4
b
Under
14
All–regional
[13]a
1.91±
0.09
3.29±
0.25
4.58±
0.22
8.49±
0.46
2.49±
0.14
2.51±
0.15
40.3
±5.3
5.8
±0.7
48.7
±5.3
b
All–national
[13]a
1.87±
0.10
3.21±
0.15
4.50±
0.21
8.32±
0.44
2.44±
0.12
2.46±
0.11
41.9
±5.1
6.0
±0.5
50.9
±3.9
b
All[20]
1.91±
0.08
3.26±
0.14
4.53±
0.20
8.39±
0.41
2.47±
0.10
2.48±
0.11
41.3
±4.4
5.9
±0.5
50.1
±4.7
b
Backs[17]
Outsidebacks
1.87±
0.07
3.18±
0.11
4.41±
0.15
8.14±
0.30
2.43±
0.10
2.44±
0.11
43.8
±3.7
5.8
±0.6
51.8
±4.6
b
Pivots
1.92±
0.10
3.28±
0.17
4.56±
0.25
8.49±
0.52
2.47±
0.07
2.47±
0.11
40.0
±5.4
5.5
±0.6
50.1
±3.8
b
Forw
ards[17]
Props
1.95±
0.07
3.34±
0.11
4.66±
0.17
8.65±
0.35
2.59±
0.08
2.6
±0.08
39.1
±4.0
6.1
±0.6
46.2
±4.3
b
Backrow
1.90±
0.07
3.26±
0.12
4.54±
0.17
8.39±
0.34
2.46±
0.10
2.47±
0.10
41.1
±3.4
6.0
±0.6
50.8
±4.0
b
Under
15
All–regional
[13]a
1.86±
0.14
3.19±
0.17
4.43±
0.22
8.17±
0.41
2.46±
0.14
2.48±
0.13
42.5
±5.4
6.4
±0.7
50.6
±4.8
b
All–national
[13]a
1.85±
0.14
3.17±
0.17
4.40±
0.23
8.10±
0.43
2.45±
0.16
2.47±
0.14
43.5
±5.0
6.5
±0.6
51.1
±3.6
b
All[19]c
1.84±
0.02
3.17±
0.03
5.69±
0.06
2.48±
0.03d
42.0
±2.0
48.8
±1.1
b
All[20]
1.87±
0.08
3.18±
0.12
4.41±
0.19
8.10±
0.41
2.44±
0.13
2.47±
0.14
43.4
±5.1
6.5
±0.6
51.3
±4.5
b
All[23]
3.50±
0.10
47.0
±3.0
48.1
±3.4
b
Backs[17]
Outsidebacks
1.83±
0.07
3.10±
0.11
4.28±
0.16
7.80±
0.35
2.40±
0.11
2.41±
0.11
46.1
±4.3
6.5
±0.7
51.8
±4.6
b
Pivots
1.87±
0.07
3.190.10
4.45±
0.17
8.19±
0.35
2.45±
0.12
2.46±
0.14
42.3
±5.7
6.1
±0.6
52.3
±3.4
b
Forw
ards[17]
Props
1.91±
0.07
3.25±
0.11
4.48±
0.17
8.30±
0.29
2.49±
0.17
2.55±
0.17
40.3
±4.0
6.7
±0.6
48.0
±5.0
b
Backrow
1.88±
0.08
3.21±
0.11
4.49±
0.17
8.27±
0.39
2.42±
0.13
2.47±
0.14
43.7
±4.8
6.6
±0.6
52.6
±4.1
b
Physical Qualities of Youth Rugby League Players 2177
123

Table
2continued
Agecategory
(years)
Position
10m(s)
20m(s)
30m(s)
40m(s)
60m(s)
Agility5-0-
5,left(s)
Agility5-0-
5,right(s)
CMJ(cm
)MBT(m
)Aerobic
capacity
Under
16
All[26]
1.89±
0.04
5.65±
0.10
2.45±
0.04d
50.0
±1.9
10.6
±0.5
e
All[23]
3.40±
0.20
47.3
±4.9
48.3
±3.6
b
All[34]
1.82±
0.07
3.12±
0.12
44.1
±3.8
1286±
493f
All[26]
1.81±
0.03
5.42±
0.11
2.40±
0.05d
53.1
±3.6
11.3
±0.7
e
Backs[17]
1.78±
0.06
3.07±
0.11
48.1
±4.6
47.5
±3.0
g
Forw
ards[17]
1.85±
0.06
3.18±
0.09
43.8
±5.0
47.1
±3.7
g
Backs[25]
1.76±
0.09
3.03±
0.12
5.40±
0.22
2.27±
0.12d
47.5
±4.6
54.6
±8.5
b
Forw
ards[25]
1.85±
0.06
3.18±
0.09
5.69±
0.17
2.34±
0.15d
48.9
±4.1
48.6
±5.1
b
Under
17
All[23]
3.30±
0.10
47.6
±5.5
52.2
±3.5
b
All[34]
1.81±
0.05
3.11±
0.09
47.8
±5.6
1308±
347f
All[26]
1.83±
0.05
5.46±
0.14
2.36±
0.08d
58.9
±3.8
12.3
±0.8
e
Backs[21]
1.78±
0.04
3.07±
0.07
50.5
±6.0
48.5
±2.1
g
Forw
ards[21]
1.83±
0.07
3.16±
0.11
48.0
±5.6
48.9
±3.2
g
Under
18
All[19]c
1.87±
0.02
3.24±
0.04
5.83±
0.08
2.44±
0.02d
42.8
±1.1
45.2
±1.2
b
All[34]
1.81±
0.05
3.10±
0.11
51.3
±6.0
1502±
301f
Backs[21]
1.78±
0.05
3.06±
0.09
52.6
±5.7
49.1
±2.2
g
Forw
ards[21]
1.81±
0.06
3.11±
0.11
49.1
±5.2
48.8
±3.3
g
Under
19
All[34]
1.80±
0.05
3.08±
0.09
52.1
±5.3
1667±
406f
Backs[21]
1.79±
0.07
3.04±
0.08
54.0
±6.2
48.9
±2.7
g
Forw
ards[21]
1.83±
0.08
3.14±
0.12
51.2
±4.4
48.3
±3.2
g
Under
20
Backs[21]
1.99±
0.06
3.26±
0.07
5.55±
0.13
50.6
±5.0
Forw
ards[21]
2.06±
0.10
3.39±
0.17
5.80±
0.26
50.6
±7.1
Backs[21]
1.76±
0.07
2.99±
0.10
54.4
±6.1
49.1
±2.8
g
Forw
ards[21]
1.82±
0.04
3.16±
0.07
51.0
±4.1
48.6
±3.0
g
Dataareexpressed
asmean±
standarddeviation
VO2maxmaxim
um
oxygen
uptake,
CMJcounterm
ovem
entjump,MBTmedicineballchestthrow
aBoth
regional
andnational
levelswereincluded
because
theseweredefined
aselitein
thisstudy
bEstim
ated
VO2max(m
lkg-1min
-1)from
multistagefitnesstest
cPost-trainingdataarepresentedforthis
study
dThesestudiesprovideonly
oneagility5-0-5
score
therefore
directionisnotavailable
eMultistagefitnesstest
level
fYo-Y
otest
distance
(m)
gEstim
ated
VO2max(m
lkg-1min
-1)from
Yo-Y
otest
2178 K. Till et al.
123
acceleration and has been shown to be related to successful
carries per minute in under 15s, 16s and 17s [45]. This is
suggested to advance ball carrying at the gain line, allow
greater force in overcoming opposing defenders, greater
impact forces in tackles and potential increases in speed of
playing the ball.
Backs have been shown to be quicker than forwards
across a range of distances [21, 24, 26, 39, 43]. When
considered in positional subgroups, pivots are quicker over
10 m, while outside backs are quicker over longer dis-
tances. Props are generally slower than all positions [17].
Although forwards have reduced speed compared with
backs, this may be due to their greater mass, resulting in
increased momentum [21]. Such findings are related to the
positional demands, with forwards involved in more col-
lision-based activities for which momentum may be more
important. Backs may engage in greater free running for
which speed over greater distances may be more important.
In summary, linear speed is important for rugby league
performance and differentiates between age categories at
younger ages (i.e., under 16 years), playing standard and
playing position. However, speed does not seem to increase
with age within older (i.e. over 16 years) age categories. In
addition, momentum, especially over shorter distances, is a
physical quality related to rugby league performance that
differentiates between age, standard and position. There-
fore, both linear speed and momentum are key aspects for
physical development within youth rugby league players
aged between 13 and 20 years, and should be evaluated,
monitored and developed. However, research to date is
limited in relation to the optimum training programmes for
developing speed and should therefore be a consideration
of future research studies.
6 Change-of-Direction Speed
The movement patterns of rugby league involve a combi-
nation of accelerations, decelerations and changes in
direction [46]. Therefore, the ability to change direction is
important. Change-of-direction speed has been assessed via
a range of measures, including the ‘L’ run [39], Illinois
agility run [24] and the agility 5-0-5 test [17, 47]. Based on
the inclusion criteria for the study, change-of-direction
speed data are presented in Table 2 for the 5-0-5 test only.
Change-of-direction speed has been shown to differentiate
between age categories for Illinois agility [24] and agility
5-0-5 performance [17, 20, 25, 26] but not in all studies
[19]. Differences between playing level [13, 25–28]
demonstrate elite players outperform sub-elite players, but
differences between backs and forwards are generally
limited [24, 26, 39], except for props being the worst-
performing position [17].
Like other physical qualities, change-of-direction speed
has generally increased with age [17, 24–26], with longi-
tudinal studies demonstrating an improvement in change-
of-direction speed between 13 and 15 years of age [20].
Furthermore, improvements in players aged 17–19 years
demonstrated approximately 6% improvements following a
14-week preseason training programme including two field
sessions per week [44] and over a competitive season [48].
Differences between age categories and improvement over
time in change-of-direction speed suggest change-of-di-
rection ability is related to the processes related to growth
and maturation [33] and is trainable. However, considera-
tion of the more complex actions of accelerating, deceler-
ating and re-accelerating may suggest that such
development is more complicated than other physical
qualities (e.g. linear speed) and further research is required
to understand the development and trainability of change of
direction.
With respect to playing standard, elite players outper-
formed sub-elite players [26–28] (e.g. agility 5-0-5; under
17, 2.36 ± 0.08 vs. 2.68 ± 0.08 s) [26], national players
were faster than regional players (see Table 2) [13], starters
were quicker than non-starters (2.31 ± 0.13 vs.
2.43 ± 0.15 s) [25] and future professionals had greater
change-of-direction ability than future amateurs (e.g.
2.42 ± 0.12 vs. 2.52 ± 0.16 s) [14, 36]. This suggests
advanced change-of-direction speed contributes to a
greater playing standard and future career attainment level.
This finding may be expected as the greater change-of-
direction ability allows players to better position them-
selves when attacking (e.g. evading a defender) and
defending (e.g. defensive line retreat). Interestingly,
change-of-direction speed was found to be the most dis-
criminating factor for career attainment in players aged
13–15 years [14] and therefore may be an important aspect
for development within young players.
In most research, positional differences for change-of-
direction speed have been less apparent than other physical
qualities [24, 26, 27, 39], with only props significantly
slower than other positions [17]. Such findings may be
apparent due to the regular 180� changes of direction
required in all positions during the defensive line retreat,
and that such movements may be of a greater quantity and
intensity in the forwards, who are closer to the play of the
ball. Till et al. [17] suggested that greater change-of-di-
rection speed in backs may be due to the greater body mass
and body fat in props, which may increase the eccentric
braking capabilities to halt momentum in one direction
before immediately accelerating in a new direction [49].
This is a potential explanation why props have lower career
attainment success in rugby league [36] (i.e. reduced ability
to change direction lessens their ability to meet the
Physical Qualities of Youth Rugby League Players 2179
123
increasing movement demands associated with progressing
levels of match-play).
In summary, change-of-direction speed has less research
available to make comparisons and inform the develop-
ment of this physical quality. However, findings generally
suggest change-of-direction speed increases with age and
differentiates between playing standard, but shows less
apparent differences between playing positions. Therefore,
change-of-direction speed seems an important physical
quality for academy player development but future
research is required to understand the long-term develop-
ment and trainability of this quality. In addition, ‘agility’-
based research, defined as ‘‘the ability to change direction
in response to a specific stimulus’’ [50] may be more
appropriate than change-of-direction speed alone. Research
on agility is available in adult rugby league players [47, 51]
demonstrating differences across playing levels, but is not
available in youth players and should be a consideration for
future research.
7 Aerobic Capacity
A well-developed aerobic capacity is important for rugby
league performance given the distances covered at low speeds
and the imperative need to recover quickly following repeated
high-intensity efforts [5]. Aerobic capacity has been assessed
via the multistage fitness test [27] or Yo-Yo Intermittent
Recovery Test Level 1 [21], and is presented as estimated
maximum oxygen uptake ( _VO2max) in Table 2. Aerobic
capacity has been shown to differentiate between age cate-
gories within some studies [17, 20, 23, 24, 26] but not others
[19, 21, 25]. Differences between playing level
[13, 26–28, 52] are consistent with greater aerobic capacity,
contributing to a higher playing standard. For playing posi-
tion, backs have been shown to have a greater aerobic capacity
in some studies [17, 24, 26, 39] but not others [21].
Current research is contradictory as to whether aerobic
capacity differentiates between age categories
[17, 19–21, 23, 24, 26, 53]. This finding may occur due to
methodological considerations such as the testing protocols
used or the timing of testing, with most studies using data
at the start of the preseason. Longitudinal studies have
shown improvements in aerobic capacity with training
[44], seasonally [35, 40], annually, and long-term (i.e.
4 years) [34]. This suggests the non-significant differences
found in some cross-sectional studies [19, 21, 25] may not
represent the development of aerobic capacity with age.
However, estimated _VO2max changes have been shown to
be greater in younger (i.e. under 15s) compared with older
players (i.e. under 18s) following 10- [19] and 14-week
[44] training periods, but not when assessed across a season
[35] for under 18s and 20s versus under 14s and 16s. Such
findings suggest that aerobic capacity development may be
a combination of training-related changes, alongside
growth and maturational development, which is impacted
upon by training history and current training status
[34, 47].
Aerobic capacity has differentiated between elite and
sub-elite players [26, 27, 52] (e.g. multistage fitness test
level; under 15, 10.6 ± 0.5 vs. 8.0 ± 0.6) [26], contributed
to whether a player started a game [25], and discriminated
between regional-and national-level players (see Table 2)
[13]. Furthermore, advanced aerobic capacity contributed
to future career attainment in players in the under 13–15
(amateur 47.6 ± 5.6 vs. professional
49.8 ± 4.6 ml kg-1 min-1) [14, 36] and under 17–18 age
categories (Yo-Yo distance under 17, 1512 ± 299 vs.
1252 ± 262 m) [38]. This suggests that advanced aerobic
capacity is an important physical quality for increased
playing standard and long-term career attainment success.
Advanced aerobic capacity has been shown to contribute to
greater high-speed distance covered during a game [54],
maintenance of playing intensity across a tournament [55],
and quicker recovery following match-play [54], poten-
tially due to reduced metabolic disturbances following
intense intermittent exercise [56]. Therefore, advanced
aerobic capacity would allow players to maintain playing
intensity while increasing training volume and intensity to
allow improved player development.
Differences in aerobic capacity between backs and for-
wards are inconsistent [17, 21, 24, 26, 39]. Like linear
speed, forwards may have reduced aerobic capacity com-
pared with backs due to their greater body mass or sum of
skinfold measurements (body composition), which may
impact on the ability to perform aerobic capacity tests. At
least in rugby union, using body mass as a covariate in
comparisons across age categories has standardised the
difference in aerobic capacity according to body mass [57].
Again, this may be relevant to the match demands of dif-
ferent playing positions, with forwards regularly having a
reduced playing time compared with backs [11].
In summary, aerobic capacity increases with age and
differentiates between playing position, playing standard
and future career attainment. This is an important consid-
eration for the youth rugby league player aged 13–20 years
due to its influence on match performance and recovery
post-match. Future studies should aim to control for mass
in their comparisons of aerobic capacity, and identify
optimal methods to maximise the improvement of this
quality alongside other important physical characteristics
in training periods and annual plans.
2180 K. Till et al.
123
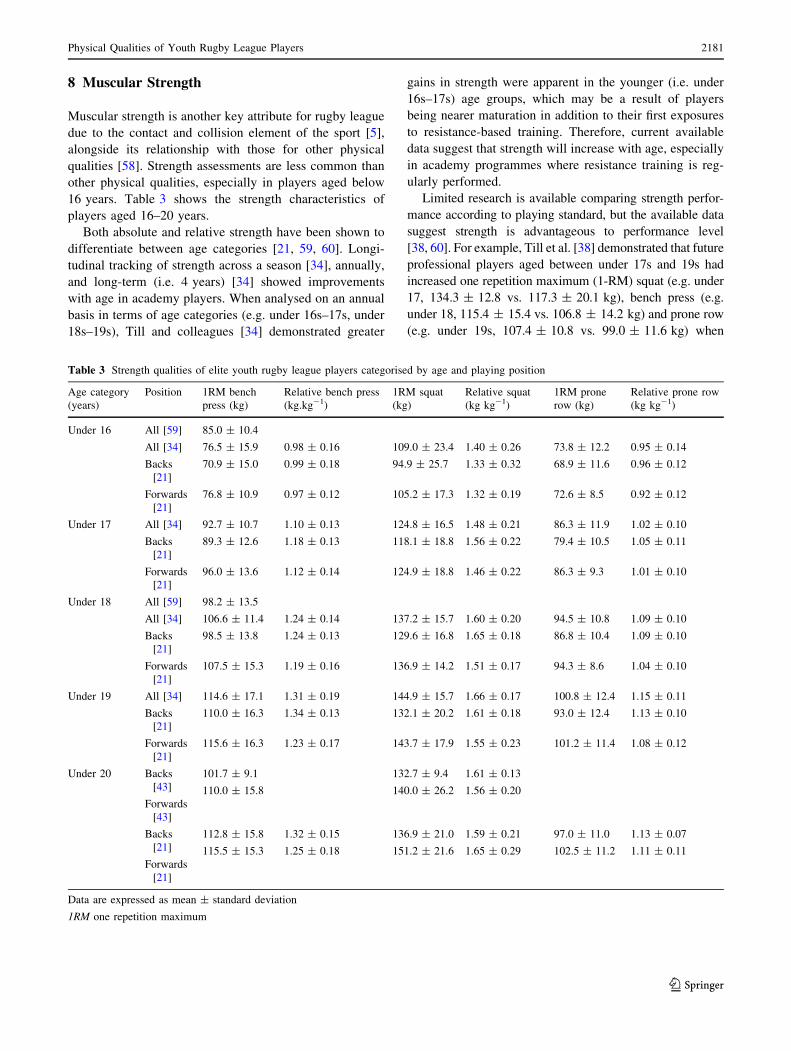
8 Muscular Strength
Muscular strength is another key attribute for rugby league
due to the contact and collision element of the sport [5],
alongside its relationship with those for other physical
qualities [58]. Strength assessments are less common than
other physical qualities, especially in players aged below
16 years. Table 3 shows the strength characteristics of
players aged 16–20 years.
Both absolute and relative strength have been shown to
differentiate between age categories [21, 59, 60]. Longi-
tudinal tracking of strength across a season [34], annually,
and long-term (i.e. 4 years) [34] showed improvements
with age in academy players. When analysed on an annual
basis in terms of age categories (e.g. under 16s–17s, under
18s–19s), Till and colleagues [34] demonstrated greater
gains in strength were apparent in the younger (i.e. under
16s–17s) age groups, which may be a result of players
being nearer maturation in addition to their first exposures
to resistance-based training. Therefore, current available
data suggest that strength will increase with age, especially
in academy programmes where resistance training is reg-
ularly performed.
Limited research is available comparing strength perfor-
mance according to playing standard, but the available data
suggest strength is advantageous to performance level
[38, 60]. For example, Till et al. [38] demonstrated that future
professional players aged between under 17s and 19s had
increased one repetition maximum (1-RM) squat (e.g. under
17, 134.3 ± 12.8 vs. 117.3 ± 20.1 kg), bench press (e.g.
under 18, 115.4 ± 15.4 vs. 106.8 ± 14.2 kg) and prone row
(e.g. under 19s, 107.4 ± 10.8 vs. 99.0 ± 11.6 kg) when
Table 3 Strength qualities of elite youth rugby league players categorised by age and playing position
Age category
(years)
Position 1RM bench
press (kg)
Relative bench press
(kg.kg-1)
1RM squat
(kg)
Relative squat
(kg kg-1)
1RM prone
row (kg)
Relative prone row
(kg kg-1)
Under 16 All [59] 85.0 ± 10.4
All [34] 76.5 ± 15.9 0.98 ± 0.16 109.0 ± 23.4 1.40 ± 0.26 73.8 ± 12.2 0.95 ± 0.14
Backs
[21]
70.9 ± 15.0 0.99 ± 0.18 94.9 ± 25.7 1.33 ± 0.32 68.9 ± 11.6 0.96 ± 0.12
Forwards
[21]
76.8 ± 10.9 0.97 ± 0.12 105.2 ± 17.3 1.32 ± 0.19 72.6 ± 8.5 0.92 ± 0.12
Under 17 All [34] 92.7 ± 10.7 1.10 ± 0.13 124.8 ± 16.5 1.48 ± 0.21 86.3 ± 11.9 1.02 ± 0.10
Backs
[21]
89.3 ± 12.6 1.18 ± 0.13 118.1 ± 18.8 1.56 ± 0.22 79.4 ± 10.5 1.05 ± 0.11
Forwards
[21]
96.0 ± 13.6 1.12 ± 0.14 124.9 ± 18.8 1.46 ± 0.22 86.3 ± 9.3 1.01 ± 0.10
Under 18 All [59] 98.2 ± 13.5
All [34] 106.6 ± 11.4 1.24 ± 0.14 137.2 ± 15.7 1.60 ± 0.20 94.5 ± 10.8 1.09 ± 0.10
Backs
[21]
98.5 ± 13.8 1.24 ± 0.13 129.6 ± 16.8 1.65 ± 0.18 86.8 ± 10.4 1.09 ± 0.10
Forwards
[21]
107.5 ± 15.3 1.19 ± 0.16 136.9 ± 14.2 1.51 ± 0.17 94.3 ± 8.6 1.04 ± 0.10
Under 19 All [34] 114.6 ± 17.1 1.31 ± 0.19 144.9 ± 15.7 1.66 ± 0.17 100.8 ± 12.4 1.15 ± 0.11
Backs
[21]
110.0 ± 16.3 1.34 ± 0.13 132.1 ± 20.2 1.61 ± 0.18 93.0 ± 12.4 1.13 ± 0.10
Forwards
[21]
115.6 ± 16.3 1.23 ± 0.17 143.7 ± 17.9 1.55 ± 0.23 101.2 ± 11.4 1.08 ± 0.12
Under 20 Backs
[43]
Forwards
[43]
101.7 ± 9.1
110.0 ± 15.8
132.7 ± 9.4
140.0 ± 26.2
1.61 ± 0.13
1.56 ± 0.20
Backs
[21]
Forwards
[21]
112.8 ± 15.8
115.5 ± 15.3
1.32 ± 0.15
1.25 ± 0.18
136.9 ± 21.0
151.2 ± 21.6
1.59 ± 0.21
1.65 ± 0.29
97.0 ± 11.0
102.5 ± 11.2
1.13 ± 0.07
1.11 ± 0.11
Data are expressed as mean ± standard deviation
1RM one repetition maximum
Physical Qualities of Youth Rugby League Players 2181
123
compared with academy players. These strength advantages
may result in greater speed and power performance, which
have been related to tackling and ball-carrying ability [28, 45],
while increased lower body strength has been related to
greater running, collision, repeat effort and internal loads in
sub-elite match-play and reduced neuromuscular fatigue [54].
Therefore, increased strength leads to greater capacity to
undertake match activities and recover from training and
match-play, allowing greater training and playing opportuni-
ties for long-term player development. As such, advanced
strength is beneficial for performance and player develop-
ment, and may be an essential quality to develop within
academy-aged players.
Regarding playing position, forwards have been shown
to have increased absolute strength compared with backs,
but no differences in relative strength [21, 43]. Absolute
strength differences may be apparent due to the positional
demands of backs and forwards in that forwards undertake
more contact- and collision-based activities during match-
play, requiring forwards to have greater absolute strength.
As backs predominantly have greater countermovement
jump and sprint-speed performance than forwards, it could
be expected that a greater relative strength would be
apparent due to the moderate relationships between relative
strength and sprint performance [43]. However, further
data may be required to explore the strength characteristics
of youth rugby players.
In summary, strength improves with age, especially
when resistance training interventions are implemented,
and differentiates between playing level and position.
Strength may be an essential physical quality for enhanced
playing standard and future career attainment. Although
recent recommendations for youth athletes [61, 62] have
emphasised the importance of strength development in
youth, limited data are available for youth rugby league
players. Future research should aim to evaluate strength
within such populations, with the possible use of the iso-
metric mid-thigh pull that allows implementation of
strength assessments with a reduction in technical compe-
tency (i.e. the squat) [63]. Furthermore, the understanding
of appropriate strength training interventions should be
prioritised alongside the links between strength and injury.
9 Muscular Power
Muscular power is a key attribute for rugby league due to
the contact and collision element of the sport [5, 64].
Lower body power has been assessed, although indirectly,
consistently in the literature via the countermovement
jump, with data presented in Table 2. Upper body power
assessments are less common, with the medicine ball chest
throw having been used to assess upper body power in 13-
to 15-year-olds but no studies having assessed upper body
power in players aged [16 years. Both upper and lower
body muscular power have been shown to differentiate
between age categories [17, 19–21, 24, 26, 60]. Studies
have demonstrated greater lower body power with
increased playing standard [13, 26–28], although this is not
consistent for upper body power [13]. Muscular power
differences between playing positions are inconsistent with
some studies showing backs to be greater than forwards for
lower body power [17, 20, 21, 26], but others showing no
differences [24, 39, 43]. For upper body power, forwards
outperform backs [17, 20].
Current research shows that both upper and lower body
muscular power (countermovement jump height) differen-
tiates and increases between age categories
[17, 19–21, 24–26, 57]. The only study where jump height
did not increase was in players aged under 15–17 years
[23], despite increases in peak power between these time
points. Studies assessing lower body power longitudinally
demonstrated improvements in performance across 10 [19]
and 14 weeks [44] of training, across a season [35, 40],
annually, and long-term (i.e. 4 years) [34]. Greater
improvement in lower body power was apparent when
younger players (e.g. under 15s) were compared with older
players (e.g. under 18s) [19, 21, 44]. These changes in
power are associated with the normal adaptations related to
growth and maturation alongside the implementation of
resistance training that is common during this period,
especially in older youth players (i.e. post 16 years) [21].
Lower body power has demonstrated differences
between elite and sub-elite players [26–28] (e.g. under 16,
53.1 ± 3.6 vs. 40.3 ± 3.3 cm) [26], national and regional
players (see Table 2) [13] and between future levels of
career attainment (e.g. amateur 39.2 ± 4.9 vs. professional
41.2 ± 7.2 cm) [14, 36]. Such differences between playing
standards may be apparent due to the relationship between
vertical jump performance and tackling ability [28] and
successful ball carries [45] in players aged 15–17 years.
However, upper-body-power studies have failed to
demonstrate differences between national and regional
players (see Table 2) [13], with future professionals actu-
ally underperforming compared with future amateurs at
13–15 years (e.g. under 14, professional 5.0 ± 0.7 vs.
academy 5.8 ± 0.8 m) [36]. This finding may suggest that
lower body power compared with upper body power may
be a more important physical quality at younger ages (i.e.
under 16 years). However, limited studies are available
evaluating upper body power post 16 years [57].
Regarding playing position, comparisons between backs
and forwards are inconsistent with some studies showing
backs are greater than forwards [17, 20, 21, 26] for lower
body power, whereas others show no difference
[24, 39, 43]. For upper body power, forwards outperform
2182 K. Till et al.
123
backs between 13 and 15 years of age [17, 20]. Such
findings may again be due to the increased mass and body
composition of forwards, which affects the ability to exert
force explosively. Therefore, it may be more appropriate to
monitor power output than jump height per se when
monitoring power development, but few studies have uti-
lised such an approach [59, 65].
In summary, lower and upper body power seem to
increase with age, and lower body power seems to be an
important physical quality to differentiate between playing
standard and future career attainment; therefore, appropri-
ate monitoring and development strategies should be
implemented to monitor this characteristic. Upper body
power seems less important due to its strong relationship
with maturation [17, 22], with further data needed in
relation to this physical quality post 16 years and utilising
better methodologies than a medicine ball throw.
10 Maturation
Although age has been considered throughout this review,
another important factor in player development ismaturation
status, which has been considered in some research in youth
rugby league players [13, 22, 23]. Maturation is the timing
and tempo of progress towards the mature adult state, which
can vary considerably between individuals during adoles-
cence [33, 66]. Based on these individual variations, youths
can be viewed as biologically ahead (early maturer), on time
(average maturer) or behind (late maturer) their peers [66].
Maturity status can be estimated by calculating age at PHV
[67]. Age at PHV was 13.61 ± 0.58 years in UK youth
rugby league players, indicating earlier maturation com-
pared with European boys (e.g. 14.2 years) [33]. Differences
have been identified between playing positions with for-
wards (props 13.29 ± 0.43, back row 13.41 ± 0.49 years)
generally maturing earlier than backs (outside backs
13.66 ± 0.54, pivots 14.00 ± 0.96 years), which may sug-
gest that players are assigned playing positions based on their
maturation status.
Some studies [13, 68, 69] have demonstrated the rela-
tionships between maturation and physical qualities, with
the maturity offset group (players grouped according to
years from PHV [YPHV] rather than chronological age)
impacting on all anthropometric and physical variables
(e.g. 20 m, -2.5 YPHV 3.46 ± 0.08, -0.5 YPHV
3.28 ± 0.15, 1.5 YPHV 3.17 ± 0.13 s) except multistage
fitness test performance. These findings are explained by
the increased testosterone [33], muscle volume and size
[70], and qualitative changes in muscle (e.g. contractile
properties) [71] associated with advanced maturation.
Furthermore, longitudinal research [22] has demonstrated
greater improvements in anthropometric and physical
qualities in later-maturing players compared with earlier-
maturing players over a 2 year period between 13 and
15 years of age (e.g. change in height, late maturers 10.3,
early maturers 5.0 cm). This suggests that later-maturing
players have greater potential for growth and performance
development during adolescence and, therefore, maturation
should be considered when monitoring and evaluating
physical performance, especially within younger players
(i.e. below 16 years of age).
11 Conclusions, Limitations and Further Research
This review provides a first attempt to present current
evidence on the anthropometric and physical qualities of
elite youth male rugby league players, considering age,
playing standard and positions. A plethora of research
exists for youth rugby league players (i.e. anthropometry,
12 studies; linear speed, change-of-direction speed, power
and aerobic capacity, 11 studies; strength, 4 studies)
matching the inclusion criteria (i.e. elite standard by
playing position) and is presented in Tables 1, 2, 3. The
under 15s (i.e. national programme) [13, 17] have
enhanced physical qualities compared with players in the
under 16 age category (from one professional club acad-
emy), potentially questioning the appropriateness of the
current literature in providing normative data for the
anthropometric and physical qualities of youth rugby lea-
gue players aged 16–20 years. It is therefore recommended
that a national standardised testing battery in the UK and
Australasia be developed and implemented to provide
practitioners with normative data, especially post 16 years,
to support the identification and physical development of
youth players.
Although the lack of a national dataset post 16 years is a
limitation of the current available research, there is a large
range of studies utilising multiple research methodologies
(i.e. cross-sectional, longitudinal, retrospective research
designs) to describe the influence of age, playing standard
and position on anthropometric and physical qualities. Age
and maturation have a significant impact on the develop-
ment of such qualities from 13 to 20 years of age, with
only body composition (across 13–20 years of age) and
linear speed (16–20 years of age) failing to improve with
age, most probably due to the very large interplayer vari-
ability in these measures [34]. This is an important con-
sideration for practitioners, and it is recommended that
such qualities are closely monitored and evaluated
throughout this youth period. In addition, practitioners
should understand and monitor the use of combined
anthropometric and physical qualities (e.g. momentum).
Physical Qualities of Youth Rugby League Players 2183
123
Anthropometric and physical qualities differentiated
across playing standards and career attainment levels
emphasise the importance of physical qualities to rugby
league success. This highlights the importance of anthro-
pometric and physical qualities for informing both talent
identification and development purposes. However, it is
recommended that both practice and future research
include maturity in assessment protocols, especially in
players under 16 years of age. Future work should also aim
to develop innovative statistics to help understand the
contribution of characteristics to success, alongside how
such physical qualities influence the specificity and sensi-
tivity of success [72]. Furthermore, longitudinal assess-
ments and monitoring should be implemented as they
provide data in relation to current performance and
developmental change that are of importance for playing
progression and informing decisions. Where possible, this
could be implemented on an individual basis [68, 73].
The implementation of strength and conditioning prac-
tices is essential for the development of youth rugby league
players. Current research suggests a range of physical
qualities influence career attainment at 13–15 years of age.
Therefore, practitioners should implement physical training
programmes including speed, change of direction (‘agi-
lity’), aerobic capacity, and muscular strength and power to
provide a broad base of physical development [74]. How-
ever, comparisons between youth and senior players show
strength and size [30] are the main discriminating factors
within 16- to 19-year-old academy players, while body
composition and strength were the primary physical qual-
ities that contributed to attaining professional status [38].
This suggests that upon commencement in an academy-
based programme, where strength and conditioning support
is available, resistance-based training interventions should
be a major focus to develop strength and size, alongside
speed, change of direction and aerobic capacity qualities.
Recent research shows that strong relationships exist
between strength and other physical qualities (i.e. speed,
agility, power, aerobic capacity) [75], suggesting improved
strength performance would result in improvements in
other qualities. The implementation of multi-joint exercises
involving squats, Olympic lifts and plyometrics may be
recommended [76].
The importance of physical qualities for the develop-
ment of rugby league players is clear. However, future
research is still required to optimise talent identification
and development programmes. Current research
[17, 20, 21, 23–27] is limited as it has not explored the role
that the dose–response relationship of training exposure
plays in the physical development of rugby league players,
with few intervention studies currently available. Future
research should include intervention-based studies or
should quantify the training load of athletes to understand
the most appropriate strategies for enhancing physical
qualities. Next, studies need to understand the relationship
between physical qualities and match performance while
providing greater consideration of the holistic development
of the youth rugby league player, including technical skill,
tactical knowledge, psychological characteristics, and
injury occurrence and reduction [4].
Compliance with Ethical Standards
Funding No sources of funding were used to assist in the preparation
of this review.
Conflict of interest Kevin Till, Sean Scantlebury and Ben Jones
declare that they have no conflicts of interest relevant to the content of
this review. Ben Jones is employed by the Rugby Football League to
manage and establish current and future research strategies but this
did not influence the article in any way.
Open Access This article is distributed under the terms of the
Creative Commons Attribution 4.0 International License (http://
creativecommons.org/licenses/by/4.0/), which permits unrestricted
use, distribution, and reproduction in any medium, provided you give
appropriate credit to the original author(s) and the source, provide a
link to the Creative Commons license, and indicate if changes were
made.
References
1. Brewer J, Davies J. Applied physiology of rugby league. Sports
Med. 1995;20:129–35.
2. Meir RA, Newton R, Curtis E. Physical fitness qualities of pro-
fessional rugby league players: determination of positional dif-
ferences. J Strength Cond Res. 2001;15:450–8.
3. Gabbett T, King T, Jenkins D. Applied physiology of rugby
league. Sports Med. 2008;38(2):119–38.
4. Cupples B, O’Connor D. The development of position-specific
performance indicators in elite youth rugby league: a coach’s
perspective. Int J Sports Sci Coach. 2011;6(1):125–41.
5. Johnston RD, Gabbett TJ, Jenkins DG. Applied sport science of
rugby league. Sports Med. 2014;44(8):1087–100.
6. Gabbett TJ, Jenkins DG, Abernethy B. Physical demands of
professional rugby league training and competition using
microtechnology. J Sci Med Sport. 2012;15(1):80–6.
7. Gabbett TJ. Sprinting patterns of national rugby league compe-
tition. J Strength Cond Res. 2012;26(1):121–30.
8. Waldron M, Twist C, Highton J, et al. Movement and physio-
logical match demands of elite rugby league using portable global
positioning systems. J Sports Sci. 2011;29(11):1223–30.
9. Austin DJ, Kelly SJ. Positional differences in professional rugby
league match play through the use of global positioning systems.
J Strength Cond Res. 2013;27(1):14–9.
10. McLellan CP, Lovell DI, Gass GC. Performance analysis of elite
rugby league match play using global positioning systems.
J Strength Cond Res. 2011;25(6):1703–10.
11. Sykes D, Twist C, Nicholas C, et al. Changes in locomotive rates
during senior elite rugby league matches. J Sports Sci.
2011;29(12):1263–71.
12. Austin DJ, Gabbett TJ, Jenkins DJ. Repeated high-intensity
exercise in a professional rugby league. J Strength Cond Res.
2011;25(7):1898–904.
2184 K. Till et al.
123
13. Till K, Cobley S, O’Hara J, et al. Using anthropometric and
performance characteristics to predict selection in junior UK
Rugby League players. J Sci Med Sport. 2011;14(3):264–9.
14. Till K, Cobley S, O’Hara J, et al. Retrospective analysis of
anthropometric and fitness characteristics associated with long-
term career progression in rugby league. J Sci Med Sport.
2015;18(3):310–4.
15. Bridge CA, da Silva Santos JF, Chaabene H, et al. Physical and
physiological profiles of taekwondo athletes. Sports Med.
2014;44(6):713–33.
16. James LP, Haff GG, Kelly VG, et al. Towards a determination of
the physiological characteristics distinguishing successful mixed
martial arts athletes: a systematic review of combat sport litera-
ture. Sports Med. 2016;46:1525–51.
17. Till K, Cobley S, O’Hara J, et al. Anthropometric, physiological
and selection characteristics in high performance UK junior
rugby league players. Talent Dev Excell. 2010;2:193–207.
18. De Lacey J, Brughelli ME, McGuigan MR, et al. Strength, speed
and power characteristics of elite rugby league players. J Strength
Cond Res. 2014;28(8):2372–5.
19. Gabbett TJ, Johns J, Riemann M. Performance changes following
training in junior rugby league players. J Strength Cond Res.
2008;22(3):910–7.
20. Till K, Cobley S, O’Hara J, et al. A longitudinal evaluation of
anthropometric and fitness characteristics in junior rugby league
players considering playing position and selection level. J Sci
Med Sport. 2013;16(5):438–43.
21. Till K, Tester E, Jones B, et al. Anthropometric and physical
characteristics of English academy rugby league players.
J Strength Cond Res. 2014;28(2):319–27.
22. Till K, Cobley S, O’Hara J, et al. Considering maturation status
and relative age in the longitudinal evaluation of junior rugby
league players. Scand J Med Sci Sports. 2014;24(3):569–76.
23. Waldron M, Worsfold P, Twist C, et al. Changes in anthropom-
etry and performance, and their interrelationships, across three
seasons in elite youth rugby league players. J Strength Cond Res.
2014;28(11):3128–36.
24. Gabbett T. Physiological characteristics of junior and senior
rugby league players. Br J Sports Med. 2002;36:334–42.
25. Gabbett T. Physiological and anthropometric characteristics of
starters and non-starters in junior rugby league players, aged
13–17 years. J Sports Med Phys Fit. 2009;49(3):233.
26. Gabbett T, Herzig P. Physiological characteristics of junior elite
and sub-elite rugby league players. Strength Cond Coach.
2004;12(2):19–24.
27. Gabbett T, Kelly J, Pezet T. Relationship between physical fitness
and playing ability in rugby league players. J Strength Cond Res.
2007;21(4):1126–34.
28. Gabbett TJ, Jenkins DG, Abernethy B. Physiological and
anthropometric correlates of tackling ability in junior elite and
subelite rugby league players. J Strength Cond Res.
2010;24(11):2989–95.
29. Gabbett T. Influence of playing position on the site, nature and
cause of rugby league injuries. J Strength Cond Res.
2005;19(4):749–56.
30. Till K, Jones B, O’Hara J, et al. Three-compartment body com-
position in academy and senior rugby league players. Int J Sports
Physiol Perform. 2016;11(2):191–6.
31. Freeman J, Cole T, Chinn S, et al. Cross sectional stature and
weight reference curves for the UK, 1990. Arch Dis Child.
1995;73(1):17–24.
32. Cheng HL, O’Connor H, Kay S, et al. Anthropometric charac-
teristics of Australian junior representative rugby league players.
J Sci Med Sport. 2014;17(5):546–51.
33. Malina RM, Bouchard C, Bar-Or O. Growth, maturation, and
physical activity. 2nd ed. Human Kinetics; 2004.
34. Till K, Jones B, Darrall-Jones J, et al. Longitudinal development
of anthropometric and physical characteristics within academy
rugby league players. J Strength Cond Res. 2015;29(6):1713–22.
35. Till K, Jones B, Emmonds S, et al. Seasonal changes in anthro-
pometric and physical characteristics within English academy
rugby league players. J Strength Cond Res. 2014;28(9):2689–96.
36. Till K, Cobley S, Morley D, et al. The influence of age, playing
position, anthropometry and fitness on career attainment out-
comes in rugby league. J Sports Sci. 2016;34(13):1240–5.
37. Gabbett TJ. Physiological and anthropometric correlates of
tackling ability in rugby league players. J Strength Cond Res.
2009;23(2):540–8.
38. Till K, Jones B, Geeson-Brown T. Do physical qualities influence
the attainment of professional status within elite 16–19 year old
rugby league players? J Sci Med Sport. 2015;19:585–9.
39. Gabbett T. A comparison of physiological and anthropometric
characteristics among playing positions in junior rugby league
players. Br J Sports Med. 2005;39(9):675–80.
40. Gabbett T. Changes in physiological and anthropometric char-
acteristics of rugby league players during a competitive season.
J Strength Cond Res. 2005;19:400–8.
41. Gabbett TJ, Jenkins DG, Abernethy B. Relative importance of
physiological, anthropometric, and skill qualities to team selec-
tion in professional rugby league. J Sports Sci.
2011;29(13):1453–61.
42. Gabbett TJ, Jenkins DG, Abernethy B. Relationships between
physiological, anthropometric, and skill qualities and playing
performance in professional rugby league players. J Sports Sci.
2011;29(15):1655–64.
43. Kirkpatrick J, Comfort P. Strength, power, and speed qualities in
English junior elite rugby league players. J Strength Cond Res.
2013;27(9):2414–9.
44. Gabbett TJ. Performance changes following a field conditioning
program in junior and senior rugby league players. J Strength
Cond Res. 2006;20(1):215–21.
45. Waldron M, Worsfold PR, Twist C, et al. The relationship
between physical abilities, ball-carrying and tackling among elite
youth rugby league players. J Sports Sci. 2014;32(6):542–9.
46. Delaney JA, Scott TJ, Ballard DA, et al. Contributing factors to
change-of-direction ability in professional rugby league players.
J Strength Cond Res. 2015;29(10):2688–96.
47. Gabbett TJ, Kelly JN, Sheppard JM. Speed, change of direction
speed, and reactive agility of rugby league players. J Strength
Cond Res. 2008;22(1):174–81.
48. Gabbett TJ. Physiological and anthropometric characteristics of
junior rugby league players over a competitive season. J Strength
Cond Res. 2005;19(4):764–71.
49. Spiteri T, Cochrane JL, Hart NH, et al. Effect of strength on plant
foot kinetics and kinematics during a change of direction task.Eur J Sport Sci. 2013;13(6):646–52.
50. Sheppard JM, Young WB. Agility literature review: classifica-
tions, training and testing. J Sports Sci. 2006;24(9):919–32.
51. Serpell BG, Ford M, Young WB. The development of a new test
of agility for rugby league. J Strength Cond Res.
2010;24(12):3270–7.
52. Johnston RD, Gabbett TJ, Jenkins DG, et al. Influence of physical
qualities on post-match fatigue in rugby league players. J Sci Med
Sport. 2015;18(2):209–13.
53. Gabbett T, Kelly J, Ralph S, et al. Physiological and anthropo-
metric characteristics of junior elite and sub-elite rugby league
players, with special reference to starters and non-starters. J Sci
Med Sport. 2009;12(1):215–22.
54. Johnston RD, Gabbett TJ, Jenkins DG. Influence of playing
standard and physical fitness on activity profiles and post-match
fatigue during intensified junior rugby league competition. Sports
Med Open. 2015;1(1):1.
Physical Qualities of Youth Rugby League Players 2185
123
55. Johnston RD, Gabbett TJ, Jenkins DG. The influence of physical
fitness and playing standard on pacing strategies during a team-sport
tournament. Int J Sports Physiol Perform. 2015;10(8):1001–8.
56. Gabbett TJ, Stein JG, Kemp JG, et al. Relationship between tests
of physical qualities and physical match performance in elite
rugby league players. J Strength Cond Res. 2013;27(6):1539–45.
57. Darrall-Jones J, Roe G, Carney S, et al. The effect of body mass
on the 30–15 intermittent fitness test in rugby union players. Int J
Sport Phys Perform. 2015;11:400–3.
58. Baker D, Nance S. The relation between strength and power in
professional rugby league players. J Strength Cond Res.
1999;13(3):224–9.
59. Baker D. Comparison of upper-body strength and power between
professional and college-aged rugby league players. J Strength
Cond Res. 2001;15(1):30–5.
60. Baker D. Differences in strength and power among junior-high,
senior-high, college-aged, and elite professional rugby league
players. J Strength Cond Res. 2002;16(4):581–5.
61. Lloyd RS, Oliver JL. The youth physical development model: a
new approach to long-term athletic development. Strength Cond
J. 2012;34(3):61–72.
62. Lloyd RS, Cronin JB, Faigenbaum AD, et al. The national
strength and conditioning association position statement on long-
term athletic development. J Strength Cond Res. 2016;30:
1491–509.
63. Darrall-Jones JD, Jones B, Till K. Anthropometric and physical
profiles of English academy rugby union players. J Strength Cond
Res. 2015;29(8):2086–96.
64. Johnston RD, Gabbett TJ, Seibold AJ, et al. Influence of physical
contact on neuromuscular fatigue and markers of muscle damage
following small-sided games. J Sci Med Sport. 2014;17(5):
535–40.
65. Baker DG, Newton RU. Comparison of lower body strength,
power, acceleration, speed, agility, and sprint momentum to
describe and compare playing rank among professional rugby
league players. J Strength Cond Res. 2008;22(1):153–8.
66. Lloyd RS, Oliver JL, Faigenbaum AD, et al. Chronological age
vs. biological maturation: implications for exercise programming
in youth. J Strength Cond Res. 2014;28(5):1454–64.
67. Mirwald RL, Baxter-Jones AD, Bailey DA, et al. An assessment
of maturity from anthropometric measurements. Med Sci Sports
Exerc. 2002;34(4):689–94.
68. Till K, Cobley S, O’Hara J, et al. An individualized longitudinal
approach to monitoring the dynamics of growth and fitness
development in adolescent athletes. J Strength Cond Res.
2013;27(5):1313–21.
69. Till K, Jones B. Monitoring anthropometry and fitness using
maturity groups within youth rugby league. J Strength Cond Res.
2015;29(3):730–6.
70. Temfemo A, Hugues J, Chardon K, et al. Relationship between
vertical jumping performance and anthropometric characteristics
during growth in boys and girls. Eur J Pediatr. 2009;168(4):457.
71. Van Praagh E, Dore E. Short-term muscle power during growth
and maturation. Sports Med. 2002;32(11):701–28.
72. Till K, Jones BL, Cobley S, et al. Identifying talent in youth
sport: a novel methodology using higher-dimensional analysis.
PLoS One. 2016;11(5):e0155047.
73. Cobley SP, Till K, O’Hara J, et al. Variable and changing tra-
jectories in youth athlete development: further verification in
advocating a long-term inclusive tracking approach. J Strength
Cond Res. 2014;28(7):1959–70.
74. Nash C. Practical sports coaching. Abingdon: Routledge; 2014.
p. 16–53.
75. Suchomel TJ, Nimphius S, Stone MH. The importance of mus-
cular strength in athletic performance. Sports Med. 2016;46:
1419–49.
76. Gabbett TJ, Seibold AJ. Relationship between tests of physical
qualities, team selection, and physical match performance in
semiprofessional rugby league players. J Strength Cond Res.
2013;27(12):3259–65.
2186 K. Till et al.
123