design of a sediment mitigation system for conowingo dam€¦ · 2.2 rotary kiln 2.3 low...
TRANSCRIPT

Design of a Sediment Mitigation System for Conowingo Dam
Presenters: Sheri Gravette Kevin Cazenas Said Masoud Rayhan Ain
Sponsor: Lower Susquehanna Riverkeeper
Faculty Advisor: George Donohue
Sediment Plume

Agenda
• Context
• Stakeholders
• Problem/Need Statement
• Mission Requirements
• Design Alternatives
• Technical Approach
• Preliminary Results
• Project Management
2
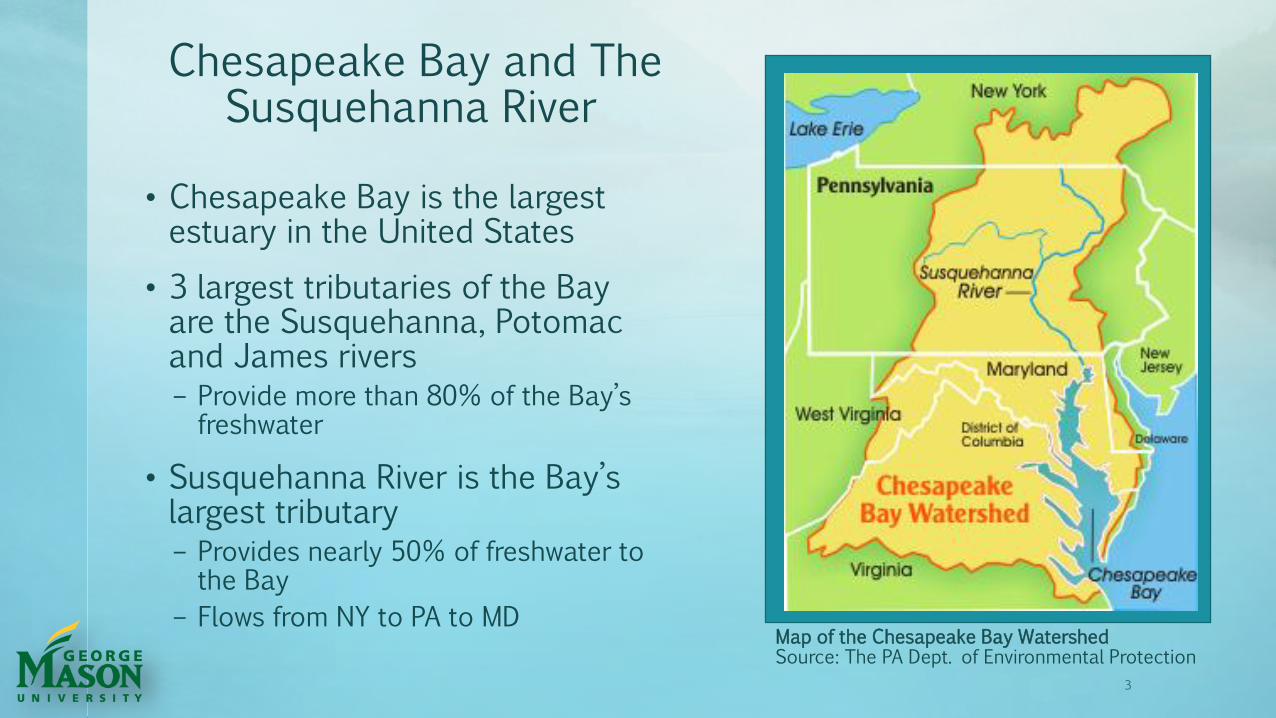
Chesapeake Bay and The Susquehanna River
• Chesapeake Bay is the largest estuary in the United States
• 3 largest tributaries of the Bay are the Susquehanna, Potomac and James rivers – Provide more than 80% of the Bay’s freshwater
• Susquehanna River is the Bay’s largest tributary – Provides nearly 50% of freshwater to the Bay
– Flows from NY to PA to MD
3
Map of the Chesapeake Bay Watershed Source: The PA Dept. of Environmental Protection
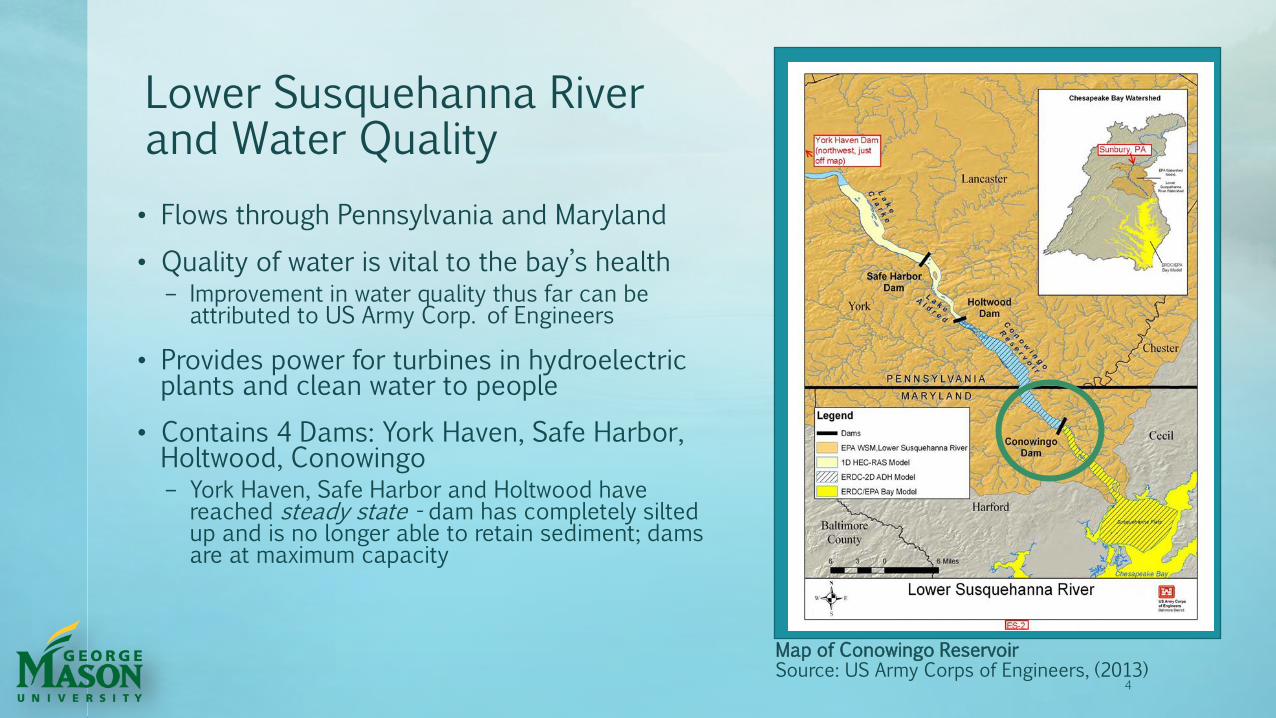
Lower Susquehanna River and Water Quality
• Flows through Pennsylvania and Maryland
• Quality of water is vital to the bay’s health – Improvement in water quality thus far can be
attributed to US Army Corp. of Engineers
• Provides power for turbines in hydroelectric plants and clean water to people
• Contains 4 Dams: York Haven, Safe Harbor, Holtwood, Conowingo – York Haven, Safe Harbor and Holtwood have
reached steady state - dam has completely silted up and is no longer able to retain sediment; dams are at maximum capacity
4
Map of Conowingo Reservoir Source: US Army Corps of Engineers, (2013)

Conowingo Dam
• Constructed in 1928
• Southernmost Dam of the Lower Susquehanna
• Location of Conowingo Hydroelectric Station – Mainly provides power to Philadelphia, PA – A black start power source – Provides 1.6 billion kWh annually
• Traps sediment and nutrients from reaching the Chesapeake Bay – Water quality is closely related to sediment deposition
– Traps ~1.5 million tons annually
5
Conowingo Dam Source: J. Schroath
sediment
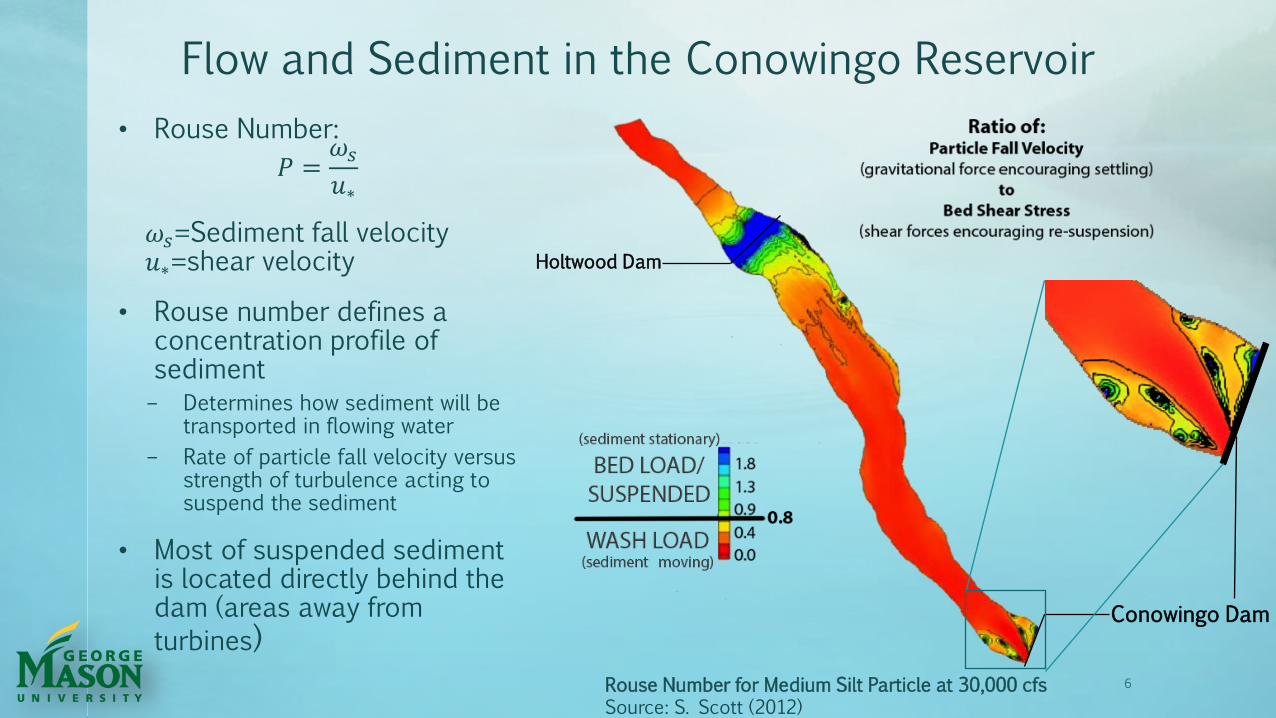
Flow and Sediment in the Conowingo Reservoir
Rouse Number for Medium Silt Particle at 30,000 cfs Source: S. Scott (2012)
• Rouse Number:
𝑃 =𝜔𝑠
𝑢∗
𝜔𝑠=Sediment fall velocity 𝑢∗=shear velocity
• Rouse number defines a concentration profile of sediment – Determines how sediment will be
transported in flowing water
– Rate of particle fall velocity versus strength of turbulence acting to suspend the sediment
• Most of suspended sediment is located directly behind the dam (areas away from
turbines)
Holtwood Dam
Conowingo Dam
6
0
0.0002
0.0004
0.0006
0.0008
0.001
0.0012
0.0014
0.0016
0.0018
0.002Probability
Flow (cfs)
Steady State
7
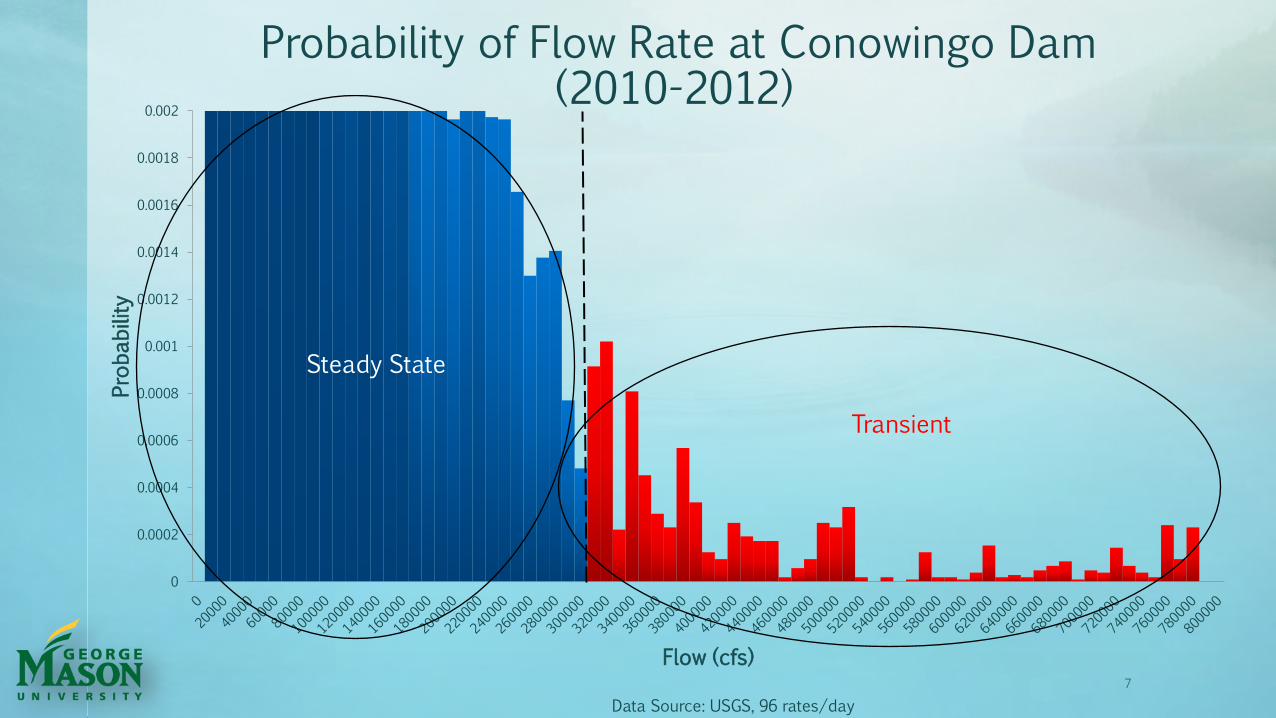
Probability of Flow Rate at Conowingo Dam (2010-2012)
Transient
Data Source: USGS, 96 rates/day
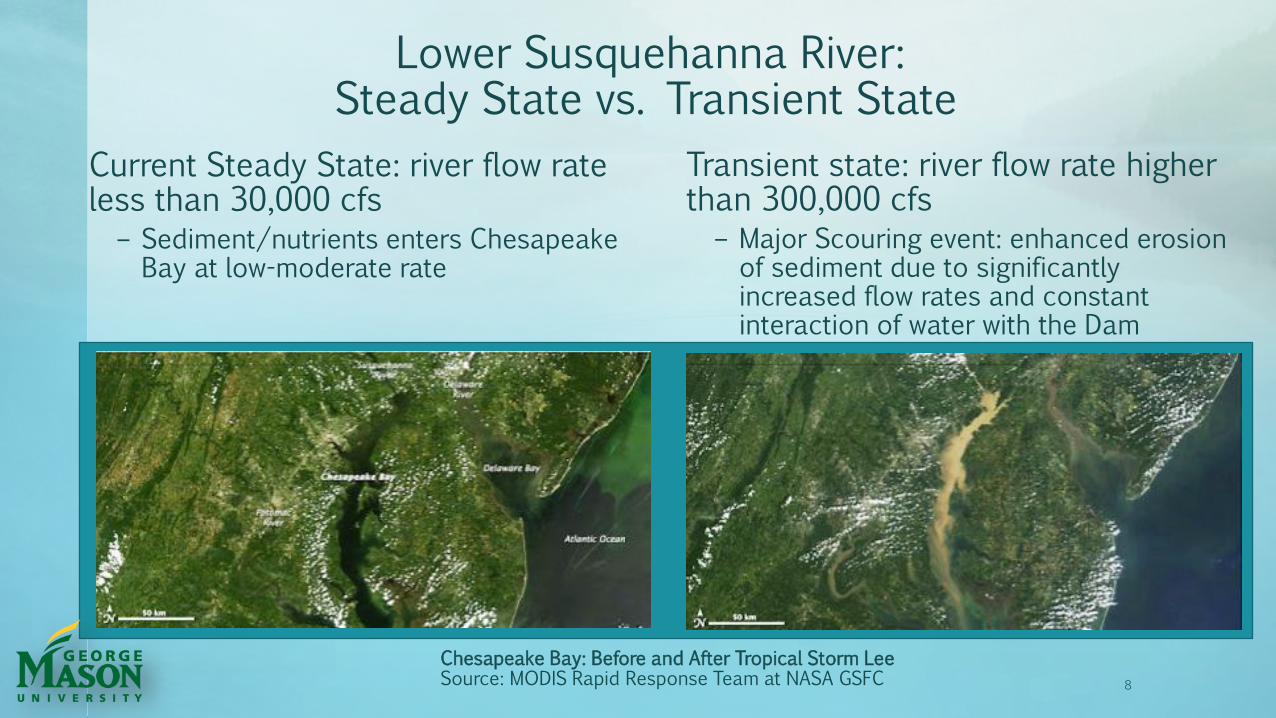
Lower Susquehanna River: Steady State vs. Transient State
Transient state: river flow rate higher than 300,000 cfs
– Major Scouring event: enhanced erosion of sediment due to significantly increased flow rates and constant interaction of water with the Dam
8
Chesapeake Bay: Before and After Tropical Storm Lee Source: MODIS Rapid Response Team at NASA GSFC
Current Steady State: river flow rate less than 30,000 cfs
– Sediment/nutrients enters Chesapeake Bay at low-moderate rate
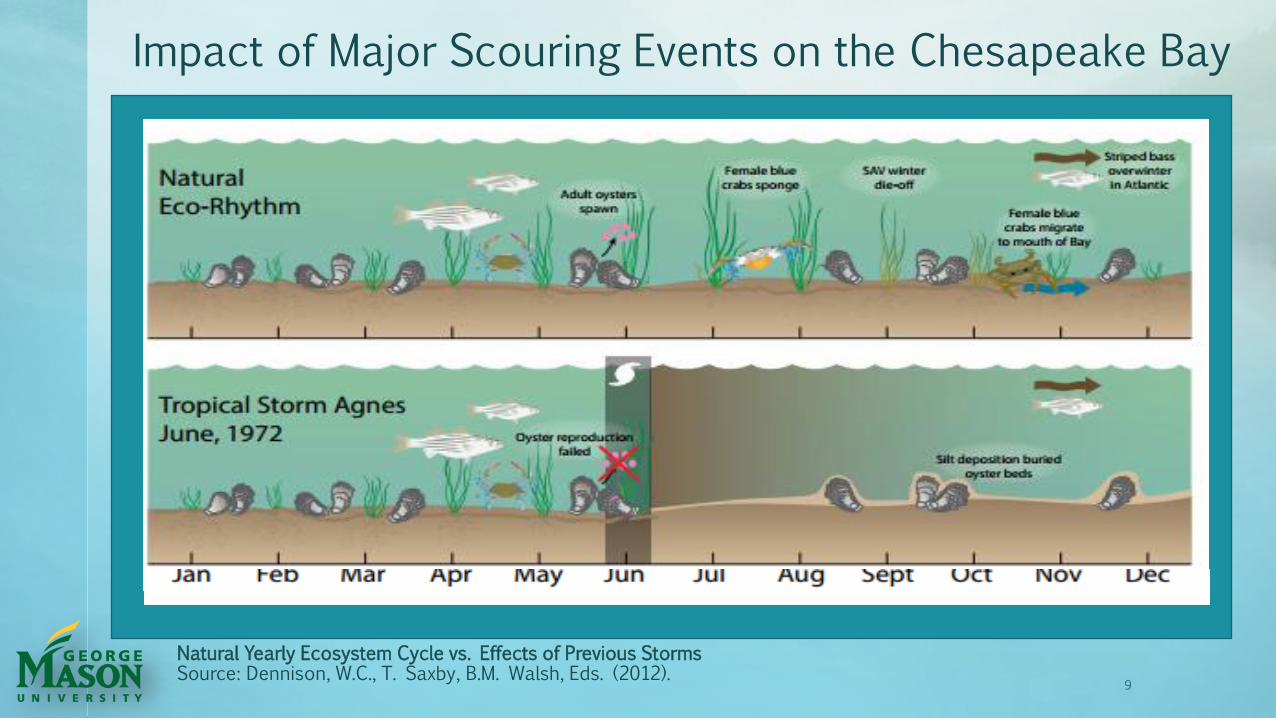
Impact of Major Scouring Events on the Chesapeake Bay
9
Natural Yearly Ecosystem Cycle vs. Effects of Previous Storms Source: Dennison, W.C., T. Saxby, B.M. Walsh, Eds. (2012).
10
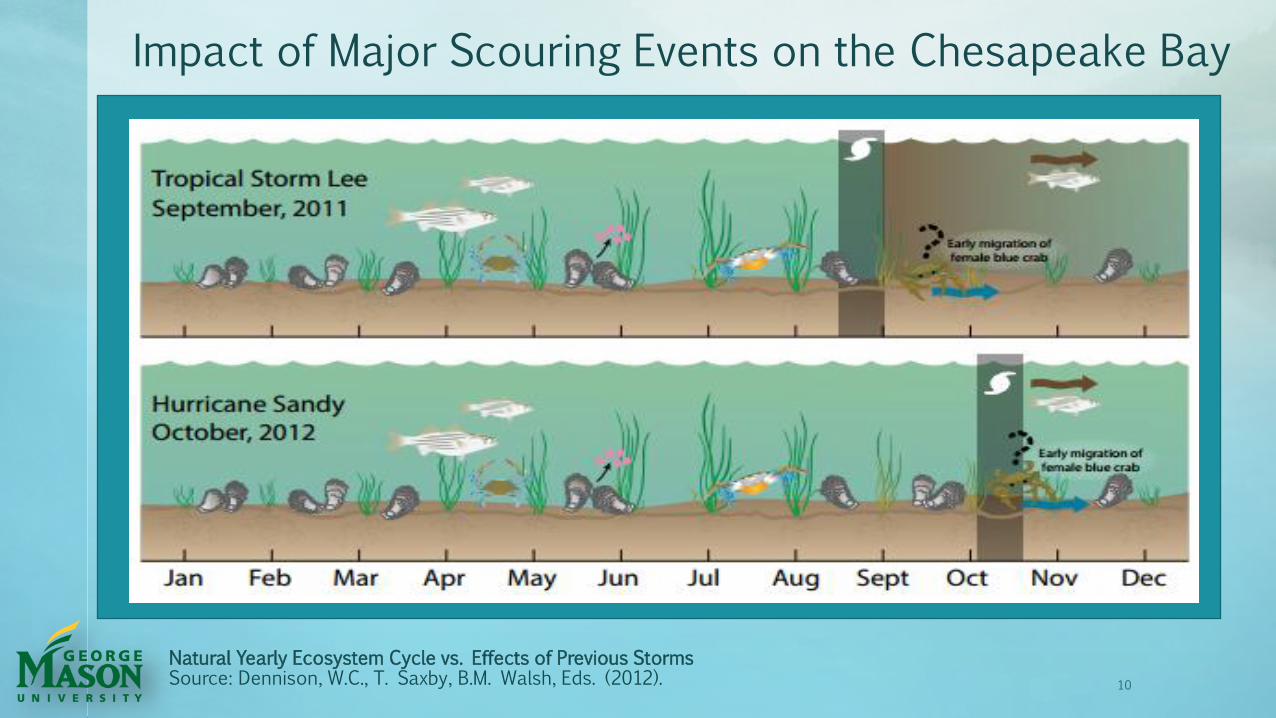
Impact of Major Scouring Events on the Chesapeake Bay
Natural Yearly Ecosystem Cycle vs. Effects of Previous Storms Source: Dennison, W.C., T. Saxby, B.M. Walsh, Eds. (2012).
Chesapeake Bay Total Maximum Daily Load (TMDL)
11
• Established by US Environmental Protection Agency in conjunction with Obama’s Clean Water Act
• Actively planned since 2000
• Covers 64,000 square miles in NY, PA, DE, MD, WV, VA, and DC
• Sets limits for farmers, plants, dams, and other organizations that dump sediment/nutrients into dam
• Designed to fully restore Bay by 2025 – 2017: 60% of sediment/nutrients reduction must be met
12
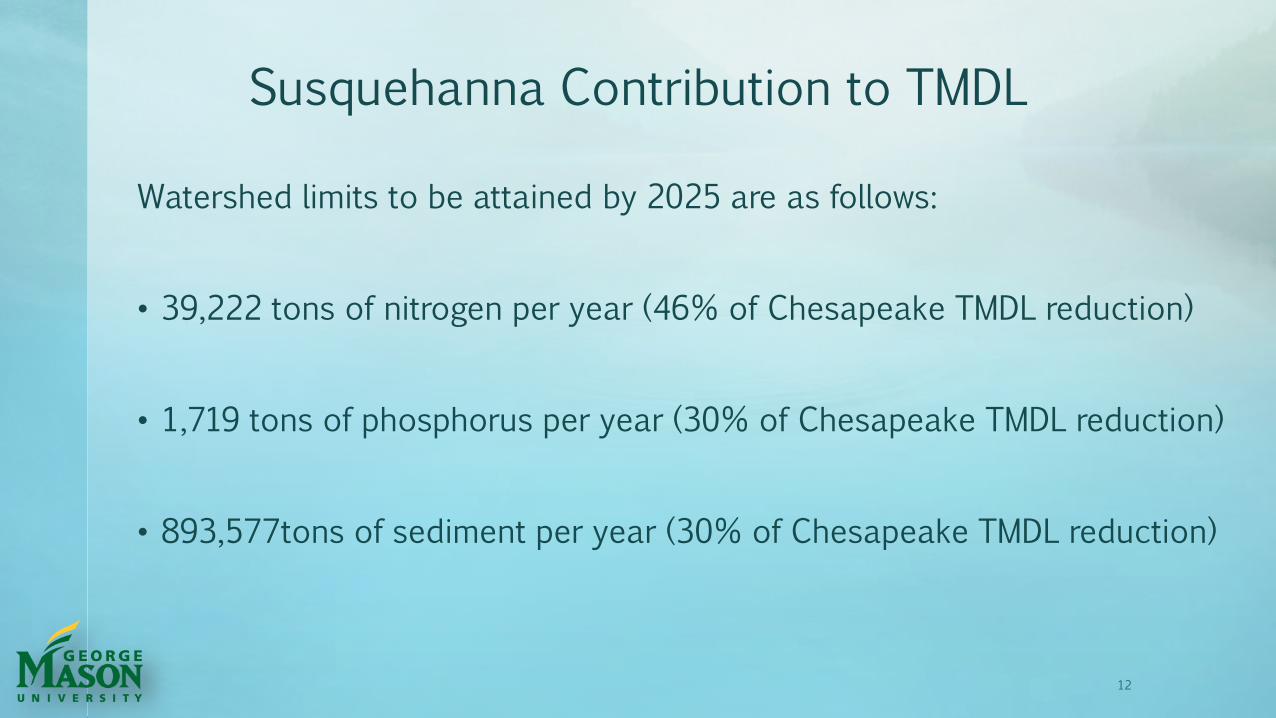
Susquehanna Contribution to TMDL
Watershed limits to be attained by 2025 are as follows:
• 39,222 tons of nitrogen per year (46% of Chesapeake TMDL reduction)
• 1,719 tons of phosphorus per year (30% of Chesapeake TMDL reduction)
• 893,577tons of sediment per year (30% of Chesapeake TMDL reduction)

Project Scope
Within Scope
• Main concern is mitigation of sediment/nutrients currently deposited directly behind dam
• Storm surge/scouring events, which is a transient problem (river flow rate > 300,000 cfs)
Out of Scope
• Prevention of increased sediment/nutrients arriving from upriver (steady-state problem)
• Entirety of the Chesapeake Bay TMDL (steady-state problem)
13

14
Sediment Deposition at Conowingo Dam
• If sediment deposition reaches maximum capacity: • Scouring events would
further devastate the Chesapeake Bay ecosystem
• All Susquehanna River sediment would flow through to the Chesapeake Bay
• Deposition potential – expected sediment deposited over a given time
14
Sediment Deposition in Conowingo Reservoir; Construction to 2008 with Gap Prediction Source of Data: Hirsch, R.M., (2012)
0%
10%
20%
30%
40%
50%
60%
70%
80%
90%
100%
0
50
100
150
200
1929 1936 1943 1950 1957 1964 1971 1978 1985 1992 1999 2006 2013 2020 2027
Percent Capacity
Sedim
ent Deposition (m
illion tons)
Year
Sediment Deposition
Expected
Threshold
15
y = 221373e4E-06x
0
2
4
6
8
10
12
14
0 200,000 400,000 600,000 800,000 1,000,000
Scoured Sedim
ent Load (m
illion tons)
Flow Rate (cfs)
Sediment Load
Threshold
Expon. (Sediment Load)
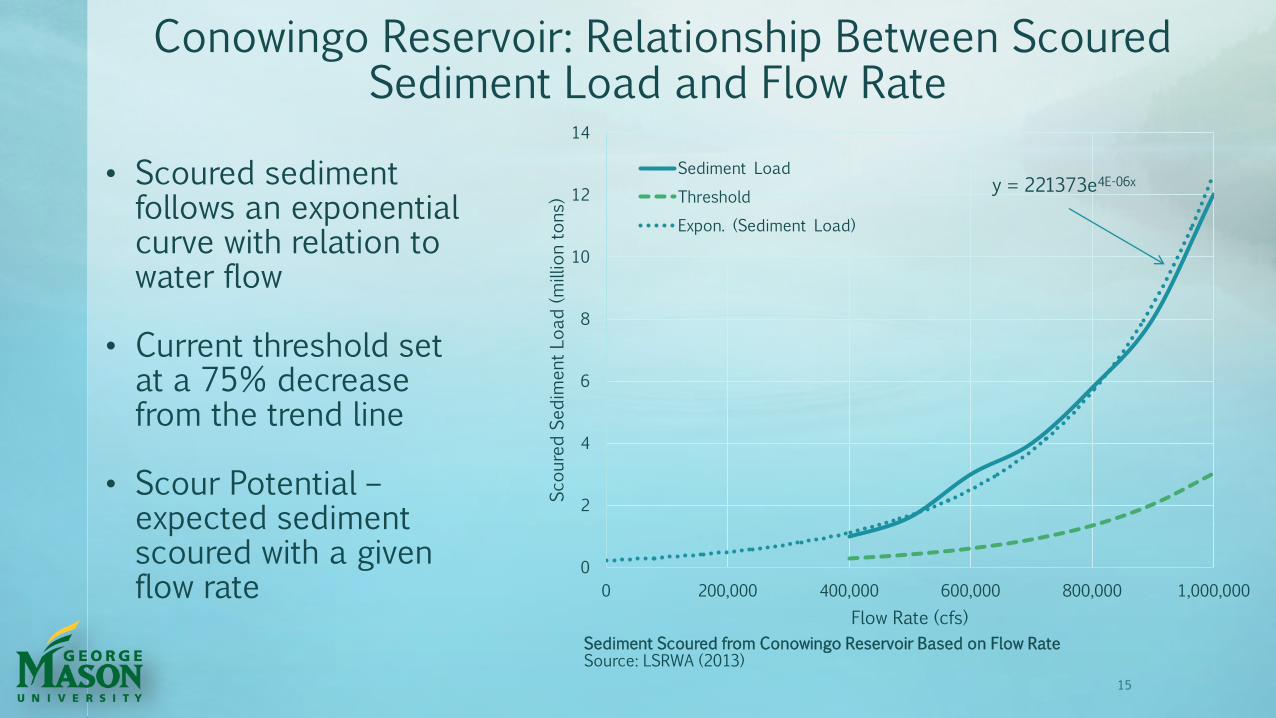
Conowingo Reservoir: Relationship Between Scoured Sediment Load and Flow Rate
Sediment Scoured from Conowingo Reservoir Based on Flow Rate Source: LSRWA (2013)
• Scoured sediment follows an exponential curve with relation to water flow
• Current threshold set at a 75% decrease from the trend line
• Scour Potential – expected sediment scoured with a given flow rate

Agenda
• Context
• Stakeholders
• Problem/Need Statement
• Mission Requirements
• Design Alternatives
• Technical Approach
• Preliminary Results
• Project Management
16
17
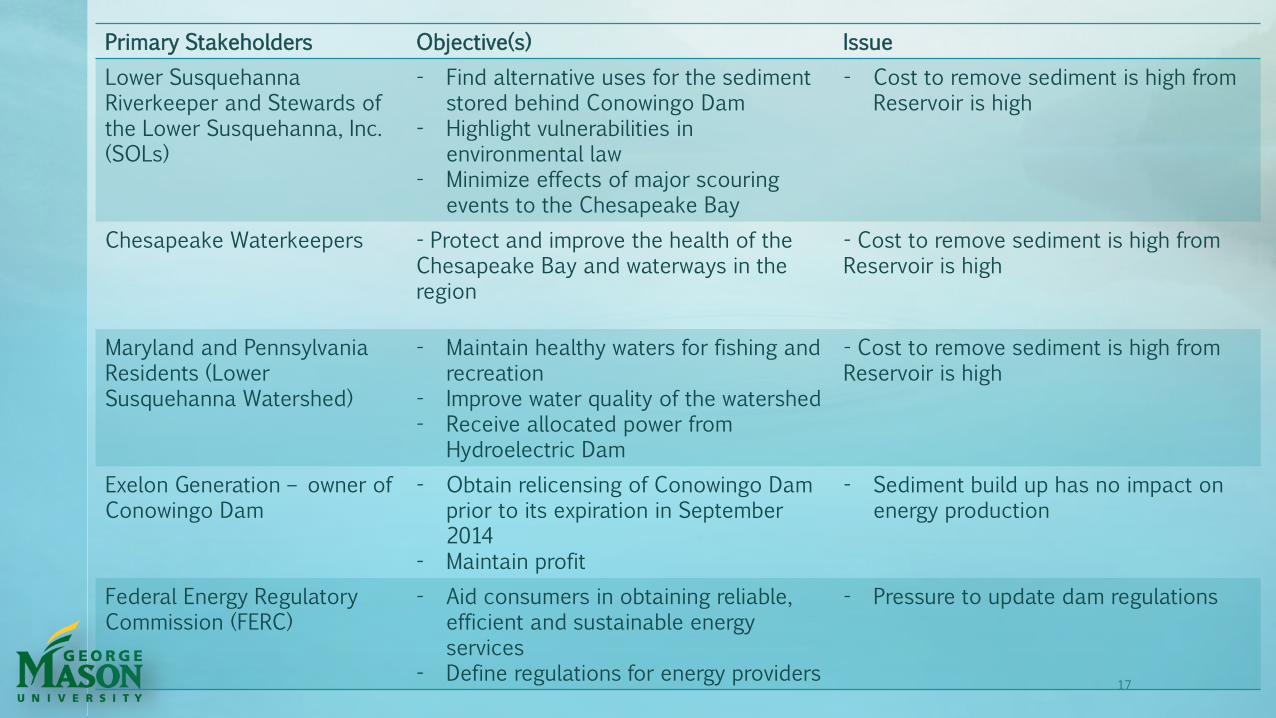
Primary Stakeholders Objective(s) Issue
Lower Susquehanna Riverkeeper and Stewards of the Lower Susquehanna, Inc. (SOLs)
- Find alternative uses for the sediment stored behind Conowingo Dam
- Highlight vulnerabilities in environmental law
- Minimize effects of major scouring events to the Chesapeake Bay
- Cost to remove sediment is high from Reservoir is high
Chesapeake Waterkeepers - Protect and improve the health of the Chesapeake Bay and waterways in the region
- Cost to remove sediment is high from Reservoir is high
Maryland and Pennsylvania Residents (Lower Susquehanna Watershed)
- Maintain healthy waters for fishing and recreation
- Improve water quality of the watershed - Receive allocated power from
Hydroelectric Dam
- Cost to remove sediment is high from Reservoir is high
Exelon Generation – owner of Conowingo Dam
- Obtain relicensing of Conowingo Dam prior to its expiration in September 2014
- Maintain profit
- Sediment build up has no impact on energy production
Federal Energy Regulatory Commission (FERC)
- Aid consumers in obtaining reliable, efficient and sustainable energy services
- Define regulations for energy providers
- Pressure to update dam regulations

Stakeholder Tensions and Interactions
18 ------- Aids in sediment removal ------- Does not aid or potentially aids in sediment removal

Agenda
• Context
• Stakeholders
• Problem/Need Statement
• Mission Requirements
• Design Alternatives
• Technical Approach
• Preliminary Results
• Project Management
19

Problem Statement
- Conowingo Reservoir has been retaining a majority of the sediment flowing down the Susquehanna River
- Major scouring events in the Lower Susquehanna River perpetuate significant ecological damage to the Chesapeake Bay
- This ecological damage is caused by increased deposition of sediment and nutrients in the Bay
20
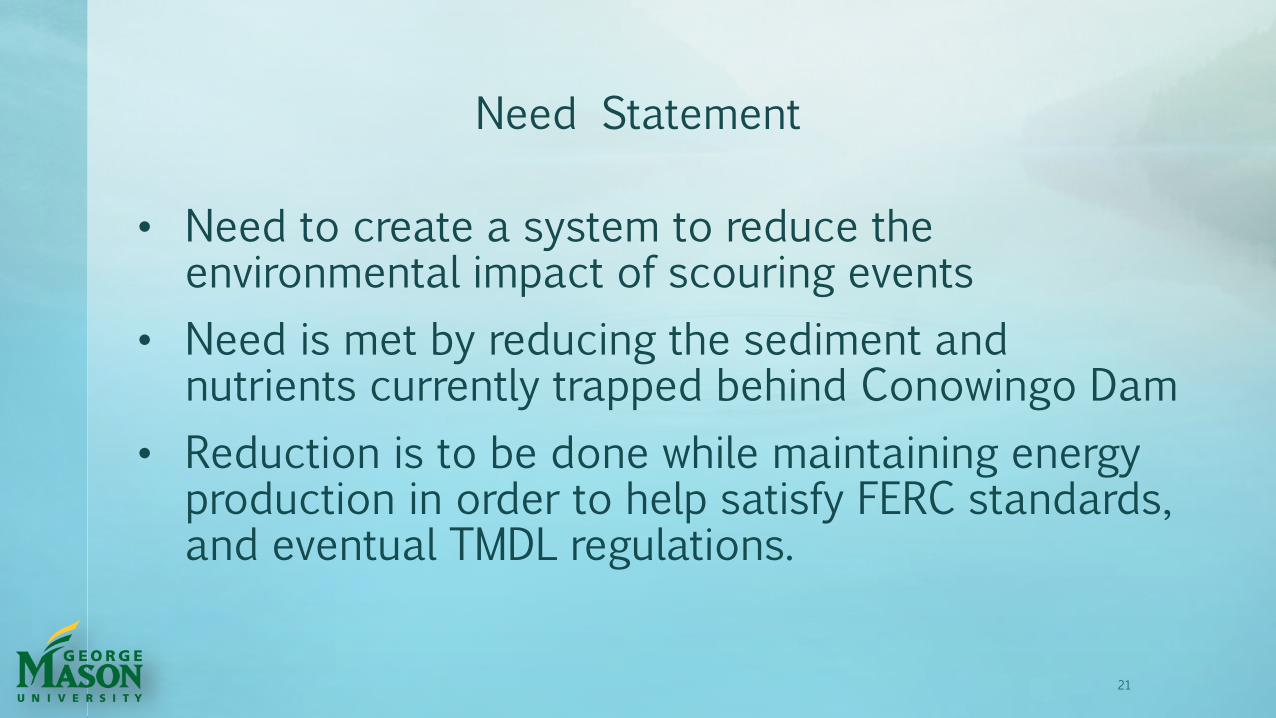
Need Statement
• Need to create a system to reduce the environmental impact of scouring events
• Need is met by reducing the sediment and nutrients currently trapped behind Conowingo Dam
• Reduction is to be done while maintaining energy production in order to help satisfy FERC standards, and eventual TMDL regulations.
21

Agenda
• Context
• Stakeholders
• Problem/Need Statement
• Mission Requirements
• Design Alternatives
• Technical Approach
• Preliminary Results
• Project Management
22
23
Mission Requirements
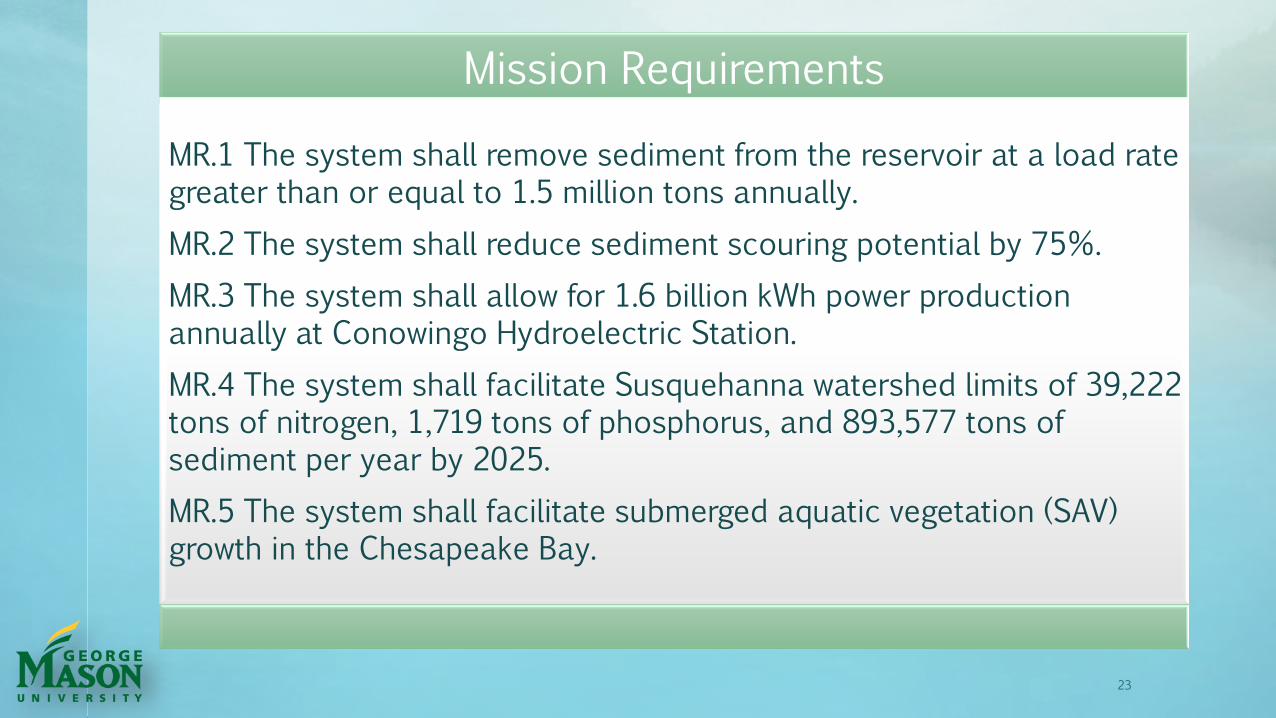
MR.1 The system shall remove sediment from the reservoir at a load rate greater than or equal to 1.5 million tons annually.
MR.2 The system shall reduce sediment scouring potential by 75%.
MR.3 The system shall allow for 1.6 billion kWh power production annually at Conowingo Hydroelectric Station.
MR.4 The system shall facilitate Susquehanna watershed limits of 39,222 tons of nitrogen, 1,719 tons of phosphorus, and 893,577 tons of sediment per year by 2025.
MR.5 The system shall facilitate submerged aquatic vegetation (SAV) growth in the Chesapeake Bay.

Agenda
• Context
• Stakeholders
• Problem/Need Statement
• Mission Requirements
• Design Alternatives
• Technical Approach
• Preliminary Results
• Project Management
24
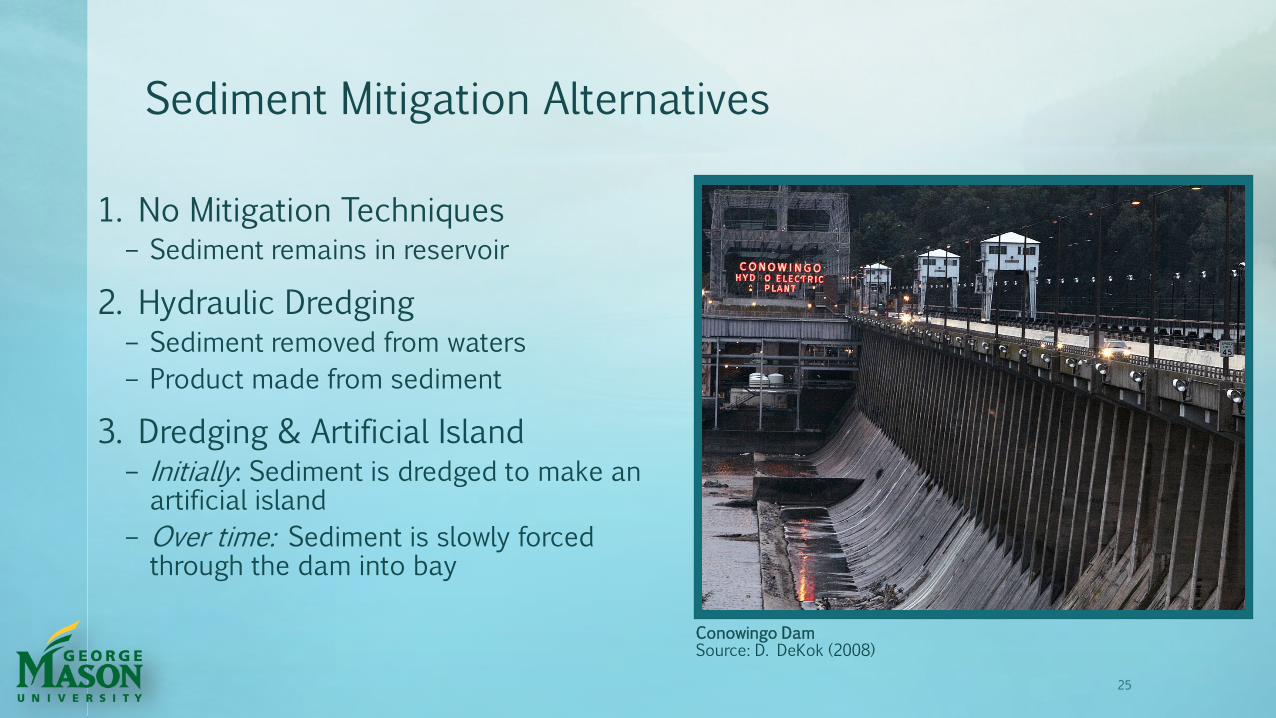
Sediment Mitigation Alternatives
1. No Mitigation Techniques – Sediment remains in reservoir
2. Hydraulic Dredging – Sediment removed from waters
– Product made from sediment
3. Dredging & Artificial Island – Initially: Sediment is dredged to make an artificial island
– Over time: Sediment is slowly forced through the dam into bay
25
Conowingo Dam Source: D. DeKok (2008)
1. No Mitigation Techniques
2. Hydraulic Dredging
3. Dredging & Artificial Island
26
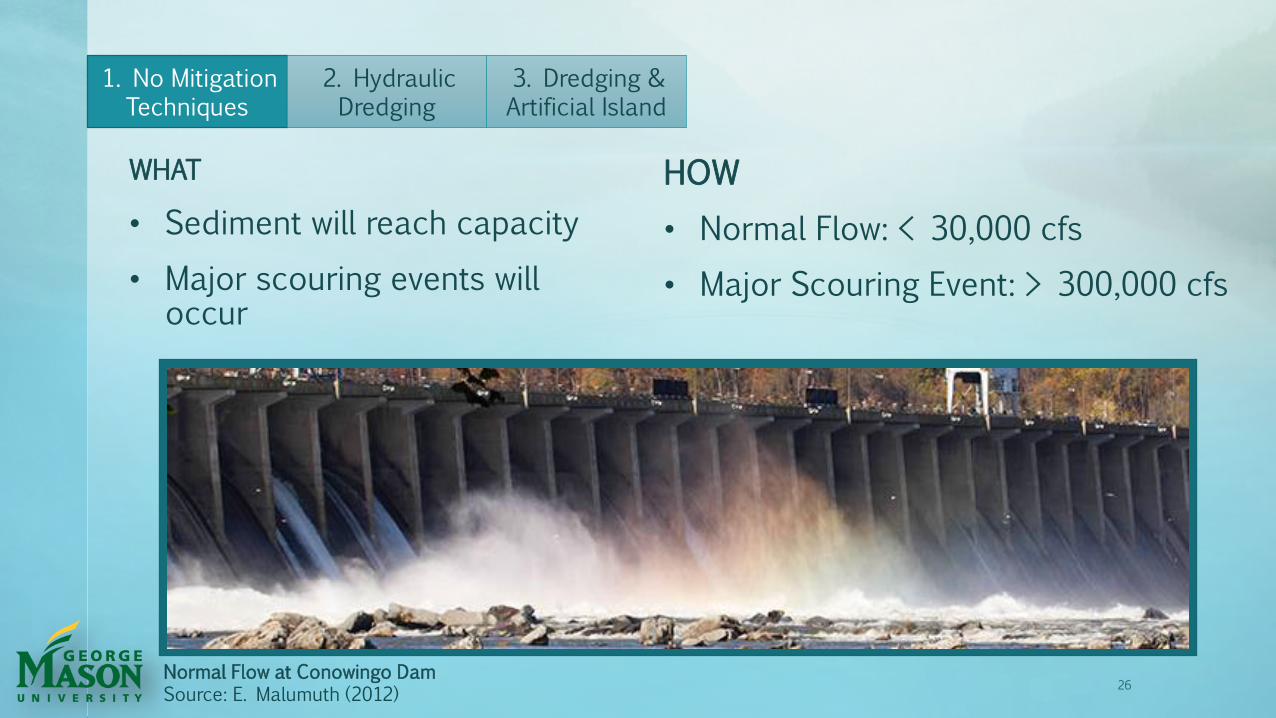
WHAT
• Sediment will reach capacity
• Major scouring events will occur
HOW
• Normal Flow: < 30,000 cfs
• Major Scouring Event: > 300,000 cfs
Normal Flow at Conowingo Dam Source: E. Malumuth (2012)

WHAT
• Remove sediment mechanically
• Concentration on suspended sediment
• Product yield from sediment
27
3. Dredging & Artificial Island
1. No Mitigation Techniques
2. Hydraulic Dredging
Hydraulic Dredging Process Source: C. Johnson
HOW
• Rotating cutter to agitate & stir up
• Pipeline pumps sediment to surface
• Collection for further treatment
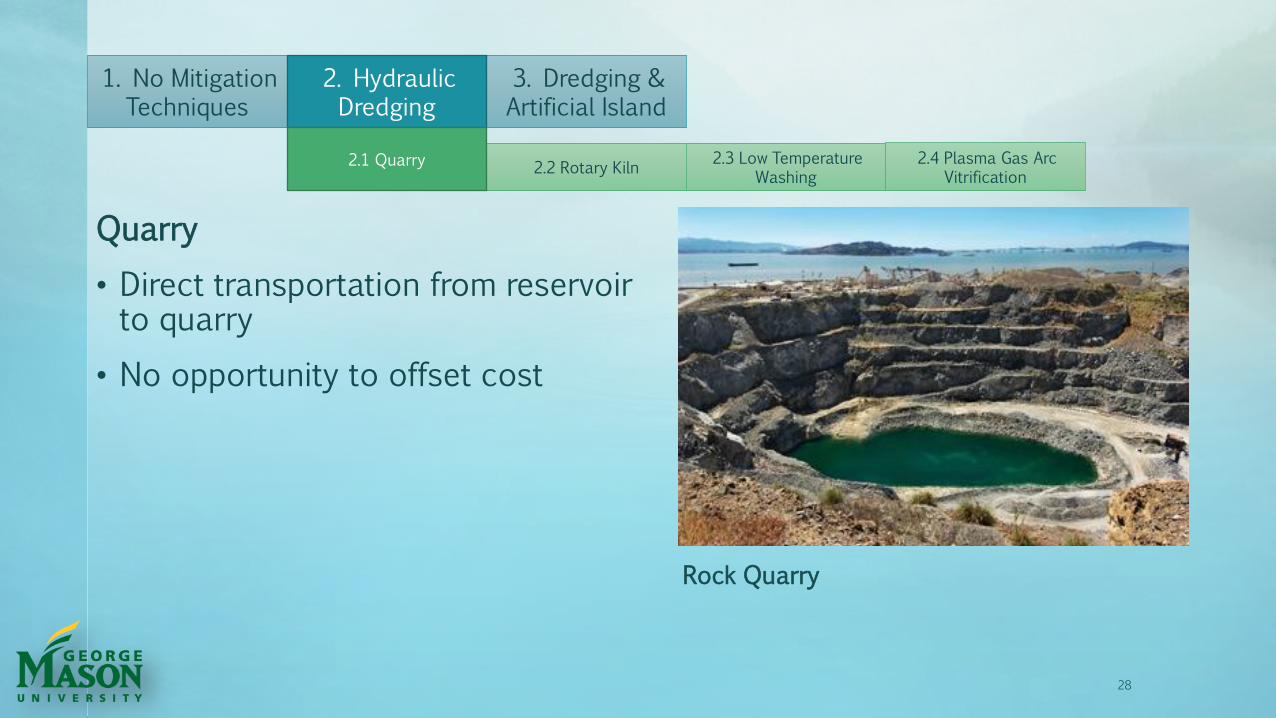
Quarry
• Direct transportation from reservoir to quarry
• No opportunity to offset cost
28
Rock Quarry
2.2 Rotary Kiln 2.4 Plasma Gas Arc
Vitrification 2.3 Low Temperature
Washing
3. Dredging & Artificial Island
1. No Mitigation Techniques
2. Hydraulic Dredging
2.1 Quarry

29
Min. Cost (cy)
Mid. Cost (cy)
Max Cost (cy)
$36 $48
$54
Source: LSRWA
Quarry Cost/Revenue Distribution s(Triangular)
0
0.02
0.04
0.06
0.08
0.1
0.12
$30 $40 $50 $60
Probability
Cost
Cost PDF (Triangular)
Quarry
Revenue
3. Dredging & Artificial Island
1. No Mitigation Techniques
2. Hydraulic Dredging
2.2 Rotary Kiln 2.4 Plasma Gas Arc
Vitrification 2.3 Low Temperature
Washing 2.1 Quarry
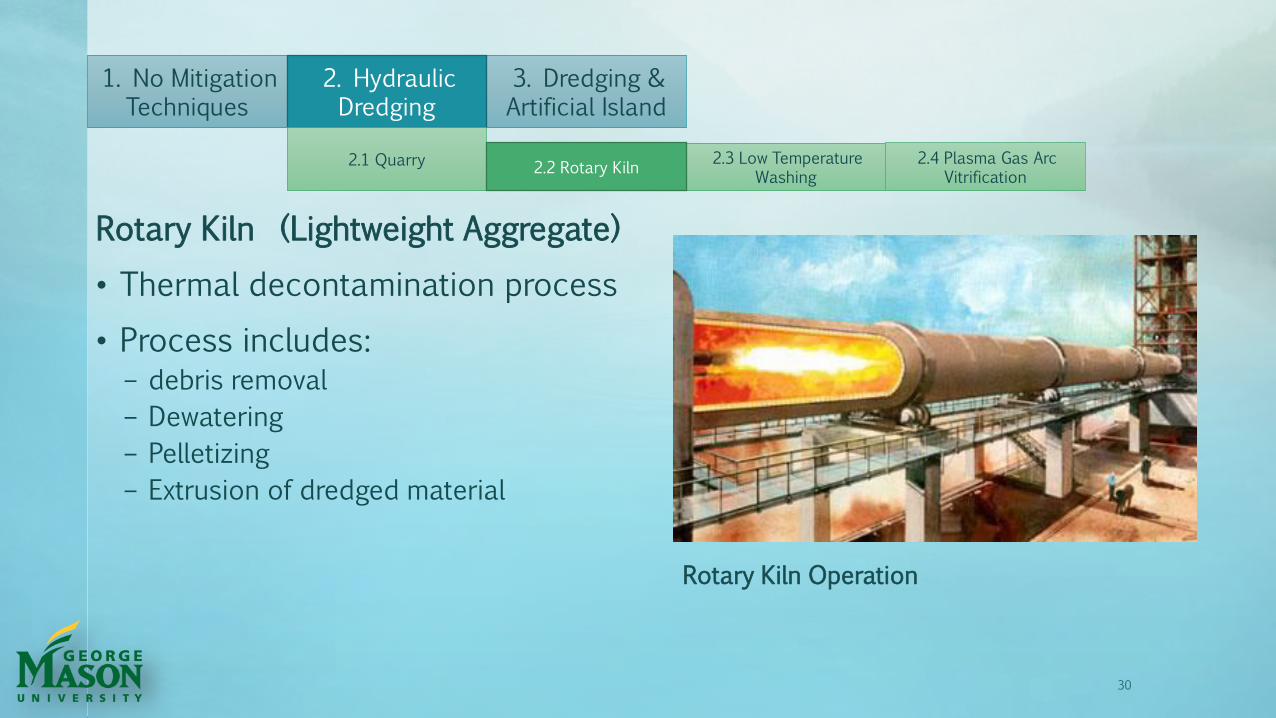
Rotary Kiln (Lightweight Aggregate)
• Thermal decontamination process
• Process includes: – debris removal
– Dewatering
– Pelletizing
– Extrusion of dredged material
30
Rotary Kiln Operation
3. Dredging & Artificial Island
1. No Mitigation Techniques
2. Hydraulic Dredging
2.1 Quarry 2.4 Plasma Gas Arc Vitrification
2.3 Low Temperature Washing
2.2 Rotary Kiln

31
Min. Cost (cy)
Mid. Cost (cy)
Max Cost (cy)
Min Revenue (cy)
Mid Revenue (cy)
Max Revenue (cy)
$52 $70
$80 $40 $65 $100
• Potential to be profitable • Adjusted for inflation Source: JCI/Upcycle Associates, LLC
Lightweight Aggregate Cost/Revenue Distribution (Triangular)
0
0.02
0.04
0.06
0.08
$0 $50 $100 $150
Probability
Monetary Value
Cost/Revenue PDF (Triangular)
Lightweight Aggregate
Revenue
Cost
3. Dredging & Artificial Island
1. No Mitigation Techniques
2. Hydraulic Dredging
2.1 Quarry 2.4 Plasma Gas Arc Vitrification
2.3 Low Temperature Washing
2.2 Rotary Kiln
32
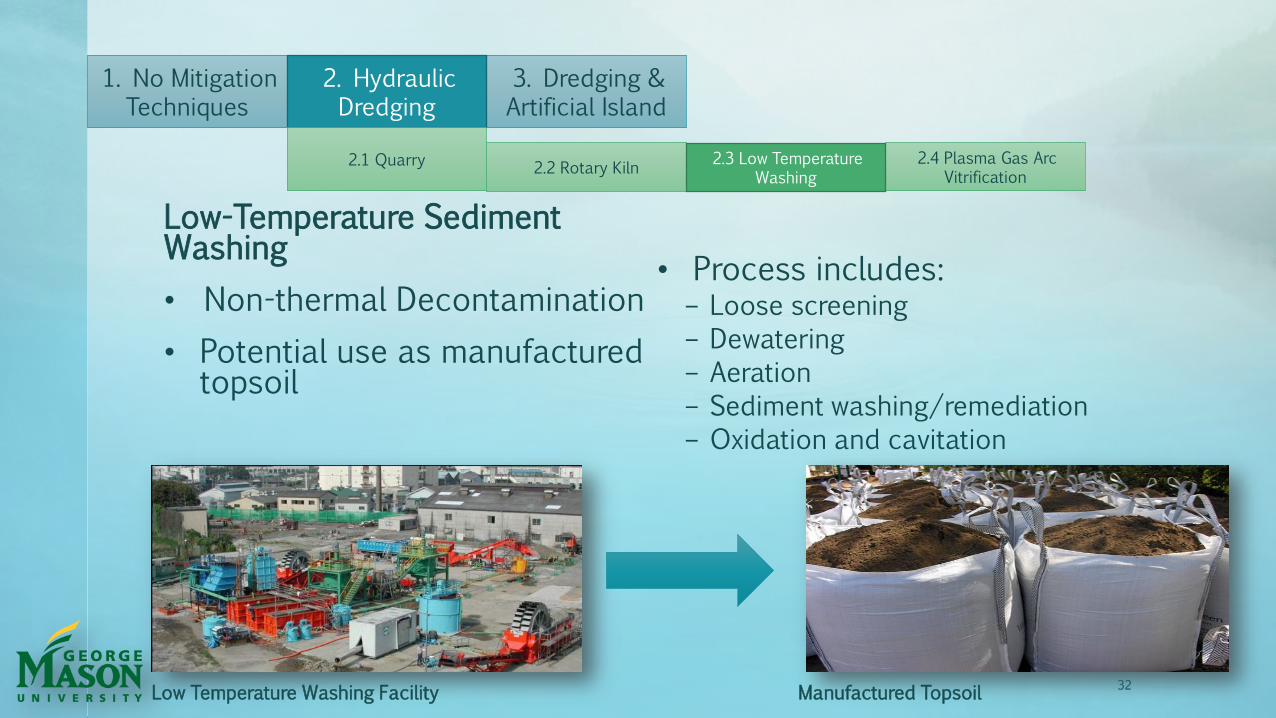
Low-Temperature Sediment Washing
• Non-thermal Decontamination
• Potential use as manufactured topsoil
• Process includes: – Loose screening
– Dewatering
– Aeration
– Sediment washing/remediation
– Oxidation and cavitation
32 Low Temperature Washing Facility Manufactured Topsoil
3. Dredging & Artificial Island
1. No Mitigation Techniques
2. Hydraulic Dredging
2.1 Quarry 2.4 Plasma Gas Arc Vitrification
2.2 Rotary Kiln 2.3 Low Temperature
Washing
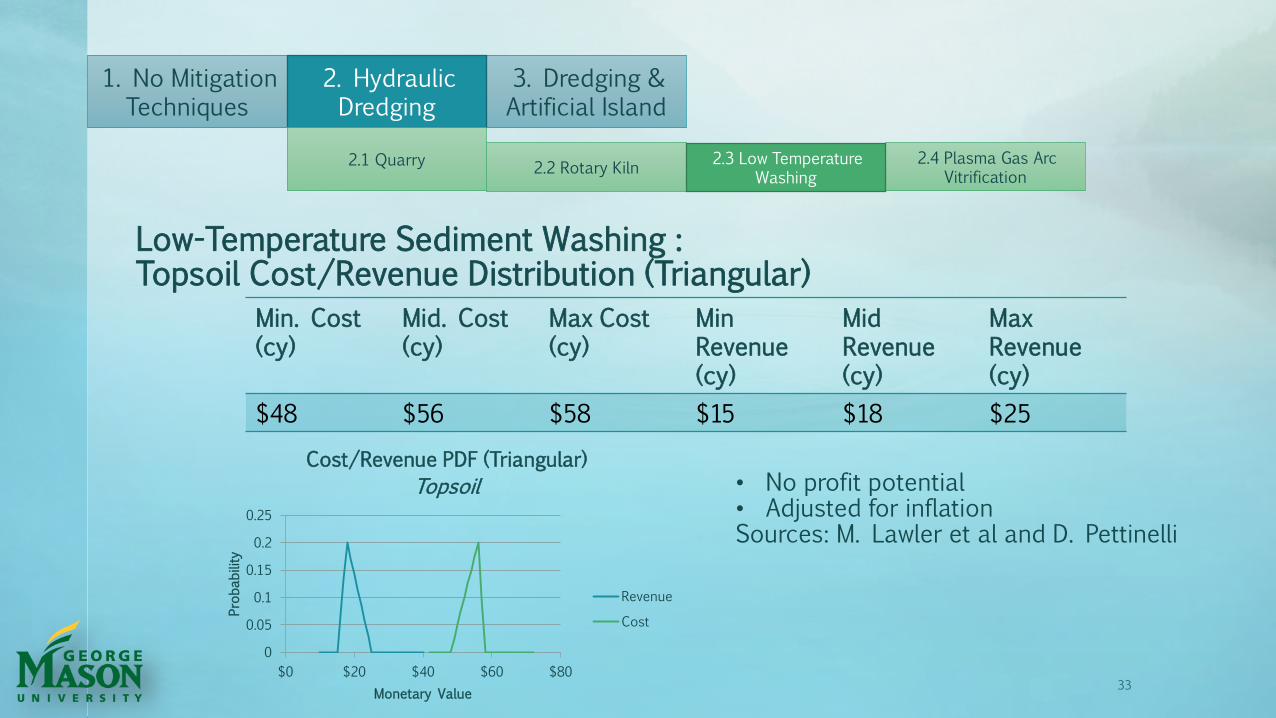
Low-Temperature Sediment Washing : Topsoil Cost/Revenue Distribution (Triangular)
Min. Cost (cy)
Mid. Cost (cy)
Max Cost (cy)
Min Revenue (cy)
Mid Revenue (cy)
Max Revenue (cy)
$48 $56 $58 $15 $18 $25
• No profit potential • Adjusted for inflation Sources: M. Lawler et al and D. Pettinelli
33
0
0.05
0.1
0.15
0.2
0.25
$0 $20 $40 $60 $80
Probability
Monetary Value
Cost/Revenue PDF (Triangular)
Topsoil
Revenue
Cost
3. Dredging & Artificial Island
1. No Mitigation Techniques
2. Hydraulic Dredging
2.1 Quarry 2.4 Plasma Gas Arc Vitrification
2.2 Rotary Kiln 2.3 Low Temperature
Washing
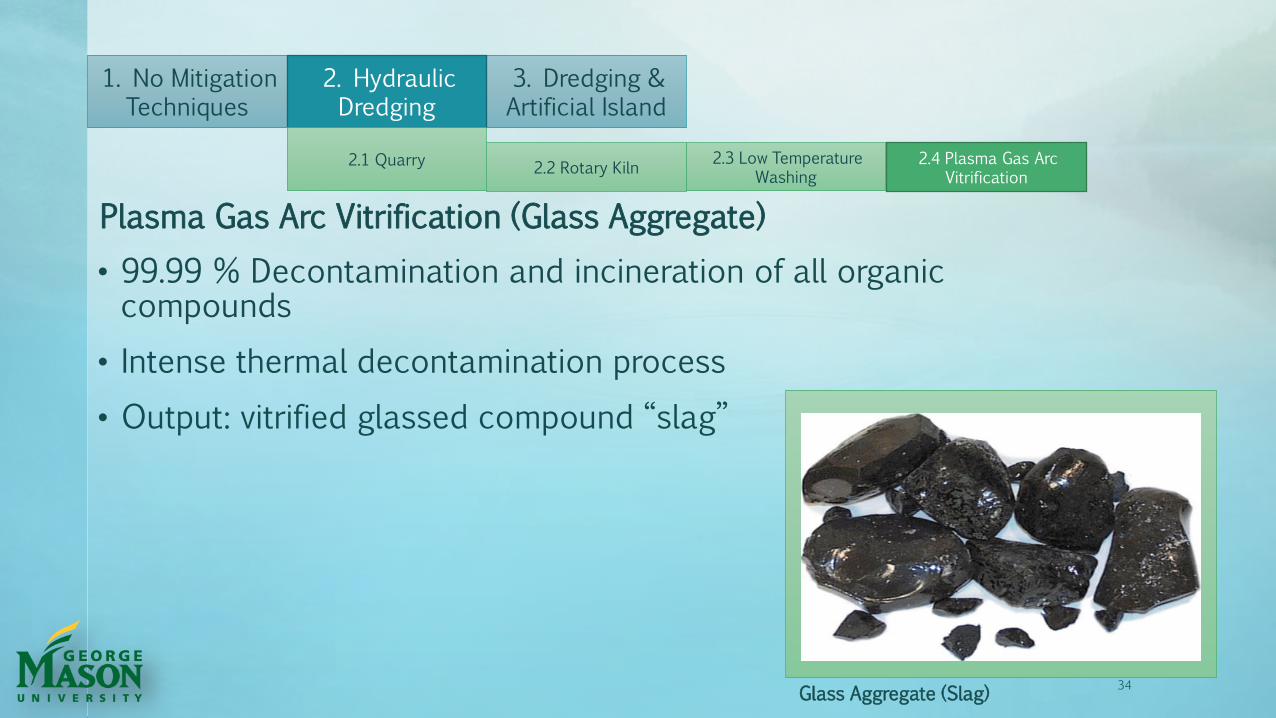
• 99.99 % Decontamination and incineration of all organic compounds
• Intense thermal decontamination process
• Output: vitrified glassed compound “slag”
Plasma Gas Arc Vitrification (Glass Aggregate)
34 Glass Aggregate (Slag)
3. Dredging & Artificial Island
1. No Mitigation Techniques
2. Hydraulic Dredging
2.1 Quarry 2.3 Low Temperature Washing
2.2 Rotary Kiln 2.4 Plasma Gas Arc
Vitrification

Slag Products : Cost/Revenue Distribution (Triangular)
35
Product Min. Cost (cy)
Mid. Cost (cy)
Max Cost (cy)
Min Revenue (cy)
Mid Revenue (cy)
Max Revenue (cy)
Arc. Tile (high grade)
$120 $146 $157 $247 $268 $322
Arc. Tile (low grade)
$120 $146 $157 $193 $203 $219
0
0.02
0.04
0.06
0.08
0.1
$100 $150 $200Probability
Monetary Value
Cost/Revenue PDF (Triangular)
Low Grade Tile
Revenue
Cost
0
0.01
0.02
0.03
0.04
0.05
0.06
$100 $150 $200 $250 $300
Probability
Monetary Value
Cost/Revenue PDF (Triangular)
High Grade Tile
Revenue
Cost
• High potential to be profitable
Source: Westinghouse
3. Dredging & Artificial Island
1. No Mitigation Techniques
2. Hydraulic Dredging
2.1 Quarry 2.3 Low Temperature Washing
2.2 Rotary Kiln 2.4 Plasma Gas Arc
Vitrification

WHAT
• Diamond-shaped structure to divert water is placed in front of the dam
• Larger sediment load through the dam (at steady-state); remaining amount is dredged
HOW
• Diverter made of dredged sediment product
• Diverts water left & right – increases flow velocity
• Decreases Rouse number near suspended sediment
• Sediment mixed into wash load
• Potentially decreases total dredging costs
Potential Artificial Island Location at Conowingo Reservoir Source: Original graphic by S. Scott (2012)
36
1. No Mitigation Techniques
2. Hydraulic Dredging
3. Dredging & Artificial Island

Agenda
• Context
• Stakeholders
• Problem/Need Statement
• Mission Requirements
• Design Alternatives
• Technical Approach
• Preliminary Results
• Project Management
37
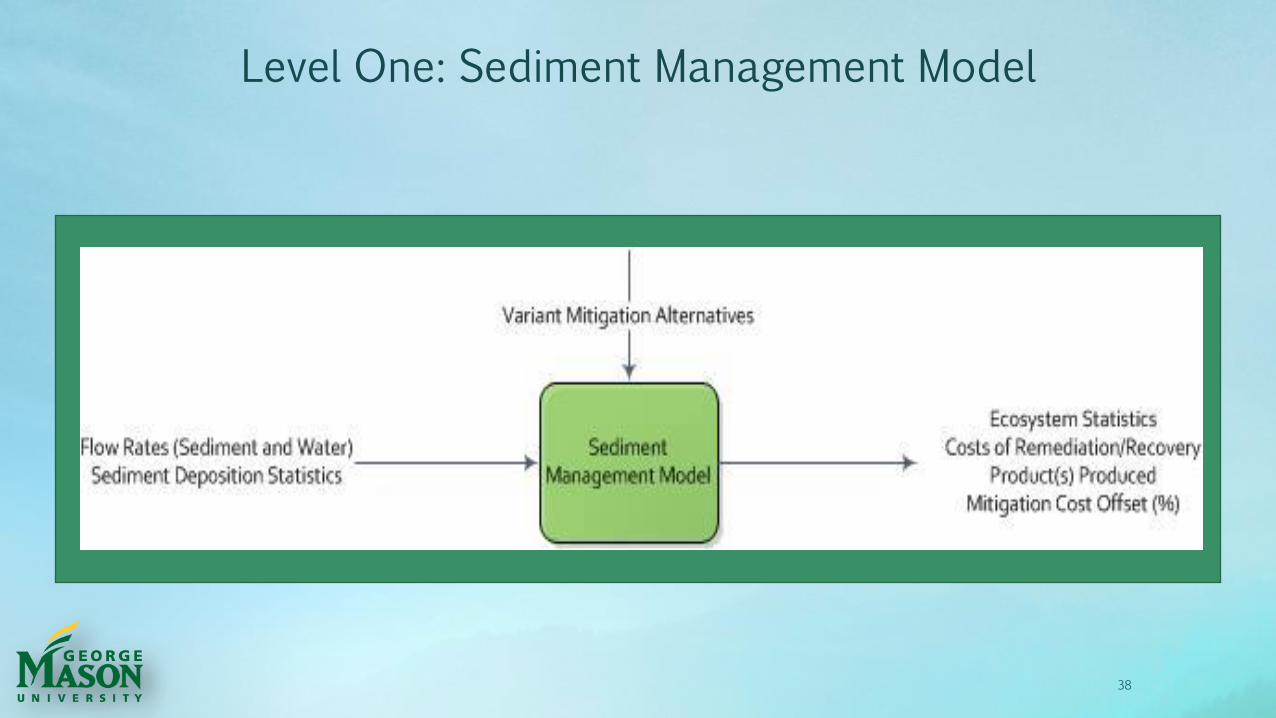
Level One: Sediment Management Model
38
39
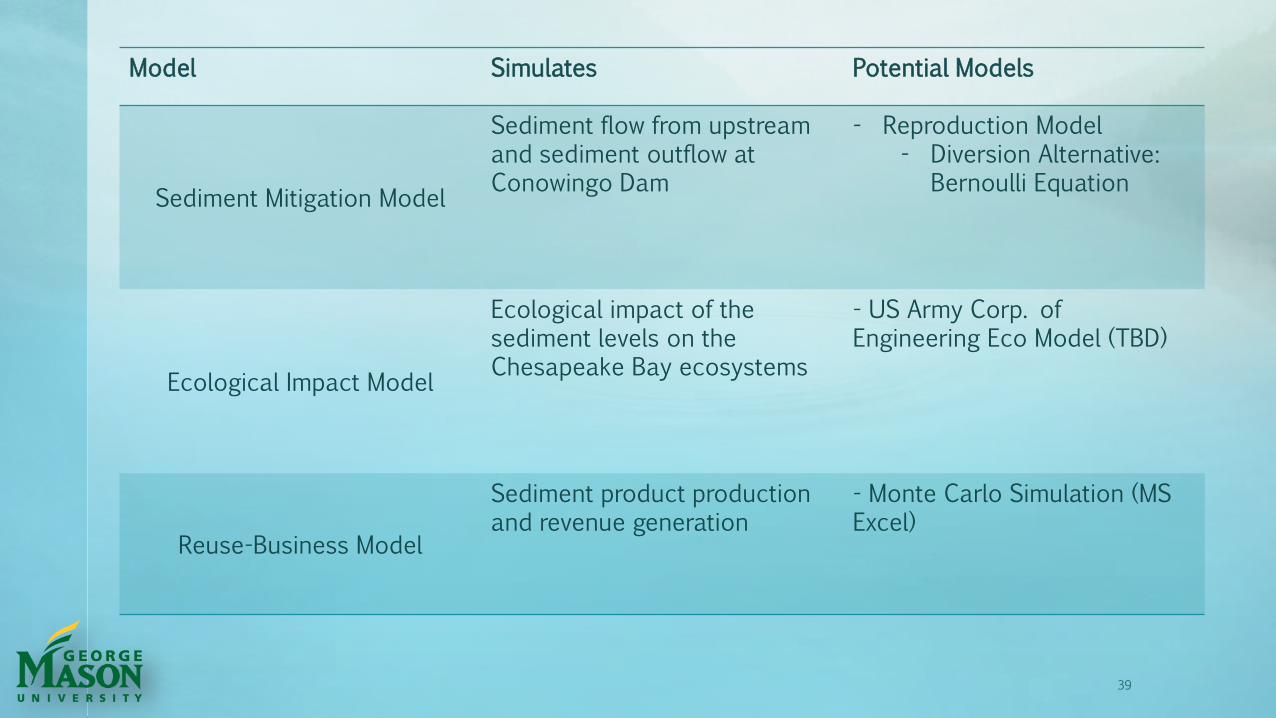
Model Simulates Potential Models
Sediment Mitigation Model
Sediment flow from upstream and sediment outflow at Conowingo Dam
- Reproduction Model - Diversion Alternative:
Bernoulli Equation
Ecological Impact Model
Ecological impact of the sediment levels on the Chesapeake Bay ecosystems
- US Army Corp. of Engineering Eco Model (TBD)
Reuse-Business Model
Sediment product production and revenue generation
- Monte Carlo Simulation (MS Excel)
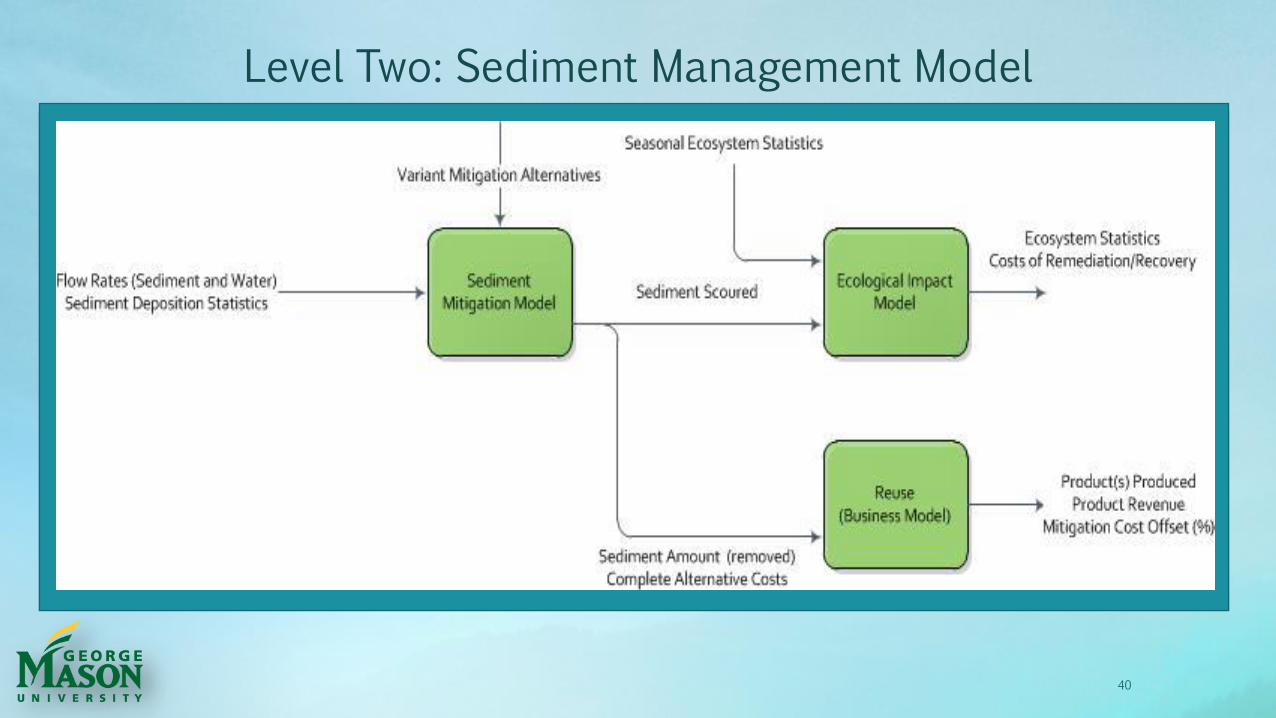
Level Two: Sediment Management Model
40
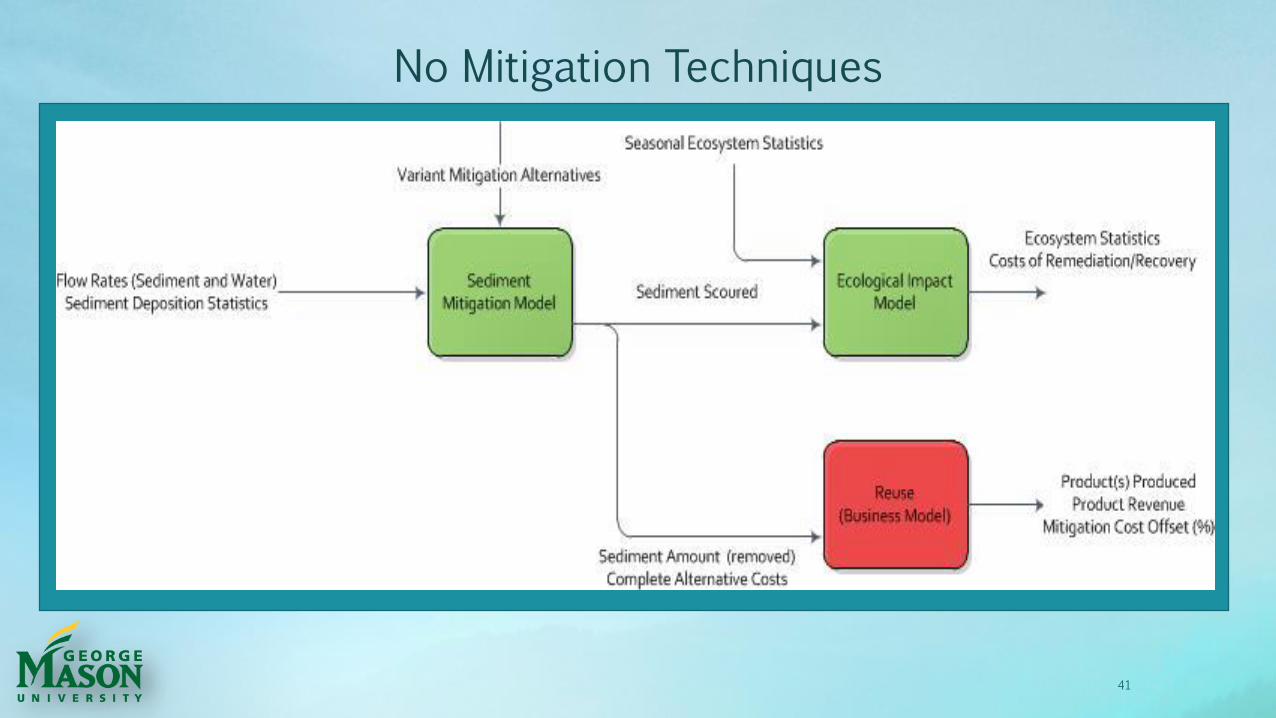
41
No Mitigation Techniques
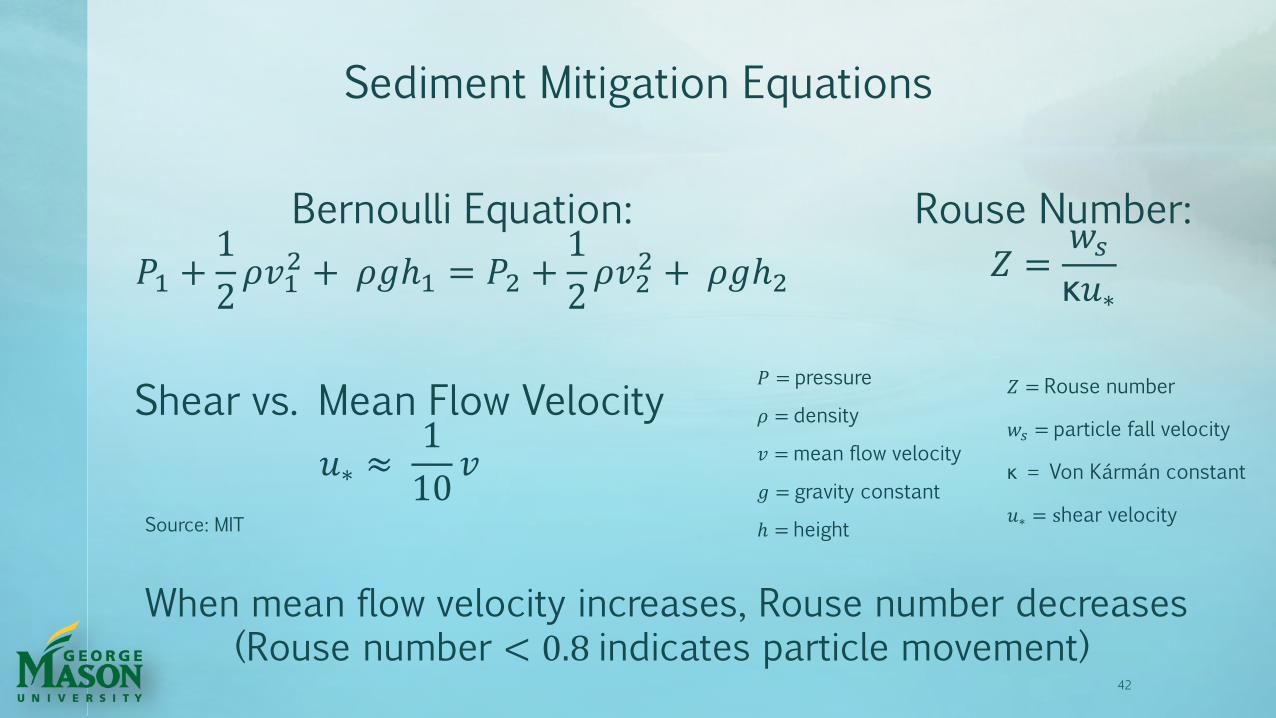
Sediment Mitigation Equations
Bernoulli Equation:
𝑃1 +1
2𝜌𝑣1
2 + 𝜌𝑔ℎ1 = 𝑃2 +1
2𝜌𝑣2
2 + 𝜌𝑔ℎ2
42
Rouse Number:
𝑍 =𝑤𝑠
κ𝑢∗
Shear vs. Mean Flow Velocity
𝑢∗ ≈ 1
10𝑣
𝑃 = pressure
𝜌 = density
𝑣 = mean flow velocity
𝑔 = gravity constant
ℎ = height
𝑍 = Rouse number
𝑤𝑠 = particle fall velocity
κ = Von Kármán constant
𝑢∗ = shear velocity
When mean flow velocity increases, Rouse number decreases (Rouse number < 0.8 indicates particle movement)
Source: MIT

Ecological Impact Equation
Flow Rate vs. Scouring Discharge:
𝑦 = 221373 ∗ 𝑒0.000004𝑥 𝑥 = Daily Average Flow Rate (cfs)
𝑦 = Scouring Discharge Load (SDL) (tons/day)
43
Source: Trendline from LSRWA data
• Varying sediment discharge levels can be found given varying flow rates • Possibility to compare with the following statistics based on use case data:
• Current bay sediment, nitrogen, phosphorus, and SAV growth
• Equation only valid for current reservoir status (no mitigation) • Dredging alternatives will require separate equations based on output from sediment mitigation model
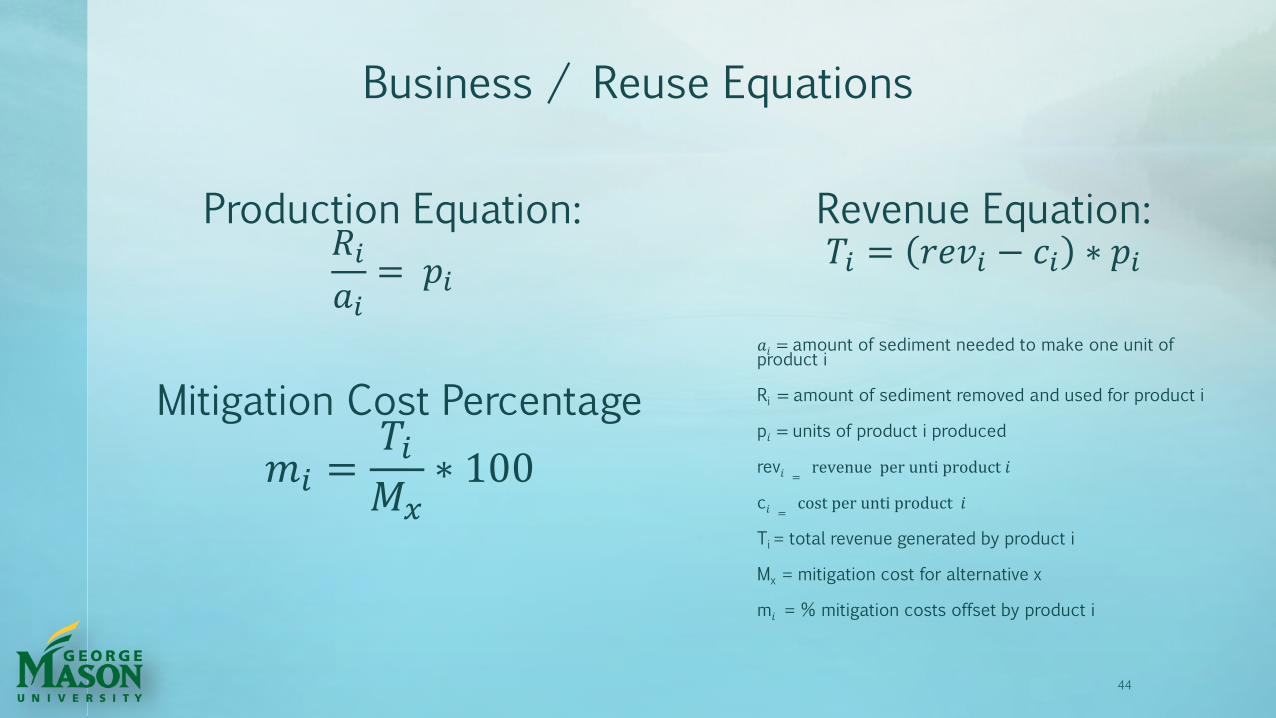
Business / Reuse Equations
Production Equation: 𝑅𝑖
𝑎𝑖= 𝑝𝑖
44
Revenue Equation: 𝑇𝑖 = 𝑟𝑒𝑣𝑖 − 𝑐𝑖 ∗ 𝑝𝑖
Mitigation Cost Percentage
𝑚𝑖 =𝑇𝑖
𝑀𝑥∗ 100
𝑎𝑖 = amount of sediment needed to make one unit of product i
Ri = amount of sediment removed and used for product i
p𝑖 = units of product i produced
rev𝑖 = revenue per unti product 𝑖
c𝑖 = cost per unti product 𝑖
Ti = total revenue generated by product i
Mx = mitigation cost for alternative x
m𝑖 = % mitigation costs offset by product i
45
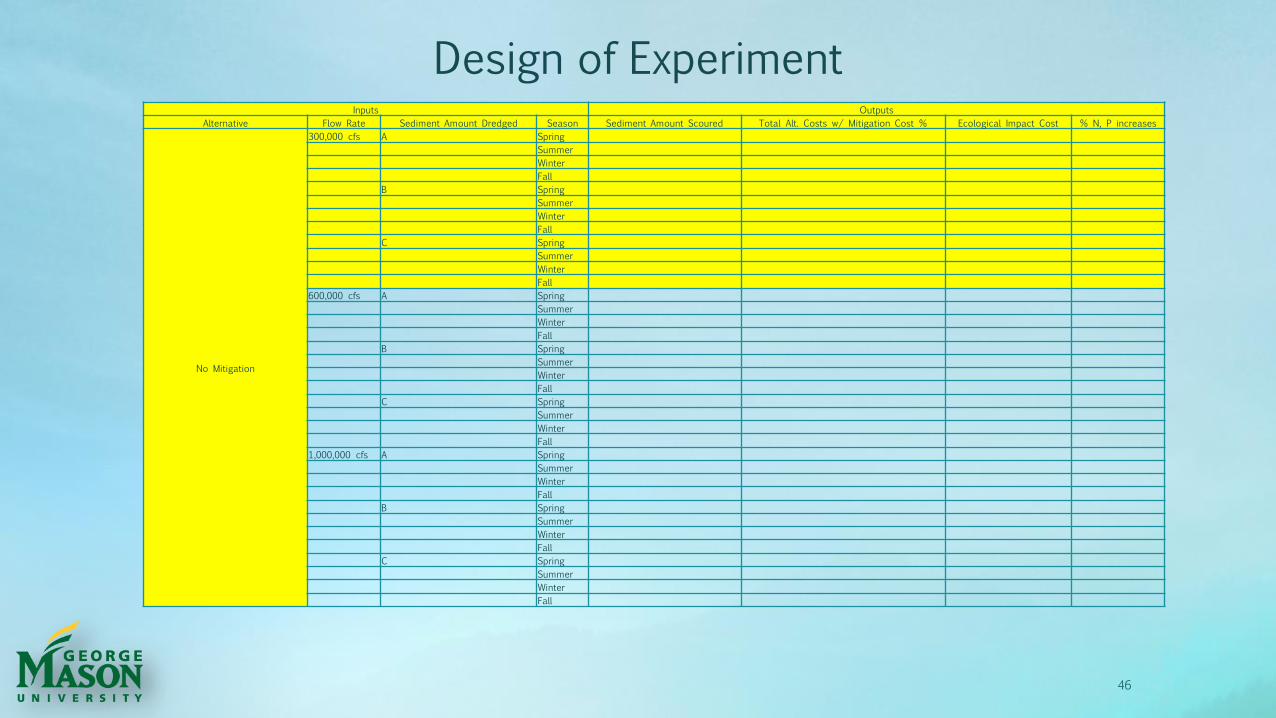
Design of Experiment Inputs Outputs
Alternative Flow Rate Sediment Amount Dredged Season Sediment Amount Scoured Total Alt. Costs w/ Mitigation Cost % Ecological Impact Cost % N, P increases
No Mitigation
300,000 cfs A Spring
Summer
Winter
Fall
B Spring
Summer
Winter
Fall
C Spring
Summer
Winter
Fall
600,000 cfs A Spring
Summer
Winter
Fall
B Spring
Summer
Winter
Fall
C Spring
Summer
Winter
Fall
1,000,000 cfs A Spring
Summer
Winter
Fall
B Spring
Summer
Winter
Fall
C Spring
Summer
Winter
Fall
Hydraulic Dredging
300,000 cfs A Spring
Summer
Winter
Fall
B Spring
Summer
Winter
Fall
C Spring
Summer
Winter
Fall
600,000 cfs A Spring
Summer
Winter
Fall
B Spring
Summer
Winter
Fall
C Spring
Summer
Winter
Fall
1,000,000 cfs A Spring
Summer
Winter
Fall
B Spring
Summer
Winter
Fall
C Spring
Summer
Winter
Fall
Dredging and Artificial Island
300,000 cfs A Spring
Summer
Winter
Fall
B Spring
Summer
Winter
Fall
C Spring
Summer
Winter
Fall
600,000 cfs A Spring
Summer
Winter
Fall
B Spring
Summer
Winter
Fall
C Spring
Summer
Winter
Fall
1,000,000 cfs A Spring
Summer
Winter
Fall
B Spring
Summer
Winter
Fall
C Spring
Summer
Winter
Fall
46
Inputs Outputs
Alternative Flow Rate Sediment Amount Dredged Season Sediment Amount Scoured Total Alt. Costs w/ Mitigation Cost % Ecological Impact Cost % N, P increases
No Mitigation
300,000 cfs A Spring
Summer
Winter
Fall
B Spring
Summer
Winter
Fall
C Spring
Summer
Winter
Fall
600,000 cfs A Spring
Summer
Winter
Fall
B Spring
Summer
Winter
Fall
C Spring
Summer
Winter
Fall
1,000,000 cfs A Spring
Summer
Winter
Fall
B Spring
Summer
Winter
Fall
C Spring
Summer
Winter
Fall
Design of Experiment
47
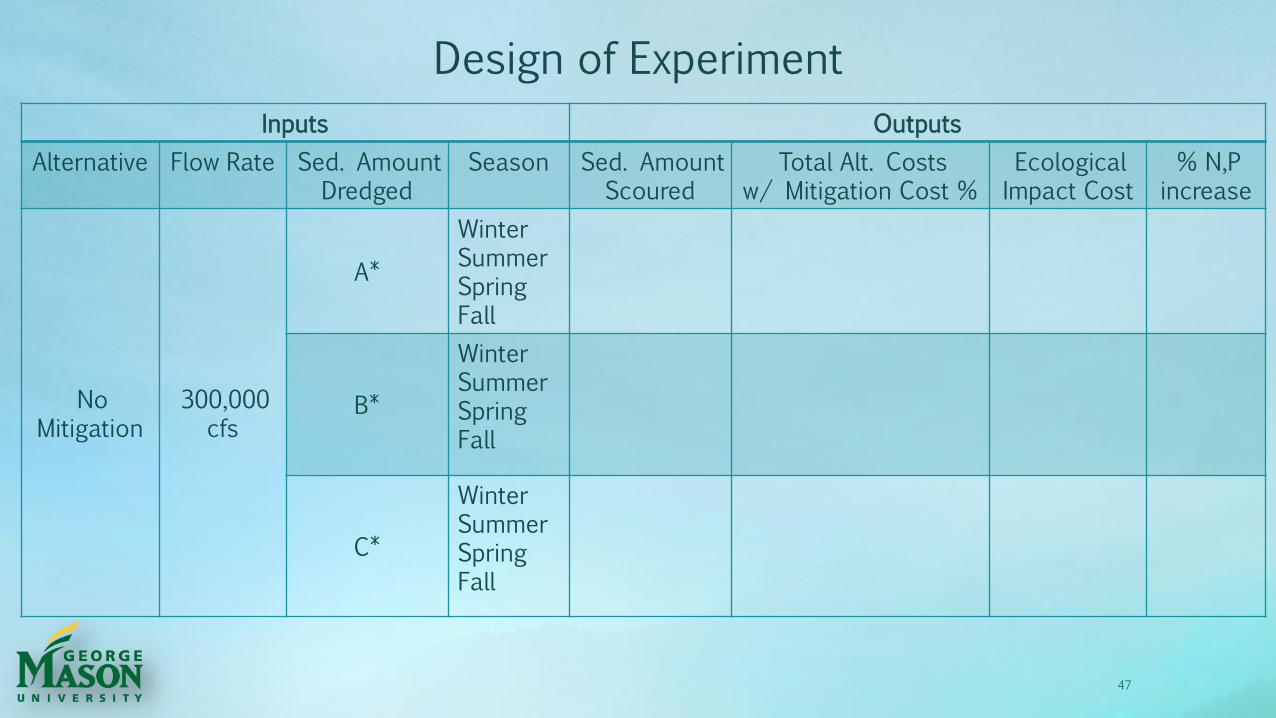
Design of Experiment
Inputs Outputs
Alternative Flow Rate Sed. Amount Dredged
Season Sed. Amount Scoured
Total Alt. Costs w/ Mitigation Cost %
Ecological Impact Cost
% N,P increase
No Mitigation
300,000 cfs
A*
Winter Summer Spring Fall
B*
Winter Summer Spring Fall
C*
Winter Summer Spring Fall
48
Minimize Ecological Impact
Sediment Deposition Potential
Sediment Scour Potential
Reliability
* All weights are TBD
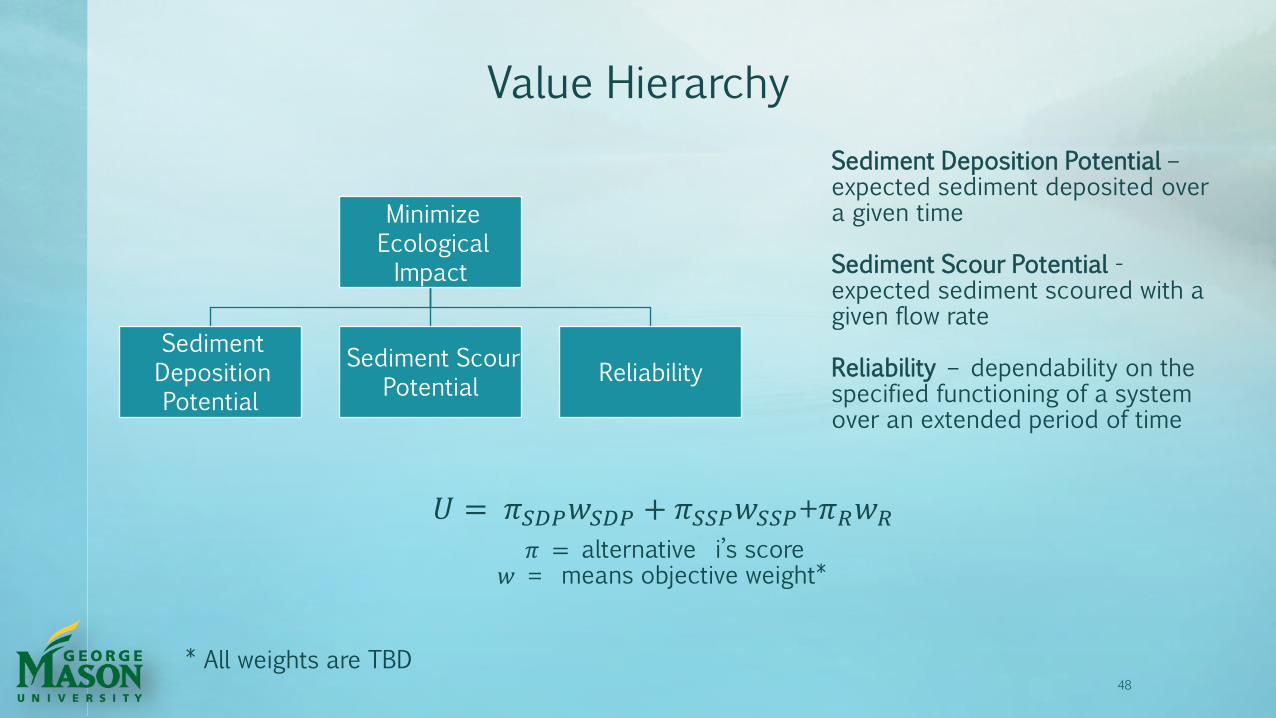
Value Hierarchy
Sediment Deposition Potential – expected sediment deposited over a given time Sediment Scour Potential - expected sediment scoured with a given flow rate Reliability – dependability on the specified functioning of a system over an extended period of time
𝑈 = 𝜋𝑆𝐷𝑃𝑤𝑆𝐷𝑃 + 𝜋𝑆𝑆𝑃𝑤𝑆𝑆𝑃+𝜋𝑅𝑤𝑅 𝜋 = alternative i’s score
𝑤 = means objective weight*

Agenda
• Context
• Stakeholders
• Problem/Need Statement
• Mission Requirements
• Design Alternatives
• Technical Approach
• Preliminary Results
• Project Management
49

1,000,000 = 3% cubic yards sediment dredged decrease in scour potential
75% = 25,000,000 set requirement percentage cubic yards to be removed
5,000,000 = 5*
optimal cubic yards years to satisfy requirement removed per year
50
Preliminary Analysis
*Assumes linear scour potential decrease. Does not factor in sediment redeposition.
Source: Estimations from LSRWA

1,000,000 = 6% cubic yards sediment dredged increase in deposition potential
51
Preliminary Analysis
*Based on annual deposition rate of 1,230,000 cubic yards per year from 1996-2008
Source: Estimations from LSRWA
1,000,000 cubic yards sediment removed
74,000 additional cubic yards deposited in one year
(6% of 1,310,000 cubic yards)
=
=
0.40% reservoir capacity decrease
0.03% reservoir capacity increase
after one year
0.37%* total capacity reservoir
decrease per year

Agenda
• Context
• Stakeholders
• Problem/Need Statement
• Mission Requirements
• Design Alternatives
• Technical Approach
• Preliminary Results
• Project Management
52

Work Breakdown Structure (WBS)
53

Project Schedule
54
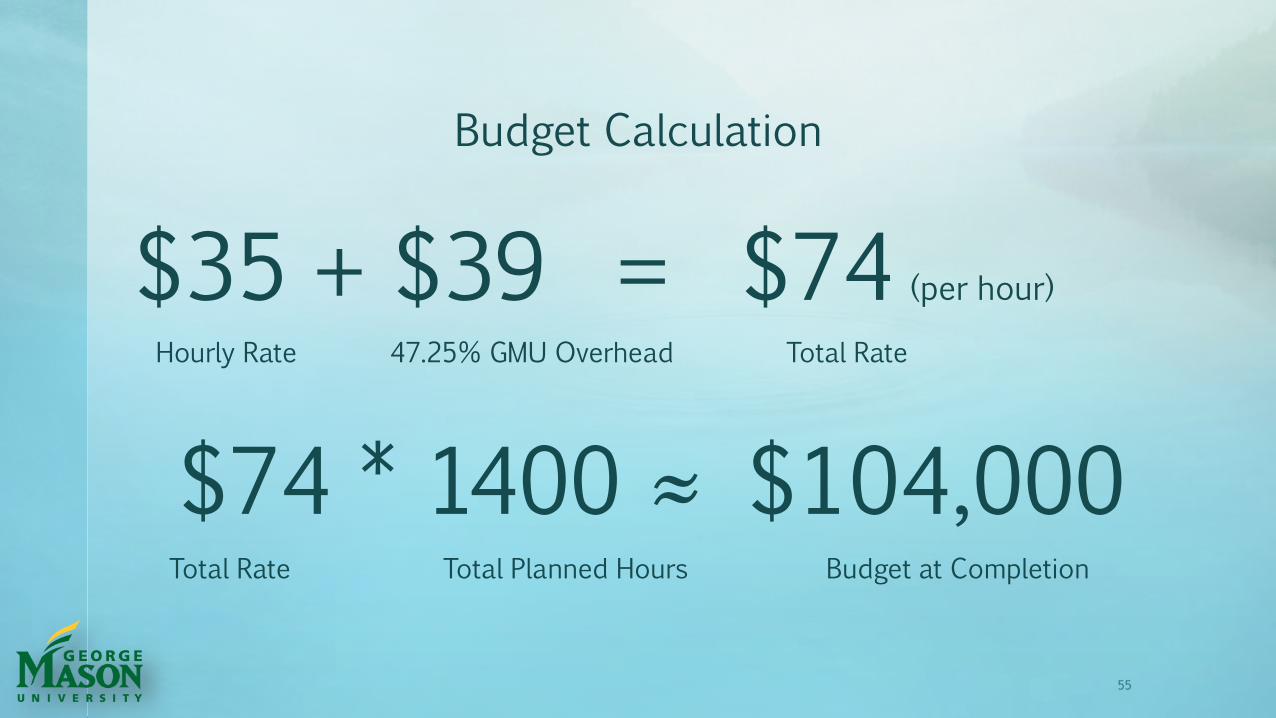
Budget Calculation
$35 + $39 = $74 (per hour)
Hourly Rate 47.25% GMU Overhead Total Rate
$74 * 1400 ≈ $104,000 Total Rate Total Planned Hours Budget at Completion
55
$0
$20,000
$40,000
$60,000
$80,000
$100,000
$120,000
1 2 3 4 5 6 7 8 9 10 11 12 13 14 15 16 17 18 19 20 21 22 23 24 25 26 27 28 29 30 31 32 33 34 35 36 37 38
Cost
Week
PV (10%) PV (50%) PV (90%) AC EV
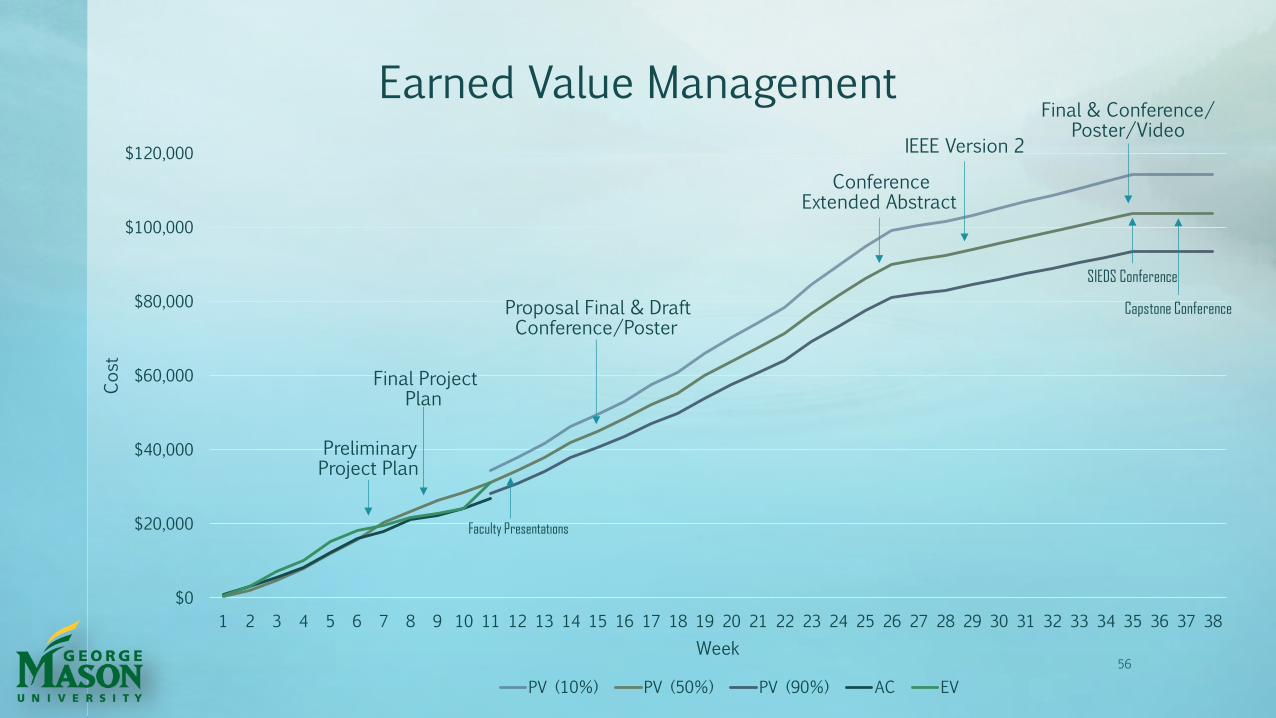
Earned Value Management
56
Preliminary Project Plan
Final Project Plan
Proposal Final & Draft Conference/Poster
SIEDS Conference
Capstone Conference
Faculty Presentations
Conference Extended Abstract
IEEE Version 2
Final & Conference/ Poster/Video
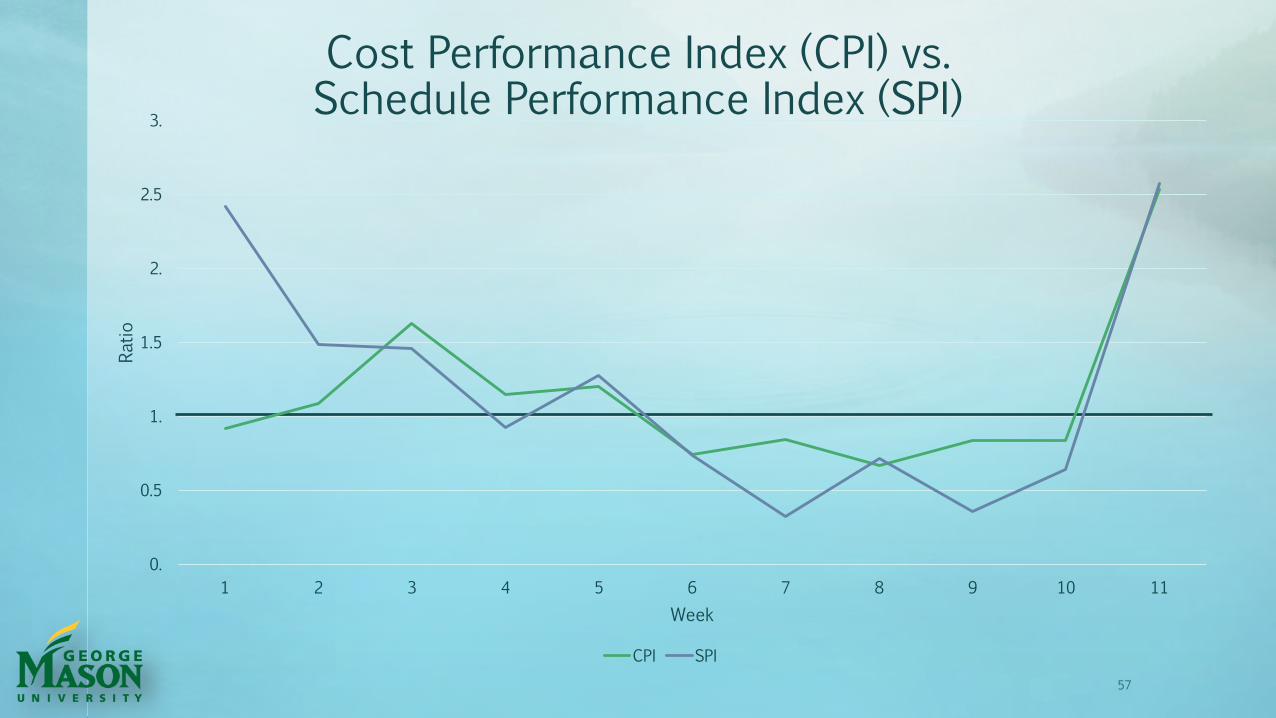
Cost Performance Index (CPI) vs. Schedule Performance Index (SPI)
57
0.
0.5
1.
1.5
2.
2.5
3.
1 2 3 4 5 6 7 8 9 10 11
Ratio
Week
CPI SPI
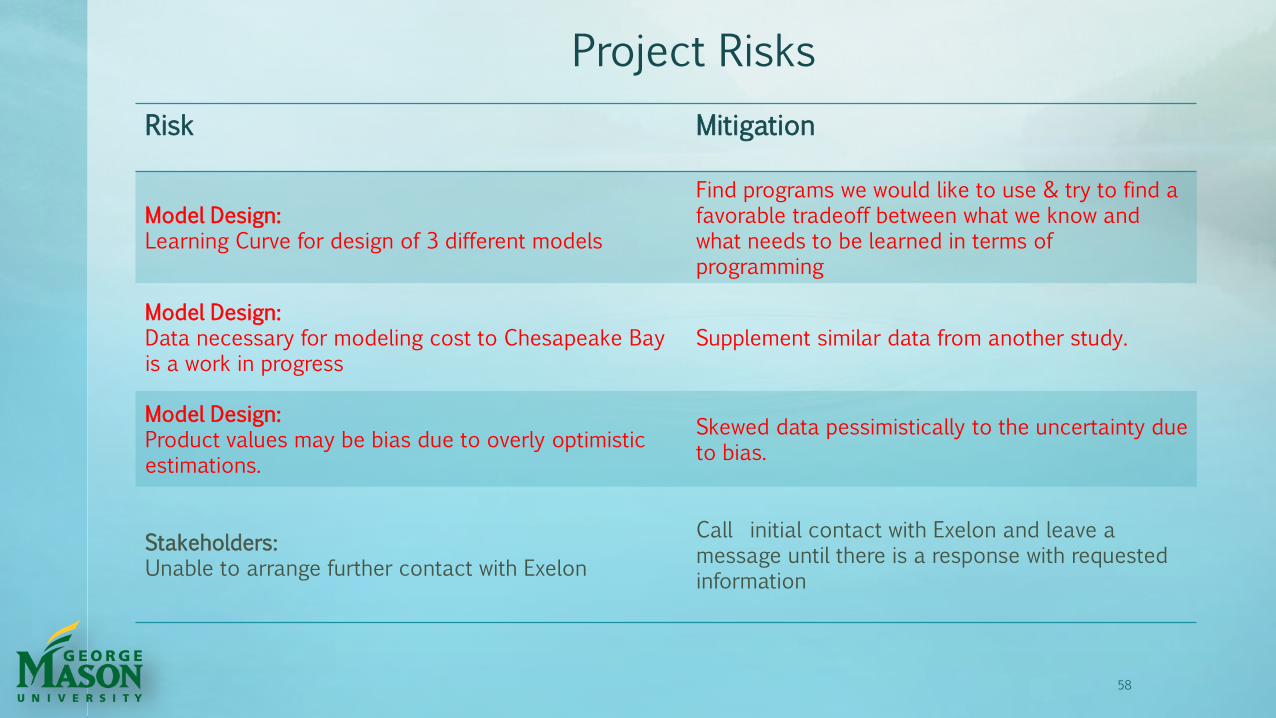
Risk Mitigation
Model Design: Learning Curve for design of 3 different models
Find programs we would like to use & try to find a favorable tradeoff between what we know and what needs to be learned in terms of programming
Model Design: Data necessary for modeling cost to Chesapeake Bay is a work in progress
Supplement similar data from another study.
Model Design: Product values may be bias due to overly optimistic estimations.
Skewed data pessimistically to the uncertainty due to bias.
Stakeholders: Unable to arrange further contact with Exelon
Call initial contact with Exelon and leave a message until there is a response with requested information
Project Risks
58

Questions?
59