depth of the oceans
DESCRIPTION
Paper explaining the viability of d18O variations as a proxy to indicate surface water temperature and salinity.TRANSCRIPT
7/21/2019 Depth of the oceans
http://slidepdf.com/reader/full/depth-of-the-oceans 1/17
Surface and subsurface seawater temperature reconstruction using
Mg/Ca microanalysis of planktonic foraminifera Globigerinoides ruber ,
Globigerinoides sacculifer , and Pulleniatina obliquiloculataAleksey Sadekov,1,2 Stephen M. Eggins,1 Patrick De Deckker,1 Ulysses Ninnemann,3
Wolfgang Kuhnt,4 and Franck Bassinot 5
Received 22 July 2008; revised 1 April 2009; accepted 17 April 2009; published 3 July 2009.
[1] Laser– ablation inductively coupled plasma– mass spectrometry microanalyses of Mg/Ca across individualfinal chambers of three planktonic foraminifera species, Globigerinoides ruber , G. sacculifer , and Pulleniatinaobliquiloculata, reveal significant interspecies differences in test Mg concentrations. Whereas these three specieshave similar Mg/Ca values at low sea surface temperatures (22C), they diverge markedly at high sea surfacetemperatures (29C). Explanations for these differences in species Mg/Ca values based on detailed comparisonof species intratest Mg/Ca distributions suggest that compositional variability within tests cannot account for theobserved deviation of species Mg/Ca values in warm-water equatorial regions. Multiple regression modelingand d 18O analysis of Globigerinoides sacculifer tests indicate that interspecies differences in Mg/Ca valuesresult from different depth habitats. The average Mg/Ca values of G. ruber final chambers reflect thetemperature of the surface mixed layer (0–25 m), whereas those of G. sacculifer and Pulleniatinaobliquiloculata correlate best with subsurface temperatures at 50–75 m and 100– 125 m water depths,respectively. Mg/Ca calibration to the temperatures at these depths reveals a similar temperature control on Mgtest composition in all species. Combining our results with Mg/Ca values from published culturing experiments,we derive a generalized equation for the effect of temperature and seawater salinity on foraminiferal Mg/Ca. Wealso show that the Mg/Ca composition of specific calcite layers within foraminiferal tests, including the low-Mg/Calayers of Globigerinoides ruber and G. sacculifer and the cortex layer of Pulleniatina obliquiloculata, correlateswith seawater temperature and can be used as an additional proxy for seawater temperature.
Citation: Sadekov, A., S. M. Eggins, P. De Deckker, U. Ninnemann, W. Kuhnt, and F. Bassinot (2009), Surface and subsurface
seawater temperature reconstruction using Mg/Ca microanalysis of planktonic foraminifera Globigerinoides ruber , Globigerinoides
sacculifer , and Pulleniatina obliquiloculata, Paleoceanography, 24, PA3201, doi:10.1029/2008PA001664.
1. Introduction
[2] Planktonic foraminifera Mg/Ca thermometry has beendeveloped as a powerful tool in paleoceanography toreconstruct past ocean temperatures [ Elderfield and Ganssen,2000; Lea, 2003]. A consistent increase in bulk foraminiferaltest Mg/Ca composition with seawater temperature (i.e.,9 ± 1% per C) has been observed for different plank-tonic foraminifer species obtained from deep-sea sediment core tops [ Rosenthal et al., 1997; Hastings et al., 1998;
Elderfield and Ganssen, 2000; Lea et al., 2000; Rosenthal et al., 2000; Dekens et al., 2002; Rosenthal and Lohmann,2002], plankton net and sediment trap samples [ Anand et
al., 2003; McKenna and Prell , 2004; McConnell and Thunell , 2005], and also laboratory culture experiments[ Nurnberg et al., 1996; Lea et al., 1999; Mashiotta et al.,1999]. However, while the exponential nature of thistemperature dependency is consistent with fundamentalthermodynamic considerations, the reasons for its muchgreater sensitivity to temperature compared to inorganically
precipitated calcite [ Mucci and Morse, 1983; Mucci, 1987; Nurnberg et al., 1996] and the very low Mg content of planktonic foraminiferal calcite, remain enigmatic. In viewof these differences, it has been suggested that Mg incor-
poration into planktonic foraminifer calcite is tightly con-trolled by biochemical processes [ Nurnberg et al., 1996;
Rosenthal et al., 1997; Lea et al., 1999]. These biochemical processes or so-called ‘‘vital effects’’ have been shown to bespecies-specific. For example, Dekens et al. [2002] foundGlobigerinoides ruber Mg/Ca compositions to be on average5–15% higher than those of G. sacculifer , and 49–55%higher than for Neogloboquadrina dutertrei taken from thesame temperature range in the tropics. A similar set of observations based on sediment trap samples led Anand et al. [2003] to develop separate Mg/Ca thermometer calibra-tions for different species of planktonic foraminifera.
PALEOCEANOGRAPHY, VOL. 24, PA3201, doi:10.1029/2008PA001664, 2009Click Here
for
Full Article
1Research School of Earth Sciences, Australian National University,Canberra, ACT, Australia.
2 Now at Grant Institute of GeoSciences, University of Edinburgh,Edinburgh, UK.
3Department of Earth Science, University of Bergen, Bergen, Norway.4Institut fur Geowissenschaften, Christian-Albrechts-Universitat zu
Kiel, Kiel, Germany.5Laboratoire des Sciences du Climat et de l’Environnement, IPSL,
CEA, CNRS, Gif-sur-Yvette, France.
Copyright 2009 by the American Geophysical Union.0883-8305/09/2008PA001664$12.00
PA3201 1 of 17
7/21/2019 Depth of the oceans
http://slidepdf.com/reader/full/depth-of-the-oceans 2/17
[3] Planktonic foraminifera migrate within the water
column during their life cycle and consequently, recordvarying calcification temperatures as they precipitate their calcite tests [ Fairbanks et al., 1982; Bijma and Hemleben,1994; Field , 2004; Kuroyanagi and Kawahata, 2004].Multiple opening-closing plankton net and oxygen isotopestudies indicate that different species prefer to inhabit differ-ent depth intervals within the water column [ Fairbanks and Wiebe, 1980; Fairbanks et al., 1982; Ravelo and Fairbanks,1992; Kuroyanagi and Kawahata, 2004]. These habitat depth
preferences may contribute to differences between species-specific Mg/Ca temperature calibrations. It also has beenshown in culturing experiments that some species precipi-tate a distinctive final layer of calcite prior to gametogenesis[ Be et al., 1977; Be , 1980; Caron et al., 1987, 1990]. In
nature this final ‘‘gametogenic’’ calcification event is be-lieved to occur in relatively deep water [ Be , 1980; Duplessyet al., 1981; Blanc and Be , 1981; Dekens et al., 2002]. If so,it may record a colder temperature signal characterized bylower Mg/Ca values. It follows that the extent to which thisgametogenic calcite is variably developed in different speciesmay bias their bulk test Mg/Ca compositions and alsoaccount for interspecies differences in Mg/Ca composition[ Dekens et al., 2002]. Resolving the influence of the ‘‘habitat depth’’ versus biochemical vital effects on the Mg/Ca com-
position of planktonic foraminifers, and its sensitivity totemperature, is required for accurate reconstruction of thewater column temperatures using Mg/Ca thermometry.
[4] Conventional application of Mg/Ca thermometry
relies on the bulk analysis of samples comprising 10–30foraminiferal tests of the same species [ Elderfield and Ganssen, 2000; Lea et al., 2000; Rosenthal et al., 2000;
Dekens et al., 2002; Anand et al., 2003; Barker et al., 2005].This approach averages the temperature signal recorded byindividual tests comprising the sample population. Bulk analyses cannot discriminate different temperature signalsincorporated at different habitat depths within individualtests. New microanalysis techniques, such as laser ablation– inductively coupled plasma–mass spectrometry (LA-ICP-MS),
provide the ability to investigate the nature of differences in
Mg/Ca composition by profiling Mg/Ca distribution across
individual test chambers [ Eggins et al., 2003; Reichart et al., 2003]. In this study, we have employed LA-ICP-MS todetermine and compare the Mg/Ca compositions of different test parts (chambers and wall layers) for three species of
planktonic foraminifera Globigerinoides ruber , G. saccu-lifer and Pulleniatina obliquiloculata, that were obtainedfrom the same core top samples. We explore the potentialfor using the Mg/Ca compositions of specific test layers as
proxies for seawater temperature. Our results provide in-sight into the nature of differences in Mg/Ca values in these
planktonic foraminiferal species and the extent to whichhabitat depth preferences versus biological vital effectsdetermine their Mg/Ca composition.
2. Materials and Methods
[5] The three species of planktonic foraminifera selectedfor this study have distinct habitat depths within the water column. Globigerinoides ruber and G. sacculifer are spinose,symbiont-bearing species which inhabit surface (0–50 m)and subsurface (20–75 m) waters, respectively [ Fairbanks et al., 1980; Erez and Honjo, 1981; Hemleben et al., 1989;
Ravelo and Fairbanks, 1992]. The life cycle of Pulleniatinaobliquiloculata is less constrained but this species has beenreported to spend its early ontogenetic stage in the mixedlayer and to later migrate to greater depths where it adds adistinctive final outer calcite layer called the ‘‘cortex’’ [ Erez
and Honjo, 1981; Hemleben et al., 1989; Ravelo and Fairbanks, 1992]. Oxygen isotope studies indicate calcifi-cation depths for these species of 0–50 m for Globiger-inoides ruber , 0–75 m for G. sacculifer , and 60–150 mfor Pulleniatina obliquiloculata [ Erez and Honjo, 1981;
Fairbanks et al., 1982; Ravelo and Fairbanks, 1992; Speroet al., 2003; Field , 2004; Kuroyanagi and Kawahata,2004; Cleroux et al., 2007; Huang et al., 2008].
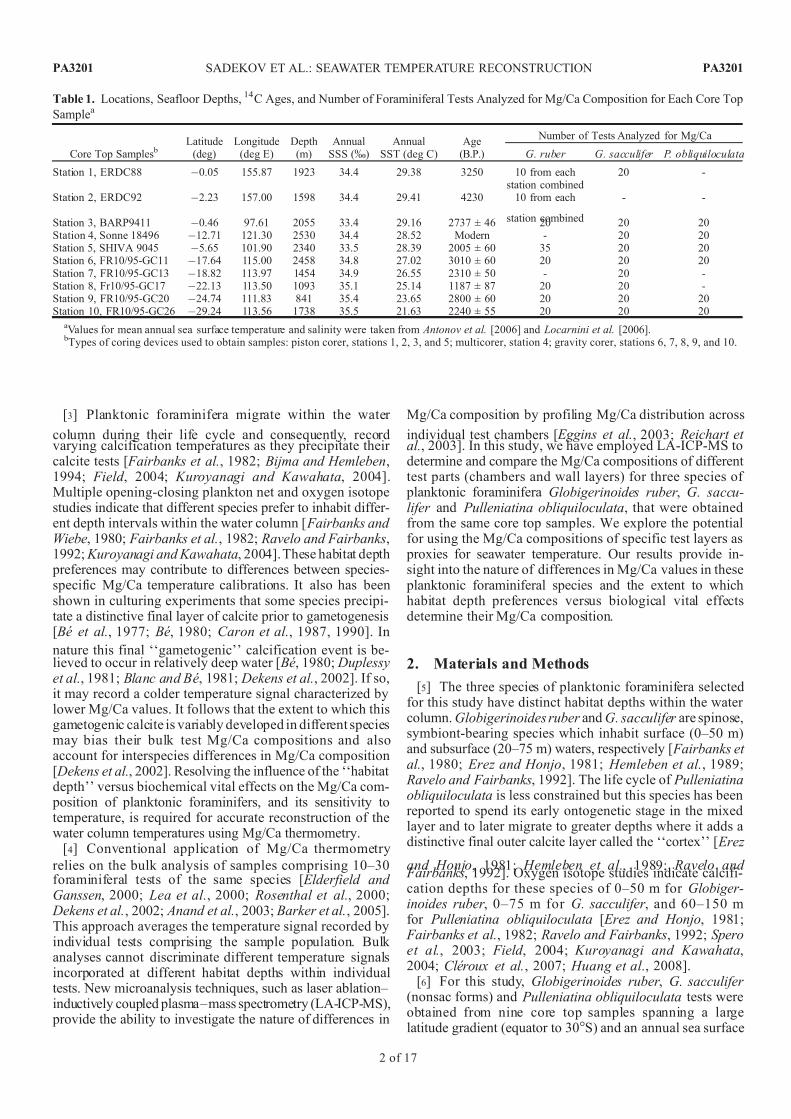
[6] For this study, Globigerinoides ruber , G. sacculifer (nonsac forms) and Pulleniatina obliquiloculata tests wereobtained from nine core top samples spanning a largelatitude gradient (equator to 30S) and an annual sea surface
Table 1. Locations, Seafloor Depths, 14C Ages, and Number of Foraminiferal Tests Analyzed for Mg/Ca Composition for Each Core Top
Samplea
Core Top Samples bLatitude
(deg)Longitude
(deg E)Depth
(m)Annual
SSS (%)Annual
SST (deg C)Age
(B.P.)
Number of Tests Analyzed for Mg/Ca
G. ruber G. sacculifer P. obliquiloculata
Station 1, ERDC88 0.05 155.87 1923 34.4 29.38 3250 10 from eachstation combined
20 -
Station 2, ERDC92 2.23 157.00 1598 34.4 29.41 4230 10 from each
station combined
- -
Station 3, BARP9411 0.46 97.61 2055 33.4 29.16 2737 ± 46 20 20 20Station 4, Sonne 18496 12.71 121.30 2530 34.4 28.52 Modern - 20 20Station 5, SHIVA 9045 5.65 101.90 2340 33.5 28.39 2005 ± 60 35 20 20Station 6, FR10/95-GC11 17.64 115.00 2458 34.8 27.02 3010 ± 60 20 20 20Station 7, FR10/95-GC13 18.82 113.97 1454 34.9 26.55 2310 ± 50 - 20 -Station 8, Fr10/95-GC17 22.13 113.50 1093 35.1 25.14 1187 ± 87 20 20 -Station 9, FR10/95-GC20 24.74 111.83 841 35.4 23.65 2800 ± 60 20 20 20Station 10, FR10/95-GC26 29.24 113.56 1738 35.5 21.63 2240 ± 55 20 20 20
a Values for mean annual sea surface temperature and salinity were taken from Antonov et al. [2006] and Locarnini et al. [2006]. bTypes of coring devices used to obtain samples: piston corer, stations 1, 2, 3, and 5; multicorer, station 4; gravity corer, stations 6, 7, 8, 9, and 10.
PA3201 SADEKOV ET AL.: SEAWATER TEMPERATURE RECONSTRUCTION
2 of 17
PA3201
7/21/2019 Depth of the oceans
http://slidepdf.com/reader/full/depth-of-the-oceans 3/17
temperature range (from 21.8C to 29.4C [ Locarnini et al.,2006] (see Table 1)). These samples correspond to a range
of upper water column structures, varying from a stronglystratified, shallow thermocline at the equator to a muchthicker, mixed surface layer off the southwestern margin of Australia. All core top samples are located well abovecalcite lysocline in this region [ Peterson and Prell , 1985]and contained well-preserved foraminiferal tests.
[7] Mg/Ca profiles were measured only in the finalchambers of G. ruber , G. sacculifer and P. obliquiloculatatests. This strategy reflects laboratory studies that report
planktonic foraminifera form new chambers every 1 – 3 days[ Be et al., 1977; Caron et al., 1987; Spero, 1988; Spero and
Lea, 1993; Lea et al., 1999] and continue to add calcitelayers to preexisting chambers. Consequently, the final
chamber is likely to display the fewest layers and least Mg/Ca variation because of migration through the water column. Sample preparation and LA-ICP-MS analyses werecarried out according to procedures described in previouswork [Sadekov et al., 2006]. Table 1 summarizes thenumber of analyzed tests of each species.
[8] The depth resolution of LA-ICP-MS profile analyseswas optimized by ablating excised final chambers of G.ruber and G. sacculifer tests from the inside to the outsidesurface. Because of their smooth surface topography, thefinal chambers of P. obliquiloculata were ablated from the
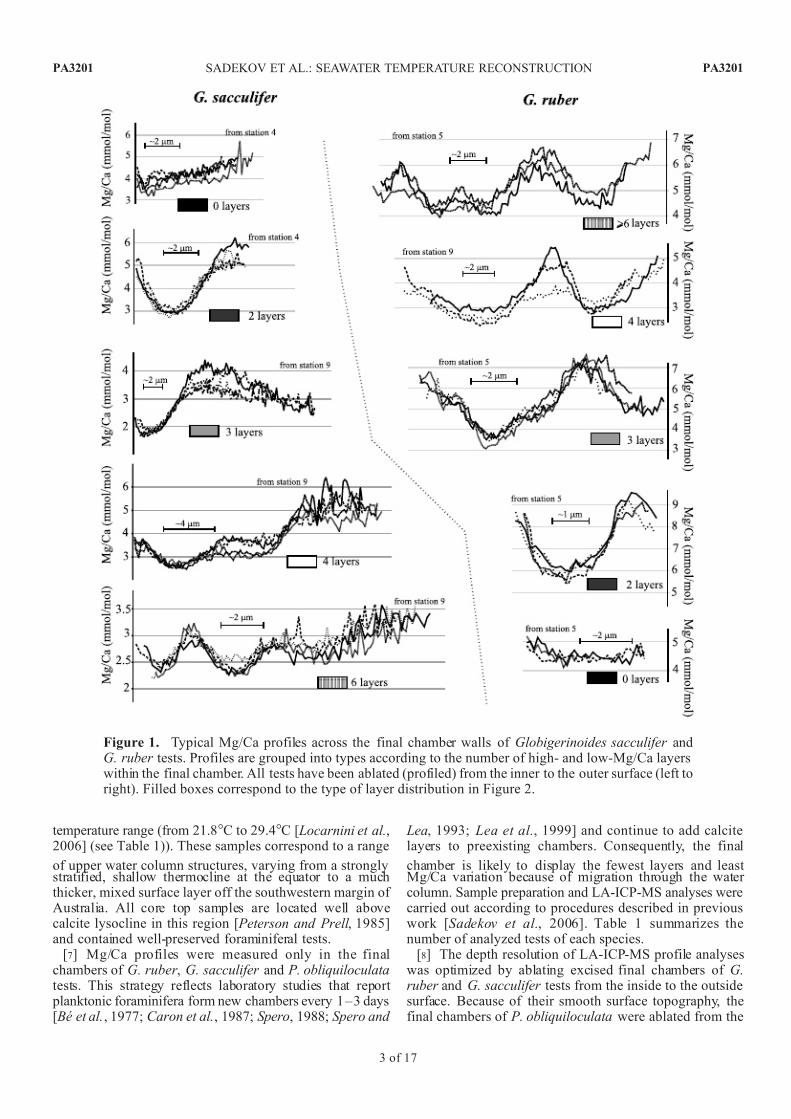
Figure 1. Typical Mg/Ca profiles across the final chamber walls of Globigerinoides sacculifer andG. ruber tests. Profiles are grouped into types according to the number of high- and low-Mg/Ca layerswithin the final chamber. All tests have been ablated (profiled) from the inner to the outer surface (left toright). Filled boxes correspond to the type of layer distribution in Figure 2.
PA3201 SADEKOV ET AL.: SEAWATER TEMPERATURE RECONSTRUCTION
3 of 17
PA3201
7/21/2019 Depth of the oceans
http://slidepdf.com/reader/full/depth-of-the-oceans 4/17
outside to inside surface. After LA-ICP-MS analysis, test fragments from the final chambers of G. sacculifer were
removed from the carbon tape and cleaned in methanol prior to d 18O isotope analysis. These isotopic measurements werecarried out at the stable isotope laboratory at Department of Earth Sciences, University of Bergen using a Finnigan MAT253 mass spectrometer coupled to an automated Kielcarbonate preparation device. The in-house standard mea-sured with the samples was Carrera Marble (CM03). Theisotopic values are calibrated to VPDB using NBS-19 and
NBS-18. The long-term analytical precision (1 sigma) of theworking standards over a time interval of several months isequal to or better than 0.1%.
[9] To ensure the recent origin (i.e., late Holocene) of thestudied material, ages of the core top samples (Table 1) wereestablished with 14C dating at the Poznan Radiocarbon
Laboratory, Poland, and at the Australian Nuclear Scienceand Technology Organisation (ANSTO) [ Fink et al., 2004;Olley et al., 2004]. The CALIB5.0 program was used tocalibrate d 14C dates into calendar ages. The age of the coretop sample from the Ontong Java Plateau was taken from
Berger et al. [1987].
3. Results and Discussion
3.1. Comparison of Mg/Ca Variation Within G. ruber ,G. sacculifer , and P. obliquiloculata
[10] G. ruber and G. sacculifer show very similar patternsof Mg/Ca variation (Figure 1), that are characterized byalternating layers with relatively low and high Mg/Ca ratio
values. These layers are typically between 1 and 6 mm thick,and the number of layers varies from specimen to specimenand tends to increase with test wall thickness. G. ruber typically has thinner tests and most (50–95%) final cham-
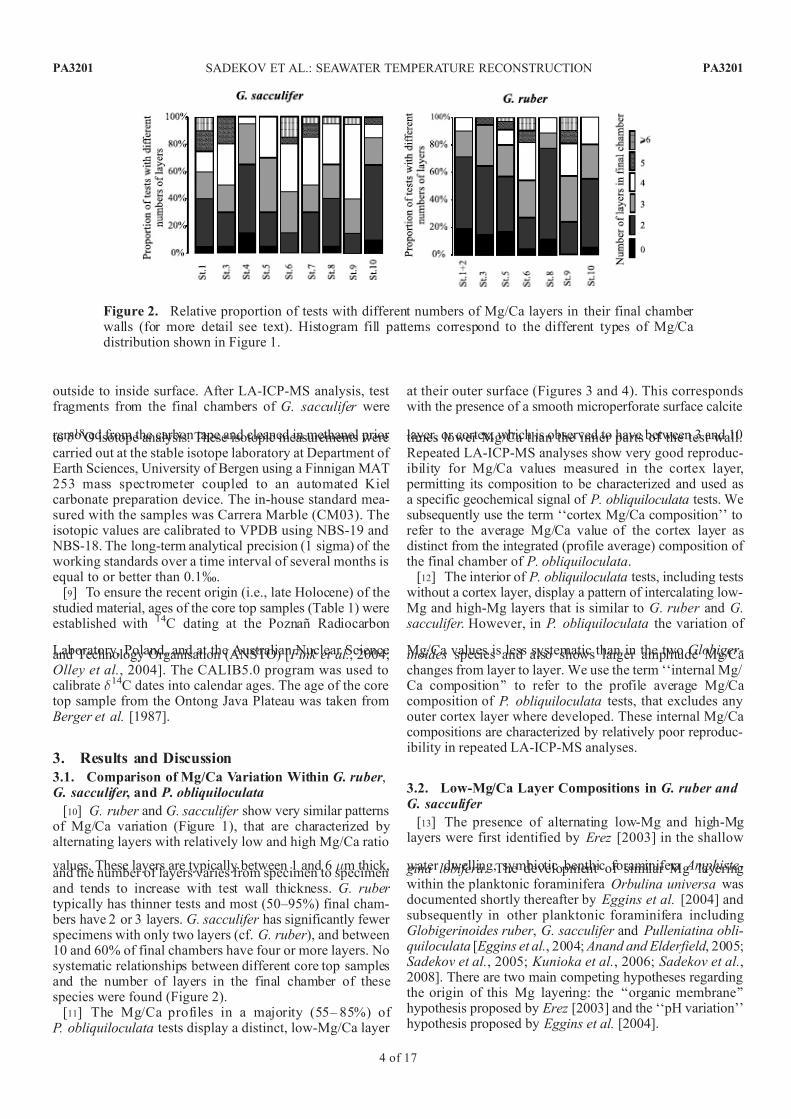
bers have 2 or 3 layers. G. sacculifer has significantly fewer specimens with only two layers (cf. G. ruber ), and between10 and 60% of final chambers have four or more layers. Nosystematic relationships between different core top samplesand the number of layers in the final chamber of thesespecies were found (Figure 2).
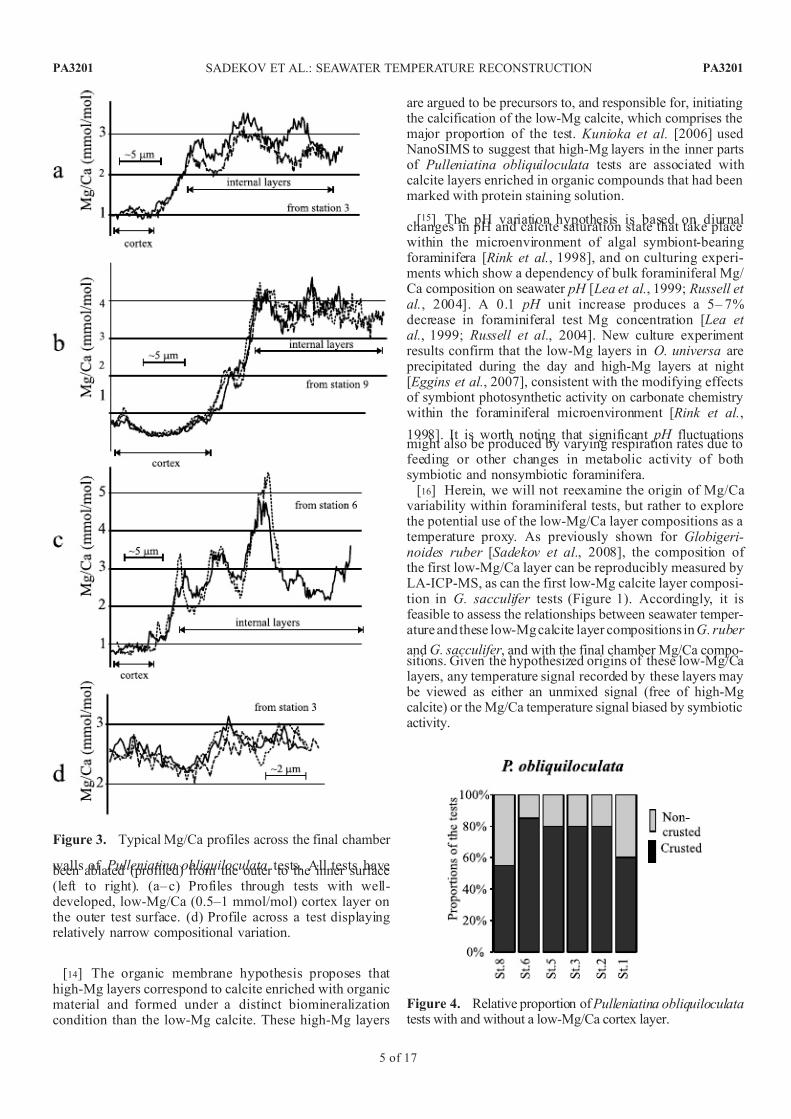
[11] The Mg/Ca profiles in a majority (55– 85%) of P. obliquiloculata tests display a distinct, low-Mg/Ca layer
at their outer surface (Figures 3 and 4). This correspondswith the presence of a smooth microperforate surface calcite
layer, or cortex, which is observed to have between 3 and 10times lower Mg/Ca than the inner parts of the test wall.Repeated LA-ICP-MS analyses show very good reproduc-ibility for Mg/Ca values measured in the cortex layer,
permitting its composition to be characterized and used asa specific geochemical signal of P. obliquiloculata tests. Wesubsequently use the term ‘‘cortex Mg/Ca composition’’ torefer to the average Mg/Ca value of the cortex layer asdistinct from the integrated (profile average) composition of the final chamber of P. obliquiloculata.
[12] The interior of P. obliquiloculata tests, including testswithout a cortex layer, display a pattern of intercalating low-Mg and high-Mg layers that is similar to G. ruber and G.
sacculifer . However, in P. obliquiloculata the variation of
Mg/Ca values is less systematic than in the two Globiger-inoides species and also shows larger amplitude Mg/Cachanges from layer to layer. We use the term ‘‘internal Mg/ Ca composition’’ to refer to the profile average Mg/Cacomposition of P. obliquiloculata tests, that excludes anyouter cortex layer where developed. These internal Mg/Cacompositions are characterized by relatively poor reproduc-ibility in repeated LA-ICP-MS analyses.
3.2. Low-Mg/Ca Layer Compositions in G. ruber and G. sacculifer
[13] The presence of alternating low-Mg and high-Mglayers were first identified by Erez [2003] in the shallow
water dwelling, symbiotic benthic foraminifera Amphiste- gina lobifera. The development of similar Mg layeringwithin the planktonic foraminifera Orbulina universa wasdocumented shortly thereafter by Eggins et al. [2004] andsubsequently in other planktonic foraminifera includingGlobigerinoides ruber , G. sacculifer and Pulleniatina obli-quiloculata [ Eggins et al., 2004; Anand and Elderfield , 2005;Sadekov et al., 2005; Kunioka et al., 2006; Sadekov et al.,2008]. There are two main competing hypotheses regardingthe origin of this Mg layering: the ‘‘organic membrane’’hypothesis proposed by Erez [2003] and the ‘‘pH variation’’hypothesis proposed by Eggins et al. [2004].
Figure 2. Relative proportion of tests with different numbers of Mg/Ca layers in their final chamber walls (for more detail see text). Histogram fill patterns correspond to the different types of Mg/Cadistribution shown in Figure 1.
PA3201 SADEKOV ET AL.: SEAWATER TEMPERATURE RECONSTRUCTION
4 of 17
PA3201
7/21/2019 Depth of the oceans
http://slidepdf.com/reader/full/depth-of-the-oceans 5/17
[14] The organic membrane hypothesis proposes that high-Mg layers correspond to calcite enriched with organicmaterial and formed under a distinct biomineralizationcondition than the low-Mg calcite. These high-Mg layers
are argued to be precursors to, and responsible for, initiatingthe calcification of the low-Mg calcite, which comprises themajor proportion of the test. Kunioka et al. [2006] used
NanoSIMS to suggest that high-Mg layers in the inner partsof Pulleniatina obliquiloculata tests are associated withcalcite layers enriched in organic compounds that had beenmarked with protein staining solution.
[15] The pH variation hypothesis is based on diurnalchanges in pH and calcite saturation state that take placewithin the microenvironment of algal symbiont-bearingforaminifera [ Rink et al., 1998], and on culturing experi-ments which show a dependency of bulk foraminiferal Mg/ Ca composition on seawater pH [ Lea et al., 1999; Russell et al., 2004]. A 0.1 pH unit increase produces a 5– 7%decrease in foraminiferal test Mg concentration [ Lea et al., 1999; Russell et al., 2004]. New culture experiment results confirm that the low-Mg layers in O. universa are
precipitated during the day and high-Mg layers at night [ Eggins et al., 2007], consistent with the modifying effectsof symbiont photosynthetic activity on carbonate chemistrywithin the foraminiferal microenvironment [ Rink et al.,
1998]. It is worth noting that significant pH fluctuationsmight also be produced by varying respiration rates due tofeeding or other changes in metabolic activity of bothsymbiotic and nonsymbiotic foraminifera.
[16] Herein, we will not reexamine the origin of Mg/Cavariability within foraminiferal tests, but rather to explorethe potential use of the low-Mg/Ca layer compositions as atemperature proxy. As previously shown for Globigeri-noides ruber [Sadekov et al., 2008], the composition of the first low-Mg/Ca layer can be reproducibly measured byLA-ICP-MS, as can the first low-Mg calcite layer composi-tion in G. sacculifer tests (Figure 1). Accordingly, it isfeasible to assess the relationships between seawater temper-ature and these low-Mg calcite layer compositions in G. ruber
and G. sacculifer , and with the final chamber Mg/Ca compo-sitions. Given the hypothesized origins of these low-Mg/Calayers, any temperature signal recorded by these layers may
be viewed as either an unmixed signal (free of high-Mgcalcite) or the Mg/Ca temperature signal biased by symbioticactivity.
Figure 3. Typical Mg/Ca profiles across the final chamber
walls of Pulleniatina obliquiloculata tests. All tests have been ablated (profiled) from the outer to the inner surface(left to right). (a– c) Profiles through tests with well-developed, low-Mg/Ca (0.5–1 mmol/mol) cortex layer onthe outer test surface. (d) Profile across a test displayingrelatively narrow compositional variation.
Figure 4. Relative proportion of Pulleniatina obliquiloculatatests with and without a low-Mg/Ca cortex layer.
PA3201 SADEKOV ET AL.: SEAWATER TEMPERATURE RECONSTRUCTION
5 of 17
PA3201
7/21/2019 Depth of the oceans
http://slidepdf.com/reader/full/depth-of-the-oceans 6/17
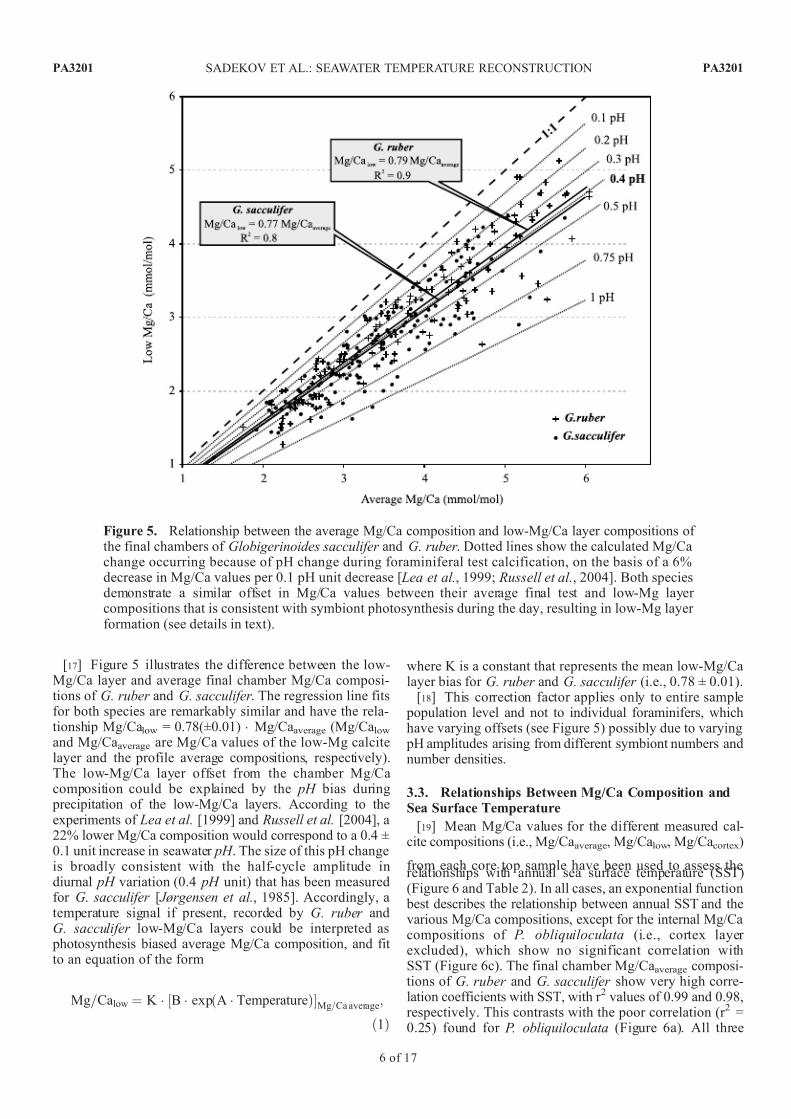
[17] Figure 5 illustrates the difference between the low-Mg/Ca layer and average final chamber Mg/Ca composi-tions of G. ruber and G. sacculifer . The regression line fitsfor both species are remarkably similar and have the rela-tionship Mg/Calow = 0.78(±0.01) Mg/Caaverage (Mg/Calowand Mg/Caaverage are Mg/Ca values of the low-Mg calcitelayer and the profile average compositions, respectively).The low-Mg/Ca layer offset from the chamber Mg/Cacomposition could be explained by the pH bias during
precipitation of the low-Mg/Ca layers. According to theexperiments of Lea et al. [1999] and Russell et al. [2004], a22% lower Mg/Ca composition would correspond to a 0.4 ±0.1 unit increase in seawater pH . The size of this pH changeis broadly consistent with the half-cycle amplitude indiurnal pH variation (0.4 pH unit) that has been measuredfor G. sacculifer [ Jørgensen et al., 1985]. Accordingly, atemperature signal if present, recorded by G. ruber andG. sacculifer low-Mg/Ca layers could be interpreted as
photosynthesis biased average Mg/Ca composition, and fit to an equation of the form
Mg=Calow ¼ K B exp A Temperatureð Þ½ Mg=Ca average;
ð1Þ
where K is a constant that represents the mean low-Mg/Calayer bias for G. ruber and G. sacculifer (i.e., 0.78 ± 0.01).
[18] This correction factor applies only to entire sample population level and not to individual foraminifers, whichhave varying offsets (see Figure 5) possibly due to varying
pH amplitudes arising from different symbiont numbers andnumber densities.
3.3. Relationships Between Mg/Ca Composition andSea Surface Temperature
[19] Mean Mg/Ca values for the different measured cal-cite compositions (i.e., Mg/Caaverage, Mg/Calow, Mg/Cacortex)
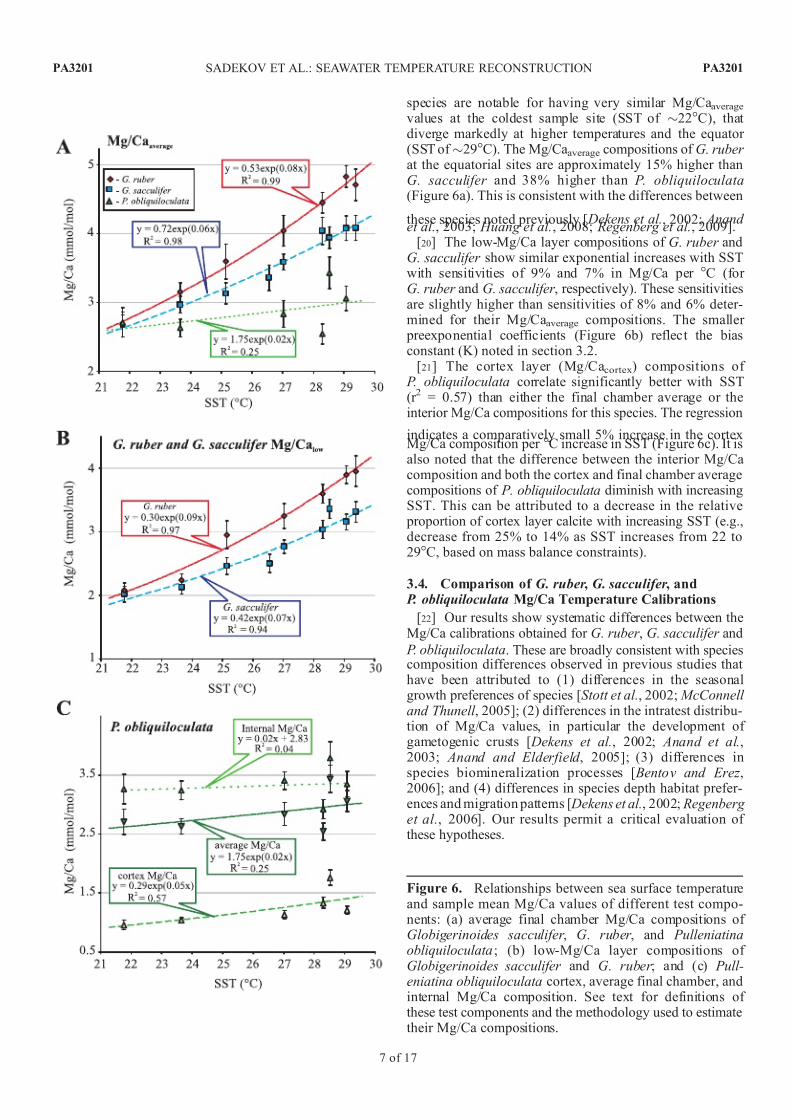
from each core top sample have been used to assess therelationships with annual sea surface temperature (SST)(Figure 6 and Table 2). In all cases, an exponential function
best describes the relationship between annual SST and thevarious Mg/Ca compositions, except for the internal Mg/Cacompositions of P. obliquiloculata (i.e., cortex layer excluded), which show no significant correlation withSST (Figure 6c). The final chamber Mg/Caaverage composi-tions of G. ruber and G. sacculifer show very high corre-lation coefficients with SST, with r 2 values of 0.99 and 0.98,respectively. This contrasts with the poor correlation (r 2 =0.25) found for P. obliquiloculata (Figure 6a). All three
Figure 5. Relationship between the average Mg/Ca composition and low-Mg/Ca layer compositions of the final chambers of Globigerinoides sacculifer and G. ruber . Dotted lines show the calculated Mg/Cachange occurring because of pH change during foraminiferal test calcification, on the basis of a 6%decrease in Mg/Ca values per 0.1 pH unit decrease [ Lea et al., 1999; Russell et al., 2004]. Both speciesdemonstrate a similar offset in Mg/Ca values between their average final test and low-Mg layer compositions that is consistent with symbiont photosynthesis during the day, resulting in low-Mg layer formation (see details in text).
PA3201 SADEKOV ET AL.: SEAWATER TEMPERATURE RECONSTRUCTION
6 of 17
PA3201
7/21/2019 Depth of the oceans
http://slidepdf.com/reader/full/depth-of-the-oceans 7/17
species are notable for having very similar Mg/Caaveragevalues at the coldest sample site (SST of 22C), that diverge markedly at higher temperatures and the equator (SST of 29C). The Mg/Caaverage compositions of G. ruber at the equatorial sites are approximately 15% higher thanG. sacculifer and 38% higher than P. obliquiloculata(Figure 6a). This is consistent with the differences between
these species noted previously [ Dekens et al., 2002; Anand et al., 2003; Huang et al., 2008; Regenberg et al., 2009].
[20] The low-Mg/Ca layer compositions of G. ruber andG. sacculifer show similar exponential increases with SSTwith sensitivities of 9% and 7% in Mg/Ca per C (for G. ruber and G. sacculifer , respectively). These sensitivitiesare slightly higher than sensitivities of 8% and 6% deter-mined for their Mg/Caaverage compositions. The smaller
preexponential coefficients (Figure 6b) reflect the biasconstant (K) noted in section 3.2.
[21] The cortex layer (Mg/Cacortex) compositions of P. obliquiloculata correlate significantly better with SST(r 2 = 0.57) than either the final chamber average or theinterior Mg/Ca compositions for this species. The regression
indicates a comparatively small 5% increase in the cortexMg/Ca composition per C increase in SST (Figure 6c). It isalso noted that the difference between the interior Mg/Cacomposition and both the cortex and final chamber averagecompositions of P. obliquiloculata diminish with increasingSST. This can be attributed to a decrease in the relative
proportion of cortex layer calcite with increasing SST (e.g.,decrease from 25% to 14% as SST increases from 22 to29C, based on mass balance constraints).
3.4. Comparison of G. ruber , G. sacculifer , and P. obliquiloculata Mg/Ca Temperature Calibrations
[22] Our results show systematic differences between theMg/Ca calibrations obtained for G. ruber , G. sacculifer and
P. obliquiloculata. These are broadly consistent with speciescomposition differences observed in previous studies that have been attributed to (1) differences in the seasonalgrowth preferences of species [Stott et al., 2002; McConnell and Thunell , 2005]; (2) differences in the intratest distribu-tion of Mg/Ca values, in particular the development of gametogenic crusts [ Dekens et al., 2002; Anand et al.,2003; Anand and Elderfield , 2005]; (3) differences inspecies biomineralization processes [ Bentov and Erez ,2006]; and (4) differences in species depth habitat prefer-ences and migration patterns [ Dekens et al., 2002; Regenberg et al., 2006]. Our results permit a critical evaluation of these hypotheses.
Figure 6. Relationships between sea surface temperatureand sample mean Mg/Ca values of different test compo-nents: (a) average final chamber Mg/Ca compositions of Globigerinoides sacculifer , G. ruber , and Pulleniatinaobliquiloculata ; (b) low-Mg/Ca layer compositions of Globigerinoides sacculifer and G. ruber ; and (c) Pull-eniatina obliquiloculata cortex, average final chamber, andinternal Mg/Ca composition. See text for definitions of these test components and the methodology used to estimatetheir Mg/Ca compositions.
PA3201 SADEKOV ET AL.: SEAWATER TEMPERATURE RECONSTRUCTION
7 of 17
PA3201
7/21/2019 Depth of the oceans
http://slidepdf.com/reader/full/depth-of-the-oceans 8/17
3.4.1. Seasonal Species Preferences[23] The largest differences between the Mg/Ca compo-
sitions of G. ruber , G. sacculifer and P. obliquiloculata areobserved in samples from equatorial regions which have the
highest SSTs (Figure 6). Calcification temperatures estimat-ed from the average Mg/Ca values for the equatorial coret o p samp les ar e 2 8.2C f o r G. ruber , 2 6. 3C f o r G. sacculifer on the basis of Dekens et al.’s [2002] ther-mometer calibrations, and 24.0C for P. obliquiloculata (onthe basis of Anand et al.’s [2003] thermometer calibration).These differences in calcification temperatures wouldrequire the seasonal SST variation to be 1.9–4.2C, whichis significantly larger than the seasonal ranges in the equato-rial Indo-Pacific region (i.e., less than 1.5C) [ Locarnini et al., 2006]. Importantly, time series sediment trap studies fromthe equatorial Pacific show that G. ruber , G. sacculifer and P. obliquiloculata have similar seasonal preferences,with peaks in abundances during August–September and
December– January [ Kuroyanagi et al., 2002]. Seasonal preferences are therefore an unlikely explanation for theobserved compositional differences between these species.3.4.2. Species Differences in Intratest Mg/CaDistribution
[24] Species-specific differences in Mg/Ca distributionwithin tests, in particular the occurrence of a calcite crust layer precipitated in deeper parts of the water column, is acommonly suggested explanation for interspecific differ-ences in bulk test Mg/Ca compositions [ Dekens et al., 2002;
Regenberg et al., 2006]. For example, the presence of theencrusting cortex layer with low Mg/Ca values in
P. obliquiloculata tests can explain the relatively lowaverage test Mg/Ca values of this species. However, to
account for the differences between the Mg/Ca thermometer calibrations of P. obliquiloculata and the other species, the
proportional contribution of the encrusting cortex layer tothe chamber wall composition should increase with increas-ing water temperature. This is the reverse of what isobserved, that is, a decreasing contribution with increasingSST (Figure 6c; see also section 3.3).
[25] It is difficult to explain the observed deviation between the temperature calibrations of G. ruber andG. sacculifer at high temperatures given their similar chamber wall Mg/Ca profile characteristics (Figure 1). Nodistinctive low-Mg/Ca encrusting layer is observed in either
G. sacculifer or G. ruber that could otherwise account for the differences in the Mg/Caaverage temperature calibrations
between these species. However, it is possible that a subtledifference occurs in the relative proportion (or thickness) of low-Mg and high-Mg calcite layers within G. ruber and
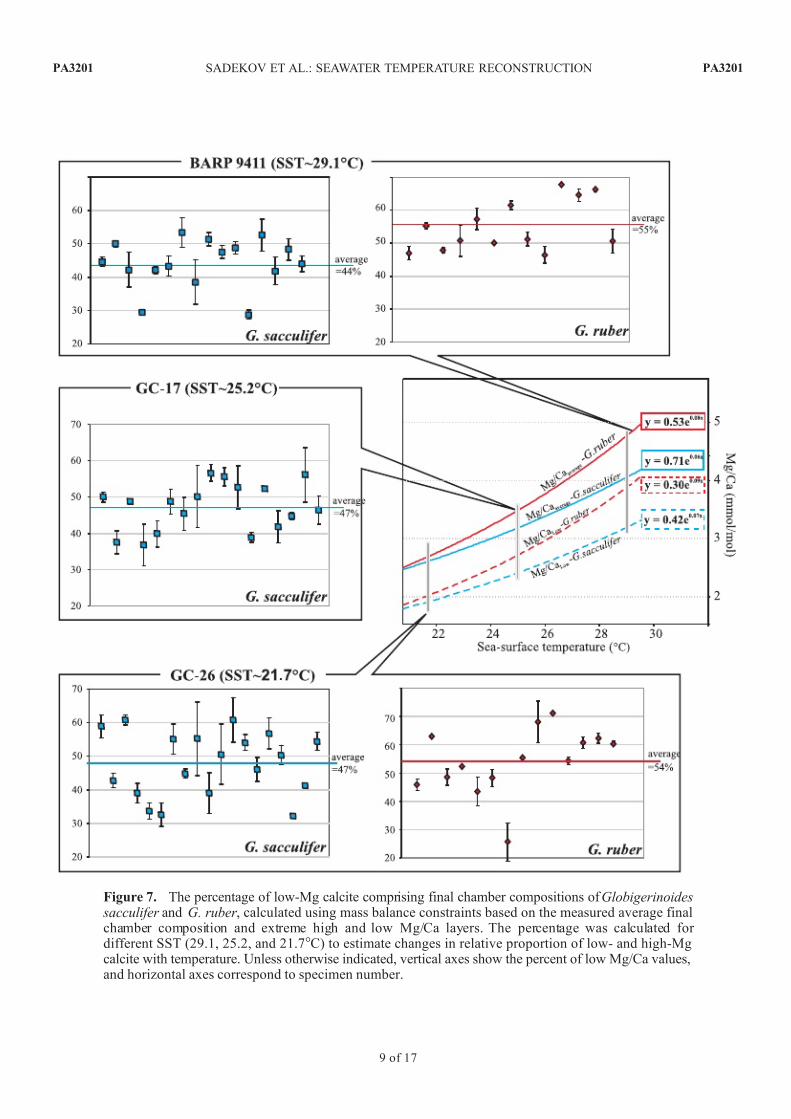
G. sacculifer tests with increasing temperature (e.g., alongthe lines proposed by Bentov and Erez [2006] to account for the temperature sensitivity of Mg partitioning into forami-niferal calcite). To assess this possibility, we have conductedmass balance calculations to estimate the relative propor-tions of measured low-Mg/Ca and high-Mg/Ca calcite layer compositions that are required to account for the observedchanges in Mg/Caaverage compositions (Figure 7). Theresults for G. ruber and G. sacculifer (see Figure 7) indicatethat the proportion of low-Mg/Ca layers is independent of temperature and is approximately constant at 45% and55% of the chamber wall, respectively. These calculationsassume that each final chamber comprises a mix of asingle low-Mg/Ca and single high-Mg/Ca layer composi-
tion, and is reliant on the ability of LA-ICP-MS to resolvethese two end-member layer compositions. Subject of these limitations, the absence of any trends in Figure 7suggests that no significant temperature control is exertedon the relative development of high-Mg/Ca and low-Mg/ Ca layers (Figure 7).3.4.3. Species-Specific Differences inBiomineralization Control of Mg Incorporation
[26] The Mg/Ca values of G. ruber , G. sacculifer and P. obliquiloculata are approximately 2 orders of magnitudelower than Mg/Ca values in inorganically precipitatedcalcite [ Katz , 1973; Nurnberg et al., 1996]. To precipitatethese low-Mg/Ca calcite compositions from seawater, fora-minifera may need to reduce the Mg2+ activity in thecalcifying fluid [ Rosenthal et al., 1997; Zeebe and Sanyal ,2002; Lea, 2003]. Several mechanisms have been proposed(see review by Bentov and Erez [2006]), including modifi-cation of pinocytosed seawater by transmembrane transport of Mg2+ and complexation with organic molecules (e.g.,ATP) [ Zeebe and Sanyal , 2002; Bentov and Erez , 2005,2006]. The extent of this Mg activity reduction and itsrelationship with temperature can be estimated for eachspecies using the average Mg/Ca values of test calcite, byassuming that all calcite precipitates inorganically from
biologically modified seawater. It is then straightforward
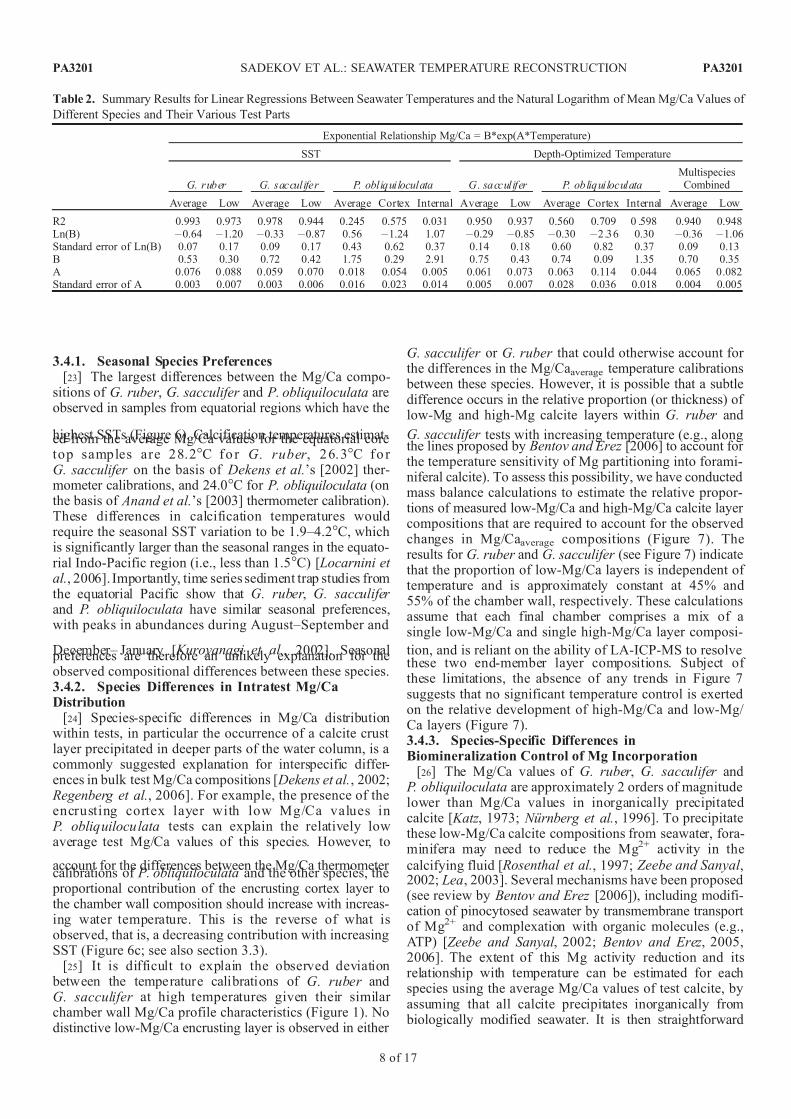
Table 2. Summary Results for Linear Regressions Between Seawater Temperatures and the Natural Logarithm of Mean Mg/Ca Values of
Different Species and Their Various Test Parts
Exponential Relationship Mg/Ca = B*exp(A*Temperature)
SST Depth-Optimized Temperature
G. ruber G. sacculifer P. obliquiloculata G . sacculifer P. obliquiloculataMultispecies
Combined
Average Low Average Low Average Cortex Internal Average Low Average Cortex Internal Average Low
R2 0.993 0.973 0.978 0.944 0.245 0.575 0.031 0.950 0.937 0.560 0.709 0 .598 0.940 0.948Ln(B) 0.64 1.20 0.33 0.87 0.56 1.24 1.07 0.29 0.85 0.30 2 .3 6 0.30 0.36 1.06Standard error of Ln(B) 0.07 0.17 0.09 0.17 0.43 0.62 0.37 0.14 0.18 0.60 0.82 0.37 0.09 0.13B 0.53 0.30 0.72 0.42 1.75 0.29 2.91 0.75 0.43 0.74 0.09 1.35 0.70 0.35A 0.076 0.088 0.059 0.070 0.018 0.054 0.005 0.061 0.073 0.063 0.114 0.044 0.065 0.082Standard error of A 0.003 0.007 0.003 0.006 0.016 0.023 0.014 0.005 0.007 0.028 0.036 0.018 0.004 0.005
8 of 17
PA3201PA3201 SADEKOV ET AL.: SEAWATER TEMPERATURE RECONSTRUCTION
7/21/2019 Depth of the oceans
http://slidepdf.com/reader/full/depth-of-the-oceans 9/17
Figure 7. The percentage of low-Mg calcite comprising final chamber compositions of Globigerinoides sacculifer and G. ruber , calculated using mass balance constraints based on the measured average finalchamber composition and extreme high and low Mg/Ca layers. The percentage was calculated for different SST (29.1, 25.2, and 21.7C) to estimate changes in relative proportion of low- and high-Mgcalcite with temperature. Unless otherwise indicated, vertical axes show the percent of low Mg/Ca values,and horizontal axes correspond to specimen number.
PA3201 SADEKOV ET AL.: SEAWATER TEMPERATURE RECONSTRUCTION
9 of 17
PA3201
7/21/2019 Depth of the oceans
http://slidepdf.com/reader/full/depth-of-the-oceans 10/17
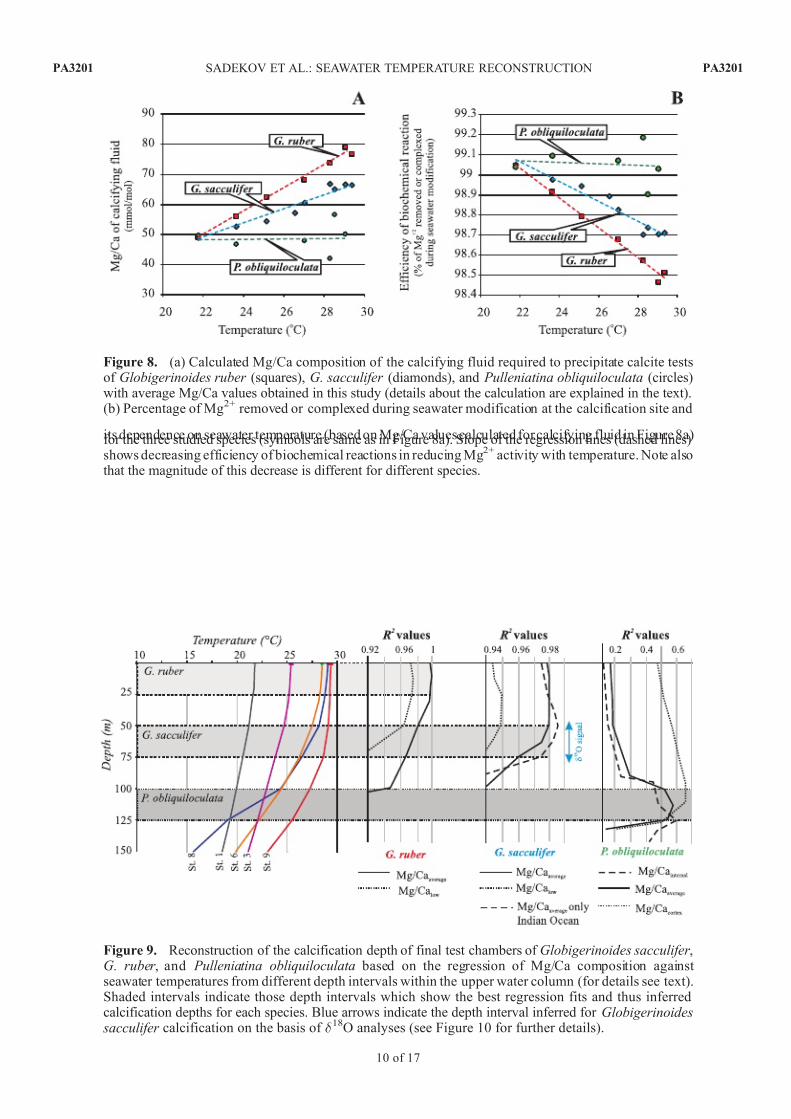
Figure 8. (a) Calculated Mg/Ca composition of the calcifying fluid required to precipitate calcite testsof Globigerinoides ruber (squares), G. sacculifer (diamonds), and Pulleniatina obliquiloculata (circles)with average Mg/Ca values obtained in this study (details about the calculation are explained in the text).(b) Percentage of Mg2+ removed or complexed during seawater modification at the calcification site and
its dependence on seawater temperature (based on Mg/Ca values calculated for calcifying fluid in Figure 8a)for the three studied species (symbols are same as in Figure 8a). Slope of the regression lines (dashed lines)shows decreasing efficiency of biochemical reactions in reducing Mg2+ activity with temperature. Note alsothat the magnitude of this decrease is different for different species.
Figure 9. Reconstruction of the calcification depth of final test chambers of Globigerinoides sacculifer ,G. ruber , and Pulleniatina obliquiloculata based on the regression of Mg/Ca composition against seawater temperatures from different depth intervals within the upper water column (for details see text).Shaded intervals indicate those depth intervals which show the best regression fits and thus inferredcalcification depths for each species. Blue arrows indicate the depth interval inferred for Globigerinoides
sacculifer calcification on the basis of d 18O analyses (see Figure 10 for further details).
PA3201 SADEKOV ET AL.: SEAWATER TEMPERATURE RECONSTRUCTION
10 of 17
PA3201
7/21/2019 Depth of the oceans
http://slidepdf.com/reader/full/depth-of-the-oceans 11/17
to calculate the Mg/Ca activity ratio values of the calcifyingfluid using a value of 5.15 mol/mol for seawater Mg/Ca[ Broecker and Peng , 1982] and equations (2) and (3) from
Katz [1973], which describe a partition coefficient of
magnesium in calcite and its relationship with temperature(Figure 8a).
Mg=Ca½ calcifying fluid ¼ Mg=Ca½ calcite=DMg ð2Þ
DMg ¼ 0:0009 T C þ 0:035 ð3Þ
Mg/Ca values of the calcifying fluid increase withtemperature in G. ruber and G. sacculifer , but have littleor no change for P. obliquiloculata. These species-specificchanges in the Mg/Ca values of the calcifying fluid can be
interpreted as a decrease in efficiency of the biochemicalreaction responsible for Mg2+ reduction at the calcificationsite (Figure 8b). Bentov and Erez [2006] suggested that temperature may cause an increase in diffusion rate or that ATP hydrolysis can reduce the efficiency of biochemicalremoval of Mg ions from the calcifying fluid andconsequently increase calcite Mg/Ca values. While it is
possible these factors (e.g., diffusion or ATP hydrolysis)could respond differently to seawater temperature changes
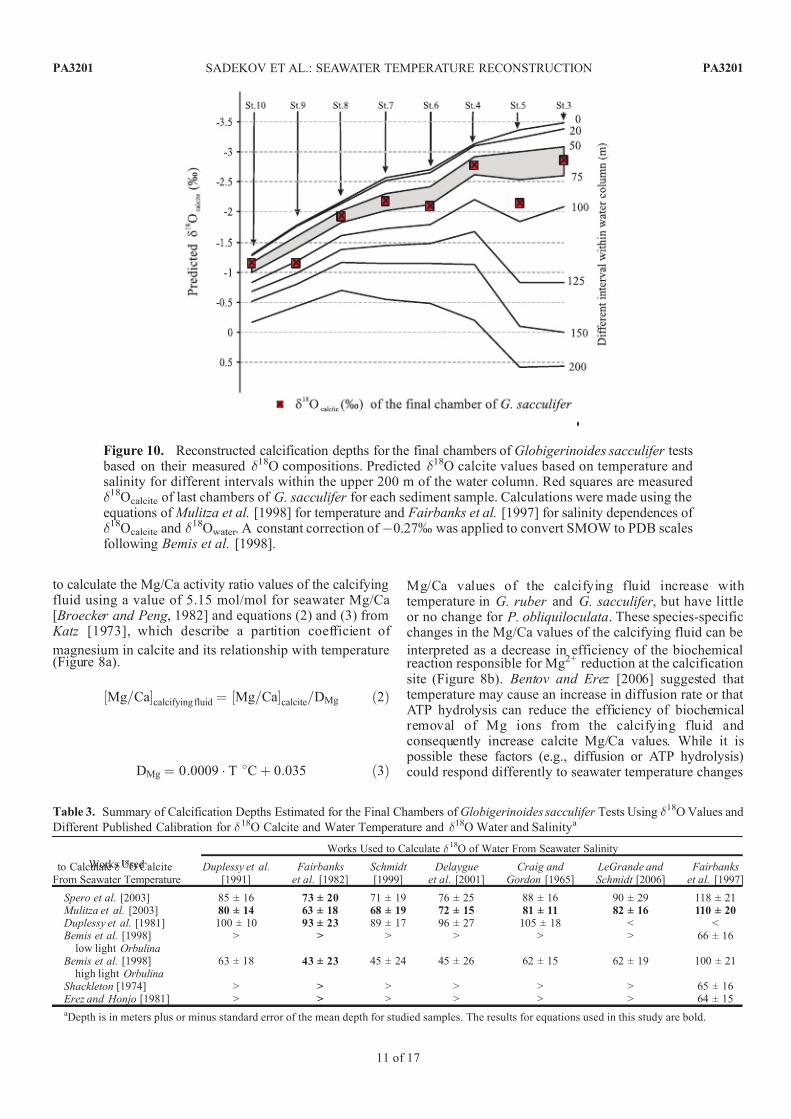
Figure 10. Reconstructed calcification depths for the final chambers of Globigerinoides sacculifer tests based on their measured d 18O compositions. Predicted d 18O calcite values based on temperature andsalinity for different intervals within the upper 200 m of the water column. Red squares are measuredd 18Ocalcite of last chambers of G. sacculifer for each sediment sample. Calculations were made using theequations of Mulitza et al. [1998] for temperature and Fairbanks et al. [1997] for salinity dependences of d 18Ocalcite and d 18Owater . A constant correction of 0.27% was applied to convert SMOW to PDB scalesfollowing Bemis et al. [1998].
Table 3. Summary of Calcification Depths Estimated for the Final Chambers of Globigerinoides sacculifer Tests Using d 18O Values and
Different Published Calibration for d 18O Calcite and Water Temperature and d 18O Water and Salinitya
Works Usedto Calculate d 18O CalciteFrom Seawater Temperature
Works Used to Calculate d 18O of Water From Seawater Salinity
Duplessy et al.[1991]
Fairbankset al. [1982]
Schmidt [1999]
Delaygueet al. [2001]
Craig and Gordon [1965]
LeGrande and Schmidt [2006]
Fairbankset al. [1997]
Spero et al. [2003] 85 ± 16 73 ± 20 71 ± 19 76 ± 25 88 ± 16 90 ± 29 118 ± 21 Mulitza et al. [2003] 80 ± 14 63 ± 18 68 ± 19 72 ± 15 81 ± 11 82 ± 16 110 ± 20 Duplessy et al. [1981] 100 ± 10 93 ± 23 89 ± 17 96 ± 27 105 ± 18 < < Bemis et al. [1998]
low light Orbulina> > > > > > 66 ± 16
Bemis et al. [1998]high light Orbulina
63 ± 18 43 ± 23 45 ± 24 45 ± 26 62 ± 15 62 ± 19 100 ± 21
Shackleton [1974] > > > > > > 65 ± 16 Erez and Honjo [1981] > > > > > > 64 ± 15
a Depth is in meters plus or minus standard error of the mean depth for studied samples. The results for equations used in this study are bold.
PA3201 SADEKOV ET AL.: SEAWATER TEMPERATURE RECONSTRUCTION
11 of 17
PA3201
7/21/2019 Depth of the oceans
http://slidepdf.com/reader/full/depth-of-the-oceans 12/17
in each species and therefore account for differences between species-specific Mg/Ca thermometers, this is
highly speculative and a topic for future studies onforaminiferal biomineralization.3.4.4. Differences in Species’ Habitat Preference
[27] The effects of foraminiferal habitat preferences onthe test chemistry of different species are well known fromoxygen isotopes studies [ Fairbanks and Wiebe, 1980;
Fairbanks et al., 1980; Blanc and Be , 1981; Fairbankset al., 1982; Ravelo and Fairbanks, 1992], and have beensuggested to be a factor contributing to interspecies differ-ences in Mg/Ca composition [ Dekens et al., 2002; Regenberg et al., 2006; Cleroux et al., 2007, 2008; Huang et al., 2008].
[28] To test the effects of species depth habitat preferenceson Mg/Ca compositions, we used a similar approach to therecent study of Farmer et al. [2007] employing oxygen
isotope compositions. The rationale for this approach is that the depth interval and associated water temperature which
best represents the observed Mg/Ca compositions shouldminimize residual deviations and provide the best regres-sion fit for Mg/Ca versus temperature. Accordingly, wecompare the regression fits for the measured Mg/Ca com-
positions of each species with mean annual temperatures at different water depth intervals for each core top samplingsite [ Locarnini et al., 2006]. The regression fit resultsobtained from this comparison of the measured test com-
ponent compositions of the three species are shown in
Figure 9. The best fits (highest correlation coefficients)for G. ruber and G. sacculifer and P. obliquiloculata were
obtained with temperatures corresponding to depth intervalsof 0–25 m, 0–50 m and 100–125 m, respectively. Analysesof d 18O composition obtained on the same final test cham-
bers of G. sacculifer indicate that calcification temperaturesfor the formation of the final chamber are consistent withthe 50–75 m depth interval (Figure 10 and Table 3), whichis slightly deeper than the depth derived from Mg/Cacompositions. Interestingly, if the sample from Ontong JavaPlateau is omitted, leaving only the core tops samples fromIndian Ocean, the revised regression fit indicates a consistent calcification depth of 50–75 m for G. sacculifer (Figure 9).This depth interval (i.e., 50–75 m) is also more in line withthe results of previous studies [ Fairbanks et al., 1982;
Ravelo and Fairbanks, 1992; Bijma and Hemleben, 1994;
Bijma et al., 1994; Faul et al., 2000; Loncaric et al., 2006; Regenberg et al., 2009].
[29] These best fit depth intervals are calcification depthsfor the final chambers and are not equivalent to specieshabitat depths. However, these intervals are notable for their good agreement with previously documented habitat depthsfor each of these species, on the basis of both plankton net and oxygen isotope studies [ Fairbanks et al., 1982; Raveloand Fairbanks, 1992; Bijma and Hemleben, 1994; Faul et al., 2000; Anand et al., 2003; Field , 2004; Kuroyanagi and
Kawahata, 2004; Cleroux et al., 2008; Regenberg et al.,
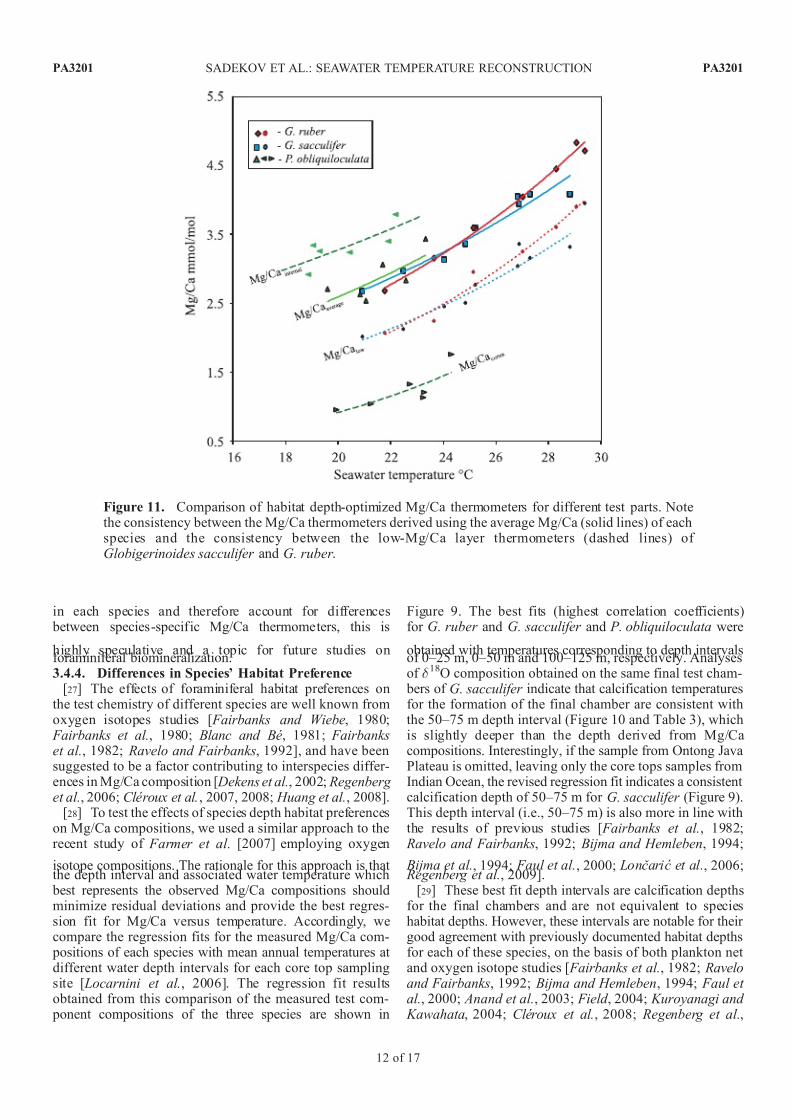
Figure 11. Comparison of habitat depth-optimized Mg/Ca thermometers for different test parts. Notethe consistency between the Mg/Ca thermometers derived using the average Mg/Ca (solid lines) of eachspecies and the consistency between the low-Mg/Ca layer thermometers (dashed lines) of Globigerinoides sacculifer and G. ruber .
PA3201 SADEKOV ET AL.: SEAWATER TEMPERATURE RECONSTRUCTION
12 of 17
PA3201
7/21/2019 Depth of the oceans
http://slidepdf.com/reader/full/depth-of-the-oceans 13/17
2009]. Consequently, we attribute the observed differences between species Mg/Ca thermometer calibrations to thedifferent calcification depths of the final test chambers.
[30] The depth optimized Mg/Caaverage temperatureregressions for G. ruber and G. sacculifer and P. obliqui-loculata are notable for being statistically indistinguishablefrom each other (Figure 11). The depth optimized regres-sions for the Mg/Calow compositions of G. sacculifer andG. ruber are also closely similar (Figure 11). These are
consistent with the similar offset observed between Mg/ Caaverage and Mg/Calow values in section 3.2 of this work.
[31] The absence of any significant differences betweenspecies depth optimized Mg/Caaverage and Mg/Calow temper-atures indicates that the temperature control on Mg/Cacompositions may be identical for all three species. Thisindicates the possibility that a single ‘‘generalized’’ Mgthermometer could be applied to these species to reconstruct a temperature profile for the upper water column, and
possibly minimizing errors associated with applications of different species-specific calibrations.
3.4.5. Generalized Mg/Ca Thermometer for SeaSurface and Upper Thermocline TemperatureReconstruction
[32] A generalized Mg/Ca temperature equation might be best estimated from culturing experiments where water conditions are tightly controlled [Spero, 1992; Lea et al.,1999]. By using Mg/Ca analyses only from the finalchambers of G. ruber and G. sacculifer and P. obliquilocu-lata it may also be possible to reduce the variability of Mg/
Ca values caused otherwise by foraminiferal migrationwithin the water column. To estimate the generalized Mg/ Ca thermometer, we have applied a multiple regressionmodel to the combined Mg/Ca data sets from culturingexperiments available for studies species [e.g., Nurnberg et al., 1996; Kısakurek et al., 2008] and the Mg/Caaveragevalues from our work (Figure 12 and Table S1).1 Seawater salinity dependence was also included in the regression
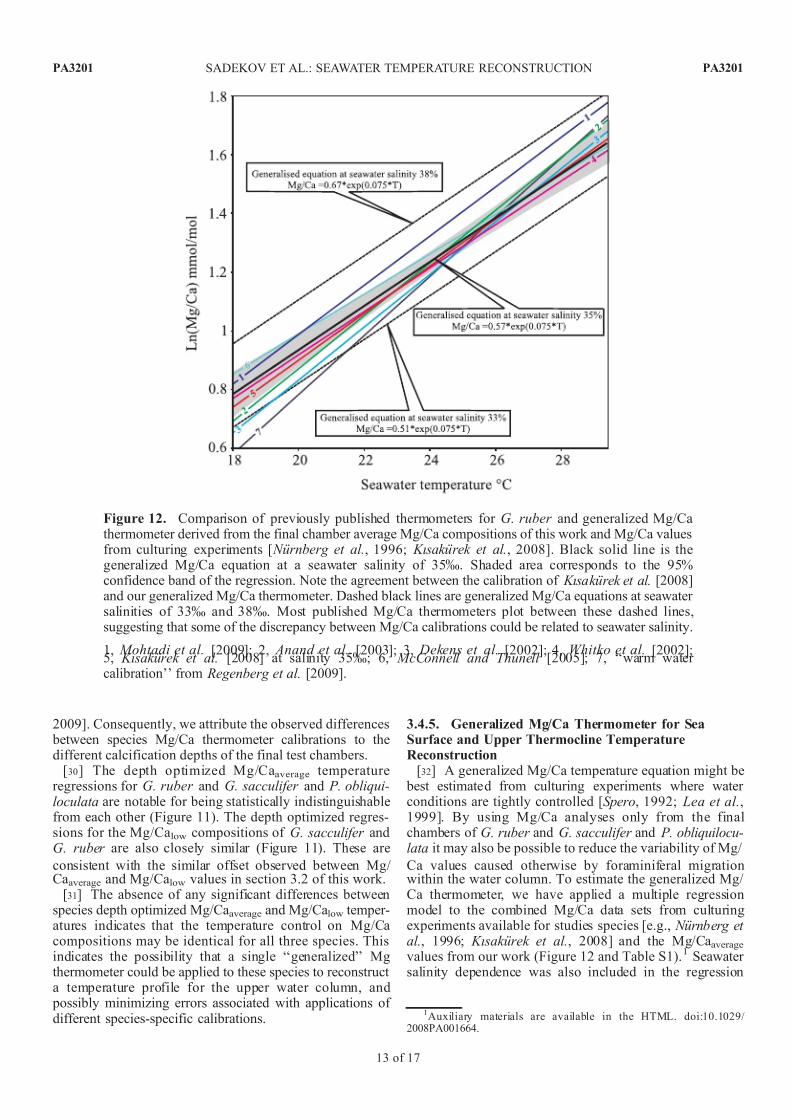
Figure 12. Comparison of previously published thermometers for G. ruber and generalized Mg/Cathermometer derived from the final chamber average Mg/Ca compositions of this work and Mg/Ca valuesfrom culturing experiments [ Nurnberg et al., 1996; Kısakurek et al., 2008]. Black solid line is thegeneralized Mg/Ca equation at a seawater salinity of 35%. Shaded area corresponds to the 95%confidence band of the regression. Note the agreement between the calibration of Kısakurek et al. [2008]and our generalized Mg/Ca thermometer. Dashed black lines are generalized Mg/Ca equations at seawater salinities of 33% and 38%. Most published Mg/Ca thermometers plot between these dashed lines,suggesting that some of the discrepancy between Mg/Ca calibrations could be related to seawater salinity.
1, Mohtadi et al. [2009]; 2, Anand et al. [2003]; 3, Dekens et al. [2002]; 4, Whitko et al. [2002];5, Kısakurek et al. [2008] at salinity 35%; 6, McConnell and Thunell [2005]; 7, ‘‘warm water calibration’’ from Regenberg et al. [2009].
1Auxiliary materials are available in the HTML. doi:10.1029/ 2008PA001664.
PA3201 SADEKOV ET AL.: SEAWATER TEMPERATURE RECONSTRUCTION
13 of 17
PA3201
7/21/2019 Depth of the oceans
http://slidepdf.com/reader/full/depth-of-the-oceans 14/17
model to account for the large salinity variation that occurs
for our core top sites [ Antonov et al., 2006], and recent studies that show the importance of salinity for foraminifer Mg/Ca compositions [ Nurnberg et al., 1996; de Menocal et al., 2007; Ferguson et al., 2008; Groeneveld et al., 2008;
Kısakurek et al., 2008]. The resulting generalized equationfit, i.e.,
Mg=Caaverage ¼ exp 0:057 0:012ð Þ S psuð Þ½
þ0:075 0:006ð Þ T Cð Þ 2:56 0:46ð Þ;
ð4Þ
accounts for 0.85% of the total Mg/Ca variability (e.g., R 2 =0.85). It is also readily modified for application to the Mg/
Calow compositions of G. ruber and G. sacculifer by addingthe appropriate preexponential constant (see equation (1) insection 3.2) as follows:
Mg=Calow ¼ 0:78 exp 0:057 0:012ð Þ S psuð Þ½
þ0:075 0:006ð Þ T Cð Þ 2:56 0:46ð Þ:
Equation (4) is statistically indistinguishable from the published calibrations of Whitko et al. [2002] and Kısakurek et al. [2008] (Figure 12), and is broadly consistent withmany published Mg/Ca thermometers [ Hastings et al.,
1998; Dekens et al., 2002; Anand et al., 2003; McConnell
and Thunell , 2005; Cleroux et al., 2008; Mohtadi et al.,2009; Regenberg et al., 2009] (Figure 12).
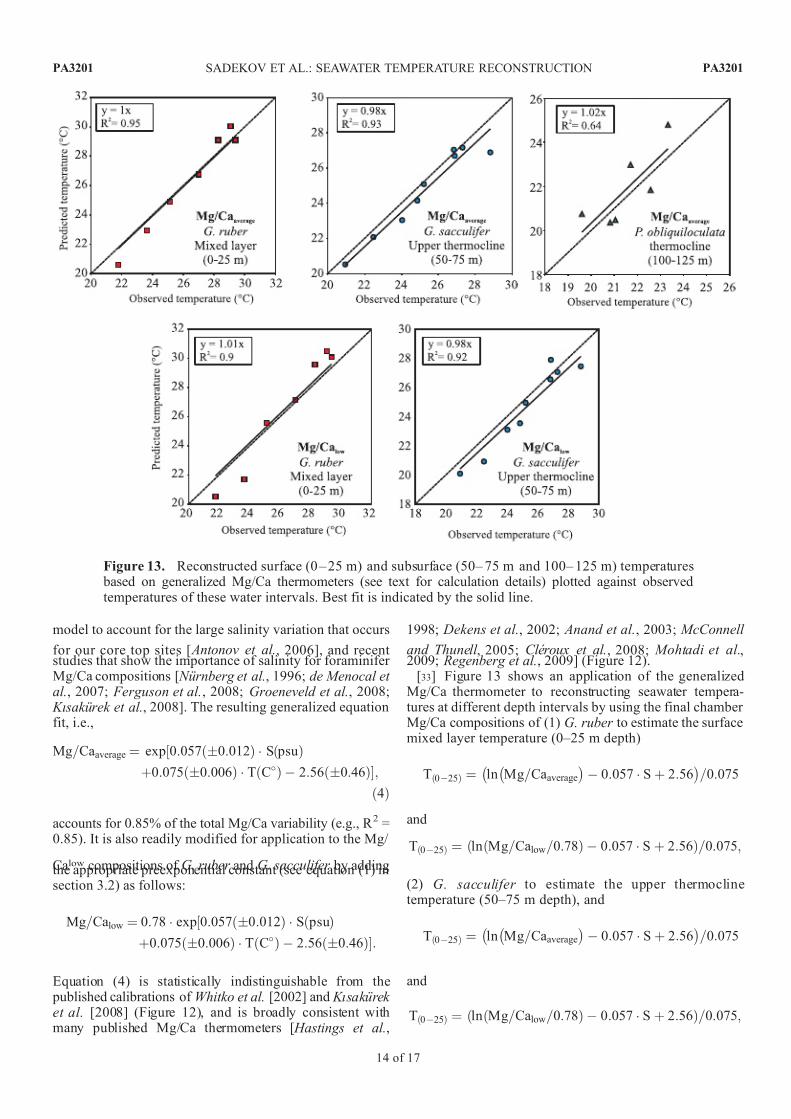
[33] Figure 13 shows an application of the generalizedMg/Ca thermometer to reconstructing seawater tempera-tures at different depth intervals by using the final chamber Mg/Ca compositions of (1) G. ruber to estimate the surfacemixed layer temperature (0–25 m depth)
T 025ð Þ ¼ ln Mg=Caaverage
0:057 S þ 2:56
=0:075
and
T 025ð Þ ¼ ln Mg=Calow=0:78ð Þ 0:057 S þ 2:56ð Þ=0:075;
(2) G. sacculifer to estimate the upper thermoclinetemperature (50–75 m depth), and
T 025ð Þ ¼ ln Mg=Caaverage
0:057 S þ 2:56
=0:075
and
T 025ð Þ ¼ ln Mg=Calow=0:78ð Þ 0:057 S þ 2:56ð Þ=0:075;
Figure 13. Reconstructed surface (0 – 25 m) and subsurface (50– 75 m and 100– 125 m) temperatures based on generalized Mg/Ca thermometers (see text for calculation details) plotted against observedtemperatures of these water intervals. Best fit is indicated by the solid line.
PA3201 SADEKOV ET AL.: SEAWATER TEMPERATURE RECONSTRUCTION
14 of 17
PA3201
7/21/2019 Depth of the oceans
http://slidepdf.com/reader/full/depth-of-the-oceans 15/17
and (3) P. obliquiloculata to estimate deeper mainthermocline temperatures (100–125 m depth).
T 100125ð Þ ¼ ln Mg=Caaverage
0:057 S þ 2:56
=0:075
The calculated temperatures for the water column intervalsshow a good correlation with observed temperatures
(Figure 13). This application is not an independent experiment because we used the same core top samplesfor the regression model of the generalized thermometer, incombination with other Mg/Ca data (e.g., data fromculturing experiments [ Nurnberg et al., 1996; Kısakurek et al., 2008]). However, Figure 13 demonstrates the applic-ability of the generalized Mg/Ca equation for each speciesseparately, as well as for the low-Mg calcite of G. ruber andG. sacculifer species.
[34] Previous studies have attributed the habitat depth preferences of different planktonic foraminiferal species totheir symbioses and feeding strategies, with the latter beingrelated to depth of the chlorophyll maximum rather thanabsolute depth [ Fairbanks et al., 1982; Ravelo and Fairbanks,
1992; Bijma and Hemleben, 1994; Faul et al., 2000; Anand et al., 2003; Field , 2004; Kuroyanagi and Kawahata, 2004].Accordingly, the calcification depths inferred in this studyfor G. sacculifer and P. obliquiloculata may be valid onlyfor temperate to tropical regions of the Indian and Pacificoceans, and the other regions with a comparable oceanog-raphy. Given the sensitivity to past changes in the depth of the chlorophyll maximum in the oceans, the ability toreconstruct accurate temperature-depth profiles may becompromised, as distinct from temperatures related to the
position of the chlorophyll maximum. Further studies arerequired to test the G. sacculifer and P. obliquiloculatadepth habitat preferences in different parts of the ocean andthe applicability of this approach to paleocean reconstruction.
4. Conclusions
[35] LA-ICP-MS microanalysis of Mg/Ca through indi-vidual final chambers of Globigerinoides ruber , G. saccu-lifer an d Pulleniatina obliquiloculata tests indicate
significant interspecies differences in test Mg/Ca concen-trations. Our results show that differences in intratest dis-tributions of species Mg/Ca values cannot account for theobserved deviation of species Mg/Ca values in warm-water equatorial regions. Results of our multiple regression mod-eling and previous d 18O studies of Globigerinoides saccu-lifer tests, both indicate that interspecies discrepancies in
Mg/Ca thermometers result from species differences indepth habitat. The average Mg/Ca values of G. ruber reflect seawater temperature of the surface water mixed layer (0– 25 m), whereas those of G. sacculifer and Pulleniatinaobliquiloculata correlate best with temperatures at 50–75 mand 100–125 m depth, respectively. Comparison of Mg/Cacalibrations based on seawater temperatures correspondingto these depths indicates that all three species share a similar temperature control on Mg test composition. Accordingly,we have derived a generalized temperature relationship bymultiple regression of our results and culture studies whichis described by the equation
Mg=Cafinal chamber average ¼ exp 0:057 0:012ð Þ S psuð Þ½
þ 0:075 0:006ð Þ T Cð Þ
2:56 0:46ð Þ:
We further demonstrate that the low-Mg/Ca layer composi-tions of G. ruber and G. sacculifer and the cortex’s Mg/Cavalues of P. obliquiloculata can also be used as proxy for water temperature.
[36] Acknowledgments. This work was funded by Australian Re-search Council Discovery grant DP0450358 awarded to Patrick De Deckker and Stephan Eggins. Cores were obtained through R/V Sonne and R/V
Franklin cruises funded by German Ministry of Education, Science andTechnology (BMBF-grant 03G0185A, Sonne 185 cruise) and by theAustralian National Facility grant to Patrick De Deckker for cruises
Franklin 95/10 and 96/02. Material from cores BAR9403 and SHI 9016was provided by F. Guichard from the LSCE in Gif-sur-Yvette. Some of theAMS dates on core top samples were funded by AINSE grant 97/057R. Wealso thank Judith Shelley for assistance with AMS sample preparation andRune Søraas for help with stable isotope analyses. This manuscript greatly
benefited from the constructive criticism of Gerald Dickens and Gert-JanReichart.
References
Anand, P., and H. Elderfield (2005), Variabilityof Mg/Ca and Sr/Ca between and within the
planktonic foraminifers Globigerina bulloidesand Globorotalia truncatulinoides, Geochem.Geophys. Geosyst., 6 , Q11D15, doi:10.1029/ 2004GC000811.
Anand, P., H. Elderfield, and M. H. Conte(2003), Calibration of Mg/Ca thermometry in
planktonic foraminifera from a sediment traptime series, Paleoceanography, 18(2), 1050,doi:10.1029/2002PA000846.
Antonov, J. I., R. A. Locarnini, T. P. Boyer, A. V.Mishonov, and H. E. Garcia (2006), World Ocean Atlas 2005, vol. 2, Salinity, NOAA At-las NESDIS , vol. 62, edited by S. Levitus, 182
pp., NOAA, Silver Spring, Md.Barker, S.,I. Cacho, H. Benway, and K. Tachikawa
(2005), Planktonic foraminiferal Mg/Ca as a proxy for past oceanic temperatures: A meth-odological overview and data compilation for the Last Glacial Maximum, Quat. Sci. Rev.,
24(7–9), 821–834, doi:10.1016/j.quascirev.2004.07.016.
Be, A. W. H. (1980), Gametogenic calcifica-tion in a spinose planktonic foraminifer,Globigerinoides sacculifer (Brady), Mar. Mi-cropaleontol., 5, 283– 310, doi:10.1016/
0377-8398(80)90014-6.Be, A. W. H., C. Hemleben, O. R. Anderson,
M. Spindler, J. Hacunda, and C. S. Tuntivate(1977), Laboratory and field observations of living planktonic foraminifera, Micropaleon-tology, 23 (2), 155 – 179, doi:10.2307/ 1485330.
Bemis, B. E., H. J. Spero, J. Bijma, and D. W.Lea (1998), Reevaluation of the oxygen iso-topic composition of planktonic foraminifera:Experimental results and revised paleotem-
perature equations, Paleoceanography, 13(2),150 – 160, doi:10.1029/98PA00070.
Bentov, S., and J. Erez (2005), Novel observa-tions on biomineralization processes in fora-
minifera and implications for Mg/Ca ratio inthe shells , Geology, 33 ( 1 1 ) , 8 4 1 – 8 4 4 ,doi:10.1130/G21800.1.
Bentov, S., and J. Erez (2006), Impact of biomi-neralization processes on the Mg content of foraminiferal shells: A biological perspective,
Geochem. Geophys. Geosyst., 7 , Q01P08,doi:10.1029/2005GC001015.
Berger, W. H., J. S. Killingley, and E. Vincent (1987), Time scale of the Wisconsin Holocenetransition—Oxygen isotope record in the wes-tern equatorial Pacific, Quat. Res., 28(2),295 – 306, doi:10.1016/0033-5894(87)90068-8.
Bijma, J., and C. Hemleben (1994), Populationdynamics of the planktic foraminifer Globi-
gerinoides sacculifer (Brady) from the centralRed Sea, Deep Sea Res., Part I , 41(3), 485– 510, doi:10.1016/0967-0637(94)90092-2.
Bijma, J., C. Hemleben, and K. Wellnitz (1994),Lunar-influenced carbonate flux of the plank-
PA3201 SADEKOV ET AL.: SEAWATER TEMPERATURE RECONSTRUCTION
15 of 17
PA3201
7/21/2019 Depth of the oceans
http://slidepdf.com/reader/full/depth-of-the-oceans 16/17
tic foraminifer Globigerinoides sacculifer (Brady) from the central Red Sea, Deep Sea
Res., Part I , 41(3), 511–530, doi:10.1016/ 0967-0637(94)90093-0.
Blanc, P.-L., and A. W. H. Be (1981), Oxygen-18 enrichment of planktonic foraminifera dueto gametogenic calcification below the eupho-tic zone, Science, 213(4513), 1247–1250,doi:10.1126/science.213.4513.1247.
Broecker, W. S., and T. H. Peng (1982), Tracersin the Sea, 690 pp., Lamont-Doherty Geol.Obs. Press, Palisades, N. Y.
Caron, D. A., W. W. Faber Jr., and A. W. H. Be(1987), Growth of the spinose planktonic for-aminifer Orbulina universa in laboratory cul-ture and the effect of temperature on life
proc esses, J. Mar. Biol. Assoc. U. K., 67 ,343– 358, doi:10.1017/S0025315400026655.
Caron, D. A., O. R. Anderson, J. L. Lindsey,W. W. Faber Jr., and E. L. Lim (1990), Effectsof gametogenesis on test structure and disso-lution of some spinose planktonic foraminiferaand implications for test preservation, Mar.
Micropaleonto l., 16 , 93–116, doi:10.1016/ 0377-8398(90)90031-G.
Cleroux, C., E. Cortijo, J.-C. Duplessy, andR. Zahn (2007), Deep-dwelling foraminiferaas thermocline temperature recorders, Geo-chem. Geophys. Geosyst., 8, Q04N11,doi:10.1029/2006GC001474.
Cleroux, C., E. Cortijo, P. Anand, L. Labeyrie,F. Bassinot, N. Caillon, and J.-C. Duplessy(2008), Mg/Ca and Sr/Ca ratios in plank-tonic foraminifera: Proxies for upper water column temperature reconstruction, Paleo-ceanography, 23, PA3214, doi:10.1029/ 2007PA001505.
Craig, H., and L. I. Gordon (1965), Deuteriumand oxygen-18 variations in the ocean and themarine atmosphere, in Stable Isotopes inOceanographic Studies and Paleotempera-tures, edited by E. Tongiorgi, pp. 9–130,Lab. di Geol. Nucl., Pisa Cons. Naz. delleRic., Spoleto, Italy.
Dekens, P. S., D. W. Lea, D. K. Pak, and H. J.Spero (2002), Core top calibration of Mg/Cain tropical foraminifera: Refining paleotem-
perature estimation, Geochem. Geophys. Geo- s y s t . , 3 ( 4 ) , 1 0 2 2 , d o i : 1 0 . 1 0 2 9 / 2001GC000200.
Delaygue, G., E. Bard, C. Rollion, J. Jouzel,M. Stievenard, J.-C. Duplessy, and G. Ganssen(2001), Oxygen isotope/salinity relationship inthe northern Indian Ocean, J. Geophys. Res.,106 (C3), 4565– 4574.
de Menocal, P. B., J. A. Arbuszewski, A. Kaplan,and M. Bice (2007), Fidelity of d 18O seawater estimates using foraminiferal shell Mg/Ca andd 18O, Eos Trans. AGU , 88(52), Fall Meet.Suppl., Abstract PP41E-08.
Duplessy, J. C., A. W. H. Be, and P. L. Blanc(1981), Oxygen and carbon isotopic compo-sition and biogeographic distribution of
planktonic-foraminifera in the Indian Ocean, Palaeogeog r. Palaeocl imatol. Palaeoec ol.,3 3 ( 1 – 3 ) , 9 – 4 6 , d o i : 1 0 . 1 0 1 6 / 0 0 3 1 -0182(81)90031-6.
Duplessy, J. C., L. Labeyrie, A. Juilletleclerc,F. Maitre, J. Duprat, and M. Sarnthein (1991),Surface salinity reconstruction of the NorthAtlantic Ocean during the Last Glacial Maxi-mum, Oceanol. Acta, 14(4), 311– 324.
Eggins, S., P. De Deckker, and J. Marshall(2003), Mg/Ca variation in planktonic forami-nifera tests: Implications for reconstructing pa-laeo-seawater temperature and habitat migration, Earth Planet. Sci. Lett., 212, 291– 306, doi:10.1016/S0012-821X(03)00283-8.
Eggins, S. M., A. Y. Sadekov, and P. De Deckker (2004), Modulation and daily banding of Mg/Ca in Orbulina universa tests by symbiont
photosynthesis and respiration: A complicationfor seawater thermometry?, Earth Planet. Sci.
L e t t . , 2 2 5 , 4 1 1 – 4 1 9 , d o i : 1 0 . 1 0 1 6 / j.epsl.2004.06.019.
Eggins, S., H. Spero, A. D. Russell, S. Alford,S. Doo, A. Kuroyanagi, R. E. da Rocha, andA. Y. Sadekov (2007), Controls on Mg/Cavariation in planktonic foraminifera: Insightsfrom microanalysis of laboratory cultured Or-bulina universa, Eos Trans. AGU , 88(52),Fall Meet. Suppl., Abstract PP41E-03.
Elderfield, H., and G. Ganssen (2000), Past tem- perature and d 18O of surface ocean waters in-ferred from foraminiferal Mg/Caratios, Nature,405(6785), 442 – 445, doi:10.1038/35013033.
Erez, J. (2003), The source of ions for biominer-alization in foraminifera and their implicationsfor paleoceanographic proxies, in Biominera-lization, edited by P. M. Dove, J. J. De Yoreo,and S. Weiner, pp. 115–149, Mineral. Soc. of Am., Washington, D. C.
Erez, J., and S. Honjo (1981), Comparison of isotopic composition of planktonic foramini-fera in plankton tows, sediment traps and sedi-m e n t s , P a l a e o g e o g r. P a l a e o c l i m a t o l .
Palaeoecol., 33(1– 3), 129– 156, doi:10.1016/ 0031-0182(81)90035-3.
Fairbanks, R. G., and P. H. Wiebe (1980), For-aminifera and chlorophyll maximum: Verticaldistribution, seasonal succession, and paleo-c e a n o g r a p h i c s i g n i f i c a n c e , S c i e n c e ,20 9( 4 4 6 4 ) , 1 5 2 4 – 1 5 2 6 , d o i : 1 0 . 1 1 2 6 / science.209.4464.1524.
Fairbanks, R. G., P. H. Wiebe, and A. W. H. Be(1980), Vertical distribution and isotopic com-
position of living planktonic foraminifera in thewestern North Atlantic, Science, 207 (4426),61 – 63, doi:10.1126/science.207.4426.61.
Fairbanks, R. G., M. Sverdlove, R. Free, P. H.Wiebe, and A. W. H. Be (1982), Vertical dis-tribution and isotopic fractionation of living
planktonic foraminifera from the Panama Ba-s i n , N a t u r e , 2 9 8 ( 5 8 7 7 ) , 8 4 1 – 8 4 4 ,doi:10.1038/298841a0.
Fairbanks, R. G., M. N. Evans, J. L. Rubenstone,R. A. Mortlock, K. Broad, M. D. Moore, andC. D. Charles (1997), Evaluating climateindices and their geochemical proxies mea-sured in corals, Coral Reefs, 16 , S93–S100,doi:10.1007/s003380050245.
Farmer, E. C, A. Kaplan, P. B. de Menocal, andJ. Lynch-Stieglitz (2007), Corroborating eco-logical depth preferences of planktonic fora-minifera in the tropical Atlantic with the stableoxygen isotope ratios of core top specimens,
Paleoceanography, 22, PA3205, doi:10.1029/ 2006PA001361.
Faul, K. L., A. C. Ravelo, and M. L. Delaney(2000), Reconstructions of upwelling, produc-tivity, and photic zone depth in the easternequatorial Pacific Ocean using planktonic for-aminiferal stable isotopes and abundances,
J. Fo ra min if er al Re s. , 30 (2), 110–125,doi:10.2113/0300110.
Ferguson, J. E., G. M. Henderson, M. Kucera,and R. E. M. Rickaby (2008), Systematicchange of foraminiferal Mg/Ca ratios acrossa strong salinity gradient, Earth Planet. Sci.
L e t t . , 2 6 5 , 1 5 3 – 1 6 6 , d o i : 1 0 . 1 0 1 6 / j.epsl.2007.10.011.
Field, D. B. (2004), Variability in vertical distri- butions of planktonic foraminifera in the Ca-lifornia Current: Relationships to verticalocean structure, Paleoceanography, 19 ,PA2014, doi:10.1029/2003PA000970.
Fink, D., et al. (2004), The ANTARES AMSfacility at ANSTO, Nucl. Instrum. Methods
Phy s. Res. , Sec t. B, 223–224, 109–115,doi:10.1016/j.nimb.2004.04.025.
Groeneveld,J., D. Nurnberg, R. Tiedemann,G.-J.Reichart, S. Steph, L. Reuning, D. Crudeli, andP. Mason (2008), Foraminiferal Mg/Ca in-crease in the Caribbean during the Pliocene:Western Atlantic Warm Pool formation, sali-nity influence, or diagenetic overprint?, Geo-chem . G eophys. G eosyst. , 9, Q 0 1 P 2 3 ,doi:10.1029/2006GC001564.
Hastings,D. W.,A. D. Russell,and S.R. Emerson(1998), Foraminiferal magnesium in Globeri-
gin oide s sacc uli fer as a paleotemperature prox y, Paleoceanography, 13(2), 161–169,doi:10.1029/97PA03147.
Hemleben, C., M. Spindler, and R. O. Anderson(1989), Modern Planktonic Foraminifera, 363
pp., Springer, Berlin.Huang, K.-F., C.-F. Yuo, H.-L. Lin, and Y.-T.
Shieh (2008), In situ calibration of Mg/Ca ra-tio in planktonic foraminiferal shell using timeseries sediment trap: A case study of intensedissolution artifact in the South China Sea,Geochem. Geophys. Geosyst., 9, Q04016,doi:10.1029/2007GC001660.
Jørgensen, B. B., J. Erez, N. P. Revsbech, andY. Cohen (1985), Symbiotic photosynthesisin a planktonic foraminifera Globigerinoides
saccul ifer (Brady), studied with microelec-trodes, Limnol. Oceanogr., 30(6), 1253–1267.
Katz, A. (1973), The interaction of magnesiumwith calcite during crystal growth at 25–90Cand one atmosphere, Geochim. Cosmochim.
Acta, 37 (6), 1563– 1586, doi:10.1016/0016-7037(73)90091-4.
Kısakurek, B., A. Eisenhauer, F. Bohm,D. Garbe-Schonb erg, and J. Erez (2008), Con-trols on shell Mg/Ca and Sr/Ca in cultured
planktonic foraminiferan, Globigerinoides ru-ber (white), Earth Planet. Sci. Lett., 273, 260– 269, doi:10.1016/j.epsl.2008.06.026.
Kunioka, D., K. Shirai, N. Takahata, Y. Sano,T. Toyofuku, and Y. Ujiie (2006), Microdis-tribution of Mg/Ca, Sr/Ca, and Ba/Ca ratiosin Pulleniatina obliquiloculata test by using
NanoSIMS: Implication for the vital effect mechanism, Geochem. Geophys. Geosyst., 7 ,Q12P20, doi:10.1029/2006GC001280.
Kuroyanagi, A., and H. Kawahata (2004), Ver-tical distribution of living planktonic forami-n i fe r a i n t h e s e a s a r ou n d J a pa n , Mar.
Micropaleontol., 53, 173– 196, doi:10.1016/ j.marmicro.2004.06.001.
Kuroyanagi, A., H. Kawahata, H. Nishi, andM. C. Honda (2002), Seasonal changes in
plankto nic foramini fera in the northwe stern North Pacific Ocean: Sediment trap experi-ments from subarctic and subtropical gyres,
Deep Sea Res., Part II , 49(24–25), 5627– 5645, doi:10.1016/S0967-0645(02)00202-3.
Lea, D. W. (2003), Elemental and isotopic proxies of marine temperatu res, in Treatiseon Geochemistry, vol. 6, The Oceans and
Marine Geochemistry, edited by H. Elderfield, pp. 365 – 390, Elsevier, New York.
Lea, D. W., T. A. Mashiotta, and H. J. Spero(1999), Controls on magnesium and strontiumuptake in planktonic foraminifera determined
by live culturing, Geochim. Cosmochim. Acta,63(16), 2369–2379, doi:10.1016/S0016-7037(99)00197-0.
Lea, D. W., D. K. Pak, and H. J. Spero (2000),Climate impact of Late Quaternary equatorialPacific sea surface temperature variations,S c i e n c e , 2 8 9 ( 5 4 8 5 ) , 1 7 1 9 – 1 7 2 4 ,doi:10.1126/science.289.5485.1719.
PA3201 SADEKOV ET AL.: SEAWATER TEMPERATURE RECONSTRUCTION
16 of 17
PA3201
7/21/2019 Depth of the oceans
http://slidepdf.com/reader/full/depth-of-the-oceans 17/17
LeGrande, A. N., and G. A. Schmidt (2006),Global gridded data set of the oxygen isotopiccomposition in seawater, Geophys. Res. Lett.,33, L12604, doi:10.1029/2006GL026011.
Locarnini, R. A., A. V. Mishonov, J. I. Antonov,T. P. Boyer, and H. E. Garcia (2006), World Ocean Atlas 2005, vol. 1, Temperature, NOAA
Atlas NESDIS , vol. 61, edited by S. Levitus,182 pp., NOAA, Silver Spring, Md.
Loncaric, N., F. J. C. Peeters, D. Kroon, andG.-J. A. Brummer (2006), Oxygen isotopeecology of recent planktic foraminifera at the central Walvis Ridge (SE Atlantic), Pa-leoceanography, 21, PA3009, doi:10.1029/ 2005PA001207.
Mashiotta, T. A., D. W. Lea, and H. J. Spero(1999), Glacial-interglacial changes in suban-tarctic sea surface temperature and d 18O-water using foraminiferal Mg, Earth Planet. Sci.
Lett ., 170, 417– 432, doi:10.1016/S0012-821X(99)00116-8.
McConnell, M. C., and R. C. Thunell (2005),Calibration of the planktonic foraminiferalMg/Ca paleothermometer: Sediment trap re-sults from the Guaymas Basin, Gulf of Cali-fornia, Paleoceanography, 20 , PA2016,doi:10.1029/2004PA001077.
McKenna, V. S., and W. L. Prell (2004), Cali- bration of the Mg/Ca of Globorotalia trunca-tulinoides (R) for the reconstruction of marinetemperature gradients, Paleoceanography, 19,PA2006, doi:10.1029/2000PA000604.
Mohtadi, M., S. Steinke, J. Groeneveld, H. G.Fink, T. Rixen, D. Hebbeln, B. Donner, andB. Herunadi (2009), Low-latitude control onseasonal and interannual changes in planktonicforaminiferal flux and shell geochemistry off south Java: A sediment trap study, Paleoceano-
g r a p h y , 2 4 , P A 1 2 0 1 , d o i : 1 0 . 1 0 2 9 / 2008PA001636.
Mucci, A. (1987), Influence of temperature onthe composition of magnesium calcite over-growths precipitated from seawater, Geochim.C osm ochim . Acta, 51 (7), 1977 – 1984,doi:10.1016/0016-7037(87)90186-4.
Mucci, A., and J. W. Morse (1983), The incor- poration of Mg2+ and Sr 2+ into calcite over-growths: Influences of growth rate andsolution composition, Geochim. Cosmochim.
Acta , 47 (2), 217–233, doi:10.1016/0016-7037(83)90135-7.
Mulitza, S., T. Wolff, J. Patzold, W. Hale, andG. Wefer (1998), Temperature sensitivity of
planktic foraminifera and its influence on theoxygen isotope record, Mar. Micropaleontol.,3 3 , 2 2 3 – 2 4 0 , d o i : 1 0 . 1 0 1 6 / S 0 3 7 7 -8398(97)00040-6.
Mulitza, S., D. Boltovskoy,B. Donner, H. Meggers,A. Paul, and G. Wefer (2003), Temperature:d 18O relationships of planktonic foraminiferacollected from surface waters, Palaeogeogr.
Palaeoclimatol. Palaeoecol., 202(1– 2), 143– 152.
Nu rn ber g, D., J. Bij ma, an d C. Hem leb en(1996), Assessing the reliability of magnesiumin foraminiferal calcite as a proxy for water mass temperatures, Geochim. Cosmochim.
Acta , 60(5), 803–814, doi:10.1016/0016-7037(95)00446-7.
Olley, J. M., P. De Deckker, R. G. Roberts, L. K.Fifield, H. Yoshida, and G. Hancock (2004),Optical dating of deep-sea sediments usingsingle grains of quartz: A comparison with
radiocarbon, Sediment. Geol., 169 ( 3 – 4 ) ,175 – 189, doi:10.1016/j.sedgeo.2004.05.005.
Peterson, L. C., and W. L. Prell (1985), Carbo-nate dissolution in recent sediments of theeastern equatorial Indian Ocean: Preservation
patterns and carbonate loss above the lyso-cline, Mar. Geol., 64 ( 3 – 4 ), 2 5 9 – 2 90 ,doi:10.1016/0025-3227(85)90108-2.
Ravelo, A. C., and R. G. Fairbanks (1992), Oxy-gen isotopic composition of multiple speciesof planktonic foraminifera: Recorders of themodern photic zone temperature gradient, Pa-leoceanography, 7 (6), 815–831, doi:10.1029/ 92PA02092.
Regenberg, M., D. Nurnberg, S. Steph,J. Groeneveld, D. Garbe-Schonberg, R. Tiedemann,and W.-C. Dullo (2006),Assessing theeffect of dissolution on planktonic foraminiferal Mg/Caratios: Evidence from Caribbean core tops,Geochem. Geophys. Geosyst., 7 , Q07P15,doi:10.1029/2005GC001019.
Regenberg, M., S. Steph, D. Nurnberg,R. Tiedemann , and D. Garb e-Schon berg(2009), Calibrating Mg/Ca ratios of multiple
planktonic foraminiferal species with d 18O-calcification temperatures: Paleothermometryfor the upper water column, Earth Planet.Sci. Lett., 278 , 324– 336, doi:10.1016/
j.epsl.2008.12.019.Reichart, G. J., F. Jorissen, P. Anschutz, and P. R.
D. Mason (2003), Single foraminiferal test chemistry records the marine environment,Geology, 31(4), 355–358, doi:10.1130/0091-7613(2003)031<0355:SFTCRT>2.0.CO;2.
Rink, S., M. Kuhl, J. Bijma, and H. J. Spero(1998), Microsensor studies of photosynthesisand respiration in the symbiotic foraminifer Orbulina universa, Mar. Biol. Berlin, 131,583 – 595, doi:10.1007/s002270050350.
Rosenthal, Y., and G. P. Lohmann (2002), Ac-curate estimation of sea surface temperaturesusing dissolution-corrected calibrations for Mg/Ca paleothermometry, Paleoceanography,17 (3), 1044, doi:10.1029/2001PA000749.
Rosenthal, Y., E. A. Boyle, and N. C. Slowey(1997), Temperature control on the incorpora-tion of magnesium, strontium, fluorine, andcadmium into benthic foraminiferal shellsfrom Little Bahama Bank: Prospects for ther-mocline paleoceanography, Geochim. Cosmo-chim. Acta, 61(17), 3633–3643, doi:10.1016/ S0016-7037(97)00181-6.
Rosenthal, Y., G. P. Lohmann, K. C. Lohmann,and R. M. Sherrell (2000), Incorporation and
preservation of Mg in Globigerinoides sac-culifer : Implications for reconstructing thetemperature and 18O/ 16O of seawater, Paleo-ceanography, 15(1), 135– 145, doi:10.1029/ 1999PA000415.
Russell, A. D., B. Honisch, H. J. Spero, andD. W. Lea (2004), Effects of seawater carbo-nate ion concentration and temperature onshell U, Mg, and Sr in cultured planktonicforaminifera, Geochim. Cosmochim. Acta,6 8 ( 2 1 ) , 4 3 4 7 – 4 3 6 1 , d o i : 1 0 . 1 0 1 6 /
j.gca.2004.03.013.Sadekov, A. Y., S. M. Eggins, and P. De Deckker
(2005), Characterization of Mg/Ca distribu-tions in planktonic foraminifera species byelectron microprobe mapping, Geochem. Geo-
phy s. Geo sys t. , 6 , Q12P06, doi:10.1029/ 2005GC000973.
Sadekov, A. Y., S. Eggins, and P. De Deckker (2006), Intraspecific variation in recent popu-lations of Globigerinoides ruber from the
eastern Indian Ocean: Evidence from test mor- pholog y and geochem istry, Anu. Inst. Geo-cienc., 29(1), 394.
Sadekov, A., S. M. Eggins, P. De Deckker, andD. Kroon (2008), Uncertainties in seawater thermometry deriving from intratest and intert-est Mg/Ca variability in Globigerinoides ru-be r , Paleoceanography, 23 , P A 1 2 1 5 ,doi:10.1029/2007PA001452.
Schmidt, G. A. (1999), Error analysis of paleo-salinity calculations, Paleoceanography,14(3), 422– 429, doi:10.1029/1999PA900008.
Shackleton, N. J. (1974), Attainment of isotopicequilibrium between ocean water and the
benthonic foraminiferal genus Uvigerina: Iso-topic changes in the ocean during the last gla-cial, Colloq. Int. CNRS , 219, 203– 209.
Spero, H. J. (1988), Ultrastructural examinationof chamber morphogenesis and biomineraliza-tion in planktonic foraminifer Orbulina uni-v e r s a , M a r. B i o l . B e r l i n , 9 9 , 9 – 2 0 ,doi:10.1007/BF00644972.
Spero, H. J. (1992), Do planktic foraminiferaaccurately record shifts in the carbon isotopiccomposition of seawater SCO2?, Mar. Micro-
paleontol., 19, 275–285, doi:10.1016/0377-8398(92)90033-G.
Spero, H. J., and D. W. Lea (1993), Intraspecificstable isotope variability in the planktic fora-minifera Globigerinoides sacculifer : Resultsfrom laboratory experiments, Mar. Micropa-leontol., 22, 221–234, doi:10.1016/0377-8398(93)90045-Y.
Spero, H. J., K. M. Mielke, E. M. Kalve, D. W.Lea, and D. K. Pak (2003), Multispecies ap-
proach to reconstructing eastern equatorial Pa-cific thermocline hydrography during the past 360 kyr, Paleoceanography, 18(1), 1022,doi:10.1029/2002PA000814.
Stott, L., C. Poulsen, S. Lund, and R. Thunell(2002), Super ENSO and global climate oscil-lations at millennial time scales, Science,2 9 7 ( 5 5 7 9 ) , 2 2 2 – 2 2 6 , d o i : 1 0 . 1 1 2 6 / science.1071627.
Whitko, A. N., D. W. Hastings, and B. P. Flower (2002), Past sea surface temperatures in thetropical South China Sea based on a newforaminiferal Mg calibration, MarSci, 1,doi:MARSci.2002.01.020101.
Zeebe, R. E., and A. Sanyal (2002), Comparisonof two potential strategies of planktonic for-aminifera for house building: Mg2+ or H+
removal?, Geochim. Cosmochim. Acta,66 (7), 1159– 1169, doi:10.1016/S0016-7037(01)00852-3.
F. Bassinot, Laboratoire des Sciences du
Climat et de l’Environnement, IPSL, CEA,CNRS, F-91198 Gif-sur-Yvette, France.
P. De Deckker and S. M. Eggins, ResearchSchool of Earth Sciences, Australian NationalUniversity, Canberra, ACT 0200, Australia.
W. Kuhnt, Institut fur Geowissenschaften,Christian-Albrechts-Universitat zu Kiel, Olshau-senstrasse 40, D-24118 Kiel, Germany.
U. Ninnemann, Department of Earth Science,University of Bergen, Allegaten 41, N-5007Bergen, Norway.
A. Sadekov, Grant Institute of GeoSciences,University of Edinburgh, The King’s Buildings,West Mains Road, Edinburgh EH9 3JW, UK.([email protected])
PA3201 SADEKOV ET AL.: SEAWATER TEMPERATURE RECONSTRUCTION
17 of 17
PA3201