department of economics - fea/usp · anonymous referees, as well as participants at the eastern...
TRANSCRIPT

LAURA CARVALHO
ARMON REZAI
WORKING PAPER SERIES Nº 2014-23
Department of Economics - FEA/USP
Personal Income Inequality and Aggregate Demand

DEPARTMENT OF ECONOMICS, FEA-USP WORKING PAPER Nº 2014-23
Personal Income Inequality and Aggregate Demand
Laura Carvalho ([email protected])
Armon Rezai ([email protected])
JEL Codes: D31; D33; E25; C32
Keywords: Income inequality; demand regimes; Neo-Kaleckian model; personal and functional income distribution.
Abstract:
This paper presents a theoretical and empirical investigation of how changes in the size distribution of income can affect aggregate demand and the demand regime of an economy. After presenting empirical evidence for the US economy that the propensity to save increases significantly from the bottom to the top quintile of wage earners, we demonstrate that more equal distributions always lead to higher output in the traditional neo-Kaleckian macroeconomic model. We also present conditions under which a reduction of income inequality among workers turns demand more wage-led. This view is supported by the results of an econometric study for the United States (1967-2010) which show that the rise after 1980 in income inequality has made the US economy more profit-led.

Personal income inequality and aggregate demand∗
Laura Carvalho† Armon Rezai‡
October 21, 2014
Abstract
This paper presents a theoretical and empirical investigation of howchanges in the size distribution of income can affect aggregate demand andthe demand regime of an economy. After presenting empirical evidencefor the US economy that the propensity to save increases significantlyfrom the bottom to the top quintile of wage earners, we demonstrate thatmore equal distributions always lead to higher output in the traditionalneo-Kaleckian macroeconomic model. We also present conditions underwhich a reduction of income inequality among workers turns demand morewage-led. This view is supported by the results of an econometric studyfor the United States (1967-2010) which show that the rise after 1980 inincome inequality has made the US economy more profit-led.
Keywords: Income inequality, demand regimes, Neo–Kaleckian model,personal and functional income distribution.
JEL classification numbers: D31, D33, E25, C32
∗We benefited from comments by Lance Taylor, Luca Zamparelli, Lucas Teixeira and twoanonymous referees, as well as participants at the Eastern Economic Association Conference,the World Keynes Association Conference, the Brazilian Keynesian Association Conferenceand the Research Network Macroeconomics and Macroeconomic Policies Conference. Theusual disclaimer applies.†University of Sao Paulo, Department of Economics. Corresponding author: decar-
[email protected].‡Vienna University of Economics and Business, Department of Socio-Economics. Also
affiliated with IIASA.

1 Introduction
As the unprecedentedly large share of income appropriated by the top 1% wasincorporated into the slogan of the Occupy Wall Street movement, the substan-tial rise in income inequality in the United States since the 1970s has becomeacknowledged by a wider public. In the economic literature, the main refer-ence for this topic has recently become the book by Piketty (2014), even if inthe particular case of the US, the main findings had been presented in Pikettyand Saez (2003), who compiled a series for the top shares of income and wagesbetween to conclude that income inequality has not only been increasing asa whole in the recent decades, but also that the working rich have replacedthe rentiers at the top of the US income distribution.1 The role of managerialworkers and their hybrid nature has been discussed seminally by Kalecki (1971)and Gordon (1996). Mohun (2012) presents recent evidence of the increase inthe share of supervisory workers in total wages. This phenomenon serves asmain motivation for this paper which aims at studying the implications of arising inequality among wage earners for aggregate demand and its relationshipto functional income distribution. The proponents of the Occupy Wall Streetmovement have, among other things, called for reform of the tax system to re-duce income inequality. Our theoretical and empirical work traces through thegenerally positive macroeconomic implications of such policy proposals.
The macroeconomic effects of changing the functional distribution of incomehas been investigated extensively in both the theoretical and empirical economicliterature. Already Keynes (1936) recognized the distributive effects on demand,e.g. in his condemnation of high-saving rentiers and bear speculators. Kalecki(1942) formalized the idea that savings propensities are different between profitearners and wage earners by assuming that saving is done exclusively by capi-talists. Kaldor (1955-56) discusses the effects of differential saving rates on thedistribution of income. This assumption has then been combined with Kaleck-ian mark-up pricing and an independent investment function in the so-calledNeo-Kaleckian (or Kalecki-Steindl) models developed seminally by Rowthorn(1982), Dutt (1984), Taylor (1985) and Bhaduri and Marglin (1990). The cru-cial role played by the functional distribution of income in the determination ofboth consumption and investment in these models has given rise to the conceptsof wage- and profit-led demand regimes, depending on which effect dominates.
Based on these ideas, empirical investigations of the overall effect of redis-tributing toward wages for different countries, time periods or specifications ofdemand and distributive variables have yielded contradicting results. Estima-tions of full macro models tend to show profit–led demand regimes (Franke,Flaschel, and Proano, 2006; Chiarella, Franke, Flaschel, and Semmler, 2004;Barbosa-Filho and Taylor, 2006). Studies accommodating open economy ef-fects (Bowles and Boyer, 1995; Naastepad and Storm, 2007; Ederer and Stock-hammer, 2007; Hein and Vogel, 2008) find that small open economies (like the
1Palma (2011) extends the empirical analysis to a large number of countries and showsthat inequality within countries rather than across country has been the major cause of theglobal trend in income inequality in the past decades.
1

Netherlands or Austria) are more likely to be profit-led than large, relativelyclosed ones (like the US or the Euro area as a whole), even if domestic demand—consumption vs. investment—happens to be wage–led. As Gordon (1995) putit early on: ”[...] the estimated coefficients from the net-export equation areinstrumental in determining the final sign of the utilization function” (p. 361).2
In addition to the consideration of open economy effects, the original conceptsof wage- and profit-led demand regimes have been further extended to includepossible non-linearities in the relationship between the wage share and the de-gree of capacity utilization, as studied in Nikiforos and Foley (2012). Theseextensions are challenging previous empirical results and the very existence ofstable demand regimes in particular countries over time.3
This paper extends the short-run Neo-Kaleckian framework to address adifferent kind of bias in such empirical and theoretical arguments: the size dis-tribution of income. As the evidence presented in Piketty and Saez (2003) andPiketty (2014) highlights, rising inequality in the United States in the recentdecades has been characterized by an increase in the share of income held by thetop wage earners in addition to a falling wage share. One possible approach tothis problem, taken by Dutt (1992) and Lavoie (1996), is to add an unproduc-tive managerial class to the basic Kaleckian framework and examine the effectsof wage inequality between managers and workers. Indeed, by also endogeniz-ing the functional distribution of income and wage inequality itself, Tavani andVasudevan (2014) find that wage-led regimes in terms of the distribution withinthe wage bill workers and co-exist with profit-led regimes in the functional in-come distribution. Palley (2013) proposes a model with three classes (workers,middle-class managers, and capitalist top managers) and studies the potentialmacroeconomic outcomes in terms of growth and distribution resulting fromlabor market conflict among these classes.
This paper has a similar motivation, but follows a different strategy. Insteadof adding a third class to the Kaleckian framework, we provide both an empiricaland a theoretical explanation for the savings rate to be an increasing functionof wage inequality. Based on this extension, we ask two main questions: (i) howhas this increase in the top share of income affected aggregate demand for agiven level of the wage share? and (ii) did this increase contribute to the weakresponse of consumption to the wage share, thus turning the demand-regimemore profit-led?
In an attempt to answer these questions, the paper is organized as follows.First, based on stylized facts regarding the relationship between savings ratesand income inequality in the United States, Section 2 extends the standard
2Recent empirical work by Storm and Naastepad (2012), however, shows wage-led resultsfor a large number of OECD countries, and attributes a more important role to investmentthan to net exports in the explanation of profit-led cases.
3An additional source of contention is the relationship between the demand regime and thebusiness cycle. Barbosa-Filho and Taylor (2006) find Goodwin cycles in the US economy. Theonly dynamically stable combination rationalizing this pattern is a profit-led demand regimewith a profit-squeeze distribution regime (see Taylor (2004) for details). Proao, Flaschel,Krolzig, and Diallo (2011) argue that this argument ignores the stabilizing role of monetarypolicy. Empirical findings in Rezai (2014a), however, reject their theoretical objection.
2

Neo-Kaleckian model to account for different size distributions of wage income.While greater inequality necessarily reduces aggregate demand, we show thatthe effect of inequality on the demand regime of the economy depends on var-ious parameters due to multiplier effects. Second, in Section 3, we present aneconometric study examining the role of income inequality in determining thedemand regime for the United States from 1967 to 2010. We find that theincrease in inequality after 1980 has made the economy more profit-led.
2 Macroeconomic effects of the size distributionof income
2.1 Empirical Motivation
Most Neo–Kaleckian models assume that savings rates are different for differentincome classes. While this assumption is plausible, it is usually taken at facevalue without presenting empirical evidence. In this section we present suchevidence for the US economy. In doing so, we use data for the quintiles ofincome before taxes from the Consumer Expenditure Survey as provided by theBureau of Labor Statistics.4
Figure 1: Savings rate per income quintile in the United States (1985-2010)
In Figure 1 we report the savings rates for each quintile of income after taxes.We computed these by calculating (1 − C/Y ), where C is the average annualexpenditure and Y is the average annual income of each quintile. Savings ratesincrease strongly with income.5 Whereas the top 20% saved about 40 % of
4Tables from 1984 to 2010 are available at http://www.bls.gov/cex/. Data on the aggregatesaving rate is conventionally taken from the NIPA. Taylor, Rezai, Kumar, Carvalho, andBarbosa-Filho (2014) discuss comparability of the two data sources.
5Not all income depicted in figure 1 is wage income but data limitations do not permita separation of wage and profit income. Taylor, Rezai, Kumar, Carvalho, and Barbosa-Filho (2014) disaggregate sources of household income showing that the ratio of income fromfinance to wage income rises dramatically from 1:0.002 for the bottom quintile over 1:0.06 forthe middle 20% to 1:0.15 for the top quintile (and 1:0.25 for the top 1%). The dispersion of
3
their income in 2005, the middle 20% saved less than 10% and the bottom 20%borrowed to finance a substantial part of their expenditure. Personal incomeclearly matters for individual saving behavior and the distribution of income,therefore, clearly matters for aggregate saving.
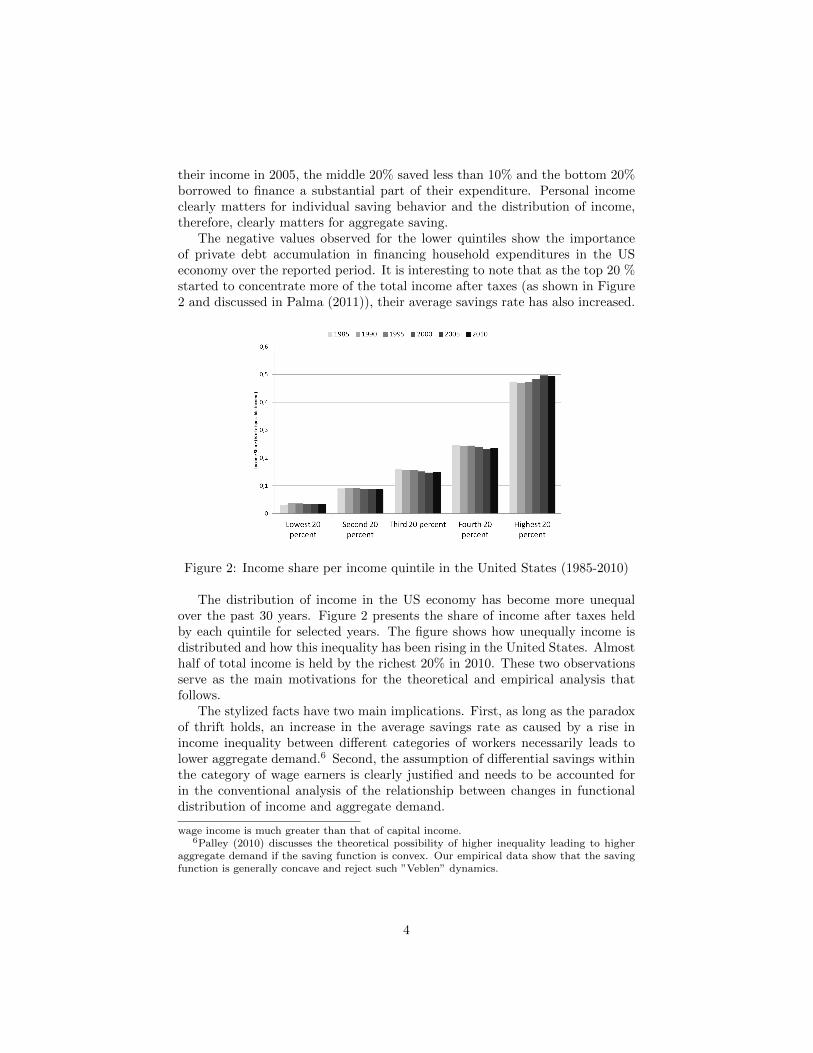
The negative values observed for the lower quintiles show the importanceof private debt accumulation in financing household expenditures in the USeconomy over the reported period. It is interesting to note that as the top 20 %started to concentrate more of the total income after taxes (as shown in Figure2 and discussed in Palma (2011)), their average savings rate has also increased.
Figure 2: Income share per income quintile in the United States (1985-2010)
The distribution of income in the US economy has become more unequalover the past 30 years. Figure 2 presents the share of income after taxes heldby each quintile for selected years. The figure shows how unequally income isdistributed and how this inequality has been rising in the United States. Almosthalf of total income is held by the richest 20% in 2010. These two observationsserve as the main motivations for the theoretical and empirical analysis thatfollows.
The stylized facts have two main implications. First, as long as the paradoxof thrift holds, an increase in the average savings rate as caused by a rise inincome inequality between different categories of workers necessarily leads tolower aggregate demand.6 Second, the assumption of differential savings withinthe category of wage earners is clearly justified and needs to be accounted forin the conventional analysis of the relationship between changes in functionaldistribution of income and aggregate demand.
wage income is much greater than that of capital income.6Palley (2010) discusses the theoretical possibility of higher inequality leading to higher
aggregate demand if the saving function is convex. Our empirical data show that the savingfunction is generally concave and reject such ”Veblen” dynamics.
4

2.2 Theoretical argument
Most neo-Kaleckian models restrict themselves to differences in the saving be-havior out of different sources of income. Their focus lies on the distributionbetween wages and profits, the functional income distribution.7 We find thissurprising as these models can easily incorporate personal income inequality. Weproceed by presenting an intuitive explanation of how income inequality affectsthe macroeconomy; a detailed application using a specific functional form forthe saving function and a Pareto distribution of income is relegated to AppendixA.
Aggregate income is determined by independent investment and consump-tion/saving decisions. We retain the Steindlian-Kaldorian formulation for theinvestment function, in which investment I depends positively on the rate ofcapacity utilization u and on the rate of profit r, as well as on the autonomouscomponent γ0 representing so-called ”animal spirits”. We modify the savingfunction Sw such that the propensity to save out of wages sw now depends onthe size distribution of income among workers, captured in the inequality mea-sure σ. The more unequal the distribution, the higher σ and the higher theoverall saving propensity: s′w > 0. With this small, but important modificationwe can state the model equations. We use the model presented in chapter 5 ofTaylor (2004).8
gi =I
K= γ0 + γuu+ γπr = γ0 + (γu + γπ(1− ψ))u (1)
gsw =SwK
= sw[σ] ψ u
gsπ =SπK
= sπ π u = sπ (1− ψ) u
With λ > 0, macroeconomic balance between savings and investment re-quires that in equilibrium
u = λ (gi − (gsw + gsπ)) = 0. (2)
Substituting equations (1) into (2), we obtain the standard expression forshort-run equilibrium output
u∗ = u|u=0 =γ0
−(γu + γπ(1− ψ)− sw[σ] ψ − sπ (1− ψ))=γ0
∆> 0.
Output is determined by autonomous investment, γ0, times the multiplier,∆. We assume that the Keynesian stability condition holds, i.e. du
du = −∆ < 0.
7As mentioned in the introduction, one exception are models which incorporate a thirdclass to the model to represent managers in the form of unproductive labor.
8As in Taylor (2004), all variables will be given as ratios of the capital stock K. The rateof capacity utilization u will be approximated by the output-capital ratio by assuming thatcapital productivity, namely the ratio of potential output to capital, is constant.
5

Inequality affects the economy’s overall saving decisions. As wage income isredistributed from low- to high-saving classes, leakage increases and aggregatedemand falls as one would predict under the Paradox of Thrift. Put formally,this implies
du∗
dσ=
γ0
∆2
∂∆
∂σ= −u∗ ψ
∆
dsw[σ]
dσ< 0. (3)
It is clear that redistribution among wage earners always stimulates demandand increases output. This effect is represented by a shift from point A to B inFigures 3 and 4.
The usual debate on redistribution focuses on functional income redistribu-tion, assuming equal distribution within factors. While this assumption mightbe innocuous for profit earners, the empirical evidence presented in section 2demonstrates clearly that this does not hold for wage earners. Moreover, theassumption of unequal distribution of wages affects the response of output to thefunctional income redistribution, i.e. the demand regime. The demand regimeof an economy is defined as
du∗
dψ=u∗
∆[(sπ − sw[σ])− γπ] ≶ 0. (4)
If an increase in the wage share increases capacity utilization, the economy issaid to be ’wage-led’, if the opposite holds the economy is considered ’profit-led’.In this model, it is clear from expression (4), that the economy is wage-led ifthe saving differential between capitalists and workers (sπ − sw) is large andinvestment responds weakly to lower profitability as represented by a low γπ.The first effect of functional income distribution decreases overall leakage in theeconomy, the second effect prevents injections to fall as ψ increases.
Personal income distribution influences saving out of wages, it thereby alsoaffects the demand regime of the economy, a feature that has received muchattention over the past 20 years (Bowles and Boyer, 1995; Taylor, 2004; Barbosa-Filho and Taylor, 2006; Chiarella, Franke, Flaschel, and Semmler, 2004; Franke,Flaschel, and Proano, 2006; Ederer and Stockhammer, 2007; Hein and Vogel,2008). Basic intuition tells us that an increase in inequality, caused by a risingshare of income held by the top wage earners, increases the average saving out ofwage income. This weakens the positive demand effects of a functional incomeredistribution, namely the fall in leakages. However, the changes in the savingsrate also reduces the multiplier and capacity utilization with more subtle effectson investment and saving and, overall, ambiguous effects on the demand regime.To see this more clearly, we differentiate the expression (4) with respect to σ
ddu∗
dψ
dσ= −u
∗
∆
dswdσ− du∗
dψ
1
∆
dswdσ
= − 1
∆(u∗ + 2ψ
du∗
dψ)dswdσ
≶ 0. (5)
The first term in the inequality captures the immediate effect of saving out ofwages on the demand regime: higher personal income inequality increases savingout of wages, which lowers the differential between saving out of profits and out
6

of wages. Higher inequality pushes the demand regime toward more ’profit-ledness’. However, there are repercussions through the effect of inequality onthe multiplier (saving and investment behavior). This mechanism is captured inthe second term of the inequality in (5). This term depends on (and takes thesign of) the demand regime itself and is positive when the economy is wage-ledand negative otherwise.
Figure 3: Response of aggregate demand to a reduction in wage inequality inthe wage-led case
Hence, while egalitarian policies of income redistribution always increase ca-pacity utilization in this model, their effect on the demand regime of the econ-omy is ambiguous. If the economy is wage-led, redistribution always pushesthe economy toward wage-ledness, as represented in Figure 3. This holds alsotrue if the economy is ”weakly profit-led”. Only if the economy is ”stronglyprofit-led” (strong investment responds to profitability and low functional sav-ing differentials), personal income equality leads to more profit-ledness. Theambiguous change in the slope of the demand curve following a reduction ininequality in the profit-led scenario is represented in Figure 4, giving rise todifferent responses to an exogenous increase in the wage share (points C andD).
Barbosa-Filho and Taylor (2006) found that the US economy is profit-led.In this case, sole theoretical considerations cannot identify the effect of personalwage income inequality on the US economy’s demand regime. In the next sectionwe reestimate their model accounting for personal income inequality to informthis question empirically.9
9Others studies found that the US are wage-led (see literature review at the end of section1). In this case, a reduction in wage inequality necessarily makes the economy more wage-led.
7

Figure 4: Response of aggregate demand to a reduction in wage inequality inthe profit-led case
3 Empirical analysis
3.1 Methodology and Data
One of the main difficulties in estimating demand regimes lies in a potentialendogeneity problem between measures of aggregate demand and income dis-tribution. Indeed, as addressed by the literature focused on Goodwin cycles(Goodwin, 1967), income distribution not only affects, but may also be affectedby aggregate demand if lower unemployment leads to an increase in the powerof bargaining of workers. Two main approaches to address this problem can befound in the empirical literature. The first has involved the use of instrumentalvariables to control for each of the two directions of causality (see for instanceNikiforos and Foley (2012)). The second has been to estimate a system of dy-namic equations simultaneously in a Vector Autoregression (VAR) or a VectorError Correction (VEC) model, thus taking both directions of causality intoaccount. The latter approach was the one used in Barbosa-Filho and Taylor(2006), who by means of a two-dimensional VAR model for capacity utilizationand the wage share have found demand in the United States to be profit-led.Based on these results, the empirical study done in this section will investigatethe role of income inequality in determining such demand regime by makinguse of a similar method: a two-dimensional Threshold Vector Autoregression(TVAR).
The idea of the threshold autoregressive model first developed by Tong
By using a model in our empirical study which finds a profit-led demand regime, we load thedice against this outcome.
8

(1990) is to allow for a non-linearity in the dynamic relationship that is es-timated. In other words, a threshold defined by the level of a certain variableis searched so as to minimize the sum of squared residuals and the estimatedcoefficients are different in the so-called low and high regimes. The regime-switching (threshold) autoregressive model was extended to the multivariatecontext by Tsay (1998), giving rise to the Threshold Vector Autoregressivemodel (TVAR).10A two-dimensional TVAR will be estimated for the degree ofcapacity utilization and the labor share, using a measure of the size distributionof income as the threshold variable. In other words, the model allows us to in-vestigate whether the level of income inequality affects the response of aggregatedemand to the functional distribution of income.
The quarterly series for the degree of capacity utilization was calculated asthe ratio between actual output (obtained from the Bureau of Labor Statistics)and potential output.11 The series for the labor share is also provided from theBureau of Labor Statistics at quarterly frequency. Both series will be used inlogarithmic form in the estimations. Finally, income inequality will be measuredby the Gini Coefficient provided by the U.S. Census Bureau (2010)12 from 1967to 2010 annually. The conversion from annual to quarterly data was made bycubic interpolation.
A two-dimensional TVAR for the labor share and capacity utilization (inlogarithmic form) was then estimated using two lags and the Gini coefficientas a threshold variable (lagged by one period), for the period 1967-2010. Thethreshold value was selected automatically based on a grid search which mini-mized the sum of squared residuals of the corresponding estimation.13
Linear accumulated impulse response functions to Cholesky standard de-viation innovations were computed for the two regimes separately using thecorresponding coefficients and the residuals of each TVAR14.
3.2 Results
The results of the TVAR estimation for the period 1967-2010 are presentedin Table 1 in the Appendix. The selected threshold for the Gini coefficientdetermining the low and high inequality regimes was 0.406, which correspondsto the value attained in 1981. The low (high) inequality regime, which comprises32.9% (67.1%) of the total of observations, thus corresponds to the years before(after) 1981. Both regimes are shown to be characterized by profit-led demand,
10Different types of models have been developed to address non-linearities in time seriessince Tong’s original threshold autoregressive model. See Hansen (2011) for a survey of suchdevelopments applied to economics.
11As in Barbosa-Filho and Taylor (2006), the series for potential output was derived fromthe output series using a Hodrick-Prescott filter.
12Current Population Survey, Annual Social and Economic Supplements, available athttp://www.census.gov/hhes/www/income/data/historical/household/h04.html
13The R program is available from authors upon request.14Since exogenous shocks may generate a switch from one regime to the other, general-
ized non-linear impulse response functions based on initial conditions are developed in Koop,Pesaran, and Potter (1996), but will not be estimated here.
9

with the total effect of the labor share Ψ in the equation for capacity utilization ubeing negative even if it is positive for the first lag (due to higher consumption).
Figure 5 presents the accumulated response of the degree of capacity uti-lization to a standard deviation shock in the labor share for the low and highinequality regimes15. The figure shows that in the high inequality regime theimpact of an increase in the wage share in capacity utilization is more nega-tive. In other words, results of the TVAR suggest that the increase in incomeinequality has turned demand more profit-led in the United States over this pe-riod. Hence, these results seem to confirm the theoretical argument presentedin the previous section which corresponds to the weakly profit-led case.
Our results do not capture the full picture, namely the joint roles of personalincome inequality, open economy effects and consumer debt in the determinationof the (possibly non-linear) relationship between functional income distributionand the level of economic activity. Yet, if we consider that a rise in inequalitymay also increase the level of consumer debt, high inequality periods would tendto be more wage-led, as the rise in debt would reduce the fall in consumptionfollowing a redistribution toward profits. Hence, controlling for this channelcould have the potential effect of strengthening our main result, thus stressingthe importance of savings differentials withing wage earners as a transmissionmechanism.
4 Discussion
Income distribution has become more unequal in the past decades, reversingmuch of the gains from post-WWII. This holds true for shifts toward profitsin the functional income distribution and shifts toward high-income earnerswithin wage income. While these shifts have gained the attention of the widerpublic through the ’Occupy Wall Street’ movement, the academic debate hasfocused almost exclusively on the impact of changes in the functional incomedistribution.
Empirical evidence clearly shows that wage earners have different savingrates depending on the disposable income. Saving rates rise from negative forthe bottom 20% to as high as 40% for the top 20% in the year 2010. Given thesedifferences in saving behavior, we analyze the effects of recent increases in wageincome inequality on aggregate demand and the economy’s demand regime.
While the Paradox of Thrift predicts that output falls as inequality rises,the effects of changes in the functional income distribution on output underdifferent wage income distributions is ambiguous. Higher wage equality makesthe economy more wage-led. If the economy is profit-led, the sign of this effectis ambiguous and depends on the level of demand regime itself. These nonlineareffects in the IS curve complements recent work on non-linearities by Nikiforosand Foley (2012) who present empirical evidence for a non-linear distributionschedule.
15The impulse response functions for the other direction of causality – the effect of aggregatedemand on distribution – are presented in the appendix but will not be analyzed here.
10

Figure 5: Accumulated impulse response function of the degree of capacityutilization to a standard deviation shock in the labor share in the low and highinequality regimes for the United States (1967-2010)
11

Since our theoretical model cannot clearly identify the effects of wage incomeinequality on the demand regime, we proceed empirically by estimating a non-linear version of the model by Barbosa-Filho and Taylor (2006) in order todetermine the effect of income inequality on the demand regime for the post-WWII US economy. The linear estimation by the authors had suggested thatthe US economy is profit-led. Our estimations show that a large part of thisresult is due to the high inequality level after 1981.
These findings add to recent evidence that the standard Kaleckian modelincompletely captures interactions between demand and distribution when ap-plied to today’s advanced economies: Dutt (2006) extends the model to accountfor consumer debt, illustrating the positive short run of consumer borrowing ondemand and the potentially negative implications for future growth and finan-cial stability. Rezai (2014b) and von Arnim, Tavani, and de Carvalho (2012)highlight the importance of open-economy issues. We introduce personal incomedistribution as a third omitted and potentially important bias.
Our results have clear and important implications for economic policy. Asthe Great Recession keeps unfolding and the political climate shifts increasinglyagainst traditional economic stimuli to prop up demand, taxes-and-transferschemes can prove effective. While the demand effects of increases in moneywages might be repressed by concurrent increases in inflation under mark-uppricing rules, the demand effect of redistribution from profits toward wages de-pends on the economy’s demand regime. Our findings suggest that egalitarianpolicies within wage earners increase demand irrespective of such considera-tions. Lowering wage income inequality always increases aggregate demand dueto the Paradox of Thrift. Moreover, lowering inequality among wage earnerscan, and in fact in the US economy does, tilt the economy in a wage-led direc-tion, providing arguments for progressive and expansionary policy in the formof redistribution in functional income on economic – rather than mere social –grounds in the future.
12

References
Barbosa-Filho, N., and L. Taylor (2006): “Distributive And Demand Cy-cles In The Us Economy-A Structuralist Goodwin Model,” Metroeconomica,57(3), 389–411.
Bhaduri, A., and S. Marglin (1990): “Unemployment and the Real Wage:The Economic Basis for Contesting Political Ideologies,” Cambridge Journalof Economics, 14(4), 375–393.
Bowles, S., and R. Boyer (1995): “Wages, aggregate demand, and employ-ment in an open economy,” in Macroeconomic Policy After the ConservativeEra, ed. by G. Epstein, and H. Gintis. Cambridge University Press, Cam-bridge, UK.
Chiarella, C., R. Franke, P. Flaschel, and W. Semmler (2004): Quan-titative and Empirical Analysis of Nonlinear Dynamic Macromodels, Volume277. Harvard University Press, Amsterdam.
Dutt, A. K. (1984): “Stagnation, Income Distribution and Monopoly Power,”Cambridge Journal of Economics, 8(1), 25–40.
(1992): “Stagnation, Growth, and Unproductive Activity,” in TheEconomic Surplus in Advanced Economies, ed. by J. Davies. Edward Elgar,Aldershot.
(2006): “Maturity, Stagnation And Consumer Debt: A SteindlianApproach,” Metroeconomica, 57(3), 339–364.
Ederer, S., and E. Stockhammer (2007): “Wages and aggregate demandin France: an empirical investigation,” in Money, Distribution and EconomicPolicy: Alternatives to Orthodox Macroeconomics, ed. by E. Elgar. CambridgeUniversity Press, Cheltenham.
Franke, R., P. Flaschel, and C. R. Proano (2006): “Wage-price dynam-ics and income distribution in a semi-structural Keynes-Goodwin model,”Structural Change and Economic Dynamics, 17(4), 452–465.
Goodwin, R. (1967): “A Growth Cycle,” in Socialism, Capitalism, andGrowth, ed. by C. Feinstein. Harvard University Press, Cambridge, Mas-sachusetts.
Gordon, D. (1995): “Growth, distribution, and the rules of the game: socialstructuralist macro foundations for a democratic economic policy,” in Macroe-conomic Policy After the Conservative Era, ed. by G. Epstein, and H. Gintis,p. 335383. Cambridge University Press, Cambridge, UK.
Gordon, D. (1996): Fat and Mean: The Corporate Squeeze of Working Amer-icans and the Myth of Managerial ’Downsizing’. The Free Press, New York,NY.
13
Hansen, B. (2011): “Threshold autoregression in economics,” Statistics andits interface, 17, 123–127.
Hein, E., and L. Vogel (2008): “Distribution and growth reconsidered: em-pirical results for six OECD countries,” Cambridge Journal of Economics,32(3), 479–511.
Kaldor, N. (1955-56): “Alternative Theories of Distribution,” The Review ofEconomic Studies, 23(2), 83–100.
Kalecki, M. (1942): “A Theory of Profits,” The Economic Journal, 52(206–207), 258–267.
(1971): “Class struggle and the distribution of national income,” Kyk-los, 24(1), 1–9.
Keynes, J. (1936): The General Theory of Employment, Interest and Money.Palgrave Macmillan, London.
Koop, G., M. H. Pesaran, and S. M. Potter (1996): “Impulse responseanalysis in nonlinear multivariate models,” Journal of Econometrics, 74(1),119–147.
Lavoie, M. (1996): “Unproductive Outlays and Capital Accumulation withTarget-return Pricing,” Review of Social Economy, 54(3), 303–322.
Mohun, S. (2012): “Unproductive Labor in the US Economy,” Discussionpaper, mimeo.
Naastepad, C. W., and S. Storm (2007): “OECD demand regimes (1960-2000),” Journal of Post Keynesian Economics, 29(2), 211–246.
Nikiforos, M., and D. K. Foley (2012): “Distribution And Capacity Uti-lization: Conceptual Issues And Empirical Evidence,” Metroeconomica, 63(1),200–229.
Palley, T. (2010): “The Relative Permanent Income Theory of Consump-tion: A Synthetic Keynes-Duesenberry-Friedman Model,” Review of PoliticalEconomy, 22(1), 41–56.
(2013): “A neo-Kaleckian-Goodwin model of capitalist economicgrowth: monopoly power, managerial pay and labour market conflict,” Cam-bridge Journal of Economics, p. forthcoming.
Palma, J. (2011): “Homogeneous Middles vs. Heterogeneous Tails, and theEnd of the Inverted-U: It’s All About the Share of the Rich,” Developmentand Change, 42(1), 97–153.
Piketty, T. (2014): Capital in the twenty-first century. Harvard UniversityPress: Cambridge.
14

Piketty, T., and E. Saez (2003): “Income Inequality In The United States,1913-1998,” The Quarterly Journal of Economics, 118(1), 1–39.
Proao, C., P. Flaschel, H. Krolzig, and M. Diallo (2011): “MonetaryPolicy and Macroeconomic Stability under Alternative Demand Regimes,”Cambridge Journal of Economics, 35(3), 569–585.
Rezai, A. (2014a): “Cycles of Demand and Distribution and Monetary Policyin the US Economy,” Journal of Post Keynesian Economics, 36, 231–250.
(2014b): “Demand and distribution of integrated economies,” Cam-bridge Journal of Economics, p. forthcoming.
Rowthorn, R. (1982): “Demand, real wages and economic growth,” StudiEconomici, 1(18), 3–54.
Storm, S., and C. W. M. Naastepad (2012): Macroeconomics Beyond theNAIRU. Harvard University Press, Cambridge, Massachusetts.
Tavani, D., and R. Vasudevan (2014): “Capitalists, workers, and managers:Wage inequality and effective demand,” Structural Change and EconomicDynamics, 30(0), 120 – 131.
Taylor, L. (1985): “A Stagnationist Model of Economic Growth,” CambridgeJournal of Economics, 9(4), 383–403.
(2004): Reconstructing Macroeconomics. Structuralist Proposals andCritiques of the Mainstream. Harvard University Press, Cambridge, Mas-sachusetts.
Taylor, L., A. Rezai, R. Kumar, L. Carvalho, and N. Barbosa-Filho(2014): “US Size Distribution and the Macroeconomy, 1986-2009,” in Macroe-conomics and Development: Roberto Frenkel and the Economics of LatinAmerica, ed. by M. Damill, M. Rapetti, and G. Rozenwurcel, p. ch. 15.Columbia University Press, New York, NY.
Tong, H. (1990): Non-linear time series: a dynamic system approach. Claren-don Press, Cambridge, Massachusetts.
Tsay, R. S. (1998): “Testing and Modeling Multivariate Threshold Models,”Journal of the American Statistical Association, 93(443), 1188–1202.
von Arnim, R., D. Tavani, and L. de Carvalho (2012): “Globalizationas coordination failure: A Keynesian perspective,” Department of EconomicsWorking Paper 02/2012, New School for Social Research.
Yakovenko, V. (2012): “Applications of statistical mechanics to economics:Entropic origin of the probability distributions of money, income, and energyconsumption,” in Analytical Insights and Social Fairness: Economic Essaysin the Spirit of Duncan K. Foley, ed. by L. Taylor, A. Rezai, and T. Michl.Routledge.
15

Appendix
A An application of the model
In this section we present the derivation of the aggregate saving function for aneconomy in which wage income follows a Pareto (Type I) distribution. We pickthe Pareto distribution for three reasons: first, since income cannot be negative,the probability density function needs a lower limit under which it has measure0. This limit is defined as parameter k for the Pareto distribution. Second,Yakovenko (2012) demonstrates that the distribution of personal income in theUS exhibits a ’fat’ tail. The Pareto distribution has such a fat tail. Third, closedform solutions can be derived for the Lorenz curve and the GINI coefficient whenincome follows the Pareto distribution.
Let personal income equal y > κ, then the probability density function (pdf)of a Pareto distribution is
f(y) =
k αyα−1 if κ ≤ y0 if κ > y
The median, µ, and median, ν, of a Pareto are defined as
µ =κ α
α− 1for α > 1 and ν = 21/ακ.
We assume that personal saving decision of household i depends the incomeof household i, yi, and the income of the median household, yν . Household i’ssaving is defined as
Si = a0 yi + a1(yi − yν).
Aggregate saving is the sum of all saving:
Sw =
∫[a0 yi + a1(yi − yν)] f(y) dy = a0 µ+a1(µ−ν) =
[a0 + a1(1− ν
µ)
]µ.
µ eqals average income, which has to be related to the macro variables ofthe Kaleckian model of section 2. Average income times population size has toequal aggregate wage income: µ L ≡ ψ X or µ ≡ ψ u k. A Pareto distributionhas 2 degrees of freedom, κ and α. We use κ to ensure that changes in thedistribution are mean-preserving (i.e. the identity is satisfied),
κ ≡ α− 1
αψ u k.
Population size is normalized to 1, L ≡ 1. Substituting this expression andthe expression for the Gini coefficient, Γ = 1
2α−1 , into the saving function, weobtain a saving function of the form used in our empirical and theoretical model
SwK
=
[a0 + a1(1− 21/α α− 1
α)
]ψ u =
[a0 + a1(1− 4
Γ1+Γ
(1− Γ)
1 + Γ)
]ψ u = sw [Γ] ψ u.
16

with sw [Γ] the average propensity to save (APS). The second parameter ofthe Pareto distribution, Γ, captures the degree of wage income inequality. As Γincreases, more income is concentrated at the bottom and the more equal wageincome distribution.
sw [Γ] has both properties used for the comparative statics used in section2: first, average aggregate saving rises as the economy becomes more unequaland, second, under equally distributed income, the analysis conflates to thetraditional assumption of a constant APS:
dswdΓ
< 0
limΓ→0
sw → a0
limΓ→1
sw → a0 + a1
Our results therefore hold for specific (and realistic) assumptions on thedistribution of income across wage earners. The results also demonstrate howour model is a generalize variant of the standard Kalecki-Steindl growth model.
B Econometric results
Equation for u Equation for ΨLow Inequality High Inequality Low Inequality High Inequality
u−1 1.3095*** 1.4477*** -0.0039 0.0732u−2 -0.5941*** -0.6297*** 0.2071* 0.0948Ψ−1 0.8536*** 0.2956** 0.5271*** 0.7473***Ψ−2 -0.9124*** -0.3181** 0.1603 0.2652**Intercept 0.2456 0.0932 1.3061*** -0.053Signif. Codes: *** 1%; **5%; *10%Threshold value: 0.406469Percentage of Observations in each regime: 32.9% 67.1%
Table 1: Results of the two-dimensional TVAR estimation for the United States(1967-2010) using the Gini Coefficient as a threshold.
17
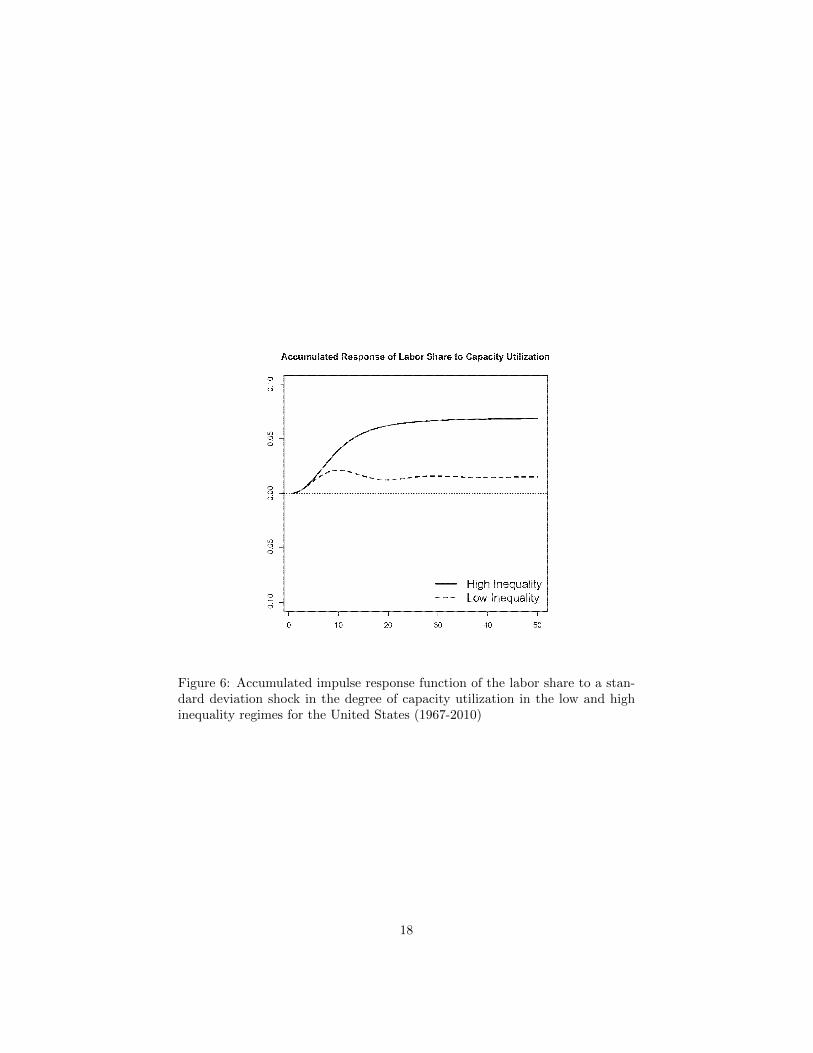
Figure 6: Accumulated impulse response function of the labor share to a stan-dard deviation shock in the degree of capacity utilization in the low and highinequality regimes for the United States (1967-2010)
18