department of chemistry and pharmacy, inorganic … · department of chemistry and pharmacy,...
TRANSCRIPT

W W W. N A T U R E . C O M / N A T U R E | 1
SUPPLEMENTARY INFORMATIONdoi:10.1038/nature16530
1
Supporting Information
Uranium-Mediated Electrocatalytic H2 Production from Water
Dominik P. Halter, Frank W. Heinemann, Julien Bachmann, and Karsten Meyer*
Department of Chemistry and Pharmacy, Inorganic Chemistry, Friedrich-Alexander
University Erlangen-Nürnberg (FAU), D-91058 Erlangen, Germany.
* Correspondence to [email protected]
Supporting Information Table of Contents
General Considerations ........................................................................................................................... 2
Spectroscopic Details .............................................................................................................................. 3 1H NMR Spectroscopy .......................................................................................................................... 3
Vis-‐NIR Spectroscopy ........................................................................................................................... 5
EPR Spectroscopy ................................................................................................................................ 6
SQUID Magnetometry ......................................................................................................................... 7
Gas Chromatography ............................................................................................................................... 7
Electrochemical Studies ........................................................................................................................ 11
Amperometry .................................................................................................................................... 11
Electrochemical Impedance Spectroscopy ........................................................................................ 13
Squarewave Voltammetry ................................................................................................................. 14
Open Circuit Potential Measurement ............................................................................................... 15
Cyclic Voltammetry ........................................................................................................................... 16
Direct Comparison of Catalyst 1 and the Mo-‐Based Catalyst [(PY5Me2)MoO](B(C6H3(CF3)2)4)2 ........ 22
Foot-‐of-‐the-‐wave Analysis ................................................................................................................. 23
X-‐Ray Crystal Structure Determination ................................................................................................. 24
References ............................................................................................................................................. 35

SUPPLEMENTARY INFORMATION
2 | W W W. N A T U R E . C O M / N A T U R E
RESEARCH
2
General Considerations
Depleted uranium (DU) typically consists of +99.7% 238U, a weak α-‐emitter with a half-‐life of 4.47 • 109 years. The radiologic toxicity of DU is about a million times smaller than the chemical toxicity and hence should be treated with the same safety precautions as other heavy metals, which are also considered carcinogenic 1.

W W W. N A T U R E . C O M / N A T U R E | 3
SUPPLEMENTARY INFORMATION RESEARCH
3
Spectroscopic Detai ls
1H NMR Spectroscopy
Fig. S1 | 1H NMR of [[(Ad,MeArO)3mes)U(OH)(THF)] 2–OH recorded in C6D6, impurities (n-‐pentane and silicon grease) are marked with an asterisk.
Fig. S2 | 1H NMR of [[(Ad,MeArO)3mes)U(OD)(THF)] 2–OD recorded in C6D6, n-‐pentane is marked with an asterisk.

SUPPLEMENTARY INFORMATION
4 | W W W. N A T U R E . C O M / N A T U R E
RESEARCH
4
In addition to the mechanistic study presented in the maintext of the manuscript, a scrambling experiment was performed, where a 1:1 mixture of H2O and D2O in THF was electrolyzed by catalyst 1.
Fig. S3 | 1H NMR spectra in C6D6 of an HD reference sample (left) and a sample of the headspace of a bulk electrolysis experiment, including 10 mL of THF, with 10 mg of catalyst, 20 µL of H2O, and 20 µL of D2O, clearly showing H2 (at δ = 4.47) and possibly traces of HD (right) that remain questionable after 16.000 scans (40-‐hr-‐experiment).
Fig. S4 | Upper panel: Reaction scheme depicting the role of the uranium oxo complex [((Ad,Me(ArO3)mes)U=O(THF)] during the synthesis of 2–OH from 1 and H2O, as predicted by the mechanism. Lower panel: 1H NMR spectra confirming the formation of two eq. of [((Ad,Me(ArO3)mes)U(OH)(THF)] (2-‐OH), from the reaction of one eq. of [((AdMe(ArO3)mes)U] with one eq. of [((Ad,Me(ArO3)mes)U=O(THF)] and one eq. of H2O.

W W W. N A T U R E . C O M / N A T U R E | 5
SUPPLEMENTARY INFORMATION RESEARCH
5
Vis-‐NIR Spectroscopy
Fig. S5 | Vis-‐NIR spectrum of [[(Ad,MeArO)3mes)U(OH)(THF)] 2–OH, 3 mM in THF.
Table S 1 | Absorption band / extinction coefficient pairs for the electronic absorption spectrum of 2–OH in THF.
λ /nm 537 629 651 784 1110 1179 1305 1887 ε / l mol-‐1 cm-‐1 23 15 13 6 23 11 10 18
SUPPLEMENTARY INFORMATION
6 | W W W. N A T U R E . C O M / N A T U R E
RESEARCH
6
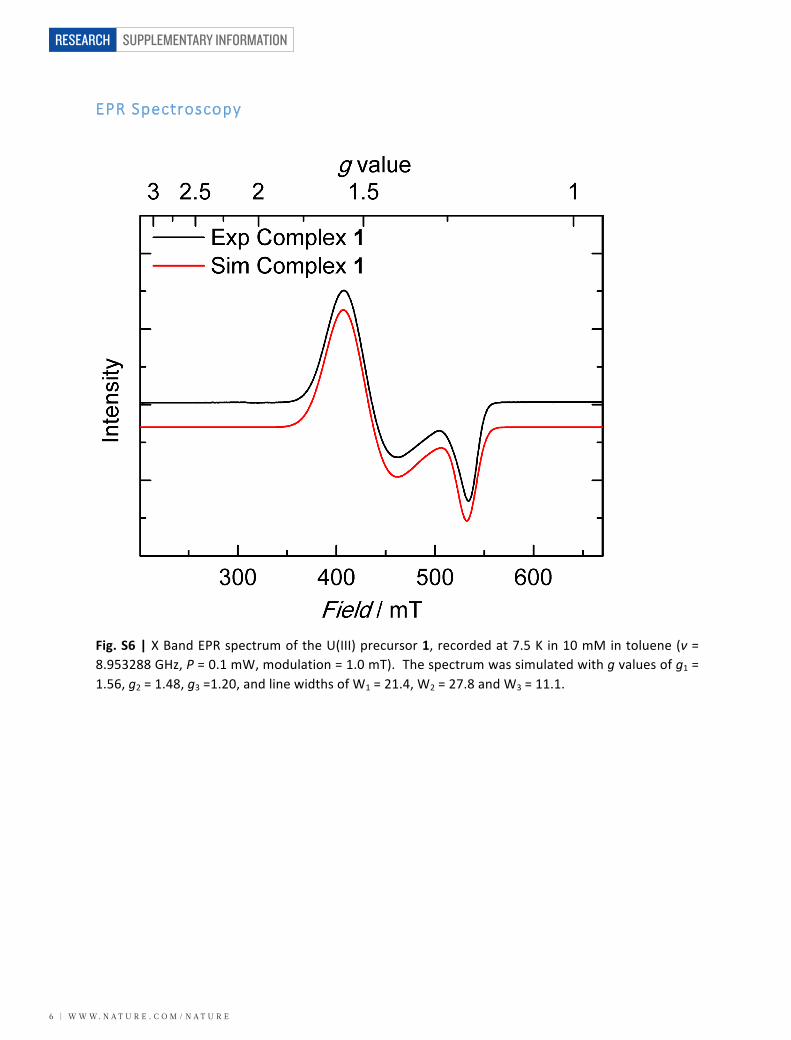
EPR Spectroscopy
Fig. S6 | X Band EPR spectrum of the U(III) precursor 1, recorded at 7.5 K in 10 mM in toluene (ν = 8.953288 GHz, P = 0.1 mW, modulation = 1.0 mT). The spectrum was simulated with g values of g1 = 1.56, g2 = 1.48, g3 =1.20, and line widths of W1 = 21.4, W2 = 27.8 and W3 = 11.1.
W W W. N A T U R E . C O M / N A T U R E | 7
SUPPLEMENTARY INFORMATION RESEARCH
7
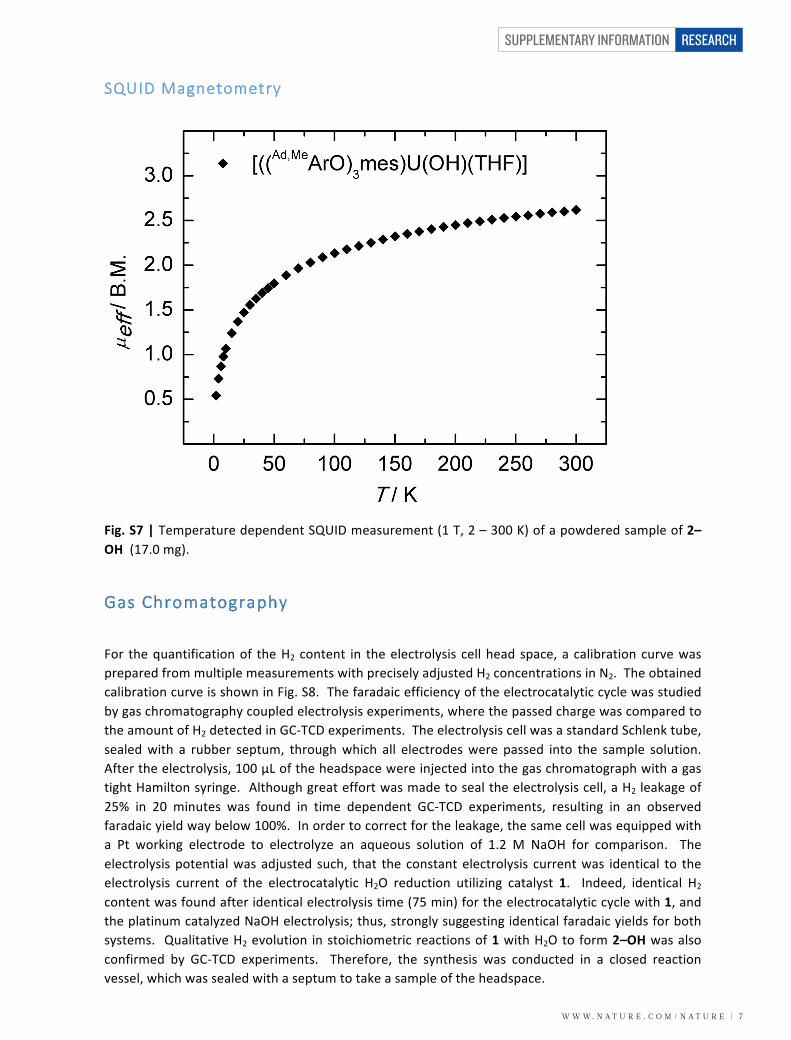
SQUID Magnetometry
Fig. S7 | Temperature dependent SQUID measurement (1 T, 2 – 300 K) of a powdered sample of 2–OH (17.0 mg).
Gas Chromatography
For the quantification of the H2 content in the electrolysis cell head space, a calibration curve was prepared from multiple measurements with precisely adjusted H2 concentrations in N2. The obtained calibration curve is shown in Fig. S8. The faradaic efficiency of the electrocatalytic cycle was studied by gas chromatography coupled electrolysis experiments, where the passed charge was compared to the amount of H2 detected in GC-‐TCD experiments. The electrolysis cell was a standard Schlenk tube, sealed with a rubber septum, through which all electrodes were passed into the sample solution. After the electrolysis, 100 µL of the headspace were injected into the gas chromatograph with a gas tight Hamilton syringe. Although great effort was made to seal the electrolysis cell, a H2 leakage of 25% in 20 minutes was found in time dependent GC-‐TCD experiments, resulting in an observed faradaic yield way below 100%. In order to correct for the leakage, the same cell was equipped with a Pt working electrode to electrolyze an aqueous solution of 1.2 M NaOH for comparison. The electrolysis potential was adjusted such, that the constant electrolysis current was identical to the electrolysis current of the electrocatalytic H2O reduction utilizing catalyst 1. Indeed, identical H2 content was found after identical electrolysis time (75 min) for the electrocatalytic cycle with 1, and the platinum catalyzed NaOH electrolysis; thus, strongly suggesting identical faradaic yields for both systems. Qualitative H2 evolution in stoichiometric reactions of 1 with H2O to form 2–OH was also confirmed by GC-‐TCD experiments. Therefore, the synthesis was conducted in a closed reaction vessel, which was sealed with a septum to take a sample of the headspace.

SUPPLEMENTARY INFORMATION
8 | W W W. N A T U R E . C O M / N A T U R E
RESEARCH
8
Fig. S8 | Calibration curve for quantitative H2 determination, obtained from measurements of pre-‐cisely prepared mixtures of H2 and N2, in gas collecting tubes, yielding H2 volumetric concentrations of 1, 3, 5 ,10, and 100 % H2 in N2.
Fig. S9 | GC headspace analysis of the stoichiometric synthesis of 2–OH from 1 with one eq. of H2O in a sealed reaction vessel revealed the formation of H2.

W W W. N A T U R E . C O M / N A T U R E | 9
SUPPLEMENTARY INFORMATION RESEARCH
9
Fig. S10 | GC headspace analysis of electrocatalytic H2O reduction in a sealed electrolysis cell including 5 mg of 1, H2O (0.22M in THF) and 5 mL THF.
Fig. S11 | GC head space analysis of an electrolysis experiment with strict exclusion of H2O in a sealed electrolysis cell including 5 mg of 1, and 5 mL THF. The analysis proves that no H2 is formed in the absence of the substrate H2O by our catalyst.

SUPPLEMENTARY INFORMATION
1 0 | W W W. N A T U R E . C O M / N A T U R E
RESEARCH
10
Fig. S12 | Reference electrolysis of NaOH (1.2 M in H2O) with a Pt electrode under aerobic conditions to dertermine the H2 gas leakage of the sealed cell. The hight of the oxygen peak is increased, since the electrolysis setup was assembled under air and then sealed for the electrolysis.

W W W. N A T U R E . C O M / N A T U R E | 1 1
SUPPLEMENTARY INFORMATION RESEARCH
11
Electrochemical Studies
Amperometry
Amperometric experiments for bulk electrolyses were performed with a rotating disk glassy carbon working electrode (diameter 3 mm, stir rate 300 rad/s), a platinum rod counter electrode and a Ag wire reference electrode under inert gas conditions in a N2 equipped glovebox, unless noted otherwise. The applied potential was –3.25 V vs. Fc+/Fc, which was controlled by the addition of purified Fc to the sample solution and monitored by cyclic voltammetry. Electrolysis experiments for GC analysis were conducted in a standard Schlenk tube sealed with a rubber septum, through which all electrodes were passed into the sample solution. The electrolysis solution was then stirred with a glass stir bar (stir rate 300 rpm). The reference electrolysis of a 1.2 M NaOH solution was conducted in a Schlenk tube with a Pt disk working electrode (diameter 5 mm), a Pt rod counter electrode, and a Ag wire reference electrode and a glass stir bar. The potential is reported against the Ag+/Ag couple, since ferrocene is not soluble in H2O.
Fig. S13 | Chrono amperometry experiments with a rotating disk glassy carbon working electrode in THF with TBAPF6, 0.1 M.

SUPPLEMENTARY INFORMATION
1 2 | W W W. N A T U R E . C O M / N A T U R E
RESEARCH
12
Fig. S14 | Chronoamperogram of NaOH electrolysis (1.2 M in H2O), obtained at an electrolysis potential of –1.60 V vs Ag+/Ag with a Pt disk electrode (diameter 5mm), a Pt rod counter electrode, and a Ag wire reference electrode.
Fig. S15 | Chronoamperogram of H2O electrolysis (0.22 M in THF) catalyzed by 1 at an electrolysis potential of –3.25 V vs. Fc+/Fc with a glassy carbon disk working electrode (3 mm), a Pt rod counter electrode and a Ag wire reference electrode in THF with 0.1 M TBAPF6.

W W W. N A T U R E . C O M / N A T U R E | 1 3
SUPPLEMENTARY INFORMATION RESEARCH
13
Electrochemical Impedance Spectroscopy
The experimental data for the catalyzed H2O reduction were fitted with a Randles equivalent circuit between 880.429 Hz and 0.122888 Hz, yielding a cell resistance Rs = 2.564 kΩ, a faradaic resistance Rct = 3.704 kΩ, and a double layer capacity Cdl = 6.422 x 10⁻⁷ F. The experimental data for un-‐catalyzed H2O electrolysis were fitted with two Randles equivalent circuits in series between 880.429 Hz and 0.0262447 Hz, yielding a cell resistances Rs = 3.203 kΩ, faradaic resistances Rct1 = 122.6 kΩ, Rct2 = 1.232 MΩ, as well as double layer capacities Cdl1 = 2.446 x 10⁻⁶ F and Cdl2 = 4.772 x 10⁻⁶ F.

SUPPLEMENTARY INFORMATION
1 4 | W W W. N A T U R E . C O M / N A T U R E
RESEARCH
14
Squarewave Voltammetry
Fig. S16 | Square wave voltammogram of 2–OH in THF with 0.1 M TBAPF6. Two independent reduction events, centered around –1.9 V and –2.5 V are resolved.

W W W. N A T U R E . C O M / N A T U R E | 1 5
SUPPLEMENTARY INFORMATION RESEARCH
15
Open Circuit Potential Measurement
Fig. S17 | OCP Measurement for the determination of the thermodynamic potential for H2 formation, as introduced by Bullock et al. 2, measured with a platinized Pt electrode, a Pt counter electrode, and a Ag wire pseudo reference electrode in a solution of 0.22 M H2O in THF with 0.1 M TBAPF6 measured under 1 atm. of H2.

SUPPLEMENTARY INFORMATION
1 6 | W W W. N A T U R E . C O M / N A T U R E
RESEARCH
16
Cyclic Voltammetry
Fig. S18 | Cyclic voltammogram of 2–OH in THF with 0.1 M TBAPF6.

W W W. N A T U R E . C O M / N A T U R E | 1 7
SUPPLEMENTARY INFORMATION RESEARCH
17
Fig. S19 | Cyclic voltammogram of the U(III)/U(II) redox couple of electrochemically generated 1 from an initially pure sample of 2–OH (electrolysis at –2.2 V vs. Fc+/Fc) in THF with 0.1 M TBAPF6.
Fig. S20 | Cyclic voltammograms of electrocatalytic H2O reduction with increasing concentrations of the catalyst, recorded with a glassy carbon working electrode in THF with 0.1 M TBAPF6. The overlay shows neither a decrease of the onset potential, nor an increased catalytic current for higher catalyst concentrations.

SUPPLEMENTARY INFORMATION
1 8 | W W W. N A T U R E . C O M / N A T U R E
RESEARCH
18
Fig. S21 | CV analysis of electrocatalytic H2O reduction (0.22 M in THF) with 5 mg of catalyst 1 in 5 mL THF with 0.1 M TBAPF6 , with (blue trace) and without (black trace) the addition of an excess of Hg. The analysis shows that the addition of Hg did neither influence the onset potential or the catalytic current response for H2O reduction with catalyst 1, hinting that no catalytically active nanoparticles are present.

W W W. N A T U R E . C O M / N A T U R E | 1 9
SUPPLEMENTARY INFORMATION RESEARCH
19
Fig. S22 | Cyclic voltammograms of a solution containing 0.22 M H2O in THF with 0.1 M TBAPF6, recorded with a freshly polished electrode (black trace) and an electrode that was pre-‐treated by multi-‐hour electrolysis in a solution containing catalyst 1 and, subsequently, carefully rinsed with THF prior to use. The overlay plot shows neither a decrease of the onset potential, nor an increased current for the pre-‐treated electrode. Hence, a catalytically active film is most likely not produced during the electrolysis with catalyst 1.

SUPPLEMENTARY INFORMATION
2 0 | W W W. N A T U R E . C O M / N A T U R E
RESEARCH
20
Fig. S23 | Cyclic Voltammograms of H2O reduction (0.22 M in THF) in the presence (blue trace) and absence (black trace) of the uranly salt UO2Cl2 (0.4 mol % -‐ the standard catalyst loading). No change of the onset potential or the catalytic current was observed in the presence of uranyl; hence, the catalytic activity observed for catalyst 1 is unlikely to originate from potential decomposition products, which are most typically uranyl salts.

W W W. N A T U R E . C O M / N A T U R E | 2 1
SUPPLEMENTARY INFORMATION RESEARCH
21
Fig. S24 | CV analysis of electrocatalytic H2O reduction (0.22 M in THF) with 5 mg of catalyst 1 in 5 mL THF with 0.1 M TBAPF6 with (black trace) and without (blue trace) the addition of an excess of solid KOH. The analysis clearly shows that the addition of KOH did neither influence the onset potential or the catalytic current response for H2O reduction with catalyst 1.
SUPPLEMENTARY INFORMATION
2 2 | W W W. N A T U R E . C O M / N A T U R E
RESEARCH
22
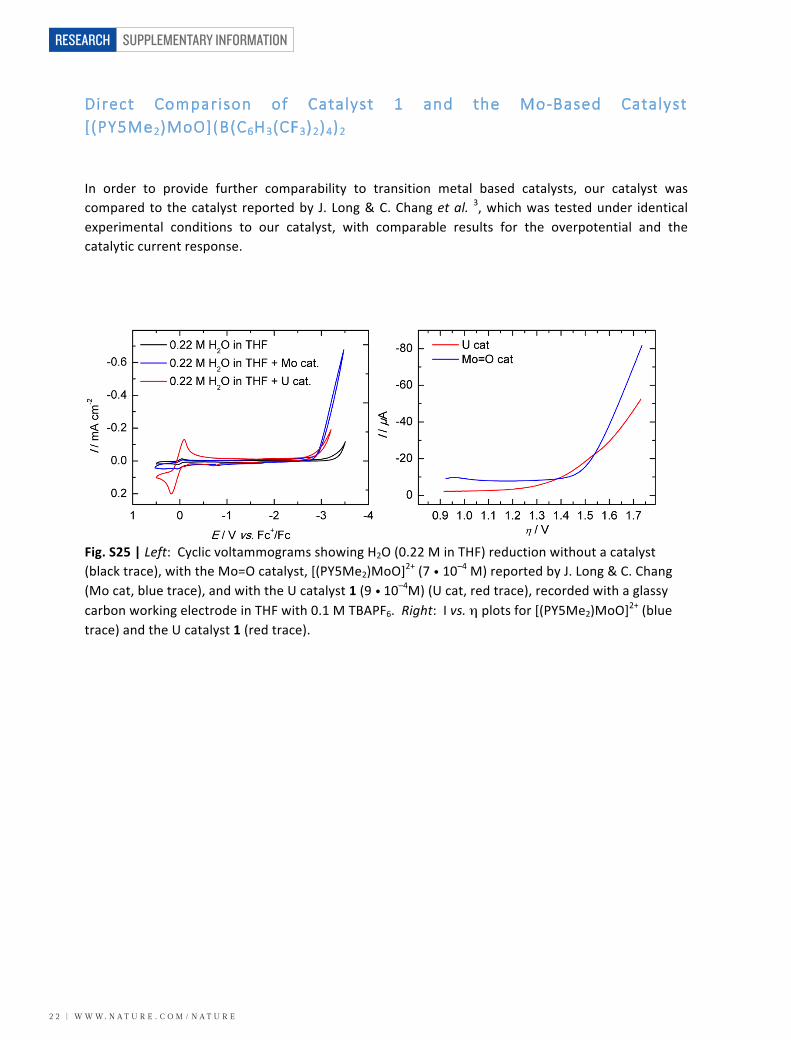
Direct Comparison of Catalyst 1 and the Mo-‐Based Catalyst [(PY5Me2)MoO](B(C6H3(CF3)2)4)2
In order to provide further comparability to transition metal based catalysts, our catalyst was compared to the catalyst reported by J. Long & C. Chang et al. 3, which was tested under identical experimental conditions to our catalyst, with comparable results for the overpotential and the catalytic current response.
Fig. S25 | Left: Cyclic voltammograms showing H2O (0.22 M in THF) reduction without a catalyst (black trace), with the Mo=O catalyst, [(PY5Me2)MoO]2+ (7 • 10–4 M) reported by J. Long & C. Chang (Mo cat, blue trace), and with the U catalyst 1 (9 • 10–4M) (U cat, red trace), recorded with a glassy carbon working electrode in THF with 0.1 M TBAPF6. Right: I vs. η plots for [(PY5Me2)MoO]2+ (blue trace) and the U catalyst 1 (red trace).

W W W. N A T U R E . C O M / N A T U R E | 2 3
SUPPLEMENTARY INFORMATION RESEARCH
23
Foot-‐of-‐the-‐wave Analysis
A foot-‐of-‐the-‐wave analysis was performed for our catalyst 1, as reported by Savéant et al. 4 and Dempsey et al. 5, yielding a TOF of 106 h–1 (at η = 1.3 V) for our experimental conditions.
Fig. S26 | Top, left: Redox wave of catalyst 1, recorded from 1 mg catalyst in 5 mL THF with 0.1 M TBAPF6, yielding E0PQ and I0p. Top right: Catalytic H2O (0.22 M) reduction with 1 mg catalyst in 5 mL THF with 0.1 M TBAPF6, including a Fc+/Fc wave set to 0 V for referencing. Middle left: Referenced catalytic wave for foot-‐of-‐the-‐wave analysis. Middle right: Log(TOF) vs. η plot for catalyst 1. Lower panels: equations used for the foot-‐of-‐the-‐wave-‐analysis.
SUPPLEMENTARY INFORMATION
2 4 | W W W. N A T U R E . C O M / N A T U R E
RESEARCH
24
X-‐Ray Crystal Structure Determination
CCDC-‐1413741 (for 2–OH from THF/n-‐pentane), CCDC-‐1401838 (for 2–OH from THF), and CCDC-‐1437872 (for [((Ad,tBuArO)3tacn)U(OH)] ·∙ 2Et2O) contain the supplementary crystallographic data for this paper. This data can be obtained free of charge via http://www.ccdc.cam.ac.uk/products/csd/request/ (or from Cambridge Crystallographic Data Centre, 12 Union Road, Cambridge, CB2 1EZ, UK (fax: ++44-‐1223-‐336-‐033; e-‐mail: [email protected]).

W W W. N A T U R E . C O M / N A T U R E | 2 5
SUPPLEMENTARY INFORMATION RESEARCH
25
Table S2 | Crystallographic data, data collection and refinement details of 2–OH from THF/n-‐pentane and 2-‐OH from THF.
2–OH from THF/n-‐pentane 2–OH from THF [U(OH)((AdArO)3tacn)] ·∙
2Et2O
Empirical formula C79H108O8U C80.69H111.38O8.42U C77H117 N3O6U
Mol. weight 1423.68 1454.14 1418.76
Crystal shape, color plate, yellow plate, yellow plate, colorless
Crystal size [mm] 0.24×0.08×0.06 0.15×0.14×0.03 0.17×0.11×0.05
Temperature [K] 100(2) 100(2) 100(2)
Crystal system Monoclinic Monoclinic Monoclinic
Space group C2/c C2/c P21/c
a [Å] 41.806(5) 30.480(4) 10.937(2)
b [Å] 15.940(2) 15.941(2) 30.067(6)
c [Å] 24.293(3) 27.850(3) 22.150(4)
α [°] 90 90 90
+β [°] 124.082(2) 97.786(2) 94.76(3)
γ [°] 90 90 90
V [Å3] 13408(3) 13407(3) 7259(3)
Z 8 8 4
ρ [g cm-‐3] (calc.) 1.411 1.441 1.298
µ [mm-‐1] 2.478 2.481 2.288
F (000) 5904 6039 2960
Tmin; Tmax 0.635 0.746 0.646 0.746 0.322 0.894
2Θ interval [ °] 3.0 ≤ 2Θ ≤ 57.5 2.6 ≤ 2Θ ≤ 55.9 6.0 ≤ 2Θ ≤ 51.4
Coll. refl. 102606 106770 95932
Indep. refl.; Rint 17424; 0.0571 16057; 0.0701 13759; 0.1944
Obs. refl. F0 ≥ 4σ(F) 13973 11953 8553
No. ref. param. 937 1165 877
wR2 (all data) 0.0746 0.1002 0.2189
R1 (F0 ≥ 4σ(F)) 0.0301 0.0386 0.0849
GooF on F2 1.059 1.071 1.065
∆ρmax/min 1.078; –0.793 1.353; –0.991 2.684; –2.977
SUPPLEMENTARY INFORMATION
2 6 | W W W. N A T U R E . C O M / N A T U R E
RESEARCH
26
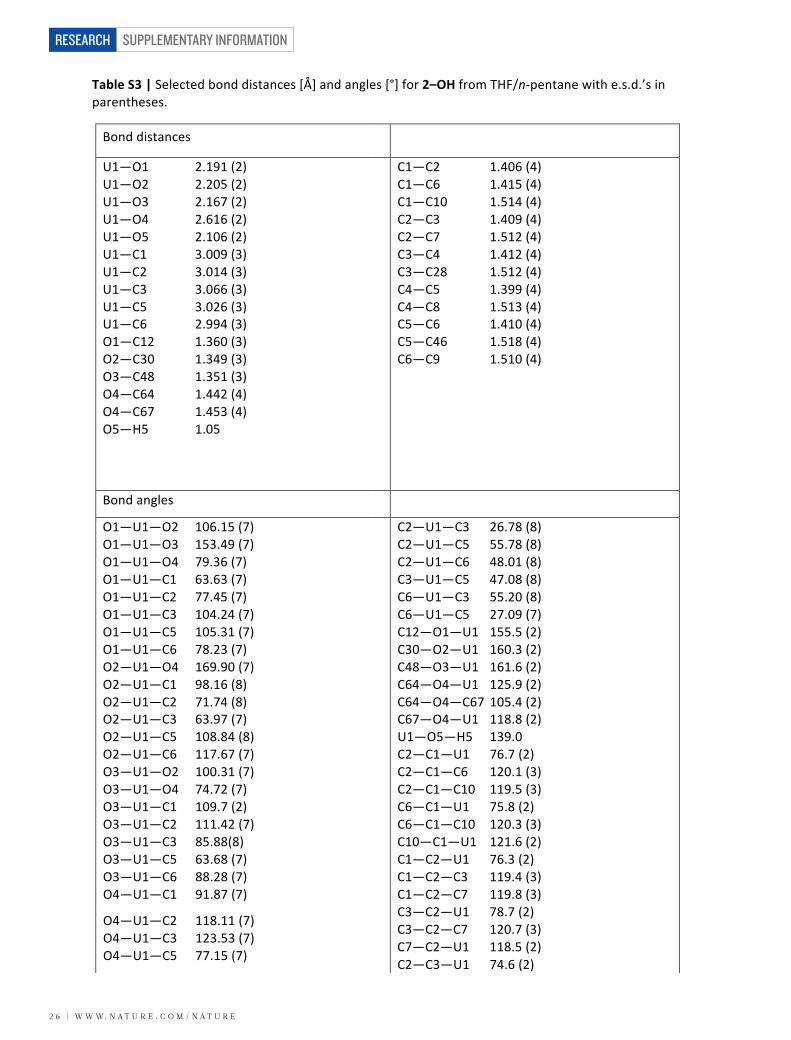
Table S3 | Selected bond distances [Å] and angles [°] for 2–OH from THF/n-‐pentane with e.s.d.’s in parentheses.
Bond distances
U1—O1 2.191 (2) U1—O2 2.205 (2) U1—O3 2.167 (2) U1—O4 2.616 (2) U1—O5 2.106 (2) U1—C1 3.009 (3) U1—C2 3.014 (3) U1—C3 3.066 (3) U1—C5 3.026 (3) U1—C6 2.994 (3) O1—C12 1.360 (3) O2—C30 1.349 (3) O3—C48 1.351 (3) O4—C64 1.442 (4) O4—C67 1.453 (4) O5—H5 1.05
C1—C2 1.406 (4) C1—C6 1.415 (4) C1—C10 1.514 (4) C2—C3 1.409 (4) C2—C7 1.512 (4) C3—C4 1.412 (4) C3—C28 1.512 (4) C4—C5 1.399 (4) C4—C8 1.513 (4) C5—C6 1.410 (4) C5—C46 1.518 (4) C6—C9 1.510 (4)
Bond angles
O1—U1—O2 106.15 (7) O1—U1—O3 153.49 (7) O1—U1—O4 79.36 (7) O1—U1—C1 63.63 (7) O1—U1—C2 77.45 (7) O1—U1—C3 104.24 (7) O1—U1—C5 105.31 (7) O1—U1—C6 78.23 (7) O2—U1—O4 169.90 (7) O2—U1—C1 98.16 (8) O2—U1—C2 71.74 (8) O2—U1—C3 63.97 (7) O2—U1—C5 108.84 (8) O2—U1—C6 117.67 (7) O3—U1—O2 100.31 (7) O3—U1—O4 74.72 (7) O3—U1—C1 109.7 (2) O3—U1—C2 111.42 (7) O3—U1—C3 85.88(8) O3—U1—C5 63.68 (7) O3—U1—C6 88.28 (7) O4—U1—C1 91.87 (7)
O4—U1—C2 118.11 (7) O4—U1—C3 123.53 (7) O4—U1—C5 77.15 (7)
C2—U1—C3 26.78 (8) C2—U1—C5 55.78 (8) C2—U1—C6 48.01 (8) C3—U1—C5 47.08 (8) C6—U1—C3 55.20 (8) C6—U1—C5 27.09 (7) C12—O1—U1 155.5 (2) C30—O2—U1 160.3 (2) C48—O3—U1 161.6 (2) C64—O4—U1 125.9 (2) C64—O4—C67 105.4 (2) C67—O4—U1 118.8 (2) U1—O5—H5 139.0 C2—C1—U1 76.7 (2) C2—C1—C6 120.1 (3) C2—C1—C10 119.5 (3) C6—C1—U1 75.8 (2) C6—C1—C10 120.3 (3) C10—C1—U1 121.6 (2) C1—C2—U1 76.3 (2) C1—C2—C3 119.4 (3) C1—C2—C7 119.8 (3) C3—C2—U1 78.7 (2) C3—C2—C7 120.7 (3) C7—C2—U1 118.5 (2) C2—C3—U1 74.6 (2)

W W W. N A T U R E . C O M / N A T U R E | 2 7
SUPPLEMENTARY INFORMATION RESEARCH
27
O4—U1—C6 71.42 (7) O5—U1—O1 93.28 (7) O5—U1—O2 91.25 (8) O5—U1—O3 87.59 (7) O5—U1—O4 79.87 (2) O5—U1—C1 156.67 (8) O5—U1—C2 157.03 (8) O5—U1—C3 152.65 (8) O5—U1—C5 146.97 (8) O5—U1—C6 151.06 (8) C1—U1—C2 27.01 (8) C1—U1—C3 47.16 (8) C1—U1—C5 47.82 (8) C1—U1—C6 27.26 (8)
C2—C3—C4 120.1 (3) C2—C3—C28 122.2 (3) C4—C3—U1 81.2 (2) C4—C3—C28 117.6 (3) C28—C3—U1 117.8 (3) C3—C4—C5 119.9 (3) C8—C4—C3 120.1 (3) C8—C4—C5 119.9 (3) C4—C5—U1 82.9 (2) C4—C5—C46 120.5 (3) C6—C5—U1 75.2 (2) C6—C5—C4 119.4 (3) C6—C5—C46 120.0 (3) C46—C5—U1 112.6 (2) C1—C6—U1 77.0 (2) C1—C6—C9 120.3 (3) C5—C6—U1 77.7 (2) C5—C6—C1 120.0 (3) C5—C6—C9 119.4 (3) C9—C6—U1 121.7 (2)
Table S4 | Selected bond distances [Å] and angles [°] for 2–OH from THF with e.s.d.’s in parentheses.
Bond distances
U1—O1 2.180 (3) U1—O2 2.211 (3) U1—O3 2.181 (3) U1—O4 2.592 (3) U1—O5 2.110 (3) U1—C1 2.903 (10) U1—C2 2.920 (8) U1—C3 3.006 (8) U1—C5 3.057 (17) U1—C6 2.973 (16) O1—C12 1.352 (5) O2—C30 1.411 (7) O3—C48 1.353 (5) O4—C64 1.456 (5) O4—C67 1.463 (5) O5—H5 0.8400
C1—C2 1.3900 C1—C6 1.3900 C1—C10 1.527 (15) C2—C3 1.3900 C2—C7 1.547 (12) C3—C4 1.3900 C3—C28 1.515 (12) C4—C5 1.3900 C4—C8 1.314 (18) C5—C6 1.3900 C5—C46 1.46 (2) C6—C9 1.538 (18)
Bond angles
O1—U1—O2 101.32 (13) O1—U1—O3 154.37 (11)
C2—U1—C3 27.08 (7) C2—U1—C5 55.37 (18)

SUPPLEMENTARY INFORMATION
2 8 | W W W. N A T U R E . C O M / N A T U R E
RESEARCH
28
O1—U1—O4 76.42 (10) O1—U1—C1 65.45 (19) O1—U1—C2 74.65 (18) O1—U1—C3 101.27 (19) O1—U1—C5 110.7 (2) O1—U1—C6 84.6 (3) O2—U1—O4 173.78 (10) O2—U1—C1 98.8 (2) O2—U1—C2 71.34 (19) O2—U1—C3 60.47 (16) O2—U1—C5 103.8 (2) O2—U1—C6 115.4 (2) O3—U1—O2 104.31 (12) O3—U1—O4 78.13 (10) O3—U1—C1 109.7 (2) O3—U1—C2 113.35 (16) O3—U1—C3 91.0 (2) O3—U1—C5 62.5 (2) O3—U1—C6 84.1 (2) O4—U1—C1 85.57 (19)
O4—U1—C2 113.18 (18) O4—U1—C3 125.51 (16) O4—U1—C5 82.4 (2) O4—U1—C6 70.3 (2) O5—U1—O1 91.17 (11) O5—U1—O2 91.73 (12) O5—U1—O3 88.48 (11) O5—U1—O4 82.56 (10) O5—U1—C1 155.76 (18) O5—U1—C2 154.76 (16) O5—U1—C3 151.14 (16) O5—U1—C5 149.5 (2) O5—U1—C6 152.8 (2) C1—U1—C2 27.62 (8) C1—U1—C3 48.05 (11) C1—U1—C5 47.6 (2) C1—U1—C6 27.33 (12)
C2—U1—C6 48.22 (15) C3—U1—C5 46.78 (17) C6—U1—C3 55.41 (17) C6—U1—C5 26.61 (14) C12—O1—U1 162.8 (3) C30—O2—U1 156.1 (4) C48—O3—U1 161.2 (3) C64—O4—U1 124.7 (3) C64—O4—C67 108.2 (3) C67—O4—U1 125.8 (2) U1—O5—H5 109.5 C2—C1—U1 76.9 (4) C2—C1—C6 120.0 C2—C1—C10 119.5 (9) C6—C1—U1 79.1 (5) C6—C1—C10 120.0 (9) C10—C1—U1 121.8 (7) C1—C2—U1 75.5 (4) C1—C2—C3 120.0 C1—C2—C7 119.3 (8) C3—C2—U1 79.9 (3) C3—C2—C7 120.7 (8) C7—C2—U1 114.2 (5) C2—C3—U1 73.0 (3) C2—C3—C4 120.0 C2—C3—C28 118.5 (9) C4—C3—U1 79.5 (4) C4—C3—C28 120.9 (9) C28—C3—U1 126.1 (5) C3—C4—C5 120.0 C8—C4—C3 102.1 (9) C8—C4—C5 137.9 (9) C4—C5—U1 77.5 (3) C4—C5—C46 118.1 (13) C6—C5—U1 73.3 (3) C6—C5—C4 120.0 C6—C5—C46 121.9 (13) C46—C5—U1 119.7 (13) C1—C6—U1 73.5 (4) C1—C6—C9 119.3 (9) C5—C6—U1 80.1 (3) C5—C6—C1 120.0 C5—C6—C9 120.7 (10) C9—C6—U1 118.3 (11)

W W W. N A T U R E . C O M / N A T U R E | 2 9
SUPPLEMENTARY INFORMATION RESEARCH
29
Table S5 | Selected bond distances [Å] and angles [°] for [U(OH)((AdArO)3tacn)] ·∙ 2Et2O with e.s.d.’s in parentheses.
Bond distances
U1—O1 2.187 (7) U1—O2 2.178 (7) U1—O3 2.185 (8) U1—O4 2.112 (7) U1—N1 2.722 (8) U1 – N2 2.731 (8) U1 – N3 2.716 (8) O1—C9 1.335 (12) O2—C30 1.341 (12) O3—C51 1.337 (12) O4—H4 0.8400
N1—C1 1.502 (13) N1—C6 1.499 (12) N1 – C7 1.502 (15) N2 – C2 1.500 (12) N2 – C3 1.498 (14) N2 – C28 1.511 (12) N3 – C4 1.487 (13) N3 – C5 1.465 (13) N3 – C49 1.506 (12)
Bond angles
O1—U1—N1 69.4 (2) O1—U1—N2 132.4 (2) O1—U1—N3 84.6 (3) O2—U1—O1 119.3 (3) O2—U1—O3 117.5 (3) O2—U1—N1 84.4 (3) O2—U1—N2 68.6 (2) O2—U1—N3 131.8 (2) O3—U1—O1 120.7 (3) O3—U1—N1 132.4 (3) O3—U1—N2 83.8 (3) O3—U1—N3 70.2 (3) O4—U1—O1 83.3 (3) O4—U1—O2 85.2 (3) O4—U1—O3 85.5 (3) O4—U1—N1 140.8 (3) O4—U1—N2 142.6 (2) O4—U1—N3 141.9 (3) N1—U1—N2 64.7 (3) N3—U1—N1 64.5 (3) N3—U1—N2 65.0 (3) C9—O1—U1 151.5 (6) C30—O2—U1 153.4 (7) C51—O3—U1 151.4 (6) U1—O4—H4 109.5 C1—N1—U1 105.2 (6) C1—N1—C7 106.8 (8) C6—N1—U1 114.7 (6) C6—N1—C1 111.1 (8) C6—N1—C7 111.9 (8) C7—N1—U1 106.6 (5)
C2—N2—U1 114.7 (6) C2—N2—C28 110.4 (8) C3—N2—U1 105.5 (5) C3—N2—C2 110.8 (8) C3—N2—C28 107.2 (8) C28—N2—U1 107.9 (5) C4—N3—U1 115.7 (6) C4—N3—C49 110.1 (9) C5—N3—U1 105.5 (6) C5—N3—C4 111.5 (8) C5—N3—C49 108.1 (8) C49—N3—U1 105.5 (6) C2—C1—N1 114.1 (9) C1—C2—N2 113.5 (8) N2—C3—C4 112.9 (9) N3—C4—C3 113.3 (8) N3—C5—C6 113.2 (8) N1—C6—C5 112.7 (8) C8—C7—N1 115.9 (9) C9—C8—C7 119.4 (9) C13—C8—C7 119.2 (9) C13—C8—C9 121.1 (10) O1—C9—C8 118.3 (9) O1—C9—C10 123.2 (9) C8—C9—C10 118.5 (10) C9—C10—C14 120.4 (10) C11—C10—C9 118.5 (10) C11—C10—C14 121.1 (10) C29—C28—N2 115.1 (9) O2—C30—C29 117.1 (10) O2—C30—C31 122.8 (10) C50—C49—N3 117.5 (9)

SUPPLEMENTARY INFORMATION
3 0 | W W W. N A T U R E . C O M / N A T U R E
RESEARCH
30
O3—C51—C50 117.6 (9) O3—C51—C52 121.9 (9)

W W W. N A T U R E . C O M / N A T U R E | 3 1
SUPPLEMENTARY INFORMATION RESEARCH
31
Graphical representations.
Fig. S27 | Molecular structure of 2–OH from THF/n-‐pentane with the applied numbering scheme (50 % probability ellipsoids, minor fraction of the disorder, hydrogen atoms except for the hydroxo H and solvent molecules omitted for clarity).
Fig. S28 | Crystal packing diagram for 2–OH from THF/n-‐pentane (view along the crystallographic b-‐axis).

SUPPLEMENTARY INFORMATION
3 2 | W W W. N A T U R E . C O M / N A T U R E
RESEARCH
32
Fig. S29 | Molecular structure of 2–OH from THF with the applied numbering scheme (50 % probability ellipsoids, minor fraction of the disorder, hydrogen atoms except for the hydroxo H and solvent molecules omitted for clarity).
Fig. S30 | Molecular structure of 2–OH from THF showing the alternative orientation of the ligand (minor fraction) with the applied numbering scheme (50 % probability ellipsoids, major fraction of the disorder, hydrogen atoms except for the hydroxo H and solvent molecules omitted for clarity).

W W W. N A T U R E . C O M / N A T U R E | 3 3
SUPPLEMENTARY INFORMATION RESEARCH
33
Fig. S31 | Top view of an overlay of the two alternative orientations of the molecular structure of 2–OH from THF (the minor fraction is indicated by dashed bonds, hydrogen atoms except for the hydroxo H and solvent molecules omitted for clarity).
Fig. S32 | Crystal packing diagram for 2–OH from THF (view along the crystallographic a-‐axis).

SUPPLEMENTARY INFORMATION
3 4 | W W W. N A T U R E . C O M / N A T U R E
RESEARCH
34
Fig. S33 | Molecular structure of [U(OH)((AdArO)3tacn)] with the applied numbering scheme (50 % probability ellipsoids, minor fraction of the disorder, hydrogen atoms except for the hydroxo H and solvent molecules omitted for clarity).
Fig. S34 | Crystal packing diagram for [U(OH)((AdArO)3tacn)] ·∙ 2Et2O (view along the crystallographic a-‐axis).

W W W. N A T U R E . C O M / N A T U R E | 3 5
SUPPLEMENTARY INFORMATION RESEARCH
35
References
1. Miller, A. C., Stewart, M., Brooks, K., Shi, L. & Page, N. Depleted uranium-‐catalyzed oxidative DNA damage: absence of significant alpha particle decay. Journal of Inorganic Biochemistry 91, 246–252 (2002).
2. Roberts, J. A. S. & Bullock, R. M. Direct Determination of Equilibrium Potentials for Hydrogen Oxidation/Production by Open Circuit Potential Measurements in Acetonitrile. Inorg. Chem. 52, 3823–3835 (2013).
3. Karunadasa, H. I., Chang, C. J. & Long, J. R. A molecular molybdenum-‐oxo catalyst for generating hydrogen from water. Nature 464, 1329–1333 (2010).
4. Costentin, C., Drouet, S., Robert, M. & Savéant, J.-‐M. Turnover Numbers, Turnover Frequencies, and Overpotential in Molecular Catalysis of Electrochemical Reactions. Cyclic Voltammetry and Preparative-‐Scale Electrolysis. J. Am. Chem. Soc. 134, 11235–11242 (2012).
5. Rountree, E. S., McCarthy, B. D., Eisenhart, T. T. & Dempsey, J. L. Evaluation of Homogeneous Electrocatalysts by Cyclic Voltammetry. Inorg. Chem. 53, 9983–10002 (2014).