denver gold presentation 2013
TRANSCRIPT

Copyright 2012 by Richmont Mines
TSX - NYSE MKT: RIC
1
RICHMONT MINES INC. Denver Gold Presentation
September 2013
TSX – NYSE MKT: RIC
ww
w.r
ich
mo
nt-
min
es.
com

Copyright 2012 by Richmont Mines
TSX - NYSE MKT: RIC
2
Safe harbor statement & cautionary note to U.S. investors concerning resource estimates
This presentation contains forward-looking statements that include risks and uncertainties. The factors that could cause actual results to differ materially from those indicated in such forward-looking statements include changes in the prevailing price of gold, the Canadian-U.S. exchange rate, grade of ore mined and unforeseen difficulties in mining operations that could affect revenue and production costs. Other factors such as uncertainties regarding government regulations could also affect the results. Other risks may be detailed from time to time in Richmont Mines Inc.’s periodic reports and annual notice.
The resource estimates in this presentation were prepared in accordance with Regulation 43-101 adopted by the Canadian Securities Administrators. The requirements of Regulation 43-101 differ significantly from the requirements of the United States Securities and Exchange Commission (the “SEC”). In this presentation, we use the terms “Measured”, “Indicated” and “Inferred” Resources. Although these terms are recognized and required in Canada, the SEC does not recognize them. The SEC permits U.S. mining companies, in their filings with the SEC, to disclose only those mineral deposits that constitute “Reserves”. Under United States standards, mineralization may not be classified as a Reserve unless the determination has been made that the mineralization could be economically and legally extracted at the time the determination is made. United States investors should not assume that all or any portion of a Measured or Indicated Resource will ever be converted into “Reserves”. Further, “Inferred Resources” have a great amount of uncertainty as to their existence and whether they can be mined economically or legally, and United States investors should not assume that “Inferred Resources” exist or can be legally or economically mined, or that they will ever be upgraded to a higher category.
U.S. Investors are urged to consider the disclosure in our annual report on Form 20-F, File No. 001-14598, which may be obtained from us or from the SEC’s web site: http://sec.gov/edgar.shtml.
Copyright 2013 by Richmont Mines
Copyright 2012 by Richmont Mines
TSX - NYSE MKT: RIC
3
Overview
Copyright 2013 by Richmont Mines
TSX - NYSE MKT: RIC
3
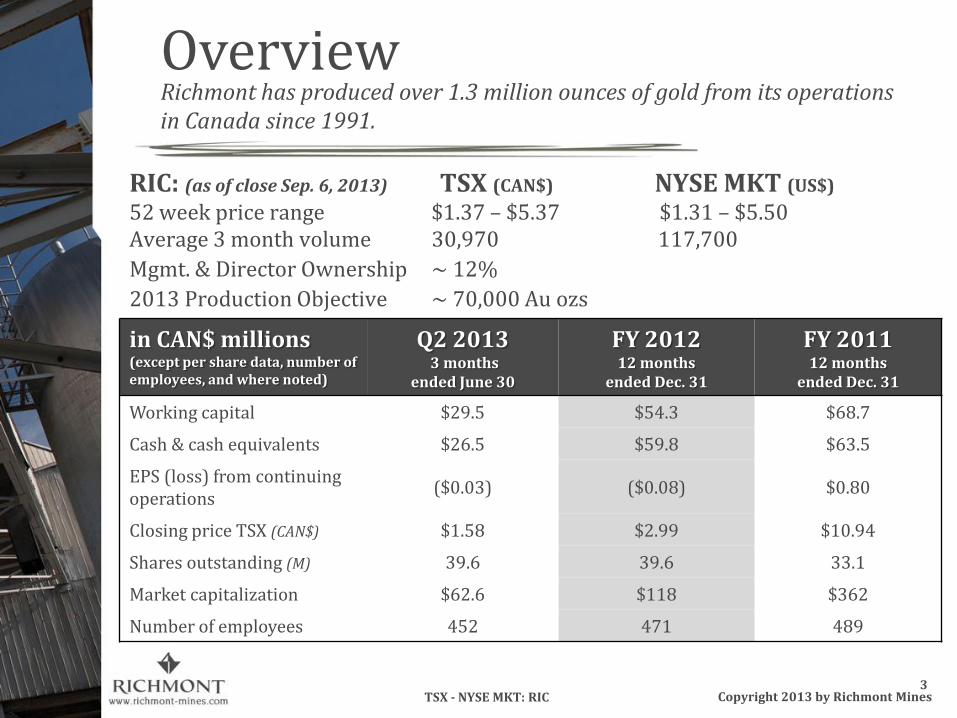
Richmont has produced over 1.3 million ounces of gold from its operations in Canada since 1991.
in CAN$ millions (except per share data, number of employees, and where noted)
Q2 2013 3 months
ended June 30
FY 2012 12 months
ended Dec. 31
FY 2011 12 months
ended Dec. 31
Working capital $29.5 $54.3 $68.7
Cash & cash equivalents $26.5 $59.8 $63.5
EPS (loss) from continuing operations
($0.03) ($0.08) $0.80
Closing price TSX (CAN$) $1.58 $2.99 $10.94
Shares outstanding (M) 39.6 39.6 33.1
Market capitalization $62.6 $118 $362
Number of employees 452 471 489
RIC: (as of close Sep. 6, 2013) TSX (CAN$) NYSE MKT (US$)
52 week price range $1.37 – $5.37 $1.31 – $5.50 Average 3 month volume 30,970 117,700
Mgmt. & Director Ownership ~ 12%
2013 Production Objective ~ 70,000 Au ozs

Copyright 2012 by Richmont Mines
TSX - NYSE MKT: RIC
4
Q2 2013 Financial Review
Copyright 2013 by Richmont Mines
TSX - NYSE MKT: RIC
4
Results in CAN$ thousands except per share data and where noted
Q2 2013 3 months ended March 31
Q2 2012 3 months ended March 31
Total gold ounces sold 12,826 14,611
Total revenue 17,835 23,686
(Loss) from continuing operations (2,240) (2,923)
(Loss) per share, from cont. operations (0.03) (0.09)
Average selling price (US$ per ounce) 1,367 1,618
Average cash cost (US$ per ounce) 999 1,097
Beaufor Mine cash cost (US$/ounce) 765 1,639
Island Gold Mine cash cost (US$/ounce) 1,229 900

Copyright 2012 by Richmont Mines
TSX - NYSE MKT: RIC
5
2013 News Year-to-Date
Senior Secured Credit Facility with Macquarie closed in August 2013:
• Up to CAN$50 Million, 3 tranches; proceeds to be used to develop Island Gold Deep Project
Successful bulk samples completed:
• W Zone • 7,700 tonne bulk sample confirmed understanding of the mineralized
zone and validated expectations of average mineralized widths, mill recovery rates and metallurgical results
• Confirmed project’s estimated Probable Reserves of 30,680 Au ozs • Commercial production Q4 2013: ~3,000 Au ozs
• Monique • 8,494 t bulk sample, 717 ozs @ 2.76 g/t; mill recovery rate of 95.1% • Open-pit Proven + Probable Reserves established: 35,698 Au ozs • Additional underground Indicated Resources of 16,858 ozs • Commercial production Q4 2013: ~ 4,500 Au ozs
Copyright 2013 by Richmont Mines
TSX - NYSE MKT: RIC
5

Copyright 2012 by Richmont Mines
TSX - NYSE MKT: RIC
6
Review of Operations
Copyright 2013 by Richmont Mines
TSX - NYSE MKT: RIC
6
Copyright 2012 by Richmont Mines
TSX - NYSE MKT: RIC
7 Copyright 2013 by Richmont Mines
TSX - NYSE MKT: RIC
7
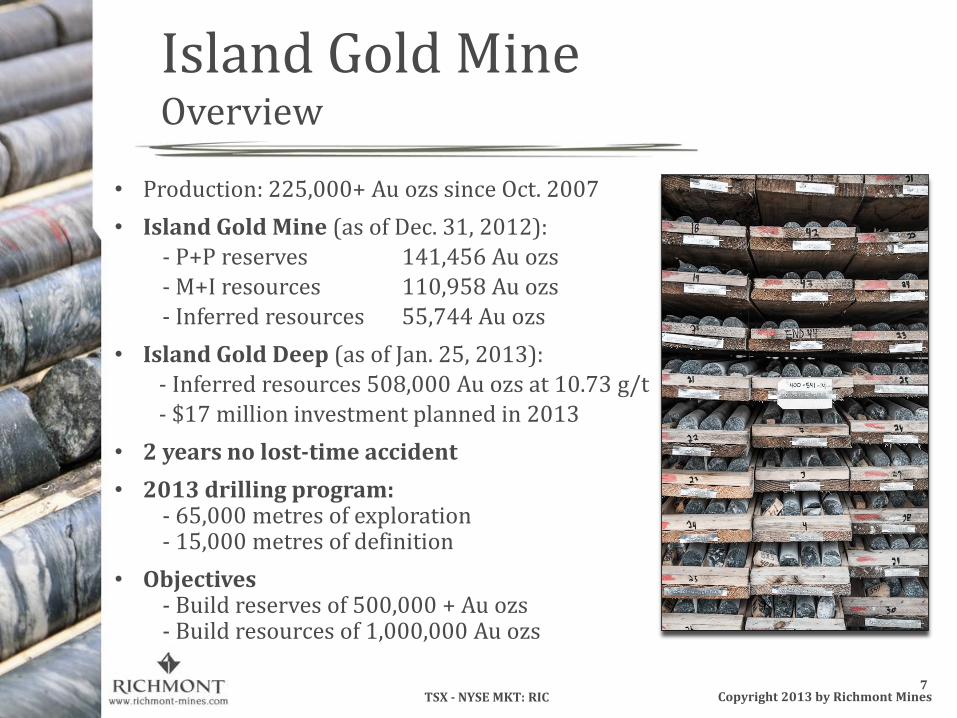
• Production: 225,000+ Au ozs since Oct. 2007
• Island Gold Mine (as of Dec. 31, 2012): - P+P reserves 141,456 Au ozs - M+I resources 110,958 Au ozs - Inferred resources 55,744 Au ozs
• Island Gold Deep (as of Jan. 25, 2013): - Inferred resources 508,000 Au ozs at 10.73 g/t - $17 million investment planned in 2013
• 2 years no lost-time accident
• 2013 drilling program: - 65,000 metres of exploration - 15,000 metres of definition
• Objectives - Build reserves of 500,000 + Au ozs - Build resources of 1,000,000 Au ozs
Island Gold Mine Overview
Copyright 2012 by Richmont Mines
TSX - NYSE MKT: RIC
8 Copyright 2013 by Richmont Mines
TSX - NYSE MKT: RIC
8
Island Gold Mine
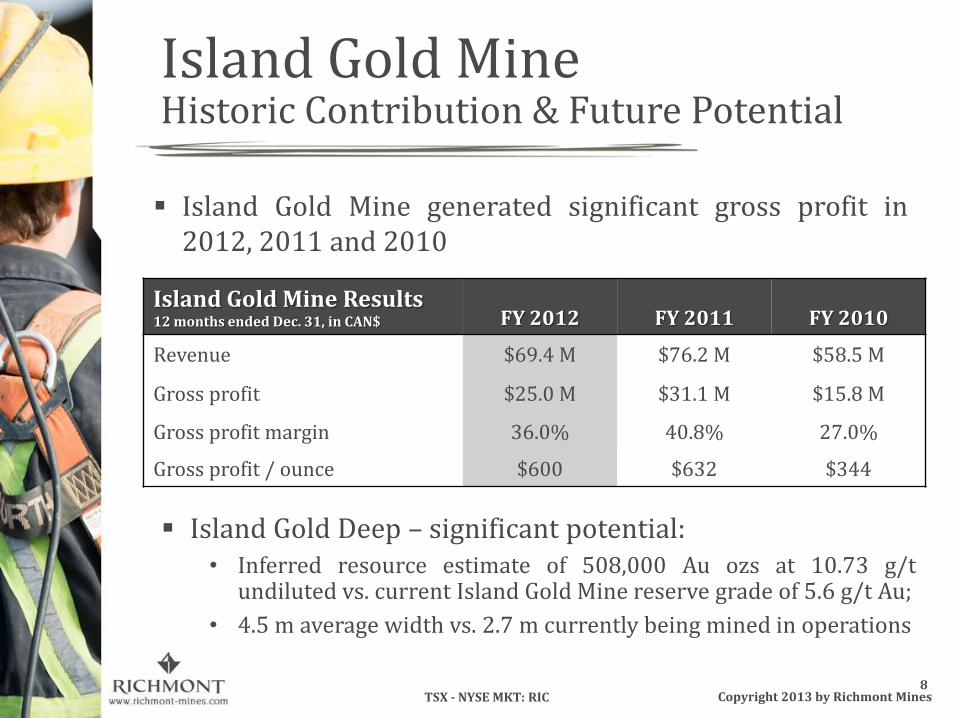
Island Gold Mine Results 12 months ended Dec. 31, in CAN$ FY 2012 FY 2011 FY 2010
Revenue $69.4 M $76.2 M $58.5 M
Gross profit $25.0 M $31.1 M $15.8 M
Gross profit margin 36.0% 40.8% 27.0%
Gross profit / ounce $600 $632 $344
Island Gold Mine generated significant gross profit in 2012, 2011 and 2010
Island Gold Deep – significant potential: • Inferred resource estimate of 508,000 Au ozs at 10.73 g/t
undiluted vs. current Island Gold Mine reserve grade of 5.6 g/t Au;
• 4.5 m average width vs. 2.7 m currently being mined in operations
Historic Contribution & Future Potential

Copyright 2012 by Richmont Mines
TSX - NYSE MKT: RIC
9
Island Gold Mine Annual Gold Sales
Copyright 2013 by Richmont Mines
TSX - NYSE MKT: RIC
9 Note: Cash cost includes royalties.
49,196 oz
736 783 766
884
1,104
1,275
1,5491,666
0
20,000
40,000
60,000
2009 2010 2011 2012 2013F
Ounces gold sold Cash cost per ounce Selling price
38,879 oz 45,865 oz 49,196 oz 41,686 oz Target:
38,000 oz
(US$) (Ounces)

Copyright 2012 by Richmont Mines
TSX - NYSE MKT: RIC
10
Island Gold Mine Q2 and YTD 2013 Production Highlights
Copyright 2013 by Richmont Mines
TSX - NYSE MKT: RIC
10
49,196 oz
49,196 oz 41,686 oz
(for the 3 and 6 mos. ended June 30) Q2
2013 Q2
2012 H1
2013 H1
2012
Tonnes 47,220 63,488 107,414 121,411
Gold recovery (%) 95.6% 96.2% 95.6% 96.1%
Head grade 4.46 g/t 5.45 g/t 4.71 g/t 5.52 g/t
Gold ounces sold 6,474 10,711 15,534 20,689
Avg. cash cost/oz (US$) 1,229 900 1,179 902
Avg. selling price/oz (US$) 1,382 1,622 1,517 1,653

Copyright 2012 by Richmont Mines
TSX - NYSE MKT: RIC
11 Copyright 2013 by Richmont Mines
TSX - NYSE MKT: RIC
11
Island Gold Deep 2013 Capex in CAN$ millions
Planned
2013 Capex
Island Gold Deep project $17.0
Island Gold Deep:
• Ramp extension at depth being advanced
• Vertical depth of 510 m at the end of Q2 2013
• Targeting depth of 570 m by year-end 2013
• Shaft work and related investments temporarily delayed
• Internal study currently underway to ascertain optimal levels to establish an exploration drift and initial mining horizon
• Project flexibility allows for prudent cash management in the current gold environment
• Re-initiation of shaft project pending improved market conditions
Island Gold Mine 2013 Investment

Copyright 2012 by Richmont Mines
TSX - NYSE MKT: RIC
12
Island Gold Mine Deep C Zone Potential
Copyright 2013 by Richmont Mines
TSX - NYSE MKT: RIC
12
49,196 oz
Important development planned in 2013
$17 million investment at Island Gold Deep will include:
• 39,000 metres of exploration drilling
• Exploration drifts to access Deep C Zone
• Ramp extension from current 450 metre depth
Project flexibility – ability to re-initiate shaft development plans when gold market conditions improve

Copyright 2012 by Richmont Mines
TSX - NYSE MKT: RIC
13 Copyright 2013 by Richmont Mines
TSX - NYSE MKT: RIC
13
49,196 oz
Island Gold Mine Longitudinal Section – Deep C Zone
Dia
base
dyke
Planned Ramp
-1,000m
-
500m
-
900m
Crown pillar
Potential future shaft
Deep C Zone Inferred Mineral Resources
1.5 MT at 10.73g/t Au, 508,000 ozs
Planned Ramp and Drifts
Potential future shaft
Proven Reserves
Probable Reserves
Indicated Resources
Inferred Resources
Actual Ramp and Drifts
Mined Out

Copyright 2012 by Richmont Mines
TSX - NYSE MKT: RIC
14
Beaufor Mine Overview
Copyright 2013 by Richmont Mines
TSX - NYSE MKT: RIC
14
• Production: 500,000+ Au ounces since 1996
• Underground, shaft access
• 5 years (1 million hours) no lost-time accident
• Ore processed 50 km away at Camflo Mill
• Reserves + Resources (as of Dec. 31/12):
- P + P reserves 39,114 Au ozs - M + I resources 160,263 Au ozs - Inferred resources 187,274 Au ozs
• 2013 drilling plan
- 17,500 metres of exploration - 11,500 metres of definition
• Objectives:
- Lower operating costs - Advance development of W Zone

Copyright 2012 by Richmont Mines
TSX - NYSE MKT: RIC
15
Beaufor Mine Annual Gold Sales
Copyright 2013 by Richmont Mines
TSX - NYSE MKT: RIC
15
(US$)
740867
921
1,394
1,1131,290
1,5591,666
0
10,000
20,000
30,000
2009 2010 2011 2012 2013F
Ounces gold sold Cash cost per ounce Selling price
20,854 oz 22,258 oz 26,947 oz Target:
25,000 oz 19,055 oz
(Ounces)
Note: Cash cost includes royalties.

Copyright 2012 by Richmont Mines
TSX - NYSE MKT: RIC
16
Beaufor Mine Q2 and YTD 2013 Production Highlights
Copyright 2013 by Richmont Mines
TSX - NYSE MKT: RIC
16
49,196 oz
49,196 oz 41,686 oz
(for the 3 and 6 mos. ended June 30) Q2
2013 Q2
2012 H1
2013 H1
2012
Tonnes 28,146 27,739 65,215 57,726
Gold recovery (%) 98.1% 97.6% 97.8% 98.1%
Head grade 7.15 g/t 4.48 g/t 5.63 g/t 5.69 g/t
Gold ounces sold 6,352 3,900 11,553 10,352
Avg. cash cost/oz (US$) 765 1,639 1,109 1,277
Avg. selling price/oz (US$) 1,352 1,608 1,466 1,658

Copyright 2012 by Richmont Mines
TSX - NYSE MKT: RIC
17 Copyright 2013 by Richmont Mines
TSX - NYSE MKT: RIC
17
W ZONE
• Located on Beaufor Mine property
• Camflo Mill is 50 km away
• Wide, steeply dipping zone • Favourable, near surface vein structure
• Significant work completed
W Zone Project Overview
Production Objectives:
- Pre-production of 3,000 Au oz in Q3 2013
- Commercial production of 3,000 Au oz in Q4 2013 (6,000 t/month)

Copyright 2012 by Richmont Mines
TSX - NYSE MKT: RIC
18
W Zone Project Reserves & Resources (Dec. 31, 2012)
Copyright 2013 by Richmont Mines
TSX - NYSE MKT: RIC
18
Perron
Shaft 5
Beaufor
Shaft 4 Ramp Portal
Zone W
Crown pillar
Zone 350
Reserves
Resources
-200 m
W ZONE
S N
-400 m
200 m
Zone 367
W E
Probable Reserves: 132,251 T at 7.21 g/t Au; 30,680 oz Au Indicated Resources: 107,511 T at 6.76 g/t Au; 23,377 oz Au Inferred Resources: 5,589 T at 7.95 g/t Au; 1,429 oz Au

Copyright 2012 by Richmont Mines
TSX - NYSE MKT: RIC
19
Monique Gold Project Overview
Copyright 2013 by Richmont Mines
TSX - NYSE MKT: RIC
19
• Located 25 km east of Val-d’Or, Quebec
• 100% owned, 50 km away from Camflo Mill
• 5.39 km2 (539 hectares)
• Reserves & Resources (as of July 1, 2013):
Open-pit Proven reserves(1) 1,707 Au ozs Open-pit Probable reserves(1) 33,991 Au ozs Total P+P reserves 35,698 Au ozs Indicated resources 16,858 Au oz * * underground, directly below the open-pit.
• Production Objectives:
- Q4 2013: 4,500 ozs
- Life of mine production of 30,000 ozs over 19 months, at an average cash cost of CAN$904/oz
(1) Open-pit reserves are based on a pit design established in 2012, and are calculated using a gold price of US$1,400/oz and an exchange rate of 1.00. The cut-off grade used is 0.85 g/t Au. A 43-101 technical report was filed on SEDAR (www.sedar.com) on September 13, 2013.

Copyright 2012 by Richmont Mines
TSX - NYSE MKT: RIC
20 Copyright 2013 by Richmont Mines
TSX - NYSE MKT: RIC
20
49,196 oz
• Located in Malartic, Quebec
• 100% owned
• Replacement value >CAN$35 M
• 3 years no lost-time accident
• Full capacity utilization with onset of production from W Zone and Monique
• 2013 feed sources:
- Beaufor Mine
- 8,494 tonne Monique bulk sample
- 7,700 tonne W Zone bulk sample
- Pre-production ore and commercial production ore from W Zone & Monique
Camflo Mill Overview

Copyright 2012 by Richmont Mines
TSX - NYSE MKT: RIC
21
Wasamac Gold Property Overview
Copyright 2013 by Richmont Mines
TSX - NYSE MKT: RIC
21
• Located 15 km from Rouyn-Noranda, QC
• 5.91 km2 (591 hectares); 100%-owned
• No royalties or back-in rights
• Exploration drilling:
~ 125,000 metres over 2010 - 2012 period
• Past production (1965 – 1971):
- 252,923 Au oz at 4.16 g/t
• Reserves + Resources (as of Dec. 31, 2012):
- M + I Resources: 1,402,263 Au ozs
- Inferred Resources: 1,605,388 Au ozs
• Objectives:
- Continue to advance technical studies
- Continue permitting efforts
• Provides Richmont with significant gold price leverage
1964

Copyright 2012 by Richmont Mines
TSX - NYSE MKT: RIC
22
Wasamac Gold Property
Copyright 2013 by Richmont Mines
TSX - NYSE MKT: RIC
22
800
600
400
800
1000
200
600
1175
1350
400
Wasam
ac
Op
tion
Glo
bex
Faille Horne-Creek
Resources as of December 31, 2012 Cut-off: 1.5 g/t Au
Measured & Indicated Resources: 15,251,529 T at 2.86 g/t Au; 1,402,263 oz Au
Inferred Resources: 18,758,786 T at 2.66 g/t Au; 1,605,388 oz Au
Zone 1 Zone 2 Zone 3 MacWin Zone Zone 4
Main Zone Production (1965-1971): 1.9 MT at 4.16 g/t Au; 252,923 oz Au
2012 Intersection
Previous intersection
Resources (31/12/2012)
Mined out / Opening
100 metres
W E

Copyright 2012 by Richmont Mines
TSX - NYSE MKT: RIC
23
Wasamac Gold Property Gold Price Leverage
Copyright 2013 by Richmont Mines
TSX - NYSE MKT: RIC
23
1,402,263 Au oz
1,605,388 Au oz
556,385 Au oz
2,130,532 Au oz
411,073 Au oz
1,007,875 Au oz
INFERRED RESOURCES
MEASURED & INDICATED RESOURCES
Dec. 31/10
Dec. 31/11
Dec. 31/12
2010
2012
2011
2012
2011
2010
• Notable resource base growth over 2010 to 2012 period
• Provides Richmont with significant optionality to gold price

Copyright 2012 by Richmont Mines
TSX - NYSE MKT: RIC
24
2013 Objectives
Objectives:
Bring Monique and W Zone projects into commercial production;
Continue to advance the Island Gold Deep project;
Optimize efficiency of our assets – those in production, and those being developed & evaluated;
Strategic capital allocation in keeping with the current gold price environment.
Richmont has a strong foundation to build on:
Solid balance sheet, tight capital structure and experienced management team anchor the Corporation for future growth;
Potentially transformational asset at Island Gold Deep;
Dramatic gold price leverage with Wasamac, should gold enter a new Bull phase.
Copyright 2013 by Richmont Mines
TSX - NYSE MKT: RIC
24

Copyright 2012 by Richmont Mines
TSX - NYSE MKT: RIC
25
Conclusion
Copyright 2013 by Richmont Mines
TSX - NYSE MKT: RIC
25
Richmont is a rarity among junior gold miners...
A proven history of gold production
Over 1.3 million gold ounces sold since 1991
Operations in a safe political environment
Sound balance sheet and capital structure, with a
potentially transformational asset on the horizon.