2012 denver gold forum
TRANSCRIPT
2012 Denver Gold Forum
Richard O’Brien, CEO
September 11, 2012
Newmont Mining Corporation | Denver Gold Forum | www.newmont.com September 11, 2012 2
Cautionary Statement
Cautionary Statement Regarding Forward Looking Statements, Including 2012 Outlook:
This presentation contains “forward-looking statements” within the meaning of Section 27A of the Securities Act of 1933, as amended, and Section 21E of the Securities Exchange Act of 1934,
as amended, which are intended to be covered by the safe harbor created by those sections and other applicable laws. Those forward-looking statements include (without limitation) estimates
and expectations of, and statements regarding: (i) the Company’s strategy and plans, including without limitation re-sequencing of our portfolio, optimization of current operations, overhead
cost reductions and outlook; (ii) future equity gold and equity copper production; (iii) future operating, sales and other costs; (iv) future capital expenditures; (v) project returns; (vi) project start
dates, ramp up, life, pipeline timelines, including commencement of mining, drilling and stage gate advancement and expansion opportunities; (vii) potential ounces or tons of reserves, NRM
and potential resources; (viii) exploration pipeline, potential or upside, opportunities, growth and growth potential; (ix) dividend payments and increases; (x) future liquidity, cash and balance
sheet expectations; and (xi) other financial outlook indicators relation to the Company’s operations and projects. Those forward-looking statements include (without limitation) statements that
use forward-looking terminology such as “may”, “will”, “expect”, “predict”, “anticipate”, “believe”, “continue”, “potential”, “target”, “goal”, “opportunity”, “outlook”, or the negative or other variations
of those terms or comparable terminology. Estimates or expectations of future events or results are based upon certain assumptions, which may prove to be incorrect. Those assumptions
include (without limitation): (i) there being no significant change to current geotechnical, metallurgical, hydrological and other physical conditions; (ii) permitting, development, operations and
expansion of the Company’s projects being consistent with current expectations and mine plans; (iii) political, social and legal developments in any jurisdiction in which the Company conducts
business being consistent with its current expectations; (iv) certain exchange rate assumptions for the Australian dollar to the U.S. dollar, as well as the other exchange rates being
approximately consistent with current levels; (v) certain price assumptions for gold, copper and oil; (vi) prices for key supplies being approximately consistent with current levels and such
supplies otherwise being available on bases consistent with the Company’s current expectations; and (vii) the accuracy of our current mineral reserve and mineral resource estimates and
exploration information. Where the Company expresses or implies an expectation or belief as to future events or results, that expectation or belief is expressed in good faith and is believed to
have a reasonable basis. However, forward-looking statements are subject to risks, uncertainties and other factors that could cause actual results to differ materially from future results
expressed, projected or implied by the “forward-looking statements”. Those risks, uncertainties and other factors include (without limitation): (i) gold and other metals price volatility; (ii) currency
fluctuations; (iii) increased capital and operating costs, and scarcity of and competition for required labor and supplies; (iv) variances in oregrade or recovery rates from those assumed in
mining plans; (v) operating or technical difficulties; (vi) political and operational risks; (vii) community relations, conflict resolution and outcome of projects or oppositions; and (viii) governmental
regulation and judicial outcomes. For a more detailed discussion of such risks and other factors, see the Company’s 2011 Annual Report on Form 10-K, filed on February 24, 2012, with the
Securities and Exchange Commission (“SEC”), as well as the Company’s other SEC filings. These forward-looking statements are not guarantees of future performance, given that they involve
risks and uncertainties. The Company does not undertake any obligation to release publicly revisions to any forward-looking statement except as may be required under applicable securities
laws. Investors should not assume that any lack of update to a previously issued forward-looking statement constitutes a reaffirmation of that statement. Continued reliance on forward-looking
statements is at investors' own risk. In addition, some of the statements in this presentation are based on assumptions or methodologies (such as commodity prices) or subject to cautionary
statements that are discussed in the notes found at the end of this presentation.
Newmont Mining Corporation | Denver Gold Forum | www.newmont.com September 11, 2012 3
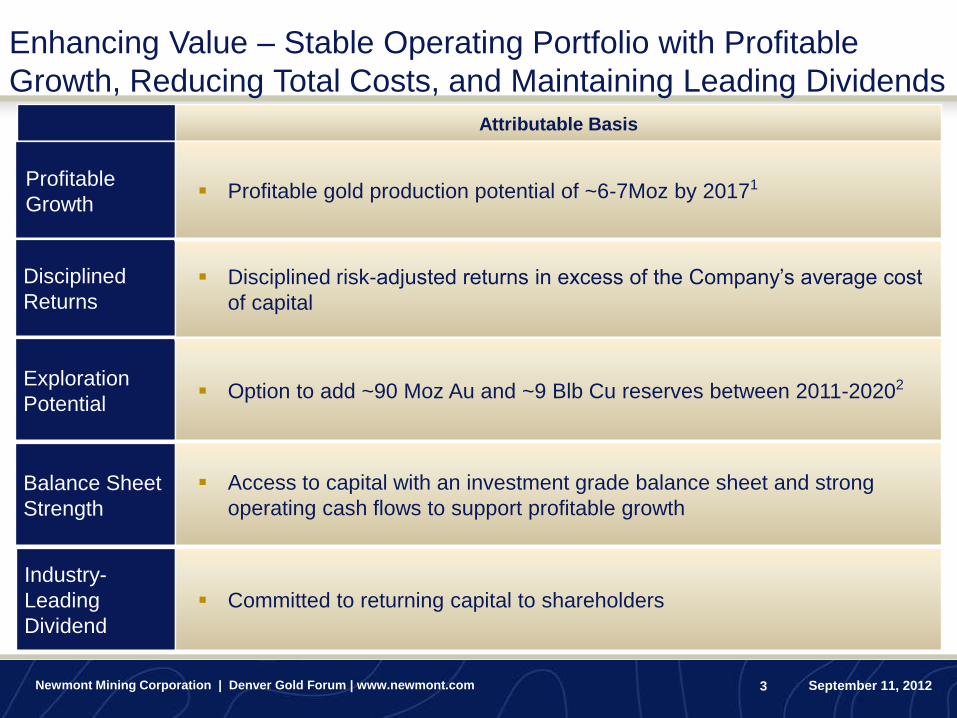
Enhancing Value – Stable Operating Portfolio with Profitable
Growth, Reducing Total Costs, and Maintaining Leading Dividends
Attributable Basis
Profitable
Growth
Disciplined
Returns
Exploration
Potential
Balance Sheet
Strength
Industry-
Leading
Dividend
Disciplined risk-adjusted returns in excess of the Company’s average cost
of capital
Option to add ~90 Moz Au and ~9 Blb Cu reserves between 2011-20202
Access to capital with an investment grade balance sheet and strong
operating cash flows to support profitable growth
Committed to returning capital to shareholders
Profitable gold production potential of ~6-7Moz by 20171
Newmont Mining Corporation | Denver Gold Forum | www.newmont.com September 11, 2012 4
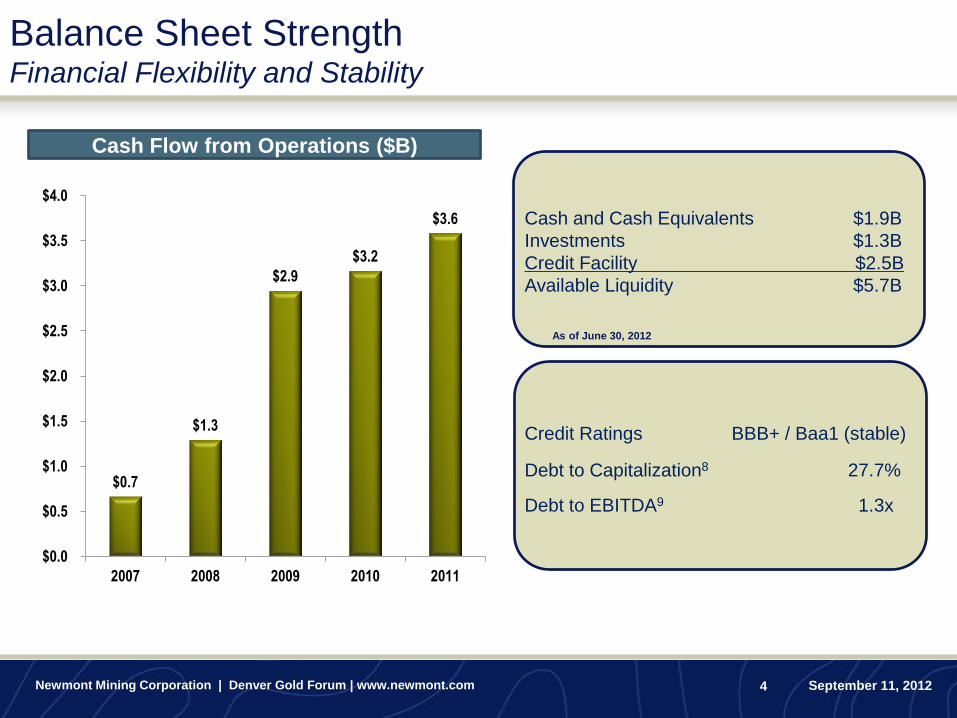
Balance Sheet Strength Financial Flexibility and Stability
$0.7
$1.3
$2.9
$3.2
$3.6
$0.0
$0.5
$1.0
$1.5
$2.0
$2.5
$3.0
$3.5
$4.0
2007 2008 2009 2010 2011
Cash Flow from Operations ($B)
Cash and Cash Equivalents $1.9B
Investments $1.3B
Credit Facility $2.5B
Available Liquidity $5.7B
Credit Ratings BBB+ / Baa1 (stable)
Debt to Capitalization8 27.7%
Debt to EBITDA9 1.3x
As of June 30, 2012
Newmont Mining Corporation | Denver Gold Forum | www.newmont.com September 11, 2012 5
$0.40
$0.60
$0.80
$1.00
$1.20
$1.40
$1.70
$2.00
$2.30
$2.70
$3.10
$3.50
$3.90
$4.30
$4.70
$0.00
$0.50
$1.00
$1.50
$2.00
$2.50
$3.00
$3.50
$4.00
$4.50
$5.00
$1,100-$1,199
$1,200-$1,299
$1,300-$1,399
$1,400-$1,499
$1,500-$1,599
$1,600-$1,699
$1,700-$1,799
$1,800-$1,899
$1,900-$1,999
$2,000-$2,099
$2,100-$2,199
$2,200-$2,299
$2,300-$2,399
$2,400-$2,499
$2,500-$2,599
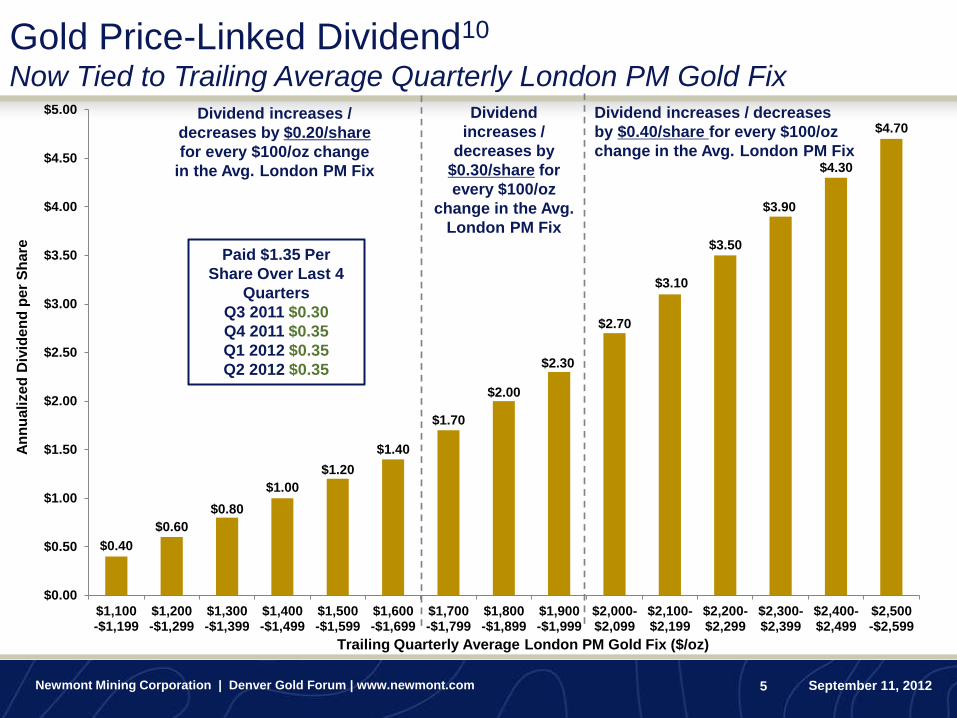
Gold Price-Linked Dividend10
Now Tied to Trailing Average Quarterly London PM Gold Fix
An
nu
ali
ze
d D
ivid
en
d p
er
Sh
are
Trailing Quarterly Average London PM Gold Fix ($/oz)
Dividend increases / decreases
by $0.40/share for every $100/oz
change in the Avg. London PM Fix
Dividend
increases /
decreases by
$0.30/share for
every $100/oz
change in the Avg.
London PM Fix
Dividend increases /
decreases by $0.20/share
for every $100/oz change
in the Avg. London PM Fix
Paid $1.35 Per
Share Over Last 4
Quarters
Q3 2011 $0.30
Q4 2011 $0.35
Q1 2012 $0.35
Q2 2012 $0.35
Newmont Mining Corporation | Denver Gold Forum | www.newmont.com September 11, 2012 6
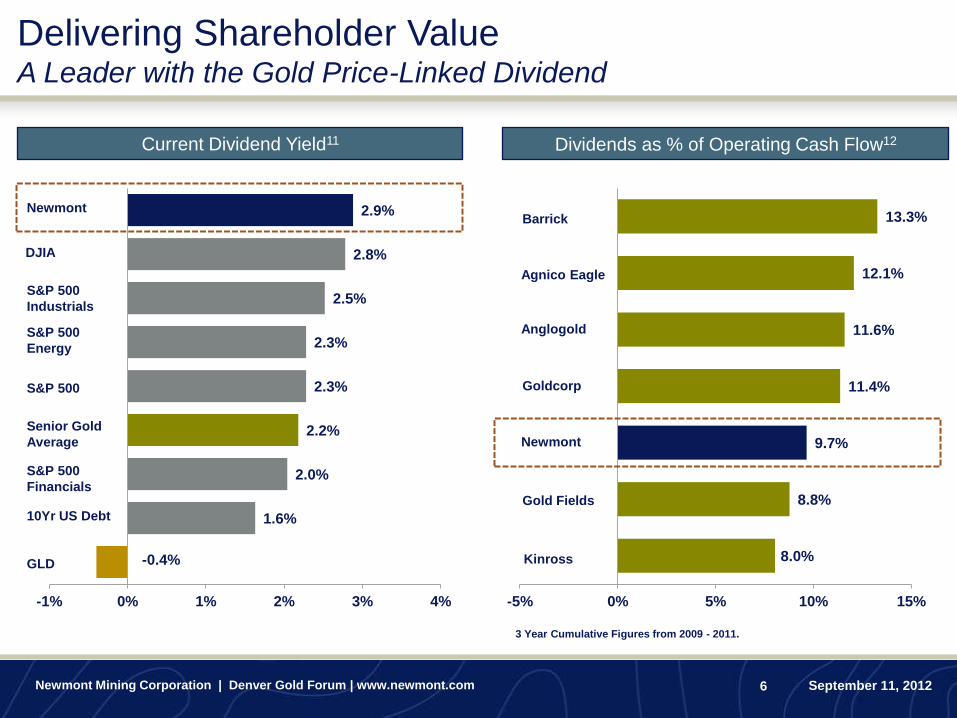
Current Dividend Yield11
Delivering Shareholder Value
A Leader with the Gold Price-Linked Dividend
Dividends as % of Operating Cash Flow12
-0.4%
1.6%
2.0%
2.2%
2.3%
2.3%
2.5%
2.8%
2.9%
-1% 0% 1% 2% 3% 4%
GLD
10Yr US Debt
S&P 500
Financials
Senior Gold
Average
S&P 500
S&P 500
Energy
S&P 500
Industrials
DJIA
Newmont
8.0%
8.8%
9.7%
11.4%
11.6%
12.1%
13.3%
-5% 0% 5% 10% 15%
Kinross
Gold Fields
Newmont
Goldcorp
Anglogold
Agnico Eagle
Barrick
3 Year Cumulative Figures from 2009 - 2011.
Newmont Mining Corporation | Denver Gold Forum | www.newmont.com September 11, 2012 7
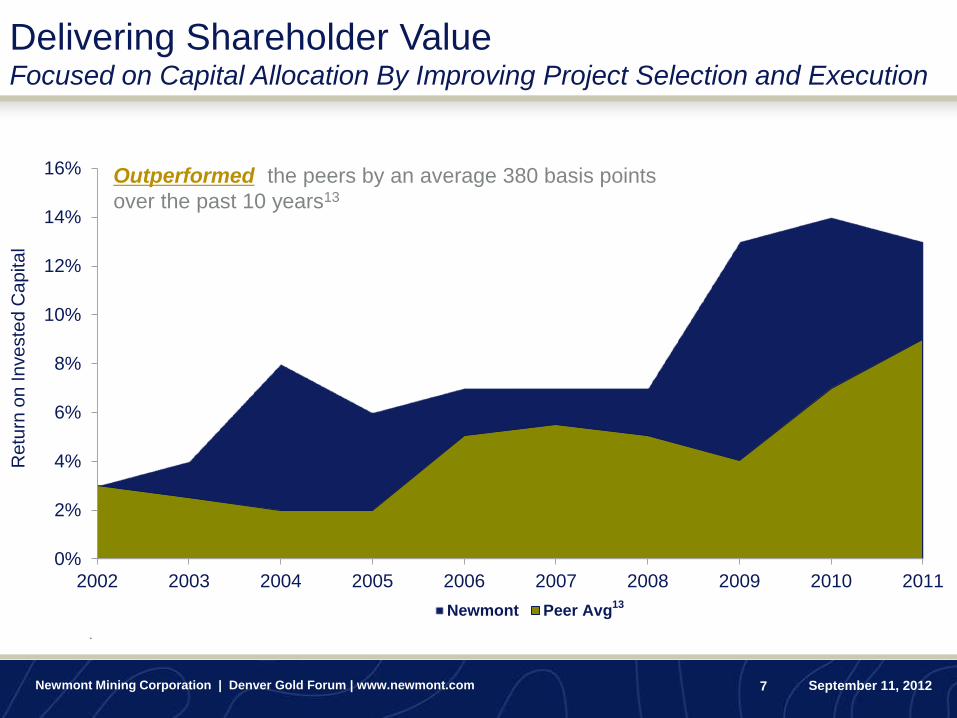
Delivering Shareholder Value Focused on Capital Allocation By Improving Project Selection and Execution
Outperformed the peers by an average 380 basis points
over the past 10 years13
Re
turn
on
In
ve
ste
d C
ap
ita
l
`
0%
2%
4%
6%
8%
10%
12%
14%
16%
2002 2003 2004 2005 2006 2007 2008 2009 2010 2011
Newmont Peer Avg13
Newmont Mining Corporation | Denver Gold Forum | www.newmont.com September 11, 2012 8
-$6.00
-$5.00
-$4.00
-$3.00
-$2.00
-$1.00
$0.00
$1.00
$2.00
$3.00
$4.00
$5.00
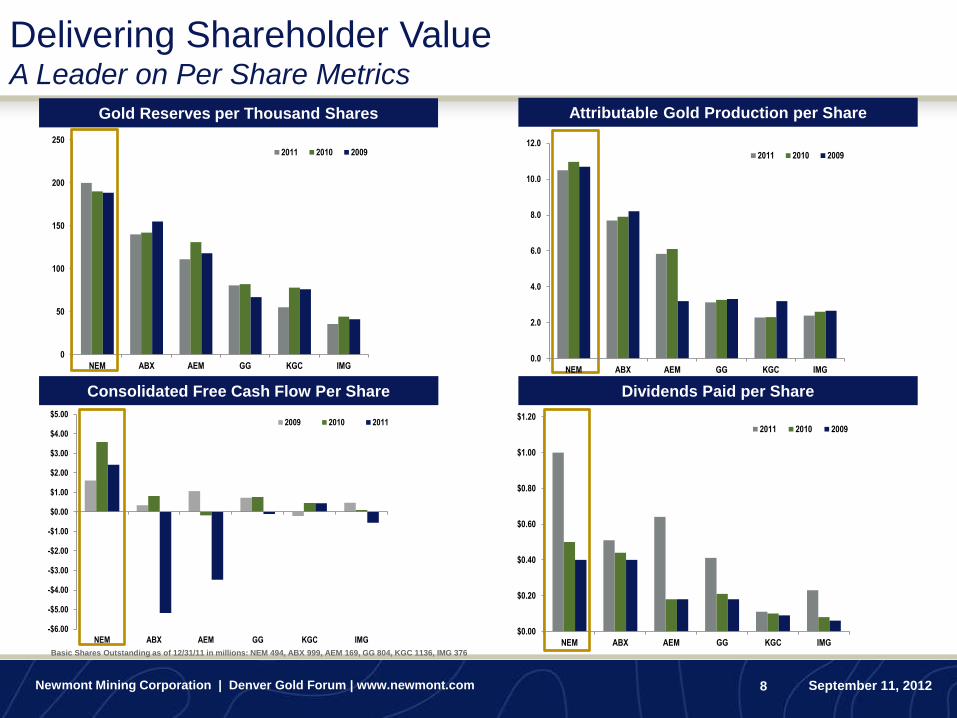
NEM ABX AEM GG KGC IMG
2009 2010 2011
$0.00
$0.20
$0.40
$0.60
$0.80
$1.00
$1.20
NEM ABX AEM GG KGC IMG
2011 2010 2009
0
50
100
150
200
250
NEM ABX AEM GG KGC IMG
2011 2010 2009
Delivering Shareholder Value A Leader on Per Share Metrics
Gold Reserves per Thousand Shares
Dividends Paid per Share Consolidated Free Cash Flow Per Share
Attributable Gold Production per Share
0.0
2.0
4.0
6.0
8.0
10.0
12.0
NEM ABX AEM GG KGC IMG
2011 2010 2009
Basic Shares Outstanding as of 12/31/11 in millions: NEM 494, ABX 999, AEM 169, GG 804, KGC 1136, IMG 376
Newmont Mining Corporation | Denver Gold Forum | www.newmont.com September 11, 2012 9
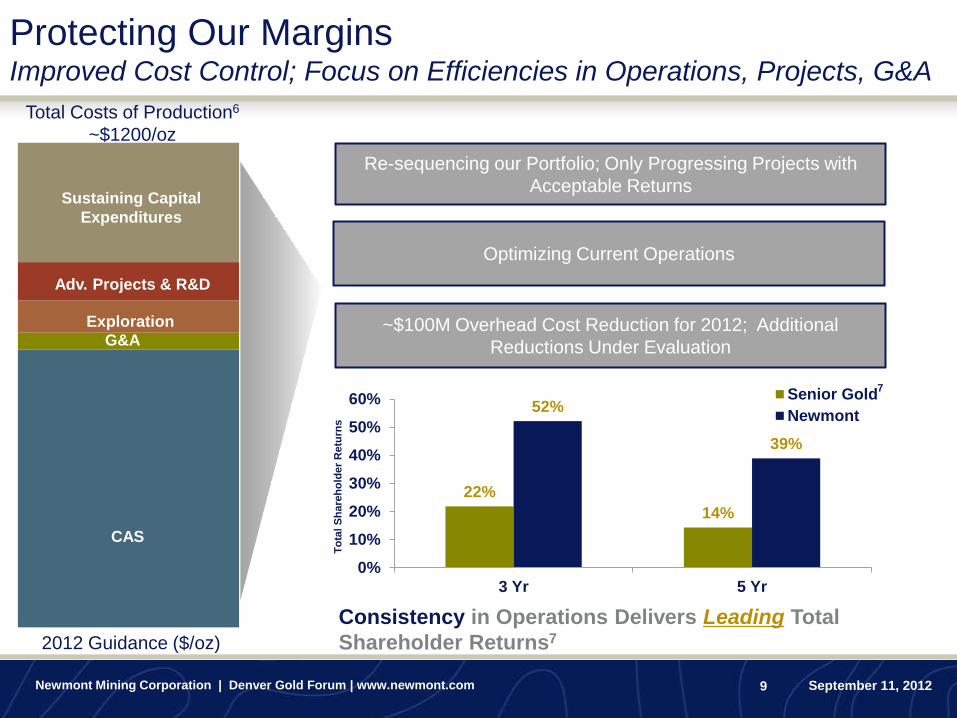
Protecting Our Margins Improved Cost Control; Focus on Efficiencies in Operations, Projects, G&A
CAS
Re-sequencing our Portfolio; Only Progressing Projects with
Acceptable Returns
G&A
Exploration
Adv. Projects & R&D
Sustaining Capital
Expenditures
~$100M Overhead Cost Reduction for 2012; Additional
Reductions Under Evaluation
2012 Guidance ($/oz)
Optimizing Current Operations
Total Costs of Production6
~$1200/oz
22%
14%
52%
39%
0%
10%
20%
30%
40%
50%
60%
3 Yr 5 Yr
Senior Gold
Newmont
To
tal
Sh
are
ho
lde
r R
etu
rns
Consistency in Operations Delivers Leading Total
Shareholder Returns7
7
Newmont Mining Corporation | Denver Gold Forum | www.newmont.com September 11, 2012 10
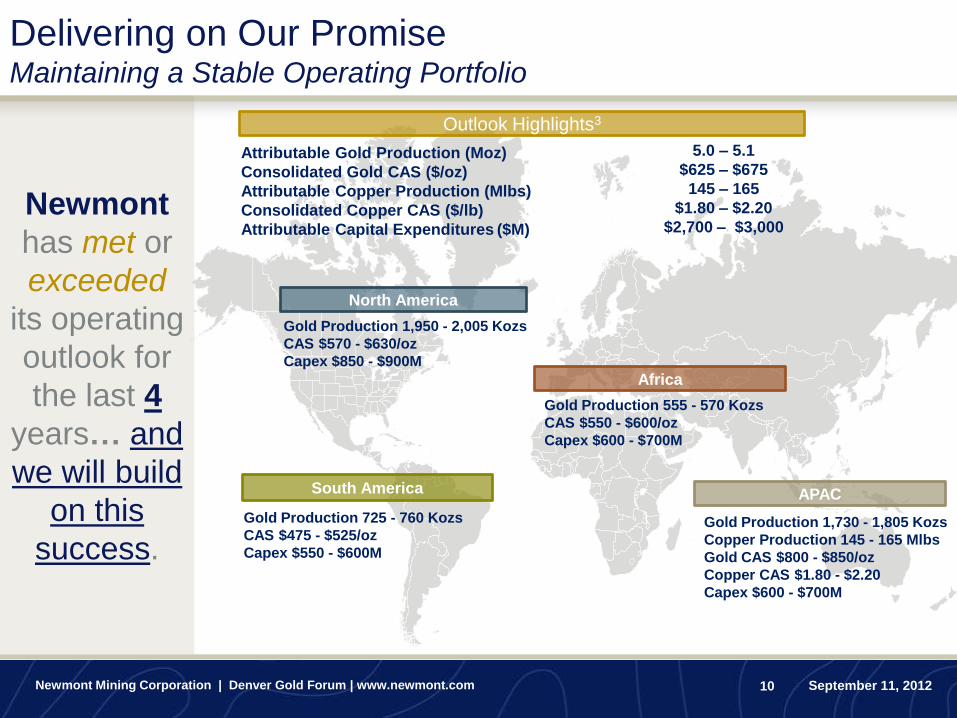
Delivering on Our Promise Maintaining a Stable Operating Portfolio
Outlook Highlights3
Attributable Gold Production (Moz)
Consolidated Gold CAS ($/oz)
Attributable Copper Production (Mlbs)
Consolidated Copper CAS ($/lb)
Attributable Capital Expenditures ($M)
5.0 – 5.1
$625 – $675
145 – 165
$1.80 – $2.20
$2,700 – $3,000
North America
Gold Production 1,950 - 2,005 Kozs
CAS $570 - $630/oz
Capex $850 - $900M
South America
Gold Production 725 - 760 Kozs
CAS $475 - $525/oz
Capex $550 - $600M
Africa
Gold Production 555 - 570 Kozs
CAS $550 - $600/oz
Capex $600 - $700M
APAC
Gold Production 1,730 - 1,805 Kozs
Copper Production 145 - 165 Mlbs
Gold CAS $800 - $850/oz
Copper CAS $1.80 - $2.20
Capex $600 - $700M
Newmont
has met or
exceeded
its operating
outlook for
the last 4
years… and
we will build
on this
success.
Newmont Mining Corporation | Denver Gold Forum | www.newmont.com September 11, 2012 11
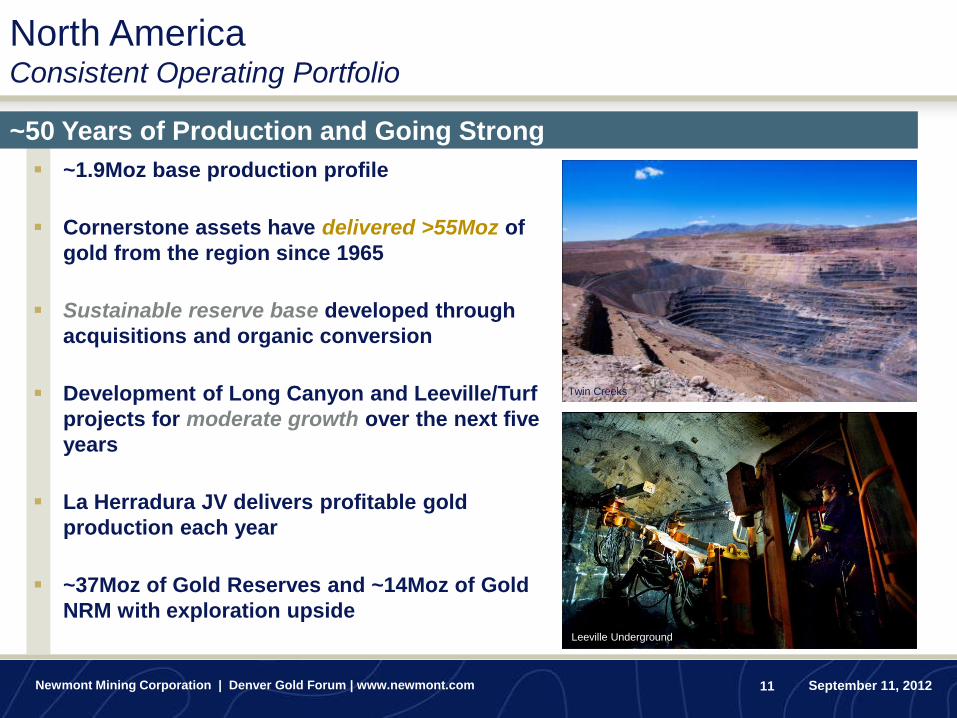
~1.9Moz base production profile
Cornerstone assets have delivered >55Moz of
gold from the region since 1965
Sustainable reserve base developed through
acquisitions and organic conversion
Development of Long Canyon and Leeville/Turf
projects for moderate growth over the next five
years
La Herradura JV delivers profitable gold
production each year
~37Moz of Gold Reserves and ~14Moz of Gold
NRM with exploration upside
~50 Years of Production and Going Strong
Phoenix Mill Twin Creeks
Leeville Underground
North America Consistent Operating Portfolio
Newmont Mining Corporation | Denver Gold Forum | www.newmont.com September 11, 2012 12
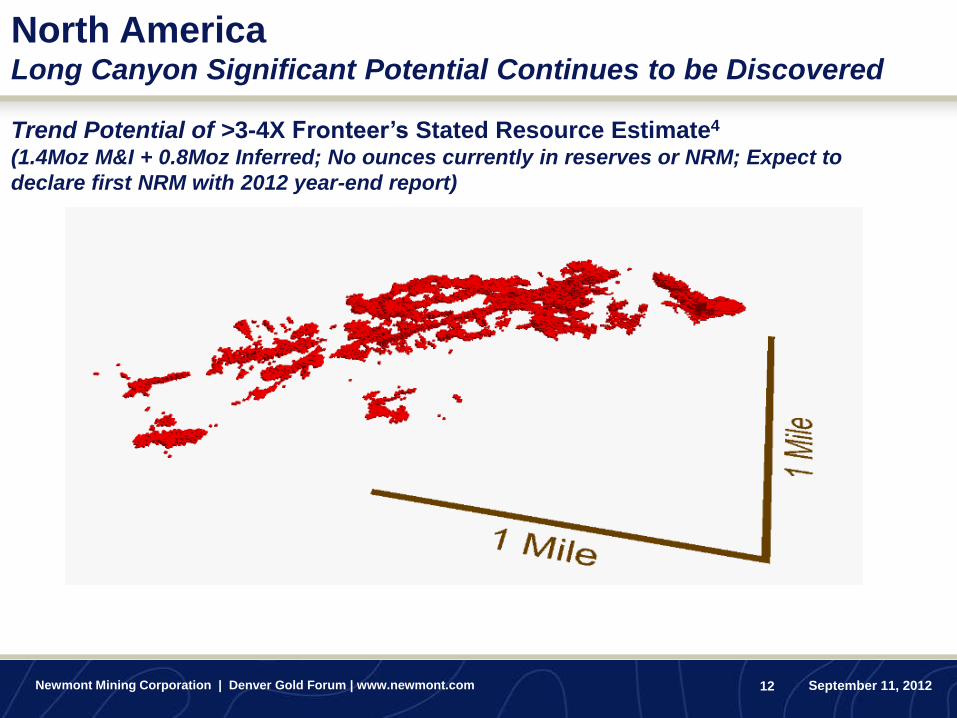
Trend Potential of >3-4X Fronteer’s Stated Resource Estimate4 (1.4Moz M&I + 0.8Moz Inferred; No ounces currently in reserves or NRM; Expect to
declare first NRM with 2012 year-end report)
North America Long Canyon Significant Potential Continues to be Discovered
Newmont Mining Corporation | Denver Gold Forum | www.newmont.com September 11, 2012 13
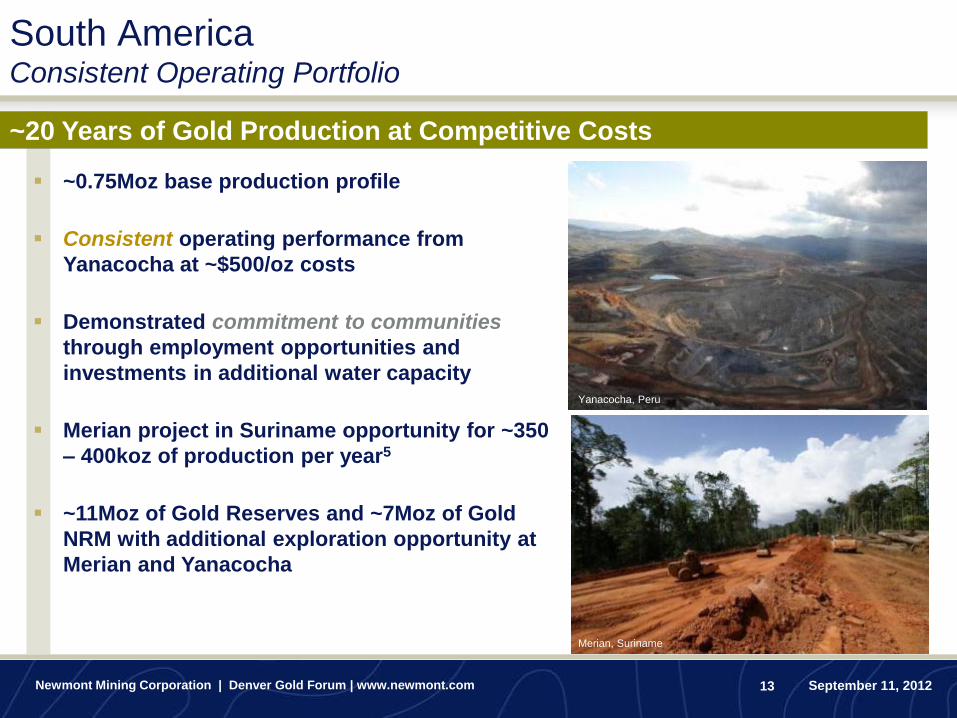
South America Consistent Operating Portfolio
~0.75Moz base production profile
Consistent operating performance from
Yanacocha at ~$500/oz costs
Demonstrated commitment to communities
through employment opportunities and
investments in additional water capacity
Merian project in Suriname opportunity for ~350
– 400koz of production per year5
~11Moz of Gold Reserves and ~7Moz of Gold
NRM with additional exploration opportunity at
Merian and Yanacocha
~20 Years of Gold Production at Competitive Costs
Merian, Suriname
Yanacocha, Peru
Newmont Mining Corporation | Denver Gold Forum | www.newmont.com September 11, 2012 14
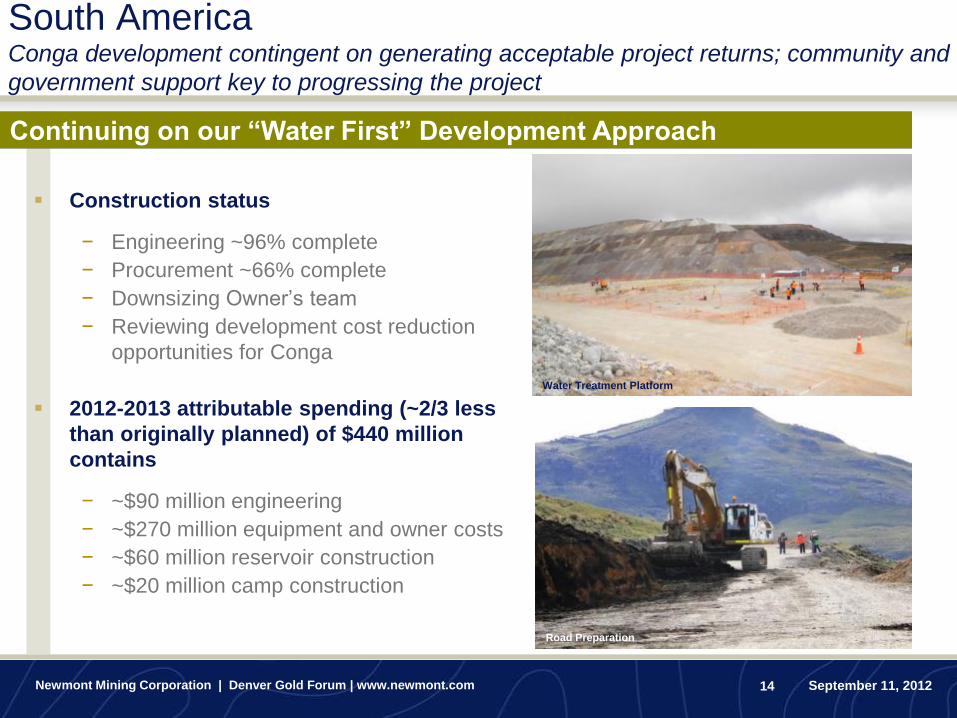
South America Conga development contingent on generating acceptable project returns; community and
government support key to progressing the project
Construction status
− Engineering ~96% complete
− Procurement ~66% complete
− Downsizing Owner’s team
− Reviewing development cost reduction
opportunities for Conga
2012-2013 attributable spending (~2/3 less
than originally planned) of $440 million
contains
− ~$90 million engineering
− ~$270 million equipment and owner costs
− ~$60 million reservoir construction
− ~$20 million camp construction
Continuing on our “Water First” Development Approach
Water Treatment Platform
Road Preparation
Newmont Mining Corporation | Denver Gold Forum | www.newmont.com September 11, 2012 15
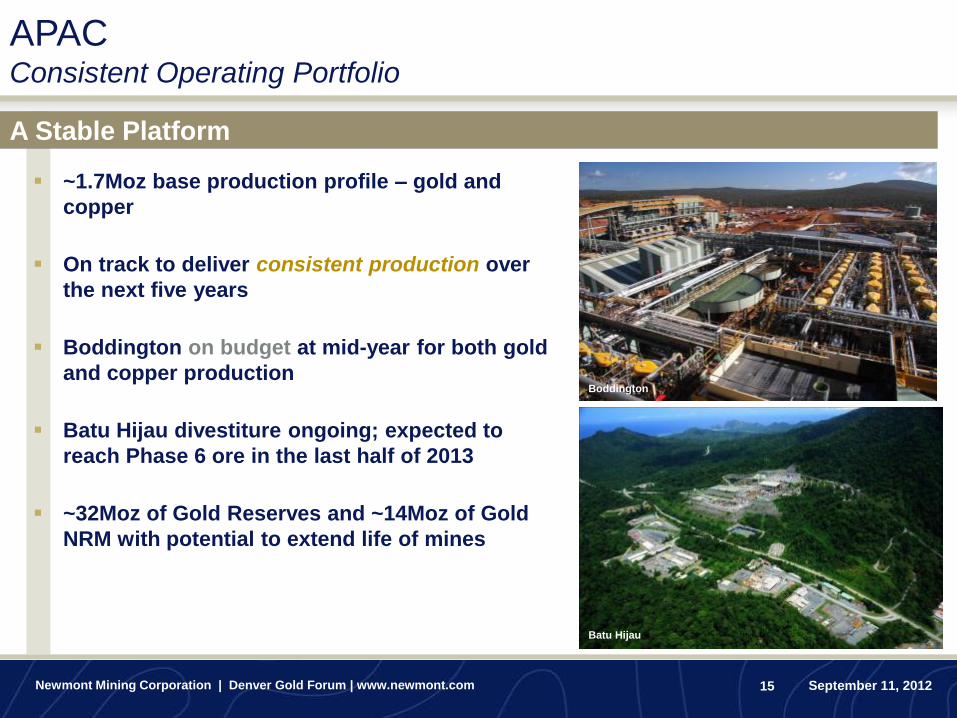
~1.7Moz base production profile – gold and
copper
On track to deliver consistent production over
the next five years
Boddington on budget at mid-year for both gold
and copper production
Batu Hijau divestiture ongoing; expected to
reach Phase 6 ore in the last half of 2013
~32Moz of Gold Reserves and ~14Moz of Gold
NRM with potential to extend life of mines
A Stable Platform
Boddington
APAC Consistent Operating Portfolio
Batu Hijau Batu Hijau
Newmont Mining Corporation | Denver Gold Forum | www.newmont.com September 11, 2012 16
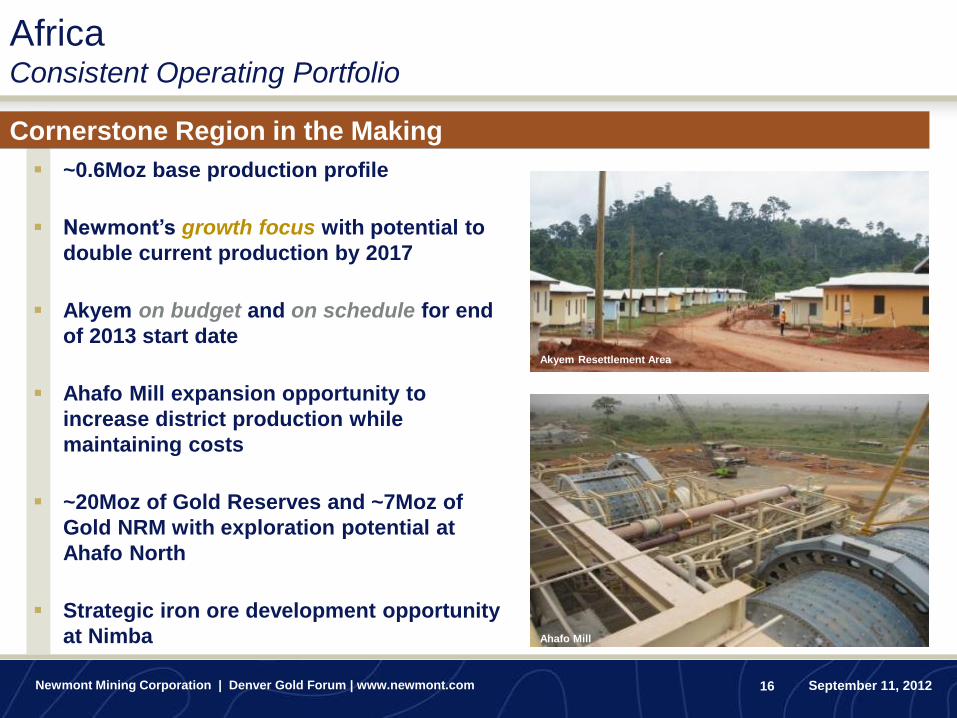
Africa Consistent Operating Portfolio
~0.6Moz base production profile
Newmont’s growth focus with potential to
double current production by 2017
Akyem on budget and on schedule for end
of 2013 start date
Ahafo Mill expansion opportunity to
increase district production while
maintaining costs
~20Moz of Gold Reserves and ~7Moz of
Gold NRM with exploration potential at
Ahafo North
Strategic iron ore development opportunity
at Nimba
Cornerstone Region in the Making
Ahafo Mill
Akyem
Akyem Resettlement Area
Newmont Mining Corporation | Denver Gold Forum | www.newmont.com September 11, 2012 17
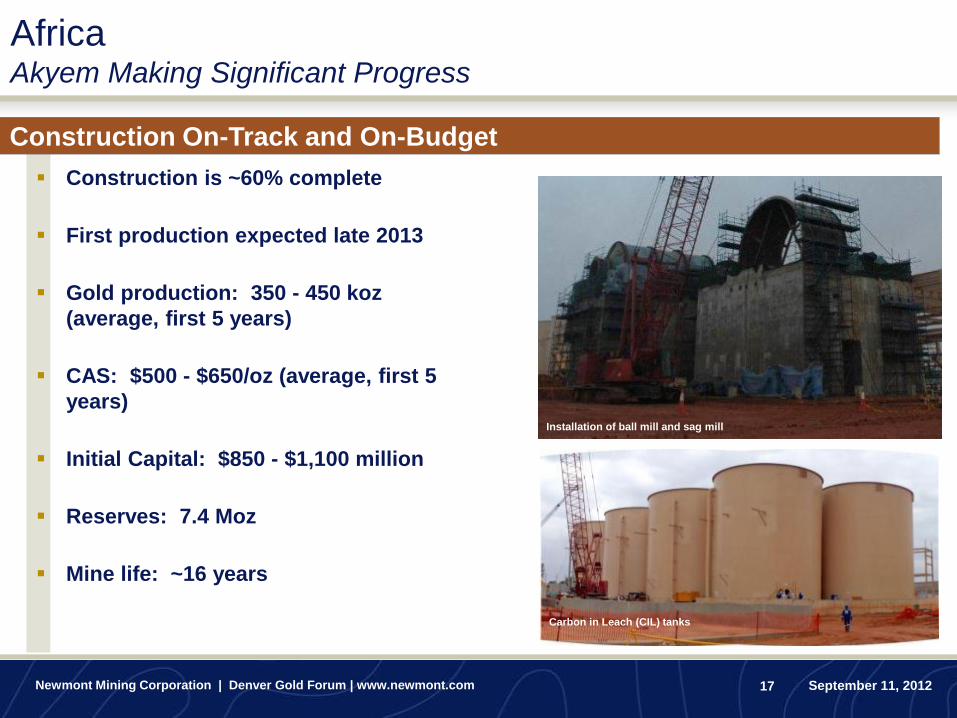
Africa Akyem Making Significant Progress
Construction On-Track and On-Budget
Construction is ~60% complete
First production expected late 2013
Gold production: 350 - 450 koz
(average, first 5 years)
CAS: $500 - $650/oz (average, first 5
years)
Initial Capital: $850 - $1,100 million
Reserves: 7.4 Moz
Mine life: ~16 years
Carbon in Leach (CIL) tanks
Installation of ball mill and sag mill
Newmont Mining Corporation | Denver Gold Forum | www.newmont.com September 11, 2012 18
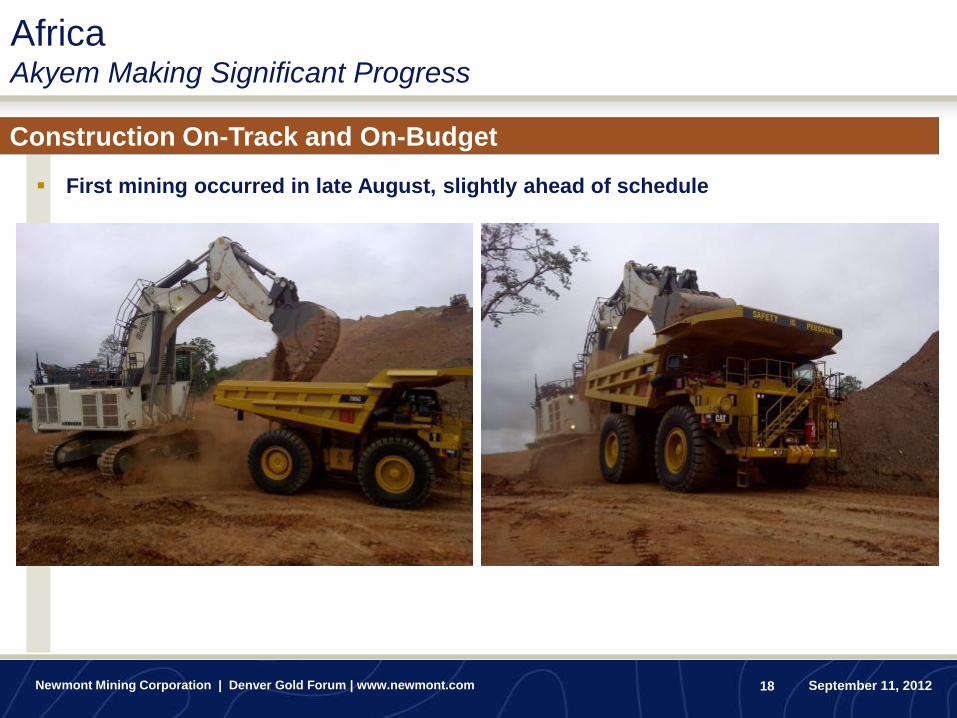
Africa Akyem Making Significant Progress
Construction On-Track and On-Budget
First mining occurred in late August, slightly ahead of schedule
Newmont Mining Corporation | Denver Gold Forum | www.newmont.com September 11, 2012 19
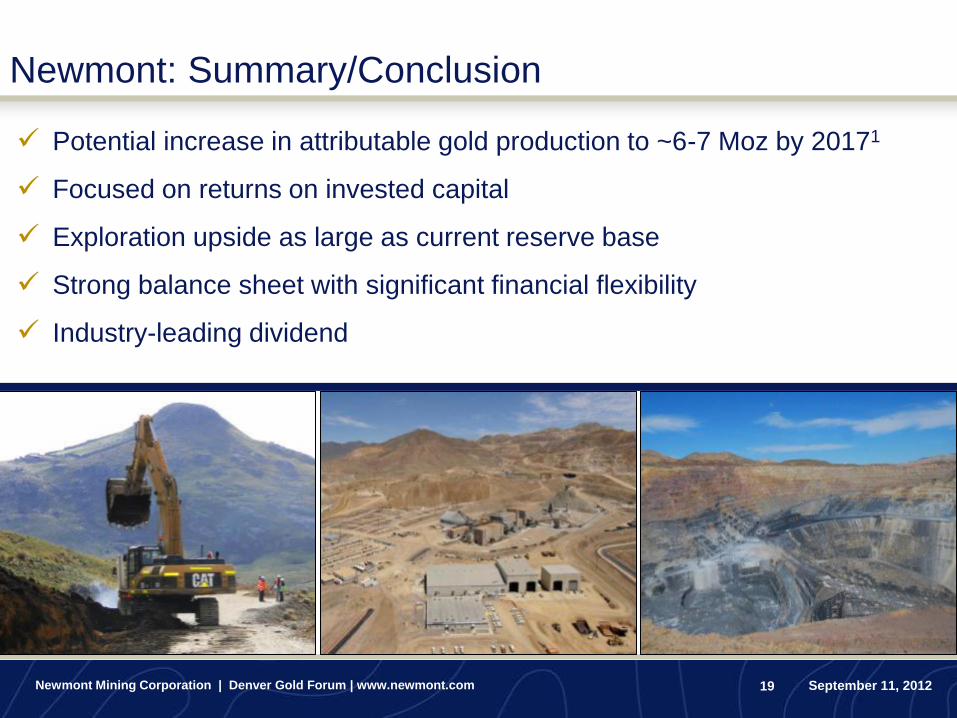
Newmont: Summary/Conclusion
Potential increase in attributable gold production to ~6-7 Moz by 20171
Focused on returns on invested capital
Exploration upside as large as current reserve base
Strong balance sheet with significant financial flexibility
Industry-leading dividend
Questions?
Appendix
Newmont Mining Corporation | Denver Gold Forum | www.newmont.com September 11, 2012 22
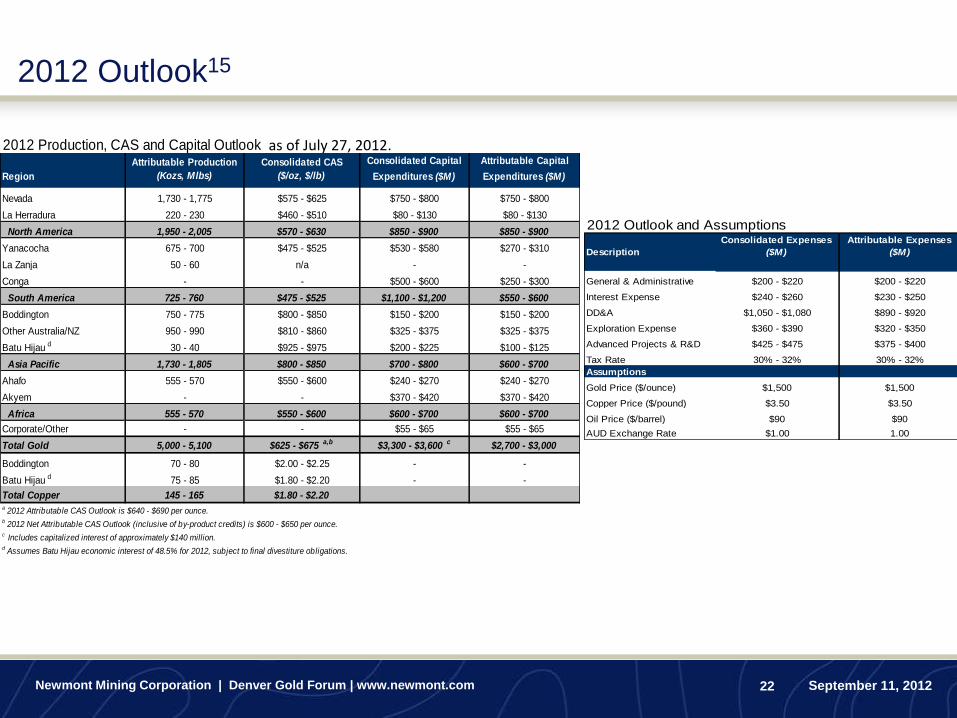
2012 Outlook15
2012 Production, CAS and Capital OutlookAttributable Production Consolidated CAS Consolidated Capital Attributable Capital
Region (Kozs, Mlbs) ($/oz, $/lb) Expenditures ($M) Expenditures ($M)
Nevada 1,730 - 1,775 $575 - $625 $750 - $800 $750 - $800
La Herradura 220 - 230 $460 - $510 $80 - $130 $80 - $130
North America 1,950 - 2,005 $570 - $630 $850 - $900 $850 - $900
Yanacocha 675 - 700 $475 - $525 $530 - $580 $270 - $310
La Zanja 50 - 60 n/a - -
Conga - - $500 - $600 $250 - $300
South America 725 - 760 $475 - $525 $1,100 - $1,200 $550 - $600
Boddington 750 - 775 $800 - $850 $150 - $200 $150 - $200
Other Australia/NZ 950 - 990 $810 - $860 $325 - $375 $325 - $375
Batu Hijau d 30 - 40 $925 - $975 $200 - $225 $100 - $125
Asia Pacific 1,730 - 1,805 $800 - $850 $700 - $800 $600 - $700
Ahafo 555 - 570 $550 - $600 $240 - $270 $240 - $270
Akyem - - $370 - $420 $370 - $420
Africa 555 - 570 $550 - $600 $600 - $700 $600 - $700
Corporate/Other - - $55 - $65 $55 - $65
Total Gold 5,000 - 5,100 $625 - $675 a,b $3,300 - $3,600 c $2,700 - $3,000
Boddington 70 - 80 $2.00 - $2.25 - -
Batu Hijau d 75 - 85 $1.80 - $2.20 - -
Total Copper 145 - 165 $1.80 - $2.20a 2012 Attributable CAS Outlook is $640 - $690 per ounce.b 2012 Net Attributable CAS Outlook (inclusive of by-product credits) is $600 - $650 per ounce.c Includes capitalized interest of approximately $140 million.d Assumes Batu Hijau economic interest of 48.5% for 2012, subject to final divestiture obligations.
2012 Outlook and Assumptions
Description
Consolidated Expenses
($M)
Attributable Expenses
($M)
General & Administrative $200 - $220 $200 - $220
Interest Expense $240 - $260 $230 - $250
DD&A $1,050 - $1,080 $890 - $920
Exploration Expense $360 - $390 $320 - $350
Advanced Projects & R&D $425 - $475 $375 - $400
Tax Rate 30% - 32% 30% - 32%
Assumptions
Gold Price ($/ounce) $1,500 $1,500
Copper Price ($/pound) $3.50 $3.50
Oil Price ($/barrel) $90 $90
AUD Exchange Rate $1.00 1.00
as of July 27, 2012.
Newmont Mining Corporation | Denver Gold Forum | www.newmont.com September 11, 2012 23
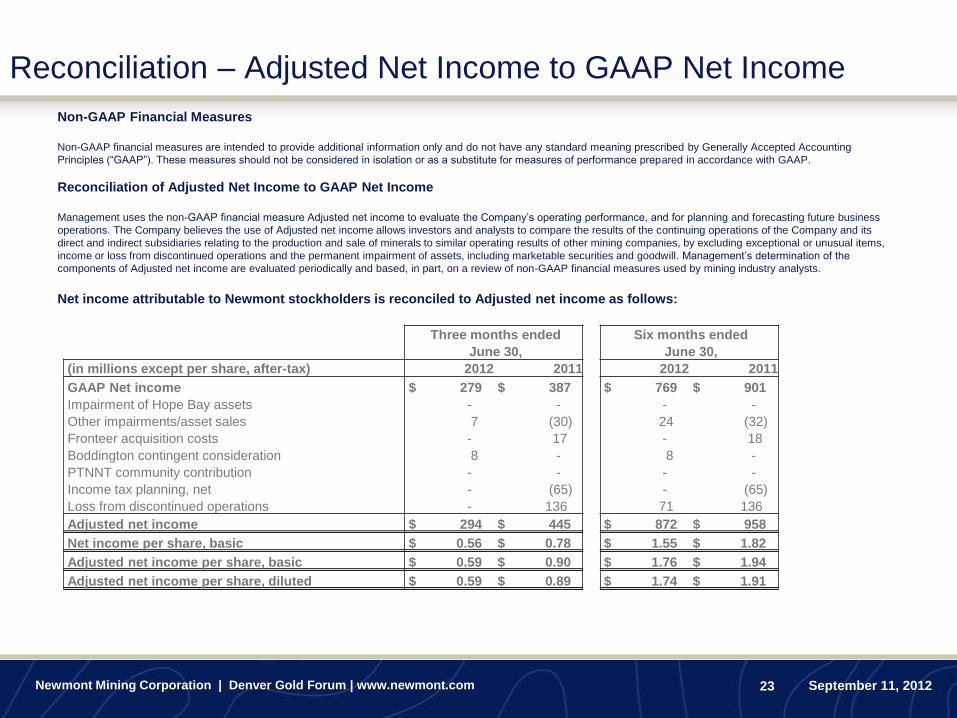
Reconciliation – Adjusted Net Income to GAAP Net Income
Non-GAAP Financial Measures
Non-GAAP financial measures are intended to provide additional information only and do not have any standard meaning prescribed by Generally Accepted Accounting
Principles (“GAAP”). These measures should not be considered in isolation or as a substitute for measures of performance prepared in accordance with GAAP.
Reconciliation of Adjusted Net Income to GAAP Net Income
Management uses the non-GAAP financial measure Adjusted net income to evaluate the Company’s operating performance, and for planning and forecasting future business
operations. The Company believes the use of Adjusted net income allows investors and analysts to compare the results of the continuing operations of the Company and its
direct and indirect subsidiaries relating to the production and sale of minerals to similar operating results of other mining companies, by excluding exceptional or unusual items,
income or loss from discontinued operations and the permanent impairment of assets, including marketable securities and goodwill. Management’s determination of the
components of Adjusted net income are evaluated periodically and based, in part, on a review of non-GAAP financial measures used by mining industry analysts.
Net income attributable to Newmont stockholders is reconciled to Adjusted net income as follows:
Three months ended Six months ended
June 30, June 30,
(in millions except per share, after-tax) 2012 2011 2012 2011
GAAP Net income $ 279 $ 387 $ 769 $ 901
Impairment of Hope Bay assets - - - -
Other impairments/asset sales 7 (30) 24 (32)
Fronteer acquisition costs - 17 - 18
Boddington contingent consideration 8 - 8 -
PTNNT community contribution - - - -
Income tax planning, net - (65) - (65)
Loss from discontinued operations - 136 71 136
Adjusted net income $ 294 $ 445 $ 872 $ 958
Net income per share, basic $ 0.56 $ 0.78 $ 1.55 $ 1.82
Adjusted net income per share, basic $ 0.59 $ 0.90 $ 1.76 $ 1.94
Adjusted net income per share, diluted $ 0.59 $ 0.89 $ 1.74 $ 1.91
Newmont Mining Corporation | Denver Gold Forum | www.newmont.com September 11, 2012 24
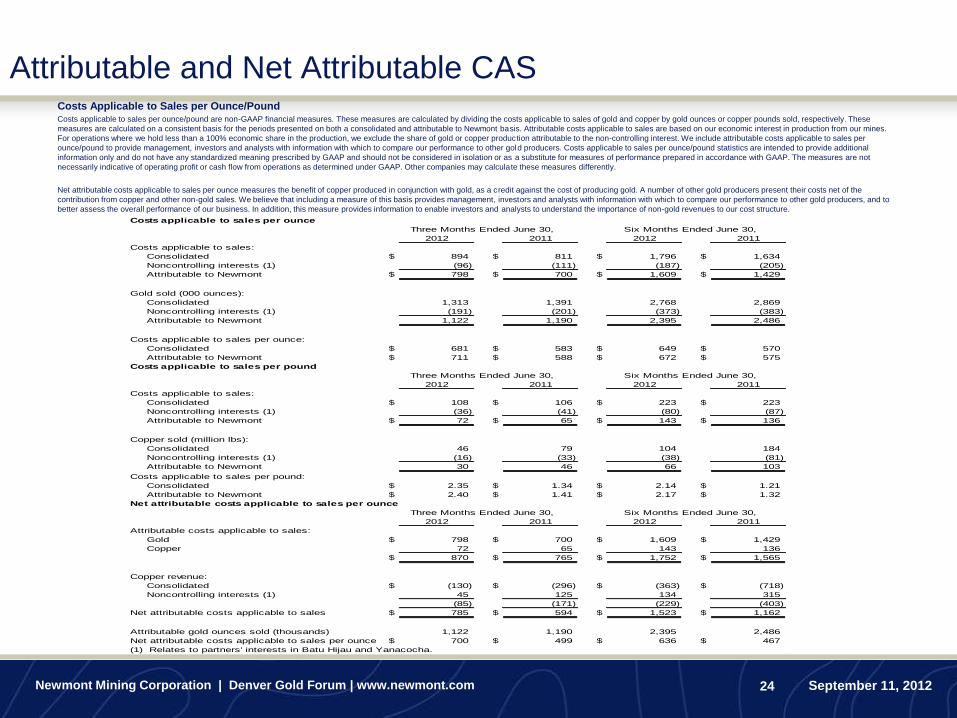
Attributable and Net Attributable CAS Costs Applicable to Sales per Ounce/Pound Costs applicable to sales per ounce/pound are non-GAAP financial measures. These measures are calculated by dividing the costs applicable to sales of gold and copper by gold ounces or copper pounds sold, respectively. These
measures are calculated on a consistent basis for the periods presented on both a consolidated and attributable to Newmont basis. Attributable costs applicable to sales are based on our economic interest in production from our mines.
For operations where we hold less than a 100% economic share in the production, we exclude the share of gold or copper production attributable to the non-controlling interest. We include attributable costs applicable to sales per
ounce/pound to provide management, investors and analysts with information with which to compare our performance to other gold producers. Costs applicable to sales per ounce/pound statistics are intended to provide additional
information only and do not have any standardized meaning prescribed by GAAP and should not be considered in isolation or as a substitute for measures of performance prepared in accordance with GAAP. The measures are not
necessarily indicative of operating profit or cash flow from operations as determined under GAAP. Other companies may calculate these measures differently.
Net attributable costs applicable to sales per ounce measures the benefit of copper produced in conjunction with gold, as a credit against the cost of producing gold. A number of other gold producers present their costs net of the
contribution from copper and other non-gold sales. We believe that including a measure of this basis provides management, investors and analysts with information with which to compare our performance to other gold producers, and to
better assess the overall performance of our business. In addition, this measure provides information to enable investors and analysts to understand the importance of non-gold revenues to our cost structure.
Costs applicable to sales per ounce
2012 2011 2012 2011
Costs applicable to sales:
Consolidated $ 894 $ 811 $ 1,796 $ 1,634
Noncontrolling interests (1) (96) (111) (187) (205)
Attributable to Newmont $ 798 $ 700 $ 1,609 $ 1,429
Gold sold (000 ounces):
Consolidated 1,313 1,391 2,768 2,869
Noncontrolling interests (1) (191) (201) (373) (383)
Attributable to Newmont 1,122 1,190 2,395 2,486
Costs applicable to sales per ounce:
Consolidated $ 681 $ 583 $ 649 $ 570
Attributable to Newmont $ 711 $ 588 $ 672 $ 575
Costs applicable to sales per pound
2012 2011 2012 2011
Costs applicable to sales:
Consolidated $ 108 $ 106 $ 223 $ 223
Noncontrolling interests (1) (36) (41) (80) (87)
Attributable to Newmont $ 72 $ 65 $ 143 $ 136
Copper sold (million lbs):
Consolidated 46 79 104 184
Noncontrolling interests (1) (16) (33) (38) (81)
Attributable to Newmont 30 46 66 103
Costs applicable to sales per pound:
Consolidated $ 2.35 $ 1.34 $ 2.14 $ 1.21
Attributable to Newmont $ 2.40 $ 1.41 $ 2.17 $ 1.32
Net attributable costs applicable to sales per ounce
2012 2011 2012 2011
Attributable costs applicable to sales:
Gold $ 798 $ 700 $ 1,609 $ 1,429
Copper 72 65 143 136
$ 870 $ 765 $ 1,752 $ 1,565
Copper revenue:
Consolidated $ (130) $ (296) $ (363) $ (718)
Noncontrolling interests (1) 45 125 134 315
(85) (171) (229) (403)
Net attributable costs applicable to sales $ 785 $ 594 $ 1,523 $ 1,162
Attributable gold ounces sold (thousands) 1,122 1,190 2,395 2,486
Net attributable costs applicable to sales per ounce $ 700 $ 499 $ 636 $ 467
(1) Relates to partners' interests in Batu Hijau and Yanacocha.
Three Months Ended June 30, Six Months Ended June 30,
Three Months Ended June 30, Six Months Ended June 30,
Three Months Ended June 30, Six Months Ended June 30,
Newmont Mining Corporation | Denver Gold Forum | www.newmont.com September 11, 2012 25
Endnotes
.
Investors are encouraged to read the information contained in this presentation in conjunction with the following notes footnotes, the Cautionary Statement on slide 2 and the factors described under
the “Risk Factors” section of the Company’s most recent Form 10-K, filed with the SEC on February 24, 2012.
1. 2017 potential production metrics are targets and should be considered forward-looking statements. When used in this presentation, the phrase “production potential” represents the sum for all projects of the estimated
average annual production targets for 2017 based upon the Company’s business plan as of 6-30-2012 for each such project anticipated to be commissioned by 2017. Additionally, unless otherwise indicated, references to
potential production used in this presentation mean that portion that is attributable to Newmont's ownership or economic interest. Such estimates are subject to change after such date based upon risks, future events and
modifications to the business plan or the Company’s growth strategy. Unless otherwise indicated, references to potential production indicate the portion attributable to Newmont’s interest.
2. See the cautionary statement on slide 2 of this presentation and footnote 3 below. Estimated mineralization “potential” and “exploration upside” refer to mineralization that are additional to current Reserves and Non-
Reserve Mineralization (“NRM”). Conversion of such mineralization to Reserves or NRM is subject to substantive risks inherent in the mining industry, and no assurance can be given that such inventory will be converted to
Reserves or NRM or of the timing or terms of any such conversion. Even if significant mineralization is discovered and converted to Reserves, it will likely take many years from the initial phases of exploration to
development and to production, during which time the economic feasibility of production may change. As a result, there is greater uncertainty of the conversion of such inventory to production than in the case of Reserves or
NRM. For additional information on Newmont’s Reserves and NRM, see our Year-End Reserve Report (as of 12/31/11) available at www.newmont.com/our-investors/reserves-and-resources. For a description of the key
assumptions, parameters and methods used to estimate mineral reserves and mineralized material, as well as a general discussion of the extent to which the estimates may be affected by any known environmental,
permitting, legal, title, taxation, socio-political, metals prices or other relevant factors, please see Newmont’s Form 10-K.
3. 2012 Outlook projections used in this presentation (“Outlook”) are considered “forward-looking statements” and represent management’s good faith estimates or expectations of future production results as of July 27, 2012
and is based upon certain assumptions. Such assumptions, include gold price of $1,500/ounce, copper price of $3.50/pound, oil price of $90/barrel and Australian dollar exchange rate of 1.00. Consequently, Outlook cannot
be guaranteed. Investors are cautioned that the Company does not undertake to subsequently reaffirm, provide comfort or otherwise update Outlook to reflect events or circumstances after the date hereof or to reflect the
occurrence of unanticipated events. Investors should not assume that any lack of update constitutes a current reaffirmation of Outlook. Note that regional guidance figures provided are attributable production, consolidated
CAS and attributable capital expenditures.
4. In January 2011, Fronteer Gold released an interim resource estimate for Long Canyon, which reported Measured and Indicated resources of approximately 0.071 and 1.324 million gold ounces, respectively, and an
additional Inferred resource of approximately 0.8 million gold ounces. U.S. investors are cautioned that Fronteer Gold provided its public disclosures at the time of acquisition in the terms of "Measured resources", “Indicated
resources” and "Inferred resource.” While these terms are recognized and required by Canadian regulations, these terms are not defined terms under the SEC’s Industry Guide 7. U.S. Investors are cautioned not to assume
that any part or all of mineral deposits in the "Measured resources” and “Indicated resources" categories will ever be converted into Reserves. Additionally, "Inferred resources" have a great amount of uncertainty as to their
existence, and great uncertainty as to their economic and legal feasibility. It cannot be assumed that all or any part of an inferred mineral resource will ever be upgraded to a higher category. Under Canadian rules,
estimates of Inferred resources may not form the basis of a feasibility study or prefeasibility studies, except in rare cases. Accordingly, U.S. Investors are cautioned not to assume that any part or all of an Inferred resource
exists or is economically or legally minable. No ounces are currently in the Company’s Reserves or NRM for Long Canyon.
5. Merian figures shown are representative of Newmont’s 100% ownership interest subject to ongoing negotiations with the Surinamese government.
6. The figures shown in the 2012 bar chart are the median of 2012 Outlook projections. See Note 3 above.
7. Total shareholder return time periods calculated as of 2011 fiscal year-end; Senior Gold includes: KGC, ABX, AEM, GG, ANG, & GFI.
8. Total debt to capitalization as of June 30, 2012.
9. Debt to EBITDA is a twelve-trailing month average as of August 1, 2012 sourced from Bloomberg.
10. Newmont has established a gold price-linked dividend policy that serves as a non-binding guideline for Newmont’s Board of Directors (the “Board”). The Board reserves all powers related to the declaration and payment of
dividends. In addition, the declaration and payment of future dividends remain at the discretion of the Board and will be determined based on Newmont’s financial results, cash and liquidity requirements, future prospects
and other factors deemed relevant by the Board. In determining the dividend to be declared and paid on the common stock of the Company, the Board may revise or terminate such policy at any time without prior notice.
11. NEM dividend yield as of 8/30/2012. Senior gold dividend yield average as of 8/30/2012 & includes: KGC, ABX, AEM, GG, ANG, & GFI. DJIA average as of 8/30/2012. S&P 500 & S&P 500 Sub-Indices as of July 2012;
GLD management fee.
12. Calculated as sum of total dividends paid from 2009 – 2011 divided by the sum of positive operating cash flow as of fiscal year ends 2009-2011.
13. Source Capital IQ; return on invested capital calculated as (EBIT*(1-37.5%))/Average Total Capital. Peer average includes KGC, ABX, AEM, GG, NCM, ANG, GFI, IMG, ELD, & YRI.
14. Source Dundee Wealth.
15. 2012 Outlook projections used in this presentation are considered “forward-looking statements” and represent management’s good faith estimates or expectations of future production results as of July 27, 2012 and are
based upon certain assumptions. Consequently, Outlook cannot be guaranteed. Investors are cautioned that the Company does not undertake to subsequently reaffirm, provide comfort or otherwise update Outlook to
reflect events or circumstances after the date hereof or to reflect the occurrence of unanticipated events. Investors should not assume that any lack of update constitutes a current reaffirmation of Outlook.