demographic/economic summary of the city summary of the city ... los angeles and chicago; ... bureau...
TRANSCRIPT

FISCAL YEAR 2012 BUDGET -------------
DEMOGRAPHIC/ECONOMIC SUMMARY OF THE CITY
The City of Houston was founded on August 30, 1836, by brothers Augustus Chapman Allen and John Kirby Allen, and named after General Sam Houston. According to the United States Census Bureau, Houston has a total area of 601.7 square miles comprising of 579.4 square miles of land and 22.3 square miles of water. Downtown Houston stands about 50 feet above sea level, and the highest point in far northwest Houston is about 125 feet in elevation. Houston is the fourth most populous city in the nation with the estimated population of 2.1 million, just behind New York, Los Angeles and Chicago; and is the largest city in the southern US and Texas.
With 5,946,800 inhabitants in 2010, the 10-county Houston-Sugar Land-Baytown Metropolitan Statistical Area (MSA) is the nation's sixth most populous metro area. Its population exceeds that of Montana, North and South Dakota, Alaska, Delaware, Vermont, Wyoming and the District of Columbia combined. The US Census Bureau estimates of country populations in 2008 show that the Houston MSA has more people than Denmark, Finland, Norway, Singapore, New Zealand or Ireland.
Estimated 2010 Cities Population
New York Los Angeles Chicago Houston Philadelphia
8,175,133 3,792,621 2,695,598 2,099,451 1,526,006
Estimated 2010 Metro Area Population
New York, Northern New Jersey, Long Island 18,897,109
Los Angeles, Long Beach, Santa Ana 12,828,837
Chicago, Naperville, Joliet 9,461,105
Dallas, Fort Worth, Arlington 6,371,773
Philadelphia, Camden, Wilmington 5,965,343
Houston, Sugar Land, Baytown 5,946,800
Washington DC, Arlington, Alexandria 5,582,170
Houston is a multicultural city, in part because of its many academic institutions and strong industries as well as being a major port city. The city has the third-largest Hispanic and third-largest Mexican population in the United States. It also has more Hispanics than any other city in Texas. Houston has some of the largest Indian and Pakistani communities in the United States. The Nigerian community of Houston, estimated to be over 2.0% of the city's population, is the largest in the United States. Over ninety languages are spoken in the city.
According to the 2006-2008 American Community Survey conducted by the US Census Bureau, Houston's population diversity consists of: Whites 53.8%; Blacks (African-Americans) 24.1 %; American Indians 0.4%; Asians 5.3%; and Pacific Islanders 0.1 %. Individuals from some other race made up 15.2% of the Houston population, and individuals from two or more races made up 1.1% of the city's population. Hispanics/Latinos (of any race) made up 41.9% of Houston's population.
From the first census in Texas in 1850 through the 2000 census, the Houston-Sugar Land-Baytown Metropolitan Statistical Area - Harris, the adjoining seven counties, and Austin and San Jacinto counties -has averaged a compound annual growth rate of 3.47%. Between the 1940 and 1980 censuses, the City of Houston pursued a vigorous annexation policy. The 1990 census was the first since 1920 to find that fewer than half the residents of the 10-county region resided within the city limits of Houston. Even in the most recent Census, 41.4% of the region's residents lived in the central city. The fact that such a large share of the region's population live and can vote in the City of Houston has helped it avoid the kinds of malaise that afflict many central cities in large metropolitan areas where a much smaller share of the population have such a vested interest in the health of the central city.
Currently Houston has 103 fire stations with over 3,900 Classified members; 44 police stations of which 16 are open 24 hours/day, wi th over 5,300 Classified members; has 38,992 acres of parkland and green space, and 7 public golf courses.
1- 24
FISCAL YEAR 2012 BUDGET
Here are just a few of Houston's #1 rankings (from Houston.org):
Cities of Opportunity· Cost Competitiveness
PricewaterhouseCoopers - May 3, 2011
2011 Fast City of the Year
Fastcompany.com - May 2011
Wage Grow1h
PayScale, Inc. - April 12, 2011
Most Free Hotel Perks
Priceline.com - March 14, 2011
Best Children's Museums
Parents Magazine - February 7, 2011
Top U.S. Manufacturing Cities
Manufacturers' News - December 29, 2010
America's Top Shopping Cities
Forbes. com - December 13,2010
Top Texas Employer - Dow Chemical, Freeport
Texas Workforce Commission - November 19, 2010
Lowest Estimated Land and Regulation Costs
New Geography - November 1, 2010
Best Cities to Start a New Career
The Daily Beast - October 2010
Best Undergraduate Entrepreneurship Program
University of Houston
The Princeton Review (as reported by Entrepreneur. com)
- September 2010
HEALTH
America's Best Airports
Travel + Leisure - July 2010
largest 5 Year Employment Gain (June 2005 - June
2010)
U.S. Bureau of Labor Statistics (as Reported by the
Houston Business Journal) - July 28, 2010
Top Cities for Recent College Grads
Bloomberg Businessweek - July 16, 2010
Top Local Government Green Power Purchaser
Environmental Protection Agency - July 6, 2010
The Office Building of the Year (TOBY) Award -
Legacy Center Business Park and Greenway Plaza
BOMA International- June 17, 2010
Best Cities for Young Professionals
Forbes. com - June 17, 2010
Highest Level of Entrepreneurial Activity Among
Largest Metro Areas
Kauffman Foundation of Entrepreneurship - May 2010 Top Destination City
U-Haullnternational- April 2, 2010
Largest Population Gain - Harris County
U.S. Census Bureau - March 23,2010
Highest Growth Rate in Texas - Atascocita
Bloomberg Business Week and Gadberry Grou,r January 2010
The Houston region's health care system is first-rate. From specialized to routine care, Houston has options for everyone. The Houston MSA, in January, 2009, had 12,589 physicians and 115 hospitals (106 general and special, and nine psychiatric) with 19,777 beds. Harris County, with 10,296 physicians, had 85 hospitals (77 general and special, and eight psychialric) with 17,049 beds - 6,500 in Texas Medical Center hospitals. Clinics, nursing homes and assisted-living facilities are plentiful. Every medical specially is represented in the Houston region. Harris County Hospital District provides more than 1 million health care visils each year to uninsured, underinsured and medically needy residents of Harris Counly. The hospital district operates Ben Taub General Hospital, Lyndon B. Johnson General Hospital, Quentin Mease Community Hospital, 12 communily health centers, a dental center, a children's center, a dialysis center, eight school-based clinics, 13 homeless sheller clinics and four mobile health units. Houston's hospitals consistently rank among the nation's top institutions.
Houston is also home to Ihe world renowned Texas Medical Center (TMC) on a vibrant, thousand-acre campus south of downtown. TMC is comprised of 48 member institutions, including 13 hospitals and 19 academic institutions. The TMC provided 5.5 million patient visits in 2009 due to the efforts of its 82,200 employees, including over 16,000 physicians, scientists, researchers, and other degreed professionals in the life sciences.
1- 25

FISCAL YEAR 2012 BUDGET
EDUCATION
Houston Independent School District (HISD) is the 7'h largest public school system in the country, with enrollment of 202,773 students. Based on student performance indicators, the state of Texas has rated 57% of HISD schools as either Exemplary or Recognized. The Houston MSA contains 66 school districts and 50 charter schools with enrollment of 1,117,764 students, as well as a number of private and parochial schools. In addition , Houston boasts about 100 business and secretarial schools.
Houston is home to at least 17 colleges and universities, with combined enrollment of over 161,000 in the 2008-2009 academic years. Additionally, over 170,000 students were enrolled in a local community college, and over 16,700 degrees and certificates were awarded in the 2008-2009 academic year.
Colleges Universities Alvin Community College Baylor College of Medicine Blinn College Houston Baptist University Brazosport College Lamar University College of the Mainland Prairie View A&M University Galveston College Rice University Houston Community College System Sam Houston State University Lee College Texas A&M University North Harris Montgomery College District Texas A&M University at Galveston San Jacinto College District Texas A&M University Health Science Center Wharton County Junior College Texas Southern University
University of Houston University of Houston - Clear Lake University of Houston - Downtown University of Phoenix - Houston Campus University of SI. Thomas University of Texas - M.D. Anderson Cancer Center University of Texas Health Science Center University of Texas Medical Branch at Galveston
ECONOMIC DRIVERS
The City of Houston's simple 19th century city seal - the noble locomotive (heralding Houston's spirit of progress) and the humble plow (symbol of the agricultural empire of Texas frorn which Houston would draw her wealth) - clearly speaks to the roots of Houston's economy and to the visionary leadership of its citizens.
The City of Houston, the county seat of Harris County, is the economic center of the Houston - Sugar Land -Baytown Metropolitan Statistical Area (MSA), which ranks as the sixth largest in the United States. The entire MSA includes the counties of Austin , Brazoria, Chambers, Fort Bend, Galveston, Harris, Liberty, Montgomery, San JaCinto, and Waller. The MSA covers more than 10,000 square miles and has an estimated population of 5.9 million residents, creating one of the most dynamic urban centers in the United States.
Houston is the US energy headquarters and a world center for virtual ly every segment of the petroleum industry. More than 3,000 energy-related establishments are located within the Houston MSA, including more than 500 exploration and production firms, more than 150 pipeline transportation establishments and hundreds of manufacturers and wholesalers of energy-sector products. The upstream energy employment has grown an average of 1.33% over the last 3 years while non-agricultural wage and salary employment has declined an average of -0.4%. Oil and natural gas prices dropped from 2008 to 2009, but prices increased in 2010. According to the New York Mercantile Exchange, the price of oil increased from $85 per barrel on April 1, 2010 to $108 on April 14, 2011 .
1- 26

FISCAL YEAR 2012 BUDGET
While energy remains an important part of the local economy, Houston's economic base is significantly diverse. The Port of Houston is a 25-mile-long complex of diversified public and private facilities located just a few hours' sailing time from the Gulf of Mexico. The port is ranked first in the United States in foreign waterborne tonnage (14 consecutive years); first in US imports (19 consecutive years) ; second in US export tonnage and second in the US in total tonnage (19 consecutive years). The Port of Houston is made up of the Port of Houston Authority and the 150-plus private industrial companies along the Houston Ship Channel. All together, the port authority and its neighbors along the ship channel are a large and vibrant component of the regional economy. More than 220 million tons of cargo moved through the Port of Houston in 2009. More than 7,700 vessel calls were recorded at the Port of Houston during the year 2009. The Port of Houston has an impressive listing of firsts , from unloading the world's first container ship to becoming the country's first port to receive International Organization for Standardization (ISO) 14001 compliance.
The Houston Ship Channel has been a catalyst for growth in Harris County since the first journey of a steamship up Buffalo Bayou in 1837. The ship channel plays a critical role in today's community as well ; it generates jobs and opportunities that allow businesses to fiourish. A 2007 study by Martin Associates says ship channel-related businesses contribute to more than 785,000 jobs throughout Texas while generating nearly $118 billion of statewide economic impact. Additionally, more than $3.7 billion in state and local tax revenues are generated by business activities related to the port. It is projected that the Port of Houston will continue to be an important factor as north-south trade expands.
The Bayport Container and Cruise Terminal , located in the city of Pasadena, Texas, is built to meet marketplace demand. The $1.4 billion Bayport complex is designed to be the premier container terminal on the United States Gulf Coast. It is a state-of-the-art industry cornerstone of a city which has gained worldwide recognition as a center for vital industrial commerce. When fully developed, the terminal will have a total of seven container berths with the capacity to handle 2.3 million twenty-foot equivalent units (TEUs) on a complex which includes 376 acres of container yard and a 123-acre intermodal facility. The cruise terminal complex will have three berths to accommodate as many as 1.7 million passengers with parking capacity for 3,000 cars. The cruise terminal will also have more than 40 acres of onsite co-development available .
The Houston Airport System (HAS) is one of North America's largest public airport systems and position Houston as the international and cargo gateway to the south central United States and a primary gateway to Latin America. HAS provides a safe and dynamic air services network that fosters economic vitality for the transportation industry and the greater Houston region. HAS has a mission of helping to ensure that its employment, services, and facilities are accessible to the public, customers , and travelers. To bring air service to Houston, HAS has three facilities: George Bush Intercontinental Airport, William P. Hobby Airport, and Ellington Airport. The three airport system served more than 49.5 million passengers in 2010, including more than 8.5 million international travelers.
The Lyndon B. Johnson Space Center (JSC) is the National Aeronautics and Space Administration's center for human spacefiight training, research and fiight control. The center consists of a complex of 100 buildings constructed on 1,620 acres in Houston. It is often popularly referred to by its central function , "Mission Control" . The center, originally known as the Manned Spacecraft Center, was constructed on land donated by Rice University and opened in 1963. On February 19, 1973, the center was renamed in honor of the late US president and Texas native, Lyndon B. Johnson. JSC is one of ten major NASA field centers.
ARTS AND ENTERTAINMENT
Houston is home to the Houston Livestock Show and Rodeo, which is the largest rodeo in the world , attracts more than 1.8 million visitors each year. With the nation 's fifth largest ballet and opera companies , Houston is also one of only five cities in the United States with permanent professional resident companies in all of the major performing arts disciplines of opera, ballet, music and theater. Home to nine world-class performing arts organizations, Houston Theater District is second only to New York in the number of theater seats in a concentrated area. The Houston Grand Opera is the only opera company in the US to win a Grammy, a Tony and an Emmy while the Alley Theatre is the only regional theatre in Texas to win a Tony award. Other performing arts companies such as Broadway in Houston, Da Camera of Houston, Houston Symphony, Society for the Performing Arts, Theatre Under the Stars (TUTS), and Uniquely Houston also serve to enrich the lives of Houston area residents .
1- 27

FISCAL YEAR 2012 BUDGET
Houston has a unique museum district offering a range of museums, galleries, art and cultural institutions, including the City's major museums. The Houston Museum District is one of the most visited and one of the top cultural districts in the country. With its eighteen members within a 1.5 mile radius, the district offers a wide array of exhibits featuring themes of art, history, culture, nature and science. In 2008, the museum district added the Buffalo Soldiers National Museum, a museum dedicated to the purpose of preserving , promoting, and perpetuating the history, tradition , and outstanding contributions of the Buffalo Soldiers toward the development and defense of the United States of America . With fourteen galleries of hands-on activities, The Children's Museum of Houston is ranked by Citysearch.com as the #1 children's museum in the country. Houston has more than 500 cultural , visual and performing arts organizations, 90 of which are devoted to multicultural and minority arts and is one of five US cities that offer year-round resident companies in all major performing arts.
Members of Houston Museum Districts:
Buffalo Soldiers National Museum Children's Museum of Houston Czech Center Museum Houston Houston Center for Contemporary Craft Houston Museum of Natural Science The John C. Freeman Weather Museum The Jung Center of Houston The Menil Collection Rice University Art Gallery
Byzantine Fresco Chapel Museum Contemporary Arts Museum Houston Holocaust Museum Houston Houston Center for Photography Houston Zoo, Inc. The Health Museum Lawndale Art Center Museum of Fine Arts, Houston The Rothko Chapel
Houston has professional teams representing football , baseball , basketball , soccer, and hockey. Houston, home to a team from nearly every major professional sport and state of the art football , basketball and baseball stadiums, is a sports lover's paradise. The city boasts an array of championship teams such as the Houston Dynamo, Houston Rockets and Houston Astros. Houston entered into an agreement to partner with Major League Soccer's Houston Dynamo, Texas Southern University, and Harris County, to construct a permanent, 21 ,000 seat soccer facility. Houston has established itself as a destination for hosting major sporting events such as Super Bowl XXXVIII , Major League Baseball and National Basketball Association All-Star Games, 2005 World Series , 2005 Big 12 Conference Football Championship, USA Gymnastics 2008 Men's Visa Championships, 2010 NCAA Men's Basketball South Region Tournament, 2010 Major League Soccer All-Star Game, 2011 NCAA Men's Final Four, as well as the annual Shell Houston Open. Additionally, Houston will host the 2011 Senior Games, 2012 Amateur Athletic Union Junior Olympic games, and the 2016 NCAA Men's Final Four.
Houston Area Sports Teams:
Professional Teams Collegiate Teams/Mascots Aeros Intemational Hockey League Houston Baptist University - Huskies Astros Major League Baseball - National League Rice University - Owls Dynamo Major League Soccer Texas Southern University - Tigers Energy Women's Independent Football League University of Houston - Cougars Rockets National Basketball Association San Jacinto College - Gators Texans National Football League - Arnerican Conference
1-28

FISCAL YEAR 2012 BUDGET -------------
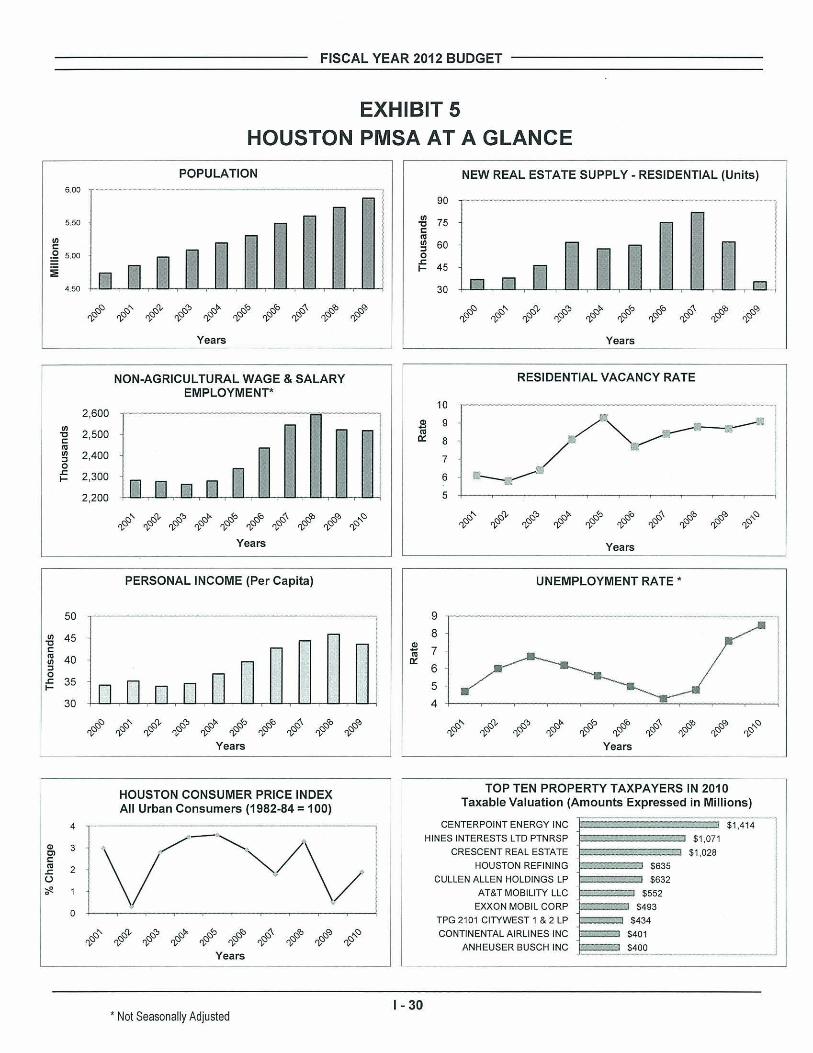
EXHIBIT 4 HOUSTON PMSA AT A GLANCE
2000 2001 2002 2003 2004 2005 2006 2007 2008 2009
POPULATION
4,739,000 4 ,851 ,000 4 ,979,000 5,084,000 5,190,000 5,300,000 5,485,000 5,598,000 5,727,000 5,867,000
NON-AGRICULTURAL WAGE & SALARY EMPLOYMENT (')
2001 2,282,400 2002 2,277,400 2003 2,262,900 2004 2,278,700 2005 2,337,200 2006 2,434,300 2007 2,543,700 2008 2,592,800 2009 2,520,600 2010 2,516,900
PERSONAL INCOME (Per Capita)
2000 2001 2002 2003 2004 2005 2006 2007 2008 2009
34,185 35,166 33,933 34,565 36,755 39,561 42 ,701 44 ,333 45 ,835 43 ,568
HOUSTON CONSUMER PRICE INDEX All Urban Consumers (1982-84 = 100)
2001 2002 2003 2004 2005 2006 2007 2008 2009 2010
Average Index 158.8 159.2 163.7 169.5 175.6 180.7 184.1 190.0 190.7 194.3
% Change
3.0 % 0.3 2.8 3.5 3.6 2.9 1.8 3.3 0.5 1.9
PMSA: Primary Metropolitan Statistical Area • Not Seasonally Adjusted
NEW REAL ESTATE SUPPLY - RESIDENTIAL (Units)
2000 2001 2002 2003 2004 2005 2006 2007 2008 2009
36,656 37,752 46,093 61 ,767 57 ,336 59,844 75,134 81 ,861 62 ,114 35,311
RESIDENTIAL VACANCY RATE
2001 6.1 % 2002 5.8 2003 6.4 2004 8.1 2005 9.3 2006 7.7 2007 8.4 2008 8.8 2009 8.7 2010 9.1
UNEMPLOYMENT RATE (' )
2001 2002 2003 2004 2005 2006 2007 2008 2009 2010
4.7 % 6.0 6.7 6.2 5.6 5.0 4 .3 4.8 7.6 8.5
TOP TEN PROPERTY TAXPAYERS IN 2010
(Amounts Expressed in Millions)
CenterPoint Energy Inc Hines Interests Ltd Crescent Real Estate Houston Refining Cullen Allen AT&T Mobility LLC Exxon Mobil Corp TPG 2101 CityWest 1 & 2 Continental Airlines Anheuser Busch Inc
Taxable Value
$1 ,414 1,071 1,028
635 632 552 493 434 401 400
Source: University of Houston, Center for Public Policy (as of March 2011 ).
1-29
FISCAL YEAR 2012 BUDGET
EXHIBIT 5 HOUSTON PMSA AT A GLANCE
POPULATION NEW REAL ESTATE SUPPLY - RESIDENTIAL (Units) 6.00
r 90
5.50 r r 00
~
"0 75 ~
00 r ~ r g 5.00
n n n ::E 4.50
~
r 00 60 ~ ~
0 .<:
45
n n n >-
30 n
~<> ~, ~'). ~., ,,<l" ~" r§''' '" ,,'" ~'" ')." ')." ')." ')." '" ')." '" ')." ')." ')." ~<> ~, ~'). ~~ ,,<l" ~" ~" '" ~'" ~'" cO' ')." ')." ')." '" ')." ')." cO' cO' ')."
Years Years
NON-AGRICULTURAL WAGE & SALARY RESIDENTIAL VACANCY RATE EMPLOYMENT'
10 2,600
/ ______ ~2
00 ~ 9 "0 2,500 ~ '" 8 ~ 00 2,400 7 ~ 0
n n n n n .<: 2,300 6 IIJ >-
2,200 5
~' ~'). ~~ ').<><l" ~" ~" '" ~'" ~'" ,<> ~, ,,'). ~~ ,,<l" ,," ,," ~~ ~'" ~'" ,<> i' i' i' ')." i' ')." i' i' i' i' ')." ')." '" ')." ')." i' i' i' ').<>
Years Years
PERSONAL INCOME (Per Capita) UNEMPLOYMENT RATE '
50 9
00 45 8 "0
~ ~ 7 ~ 00 40 '" ~ 6 0 .<: 35 5 >-
30 4
~<> ~' ~'). ~~ ~. ~" ,," '" ~'" ~'" ~, ,,'). ,,~
"" ~" r§''' '" ~'" ~'" ,<> i' ')." i' ')." i' i' ')." i' i' cO' i' ')." ')." ')." ')." '" ')." ')." ')." ').<>
Years Years
HOUSTON CONSUMER PRICE INDEX TOP TEN PROPERTY TAXPAYERS IN 2010
All Urban Consumers (1982-84 = 100) Taxable Valuation (Amounts Expressed in Millions)
4 --- CENTERPOINT ENERGY INC $1,414
I V .,,~ HINES INTERESTS LTD PTNRSP $1,071
~ 3 CRESCENT REAL ESTATE $1 ,028 Cl ~ ~ 2 HOUSTON REFININ G $635
.<:
. / U CULLEN ALLEN HOLDINGS LP $632 ., 1 AT&T MOB ILITY l lC $552
EXXON MOBIL CORP $493 _J 0 TPG 2101 CITYWEST 1 & 2 LP $434
~, ~'). ~~ ').<><l" ~" ~" ~~ ~'" ~'" ,<> CONTINENTAL AIRLINES INC $401 ')." i' ')." ')." cO' ')." ')." i' ').<>
ANHEUSER BUSCH INC $400 Years
1- 30 , Not Seasonally Adjusted

FISCAL YEAR 2012 BUDGET
ECONOMIC OUTLOOK
ECONOMIC INDICATORS
The fol lowing table shows actual and projected economic indicators for Ihe Houston MSA (Melropolilan Slatislical Area):
ECONOMIC INDICATORS SHORT-RANGE FORECAST (Revised March 2011)
HOUSTON PMSA
2009 2010 2011 2012 2013 2014 2015
Population 5,124,578 5,172,075 5,242,075 5,333,221 5,389,693 5,493,728 5,653,086 1.45% 0.93% 1.35% 1.74% 1.06% 1.93% 2.90%
Retail Sales (millions) $ 87,007 $ 88,885 $ 91,803 $ 96,794 $ 100,476 $ 105,896 $ 113,311 -2.70% 2.16% 3.28% 5.44% 3.80% 5.39% 7.00%
Total Employment 2,341,805 2,319,426 2,347,405 2,388,789 2,415,415 2,462,117 2,525,750 -2.61% -0 .96% 1.21% 1.76% 1.11% 1.93% 2.58%
Construction 165,208 148,837 144,871 142,502 142,587 144,490 149,164 -11.06% -9 .91% -2.66% -1 .64% 0.06% 1.65% 2.91%
Trade 511,338 504,734 513,282 523,104 526,068 533,869 544,836 -2.18% -1.29% 1.69% 1.91% 0.57% 1.48% 205%
Services 769,286 773,471 791,981 816,053 833,298 857,145 887,770 -1.23% 0.54% 2.39% 3.04% 2.11% 2.86% 3.57%
Government 322,797 326,929 323,986 324,861 328,240 333,754 340,996 1.80% 1.28% -0.90% 0.27% 1.04% 1.68% 2.71%
Source: University of Houston Institute for Regional Forecasting - March 2011
All Numbers represent the old Houston Primary Metropolitan Statistical Area: Chambers, Fort Bend, Harris, Liberty,
Montgomery, and Waller counties.
The Inslitute for Regional Forecasting projects thai Ihe 2011 PMSA population wi ll grow by 7.8% while tolal employmenl is projecled 10 increase by 7.6% over the next 4 years.
The annual average of local unemployment rate (not seasonally adjusted) is 8.5%, 90 basis poinls higher Ihan 2009 and 110 basis poinls lower Ihan Ihe nalional unemploymenl rale.
1-31

FISCAL YEAR 2012 BUDGET
UNEMPLOYMENT RATE Houston vs. US - Seasonally Adjusted
10% .... 9% r 8% I /
~ I r a: <i 7%
--- I I ~ c ----.... c « 6% .;, /" ~~ / / > « 5% r -- ........
/' -------..... 4%
2001 2002 2003 2004 2005 2006 2007 2008 2009 2010
Years
I -+-U.S. --- Houston I
Nationally, the growth of non-agricultural wage and salary positions has averaged a decline of -0.74% over 2009; whereas locally these same positions have declined an average of -0.2%.
5%
4%
3%
2% ~ 1% a: <: 0% ~ e -1% (!)
-2%
-3%
-4%
-5%
2001 2002
TOTAL NON·AGRICUL TURAL WAGE & SALARY EMPLOYMENT GROWTH
Houston vs. US - Seasonally Adjusted
., .• -r
2003 2004 2005 2006 2007 2008
Years
• U.S. Houston
1-32
-.-2009 2010
FISCAL YEAR 2012 BUDGET
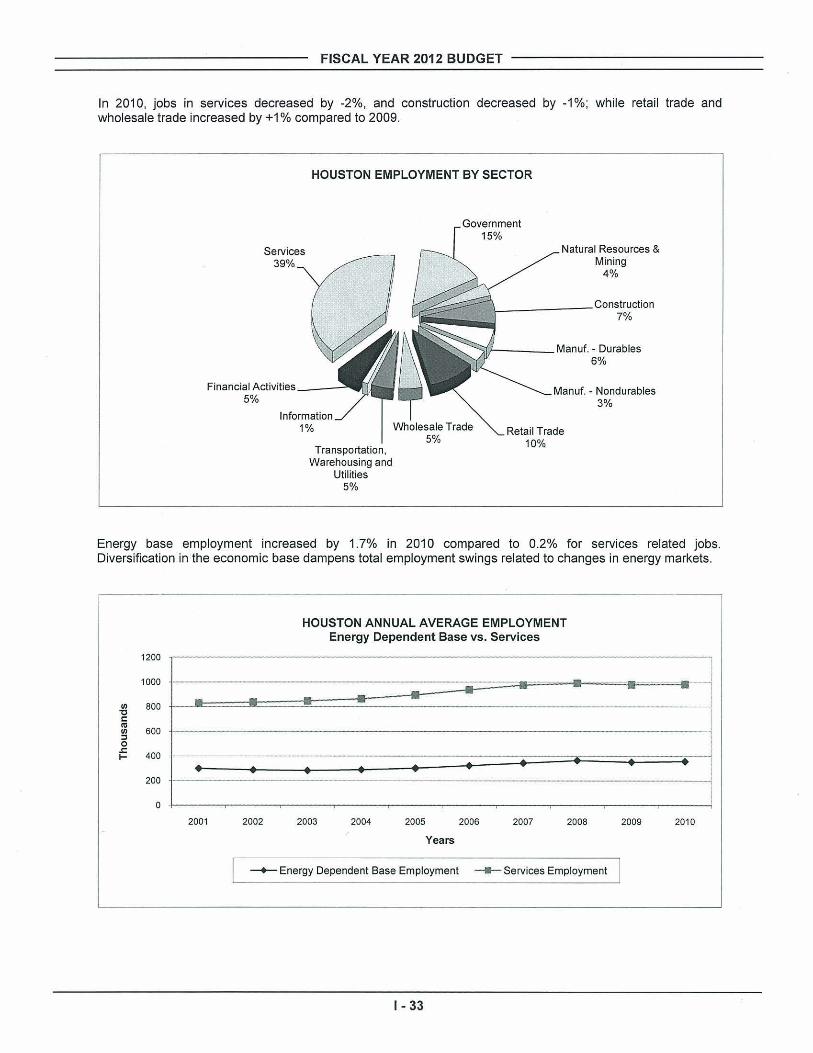
In 2010, jobs in services decreased by -2%, and construction decreased by -1%; while retail trade and wholesale trade increased by +1 % compared to 2009.
HOUSTON EMPLOYMENT BY SECTOR
Services 39%
15% Natural Resources &
Mining 4%
7%
---:ill-- - _ _ 'Manur. - Durables
Financia l Acl:ivities __ --' 5%
Information 1% Wholesale Trade
Transportation, W arehousing and
Utilities 5%
5%
6%
Manuf. - Nondurables 3%
'- " c""" Trade 10%
Energy base employment increased by 1.7% in 2010 compared to 0.2% for services related jobs. Diversification in the economic base dampens total employment swings related to changes in energy markets.
1200
1000
on "0
800 C
'" on ~
600 0 .r:
400 l-
• 200
0
2001
•
2002
HOUSTON ANNUAL AVERAGE EMPLOYMENT Energy Dependent Base vs. Services
• • • • •
2003 2004 2005 2006 2007
Years
•
2008
-+- Energy Dependent Base Employment ___ Services Employment
1-33
•
2009
•
I I
I
2010

FISCAL YEAR 2012 BUDGET
INCOME
Per capita income is widely used to compare the standards of living in different regions. In Houston, personal income fell from $45,835 in 2008 to $43,568 in 2009; a 4.9% decrease over the previous year. Since 2009, per capita income has increased an average of 3.5%.
PRICES
Houston prices, as measured by the Houston Consumer Price Index (CPI), rose 1.4% in 2010 compared to the national increase of 1.97%. Average CPI for the local area in 2010 was 194.3 versus 218.1 for the United States, meaning there is a lower cost of living for Houston residents than is the case nationally.
CONSUMER PRICE INDEX All Urban Consumers, 1982 - 1984 = 100
Houston vs. US
4.0% ,---------------------------:-----------,
3. 0%
~ "iii 2.0% ~ c c ~ 1.0% Cl ~ ~
~ 0.0%
·1.0%
2001 2002 2003 2004 2005 2006 2007 2008 2009 2010
Years
I -+-U.S. ___ Houston
1-34

FISCAL YEAR 2012 BUDGET
HOUSING COSTS
Houston's housing consists of the following counties: Harris County, Fort Bend County, Montgomery County, Brazoria County, Galveston County, Liberty County, Waller County , Chambers County, Austin County, and San Jacinto County. The sixth largest metropolitan region in the country is also one of the best bargains when it comes to housing costs. Houston's housing costs are more than 22% lower than the national average and 39% lower than the average of the 27 metro areas with more than 2 million residents. Low housing costs and a low cost of living are the main reasons Houston's overall living costs are 11 % below the nationwide average for places of all sizes and 20% below the large-metro average.
The National Association of Realtors reports that Houston's fourth quarter 2010 median sales price of $154,100 is $15,700 lower than the national median sales price of existing single-family homes.
Most MSAs in Texas fa ll below the national median sales price with Houston at 1.9% and Dallas at 6.4% below the national average. Compared to February 2010, Houston experienced a grow1h in median sales price of +4.07%, and SI. Louis experienced the highest grow1h in median sales price (+8.18%). The median sales prices in major cities had declined enormously over the past year with the largest decline in Miami (-18.60%), followed by Atlanta (-13.62%), and Minneapolis (-10.38%).
Honolulu, HI has the highest median sales price of single-family homes in 2010 at $607,600 (+1 .9% from 2009) while Youngstown-Warren-Boardman, OH-PA has the lowest at $67,200 (+1.1 % from 2009) .
MEDIAN SALES PRICE OF EXISTING SINGLE-FAMILY HOMES FOR SELECTED MSAs As of1 st Qtr 2011 • not seasonally adjusted
(Thousands)
New York-Northern New Jersey-Long Island, NY-NJ-PA $376 Was hington-Arlington-Alexandria, DC-VA-MO-VW 1 $295 ,
Los Angeles-long Beach-Santa Ana, CA 1 $293 ! Philadelphia-Camden-Wilmington, PA-NJ-OE-MD
'1 1$1~~99 A ustin-Round Rock, TX J Chicago-Naperville-Joliet, IL { $155
Miami-Fort Lauderdale-M iami Beach , FL $154 Salem, OR $154
Bloomington-Normal , IL $149 Columbia, MO . i $149
San Antonio, TX $149 Houston-Bay town-Sugar Land, TX $149 New Orleans-Metairie-Kenner, LA $1 48
Sioux Falls, SO $147 Sarasota-BradentonNenice, FL $147
Gainesville, FL $146 Dallas-Fort Worth-Arlington, TX
J
1$143 Corpus Christi, TX $134
EIPaso, TX $132 Beaumont-Port Arthur, TX $125
Amarillo , TX ,
$121 Abilene, TX $11 q
U.S. $159'
$0 $50 $100 $150 $200 $250 $300 $350 $400
Sales Price ($000)
I· 35

FISCAL YEAR 2012 BUDGET
COST OF LIVING
In Houston, the dollar has a much higher buying power than virtually any other major metropolitan area in the country. The Third Quarter 2010 ACCRA Cost of Living Index shows that Houston's overall after-taxes living costs are 9% below the nationwide average, largely due to housing costs that are 21 % below the average. In the context of the 27 participating metropolitan areas with more than 2 million residents, Houston's cost-ofliving advantage is even more pronounced. Houston's housing costs are 38% below the average for the large metro areas, and its overall costs are 19% below the average for this group.
COST OF LIVING COMPARISONS
Third Quarter 2010 (Average for 314 Urban Areas = 100)
Mise Trans- Health
Metropolitan Statistical Area Composite Groceries Housing Utilities Goods & portation Care
. Services
New York-Newark-Edison NY-NJ-PA 154.4 124.0 231.2 149.2 106.7 114.1 121.8
Los Angeles-Long Beach-Santa Ana 141 .3 107.3 220.8 106.1 116.8 110.9 107.2
CA
Washington-Arlington-Alexandria DC- 135.1 109.3 205.1 110.8 105.8 103.9 104.6
VA-MD-WV
Boston-Cambridge-Quincy MA-NH 132.4 113.3 156.1 140.2 103.6 122.2 128.4
Minneapolis-51. Paul-Bloomington MN- 111 .9 110.8 118.0 108.2 101 .9 106.5 112.5
WI
Miami-Fort Lauderdale-Miami Beach 110.5 115.1 122.2 94.2 106.8 104.9 105.4
FL
Chicago-Naperville-Joliet IL-IN-WI 107.4 104.9 118.4 102.0 107.7 108.2 99.8
Denver-Aurora CO 103.9 104.1 111.3 98.5 95.6 108.1 101.4
Atlanta-Sandy Springs-Marietta GA 94.7 96.4 88.1 88.5 99.2 107.9 98.4
Houston-Sugar Land-Baytown TX 91.0 87.6 79.0 96.2 95.2 97.2 99.3
Source: Council for Community and Economic Research, ACCRA Cost of Living Index, Th ird Quarter 201 a (published October 2010)
Note: Data are un-weighted averages for all reporting places in each metropolitan area.
1-36

FISCAL YEAR 2012 BUDGET
Sources:
• DATABook Houston - University of Houston Institute for Regional Forecasting • Houston Facts - The Greater Houston Partnership • City of Houston, Aviation Department • City of Houston, Convention and Entertainment Facilities Department • City of Houston, Mayor's Office • The Port of Houston Authority • Houston Economics - University of Houston Center for Public Policy • Facts and Figures about the Texas Medical Center - Texas Medical Center • The Official Guide to Houston - Greater Houston Convention and Visitors Bureau • Downtown Houston Association • Harris County - Houston Sports Authority • Houston Downtown Management District • National Association of Realtors Quarterly Report • US Bureau of Labor Statistics • US Census Bureau • Houston Independent School District • Federal Reserve Bank of Dallas - Houston Branch • U.S. Government Energy Information Administration • Wikipedia, The Free Encyclopedia • Houston Business Journal • Fly-2-Houston - The Houston Airport System
1- 37