delivering on action plans for suistainable air conditioning
TRANSCRIPT

The Future of Cooling in ChinaDelivering on action plans forsuistainable air conditioning
J u n e2 0 1 9

The Future of Cooling in China Abstract Delivering on action plans for sustainable air conditioning
PAGE | 1
IEA
. All
right
s re
serv
ed.
Abstract
The People’s Republic of China had the fastest growth in space cooling energy consumption worldwide in the last two decades, driven by increasing income and growing demand for thermal comfort. This report explores the principal trends and challenges related to this rapid growth, looking into existing market developments, policies, technology choices and occupant behaviour in buildings in China. It then looks at how cooling demand in buildings might evolve over the next decade to 2030 and considers what China can do to ensure greater cooling comfort without parallel growth in energy consumption and related emissions. The report recommends raising energy performance standards for cooling equipment, tapping into building design opportunities, and ensuring that “part time” and “part space” behaviour remains the principal cooling mode in buildings. These strategies, among others, will reduce the impact of rising cooling demand on China’s electricity system, unlocking benefits in terms of reduced power capacity investments, lower energy and maintenance costs, improved air quality, and greater access to cooling comfort.

The Future of Cooling in China Executive summary Delivering on action plans for sustainable air conditioning
PAGE | 2
IEA
. All
right
s re
serv
ed.
Executive summary
Energy demand for space cooling in buildings in the People’s Republic of China (“China”) is rising rapidly, placing strains on the electricity system and contributing to local air pollution and carbon dioxide (CO2) emissions. China saw the fastest growth worldwide in energy demand for space cooling in buildings over the last two decades, increasing at 13% per year since 2000 and reaching nearly 400 terawatt-hours (TWh) of electricity consumption in 2017. As a result, space cooling accounted for more than 10% of total electricity growth in China since 2010 and around 16% of peak electricity load in 2017. That share can reach as much as 50% of peak electricity demand on extremely hot days, as seen in recent summers. Cooling-related CO2 emissions from electricity consumption consequently increased fivefold between 2000 and 2017, given the strong reliance on coal-fired power generation in China.
China leads the global market for air conditioners (ACs), and bigger units are increasingly popular. China presently produces around 70% of the world’s room air conditioners and covers about 22% of installed cooling capacity worldwide. AC sales grew fivefold since 2000, representing nearly 40% of global sales in 2017. Mini-split ACs are still common, as is “part time” and “part space” cooling behaviour in which households cool rooms only when they are occupied and for a few hours. Yet larger multi-split and central cooling systems are growing in numbers, due to architectural choices and changing consumer preferences. As a result, the average size of new units sold in 2017 was around 7 kilowatts of cooling capacity (kWc), compared with previous models that were between 3 kWc and 5 kWc. Those larger and centralised cooling systems can be significantly more energy intensive.
Rated performance often does not reflect operational energy consumption. Two principal factors affect the energy efficiency ratio (EER) of cooling equipment: operation at low partial loads and the efficiency of the distribution system. Real-time data show that the operational EER can be 13-19% lower than the rated energy performance, mostly due to units operating at low partial loads. For larger centralised systems, there is typically a big gap between equipment and cooling system energy use (e.g. when energy for pumps is included), leading to overall system efficiencies that can be as much as half the rated cooling equipment performance.
The AC market is changing and is not keeping up with its energy efficiency potential. Among the preferred mini-split ACs, higher-efficiency variable-speed inverter technologies have been increasingly popular since the late 2000s. Yet the average performance of those units in new sales is still as much as 60% less than best available products and more than 20% lower than typically available options. This gap is similar for other equipment types such as multi-split ACs and reflects a widening spread between minimum energy performance standards (MEPS) and available efficiency in the market.
Greater affordability, climate and changing occupant behaviour will increase cooling energy use. China experienced exceptionally fast growth in cooling demand since 2000, but around 40% of households still do not own an AC. As income levels continue to grow, AC ownership could reach as much as 85% by 2030. Growing expectations for thermal comfort and an increasing number of hot days equally will increase how often those ACs are used. The areas with the largest increase in cooling degree days by 2030 are also typically those with higher population densities,

The Future of Cooling in China Executive summary
Delivering on action plans for sustainable air conditioning
PAGE | 3
IEA
. All
rig
hts
res
erve
d.
meaning the felt temperature and consequent cooling demand during summer months and
extreme heat events could be even higher. This will undoubtedly lead to increased energy use for
space cooling, both in terms of AC ownership and operational hours.
Without strong policies, space cooling electricity use could swell to 750 TWh or more by 2030.
This is due to both growing cooling demand and expected weak improvement in the energy
efficiency of ACs sold, which are only 10-20% more efficient by 2030 in the Baseline Scenario than
units sold in 2017. Greater shifts toward “full time” and “full space” cooling behaviour in buildings
would increase electricity demand by 2030 even further, to as much as 900 TWh or more.
Energy-efficient air conditioning with improved building design and system management can
keep cooling electricity use stable, while also providing economic, health and environmental
benefits. Improved MEPS in the Efficient Cooling Scenario lead to an average efficiency of ACs in
2030 that is 50% higher than in 2017. This cuts cooling energy demand by more than 200 TWh in
2030 compared with the Baseline Scenario. An additional 100 TWh can be saved using improved
building envelope measures such as low-emissivity windows and cool roofs and through smart
cooling devices that ensure energy is used when and where cooling services are needed. Electricity
capacity needs in the Efficient Cooling Scenario are consequently more than 50 gigawatts lower
than in the Baseline Scenario. This translates to more than 10% reduction in costs to meet space
cooling demand, 1 260 megatonnes in cumulative CO2 emissions savings and 30% reduction in
major local air pollutant emissions.
Effective policy intervention is necessary to drive energy-efficient cooling in buildings. China
can deliver significant energy and cost savings through implementation of a comprehensive
national policy framework including regulation, information programmes and industry incentives.
Improving the stringency of current MEPS across all product types is key to drive the penetration
of high-performance cooling devices. Standards can also introduce testing conditions that reflect
actual operating conditions, particularly at low partial loads, while the government can support
industry to identify innovative solutions that deliver even higher AC performance in the future.
Training and awareness raising can also ensure proper installation, operation and maintenance of
cooling equipment and systems, avoiding unnecessary energy consumption. Improved data
collection, research and co-operation with manufacturers can equally help to identify emerging
trends, technology needs and energy efficiency opportunities that enable sustainable cooling.

The Future of Cooling in China Findings and recommendations Delivering on action plans for sustainable air conditioning
PAGE | 4
IEA
. All
right
s re
serv
ed.
Findings and recommendations
China’s government can implement measures to enable and encourage energy-efficient cooling solutions and behaviour. Such measures should aim to bring about a lasting reduction in energy demand for cooling services in buildings while equally enabling greater thermal comfort. China’s track record with energy efficiency standards and building energy codes shows that such policy action works: multiple increases in equipment MEPS and building codes have delivered large and cost-effective energy savings in the past two decades. Strengthening and broadening the use of those measures can improve overall cooling comfort in China without increasing energy use.
Raise energy performance standards. Data suggest that it is already possible to buy higher-efficiency ACs at competitive costs, but product MEPS need to reflect this, forcing the market towards more efficient technology. China can strengthen existing performance standards to drive AC efficiency towards best available technology. This includes benchmarking across product categories to affect energy efficiency gains that are not reflected in current MEPS.
Encourage “part time” and “part space” cooling behaviour. China can encourage greater use of cooling operations that are adapted to occupant behaviour and cooling needs. This includes policies that urge or even require the use of occupancy sensors and “smart” ACs that use learning algorithms to predict cooling demand and avoid energy use when unnecessary.
Pay attention to real-time system operating efficiency. Overall operating efficiency of cooling equipment and systems is often low, due to a number of factors including system design and installation, operations, maintenance and pumping needs. China’s government can work with manufacturers and other industry stakeholders to raise awareness about proper AC system sizing, design, installation and maintenance. Education and training programmes can also ensure that building operators and AC technicians are familiar with measures that ensure the energy performance of equipment over its lifetime.
Urge passive design and natural ventilation where possible. China’s strong experience with policies that address heating demand in buildings can be expanded to address growing cooling demand. This includes building upon component-based performance requirements (e.g. the insulative value of windows) and building energy performance standards to include cooling energy needs. Policy can equally promote integrated energy solutions such as solar panels on building roofs and facades paired with building-integrated storage (e.g. ice storage or chilled water) to provide cleaner and more flexible solutions to meet cooling needs.
Promote suitable indoor comfort levels. Raising temperature set points can save considerable amounts of energy for cooling services. China’s government can still work with AC manufacturers, building operators and other stakeholders to promote suitable indoor comfort levels, for example using awareness campaigns and higher default temperature set points. Additional measures include working with utility companies to reward consumers that reduce their energy consumption. China can also work

The Future of Cooling in China Findings and recommendations Delivering on action plans for sustainable air conditioning
PAGE | 5
IEA
. All
right
s re
serv
ed.
with industry and researchers to identify technology solutions that address thermal comfort (e.g. treatment of humidity and smart ACs) while using less energy.
Work with manufacturers to enable demand-side response. Millions of efficient ACs operating at the same time will still affect electricity systems during peak demand and extreme heat events. Smart, responsive ACs can reduce that impact, while also helping to move from “part time” and “part space” to “right time” and “right place”. China can work with manufacturers and utilities to enable demand-side response that increases flexibility within the power system. This includes financial rewards through utility-driven demand-side response programmes and using policy that standardises the interfaces built into AC equipment.
Consider refrigerant choice when addressing energy efficiency. China can work with industry and international partners to address refrigerant use and move to alternatives that are both harmless to the ozone layer and that do not contribute significantly to global warming. This includes working AC manufacturers, technicians and related cooling stakeholders to reduce refrigerant leakage and ensure proper refrigerant recovery. China can equally work with industry and international partners to identify and deploy alternative cooling technology that does not use such harmful refrigerants, such as indirect evaporative cooling, absorption chillers and liquid desiccant or desiccant wheels.
Delivering on sustainable air conditioning in China
Space cooling demand in China is rising rapidly Energy use for space cooling in buildings in China increased with an extraordinary average annual growth rate of 13% since 2000, reaching around 400 TWh in 2017 (Figure 1). China accounted for about one-third of global growth in energy used for space cooling during that period, mostly driven by growth in AC ownership in urban areas.
Per capita electricity consumption for space cooling in China is still substantially less than the United States and less than half that in Japan and Korea, suggesting there is still considerable room for growth. In urban areas, residential cooling intensity grew from about 0.8 kilowatt-hours per square metre (kWh/m2) in 2000 to roughly 4 kWh/m2 in 2017, although there are significant differences across climate zones. The type of equipment used also greatly influences cooling energy intensity, with some buildings using central heating, ventilation and air conditioning (HVAC) systems reaching cooling intensities of 20 kWh/m2 or more.
China’s impressive growth in cooling demand has major impact on its electricity system. It has accounted for about 7% of total electricity growth since 2000, underscoring the critical role of rising cooling demand. Cooling also affects peak electricity and can represent up to 50% peak loads on very hot days. Growing electricity demand is equally reflected in rapidly rising CO2 emissions, which grew fivefold since 2000 to reach more than 250 million tonnes of CO2 in 2017.

The Future of Cooling in China Findings and recommendations Delivering on action plans for sustainable air conditioning
PAGE | 6
IEA
. All
right
s re
serv
ed.
Figure 1. Energy consumption for space cooling in buildings in China, 2000-2017
IEA 2019. All rights reserved.
Note: Natural gas (not shown here) represented a tiny share (0.024%) of cooling energy consumption in 2017.
Cooling energy demand in China reached just under 400 TWh in 2017, roughly 8% of total electricity demand in the buildings sector.
The air conditioner market in China is evolving About 36% of the 1.7 billion ACs installed worldwide in 2017 were in China, and China now leads the market for room ACs, accounting for around 70% of world production and nearly 45% of installed split units. Yet this is gradually changing, as multi-split ACs and central HVAC systems have been growing steadily since the mid-2000s, mostly for architectural design preferences (Figure 2). This leads to significant differences in cooling demand and energy consumption, where households using multi-split and central ACs tend to have higher use of cooling throughout the whole apartment, emphasising the effect of greater “full space” behaviour when equipment is not specific to one room.
Figure 2. Evolving equipment choice in urban households in Beijing and Shanghai, 2000-18
Source: Derived with 2015 and 2018 data from Tsinghua University Building Energy Research Center household surveys on the status of energy use of urban households in China.
Choice of cooling equipment in urban households has changed in many cities since the early 2000s.
0%
4%
8%
12%
0
130
260
390
2000 2004 2008 2012 2016
TWh
Electricity
Share (World)
Share (China)
Share (United States)
Share of energy used for cooling in buildings
0% 50% 100%
2000
2015
2018No cooling devices
Fan
Mini-split AC
Multi-split AC
Central HVAC
Beijing
0% 50% 100%
2000
2015
2018
Shanghai

The Future of Cooling in China Findings and recommendations Delivering on action plans for sustainable air conditioning
PAGE | 7
IEA
. All
right
s re
serv
ed.
Cooling in non-residential buildings is also intensifying. Cooling energy consumption in non-residential buildings represented about half of total cooling energy consumption in 2017 and increased nearly fivefold since 2000, compared with threefold floor area growth during the period. This reflects an increasing intensification of cooling energy demand, where the average cooling intensity increased from 10 kWh/m2 in 2000 to 15 kWh/m2 in 2017. One factor in this growth is the design of HVAC systems that require “full time” and “full space” operations, particularly as building design for commercial buildings has moved increasingly to central HVAC systems using full-time mechanical ventilation.
Cooling equipment efficiency is lower than its potential A growing set of data suggests there is considerable difference between the rated and operational performance of air-conditioning equipment, part of which is due to how the equipment is installed, operated and maintained. Market data also underscore the gap between the performance of new units sold and high-efficiency products that are available in the market (Figure 3). The average annual performance factor (APF) of variable speed mini-split units sold in 2015-17 was as much as 20% lower than more efficient units that were readily available in the market and around 50-60% lower than best available products. Fixed-speed mini-splits saw practically no improvement in energy performance in recent years, and the sales average was close to or even equal to the least efficient equipment available in the market since 2015.
MEPS are one key factor influencing the typical efficiencies of available and purchased equipment in the market. Yet cooling MEPS in China have not changed in recent years and can be far under the sales average for certain equipment types, suggesting MEPS could be raised relatively easily. MEPS for fixed-speed ACs have not been revised since 2010.
Figure 3. Range of energy performance for variable-speed mini-split ACs, 2015-17
Source: Derived with data from Cheng (2018), Report on Real-time Operation Status of China’s Air Conditioning.
The average annual energy performance of variable-speed mini-splits is lower than what is typically available in markets and much lower than best available technology.
Cooling demand will continue to grow to 2030 AC ownership in China grew exceptionally fast in the last two decades, and by 2030 as many as 85% of households are expected to own at least one air-conditioning unit, with the total number
2
3
4
5
6
7
2015 2016 2017 2015 2016 2017 2015 2016 2017
< 4.5 kW 4.5~7.1 kW 7.1~14.0 kW
APF
Sales average Best available Minimum available MEPSc c c

The Future of Cooling in China Findings and recommendations Delivering on action plans for sustainable air conditioning
PAGE | 8
IEA
. All
right
s re
serv
ed.
of installed residential cooling units (including fans and dehumidifiers) reaching over 1.1 billion. The larger absolute growth is in mini-split and multi-split ACs, adding 380 million units over the coming decade. An additional 30 million central ducted systems are added, more than doubling with respect to 2017. In the non-residential sector, ACs grow by 105 million units from 2017 to 2030, with split systems contributing to 85% of the growth.
With roughly 65% of residential and 95% of non-residential floor area expected to be cooled by 2030, the installed capacity in China more than doubles from 2 600 gigawatts of cooling capacity (GWc) in 2017 to around 5 407 GWc in 2030. This represents the biggest expected increase worldwide in absolute terms, contributing to nearly one-third of global cooling capacity additions to 2030 (Figure 4).
Increased AC ownership in the Baseline Scenario, coupled with rising floor area, continued behavioural change and slow improvement in AC performance, results in strong intensification of cooling demand in China and substantial growth in cooling energy consumption. By 2030, space cooling electricity use in the Baseline Scenario swells by almost 90% to just under 750 TWh. Greater shifts toward “full time” and “full space” cooling behaviour in buildings would increase electricity demand by 2030 even further, to as much as 900 TWh or more.
Figure 4. Installed output capacity for space cooling equipment in the Baseline Scenario to 2030
IEA 2019. All rights reserved.
Note: Floor area cooled is estimated using the total installed cooling capacity relative to total floor area.
With as much as 5 410 GWc installed by 2030, China accounts for nearly one-third of cooling capacity growth globally to 2030 and around one-quarter of total installed capacity worldwide by then.
Efficiency can improve cooling comfort without increasing energy use
China can avoid the doubling (or more) of electricity demand for cooling services by 2030 through measures that quickly tap into the energy efficiency potential that is already possible using air-conditioning technology that is available in markets today. The Efficient Cooling Scenario proposes a sustainable development of cooling services in buildings that immediately improves the efficiency of new ACs through increased MEPS and that works to improve the overall energy intensity of cooling demand in buildings. By 2030, the average performance of ACs installed in China is 50% higher than the 2017 average. As a result, future cooling demand in 2030 is about
0%
20%
40%
60%
80%
100%
0
1 100
2 200
3 300
4 400
5 500
2000 2010 2020 2030
GWc installed Share of floor area cooled
ACs output capacity Residential share Non-residential share
0
5 000
10 000
15 000
20 000
25 000
2017 2030
GWc installed
China Rest of world

The Future of Cooling in China Findings and recommendations Delivering on action plans for sustainable air conditioning
PAGE | 9
IEA
. All
right
s re
serv
ed.
205 TWh less than in the Baseline Scenario (Figure 5). Another 100 TWh in electricity savings are possible through better cooling system design, more localised and connected “smart” cooling devices, and adoption of building envelope improvements that reduce overall cooling need.
Lower cooling electricity consumption leads to lesser need for power generation and network capacity. The Efficient Cooling Scenario cuts that need by more than 10% by 2030 compared with the Baseline Scenario, particularly as the share of cooling in peak electricity demand drops from present levels to under 15% (Figure 6). This translates to avoided investment, which is then passed on to businesses and consumers in lower electricity prices. Capital and operational expenses for power generation in the Efficient Cooling Scenario are about USD 7 billion lower than the Baseline Scenario over the 2020-30 period. As a result, average annual spending per person on cooling is about 12% lower.
Figure 5. Electricity savings for cooling services in buildings to 2030 in the Efficient Cooling Scenario
IEA 2019. All rights reserved.
As much as 205 TWh can be saved by more efficient equipment in 2030. Additional savings of 100 TWh may come from envelope improvement, keeping consumption steady during 2025-30.
The Efficient Cooling Scenario leads to additional benefits, including in particular reduced emissions and improved air quality. More efficient air conditioning in buildings results in a 30% reduction in CO2 emissions by 2030 compared with the Baseline Scenario. Lower electricity demand, paired with higher shares of clean power, also leads to a nearly 30% reduction in major pollutant emissions by 2030 compared with the Baseline Scenario. Around half of the reduction is from use of more efficient ACs.
0
200
400
600
800
2010 2020 2030
TWh
Additional savings potential Efficient Cooling Scenario savings
0
80
160
240
320
Savings in2030
TWhAdditional savingspotential (32%)
Others (0.1%)
Chillers (1%)
Packaged units (1%)
Central ductless splits(2%)
Mini- and multi-ductless splits (64%)

The Future of Cooling in China Findings and recommendations Delivering on action plans for sustainable air conditioning
PAGE | 10
IEA
. All
right
s re
serv
ed.
Figure 6. Power generation capacity for space cooling, 2017-30
IEA 2019. All rights reserved
Note: GWe = gigawatts of electrical capacity.
The Efficient Cooling Scenario reduces power generation capacity needs by more than 50 GW compared with the Baseline Scenario, with the reduced capacity almost all in the form of fossil fuels.
Efficient cooling is possible with effective policy Trends in recent years illustrate that the market will not move of its own forces to energy-efficient cooling equipment, nor is it likely that builders and architects will design around efficient and low-energy-intensity cooling in buildings. Yet effective policy action will be critical to curb the continued growth in demand for cooling services in China’s buildings sector and to achieve the outcomes described in the Efficient Cooling Scenario.
China’s government can implement measures to enable and encourage energy-efficient cooling solutions and behaviour that will bring about a lasting reduction in energy demand for cooling services. This includes policies to:
Strengthen existing energy performance standards across all product categories to drive AC performance towards best available technology.
Work with manufacturers and other industry stakeholders to raise awareness about proper AC sizing, installation and maintenance.
Expand building energy policies to include cooling energy needs and encourage proper building and cooling system design, passive cooling and natural ventilation opportunities.
Promote suitable indoor comfort levels, including development of market-based incentives such as consumer programmes that reward energy savings through utility bills.
Encourage demand-side response that increases flexibility within the power system, working with AC manufacturers and utilities to enable smart, responsive ACs that meet cooling needs in the “right time” and “right place”.
0%
6%
12%
18%
0
200
400
600
2017 Capacity addition 2030 BaselineScenario
2030 EfficientCooling Scenario
GWe
Other renewables
Wind
Solar PV
Hydro
Biomass and waste
Nuclear
Natural gas (incl. oil)
Coal
Share of peak
Capacity additionsShare of peak

The Future of Cooling in China Introduction Delivering on action plans for sustainable air conditioning
PAGE | 11
IEA
. All
right
s re
serv
ed.
Introduction
Space cooling in buildings is one of the most critical blind spots in the global energy transition. Worldwide, energy consumption for cooling is growing faster than for any other end use in buildings, and rising demand for cooling services is placing strains on electricity systems and the environment. The impact of this rapidly growing demand is particularly evident in the People’s Republic of China (hereafter “China”), where ownership of air conditioners (ACs) doubled in the last decade to more than 60% of households in 2017. The effect of that rising demand was particularly evident in 2017 and 2018, when electricity producers struggled to keep up with demand during summer heat waves.
Without firm policy interventions, cooling-related energy demand will continue to soar in the coming decade, particularly in China and in other emerging economies in Asia, Africa and Latin America. Yet the 2018 report by the International Energy Agency (IEA) on the Future of Cooling highlighted that actions to improve the energy efficiency of air-conditioning equipment, alongside better building design and improved demand-side response, could curb the impacts of that rising demand for cooling comfort. This would bring major benefits in reduced power generation investment, improved operational costs, lower emissions and healthier air quality.
This report has been prepared collaboratively by the IEA and the Tsinghua University Building Energy Research Center (BERC). It highlights some of the critical trends, challenges and opportunities to deliver on energy-efficient cooling services in buildings. The report has been prepared as input into discussions on the future of cooling in China and builds upon discussions from a joint workshop held by IEA and BERC in Beijing in September 2018, which included participants from the National Development and Reform Commission, the China National Institute of Standardization, Energy Foundation China, and four of China’s major AC manufacturers.
The following report looks at current market trends, technology choices and energy behaviour in buildings, providing insights and outlooks as to how cooling energy demand and emissions in China might evolve in the coming decade. It also provides insight into opportunities that can improve cooling comfort in buildings without parallel growth in energy consumption and resultant emissions. Last, it provides a set of practical recommendations that can help China as it develops its national cooling action plan to deliver on the major energy efficiency potential highlighted in the 2018 IEA report, The Future of Cooling.

The Future of Cooling in China Energy and emissions from cooling are on the rise Delivering on action plans for sustainable air conditioning
PAGE | 12
IEA
. All
right
s re
serv
ed.
Energy and emissions from cooling are on the rise
Energy use for space cooling in China increased from about 49 terawatt-hours (TWh) in 2000 to just under 400 TWh in 2017 – a remarkable average annual growth rate of 13%. This was driven by rapid economic development, urbanisation and increasing expectations for thermal comfort, all of which were compounded by extreme heat events in recent summers.
The growth of energy demand for space cooling in China has been the fastest worldwide in the last two decades, reaching around 25% of electricity use in China’s buildings sector in 2017.1 The overall share of cooling in total energy use in buildings rose from around 1.3% in 2000 to 7% in 2017, surpassing the global average and gradually approaching the share of energy used for space cooling in buildings in the United States (Figure 7). Total energy consumption for space cooling in China in 2017 was still around 35% lower than in the United States, although this does not accurately reflect the difference (and future potential) in overall demand for cooling services in buildings, given the fourfold difference in population between the two countries.
Figure 7. Energy consumption for space cooling in buildings in China, 2000-17
IEA 2019. All rights reserved
Note: Natural gas (not shown here) represented a tiny share (0.024%) of cooling energy consumption in 2017.
Cooling energy demand in China reached just under 400 TWh in 2017, equivalent to the electricity consumed in residential buildings in India and Indonesia that year.
Per capita energy use for cooling in China is still substantially less than the United States and less than half that in Japan and Korea (Figure 8). On average, space cooling consumption in China was
1 Natural gas covered only 0.024% of total cooling energy used in 2017.
0%
4%
8%
12%
0
130
260
390
2000 2004 2008 2012 2016
TWh
Electricity
Share (World)
Share (China)
Share (United States)
Share of energy used for cooling in buildings

The Future of Cooling in China Energy and emissions from cooling are on the rise Delivering on action plans for sustainable air conditioning
PAGE | 13
IEA
. All
right
s re
serv
ed.
about 275 kilowatt-hours (kWh) per person in 2017, about one-third less than per capita levels in Japan in 2000. That energy intensity depends on the province in China, but on the whole, the major jump in average energy use for cooling per person since 2000 means that China accounted for about one-third of global growth in energy used for space cooling between 2000 and 2017.
By the end of 2017, installed capacity (in terms of potential output of space cooling service) in China accounted for over 2 600 gigawatts of cooling capacity (GWc), or 22% of installed cooling capacity worldwide. That is up from 550 GWc in 2000, highlighting the rapid increase in cooling demand since the turn of the century. This is due in particular to the enormous growth in AC sales, which increased fivefold between 2000 and 2017. China consequently represented nearly 40% of global sales of air-conditioning equipment in 2017 and just under a third of newly installed cooling capacity that year (Table 1).
Figure 8. Per capita and total energy used for cooling in selected countries/regions, 2000-17
IEA 2019. All rights reserved.
Per capita cooling demand in China is still far lower than in the United States, although growing energy intensity means China accounted for around 33% of global cooling energy growth since 2000.
Table 1. Air-conditioning units and cooling output capacity, 2000-17
Stock and sales
Million units GWc (output capacity)
Installed stock Sales Installed stock Sales
China 2000 135 11 552 73 2017 604 55 2 608 376
World 2000 816 67 5 718 599 2017 1 686 148 12 103 1 316
% of world total 2017 36% 37% 22% 29%
Growing cooling demand in China has important implications for power generation. The share of cooling in electricity demand growth in buildings is currently set to increase from 23% during the period between 2000 and 2010 to more than 32% in the present decade post-2011 (Figure 9). Its share in total electricity growth in China across all sectors is also slated to double over the 2000-10 period, underscoring the critical role of cooling in rising electricity generation needs.
0
500
1 000
1 500
2 000
0
150
300
450
600
Rest of world Brazil Korea India Japan EuropeanUnion
China United States
2000 2017 Per capita 2000 Per capita 2017
TWh kWh per person

The Future of Cooling in China Energy and emissions from cooling are on the rise Delivering on action plans for sustainable air conditioning
PAGE | 14
IEA
. All
right
s re
serv
ed.
Cooling also has considerable impact on peak electricity demand. The average share of cooling in peak electricity in 2017 was around 16%, nearly twice its share in overall electricity demand. This value can be much higher during extreme heat events, such as the heat wave in July 2017 when cooling accounted for 52% of the peak load (State Grid Corporation of China, 2017). It is estimated that in big cities, especially in Eastern and Central China, this peak phenomenon can last for as much as 10 days or more during the peak summer heat.
Figure 9. Share of cooling in increased electricity demand since 2000 and in the 2017 peak load
IEA 2019. All rights reserved.
Space cooling is one of the key elements behind growing electricity demand and affected on average around 16% of peak electricity load in 2017.
Growing electricity demand for space cooling also means that energy-related carbon dioxide (CO2) emissions are on the rise. Electricity in China is produced principally with coal-fired power generation, and emissions related to space cooling demand in buildings represented around 250 million tonnes of CO2 (MtCO2) in 2017, 2.8% of total energy-related CO2 emissions in China (Figure 10). This corresponds to roughly one-fourth of global CO2 emissions from space cooling.
Figure 10. Energy-related emissions from cooling and share of buildings emissions, 2000-17
IEA 2019. All rights reserved.
The share of cooling in energy-related CO2 emissions from buildings nearly doubled since 2000, mainly due to growing cooling demand and reliance on coal-fired power generation in China.
0%
5%
10%
15%
20%
25%
30%
35%
2000-10 2011-17
Share of cooling in electricity demand growth since 2000
Buildings Total electricity
0% 10% 20% 30%
United States
China
India
Brazil
Japan
European Union
Rest of world
Share of cooling in 2017 electricity demand
Electricity demand Peak load
0%
4%
8%
12%
16%
20%
0
50
100
150
200
250
2000 2005 2010 2015
Share of building emissionsMtCO2
Space coolingemissions
Share of buildingemissions

The Future of Cooling in China Energy and emissions from cooling are on the rise Delivering on action plans for sustainable air conditioning
PAGE | 15
IEA
. All
right
s re
serv
ed.
Cooling demand in urban residential buildings is rising quickly
Total cooling electricity consumption in the buildings sector in China increased nearly eightfold between 2000 and 2017. One of the strongest contributing factors was growth in AC ownership, especially in urban residential buildings. Changing cooling behaviour (e.g. use of larger equipment and for longer hours) has also contributed to rising electricity consumption and resultant CO2 emissions, as cooling in China’s urban residential buildings increased more than tenfold between 2000 and 2017 (Figure 11). By 2017, electricity used for cooling in residential buildings in China’s cities was around 95 TWh, resulting in about 60 MtCO2.
The choice of cooling mode in residential buildings varies, where household fans represented about 3 TWh of electricity consumption in urban residential buildings in 2017, although this has been falling in recent years. Ductless mini-splits (typically a small unit with an outdoor compressor/condenser and an indoor air-handling unit) are the most common type of AC and the biggest consumer of energy for cooling in urban households. Yet multi-split ACs (with a larger outdoor element capable of handling multiple indoor units or evaporators) have been growing steadily in popularity since the mid-2000s.
By 2017, multi-split ACs represented about 5% of urban residential cooling electricity consumption. Central heating, ventilation and air conditioning (HVAC) systems have also become more common in urban residential areas in recent years, due to some incentives under policies such as the “Guidance on Promoting the Development and Utilisation of Geothermal Energy” that look at component (e.g. chiller) performance rather than system performance. However, the share of multi-split and central HVAC systems is still low, and they accounted for only 1% of total electricity used for space cooling in urban residential buildings in 2017.
Figure 11. Cooling energy use in urban residential buildings by equipment type and resultant CO2 emissions, 2000-17
Source: BERC China Building Energy Model.
Energy consumption for cooling in urban residential buildings increased tenfold between 2000 and 2017, with comparable growth in cooling-related CO2 emissions.
0
20
40
60
80
100
0
20
40
60
80
100
2000 2002 2004 2006 2008 2010 2012 2014 2016
MtC
O2
TWh
Central HVAC
Multi-split
Mini-split
Fan
Emissions

The Future of Cooling in China Energy and emissions from cooling are on the rise Delivering on action plans for sustainable air conditioning
PAGE | 16
IEA
. All
right
s re
serv
ed.
The average cooling electricity intensity per square metre (m2) in urban residential households also grew substantially since the early 2000s, as households purchased their first AC and could afford to use them more often. Estimates from household surveys by Tsinghua University BERC and its Building Energy Model indicate that the average cooling electricity intensity for urban residential households grew from about 0.79 kWh/m2 in 2000 to roughly 4 kWh/m2 in 2017. The typical intensity naturally differs across climate zones, ranging from very little energy use in colder northern provinces t0 10 kWh/m2 or more in the hotter southern provinces.
Equipment choice also greatly influences energy intensity. On-site measurement of more than 600 apartments in five similar residential buildings in Beijing in 2006 found that households using mini-split ACs used less energy per m2 for cooling than their neighbours using multi-split units (Figure 12). The average cooling electricity intensity of apartments in a building with a central HVAC system was more than four times greater, reaching nearly 20 kWh/m2.
Figure 12. Average energy intensities by cooling equipment in residential buildings in Beijing, 2006
Source: Li (2007), Study on Life Cycle Energy Consumption and Resource Consumption of Air Conditioning in Urban Residential Buildings in China.
Cooling energy intensity differs greatly depending on cooling equipment type.
Cooling in non-residential buildings is intensifying Cooling energy consumption in non-residential buildings represents about half of total cooling energy consumption and increased nearly fivefold between 2000 and 2017, compared with threefold growth in floor area during the period. This reflects an increasing intensification of cooling energy consumption, where the average cooling intensity increased from 10 kWh/m2 in 2000 to 15 kWh/m2 in 2017 (Figure 13).
0
5
10
15
20
25
Building A(Mini-split)
Building B(Mini-split)
Building C(Mini-split)
Building D(Multi-split)
Building E(Central HVAC)
kWh/
m2

The Future of Cooling in China Energy and emissions from cooling are on the rise Delivering on action plans for sustainable air conditioning
PAGE | 17
IEA
. All
right
s re
serv
ed.
Figure 13. Cooling electricity consumption in non-residential buildings and share in 2017
Source: BERC China Building Energy Model.
Cooling electricity consumption in non-residential buildings increased fivefold between 2000 and 2017, with commercial offices and shopping centres driving this growth.
Office buildings (including commercial and government offices) account for the largest share of cooling energy consumption, representing nearly one-third of electricity for cooling in non-residential buildings in 2017. Yet cooling in shopping malls and other commercial centres has grown rapidly since the mid-2000s, accounting for 25% of non-residential cooling electricity consumption in 2017. One factor in this growth is the design of HVAC systems that require “full time” and “full space” operations, rather than more localised “part space” and “part time” cooling services. Among other types, cooling energy consumption of data centres has also grown rapidly in recent years, due to rapid growth in scale and much higher cooling intensities than more conventional non-residential buildings.
32%
24%7%
6%
13%
18%
0
2
4
6
8
10
12
14
16
18
20
0
20
40
60
80
100
120
140
160
180
200
2000 2002 2004 2006 2008 2010 2012 2014 2016
kWh/
m2
TWh
Offices Malls Hotels Hospitals Schools Other Energy intensity

The Future of Cooling in China The cooling market in China is evolving Delivering on action plans for sustainable air conditioning
PAGE | 18
IEA
. All
right
s re
serv
ed.
The cooling market in China is evolving
Occupant behaviour has a big impact on cooling energy use
Broadly speaking, “part time” and “part space” behaviour is the most common cooling usage pattern in China’s residential buildings. Households often turn on ACs in only one or two rooms when it is hot and typically only use their ACs for a few hours at a time when the room is occupied. Yet occupant behaviour varies considerably and drastically influences cooling energy use in buildings. For instance, the cooling electricity consumption of apartments using mini-split ACs in the same building in Beijing varied by as much as a factor of 14 or more (Li, 2007). Similar data from household surveys conducted by BERC in recent years confirm this strong influence of occupant behaviour on cooling energy demand.
Cooling behaviour also varies significantly across regions and is influenced by the type of cooling system (Figure 14). Climate impacts the need for cooling, and households in warm and coastal regions such as the “hot summer and cold winter” (HSCW) climate region and “hot summer and warm winter” (HSWW) climate zone tend to use ACs for longer operating hours. By contrast, households in colder northwestern regions such as the cold and severe cold climate zones generally use ACs (when they own one) for fewer hours.
Figure 14. Cooling behaviour in urban households by climate zone and equipment type, 2015
Notes: HSWW = hot summer and warm winter; HSCW = hot summer and cold winter. The sample quantity includes 6 225 mini-split ACs and 608 multi-split ACs. The sample shares are weighted by provincial population within the climate zones. Central HVAC, which represents a small number of units, typically had B4-7 behaviour. B1: never use AC; B2: turn on when extremely hot and turn off before sleep; B3: turn on when extremely hot and turn off when leaving room; B4: turn on when hot and turn off when leaving room; B5: turn on when occupied and turn off when leaving room; B6: turn on for whole apartment and turn off when leaving; B7: turn on throughout the summer. Source: Hu et al. (2017), “A survey on energy consumption and energy usage behavior of households and residential building in urban China”.
“Part time” and “part space” cooling behaviour is very common in China, but this varies significantly between regions and is influenced by the choice of cooling equipment.
0% 50% 100%
Severe cold
Cold
HSCW
HSWW
Temperate B1
B2
B3
B4
B5
B6
B7
Mini-split AC
0% 50% 100%
Multi-split AC

The Future of Cooling in China The cooling market in China is evolving Delivering on action plans for sustainable air conditioning
PAGE | 19
IEA
. All
right
s re
serv
ed.
In all regions, there are significant differences in cooling demand and energy consumption across equipment types. It is more common for residents to turn on cooling for the whole apartment (either part time or full time) if their households have central HVAC systems. Many also turn on the cooling system when they enter a room, even if they are not necessarily feeling hot. By contrast, the dominant cooling behaviour in households with split units is to turn on cooling when they are hot or extremely hot and only when the room is occupied. Households with multi-split ACs tend to have slightly higher use of cooling throughout the whole apartment, emphasising the effect of greater “full space” behaviour when equipment is not specific to one room.
Larger cooling units are increasingly popular 36% of the world’s 1.7 billion ACs were installed in China in 2017. China had 574 million split ACs in 2017, covering 44% of the global installed split stock. Packaged units such as window or mobile ACs are less common and accounted for about 1% of global stock in 2017. Central HVAC systems are growing and accounted for 22 million installed units, and around 5 million chillers, mostly used for large or commercial buildings, were installed in China in 2017 (Figure 15).
More than half of urban residential households in China use a mini-split, while around 5% use a multi-split AC or central HVAC. Another 10% do not have a cooling device and about 30% use only a fan. However, AC ownership and equipment choice is changing and varies considerably across the different climate zones in China (Figure 16). In the temperate and severe cold climate zones, over 40% of households do not own a cooling device, and those that do still typically use a fan in the summer months. Provinces with hotter summers in the cold, HSCW and HSWW climate zones typically use a mini-split AC, but multi-split units and central HVAC systems are increasingly common. This can be seen in the growing capacity of AC equipment in China. The average size of installed air-conditioning units ranges between 3 kilowatts of cooling capacity (kWc) and 5 kWc, but newly sold units had an average output capacity around 7 kWc in 2017.
Figure 15. Stock of air-conditioning systems in China, 2017
IEA 2019. All rights reserved.
China accounted for 36% of the global AC stock and around 44% of the global split market in 2017.
Part of this shift to bigger units is due to architectural choice and building design. In some cities, real estate companies are promoting multi-split and central HVAC systems as a symbol of
0%
20%
40%
60%
80%
100%
0
100
200
300
400
500
600
700Million units in China
Mini-split and multi-split Central HVAC Packaged units Chillers Share of China World share
Share of world total
2.2%
0.3%15%
0.2%
43%
34%
4%1.3%
Share of 2017 world ACs stock by type

The Future of Cooling in China The cooling market in China is evolving Delivering on action plans for sustainable air conditioning
PAGE | 20
IEA
. All
right
s re
serv
ed.
high-quality buildings. More than a quarter of new buildings that were pre-furnished by developers in 2017 had a cooling system installed, and nearly three-quarters of those had a multi-split unit or central HVAC system (SIC, 2018). Surveys by Tsinghua University BERC also illustrate that overall equipment choice in urban households has changed a great deal in the last two decades. For example, the share of households using a mini-split AC in Beijing and Shanghai doubled between 2000 and 2018 (Figure 17). Yet the number households using a multi-split or central HVAC system, while smaller in absolute terms, grew more than fivefold during the same period.
Figure 16. Major cooling devices in urban households in the different climate zones, 2015
Note: Sample size = 11 186. Source: Hu et al. (2017), “A survey on energy consumption and energy usage behavior of households and residential building in urban China”.
Cooling equipment choice differs greatly across the various climate zones in China.
Figure 17. Evolving equipment choice in urban households in Beijing and Shanghai, 2000-18
Notes: The sample size for 2000 and 2015 in Beijing was 666, and in Shanghai it was 511; the 2018 sample size in Beijing was 514 and in Shanghai it was 517. Source: Data from BERC household surveys in 2015 and 2018 on the status of energy use of urban households in China.
Choice of cooling equipment in urban households has changed in many cities since the early 2000s.
0%
20%
40%
60%
80%
100%
Severe cold Cold HSCW HSWW Temperate
Central HVAC
Multi-split AC
Mini-split AC
Fans
No coolingdevices
0% 50% 100%
2000
2015
2018No cooling devices
Fan
Mini-split AC
Multi-split AC
Central HVAC
Beijing
0% 50% 100%
2000
2015
2018
Shanghai

The Future of Cooling in China The cooling market in China is evolving Delivering on action plans for sustainable air conditioning
PAGE | 21
IEA
. All
right
s re
serv
ed.
Energy consumption differs across cooling equipment The energy consumption of ACs in China is generally low on an individual basis, due to the high use of mini-split units and “part time” and “part space” cooling behaviour. One Chinese manufacturer surveyed real-time operations of mini-split ACs for 89 000 newly installed units in the HSCW zone in 2015-16, using a cloud platform and network-connected ACs. It found that average annual cooling electricity consumption per unit was generally below 150 kWh per year for wall-mounted units and between 200 kWh and 450 kWh for vertical (box) type units (Xu et al., 2018). Unsurprisingly, smaller units had lower energy consumption, even though all the units were typically operated for a similar number of hours per cooling day and 90% of the time were set at a temperature higher than 24°C (Figure 18).
Central cooling systems and district cooling are generally much more energy intensive than individual cooling devices such as mini split ACs. Monitored electricity consumption shows that the electricity intensity of central systems is much higher than mini split ACs under same climate conditions, even when the cooling equipment has similar or higher efficiency levels than smaller split units (Figure 19). Often, this is because the central cooling systems are not controlled individually by occupants and do not take into account room occupancy.
Energy consumption for other system elements such as pumping or distribution via air ducts also affects the energy intensity. For example, a residential building in Nanjing using a central HVAC system with radiator terminals in each room supplied cooling 24 hours a day during the summer months and consumed around 24 kWh/m2 (BERC, 2017). Occupants could not turn off the AC in individual rooms, and the ventilation system ran even when no one was present. As a result, the energy intensity was about four times greater than the typical mini-split.
Figure 18. Average annual energy use for different mini-split units in the HSCW zone, 2016
Notes: Type A-E units are all mini-split ACs; the service area of type A is 11-17 m2, of type B is 14-21 m2, of type C is 15-23 m2, of type D is 26-36 m2 and of type E is 35-49 m2. The sample size was 89 000 units. Source: Derived with data from Xu et al. (2018), “Big data analysis on usage state and energy consumption of residential air conditioners in the Yangtze River basin”.
Energy used by mini-split ACs depends on the equipment type and service area covered by the unit.
0
50
100
150
200
250
300
350
400
450
Type A Type B Type C Type D Type E
Wall-hanging Box type
kWh

The Future of Cooling in China The cooling market in China is evolving Delivering on action plans for sustainable air conditioning
PAGE | 22
IEA
. All
right
s re
serv
ed.
Figure 19. Average measured energy intensity of mini-split ACs and central HVAC systems by city
Note: Nanjing 1 and Nanjing 2 refer to two different buildings in Nanjing. Sources: Derived with data from BERC household surveys and monitoring for 2011-16; Ren et al. (2003), “Analysis and study on energy consumption for air conditioners for residential buildings in Guangzhou”; Li (2012), Investigation and Analysis of the Relationship between Residential Energy Use Behavior and Energy Consumption in China; Long, Zhong and Zhang (2004), “China: The issue of residential air conditioning”; Ma et al. (2007), “Investigation and analysis on summer energy consumption structure of energy efficient residential buildings in Xi’an”; Hu, Jiang and Leng (2004), “Investigation of thermal environment and energy consumption for Hubei residences”; Wu (2005), Residential building energy consumption in Hangzhou and energy conservation technology; Li and Jiang (2009), “Analysis on cooling energy consumption of residential buildings in China’s urban areas”.
The energy intensity of central HVAC systems is generally much higher than mini-split ACs.
Household surveys also suggest that in addition to having higher energy intensities, central cooling systems do not necessarily improve indoor comfort and occupant satisfaction. A nationwide questionnaire by BERC in 2015 found there was almost no difference between split and central cooling systems (Figure 20). Equally telling is the level of dissatisfaction in households with a centralised system, which was slightly higher, partly due to less control over the cooling service.
Figure 20. Result of nationwide questionnaire on decentralised and centralised cooling systems, 2015
Source: Hu et al. (2017), “A survey on energy consumption and energy usage behavior of households and residential building in urban China”.
There is little difference in occupant satisfaction between decentralised and centralised systems.
0
5
10
15
20
25
Wuh
an
Gua
ngzh
ou
Shan
ghai
Han
gzho
u
Hun
an
Xi'a
n
Beiji
ng
Suzh
ou
Hen
an
Beiji
ng
Wuh
an
Beiji
ng
Nan
jing
1
Nan
jing
2
Fan coil unit Radiator
Mini-split AC Central HVAC with chiller
kWh/
m2
0.0
0.2
0.4
0.6
0.8
1.0
0%
15%
30%
45%
60%
75%
No cooling device Fans Mini-split Multi-split Central HVAC
Aver
age
scor
e
Freq
uenc
y (%
)
Very unsatisfied (-2) Unsatisfied (-1) OK (0) Satisfied (+1) Very satisfied (+2) Average score

The Future of Cooling in China The cooling market in China is evolving Delivering on action plans for sustainable air conditioning
PAGE | 23
IEA
. All
right
s re
serv
ed.
There is a gap between real and rated energy performance
A growing set of data suggests there is considerable difference between the rated and operational performance of air-conditioning equipment, part of which is due to how the equipment is installed, operated and maintained. For example, the operating efficiency of 53 fixed-speed mini-split ACs that were used over five years in China was tested under actual working conditions, and they performed on average worse than the respective minimum energy performance standards (MEPS) and the rated efficiency (Figure 21). Some of the difference may be explained by accumulation of dirt and resulting degradation of energy performance over time (He et al., 2015). Overall, the average energy efficiency ratio (EER) of samples with cooling capacities below 4.5 kWc was 2.39 (watt input per watt output), while for units with cooling capacities between 4.5 kWc and 7.1 kWc the operational EER was only 2.36, both below the MEPS set in 2004. Compared with their original rated EER, the efficiency loss of the samples was typically 13-19%.
For multi-split ACs, low-load operation is one of the important reasons for the difference between real and rated performance. Data obtained from over 200 000 connected units in 2016-17 showed that only one indoor air-handling unit was used for over 60% of operating hours, while only 1-2 indoor units were used more than 80% of the time (Figure 22). This means those multi-split ACs were operating at partial loads a substantial portion of the total operational hours. On average, the tested units operated below 30% load more than 60% of the time, far from the conditions specified in the 2008 MEPS (SAC, 2008).
Figure 21. Measured energy performance of fixed-speed mini-split ACs over 5 years relative to MEPS
Note: The sample size was 53 units. Sources: Derived with data from He et al. (2015), “Study on energy efficiency decay of on-duty room air conditioners”; SAC (2010a), “The minimum allowable values of the energy efficiency and energy efficiency grades for room air conditioners”; SAC (2004), “The minimum allowable values of the energy efficiency and energy efficiency grades for room air conditioners”.
Operating performance of ACs can be considerably different than the required or rated performance.
The low load profile is very important for the performance of the ACs. The EER of multi-splits is generally higher than mini-split ones under rated conditions, but while the energy performance increases at partial loads around 25-50%, it decreases greatly at loads below 25% (Figure 23). When the cooling load is lower than 10-15%, the operational EER of a common multi-split AC can
0.0
0.5
1.0
1.5
2.0
2.5
3.0
3.5
0 5 10 15 20 25 30 35 40 45 50 55
EER
Sample number
> 4.5 kW 4.5-7.1 kW > 7.1 kW MEPS 2004 MEPS 2010c c c

The Future of Cooling in China The cooling market in China is evolving Delivering on action plans for sustainable air conditioning
PAGE | 24
IEA
. All
right
s re
serv
ed.
decrease by 50% or more. The result is that, though they have higher-rated efficiency, the actual electricity consumption of multi-split ACs is usually higher than mini-split units.
Figure 22. Operational conditions of multi-split ACs studied in China in 2016-17
Note: The sample size was 200 000 units. Source: Cheng (2018), Report on Real-time Operation Status of China’s Air Conditioning.
Multi-split ACs operated below 30% load over 60% of the time, impacting equipment performance.
Figure 23. Energy efficiency of common multi-split AC at different levels of cooling load
Source: GREE (2019), “GMV Zhirui frequency conversion variable capacity home central air conditioner”.
The cooling energy efficiency decreases greatly at loads at or below 15% for common multi-split ACs.
For central HVAC systems using a chiller, there is a large gap between average seasonal performance and the actual chiller efficiency at typical working conditions, due to the large share of energy used for distribution at partial loads. Real-time operating efficiency data from 15 on-site tests and monitoring between 2010 and 2015 found that there is an obvious gap between the chiller EER and the overall seasonal EER of the entire HVAC system (Figure 24).
0%
10%
20%
30%
40%
50%Share of operational hours in different cooling loads
1 unit60%
2 units27%
3 units4%
4 units9%
Units in operation
Cooling loads
0
1
2
3
4
5
6
10% 15% 25% 50% 100%
EER

The Future of Cooling in China The cooling market in China is evolving Delivering on action plans for sustainable air conditioning
PAGE | 25
IEA
. All
right
s re
serv
ed.
Figure 24. Comparison between chiller EER and overall seasonal EER for the system
Notes: The cooling system includes the chiller, pumps and other auxiliary equipment; the system seasonal average EER is calculated using the total cooling load during the cooling season relative to the total electricity consumption of the system; S1-10 refer to different systems. Source: Data from BERC household surveys and monitoring for 2011-16.
For central HVAC systems, there is a large gap between system efficiency and chiller efficiency.
For some systems, the electricity consumed by water pumps accounted for nearly half of the electricity consumption, resulting in a near doubling of overall energy intensity (Figure 25). As a result, while the chiller EER was generally between 4 and 6, the average seasonal EER of the system was generally below 4. For some systems, the operational EER was less than half the chiller EER, meaning the energy-efficient chiller, when viewed from a system energy perspective, was operating at or below the performance levels of a decentralised system.
Figure 25. Measured cooling electricity use by component for a chiller system in Henan, 2011
Source: Data from BERC on-site tests and monitoring in 2011.
Electricity consumption of system components such as pumps in central system can be very high.
0
1
2
3
4
5
6
7
S1 S2 S3 S4 S5 S6 S7 S8 S9 S10 S1 S2 S3 S4 S5
Non-residential Residential
EER
Chiller System seasonal average
0
1
2
3
4
5
6
7
8
Total Chiller Chilled waterpump
Cooling waterpump
kWh/
m2
Chiller58%
Chilled water pump
20%
Cooling water pump
22%

The Future of Cooling in China The cooling market in China is evolving Delivering on action plans for sustainable air conditioning
PAGE | 26
IEA
. All
right
s re
serv
ed.
The market is not keeping up with energy efficiency potential
Among the most widespread mini-split ACs, fixed-speed units dominated the market until the late 2000s and had on average lower efficiency compared with variable-speed inverter technology, which has become increasingly popular in recent years, covering a market share of around 65% in 2016, up from about 8.5% in 2007 (Wang, 2017; CLASP, 2016). Yet the average annual performance factor (APF) of variable-speed units sold is 7-20% lower than more efficient units typically available in the market and 50-60% lower than best available products (Figure 26). In some capacity ranges, the energy performance of best available models does not show continuous improvements, which may be due to the lack of sales and models subsequently taken out of the market.
MEPS are one key factor influencing the typical efficiencies of available and purchased equipment in the market. Yet cooling MEPS in China have not changed in recent years and can be far under the sales average for certain equipment types, suggesting MEPS could be raised relatively easily. Over the years, China has introduced multiple subsidy schemes to support the introduction and revision of new standards (2009 and 2012) or as part of broader economic stimulus packages. The most recent subsidy scheme was launched in 2012 to support the revision of variable-speed MEPS that same year. The scheme incentivised the purchase of Tier 1 and Tier 2 ACs, providing between 240 Chinese Yuan renminbi (RMB) and RMB 400 for variable-speed units (Table 2). Initially, the subsidy likely boosted sales of more efficient ACs, explaining in part why the market sales average had levels of efficiency much higher than the 2013 MEPS. There was a sharp increase in the average energy performance of variable-speed ACs between 2013 and 2014 (Table 3). However, efficiency improvements for some equipment types levelled off in 2015-17.
Figure 26. Range of energy performance for variable-speed mini-split ACs, 2015-17
Source: Derived with data from Cheng (2018), Report on Real-time Operation Status of China’s Air Conditioning.
The average annual energy performance of variable-speed mini-splits is lower than what is typically available in markets and much lower than best available technology.
2
3
4
5
6
7
2015 2016 2017 2015 2016 2017 2015 2016 2017
< 4.5 kW 4.5~7.1 kW 7.1~14.0 kW
APF
Sales average Best available Minimum available MEPSc c c

The Future of Cooling in China The cooling market in China is evolving Delivering on action plans for sustainable air conditioning
PAGE | 27
IEA
. All
right
s re
serv
ed.
Table 2. Energy efficiency tiers and subsidies for variable-speed ACs, 2013
Cooling capacity (kWc)
Tier 3 Tier 2 Tier 1
EER Subsidy EER Subsidy EER Subsidy
< 4.5 4.3 N/A 5.0 RMB 240 5.4 RMB 300 4.5-7.1 3.9 N/A 4.4 RMB 280 5.1 RMB 350
7.1-14.0 3.5 N/A 4.0 RMB 330 4.7 RMB 400 Source: SAC (2013), “Minimum allowable values of the energy efficiency and energy efficiency grades for variable speed room air conditioners”.
Table 3. Energy performance of sales average after introduction of subsidies
Cooling capacity (kWc)
Variable speed Fixed speed
2013 2014 % change 2013 2014 % change
< 4.5 2.7 4.5 67% 3.28 3.26 -0.6% 4.5-7.1 2.2 4.5 105% 3.17 3.13 -1.3%
7.1-14.0 2.3 4.3 87% 3.13 3.01 -3.8% Source: Cheng (2018), Report on Real-time Operation Status of China’s Air Conditioning.
While variable-speed ACs have grown in performance and market share, fixed-speed mini-splits have not seen any real improvements in energy efficiency in recent years (Figure 27). Markedly, the average EER of both available models and the sales average have been close to or even equal to the least efficient equipment available in the market. Even the subsidy scheme in 2012, which provided between RMB 180 and RMB 300 for Tier 1 and Tier 2 fixed-speed ACs, did not seem to contribute to a marked improvement in energy performance. Part of this may be due to falling shares of fixed-speed units and lack of manufacturer incentive to improve performance of a shrinking market. Equally, MEPS for fixed-speed ACs have not been revised since 2010. Given that fixed-speed ACs still represent a significant share of the market, it is important to drive the sale of more efficient models through raising MEPS and incentive measures.
Figure 27. Cooling efficiency of fixed-speed mini-split ACs, 2017
Source: Derived with data from Cheng (2018), Report on Real-time Operation Status of China’s Air Conditioning.
Unlike variable-speed units, fixed-speed mini-split ACs have had little performance improvement in recent years and both the sales average and average available efficiency are at the minimum level.
2.
2. 5
3.
3. 5
4.
2015 2016 2017 2015 2016 2017 2015 2016 2017
< 4.5 kW 4.5~7.1 kW 7.1~14.0 kW
EER
Sales average Best available Minimum available MEPSc c c

The Future of Cooling in China The cooling market in China is evolving Delivering on action plans for sustainable air conditioning
PAGE | 28
IEA
. All
right
s re
serv
ed.
By contrast, the market average performance for multi-split ACs is substantially higher than MEPS (Figure 28). Minimum performance levels could be easily raised and are worth addressing as the China National Institute for Standardization prepares a revision of MEPS for air-conditioning equipment, developing overarching MEPS for both mini-split and multi-split ACs.
Figure 28. Cooling efficiency of large multi-split ACs, 2017
Note: The integrated part load value (IPLV) evaluates equipment performance while it is operating at less than full capacity. Source: Derived with data from Cheng (2018), Report on Real-time Operation Status of China’s Air Conditioning.
The IPLV of multi-split ACs is much lower than what is typically available in markets.
Building size and cooling system design affect energy intensity
Building and cooling system design can have a dramatic impact on the underlying need for and energy intensity of cooling services. For example, non-residential buildings can be classified into two types per China’s Standard for Energy Consumption of Buildings (Table 4). Type A non-residential buildings often have operable windows (windows that open) and cool using natural ventilation or a fan, mini-split or multi-split AC.2 Type B non-residential buildings such as commercial offices and shopping centres typically have inoperable windows and use a central HVAC system. The annual energy consumption in those buildings can be significantly higher on a per-m2 basis as shown in data collected by Tsinghua University BERC for 2 789 buildings in Beijing and Shanghai (Figure 29).
Table 4. Two types of non-residential buildings relative to building and cooling system design
Type A Type B
Building design Operable windows/ natural ventilation
Inoperable windows/ mechanical ventilation
Cooling system design Decentralised Centralised
Sources: BERC (2010), Annual Report on China Building Energy Efficiency; SAC (2016), “Standard for energy consumption of buildings”.
2 Use of natural ventilation depends not only on building design but also on other considerations such as the number of required air exchanges or treatment of unhealthy local air pollution.
0
2
4
6
8
10
12
2016 2017 2016 2017 2016 2017
< 28 kW 28~84 kW > 84 kW
IPLV
Average available Best available Minimum available MEPSc c c

The Future of Cooling in China The cooling market in China is evolving Delivering on action plans for sustainable air conditioning
PAGE | 29
IEA
. All
right
s re
serv
ed.
Figure 29. Range of cooling intensity of non-residential buildings in Beijing and Shanghai, 2015
Note: Sample size = 2 789 units. Source: BERC estimation according to survey and monitoring data.
The cooling energy intensity of Type A and Type B non-residential buildings differs greatly.
Type B commercial buildings are growing rapidly in China and are one of the driving forces behind growing cooling demand in non-residential buildings. For example, the proportion of Type B office buildings in Beijing increased from 7% in 2008 to 17% in 2013 (Figure 30).
Figure 30. Growth of Type B non-residential buildings in Beijing, 2008-13
Sources: Data from 2008 and 2011 BERC surveys on energy using patterns in office buildings in Beijing.
The share of Type B office buildings in Beijing more than doubled between 2008 and 2013, and those buildings generally have higher cooling intensities than Type A commercial buildings.
0
10
20
30
40
50
60
70
80
Type A Type B Type A Type B Type A Type B
Beijing Beijing Shanghai
Offices Malls
kWh/
m2
0%
20%
40%
60%
80%
100%
2008 2013
Share of Type A officebuildings
Share of Type B officebuildings

The Future of Cooling in China The cooling market in China is evolving Delivering on action plans for sustainable air conditioning
PAGE | 30
IEA
. All
right
s re
serv
ed.
Cooling demand is expanding to different building types Other non-residential buildings such as hospitals, schools and transport hubs are a growing source of cooling demand in the buildings sector. Continuous improvement of medical services and increasing construction of hospitals in China will continue to generate new cooling demand, and the number of education buildings is also expected to increase rapidly; many of them will have air-conditioning systems. Train and subway stations and other types of non-residential buildings, including warehouses and food processing facilities, are also behind growing cooling demand outside the general services subsector.
Compared with more conventional service buildings, these other non-residential buildings tend to have higher potential for energy consumption growth. For example, most school buildings currently do not have a cooling system, but in recent years, some primary and middle school buildings have installed central HVAC systems with high cooling energy intensities. For example, a middle school in Beijing that was awarded the highest grade in green building design has a central HVAC system. Measured data indicate that the school’s energy intensity reached 70 kWh/m2, which is nearly three times the energy intensity of a typical middle school in the city (BERC, 2018).

The Future of Cooling in China Demand for cooling will indubitably grow to 2030 Delivering on action plans for sustainable air conditioning
PAGE | 31
IEA
. All
right
s re
serv
ed.
Demand for cooling will indubitably grow to 2030
The stock of ACs in China could increase by as much as 90% over the coming decade to 2030 and by as much as 135% by 2050, despite the large share of households already owning an AC today (IEA, 2018). Differences in AC ownership to date are dominated by income levels and climate, particularly in urban areas. In the future, the expected evolution of cooling demand is likely to be influenced by multiple drivers. This includes changing environmental conditions such as increased numbers of hot days and extreme heat events in places that traditionally did not have cooling demand. It also reflects emerging trends in China’s cooling market, from building and cooling system design to changing occupant behaviour and equipment choice.
Greater affordability of cooling will propel continued growth
While 60% of households in China already own at least one AC, rising income levels, including in non-urban areas, will increase the affordability of owning and operating an AC (or multiple ACs). Presently, the poorest Chinese provinces have per capita income levels that are as much as one-fourth that of the richest provinces. Rising income across all of China will unquestionably raise demand for AC ownership, as it likely will increase expectations of thermal comfort, influencing the amount of space that is cooled and the number of hours air-conditioning equipment is used.
AC ownership in China grew exceptionally fast in the last two decades, even compared with countries at similar income levels with comparable or greater numbers of cooling degree days (CDDs) (Figure 31). Yet the growth relative to other countries and expected income levels suggests that China could still see considerable expansion in the number of households with an AC and the number of typical AC units per household.
In the IEA Baseline Scenario,3 AC ownership in China is expected to grow to nearly 85% of households owning at least one air-conditioning unit, with the total number of residential cooling units (including fans and dehumidifiers) reaching over 1.1 billion by 2030 (Figure 32). The larger absolute growth is in mini- and multi-split ACs, adding 380 million units over the coming decade. Packaged units quintuple, even though their total installed number remains small, and an additional 30 million central ducted systems are added, more than doubling with respect to 2017. Fans and dehumidifiers increase by only 10%.
3 For more information, see 2018 IEA report on The Future of Cooling, www.iea.org/cooling.

The Future of Cooling in China Demand for cooling will indubitably grow to 2030 Delivering on action plans for sustainable air conditioning
PAGE | 32
IEA
. All
right
s re
serv
ed.
Figure 31. Typical household ownership and number of units relative to income and CDDs
IEA 2019. All rights reserved.
AC ownership in China will likely grow further, as will the average number of ACs per household.
The overall shift towards larger multi-split and central HVAC systems means the average size of residential AC sales increases to over 8 kWc by 2030, and the average number of hours per cooling day also increases to seven hours. In the non-residential sector, ACs grow by 105 million units from 2017 to 2030, with split systems contributing to the bulk of growth (85%), followed by chillers (8.5%), dehumidifiers (4%) and packaged units (2.5%).
Figure 32. Household ownership of space cooling equipment in the Baseline Scenario to 2030
IEA 2019. All rights reserved.
Ownership of ACs could reach approximately 800 million units and fans 250 million units by 2030.
With roughly 65% of residential and 95% of non-residential floor area expected to be cooled by 2030, the installed cooling capacity in China more than doubles from 2 600 GWc in 2017 to around
0%
20%
40%
60%
80%
100%
0 10 20 30 40 50Thousand USD per person
China historical levelsOther countries (CDDs >3 000)China average (CDDs ~ 1 200)
0
0.6
1.2
1.8
2.4
3
0 10 20 30 40 50Thousand USD per person
World average China (CDDs <1 000)China (CDDs > 1 000) Provinces 2017 (CDDs > 1 000)Hot and humid outside China
Share of households owning at least one AC Average number of units per household
0%
25%
50%
75%
100%
0
300
600
900
1 200
2000 2017 2030
Million units Share of households with at least one AC
Fans anddehumidifiers
Packaged (room)ACs
Central ductedsystems
Split ACs
Ownership rate

The Future of Cooling in China Demand for cooling will indubitably grow to 2030 Delivering on action plans for sustainable air conditioning
PAGE | 33
IEA
. All
right
s re
serv
ed.
5 407 GWc in 2030. This represents the biggest expected increase worldwide in absolute terms, contributing to nearly one-third of global cooling capacity additions to 2030 (Figure 33).
Figure 33. Installed output capacity for space cooling equipment in the Baseline Scenario to 2030
IEA 2019. All rights reserved.
Note: Floor area cooled is estimated using the total installed cooling capacity relative to total floor area.
With as much as 5 410 GWc installed by 2030, China accounts for nearly one-third of cooling capacity growth globally to 2030 and around one-quarter of total installed capacity worldwide by then.
Changing occupant behaviour will impact cooling demand
Occupant behaviour is one of the most important factors influencing cooling demand, especially in residential buildings. For instance, on-site tests in 2006 of 29 apartments all using mini-split ACs in the same building with the same orientation in Beijing found that the cooling electricity consumption varied from nearly zero (very limited AC usage) to over 14 kWh/m2 (Figure 34). The cause of this variation was different behaviour using a split AC, including the number of operational hours, temperature setting and whether windows were opened during cooling operations. Similar data from household surveys conducted by BERC in recent years confirm this strong influence of occupant behaviour on cooling energy demand.
Cooling behaviour in residential buildings could shift from decentralised mini-split installations to more centralised multi-split and central HVAC units. At present, some “high-grade” residential buildings with inoperable windows, mechanical ventilation and radiator end use start to appear. This building form greatly changes the usage of occupants, who have little choice but to switch from “part time” and “part space” mode to “full time”, “full space” mode. This, alongside changing behaviour, will greatly influence cooling energy consumption.
Rising living standards will also lead to more energy-intensive cooling behaviour, for example in cooler northern and western regions that have yet to own an AC for the first time or have not previously desired an AC.
0%
20%
40%
60%
80%
100%
0
1 100
2 200
3 300
4 400
5 500
2000 2010 2020 2030
GWc installed Share of floor area cooled
ACs output capacity Residential share Non-residential share
0
5 000
10 000
15 000
20 000
25 000
2017 2030
GWc installed
China Rest of world

The Future of Cooling in China Demand for cooling will indubitably grow to 2030 Delivering on action plans for sustainable air conditioning
PAGE | 34
IEA
. All
right
s re
serv
ed.
Figure 34. Measured cooling intensity of households in same building in Beijing, 2006
Source: Li (2007), Study on Life Cycle Energy Consumption and Resource Consumption of Air Conditioning in Urban Residential Buildings in China.
Cooling behaviour drastically affects cooling energy intensity, even for households with the same type of AC in the same building.
Changing climate will increase overall need for cooling comfort
Both temperature and humidity influence thermal comfort and resulting cooling needs. China is traditionally split into five climate zones, although climate varies unevenly across the country. In 2017, the average number of days with perceived temperatures higher than 25°C across all of China was around 60, although this can reach 180 or more in some provinces in southern, eastern and central China. More than 70% of China’s population is concentrated in provinces that have hot or hot and humid summers, and cooling is increasingly essential to work and live under comfortable conditions. In regions with more moderate summer temperatures and shorter cooling periods (e.g. Yunnan and Heilongjiang), households historically have tended not to invest in air conditioning, preferring an electric fan.
CDDs significantly vary among Chinese provinces, with the greatest values (up to 3 400 CDDs) concentrated in tropical or subtropical areas (Table 5). Across all of China, the average number of CDDs between 2007 and 2017 increased by 1.7% over the 1997-2007 period. This reflects the well-known increasing trend of global average surface temperature. By 2030, those rising temperatures may lead to an increase in CDDs as much as 80% in some of China’s regions. The most significant warming occurs in cold and temperate climate zones, with the largest absolute CDD increase in Guangxi, Beijing and Xinjiang, adding on average more than 70 CDDs by 2030, with some locations adding as many as 95 CDDs. This value could go up to 230 CDDs by 2050, where the largest absolute increase occurs in Guangxi, Guangdong and Jiangxi.
The areas with the highest increase in CDDs are also typically those with higher population densities, which means the change in felt temperature during summer months and extreme events could be even higher in dense urban environments. This will undoubtedly lead to increased demand for space cooling, in terms of both AC ownership and usage.
0
2
4
6
8
10
12
14
16
1 2 3 4 5 6 7 8 9 10 11 12 13 14 15 16 17 18 19 20 21 22 23 24 25 26 27 28 29
kWh/
m2
Sample households

The Future of Cooling in China Demand for cooling will indubitably grow to 2030 Delivering on action plans for sustainable air conditioning
PAGE | 35
IEA
. All
right
s re
serv
ed.
Table 5. CDDs and the average number of cooling days by climate zone, 2017-50
2017 2030 2050
CDDs
Number of
cooling days
Number of ACs per
household
Number of
cooling days
% change over 2017
CDDs
Number of cooling
days
% change
over 2017 CDDs
Severe cold 523 30 0.13 34 7.0% 39 16.8%
Temperate 725 28 0.09 32 7.4% 37 17.9%
Cold 1 012 69 0.86 75 6.4% 80 11.1%
HSCW 1 322 93 1.29 99 4.9% 104 9.7%
HSWW 1 840 140 1.18 166 20.6% 171 25.5%
China 1 242 82 1.04 91 4.7% 96 9.8% Notes: Cooling days are assumed as the days with an average perceived temperature larger than 25°C. Severe cold includes Inner Mongolia, Liaoning, Jilin, Heilongjiang, Tibet, Gansu, Qinghai; temperate includes Guizhou and Yunnan; cold includes Beijing, Tianjin, Hebei, Shanxi, Shandong, Shaanxi, Ningxia, Xinjiang; HSCW includes Shanghai, Jiangsu, Zhejiang, Anhui, Henan, Hubei, Hunan, Chongqing, Sichuan, Fujian; HSWW includes Guangdong, Guanxi, Hainan and Jiangxi. Sources: Derived using NOAA (2018), Global Surface Summary of the Day –GSOD, 1990-2018 and NCAR (2012), GIS Program Climate Change Scenarios, assuming the Representative Concentration Pathway (RCP) 4.5 Scenario (IPCC, 2014), “Climate change 2014: Synthesis report summary for policymakers” and using a base temperature of 18°C, taking humidity into account.
Average annual CDDs are a useful indicator of changes in future cooling demand profiles, but prospective daily temperature profiles better illustrate the likely need for more cooling services in China in the future (Figure 35). For example, the average daily temperature in the Baseline Scenario (in terms of projected anomalies from the 1980-99 historical average) could be as much as 25% higher by 2030 compared with the average in 2007-17 in Shijiazhuang (Hebei), and 18% higher in Shaoguan (Guangdong). Those projected anomalies illustrate that it could be considerably hotter in some parts of China, even if the overall change in annual CDDs is not substantial. This would lead to greater cooling demand, and during extreme heat events such as those in recent summers, would contribute to much higher peak electricity loads in many cities.
Figure 35. Daily average temperature between August and September in Shijiazhuang (Hebei) and Shaoguan (Guangdong), 2030 projection relative to 2007-17
Source: Temperature values based on available weather station data (NOAA, 2018), Global Surface Summary of the Day –GSOD, 1990-2018.
Daily temperature profiles in the Baseline Scenario could have higher peaks by 2030 in some regions relative to historical temperatures, leading to increased cooling demand and peak electricity loads.
0
5
10
15
20
25
30
35
213 233 253 273
2007-17 2030
Daily average temperature in Shijiazhuang (◦C)
0
5
10
15
20
25
30
35
213 233 253 273
Daily average temperature in Shaoguan (◦C)
Day of the yearDay of the year

The Future of Cooling in China Demand for cooling will indubitably grow to 2030 Delivering on action plans for sustainable air conditioning
PAGE | 36
IEA
. All
right
s re
serv
ed.
Building design will affect the underlying need for cooling
Building design has a great impact on heating and cooling energy requirements, in terms of both thermal conductivity (e.g. construction material and insulation) and energy distribution (e.g. pumping systems for chillers). Building design (e.g. external shading and dark roofs) and material choices (e.g. clear-coated glass) also affect how much heat is captured from solar gain. Building scale (e.g. large commercial complexes) and ventilation likewise influence the need for cooling services. For example, appropriate design can take advantage of “free” cooling via natural ventilation during cooler evening hours and days when it is not extremely hot.
Choice of equipment and cooling systems at the design phase also affects cooling energy use and can allow for greater flexibility of demand, eliminating unnecessary cooling of unoccupied space or when occupants do not feel hot (in contrast with conventional HVAC systems, which often can lead to occupants feeling too hot or too cold). The efficiency of smaller split equipment is generally lower than that of large chillers, but gains in the real-time operations from “part time” and “part space” design can drastically reduce the actual amount of energy consumed by fans, pumps and other distributive equipment operating at low partial loads.
Without additional policy signals, it is likely that Type B non-residential buildings with central HVAC systems will continue to develop quickly over the coming decade. Cooling services in schools, hospitals and other types of non-residential buildings are also expected to increase considerably. If the design of those buildings and cooling systems does not address efficiency in the first instance, it could lead to significant unnecessary energy demand.
Trends also suggest that Type B non-residential buildings and an increasing number of residential buildings could move towards multi-split and central HVAC cooling systems without policy guidance. Compounded with overall expected growth in household AC ownership, this will lead to continued intensification of cooling demand in China’s buildings sector.

The Future of Cooling in China Energy use for cooling could swell by 2030 Delivering on action plans for sustainable air conditioning
PAGE | 37
IEA
. All
right
s re
serv
ed.
Energy use for cooling could swell by 2030
Increased AC ownership in the Baseline Scenario, coupled with rising floor area, continued behavioural change and slow improvement in AC performance, results in strong intensification of cooling demand in China and substantial growth in cooling energy consumption. By 2030, space cooling electricity use in the Baseline Scenario swells by almost 90% to just under 750 TWh (Figure 36). That growth continues to 2050 if action is not taken to address China’s increasing appetite for cooling services, leading to a 150% growth over 2017 demand in electricity consumption by mid-century. Weak progress in AC performance plays a strong role in the sizeable increase, where the average efficiency of sales of air-conditioning units improves by only about 10% for residential units and by about 20% for commercial units in the Baseline Scenario (compared with around 20% for residential and 17% for commercial over the past decade). That marginal improvement is almost entirely eaten by anticipated growth in the average number of hours of cooling operation in residential and non-residential buildings.
Figure 36. Total and per capita energy use and hours of use in the Baseline Scenario to 2030
IEA 2019. All rights reserved.
In the Baseline Scenario, AC efficiency improvement would not be sufficient to offset continued rapid growth in cooling demand, increasing electricity use for cooling in buildings by around 90% by 2030.
Changing behaviour could increase cooling demand further
The Baseline Scenario assumes continued growth in multi-split and central HVAC systems in China, although mini-split units remain the most common type of cooling equipment. This implies a relatively consistent use of “part time” and “part space” cooling behaviour over the next decade,
0
2
4
6
0
250
500
750
2000 2010 2020 2030
TWh
Energy use for space cooling Residential Non-residential
Average hours
0
300
600
900
0
1 000
2 000
3 000
China Rest of world
2017 2030 kWh per person
TWh kWh per person

The Future of Cooling in China Energy use for cooling could swell by 2030 Delivering on action plans for sustainable air conditioning
PAGE | 38
IEA
. All
right
s re
serv
ed.
even if the average number of cooling hours increases by around 15% and the average number of AC units per household grows from 1.05 in 2017 to around 1.8 in 2030. Yet the projected growth in the Baseline Scenario could be much higher if China’s households and commercial buildings move towards higher energy intensity levels with more “full time” and “full space” cooling.
BERC modelled the impact of cooling behaviour if urban residential households were to shift to “full time” and “full space” cooling and if non-residential buildings continued to move to Type B buildings. In the outlook (Path A), total electricity consumption by 2030 would reach over 900 TWh, nearly one-sixth of China’s total electricity use in 2017 (Figure 37). This contrasts considerably with “part time” and “part space” cooling behaviour, which if continued would lead to electricity demand in 2030 that is 50% lower, or around 600 TWh (Path B). In both cases, equipment and envelope performance improvements would cut projected electricity demand substantially, but the effects of more intensive cooling are still evident in both Path A scenarios.
Figure 37. Cooling energy use in urban residential and commercial buildings to 2030 by intensity path
Notes: The Path A scenario moves toward “full time” and “full space” cooling without other efficiency improvements; Path A-EF assumes equipment and building envelope performance improve in the “full time” and “full space” cooling trajectory; Path B continues “part time” and “part space” behaviour, while Path B-EF assumes cooling equipment and building envelope performance improvements. Source: BERC China Building Energy Model.
Moving towards “full time” and “full space” cooling, even with more efficient buildings and equipment, would dramatically increase energy use in urban residential and commercial buildings.
Efficiency can improve cooling services without growing energy
China can avoid the doubling (or more) of electricity demand for cooling services by 2030 through measures that quickly tap into the energy efficiency potential that is already possible using air-conditioning technology that is available in markets today. The IEA Efficient Cooling Scenario proposes a sustainable development of cooling services in buildings to 2030 that immediately improves the efficiency of new ACs through increased MEPS and that works to improve the overall energy intensity of cooling demand in buildings.
By 2025, the average seasonal efficiency of residential ACs in China in the Efficient Cooling Scenario is 30% higher than the 2017 average and by 2030, it is 50% higher. The performance of
0
200
400
600
800
1 000
2000 2005 2010 2015 2020 2025 2030
TWh
Path A
Path A-EF
Path B
Path B-EF

The Future of Cooling in China Energy use for cooling could swell by 2030 Delivering on action plans for sustainable air conditioning
PAGE | 39
IEA
. All
right
s re
serv
ed.
commercial ACs improves even further, by about 40% in 2025 and 75% by 2030. As a result, cooling demand in 2025 is about 110 TWh less than in the Baseline Scenario and 205 TWh less in 2030 (Figure 38). Additional savings are possible through better cooling system design, more localised and connected “smart” cooling devices, and adoption of building envelope improvements that reduce overall cooling need, such as low-emissivity windows and cool roofs. Those additional measures lead to about 100 TWh in further energy savings by 2030.
Figure 38. Electricity savings for cooling services in buildings to 2030 in the Efficient Cooling Scenario
IEA 2019. All rights reserved.
As much as 205 TWh can be saved by more efficient equipment in 2030, while additional savings of 100 TWh comes from envelope improvement, keeping consumption steady during 2025-30.
The majority of energy savings in the Efficient Cooling Scenario comes from urban residential and commercial buildings, where cooling demand is already growing the most rapidly (Figure 39). Without measures to address continued trends in cooling energy intensity, demand from those buildings will double by 2030. Yet effective and affordable building envelope measures, using simple shading techniques, low-emissivity windows and reflective surfaces, can cut that demand by more than 10% by 2030. Efficient ACs, with better system design that favours “part time” and “part space” behaviour, cut electricity demand for cooling an additional 20%.
Figure 39. Energy savings potential in urban residential and commercial buildings by 2030
Source: BERC China Building Energy Model.
Building measures that address the need for cooling services and efficient ACs cut cooling energy use in urban residential and commercial buildings by one-third in 2030.
0
200
400
600
800
2010 2020 2030
TWh
Additional savings potential Efficient Cooling Scenario savings
0
80
160
240
320
Savings in2030
TWhAdditional savingspotential (32%)
Others (0.1%)
Chillers (1%)
Packaged units (1%)
Central ductless splits(2%)
Mini- and multi-ductless splits (64%)
0
100
200
300
400
500
600
700
800
900
1 000
2017 2030 Path A 2030 Path B Efficient ACs 2030 Path B-EF
TWh
Building envelope measures
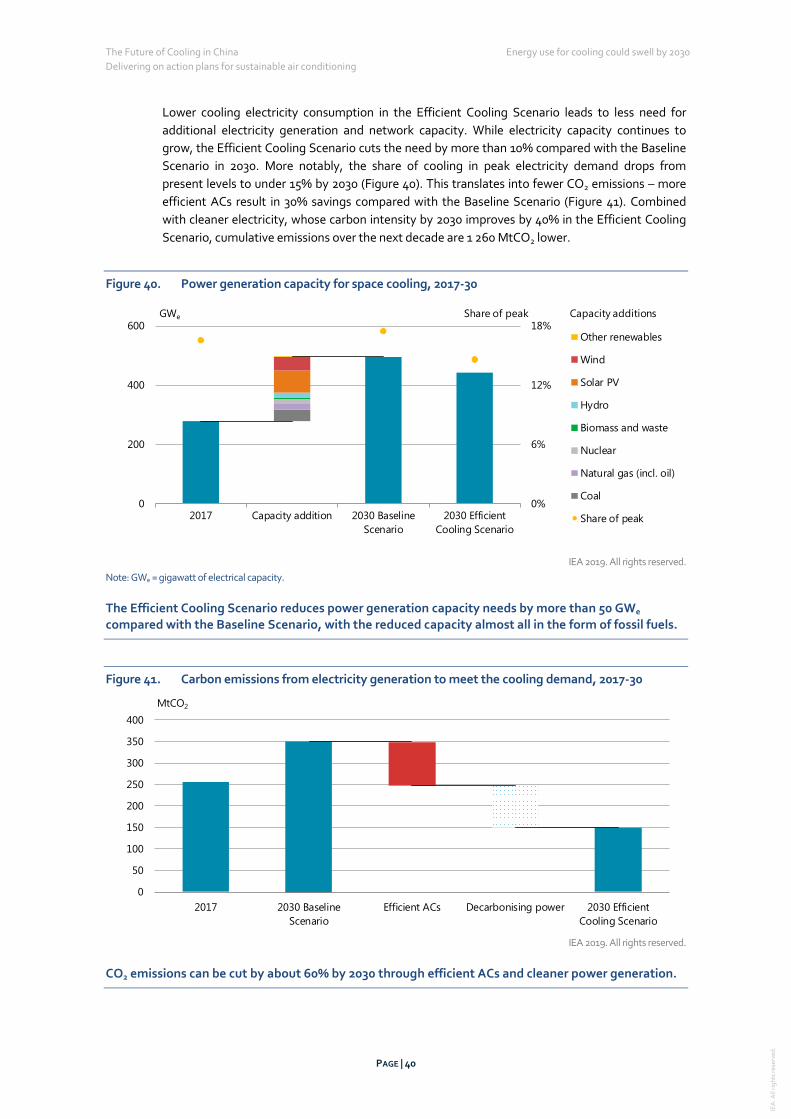
The Future of Cooling in China Energy use for cooling could swell by 2030 Delivering on action plans for sustainable air conditioning
PAGE | 40
IEA
. All
right
s re
serv
ed.
Lower cooling electricity consumption in the Efficient Cooling Scenario leads to less need for additional electricity generation and network capacity. While electricity capacity continues to grow, the Efficient Cooling Scenario cuts the need by more than 10% compared with the Baseline Scenario in 2030. More notably, the share of cooling in peak electricity demand drops from present levels to under 15% by 2030 (Figure 40). This translates into fewer CO2 emissions – more efficient ACs result in 30% savings compared with the Baseline Scenario (Figure 41). Combined with cleaner electricity, whose carbon intensity by 2030 improves by 40% in the Efficient Cooling Scenario, cumulative emissions over the next decade are 1 260 MtCO2 lower.
Figure 40. Power generation capacity for space cooling, 2017-30
IEA 2019. All rights reserved.
Note: GWe = gigawatt of electrical capacity.
The Efficient Cooling Scenario reduces power generation capacity needs by more than 50 GWe
compared with the Baseline Scenario, with the reduced capacity almost all in the form of fossil fuels.
Figure 41. Carbon emissions from electricity generation to meet the cooling demand, 2017-30
IEA 2019. All rights reserved.
CO2 emissions can be cut by about 60% by 2030 through efficient ACs and cleaner power generation.
0%
6%
12%
18%
0
200
400
600
2017 Capacity addition 2030 BaselineScenario
2030 EfficientCooling Scenario
GWe
Other renewables
Wind
Solar PV
Hydro
Biomass and waste
Nuclear
Natural gas (incl. oil)
Coal
Share of peak
Capacity additionsShare of peak
0
50
100
150
200
250
300
350
400
2017 2030 BaselineScenario
Efficient ACs Decarbonising power 2030 EfficientCooling Scenario
MtCO2

The Future of Cooling in China Energy use for cooling could swell by 2030 Delivering on action plans for sustainable air conditioning
PAGE | 41
IEA
. All
right
s re
serv
ed.
Energy-efficient cooling can benefit health and save money
The Efficient Cooling Scenario leads to additional benefits, including in particular improved air quality. Lower electricity demand, paired with higher shares of clean power, results in a nearly 30% reduction in major pollutant emissions by 2030 compared with the Baseline Scenario (Figure 42). Around half of the reduction is from use of more efficient ACs.
Figure 42. Range of air pollution reduction from Baseline to Efficient Cooling Scenario, 2025 and 2030
Notes: kt = kilotonnes; CH4 = methane; SO2 = sulphur dioxide; NOx = nitrogen oxides; PM25 = particulate matter smaller than 2.5 micrometres in diameter. Source: Derived using data prepared by the International Institute for Applied Systems Analysis Air Quality and Greenhouse Gases programme under the project “Global HFC emission reductions and energy efficiency co-benefits in a 2100 time frame”.
More efficient ACs and cleaner power can result in significant air quality improvements.
Reduced electricity consumption also translates to lower investment in power generation and network capacity, which is then passed on to businesses and consumers in lower electricity prices. Capital and operational expenses for power generation in the Efficient Cooling Scenario are about USD 7 billion lower than the Baseline Scenario over the 2020-30 period. As a result, average annual spending per person on cooling is about 12% lower (Figure 43).
Figure 43. Per capita electricity cost to meet annual cooling demand in buildings, 2017-30
IEA 2019. All rights reserved.
Energy-efficient cooling reduces spending on electricity by about 12% in 2030.
0
20
40
60
80
100
120
140
2025 2030
kt
0
100
200
300
400
500
600
700
800
900
2025 2030
kt
0
20
40
60
80
100
120
140
160
2025 2030
kt
0
2
4
6
8
10
12
2025 2030
kt
CH4 SO2 NOx PM2.5
0
10
20
30
40
50
2017 2020 2023 2026 2029
USD
Baseline Scenario
Efficient CoolingScenario

The Future of Cooling in China Recommendations to unlock energy-efficient cooling Delivering on action plans for sustainable air conditioning
PAGE | 42
IEA
. All
right
s re
serv
ed.
Recommendations to unlock energy-efficient cooling
Effective policy action will be critical to curb the continued growth in demand for cooling services in China’s buildings sector and to achieve the outcomes described in the Efficient Cooling Scenario. Trends in recent years illustrate that the market will not move of its own volition to energy-efficient cooling equipment, nor is it likely that builders and architects will design around efficient and low-energy-intensity cooling in buildings.
China’s government can implement measures to enable and encourage energy-efficient cooling solutions and behaviour that will bring about a lasting reduction in energy demand for cooling services. Moreover, China’s track record with energy efficiency standards and building energy codes shows that such policy action works: multiple increases in equipment MEPS and building codes have delivered large and cost-effective energy savings in the past two decades. Strengthening and broadening the use of those measures can improve overall cooling comfort in China, without raising energy use.
Encourage “part time” and “part space” cooling behaviour
A large-scale survey in China found that split devices that provide cooling to individual rooms use one-third to one-tenth the energy consumption of centralised AC systems (Zhou et al., 2016). The reason for this difference was the unnecessary energy used to provide “full time” and “full space” cooling service regardless of occupant presence, despite occupancy rates in those buildings that were less than 30% (in terms of how often a room had someone in it). Detailed data from building energy consumption in Beijing show that central cooling systems operate around 3 000 hours per year, compared with no more than 200 hours for mini-split units in the same city (Hu, 2017; BERC, 2018).
China can encourage greater use of “part time” and “part space” operations across all equipment types, for instance urging or even requiring the use of occupancy sensors for centralised cooling systems. This can be achieved using “smart” sensors that use learning algorithms to predict cooling demand and avoid energy use when unnecessary. This can achieve fewer operation hours without impacting service quality or cooling comfort while also improving operational efficiencies. It can also be combined with building integrated energy storage solutions (e.g. chilled water or ice) and/or solar generation, using demand-side management to help curb the impact of cooling on electricity loads.

The Future of Cooling in China Recommendations to unlock energy-efficient cooling Delivering on action plans for sustainable air conditioning
PAGE | 43
IEA
. All
right
s re
serv
ed.
Raise energy performance standards The evolution of AC efficiency in China has slowed in recent years, and the average performance of equipment sales is now very close to the last revision of MEPS. China currently has in place standards for more than ten cooling product categories and some are far behind market-available potential. China can strengthen existing performance standards to narrow that gap and drive AC performance towards best available technology. This includes benchmarking across product categories to affect energy efficiency gains that are not reflected in current MEPS. For example, the cost of a 1-tonne variable-speed AC is typically in the range of USD 300-1 950, while less efficient fixed-speed units range are USD 250-600 (Park, Shah and Gerke, 2017). This suggests that it is already possible to buy higher-efficiency ACs at competitive costs, but product MEPS need to reflect this, forcing the market towards more efficient technology.
Existing performance standards and testing procedures can also be revised to take into account actual operating conditions, such as AC performance at low loads. For example, China’s current standards use an IPLV to evaluate the energy performance of multi-split ACs (SAC, 2008). However, the IPLV assumes that ACs operate between 50% and 75% load around 80% of the time (SAC, 2010b) which is quite different from operating conditions measured during actual use (Figure 22). China’s government can work with manufacturers to revise its standards to reflect this gap and identify solutions that lead to real-time energy savings, such as compressors that are designed for higher efficiencies when operating at low partial loads (Box 1). One such policy measure could be requiring data points at low partial load conditions in equipment testing requirements.
Box 1. New compressor design to match “part time” and “part space” profiles
Using data monitoring of actual occupant behaviour and equipment performance of multi-split AC installations in China, the Chinese manufacturer GREE has develop a new compressor design to solve the problem of “part time” and “part space” operations during which multi-split ACs are running at very low loads. The new compressor design uses both a large and a small cylinder operating in parallel. At high loads, both cylinders work simultaneously to meet the cooling service demand. However, at low loads, the large cylinder stops, allowing the smaller piston to operate independently with respect to the necessary cooling output. As a result, the energy performance is much higher and can be improved by as much as 130% compared with an ordinary multi-split AC when operating at very low (e.g. 10%) partial loads.
Source: GREE (2019), “GMV Zhirui frequency conversion variable capacity home central air conditioner”, www.gree.com.cn/pczwb/cpzx/greezykt/jyzykt/cpzx1/ktxl/detail-2883.shtml.
Pay attention to real-time system operating efficiency There appears to be a big gap between rated and operational efficiency of cooling equipment. Some of this is simply due to dirt accumulation and product wear over time, but most consumers are not aware that ACs need regular maintenance. Oversizing of equipment and proper installation can also contribute to lower real-time efficiencies. China’s government can work with manufacturers and other industry stakeholders to raise awareness about proper AC sizing, installation and maintenance. Education and training programmes can also ensure that building

The Future of Cooling in China Recommendations to unlock energy-efficient cooling Delivering on action plans for sustainable air conditioning
PAGE | 44
IEA
. All
right
s re
serv
ed.
operators and AC technicians are familiar with measures that ensure the energy performance of equipment over its lifetime. This could be done through the establishment of a proper monitoring and inspection programme or through the Internet of things using smart ACs and cooling equipment to monitor real-time energy performance.
Effort is also needed to address cooling system performance relative to cooling equipment performance. While the efficiency of multi-split ACs and larger chiller equipment is typically higher than ordinary mini-split ACs, the overall operating efficiency of the cooling system is often low, due to a number of factors such as system design, operations and pumping needs. Policy can take into account the actual operational energy consumption of the system to address this gap. One such example is the 2016 Standard for Energy Consumption of Buildings (SAC, 2016) that takes into account real building energy consumption rather than the energy performance of individual building components. A worthwhile approach to reduce this gap is to work with relevant experts and technical bodies, such as the IEA Technology Collaboration Programme on Energy in Buildings and Communities,4 to identify appropriate energy policy and technical solutions to improve the energy performance of cooling systems.
Urge passive design and natural ventilation where possible
The way buildings are designed, built and operated can have a huge impact on the need for cooling and the subsequent energy used to provide cooling services. China has a strong record with building energy codes, especially policies addressing heating demand in buildings. Those policies can be expanded to address rapidly growing cooling demand, building upon component-based performance requirements (e.g. the insulative value of windows) as well as overall building energy performance standards to include cooling energy needs.
Low-emissivity windows are one such technology that can be prescribed to reduce the need for cooling in buildings, especially for buildings with large window surfaces. This technology reflects solar heat gain without affecting the entry of visible light and can reduce cooling loads by around 20% or more compared with ordinary glass (Bu, Mao and Yang, 2005). Yet low-emissivity windows are not currently required as part of wider window energy performance standards.
Further attention is needed to include the long-term benefits of measures that reduce cooling demand in building design. For example, adjustable shading using awnings and overhangs is generally considered from an aesthetic perspective, while the value it provides to overall thermal comfort and cooling energy needs is underestimated or ignored. Revision of building codes to include passive measures can encourage uptake of these simple and generally low-cost solutions. This includes design requirements (prescriptive or performance-based) that take into account future cooling needs and that seek to limit overall cooling energy consumption.
Building design requirements can equally promote integrated energy solutions such as solar panels on building roofs and facades that provide both energy production and shading. This can be paired with building-integrated storage (e.g. using phase-changing materials, ice storage or chilled water) to provide flexibility for cooling needs – for instance, solar energy to produce chilled water that is used later in the evening for cooling – and that meet other building energy needs. For
4 For more information, see: www.iea-ebc.org.

The Future of Cooling in China Recommendations to unlock energy-efficient cooling Delivering on action plans for sustainable air conditioning
PAGE | 45
IEA
. All
right
s re
serv
ed.
example, the IEA Technology Collaboration Programme on Solar Heating and Cooling is assessing the performance of building elements that use or control incident solar energy to provide heating, cooling and ventilation while reducing overall energy demand (IEA SHC, 2018).5
Cool roofs and urban vegetation are two additional features that can reduce cooling energy demand. Cool roofs, reflective surfaces and other vegetated (i.e. green) space are still uncommon in building design in China, partly because of perceived costs and lack of promotion with developers (Chen et al., 2019). Yet they can help reduce overall cooling loads, while greater vegetation in cities and better urban design can increase airflow and ventilation to reduce cooling energy demand (Javanroodi, Mahdavinejad and Nik, 2018).
Ventilation of buildings is another important factor for cooling comfort and can include both mechanical and natural techniques to remove heat from interior spaces. Building design and urban planning both play a strong role in the need for mechanical ventilation, and when done well, natural ventilation can supply high air exchanges to provide cooling comfort without any energy use. Simulation of well-designed natural ventilation in three different cities in moderate climate zones identified savings between 13 kWh/m2 and 44 kWh/m2 in net energy consumption per year (Schulze and Eicker, 2013). Field tests of 58 office buildings in China similarly found that use of natural ventilation through building design could reduce the overall hours of air-conditioning service by as much as 40% while achieving the same indoor comfortable level (Hu, 2016).
Promote suitable indoor comfort levels Indoor comfort is widely discussed, although it is difficult to assess with respect to individual occupant satisfaction and can impact occupant health (Arens et al., 2010; Cao et al., 2013). Generally speaking, slight changes (e.g. 0.5-1°C) in indoor temperature do not lead to a significant difference in occupant satisfaction with overall comfort levels, while further changes may be possible, depending on occupant feeling of thermal comfort. Yet raising temperature set points can save considerable amounts of energy for cooling services. For example, increasing the cooling set point from 22°C to 25°C can cut average cooling energy use by about 30% (Hoyt, Arens and Zhang, 2015). Higher temperatures could also reduce the number of cooling operation hours by almost half (Figure 44).
While specific temperature set points depend on building occupant preferences, China’s government can still work with AC manufacturers, building operators and other stakeholders to promote suitable indoor comfort levels. This could build upon existing policies, such as the temperature advisory, to require default temperature settings of 26°C for new AC sales, which can later be lowered depending on occupant comfort. Awareness campaigns, for instance using labelling on ACs or other information outlets, can equally promote suitable comfort levels by informing consumers of the energy (and economic) savings of higher temperature set points. This is equally something China could add to its well-recognised QR code on appliance labels.
5 For further information, see: www.iea-shc.org.

The Future of Cooling in China Recommendations to unlock energy-efficient cooling Delivering on action plans for sustainable air conditioning
PAGE | 46
IEA
. All
right
s re
serv
ed.
Figure 44. Annual cooling hours and electricity use at different temperature settings in office buildings
Source: Qin et al. (2007), “Influence of raising set temperature of air conditioning systems in summer on energy consumption of office buildings”.
Indoor temperature settings impact the number of operating hours and total electricity consumption for cooling in buildings, where higher temperatures can dramatically reduce cooling energy demand.
Additional measures include working with utility companies to reward consumers that reduce their energy consumption for cooling. For example, the Pacific Gas and Electric Company (PG&E) in California has a “Cool Savers” programme that helps homeowners to replace their AC, HVAC system or thermostat with a smarter, more efficient one and to improve the energy performance of their home. As part of the programme, there is a “Cool Rewards” incentive of up to USD 1 000 for the top 100 energy savers each year.6
China can also work collaboratively with industry and other countries to improve cooling comfort in buildings through improved technology solutions. One such example is treatment of latent heat (humidity) to provide thermal comfort at higher temperature settings. Most AC technology in use today treats latent heat through cooling-based dehumidification (i.e. lowering temperatures to 5-7°C to condense water vapour) at the sacrifice of energy performance, as the AC treats the sensible and latent heat simultaneously. Alternative solutions such as solid or liquid desiccants exist to treat latent heat, but further innovation is needed to deliver appropriate solutions without sacrificing comfort, compactness, efficiency or affordability. Collaborative efforts, such as the work being led by the IEA Technology Collaboration Programmes on Heat Pumping Technologies and on Energy Storage on the “Comfort and Climate Box”, can help to deliver high-performance and affordable solutions for cooling services in buildings.7
6 For more information, see: www.coolhomesavers.com/. 7 For further information, see: https://heatpumpingtechnologies.org/ and https://iea-eces.org/.
0
200
400
600
800
1 000
1 200
1 400
24°C 26°C 28°C
Runn
ing
hour
s
0
10
20
30
40
50
60
70
24°C 26°C 28°C
MW
h

The Future of Cooling in China Recommendations to unlock energy-efficient cooling Delivering on action plans for sustainable air conditioning
PAGE | 47
IEA
. All
right
s re
serv
ed.
Work with manufacturers to enable demand-side response
Energy-efficient air conditioning is the pillar of the Efficient Cooling Scenario, although millions of efficient ACs operating at the same time in China still will affect electricity systems during peak demand periods and extreme heat events. To address the impact of peak electricity demand from cooling in buildings, China can work with manufacturers and utilities to enable demand-side response that increases flexibility within the power system.
Australia has been working for over ten years on standards and programmes to enable demand response. One example is the PeakSmart demand response programme run by Energex.8 The programme works with consumers to purchase air-conditioning equipment that is connected through a signal receiver fitted into the compressor and that can be managed by Energex to reduce electricity demand during peak times, with financial rewards for consumers9. Consumers are incentivised through a reward of 200 Australian dollars (AUD) (4-10kWc) or AUD 400 (>10kWc) upon purchase of a PeakSmart AC, with over 87 000 ACs connected to date through the programme. When the network reaches peak demand, Energex sends a remote signal via the power supply to the receiver telling the air conditioner to cap its energy consumption. During a heat wave in 2018, Energex was able to cap the energy consumption of those PeakSmart ACs to 50%, reducing demand on the network while allowing customers to stay cool. This reduced the number of fuse faults and kept the electricity supply on for customers even during the extreme demand.
Several demand-side strategies can be introduced with different purposes (e.g. maximising the quota covered by renewable energy or achieving overall costs) with different results. As an example, the peak electricity load on a summer weekday in China in 2030 is reduced by 45 GWe thanks to improved AC efficiencies and building design. This could be reduced even further by an additional 15% using connected, responsive ACs (Figure 45).
Smart, responsive ACs can help to move from “part time” and “part space” to “right time” “right place”. Many Chinese manufacturers already offer a wide range of “smart” appliances that can be connected with mobile applications and be remote-controlled (primarily by client control for the moment). Those products also are typically affordable,10 although they are still a niche market. Achieved at scale, such demand-side response enabled through connected ACs could significantly advance power system flexibility.
China can encourage deployment of demand-side response in cooling equipment through standardisation of interfaces that are built into appliances. For example, ACs sold in Australia increasingly have a standard built-in interface that will allow them to connect to a communications system and participate in demand response schemes. 11 Other standards schemes, such as the ENERGY STAR label, are applying specifications for optional reporting on smart grid controllability to encourage greater deployment of smart equipment.
8 For additional information, see: www.energex.com.au/home/control-your-energy/positive-payback-program/positive-payback-for-households/air-conditioning-rewards. 9 For more information, see: www.ergon.com.au/__data/assets/pdf_file/0019/424117/EGE171030-peaksmart-factsheet-FINAL.pdf. 10 Xiaomi’s smart AC goes for as little as RMB 2 199 (about USD 324): https://goo.gl/dsmNJX. 11 The joint Australian/New Zealand Standard (AS/NZS 4755.1:2017) was approved in 2016. See: https://shop.standards.govt.nz/catalog/4755.1:2017(AS%7CNZS)/scope?.
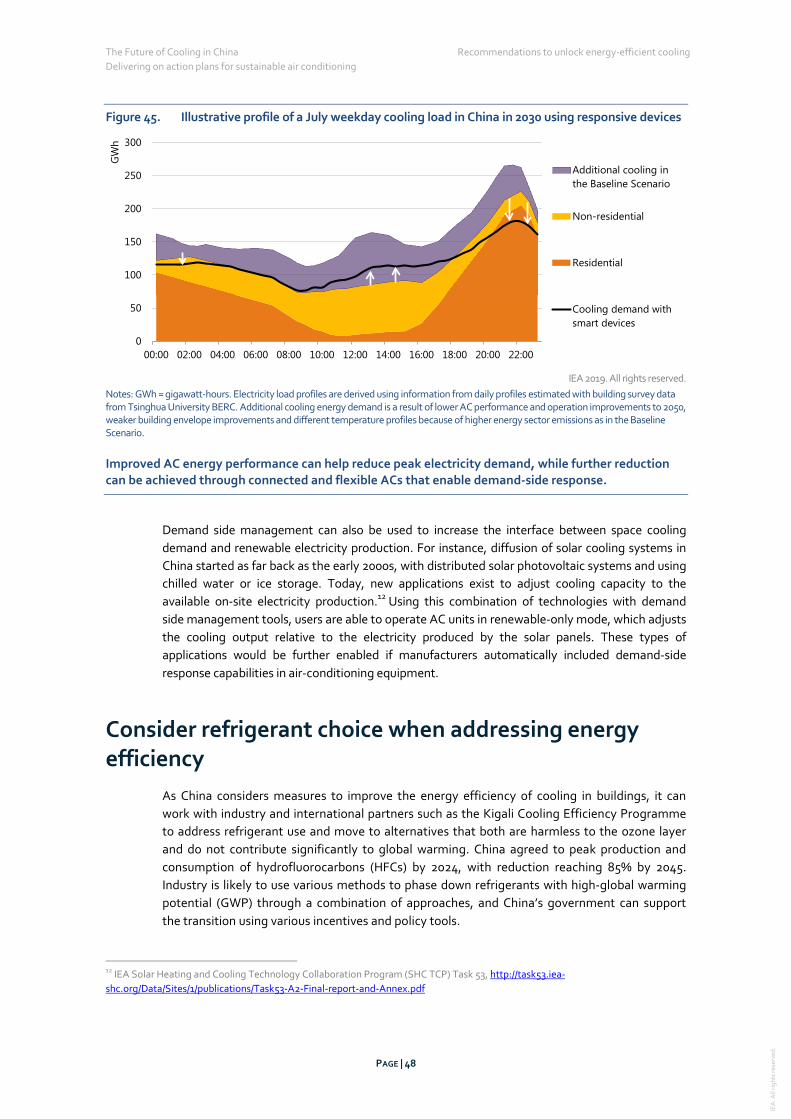
The Future of Cooling in China Recommendations to unlock energy-efficient cooling Delivering on action plans for sustainable air conditioning
PAGE | 48
IEA
. All
right
s re
serv
ed.
Figure 45. Illustrative profile of a July weekday cooling load in China in 2030 using responsive devices
IEA 2019. All rights reserved.
Notes: GWh = gigawatt-hours. Electricity load profiles are derived using information from daily profiles estimated with building survey data from Tsinghua University BERC. Additional cooling energy demand is a result of lower AC performance and operation improvements to 2050, weaker building envelope improvements and different temperature profiles because of higher energy sector emissions as in the Baseline Scenario.
Improved AC energy performance can help reduce peak electricity demand, while further reduction can be achieved through connected and flexible ACs that enable demand-side response.
Demand side management can also be used to increase the interface between space cooling demand and renewable electricity production. For instance, diffusion of solar cooling systems in China started as far back as the early 2000s, with distributed solar photovoltaic systems and using chilled water or ice storage. Today, new applications exist to adjust cooling capacity to the available on-site electricity production.12 Using this combination of technologies with demand side management tools, users are able to operate AC units in renewable-only mode, which adjusts the cooling output relative to the electricity produced by the solar panels. These types of applications would be further enabled if manufacturers automatically included demand-side response capabilities in air-conditioning equipment.
Consider refrigerant choice when addressing energy efficiency
As China considers measures to improve the energy efficiency of cooling in buildings, it can work with industry and international partners such as the Kigali Cooling Efficiency Programme to address refrigerant use and move to alternatives that both are harmless to the ozone layer and do not contribute significantly to global warming. China agreed to peak production and consumption of hydrofluorocarbons (HFCs) by 2024, with reduction reaching 85% by 2045. Industry is likely to use various methods to phase down refrigerants with high-global warming potential (GWP) through a combination of approaches, and China’s government can support the transition using various incentives and policy tools.
12 IEA Solar Heating and Cooling Technology Collaboration Program (SHC TCP) Task 53, http://task53.iea-shc.org/Data/Sites/1/publications/Task53-A2-Final-report-and-Annex.pdf
0
50
100
150
200
250
300
00:00 02:00 04:00 06:00 08:00 10:00 12:00 14:00 16:00 18:00 20:00 22:00
GW
h
Additional cooling inthe Baseline Scenario
Non-residential
Residential
Cooling demand withsmart devices

The Future of Cooling in China Recommendations to unlock energy-efficient cooling Delivering on action plans for sustainable air conditioning
PAGE | 49
IEA
. All
right
s re
serv
ed.
Industry efforts to date have focused on the suitability of alternate refrigerants, including the Air-Conditioning, Heating and Refrigeration Institute (AHRI) low-GWP Alternative Refrigerants Evaluation Program (AREP), the Promoting low-GWP Refrigerants for Air-Conditioning Sectors in High-Ambient Temperature Countries (PRAHA), and the Egyptian Programme for Promoting Low-GWP Refrigerants’ Alternatives (Egypra). Results of these programmes have shown that low-GWP alternatives typically perform (in terms of energy efficiency) in a range between +/- 5-10% relative to the baseline HFC refrigerants, suggesting that they would likely have similar or higher cooling capacity if commercialised. However, many new low-GWP refrigerants are likely to be flammable or mildly flammable (Kujak, 2017). China’s government can support further research and development of potential alternatives, working with industry to bring those alternatives to market and enable their deployment at scale.
China can also work with industry, AC technicians and related building operators to reduce refrigerant leakage and ensure proper refrigerant recovery. Cooling equipment types have different charge sizes and leakage rates (IIR, 2014), but proper installation and maintenance practices by trained technicians can serve to reduce the leakage of GWP refrigerants. China can promote best practices such as those described by the American Society of Heating, Refrigerating and Air-Conditioning Engineers’ (ASHRAE’s) Refrigeration Commissioning Guide for commercial and industrial systems.
Proper end-of-life recovery programmes for refrigerants are also necessary to minimise the release of refrigerants to the atmosphere. China can work with industry and technicians to ensure proper recovery using tools such as enhanced producer responsibility schemes, where manufacturers include the costs of the end-of-life collection and recycling of the appliances in the sales price. These costs are used to fund the proper end-of-life collection and treatment of the appliances. In addition, China’s government and industry can raise awareness among consumers to encourage appropriate recycling of equipment.
China can equally work with industry and international partners to identify and deploy cooling technology that is not based on a vapour compression cycle as an alternative to phase down HFC refrigerants, such as indirect evaporative cooling, absorption chillers, and liquid desiccant or desiccant wheels (Box 2). Many such technologies are already commercially available including direct, indirect and M-cycle evaporative coolers, absorption chillers, and thermoelectric and magnetocaloric coolers. However, some of these technologies have limitations to their application, and cost and scalability can be barriers to deployment.
Box 2. Alternative cooling technologies
Multiple solutions exist to provide cooling comfort in buildings. In dry climate regions, for example, if the dew point is below 12°C, indoor moisture can be removed using outdoor air, eliminating the need for refrigeration. Cooling comfort in those conditions can be achieved using 15-18°C chilled water produced by evaporative cooling. The evaporative device (or cooling tower) takes advantage of water’s absorption of a relatively large amount of heat in order to evaporate, thus avoiding the need for cooling using a vapour compression cycle with a refrigerant. Evaporative cooling also typically provides cooling comfort using much less energy than an AC, although it is dependent on the relative humidity. About 40% of regions in the world that require cooling could apply this technique (Jiang and Xie, 2010).
Another option is an absorption chiller, which is a heat-driven cooling technology that uses a refrigerant (typically lithium bromide) and an absorbent (water), eliminating the need for GWP refrigerant. Other

The Future of Cooling in China Recommendations to unlock energy-efficient cooling Delivering on action plans for sustainable air conditioning
PAGE | 50
IEA
. All
right
s re
serv
ed.
options include lithium chloride and water or ammonia and water, often used for cooling applications at temperatures below 0°C. Such chillers can be fuelled by gas or other sources of heat, such as industrial excess heat or solar thermal energy, which replaces the electricity used by a mechanical compressor.
In conditions with high latent loads (e.g. humid climates), dehumidification is important and can be achieved through chilled water produced by a dessicant wheel or liquid desiccant. Desiccant materials can be both liquid and solid sorbents (e.g. silica gel) that are regenerated after removing moisture from the air by using heat (e.g. solar thermal energy) to remove the water from the moisture-loaded desiccant. The use of a desiccant can reduce sizing needs (i.e. cooling capacity) for conventional air-conditioning equipment and increase overall system efficiencies by avoiding simultaneous treatment of sensible and latent loads (requiring ACs to cool to water’s condensing point).

The Future of Cooling in China Conclusions Delivering on action plans for sustainable air conditioning
PAGE | 51
IEA
. All
right
s re
serv
ed.
Conclusions
Cooling demand in China is set to increase even more substantially in the coming decade, especially as urban residential and commercial households move towards more energy-intensive cooling behaviour and as summer heat drives up demand for cooling services. China can take immediate action to rein in the growth in energy use while allowing for continued improvement in thermal comfort. Well-defined policy actions can deliver significant energy savings and cost savings and reduced local air pollution by ensuring the widespread deployment of high-performance cooling, including the equipment and systems themselves, as well as measures to improve building design and address the underlying need for cooling energy use.
Achieving the Efficient Cooling Scenario will require assertive and balanced policy support, working with AC manufacturers, the cooling industry and other buildings sector stakeholders. As China moves forward with its action plans for sustainable cooling, it should consider the following actions:
Introduce a comprehensive national policy framework that sets forth clear regulations, information programmes and industry incentives to reduce cooling-related energy consumption and refrigerant emissions.
Ensure the framework takes into account the multiple opportunities for energy efficiency, including both equipment and system energy use during real-time operations.
Strengthen current regulatory measures for cooling MEPS across all product types and improve building energy codes to address the underlying need for cooling services.
Work with industry to improve awareness of consumers and building operators on AC maintenance, behaviour and operations, including better information on product labelling.
Support training and capacity-building efforts to educate architects, engineers and cooling-system installers on design techniques and building practices that reduce cooling energy demand.
Develop financial incentives for energy efficiency, including financial backing for energy service companies and other institutions that supply or finance the purchase of efficient cooling technologies and building measures.
Work with industry and international partners to advance cooling research, focusing on emerging technologies that have the potential to lower energy and emissions from cooling, such as combined solar units and energy storage capacity with cooling devices.
Continue to improve data collection and statistics on cooling energy consumption and behaviour that can be used by utilities, industry, government, and university researchers to identify emerging trends, technology gaps and innovation opportunities.

The Future of Cooling in China References Delivering on action plans for sustainable air conditioning
PAGE | 52
IEA
. All
right
s re
serv
ed.
References
Arens, E. et al. (2010), “Are ‘class A’ temperature requirements realistic or desirable?”, Building and Environment, Vol. 45/1, pp. 4-10, https://doi.org/10.1016/j.buildenv.2009.03.014.
BERC (Tsinghua University Building Energy Research Center) (2018), Annual Report on China Building Energy Efficiency, China Architecture & Building Press, Beijing, http://book.cabplink.com/bookdetail.jsp?id=66111&nodeid=1439
BERC (2017), Annual Report on China Building Energy Efficiency, China Architecture & Building Press, Beijing, http://book.cabplink.com/bookdetail.jsp?id=64260&nodeid=1439.
BERC (2010), Annual Report on China Building Energy Efficiency, China Architecture & Building Press, Beijing, http://book.cabplink.com/bookdetail.jsp?id=31862&nodeid=1439.
Bu, Z., H. Mao and H. Yang (2005), “Influence of Low-e glass on air conditioning load and building energy consumption”, HVAC, Vol. 25/8, pp. 119-121, www.airitilibrary.com/Publication/alDetailedMesh?docid=10028501-200508-35-8-119-121-a.
Cao, B. et al. (2013), “The impact of air-conditioning usage on sick building syndrome during summer in China”, Indoor and Built Environment, Vol. 22/3, pp. 490–497, https://doi.org/10.1177/1420326X12443246.
Chen, X. et al. (2019), “What are the root causes hindering the implementation of green roofs in urban China?”, Science of the Total Environment, Vol. 654, pp. 742- 750, https://doi.org/10.1016/j.scitotenv.2018.11.051.
Cheng, J. (2018), Report on Real-time Operation Status of China’s Air Conditioning, Standards Press of China, Beijing.
CLASP (2016), Market Analysis of China Energy Efficient Products, CLASP, Washington, DC, https://clasp.ngo/publications/market-analysis-of-china-energy-efficient-products.
GREE (2019), “GMV Zhirui frequency conversion variable capacity home central air conditioner”, www.gree.com.cn/pczwb/cpzx/greezykt/jyzykt/cpzx1/ktxl/detail-2883.shtml.
He, S. et al. (2015), “Study on energy efficiency decay of on-duty room air conditioners”, Refrigeration, Vol. 34/1, pp. 7-13, http://en.cnki.com.cn/Article_en/CJFDTotal-ZLZZ201501002.htm.
Hoyt, T., E. Arens and H. Zhang (2015), “Extending air temperature setpoints: Simulated energy savings and design considerations for new and retrofit buildings”, Building and Environment, Vol. 88, pp. 89-96, http://dx.doi.org/10.1016/j.buildenv.2014.09.010.
Hu, S. (2017), Research on China’s Building Energy Conservation Path from the Perspective of Ecological Civilization, Tsinghua University, Beijing, http://eproxy2.lib.tsinghua.edu.cn/rwt/119/http/GE5DMLSSGEZT6MJTGAYDIMC/Thesis/Thesis/ThesisSearch/Search_DataDetails.aspx?dbcode=ETDQH&dbid=7&sysid=251390.
Hu, S. (2016), Best Practice for China’s Building Energy Conservation, China Architecture & Building Press, Beijing. http://book.cabplink.com/bookdetail.jsp?id=62517&nodeid=1439.
Hu, S. et al. (2017), “A survey on energy consumption and energy usage behavior of households and residential building in urban China”, Energy and Buildings, Vol. 148, pp. 366-378, https://doi.org/10.1016/j.enbuild.2017.03.064.

The Future of Cooling in China References Delivering on action plans for sustainable air conditioning
PAGE | 53
IEA
. All
right
s re
serv
ed.
Hu, P., Z. Jiang and Y. Leng (2004), “Investigation of thermal environment and energy consumption for Hubei residences”, Heating, Ventilation and Air Conditioning, Vol. 34, pp. 21–22. http://kns.cnki.net/KCMS/detail/detail.aspx?dbcode=CJFQ&dbname=CJFD2004&filename=NTKT200406004&v=MTIzODV4WVM3RGgxVDNxVHJXTTFGckNVUkxPZll1WnJGeWpuVUxySUt6bkFlckc0SHRYTXFZOUZZSVI4ZVgxTHU=.
IEA (International Energy Agency) (2018), The future of cooling: Opportunities for energy-efficient air-conditioning, Paris, https://webstore.iea.org/the-future-of-cooling.
IEA SHC (IEA Technology Collaboration Programme on Solar Heating and Cooling) (2018), “SHC Task 56: Building integrated solar envelope systems”, http://task56.iea-shc.org/.
IIASA (International Institute for Applied Systems Analysis) (2019), “Global HFC emission reductions and energy-efficiency co-benefits in a 2100 time frame”, Air Quality and Greenhouse Gases Program.
IIR (International Institute of Refrigeration) (2014), “Containment of refrigerants within refrigeration, air conditioning and heat pump systems”, IIR, Paris, www.iifiir.org/userfiles/file/publications/notes/NoteTech_24_EN.pdf.
IPCC (Intergovernmental Panel on Climate Change) (2014), “Climate change 2014: Synthesis report summary for policymakers”, www.ipcc.ch/site/assets/uploads/2018/02/AR5_SYR_FINAL_SPM.pdf.
Javanroodi, K., M. Mahdavinejad and V.M. Nik (2018), “Impacts of urban morphology on reducing cooling load and increasing ventilation potential in hot-arid climate”, Applied Energy, Vol. 231, pp. 714-746, https://doi.org/10.1016/j.apenergy.2018.09.116.
Jiang, Y. and X. Xie (2010), “Theoretical and testing performance of an innovative indirect evaporative chiller”, Solar Energy, Vol. 84, pp. 2041-2055, https://doi.org/10.1016/j.solener.2010.09.012.
Kujak, S. “Flammability and new refrigerant options”, ASHRAE Journal, https://www.trane.com/content/dam/Trane/Commercial/global/products-systems/education-training/industry-articles/ASHRAE052017_Kujak_Refrigerants.pdf.
Li, Z. (2012), Investigation and Analysis of the Relationship between Residential Energy Use Behavior and Energy Consumption in China, Tsinghua University, Beijing. http://kns.cnki.net/KCMS/detail/detail.aspx?dbcode=CMFD&dbname=CMFD201302&filename=1013016733.nh&v=MjQ4MThNMUZyQ1VSTE9mWXVackZ5dmtWYjNQVkYyNkhiTzVHTmJQckpFYlBJUjhlWDFMdXhZUzdEaDFUM3FUclc=.
Li, Z. (2007), Study on life cycle energy consumption and resource consumption of air conditioning in urban residential buildings in China, Tsinghua University. http://kns.cnki.net/KCMS/detail/detail.aspx?dbcode=CDFD&dbname=CDFD0911&filename=2009055435.nh&v=MjU3NzBoMVQzcVRyV00xRnJDVVJMT2ZZdVpyRnl2bFU3L0lWMTI3RjdPOUc5WFBxcEViUElSOGVYMUx1eFlTN0Q=.
Li, Z. and Y. Jiang (2009), “Analysis on cooling energy consumption of residential buildings in China’s urban areas”, Heating Ventilating & Air Conditioning, Vol. 39, pp. 82-88, http://kns.cnki.net/KCMS/detail/detail.aspx?dbcode=CJFD&dbname=CJFD2009&filename=NTKT200905026&v=MjUyMjFYMUx1eFlTN0RoMVQzcVRyV00xRnJDVVJMT2ZZdVpyRnl2bFVMM0xLem5BZXJHNEh0ak1xbzlIWW9SOGU=.
Long, W., T. Zhong and B. Zhang (2004), “China: The issue of residential air conditioning”, International Institute of Refrigeration Bulletin, Vol. 84, pp. 4-14. http://www.iifiir.org/medias/medias.aspx?instance=EXPLOITATION&SETLANGUAGE=EN
Ma, B. et al. (2006), “Investigation and analysis on summer energy consumption structure of energy efficient residential buildings in Xi’an”, Texas A&M University, https://core.ac.uk/download/pdf/79624481.pdf.

The Future of Cooling in China References Delivering on action plans for sustainable air conditioning
PAGE | 54
IEA
. All
right
s re
serv
ed.
NCAR (National Center for Atmospheric Research) (2012), GIS Program Climate Change Scenarios, https://gisclimatechange.ucar.edu/.
NOAA (National Oceanic and Atmospheric Administration) (2018), Global Surface Summary of the Day –GSOD, 1990-2018, https://data.noaa.gov/dataset/dataset/global-surface-summary-of-the-day-gsod.
Park, W.Y., N. Shah and B. Gerke (2017), “Assessment of commercially available energy-efficient room air conditioners including models with low global warming potential (GWP) refrigerants”, Lawrence Berkeley National Laboratory, https://escholarship.org/uc/item/01h8g7zb.
Qin, R. et al. (2007), “Influence of raising set temperature of air conditioning systems in summer on energy consumption of office buildings”, Heating Ventilating & Air Conditioning, Vol. 37/8, pp. 33-37. http://kns.cnki.net/KCMS/detail/detail.aspx?dbcode=CJFQ&dbname=CJFD2007&filename=NTKT200708011&uid=WEEvREdxOWJmbC9oM1NjYkZCbDdrdWdXNFk5SHZHb2QzY3ZFd1RqcEtFalM=$R1yZ0H6jyaa0en3RxVUd8df-oHi7XMMDo7mtKT6mSmEvTuk11l2gFA!!&v=MjQ1MjNVUkxPZll1ZHBGQ3JoVnI3TUt6bkFlckc0SHRiTXA0OUVaWVI4ZVgxTHV4WVM3RGgxVDNxVHJXTTFGckM=.
Ren, J. et al. (2003), “Analysis and study on energy consumption for air conditioners for residential buildings in Guangzhou”, Walling Material Innovation and Energy Saving Conservation of Buildings, Vol. 4, pp. 34-37, http://kns.cnki.net/KCMS/detail/detail.aspx?dbcode=CJFQ&dbname=CJFD2003&filename=QCGJ200304019&v=MDQ4OTZyV00xRnJDVVJMT2ZZdVpyRnlqaFVyM01OQzdNWkxHNEh0TE1xNDlFYllSOGVYMUx1eFlTN0RoMVQzcVQ=.
SAC (Standardization Administration of China) (2016), “Standard for energy consumption of building”, GB/T51161-2016, www.codeofchina.com/standard/GBT51161-2016.html.
SAC (2013), “Minimum allowable values of the energy efficiency and energy efficiency grades for variable speed room air conditioners”, GB 21455-2013, www.codeofchina.com/standard/GB21455-2013.html.
SAC (2010a), “The minimum allowable values of the energy efficiency and energy efficiency grades for room air conditioners”, GB 12021.3-2010, www.codeofchina.com/standard/GB12021.3-2010.html.
SAC (2010b), “Standard for unitary air conditioners”, GB/T 17758-2010, www.codeofchina.com/standard/GBT17758-2010.html.
SAC (2008), “The minimum allowable values of the IPLV and energy efficiency grades for multi-connected air-condition (heat pump) unit”, GB 21454-2008, www.codeofchina.com/standard/GB21454-2008.html.
SAC (2004), “The minimum allowable values of the energy efficiency and energy efficiency grades for room air conditioners”, (GB 12021.3-2004), www.codeofchina.com/standard/GB12021.3-2004.html.
Schulze, T. and U. Eicker (2013), “Controlled natural ventilation for energy efficient buildings”, Energy and Buildings, Vol. 56, pp. 221-232, https://doi.org/10.1016/j.enbuild.2012.07.044.
SIC (State Information Center) (2018), “Household central air conditioning development trend report 2018”, www.sic.gov.cn/archiver/SIC/UpFile/Files/Default/20180608101438203978.doc.
State Grid Corporation of China (2017), “Science and Technology Daily: How power grids cope with record-breaking peak load in 2017”, www.sgcc.com.cn/ywlm/mediacenter/corporatenews/08/341409.shtml.
Wang, W. (2017), 2016 China Air Conditioning Market Yearbook, http://cyfd.cnki.com.cn/N2017030243.htm.

The Future of Cooling in China References Delivering on action plans for sustainable air conditioning
PAGE | 55
IEA
. All
right
s re
serv
ed.
Wu, X. (2005), Residential building energy consumption in Hangzhou and energy conservation technology, Zhejiang University. http://kns.cnki.net/KCMS/detail/detail.aspx?dbcode=CMFD&dbname=CMFD0506&filename=2005042122.nh&v=MDc2NTExVDNxVHJXTTFGckNVUkxPZll1WnJGeXZsVXI3UFYxMjdHN084SE5ET3JaRWJQSVI4ZVgxTHV4WVM3RGg=.
Xu, Z. et al. (2018), “Big data analysis on usage state and energy consumption of residential air conditioners in the Yangtze River basin”, Journal of HV & AC, www.hvacjournal.cn/Category_709/N_7648.aspx.
Zhou, X. et al. (2016), “Influence of household air-conditioning use modes on the energy performance of residential district cooling systems”, Building Simulation, Vol. 9/4, pp. 429-441, https://doi.org/10.1007/s12273-016-0280-9.

The Future of Cooling in China Acronyms and units of measure Delivering on action plans for sustainable air conditioning
PAGE | 56
IEA
. All
right
s re
serv
ed.
Acronyms and units of measure
AC air conditioner AHRI Air-Conditioning, Heating and Refrigeration Institute APF annual performance factor AREP Alternate Refrigerant Evaluation Program ASHRAE American Society of Heating, Refrigerating and Air-Conditioning Engineers BERC Building Energy Research Center CDDs cooling degree days CH4 methane CO2 carbon dioxide EER energy efficiency ratio Egypra Egyptian Programme for Promoting Low-GWP Refrigerants’ Alternatives GWP global warming potential HFC hydrofluorocarbon HSCW hot summer and cold winter HSWW hot summer and warm winter HVAC heating, ventilation and air conditioning IEA International Energy Agency IPLV integrated part load value MEPS minimum energy performance standards NOx nitrogen oxides PG&E Pacific Gas and Electricity PM2.5 particulate matter smaller than 2.5 micrometres in diameter PRAHA Promoting low-GWP Refrigerants for Air-Conditioning Sectors in High-Ambient
Temperature Countries RCP Representative Concentration Pathway RMB Yuan renminbi SO2 sulphur dioxide GWc gigawatts of cooling capacity GWe gigawatt of electric capacity GWh gigawatt-hour kt kilotonnes kWc kilowatts of cooling capacity kWh kilowatt-hours m2 square metre MtCO2 million tonnes of CO2 TWh terawatt-hours

The Future of Cooling in China Acknowledgements
Delivering on action plans for sustainable air conditioning
PAGE | 57
IEA
. All
rig
hts
res
erve
d.
Acknowledgements
This publication was prepared by the International Energy Agency (IEA) and the Tsinghua
University Building Energy Research Center (BERC). The report was prepared under the leadership
of Mechthild Wörsdörfer, Director of the IEA Directorate of Sustainability, Technology and
Outlooks, Timur Gül, Head of the IEA Energy Technology Policy Division, Professor Yi Jiang,
Director of the Tsinghua University BERC and Professor Da Yan, Head of BERC Designer’s
Simulation Tookit Development Group (DeST Group). The report was led by John Dulac (IEA) and
Shan Hu (BERC) and written by Chiara Delmastro (IEA), Yang Zhang (BERC) and Ailin Huang
(IEA).
The report benefited from valuable inputs and comments from other experts within the IEA and
BERC, including, Thibaut Abergel, Brian Dean, Timothy Goodson, Maxine Jordan, Kevin Lane,
Melanie Slade and Uwe Remme (IEA), and Siyue Guo, Zhaohan Nan, Mingyang Qian and Baolong
Wang (BERC). Special thanks to Pengcheng Li (China National Institute of Standardization) for his
support of this analysis and kind review of the report. Thanks also go to Astrid Dumond, Katie
Lazaro, Therese Walsh and Clara Vallois of the IEA Communications and Digital Office for their
help in producing this publication. Tsinghua BERC also gratefully acknowledges support of this
research from the 13th Five-Year National Science and Technology Major Project of China (Grant
No. 2018YFC1509006).
Several experts outside the IEA and BERC also provided input, commented on the underlying
analytical work and reviewed the report. Their contributions were of great value. Those people
include: Quan Bai (Energy Research Institute [ERI] of the National Development and Reform
Commission [NDRC]), Jianhong Cheng (China National Institute of Standardization), Gabrielle
Dreyfus (Institute for Governance and Sustainable Development), Lena Hoglund (International
Institute for Applied Systems Analysis [IIASA]), HuMin Hu (ClimateWorks Foundation), Lijing Gu
(NDRC-ERI), Hua Liu (Gree), Daniel Mugnier (Tecsol), Pallav Purohit (IIASA), Wenxing Shi
(Tsinghua University) and Jianguo Zhang (NDRC-ERI).

The Future of Cooling in China Table of contents Delivering on action plans for sustainable air conditioning
PAGE | 58
IEA
. All
right
s re
serv
ed.
Table of contents
Abstract .................................................................................................................................................... 1 Executive summary .................................................................................................................................... 2 Findings and recommendations ................................................................................................................... 4 Delivering on sustainable air conditioning in China..................................................................................................... 5 Introduction ............................................................................................................................................. 11 Energy and emissions from cooling are on the rise....................................................................................... 12 Cooling demand in urban residential buildings is rising quickly ................................................................................. 15 Cooling in non-residential buildings is intensifying ................................................................................................... 16 The cooling market in China is evolving ...................................................................................................... 18 Occupant behaviour has a big impact on cooling energy use .................................................................................... 18 Larger cooling units are increasingly popular ........................................................................................................... 19 Energy consumption differs across cooling equipment ............................................................................................. 21 There is a gap between real and rated energy performance ..................................................................................... 23 The market is not keeping up with energy efficiency potential ................................................................................. 26 Building size and cooling system design affect energy intensity ............................................................................... 28 Cooling demand is expanding to different building types ......................................................................................... 30 Demand for cooling will indubitably grow to 2030 ....................................................................................... 31 Greater affordability of cooling will propel continued growth ................................................................................... 31 Changing occupant behaviour will impact cooling demand ...................................................................................... 33 Changing climate will increase overall need for cooling comfort ............................................................................... 34 Building design will affect the underlying need for cooling ....................................................................................... 36 Energy use for cooling could swell by 2030 .................................................................................................. 37 Changing behaviour could increase cooling demand further .................................................................................... 37 Efficiency can improve cooling services without growing energy .............................................................................. 38 Energy-efficient cooling can benefit health and save money .................................................................................... 41 Recommendations to unlock energy-efficient cooling ................................................................................. 42 Encourage “part time” and “part space” cooling behaviour ...................................................................................... 42 Raise energy performance standards ....................................................................................................................... 43 Pay attention to real-time system operating efficiency ............................................................................................ 43 Urge passive design and natural ventilation where possible ..................................................................................... 44 Promote suitable indoor comfort levels ................................................................................................................... 45 Work with manufacturers to enable demand-side response ..................................................................................... 47 Consider refrigerant choice when addressing energy efficiency ................................................................................ 48 Conclusions .............................................................................................................................................. 51 References ............................................................................................................................................... 52 Acronyms and units of measure ................................................................................................................. 56 Acknowledgements .................................................................................................................................. 57
List of figures Figure 1. Energy consumption for space cooling in buildings in China, 2000-2017 ................................................. 6 Figure 2. Evolving equipment choice in urban households in Beijing and Shanghai, 2000-18 ................................. 6 Figure 3. Range of energy performance for variable-speed mini-split ACs, 2015-17 ............................................... 7 Figure 4. Installed output capacity for space cooling equipment in the Baseline Scenario to 2030 ......................... 8 Figure 5. Electricity savings for cooling services in buildings to 2030 in the Efficient Cooling Scenario ................... 9 Figure 6. Power generation capacity for space cooling, 2017-30 .......................................................................... 10 Figure 7. Energy consumption for space cooling in buildings in China, 2000-17 ................................................... 12 Figure 8. Per capita and total energy used for cooling in selected countries/regions, 2000-17 .............................. 13 Figure 9. Share of cooling in increased electricity demand since 2000 and in the 2017 peak load ......................... 14

The Future of Cooling in China Table of contents Delivering on action plans for sustainable air conditioning
PAGE | 59
IEA
. All
right
s re
serv
ed.
Figure 10. Energy-related emissions from cooling and share of buildings emissions, 2000-17 ............................... 14 Figure 11. Cooling energy use in urban residential buildings by equipment type and resultant CO2 emissions,
2000-17 ............................................................................................................................................... 15 Figure 12. Average energy intensities by cooling equipment in residential buildings in Beijing, 2006 .................... 16 Figure 13. Cooling electricity consumption in non-residential buildings and share in 2017 ..................................... 17 Figure 14. Cooling behaviour in urban households by climate zone and equipment type, 2015 ............................. 18 Figure 15. Stock of air-conditioning systems in China, 2017 .................................................................................. 19 Figure 16. Major cooling devices in urban households in the different climate zones, 2015 ................................... 20 Figure 17. Evolving equipment choice in urban households in Beijing and Shanghai, 2000-18 ............................... 20 Figure 18. Average annual energy use for different mini-split units in the HSCW zone, 2016 ................................. 21 Figure 19. Average measured energy intensity of mini-split ACs and central HVAC systems by city ...................... 22 Figure 20. Result of nationwide questionnaire on decentralised and centralised cooling systems, 2015................. 22 Figure 21. Measured energy performance of fixed-speed mini-split ACs over 5 years relative to MEPS ................. 23 Figure 22. Operational conditions of multi-split ACs studied in China in 2016-17 ................................................... 24 Figure 23. Energy efficiency of common multi-split AC at different levels of cooling load ..................................... 24 Figure 24. Comparison between chiller EER and overall seasonal EER for the system ........................................... 25 Figure 25. Measured cooling electricity use by component for a chiller system in Henan, 2011.............................. 25 Figure 26. Range of energy performance for variable-speed mini-split ACs, 2015-17 ............................................. 26 Figure 27. Cooling efficiency of fixed-speed mini-split ACs, 2017 .......................................................................... 27 Figure 28. Cooling efficiency of large multi-split ACs, 2017 ................................................................................... 28 Figure 29. Range of cooling intensity of non-residential buildings in Beijing and Shanghai, 2015 .......................... 29 Figure 30. Growth of Type B non-residential buildings in Beijing, 2008-13 ............................................................ 29 Figure 31. Typical household ownership and number of units relative to income and CDDs .................................. 32 Figure 32. Household ownership of space cooling equipment in the Baseline Scenario to 2030 ............................. 32 Figure 33. Installed output capacity for space cooling equipment in the Baseline Scenario to 2030 ....................... 33 Figure 34. Measured cooling intensity of households in same building in Beijing, 2006 ......................................... 34 Figure 35. Daily average temperature between August and September in Shijiazhuang (Hebei) and Shaoguan
(Guangdong), 2030 projection relative to 2007-17................................................................................ 35 Figure 36. Total and per capita energy use and hours of use in the Baseline Scenario to 2030 ............................... 37 Figure 37. Cooling energy use in urban residential and commercial buildings to 2030 by intensity path ................ 38 Figure 38. Electricity savings for cooling services in buildings to 2030 in the Efficient Cooling Scenario ................. 39 Figure 39. Energy savings potential in urban residential and commercial buildings by 2030 .................................. 39 Figure 40. Power generation capacity for space cooling, 2017-30 .......................................................................... 40 Figure 41. Carbon emissions from electricity generation to meet the cooling demand, 2017-30 ............................ 40 Figure 42. Range of air pollution reduction from Baseline to Efficient Cooling Scenario, 2025 and 2030 ................ 41 Figure 43. Per capita electricity cost to meet annual cooling demand in buildings, 2017-30 ................................... 41 Figure 44. Annual cooling hours and electricity use at different temperature settings in office buildings ............... 46 Figure 45. Illustrative profile of a July weekday cooling load in China in 2030 using responsive devices ................. 48
List of boxes Box 1. New compressor design to match “part time” and “part space” profiles ............................................... 43 Box 2. Alternative cooling technologies.......................................................................................................... 49
List of tables Table 1. Air-conditioning units and cooling output capacity, 2000-17 ................................................................ 13 Table 2. Energy efficiency tiers and subsidies for variable-speed ACs, 2013 ....................................................... 27 Table 3. Energy performance of sales average after introduction of subsidies ................................................... 27 Table 4. Two types of non-residential buildings relative to building and cooling system design ......................... 28 Table 5. CDDs and the average number of cooling days by climate zone, 2017-50 ............................................. 35

The IEA examines the full spectrum of energy issues including oil, gas and coal supply and demand, renewable energy technologies, electricity markets, energy efficiency, access to energy, demand side management and much more. Through its work, the IEA advocates policies that will enhance the reliability, affordability and sustainability of energy in its 30 member countries, 8 association countries and beyond.
Please note that this publication is subject to specific restrictions that limit its use and distribution. The terms and conditions are available online at www.iea.org/t&c/
Source: IEA. All rights reserved.International Energy Agency Website: www.iea.org
IEA member countries:
Australia Austria BelgiumCanadaCzech Republic DenmarkEstoniaFinland France Germany Greece HungaryIreland ItalyJapanKorea Luxembourg Mexico Netherlands New Zealand Norway Poland Portugal Slovak Republic Spain Sweden Switzerland Turkey United Kingdom United States
The European Commission also participates in the work of the IEA
IEA association countries:
BrazilChinaIndiaIndonesiaMoroccoSingaporeSouth AfricaThailand
INTERNATIONAL ENERGYAGENCY

The Tsinghua University Building Energy Research Center
The Tsinghua University Building Energy Research Center (BERC) was created in 2005. The
mission of BERC is devoted to the development of energy‐efficient and environmentally
responsible buildings in China in accordance with national and international energy and
environmental targets, including buildings research and innovation.
The principal research activities within BERC include:
Assessment of the current buildings status in China and strategic outlooks on buildings
energy consumption and efficiency.
Occupant behaviour and buildings simulation research.
Research and development (R&D) of innovative high‐efficiency buildings technology
and systems.
Energy efficiency application research on subsectors, including: space heating in
Northern China; rural residential buildings and urban residential buildings; and public
and commercial buildings.
BERC is involved in international exchange and co‐operation projects, including its on‐
going collaboration with the International Energy Agency. BERC is also responsible for the
Annual Report on China Building Energy Efficiency (in Chinese), which has been published
annually since 2007, and China Building Energy Use (in English), which has been published
annually since 2016. BERC’s research for this report was supported by the 12th Five‐Year
National Key Technology R&D Program of China (Grant No. 2012 BAJ12B01).
The BERC webpage is https://berc.bestchina.org/. The annual report, entitled China Building
Energy Use (in English), can be downloaded from: https://berc.bestchina.org/?ky/Article250/.

This publication reflects the views of the IEA Secretariat but does not necessarily reflect those of individual IEA member countries. The IEA makes no representation or warranty, express or implied, in respect of the publication’s contents (including its completeness or accuracy) and shall not be responsible for any use of, or reliance on, the publication. Unless otherwise indicated, all material presented in figures and tables is derived from IEA data and analysis.
This publication and any map included herein are without prejudice to the status of or sovereignty over any territory, to the delimitation of international frontiers and boundaries and to the name of any territory, city or area.
IEA. All rights reserved.IEA PublicationsInternational Energy Agency Website: www.iea.orgContact information: www.iea.org/about/contact
Typeset in France by IEA - June 2019 Cover design: IEAPhoto credits: © Shutterstock
IEA possible corrigenda on: www.iea.org/corrections/
