deconstructing theories of overeducation in europe: a …ftp.iza.org/dp9698.pdf · konstantinos...
TRANSCRIPT

Forschungsinstitut zur Zukunft der ArbeitInstitute for the Study of Labor
DI
SC
US
SI
ON
P
AP
ER
S
ER
IE
S
Deconstructing Theories of Overeducation in Europe:A Wage Decomposition Approach
IZA DP No. 9698
February 2016
Seamus McGuinnessKonstantinos Pouliakas

Deconstructing Theories of Overeducation in Europe:
A Wage Decomposition Approach
Seamus McGuinness Economic and Social Research Institute (ESRI)
and IZA
Konstantinos Pouliakas CEDEFOP, University of Aberdeen
and IZA
Discussion Paper No. 9698 February 2016
IZA
P.O. Box 7240 53072 Bonn
Germany
Phone: +49-228-3894-0 Fax: +49-228-3894-180
E-mail: [email protected]
Any opinions expressed here are those of the author(s) and not those of IZA. Research published in this series may include views on policy, but the institute itself takes no institutional policy positions. The IZA research network is committed to the IZA Guiding Principles of Research Integrity. The Institute for the Study of Labor (IZA) in Bonn is a local and virtual international research center and a place of communication between science, politics and business. IZA is an independent nonprofit organization supported by Deutsche Post Foundation. The center is associated with the University of Bonn and offers a stimulating research environment through its international network, workshops and conferences, data service, project support, research visits and doctoral program. IZA engages in (i) original and internationally competitive research in all fields of labor economics, (ii) development of policy concepts, and (iii) dissemination of research results and concepts to the interested public. IZA Discussion Papers often represent preliminary work and are circulated to encourage discussion. Citation of such a paper should account for its provisional character. A revised version may be available directly from the author.

IZA Discussion Paper No. 9698 February 2016
ABSTRACT
Deconstructing Theories of Overeducation in Europe: A Wage Decomposition Approach*
This paper uses data from the Cedefop European Skills and Jobs (ESJ) survey, a new international dataset of adult workers in 28 EU countries, to decompose the wage penalty of overeducated workers. The ESJ survey allows for integration of a rich, previously unavailable, set of factors in the estimation of the effect of overeducation on earnings. Oaxaca decomposition techniques are employed to uncover the extent to which the overeducation wage penalty can be attributed to either (i) human capital attributes, (ii) job characteristics, (iii) information asymmetries, (iv) compensating job attributes or (v) skill needs of jobs. Differences in human capital and job‐skill requirements are important factors in explaining the wage premium. It is found that asymmetry of information accounts for a significant part of the overeducation wage penalty for tertiary education graduates, whereas job characteristics and low skill content of jobs explain most of the wage gap for medium‐qualified employees. Little evidence is found in favour of equilibrium theories of skills matching and compensating wage differentials. The paper thus highlights the need for customised policy responses (e.g. career guidance; policies to raise job quality) to tackle overeducation. JEL Classification: J24, J31, J70, I26 Keywords: overeducation, skills, mismatch, wages, decomposition Corresponding author: Konstantinos Pouliakas CEDEFOP Europe 123 Thessaloniki (Pylaia) 570 01 Greece E-mail: [email protected]
* The views expressed in the paper are solely the authors’ and do not necessarily represent those of the European Centre for the Development of Vocational Training (Cedefop). The usual disclaimer applies. The authors would like to thank Professor Kostas Mavromaras (Flinders University, South Australia) and participants at the CEDEFOP/IZA workshop on skills and skill mismatch (29‐30 October, Thessaloniki, Greece) for their useful comments and insights.
2
1. Introduction
The literature on skill mismatch has grown significantly over the years, where skills mismatch
is usually defined either in terms of excess or deficient qualifications and skills possessed by
individuals relative to job‐skill requirements.1 Evidence from several advanced economies has
shown that skill mismatch is a widespread phenomenon, typically affecting about one third
of the higher educated employed population. Several research studies have also cautioned in
recent years that as a result of the 2008 economic crisis, there has been a tendency towards
higher overqualification rates across Europe (Pouliakas, 2012; ILO, 2014). Studies of skill
mismatch tend to focus on one of two central measures (a) overskilling which describes the
phenomena whereby workers are unable to use a range of their skills and abilities in their
current job and (b) overeducation, which describes the phenomena whereby workers have
acquired a level of schooling in excess of what is required to either get or do a job. The
literature to date suggests that there is a less than perfect correlation between overeducation
and overskilling and that both phenomena tend to have quite distinct implications for
workers. Overeducation tends to be associated with a large penalty on pay but a lower impact
on job satisfaction, whereas overskilling tends to affect pay less but is associated with much
lower levels of job satisfaction (McGuinness & Sloane, 2011; Mavromaras et al., 2013a). In
this study we are interested in decomposing the impacts of qualification mismatch on worker
pay and, consequently, our focus is exclusively on overeducation which has consistently been
associated with a substantial pay penalty.
A number of studies have attempted to uncover the potential determinants of various forms
of mismatch, by assessing the degree to which the wage penalties associated with
overeducation or overskilling adjust when different controls for job/individual worker
characteristics are added to model specifications (McGuinness and Sloane, 2011). Other
studies have measured the degree to which any measured disadvantage declines in models
that control for unobserved ability (Bauer, 2002). However, to date, no studies have applied
decomposition techniques to assess the extent to which observed differentials, in either wage
or job satisfaction premiums, between matched and mismatched workers relate to (a)
1 Cedefop (2010) provides clear‐cut definitions and discusses the differences between the terms “over‐ (under)education” and “over‐ (under‐)skilling”, all of which tend to be referred to (somewhat confusingly) in literature under the overarching term ‘skill mismatch’.

3
differences in the endowments of human capital and job‐related variables (b) differences in
the returns to given characteristics and (c) unobserved effects.
The aim of this study is to decouple the influence of the aforementioned factors on the wage
penalty of overeducated workers in the 28 EU member states. The paper will measure the
extent to which the raw pay penalty experienced by overeducated workers relates to
observable differences in human capital, job characteristics, job‐skill requirements, worker
preferences and the quality of job search information. Not only will this approach quantify
the proportion of the pay gap that can be attributed to particular theoretical perspectives,
but it will also allow us to draw important policy conclusions regarding potential measures for
reducing the incidence of overeducation. For example, the research will provide an indication
as to the extent to which overeducation rates are likely to respond to policies targeted at the
accumulation of skills, compared to improved job content or facilitating a better work life
balance.
In order to meet its research goal, the study explores new data from the Cedefop European
skills and jobs survey (ESJ), carried out in 2014 by the European Centre for the Development
of Vocational Training (Cedefop). The value added of the new dataset is that it contains novel
information on many important correlates of interest for skill mismatch at European level,
including the information, motives and constraints that individuals had at the time of job
search and a battery of questions on the nature of tasks and skills required by individuals’
jobs. Section 2 of the paper provides a review of the literature on the magnitude of wage
penalties related to overeducation and factors that may account for the differences in pay
between workers with matched and excess qualifications. Section 3 describes the new
dataset and key variables used for the purposes of the empirical analysis. Section 4 explains
the empirical methodology employed while section 5 provides an extensive discussion of the
empirical findings. Section 6 concludes.
2. Literature review
The overeducation literature has mushroomed in recent times and has become a key issue of
policy importance (Quintini, 2011; Pouliakas, 2012). As the focus of this paper relates to the
degree to which the wage penalty associated with overeducation can be explained by
observable differences between matched and overeducated workers, we will focus on the

4
literature related to both the robustness of the overeducation pay penalty and the potential
explanatory variables that should be included in any wage decomposition.
2.1 The magnitude and robustness of wage penalty estimates
Comprehensive surveys and meta‐analyses of the wealth of empirical estimates have
highlighted that there are important negative wage and welfare consequences of
overeducation on individual employees (Hartog, 2000; McGuinness, 2006; Cedefop, 2010;
Leuven and Oosterbeek, 2011; Pouliakas, 2012; Sattinger, 2012).
The majority of the studies have confirmed two stylized facts in relation to the impact of
overeducation on pay, as suggested initially by Sicherman and Galor (1991). First,
overeducated workers suffer from a wage penalty in relation to matched individuals with the
same level of education, whereas they earn a premium over their matched colleagues in the
same job. Relative to matched workers with similar levels of schooling, the average wage
penalty associated with overeducation has been estimated, on the basis of a dummy variable
in a standard wage regression, at around 15% (McGuinness, 2006). Another approach (known
as the ORU approach) breaks down the educational level into three constituent components
(Over‐, Required‐ and Under‐education) (Duncan and Hoffman, 1981). Based on this
methodology, Groot and Maasen van der Brink (2000) produce meta‐analytical estimates of
an average rate of return of 5.6% for attained years of education. Importantly, the return to
surplus (3%) or deficient (‐1.5%) years of education is significantly lower compared to the
comparable return for required years of education (7.8%). The evidence thus suggests that
although the overeducated work below their potential due to some productivity ceiling
(related to inferior skills and abilities or to particular firm and institutional characteristics),
there is still some benefit to be enjoyed from the extra years of education (Rumberger, 1987).
A key issue in the literature is that the above determinants and consequences of mismatch
have been identified mostly in cross‐sectional datasets or short time‐series of graduate
cohorts. Thus, it has been argued that perceived mismatches on the basis of the above data
are partly a statistical artefact that reflects unobserved labour market sorting due to
differences in individual abilities/skills within educational categories (Bauer, 2002;
McGuinness, 2003; Frenette, 2004). The plausibility of this statement has been heightened in
recent years, given the rapid expansion in tertiary education graduate rates across many

5
developed countries. Overeducation may therefore not be genuinely related to an
underutilisation of skills or abilities, since the additional investment in education may simply
compensate for the lack of ability of individuals who appear to be mismatched (Chevalier,
2003; Green and Zhu, 2010).
For instance, Mavromaras et al. (2010) and Sloane (2014) argue, on the basis of estimates
from an Australian longitudinal dataset (HILDA), that the magnitude of many coefficients
based on cross‐sectional data appear to be questionable. Using panel data methods that
control for unobserved individual heterogeneity identifies unbiased estimates of the effect of
skill mismatch, although concerns about the limited within‐group variance in the incidence of
mismatch also raises some doubts that the fixed effects estimates are themselves unbiased
(Mavromaras et al, 2013b).
Thus, the evidence on the reliability of cross‐sectional estimates of the overeducation pay
penalty remains somewhat mixed. While the wage impacts fall substantially when estimated
within a panel framework that controls for unobserved time‐invariant influences, such models
may themselves generate biased estimates of the coefficients of variables, such as
overeducation, that move slowly over time (ibid., 2013b). Consequently, we conclude that
while there exists some debate with regard to the magnitude of the overeducation pay
penalty, the differential itself represents a genuine measure of disadvantage experienced by
overeducated workers in the labour market.
2.2 What are the potential determinants of overeducation?
It is important that any attempt to decompose the wage effects associated with
overeducation includes a choice of covariates consistent with both economic theory and
existing empirical studies. A number of theoretical frameworks have been used to
conceptualise overeducation including (a) Human Capital Theory, (b) the Job Competition
Model, (c) Assignment theory and (d) Occupational mobility theory and models of job search.
Human Capital Theory (HCT) (Becker, 1964; Mincer, 1974) predicts that workers will always
earn their marginal product, implying that there should be no under‐utilization of human
capital in the labour market and that overeducation will not exist in equilibrium. However,
overeducation may still be observed in a world where the predictions of HCT hold, if earnings
and continuous human capital accumulation are imperfectly measured i.e. overeducation

6
may simply be a statistical artefact arising as a consequence of an omitted variables problem
(McGuinness, 2006). Specifically, the overeducation pay penalty may simply reflect lower
levels of total human capital among workers who, despite having higher than average levels
of formally acquired human capital (schooling), have lower levels of human capital acquired
in the workplace (e.g. non‐formal training and informal on‐the‐job learning), the latter
imperfectly measured within the data. Therefore, on the basis of the HCT model, any attempt
to decompose the overeducation pay penalty should include sufficient controls and measures
for human capital acquired through both formal schooling and workplace
learning/experience.
Thurow’s Job Competition Model (Thurow, 1975) emphasizes the importance of job
availability and argues that workers are allocated to a fixed distribution of jobs with
individuals investing in education in order to preserve their place in the jobs queue. Once an
individual reaches the top of the queue they are allocated to a job, so their wage will be
predetermined solely by the productivity characteristics of the job in question, with
overeducation occurring where the skill requirements of the allocated position are below
those acquired by the worker. Similarly, assignment models (Sattinger, 1993; Sattinger and
Hartog, 2013) also stress the importance of job distribution; however, the job allocation
process is no longer a lottery as utility maximization guides workers to choose certain jobs
over others and wages are determined by a hedonic price equation that accounts for both job
and worker characteristics. Therefore, both the job competition and assignment
interpretations of the labour market point to the importance of taking into account controls
for productivity‐relevant job characteristics and other vacancy externalities (e.g. the
availability of suitable job opportunities in the labour market) when decomposing the
overeducation pay penalty.
Theories of career mobility (Sicherman and Galor, 1991) suggest that some workers choose
an initially mismatched post that enables them to acquire the necessary skills, through on‐
the‐job training and work experience, which will enable them to achieve more rapid career
progression in the future. Alternatively, proponents of matching theories of job search
(Jovanavic, 1970) suggest that overeducation is largely a consequence of poor information
and, over time, workers will realize their error and achieve improved matches through
repeated job search. Other authors have hypothesised that mismatch may be a consequence

7
of workers trading off overeducation and lower pay for other job attributes, such as job
security, for which they have a stronger preference (McGuinness and Sloane, 2011).
Therefore, these frameworks suggest that overeducation is a temporary phenomenon, driven
by either strategic behaviour or imperfect information, suggesting that worker preferences
and beliefs should also be included within the decomposition framework.
3. Data and descriptive statistics
3.1 The Cedefop European Skills and Jobs (ESJ) survey
The Cedefop ESJ survey is a state‐of‐the‐art survey of adult employees (aged 24‐65) carried
out in the 28 member states of the European Union, collecting information on the match of
their skills with the skill needs of their jobs. It was financed and developed by the European
Centre for the Development of Vocational Training (Cedefop), in collaboration with a network
of experts on skills, the OECD and Eurofound (Cedefop, 2015). The aim of the survey is to help
inform the development of European policies on initial and continuing education and training
and employment policies. To do so, it seeks to understand how individuals’ qualifications and
skills are matched (or not) to the changing skill demands and complexities of their jobs. The
survey also looks at the extent to which employees’ skills are developed and used in their
workplaces over time.
A mixed methodology approach ensured that the data collected provided a representative
sample of the adult working age population in each of the EU28 member states. The survey
was carried out using quota sampling by the survey company Ipsos MORI and its network
partners in each country between 7 March and 26 June 2014. In total, 48,676 respondents
from different demographic groups took part either by telephone (9,154 employees) or online
interviewing (39,522 employees).2 In most EU countries about 1000‐1500 employees were
effectively interviewed, although the sample varies between countries. The sample was
augmented to 4000 observations in the case of five large EU labour markets, such as Germany,
France, Poland, UK, Spain, 3000 cases for Italy, and 2000 cases in Greece and Finland, while
2 The questionnaire was translated into the national languages of the EU countries using a strict translation protocol, managed by Ipsos MORI. Prior to administering the survey, extensive cognitive and pilot tests took place to validate the content and validity of the survey instrument. For details, see Cedefop (2015).

8
500 individuals were surveyed by telephone in each of the three smallest countries (Malta,
Cyprus and Luxembourg).3
The survey asked respondents a series of questions designed to assess the extent to which
their qualifications and skills are at the level needed to be hired for and to do their job. The
key contribution of the new survey is that it takes a longitudinal perspective, with some of
these questions asked several times, referring to distinct time periods, enabling the dynamic
analysis of skill mismatch of EU employees. The survey thus offers the first comparable
evidence of the dynamic evolution of skill mismatch of employees across all 28 EU countries.
It also allows researchers to take into account the persistency or initial state of skill mismatch
affecting individuals over time.
Given that the new survey focused on the issue of skill mismatch, it contains contextual
information that was not readily available in previous datasets. For example, in addition to a
standard set of control vairables (e.g. age, gender, level of education, firm size, type of
contract, economic sector, occupation) the survey collected data on the micro/macro‐
economic motives and constraints that influence individuals’ job choice; determinants of skill
accumulation in their jobs, focusing on both non‐formal and informal continuing vocational
training; experience of work‐based learning as part of initial education and training; whether
individuals embarked on occupation and/or geographic mobility prior to accepting their
current job; and the changing complexity of workers’ tasks in their jobs. In addition, the
survey permits the definition and measurement of several types of skill mismatch, including
educational mismatch and mismatch in terms of employees’ skill levels. Furthermore, the
survey collected data on the gross monthly earnings of adult workers in the 28 countries.
The inclusion of this rich set of variables and the availability of an international sample for the
analysis of overeducation is a marked improvement relative to previous empirical studies,
which have either used rich databases albeit from single countries, or have relied on
sometimes problematic panel data estimation techniques.
3 To control for any erratic variance in the mode of sampling, the empirical analysis has included as an additional explanatory variable a dummy variable that identifies whether a given observation was approached via online or telephone interviewing.

9
3.2 Key variables and summary statistics
The study utilises the full sample of adult employees, aged between 24 and 65, in all 28
European member states, corresponding to 48,676 cases. To analyse the wage consequences
of overeducation among European workers, two separate measures of educational mismatch
were derived as a first step in the analysis.
In the ESJ survey respondents were asked about the typical qualifications and skills needed
for their jobs. Specifically, the survey asked respondents to assess both the level of
qualifications needed to get their job if someone would apply for their job today, in addition
to the level of skills needed to do their job. This was done to investigate whether there is a
discrepancy between the qualifications needed for recruitment purposes and the level of
education that constitutes a genuine prerequisite for performing the necessary tasks in a job.
Particularly in weak labour markets with high unemployment rates, employers may inflate
recruitment criteria to filter the best candidates, or they may afford to deliberately hire
individuals with higher education as a means of hedging against greater economic uncertainty
(Bulmahn and Krakel, 2002). In either case individuals are induced to acquire higher
qualifications to be hired in a more competitive labour market, fostering credentialism, even
though the jobs for which they are recruited for may eventually require lower qualifications
and skills than they possess.
The measure of overeducation derived, and used as the main dependent variable in the wage
regressions of the paper, is based on a direct comparison of the highest qualification level of
individuals (translated to conventional ISCED levels) with the qualification level reported by
themselves as necessary to actually do their current job.4 This variable should represent a
more reliable measure of mismatch between acquired schooling and job content, whereas
the alternative measure based on education necessary to get the job is likely to be
confounded by credentialism and is less directly related to actual job content.
4 However, for the sake of robustness, the empirical analysis in section 5 has also taken into account the measure of qualification mismatch based on the level of education needed so that people can be hired in their current jobs. No significant changes to the main findings are observed, given the very high correlation (Pearson correlation coefficient = 0.8) of the two variables.

10
In 2014, about 33% of adult job holders in the EU sample believed that a tertiary education
degree is required so that they can perform their job, the majority (40%) responded that their
job could be performed with a medium‐level qualification while 21% stated that a low level
or no qualifications at all suffice. Comparing the educational requirement with the own
qualification of employees, the survey confirms that a substantial share of the European
workforce is employed in jobs that need a different (higher or lower) level of qualifications
than their own for performing them. In 2014, total qualification mismatch affected, on
average, 29% of the European adult working population, comprising of 17% who were
overqualified and 12% underqualified. About 1 in 4 (24%) tertiary educated workers (and 16%
of medium‐qualified employees) in Europe are found to be overeducated for their jobs.
Figure 1 shows that, on average, overeducation in the EU is more prevalent among younger‐
aged employees, females and individuals who were outside of the labour market
(unemployed or inactive) prior to accepting their current employment. It is also higher among
tertiary education graduates, particularly those from certain fields of study, such as
humanities, languages and arts and other social sciences. Rates of overeducation are also
significantly different depending on the characteristics of jobs. In particular, they are higher
for individuals employed in smaller‐sized firms and in less skill‐intensive occupations (e.g.
elementary jobs, service and market sales workers) and for those in non‐standard contract
jobs (part time, informal, temporary agency contracts).
[INSERT FIGURE 1 ABOUT HERE]
To breakdown the differences in earnings between overeducated and matched workers, a
measure of hourly earnings of adult employees has been derived as follows. Individuals were
initially asked to report how much is their gross monthly earnings from their job (before
deductions or credits of tax and national insurance). About 70% of the whole sample provided
an earnings figure, but the remaining 30% either refused (24.5%) to disclose their earnings or
did not know (5.5%). For the latter two groups the survey included a follow‐up question,
which allowed respondents to identify in which of four national‐specific income bands their
own monthly earnings belong to.5 In case of a valid response, the mid‐point of the respective
5 For each country four respective income bands were defined, namely {below lowest quartile, between lowest quartile and median, between median and highest quartile, above highest quartile}, based on reliable country‐

11
income band has been used as a proxy of a respondent’s monthly earnings. In this manner,
the sample used for the analysis contains positive wage values for about 83% of the original
sample of adult employees. Nevertheless, around 17% of the sample either refused to provide
their earnings data in both income questions of the ESJ survey, or did not know or answer
altogether.
Following the aforementioned procedure, it was observed that the wage variable was
distorted by the existence of a number of outliers in the sample (potentially because several
respondents provided an estimate of their annual rather than monthly earnings). To correct
for the observed skewness, the variable was therefore capped both at the bottom and at the
top of the distribution. In particular, the bottom 1% and the top 5% of the distribution were
dropped completely from the sample. Following the exclusion of possible outliers from the
analysis, the distribution of the wage variable and its summary moments were observed to
be compatible to those identified from other reliable European data sources containing
information on salary income of EU employees (e.g. EU SILC). For instance, the mean monthly
earnings of employees in the EU28 block are equal to approximately 2300 EUR, ranging from
above 4000 EUR in Denmark or 3000 EUR in Luxembourg, Finland and Sweden to 430 euros
in Bulgaria. As a final step the monthly earnings of adult workers were converted to hourly
earnings by dividing by the usual average weekly hours worked (multiplied by 4.33 since the
variable on hours includes paid and unpaid overtime hours).
[INSERT TABLE 1 ABOUT HERE]
Table 1 displays differences in average hourly wages between overeducated and matched EU
adult employees. The mean monthly earnings of the overeducated is equal to 2141 EUR
whereas the respective figure for matched employees is 2360 EUR, a wage penalty of 219 EUR
per month for the former group. However, the latter are employed for an extra 1.5 hours per
week (38.2 as opposed to 36.8 hours), which explains why there is a smaller difference in
mean hourly earnings between the two groups. There is greater skewness in the earnings
distribution of matched employees, resulting in a 2 EUR per hour premium in median hourly
wages. The table also indicates that the wage difference between the two groups is mostly
specific data (e.g. latest waves of EU‐SILC survey or national LFS datasets). More details are available at Cedefop (2015).

12
driven by tertiary education and recent graduates, males, individuals returning back to the
labour market after a period of inactivity, recipients of on‐the‐job training and those in jobs
with non‐indefinite contracts and low skill content.
4. Empirical methodology
The associations shown in Figure 1 and Table 1 highlight the importance of taking into account
a number of factors that are correlated with the incidence of overeducation, when estimating
the ceteris paribus effect of the latter on individual earnings. A multivariate regression
analysis has therefore been employed in the paper that controls for the effect of several key
characteristics, consistent with theory, in the estimation of earnings functions that contain
the overeducation dummy as the main explanatory variable of interest.
In particular, the empirical analysis follows a standard decomposition framework as outlined
by Oaxaca (1973) and Blinder (1973).6 The procedure requires first the estimation of separate
earnings functions for individuals in paid employment who are either overeducated or have
a qualification level matched to the requirement of their job. The wage gap between the two
groups is then deconstructed into a part that is attributable to differences in the mean
productive characteristics (the explained part) and a part that is due to different returns to
such characteristics (the unexplained part). In this manner it becomes possible to detect the
extent to which several observable characteristics contribute to wage differences between
the overeducated and matched and how much of the wedge can be attributed to
discriminatory practices or other unobserved influences.
Mincer‐type earnings functions are first fitted for each group (overeducated and matched) as
follows:
iiiii εδCγZβHW ln (1)
where lnWi are the log hourly earnings of individual i (i = 1,…, N), Hi is a vector of individual human
capital attributes which affect earnings, Zi is a vector of characteristics describing a range of other
theory consistent explanatory variables (such as job characteristics, job search information and
6 The analysis was replicated using the amended methodologies proposed by Neumark (1988) and Oaxaca and Ransom (1994), showing very similar results to the ones discussed in the paper.

13
preferences), C are country dummies and εi is a Gaussian random error term. The terms β, γ, δ are
regression parameters that capture the marginal returns of the characteristics contained in the
vectors H, Z, C and will be estimated on the basis of the ESJ sample. Robust standard errors of the
regression coefficients clustered at the country level are calculated for statistical inference
purposes.
The total difference in the mean wages of the two groups can then be decomposed in the
conventional Oaxaca manner as follows:
mismismmismismmmismmmismmism XZZZHHWW )ˆˆ()ˆˆ(ˆ)(ˆ)( (2)
where the first part of equation (2) (i.e. the ‘explained’ or ‘endowment’ part) reflects the
component of the average wage difference between the two groups attributed to differences in
the means of the explanatory variables, which are in turn weighed by the estimated coefficients
of the matched equation. It measures the relative importance of observable differences in human
capital, job characteristics, preferences etc. between the two sets of workers. The second term
(i.e. the ‘unexplained’ part) refers to the part of the wage gap that arises because of the
differential manner with which the labour market rewards the characteristics of overeducated
and matched employees. In this respect, it provides an indication of the extent to which
mismatched employment imposes productivity‐related constraints on the return to observable
characteristics.
The models are estimated first for the whole sample and then separately for individuals with a
different level of education (i.e. ISCED category), given that tertiary education graduates are more
likely to be overeducated as opposed to those with a medium‐level qualification. Furthermore, a
stepwise approach has been followed, which first allows for an empirical specification that only
incorporates standard demographic and human capital characteristics (e.g. age, gender,
education attainment level, previous labour market status, years of employer tenure, non‐formal
and informal training in job) and subsequently takes into account standard job characteristics (e.g.
private sector, size of workplace, type of contract, tasks required in job, promotion prospects) and
other important factors (e.g. job search motives of workers, skill needs of job). In terms of the
theoretical perspectives, the variables on education and training capture the impact of Human
Capital theory, while the information on job characteristics and skill requirements relate closely
to the predictions of both the Job Competition Model and Assignment Theory.

14
Furthermore, the novel information provided in the survey with regards to the motives for job
choice among individuals permits this study to put additional theories of overeducation under
scrutinity. These questions were asked retrospectively and rank the importance of a series of
factors for individuals choosing their current job. As these responses should, theoretically, pre‐
date the point before they commenced their current job, reverse causality becomes less of a
concern. These retrospective variables enable us to assess the relative importance of
compensating wage effects and, specifically, the extent to which individuals valued aspects of the
job such as reputation, work‐life balance and intrinsic benefits. The importance of Job Mobility
Theory is captured by variables which measure the extent to which the job was chosen on the
basis of its value for career progression or as a channel for gaining work experience. Finally, the
relative importance of prior information and, therefore, the quality of the job signal, is captured
by a range of prior response variables that reflect the level of information that the respondent
had with respect to the jobs’ benefits and skill requirements.
5. Empirical results
5.1 Estimation of earnings regressions
Tables 2‐4 display ordinary least squares coefficients following estimation of the main
earnings function, shown in equation (1), based on a sample of adult employees from all 28
EU member states. Table 2 displays the estimated coefficients for the whole sample, whereas
Tables 3 and 4 show the effects broken down by level of education attainment, first for those
with tertiary level qualifications and subsequently for individuals with an upper
secondary/non‐tertiary degree. The estimated coefficients describe the mean conditional
(proportional) effect of the explanatory variables on individuals’ hourly earnings, ceteris
paribus.
[INSERT TABLES 2-4 ABOUT HERE]
As shown in Table 2, overeducated workers suffer from a 22% wage penalty relative to
matched employees, when controlling for age, gender, level of education and their labour
market status prior to job entry. The figure falls to 19% when an augmented Mincer earnings
function is estimated. In this case the estimation takes into account that the overeducated
have lower average levels of job‐specific skills relative to the matched, due to fewer years of
seniority and less participation in non‐formal and informal training.

15
The size of the penalty is robust to the inclusion of variables that act as proxies for the match
between employees’ skills and the skill needs of their job, namely whether their skills exceed
current job requirements (overskilled) or are deficient relative to the optimal productivity
threshold (skill gap).7 This implies that the lower wages of overeducated workers are
independent of the fact that some of them may have inferior or superior skills than needed
by their jobs. It is thus important to consider explanations other than those that focus on skills
matching for understanding the source of the overeducation wage gap.
Job characteristics, such as whether an employee’s workplace is in the private sector or of
larger size, or the nature of complexity and autonomy of the job tasks, are important
predictors of adult workers’ wages. However, the overeducation wage penalty, at 18%, is
quite robust to the inclusion of such variables.
Another part of the lower earnings of overqualified workers can be attributed to their
placement in jobs with lower skill content, namely jobs that place a low degree of importance
on cognitive, digital and soft skills. Accounting for different levels of skill needs by jobs leads
to a marked reduction in the size of the regression coefficient on the overeducation dummy.
But even for individuals with the same human capital features, employed in jobs of similar
characteristics and skill intensity, it is observed that the overeducated still earn 13.8% lower
wages than those with matched qualifications. This result suggests that it is not the possession
of excess labour market skills that determine earnings per se, but the possession of excess
skills relevant to actual job requirements.
The full specification of the estimated equations reveals that part of the significant wage
penalty of overqualified workers also reflects the quality and relevance of the information
available to them (e.g. via career guidance and counselling or other forms of labour market
intelligence) as part of the job search process. It is evident that overeducated individuals who
do not select their jobs on the basis of their suitability with their own skills and qualifications,
or because of imperfect knowledge of their pay and benefits, are more likely to have lower
7 The equation and decomposition analysis has included as explanatory variables both the quality of the skill match at the time of entry into an individual’s job and at the time of the survey. Either of the variables acting as proxies of skills matching is statistically insignificant in earnings equations, once other characteristics of individuals and jobs are taken into account.

16
mean wages. By contrast, placing a higher premium on job security, an employer’s reputation
or because of a job’s proximity to the household exerts a negative pull on wages.
When examining determinants of earnings for adult workers with different levels of education
attainment, as shown in Tables 3 and 4, it is found that the overeducation wage penalty is
somewhat higher (ranging between 15‐24%, depending on the specification) for highly
educated graduates and lower (between 8‐18%) for medium‐qualified graduates. The
overeducation wage penalty is robust to differences between higher education graduates in
their subject of study, given that specific fields such as economics, engineering and medicine
are associated with higher average earnings. Tertiary graduates employed in jobs where their
skills are not fully utilised (overskilled) suffer from a 2% wage deficit relative to those with
matched skills; however, the regression coefficient of the overeducation variable is not
affected, which confirms that it is independent of the variation in the match of workers’
general level of surplus skills. By contrast, it is clear that part of the wage difference between
overeducated and matched workers is driven by the skill needs of their jobs and individual
job search motives.
Interestingly, the factors that weigh more heavily in explaining the lower wages of
overeducated graduates with medium‐level qualifications are their lower stock of job‐specific
human capital (measured in both years of employer tenure and participation in non‐formal
and informal training) and the fact that they are employed in jobs with a lower skill content.
Nevertheless, the OLS estimates show the combined impact of both endowment and
coefficient effects related to specific groups of variables on the overeducation pay premium.
In order to separate out the relative importance of variations in the amount of each attribute
held by overeducated and matched workers, we must adopt a decomposition approach as
discussed in the next section.
5.2 Decomposition analysis
5.2.1 Endowments differences between matched‐overeducated workers
In terms of the decomposition analysis, the base case is individuals who are matched, so the
decomposition algorithm explains the pay premium to being matched relative to the
overeducated group. The full specification, as shown in the final columns of Tables 2‐4, is used
when estimating the respective wage equations for the subsamples of matched and mismatch
17
employees, namely one that takes into account human capital and job characteristics, as well
as the skill content of jobs and individuals’ job search motives.
As is evident in Table 5, differences in endowments can explain about 28% of the raw
overeducation gap in a sample of employees who hold at least an upper secondary
qualification.8 In a similar spirit, the difference in observable characteristics is found to
account for about 31% of the raw wage premium in the medium‐educated model, whereas
they account for 43% in the model focused on tertiary education graduates. Nevertheless,
despite the richness of our data, the majority of the overeducation raw pay gap remained
unexplained in all three models.
[INSERT TABLE 5 ABOUT HERE]
Dealing firstly with the results of the total sample, Table 6 shows that differences in job
characteristics and job skill requirements are the most important factors in explaining the
wage advantage of matched workers, however, motivation variables and country level fixed
effects also play a marked role. Turning specifically to the human capital results, the data
shows that individuals with matched qualifications (the reference group) are found to have
higher mean wages mainly because of their higher average age and seniority.9 Furthermore,
the observed raw pay premium is reduced by the higher tertiary education attainment of the
overeducated, but widens due to their lower levels of on‐the‐job training and their greater
incidence of past unemployment episodes.
With respect to job characteristics, the lower wages of the overeducated can be partially
attributed to the fact that they are more frequently employed under a temporary contract
and in very small‐sized workplaces than the matched. Furthermore the mismatched are also
less likely to have been promoted in their jobs. Finally, when turning to job‐skill requirements,
the overeducated are, on average, employed in less skill intensive jobs, in particular jobs that
8 When undertaking the Oaxaca decomposition analysis we have excluded individuals with a low level education from the sample due to the fact that, by definition, they cannot be classified as overeducated workers. If they are not excluded, the wage regression restricted only to overeducated workers is run on a sample of medium‐ and high educated individuals, whereas the respective regression on the matched sample also includes those with low education. 9 Exactly why age is important, as opposed to job tenure is unclear. The result suggests that part of the pay gap may relate to the accumulation of general labour market experience; nevertheless, cohort effects, whereby the relative availability of quality positions within firms has fallen as educational attainment has risen, also represents a potential explanation.

18
do not require an advanced literacy or ICT skill level to be performed, which depresses their
wages by acting as a productivity threshold. The absence of high literacy requirements within
the job has the most substantial impact on the overeducation pay penalty.
The empirical wage decompositions further highlight the critical role of information and, to a
lesser extent, of career concerns, in sorting or not individuals into well‐matched jobs. In
particular, overeducated adult employees are less likely to have selected their jobs because
they are a suitable match for their qualifications and skills, or because of knowledge of their
pay and benefits, and this negatively impacts the wedge between their wages and those of
matched workers. The latter were instead more inclined to select their job because of their
career development opportunities, or for the promise of gaining some work experience.
Some, though limited, evidence is found to suggest that individuals may be willing to accept
jobs below their qualification level as a trade‐off for them being closer to their home.
Overall, in the model containing the whole sample of individuals holding at least upper
secondary qualifications, human capital differences account for around 5% of the observed
raw pay gap and standard job characteristics explain 9% of the gap. Two blocks of explanatory
variables, previously unaccounted for in most empirical analyses, account for the largest
share of the overeducation wage penalty. In particular, the skill intensity of jobs explain 18%
of the observed wage gap, while individuals’ job search motives account for a further 11%.
In terms of the sample of tertiary education graduates, overall, it is observed that human
capital endowments weigh more heavily relative to the whole sample, explaining 16% of the
raw wage differential. Job motives follow in significance, accounting for 9% of the
overeducation pay gap, although the combination of job characteristics and of the importance
of skills in jobs explains 14% of the total raw wage difference. This highlights the critical role
of landing a skill‐intensive job as a safeguard for graduates’ earnings, especially if they enter
into jobs demanding lower qualifications than their own.
In terms of the specific human capital effects, the impact of age and employer tenure still
represents the largest single impacts, however, they are less pronounced for tertiary
education graduates relative to the average, as is the impact of a previous unemployment
spell. Importantly, overeducated employees with a tertiary level qualification are found to be
less likely to have graduated from an Economics and Business degree as part of their studies,

19
which tends to raise the pay gap. Overeducated graduates also have a greater tendency to be
graduates from Humanities subjects and are less prone to Engineering and Education science
courses, which also contribute to their lower wages relative to those of matched employees.
Turning to job characteristics, as in the total sample, overeducated tertiary graduates are
recipients of lower mean hourly wages due to the fact that they are more frequently
employed in smaller‐sized workplaces and in less skill‐intensive jobs, associated with fewer
opportunities for promotion. They are also found to be less likely to select jobs on the basis
that they are a suitable match for their skills and qualifications. Moreover, overeducated
tertiary workers tend to put greater emphasis on the proximity of their job to their home,
which impacts negatively on hourly wages.
Finally, we decompose the earnings of medium skilled workers. A crucial difference between
the high‐ and medium‐educated models is the large role played by country level fixed effects
in the latter decomposition. The results indicate that the pay premium enjoyed by matched
medium skill workers is substantially reduced as a consequence of their higher relative
concentration in lower wage economies. Such a large negative fixed effect makes the
interpretation of the results in the medium skill decomposition more complicated.
Nevertheless, they suggest that job characteristics and skill requirements generally outweigh
differences in human capital endowments or other important factors, in terms of explaining
wage differences between the overeducated and those with matched qualifications.
Ignoring the size of the endowment effects and concentrating on their relative impact, it is
clear from the decomposition results that overeducated medium‐qualified workers tend to
be in jobs that do not require high levels of literacy or ICT skills and this can account for a
substantial amount of their raw pay gap. They are also more likely to have temporary
contracts and to be in jobs in which they fail to get a promotion. Among human capital
endowments it is evident that seniority plays a dominant role, given that the higher earnings
of matched workers is attributed to their additional years of employer tenure and to the lower
incidence of past unemployment spells. The matched are also found to have higher wages
because of greater participation in training courses during their work hours. Those among
them that selected their jobs on the basis of the pay and benefits offered, or because of their

20
favourable career prospects, also benefit from higher hourly wages relative to their
overeducated counterparts.
[INSERT TABLE 6 ABOUT HERE]
5.2.2 Unexplained wage differences between matched and overeducated workers
Table 7 focuses on the part of the difference in wages between matched and overeducated
workers that is unexplained, attributed either to a discrepancy in the shift coefficients or to
differential market valuations of the average characteristics of the two groups of employees.
In particular, the table shows differences in the estimated regression coefficients of the
matched and overeducated groups, weighted by the average characteristics of the
overeducated workers, a component that could reflect labour market discrimination against
those who enter into jobs requiring lower qualifications than their own.
Overall, around 70% of the raw wage difference in the total sample and in the sample of
medium‐qualified employees remains unexplained, while a smaller share (57%) is
unaccounted for in the high‐educated model. On the whole overeducated workers are found
to benefit from higher wage returns to their productive characteristics, although this is not
true for overeducated tertiary education graduates and is driven by the significant wage
returns enjoyed by those with medium‐level education. Matched workers are also found to
have higher absolute mean wages than the overeducated across all education levels, as
indicated by the positive intercept terms, suggesting that the bulk of the unexplained wage
component may be driven by factors not controlled for in our models.
Having a higher level of education is valued more for individuals that enter into jobs that are
a good match for their qualifications within graduate labour markets. The higher mean wages
of matched tertiary educated workers relative to the overeducated are amplified due to the
higher returns to age and training participation of the former. Being in a multi‐site workplace
environment, or selecting the job because it suits one’s credentials or yields higher pay and
benefits, disproportionately benefits those in jobs with matched qualifications. By contrast,
overeducated tertiary graduates who were driven, when selecting their job, by career
progression possibilities, enjoy a higher wage increment in comparison to the matched.

21
Furthermore, individuals in overeducated posts receive higher financial returns for each extra
year of employer seniority, regardless of level of education. Each additional year of age is also
rewarded more highly for medium‐qualified overeducated employees. The male‐female wage
gap for those with a medium‐level education is also smaller among individuals with matched
qualifications relative to the overeducated.
Therefore, while the bulk of the unexplained wage premium is related to higher average
wages among matched workers which may, in turn, be attributable to omitted variables,
there is some evidence of differential returns to observable characteristics that appear to vary
according to the level of mismatch. Medium skilled overeducated workers enjoy higher
returns to human capital characteristics relative to their matched counterparts; however,
these positive wage effects are more than outweighed by a large average overeducation pay
penalty. Conversely, matched graduates earn a slight premium due to higher returns to
human capital characteristics, with the vast majority of the unexplained premium relating to
a large average wage effect, which may also be driven by factors not available in the data.
[INSERT TABLE 7 ABOUT HERE]
6. Conclusions
Following a conventional Oaxaca decomposition analysis, the empirical findings in this paper
reveals that about one third of the observed wage premium to being matched relative to
being overeducated can be explained by differences in the endowments of the two groups.
Among graduates, a larger part (43%) of the pay gap is explained, with human capital
differences, job requirements and informational constraints affecting workers at the time of
job search, accounting for the largest part of the explained gap. These results confirm that
while individual and job characteristics are important in explaining the overeducation pay
penalty of graduates, the job selection process and, in particular, taking time to ensure that
the job matches your skill set, has a big pay‐off. The reduction of information asymmetries
among graduates with regards to available job opportunities therefore appears to be a key
policy response to overcoming the problem of graduate overeducation (McGuiness et al.,
2015). From a theoretical perspective, graduate overeducation appears consistent with
aspects of human capital theory, assignment theory and the signalling model, so important
lessons can be learnt from each perspective in terms of reducing the incidence of
22
overeducation. The finding that overeducation is consistent with a signalling problem is more
novel. From a policy perspective the signalling result highlights the importance of effective
guidance and counselling, provision of incentives for job mobility and perhaps of prolonged
job search to facilitate the better matching of the skills of tertiary graduates with their jobs.
Among medium‐educated workers, ignoring country level fixed effects, the largest explained
effects relate to job characteristics, such as the fact that the overeducated are more likely to
be in temporary contracts and are located in smaller firms and in jobs without promotion
prospects. Differences in job skill requirements are also an important factor, with
overeducated workers being paid less as they tend to be in jobs that only require a basic level
of skills. Raising job quality, or increasing job flexibility, would therefore appear to constitute
a more effective policy response for mitigating overeducation experienced by individuals with
a medium‐level education. As overeducation among the medium educated appears to be
related to job‐specific productivity ceilings which limit wage growth, the observed outcomes
appear more consistent with both the job competition and assignment interpretations of the
labour market.
It is likely that the relative contribution of the various theoretical frameworks and, therefore,
the most appropriate recommendations with respect to policy change will vary across
countries and more research is needed in this respect. A crucial aspect of the existing results
highlight the fact that overeducation among medium skilled workers is less common within
lower wage economies, suggesting that structural factors are a key determinant of mismatch.
The results suggest that the relative demand for intermediate labour declines as economies
grow, perhaps due to the impact of skill biased technological change, resulting in higher rates
of overeducation among medium skilled workers who are potentially being “bumped down”
into lower quality jobs.
Finally, it is important to note that despite the use of a highly detailed data set, the majority
of the overeducation pay penalty could not be explained in terms of endowment effects.
More research is certainly required if we are to fully understand both the determinants and
consequences of overeducation in the labour market.

23
References
Bauer T. (2002), “Educational Mismatch and Wages: A Panel Analysis”, Economics of Education Review, 21, 221‐229.
Becker, G.S. (1964). Human Capital. New York: Columbia University Press. Blinder, A.S. (1973). “Wage Discrimination: Reduced Form and Structural Estimates”. Journal
of Human Resources, Vol. 8 No 4, pp. 436–455. Bulmahn, G. and Kräkel, M. (2002). “Overeducated Workers as an Insurance Device”, LABOUR,
Vol. 16, No. 2, p. 383‐402. Cedefop (2010). The skill matching challenge: analysing skill mismatch and policy implications.
Luxembourg: Publications Office. http://www.cedefop.europa.eu/EN/Files/3056_en.pdf
Cedefop (2015), Skills, qualifications and jobs in the EU: the making of a perfect match?, Cedefop reference series No. 103, Luxembourg: Office for the Official Publications of the European Union. http://www.cedefop.europa.eu/en/publications‐and‐resources/publications/3072
Chevalier, A. (2003). “Measuring Over‐education”. Economica, Vol.70, No. 279, p. 509‐531. Duncan, G. and Hoffman, S. (1981). ‘The incidence and wage effects of overeducation’.
Economics of Education Review, 1: 75‐86. Frenette, M. (2004). “The overqualified Canadian graduate: the role of the academic program
in the incidence, persistence, and economic returns to overqualification”. Economics of Education Review, Vol. 23, No. 1, p. 29‐45.
Green, F. and Zhu, Y. (2010). ‘Overqualification, job dissatisfaction, and increasing dispersion in the returns to graduate education’. Oxford Economic Papers, 62: 740‐763.
Groot, W. and Maassen van den Brink, H. (2000). Overeducation in the labor market: a meta‐analysis. Economics of Education Review, Vol. 19, No. 2, p. 149‐158.
Hartog, J. (2000). ‘Over‐education and earnings: Where are we, where should we go?’. Economics of Education Review, 19: 131‐147.
ILO (2014), Skill mismatch in Europe: Statistics Brief, Geneva: International Labour Organisation.
Jovanovic, B. (1970). “Job Matching and the Theory of Turnover”, Journal of Political Economy, 87, 972‐990.
Leuven, E. and Oosterbeek, H. (2011). ‘Overeducation and mismatch in the labor market’. In Erik Hanushek, F. Welch (eds.): Handbook of the Economics of Education, Elsevier Science, Vol. 4, 283 ‐ 326.
Mavromaras, K., McGuinness, S., O’Leary, N., Sloane, P. and Fok, Y. (2010), ‘The problem of overskilling in Australian and Britain’. The Manchester School, 78: 219‐241.
Mavromaras, K., Mahuteau, S., Sloane, P. and Wei, Z. (2013a). ‘The effect of overskilling dynamics on wages’. Education Economics, 21: 281‐303.
Mavromaras, K,. McGuinness, S, O’Leary, N., Sloane, P, & Wei, Z. (2013b). “Job Mismatches and Labour Market Outcomes: Panel Evidence on Australian University Graduates”, Economic Record, Vo. 89 (286), pp. 382‐395.
McGuinness, S. (2003). “Graduate overeducation as a sheepskin effect: evidence from Northern Ireland”, Applied Economics, Vol. 35, No. 5, p. 597‐608.
McGuinness, S. (2006). Overeducation in the labour market. Journal of Economic Surveys, Vol. 20, No 3, p. 387‐418.

24
McGuinness, S. & Sloane, P. J. (2011). “Labour Market Mismatch Among UK Graduates: An Analysis Using Reflex Data”, Economics of Education Review, Vol. 30 (1), 130‐145.
McGuinness, S., Whelan, A. & Bergin, A. (2015). “Recruitment Methods and Educational Provision Effects on Graduate Overeducation and Overskilling”, STYLE working paper D5.4.
Mincer, J.A. (1974). Schooling, Experience and Earnings. New York: Columbia University Press. Neumark, D. (1988). “Employers’ discriminatory behavior and the estimation of wage
discrimination.” Journal of Human Resources, Volume 23, No. 3, pp. 279–95. Oaxaca, R.L. (1973). “Male‐Female Wage Differentials in Urban Labor Markets”, International
Economic Review, Vol. 14 No. 3, pp. 693–709. Oaxaca, R.L. and Ransom, M.R. (1994). "On discrimination and the decomposition of wage
differentials," Journal of Econometrics, Elsevier, Vol. 61 No.1, pp. 5‐21. Pouliakas, K. (2012). ‘The skill mismatch challenge in Europe’, Ch. 6 in: Employment and Social
Developments in Europe 2012. Luxembourg: Publications Office of the European Union. Quintini, G. (2011). “Over‐qualified or Under‐skilled: A review of the existing literature”. OECD
Social, Employment and Migration working papers No.121. Rumberger, R. (1987). ‘The impact of surplus schooling on productivity and earnings’. Journal
of Human Resources, Vol. 22, pp. 24‐50. Sattinger, M. (1993). “Assignment models of the distribution of earnings”, Journal of
Economic Literature, No 31, p. 831‐880. Sattinger, M. (2012). Qualitative Mismatches. Hanover (Ma.): Now Publishers. Sattinger, M. and Hartog, J. (2013). ‘Nash bargaining and the wage consequences of
educational mismatches’. Labour Economics, 23: 50‐56. Sicherman, N. and Galor, O. (1991). ‘Overeducation in the labor market’. Journal of Labor
Economics, 9: 101‐122. Sloane, P.J. 2014. "Overeducation, skill mismatches, and labor market outcomes for college
graduates," IZA World of Labor, Vol. 88. http://wol.iza.org/articles/overeducation‐skill‐mismatches‐and‐labor‐market‐outcomes‐for‐college‐graduates/long
Thurow, L.C. (1975). Generating inequality. New York: Basic Books.

25
Figure 1 Overeducation by population groups, % of adult employees, 2014, EU28
Source: Cedefop European Skills and Jobs (ESJ) survey
12%
8%
12%
27%
21%
15%
15%
24%
31%
14%
16%
17%
19%
21%
16%
18%
13%
17%
20%
23%
16%
21%
16%
19%
24%
29%
0% 5% 10% 15% 20% 25% 30% 35%
Managers
Professionals
Technicians and associate professionals
Service and market sales workers
Clerical support
Skilled agriculture, forestry, fishing
Building, crafts or related trades
Plant and machine operators and assemblers
Elementary occupations
55-65
45-54
35-44
30-34
24-29
Male
Female
In education or training
Employed in another job
Not working (e.g. child care, family)
Unemployed
Full-time
Part-time
Indefinite/permanent
Fixed term/temporary
Informal
Temporary employment agencyO
ccup
atio
nA
ge g
roup
Gen
der
Pre
viou
s LM
stat
usC
ontr
act

26
Table 1 Mean (s.d) hourly earnings (EUR) by overeducation status, 2014, EU28
Overeducated Matched Distribution of earnings Mean log(hourly wage) 2.28 (0.85) 2.42 (0.81) Median 10.39 12.31 1st quartile 6.06 7.31 3rd quartile 15.19 18.07 By level of education attainment High (ISCED 5-6) 16.62 (64.20) 18.35 (23.26) Medium (ISCED 3-4) 14.51 (26.54) 14.62 (22.88) By gender Female 16.47 (66.62) 15.61 (24.95) Male 14.72 (21.46) 16.20 (21.62) By age groups 24-39 14.95 (66.89) 15.03 (24.26) 40-54 16.33 (25.65) 16.18 (22.90) 55-65 15.72 (31.62) 17.39 (21.68) By previous labour market status Employed 16.01 (61.20) 15.84 (19.98) Self-employed 15.44 (26.35) 14.85 (21.02) Education and training 15.97 (29.26) 16.85 (25.61) Unemployed 14.04 (23.61) 14.34 (23.42) Inactive 15.57 (23.51) 18.45 (47.43) By training incidence Training mostly or only during work hours: Yes 16.11 (26.22) 16.69 (22.12) Training mostly or only during work hours: No 15.27 (60.84) 15.29 (24.15) By type of contract Indefinite 16.25 (53.73) 16.11 (22.78) Fixed term 11.00 (18.67) 13.73 (19.24) Temporary agency 12.79 (18.95) 23.08 (64.63) No formal contract 17.77 (41.20) 14.14 (20.05) Other 16.07 (36.28) 18.82 (36.71) By skill content of job Advanced literacy skills needed in job 16.68 (23.95) 17.44 (24.06) Advanced ICT skills needed in job 17.55 (27.03) 18.33 (23.66) Advanced soft skills (e.g. problem solving, communication skills) needed in job 15.32 (23.03) 16.28 (23.17)
Source: Cedefop European skills and jobs (ESJ) survey

27
Table 2: OLS estimates of wage equation, all adult employees, 2014, EU28 (1) (2) (3) (4) (5) (6) Basic HC Augmented
HC Skill
mismatch Job Skill needs Motives
overeducated -0.22*** -0.19*** -0.19*** -0.18*** -0.14*** -0.12*** (0.012) (0.010) (0.010) (0.010) (0.011) (0.011) age 0.03*** 0.02*** 0.02*** 0.02*** 0.02*** 0.02*** (0.006) (0.005) (0.005) (0.005) (0.005) (0.005) agesq -0.00*** -0.00*** -0.00*** -0.00*** -0.00*** -0.00*** (0.000) (0.000) (0.000) (0.000) (0.000) (0.000) male 0.12*** 0.12*** 0.12*** 0.10*** 0.10*** 0.09*** (0.014) (0.015) (0.015) (0.014) (0.014) (0.014) medisced 0.21*** 0.20*** 0.20*** 0.19*** 0.14*** 0.15*** (0.032) (0.029) (0.029) (0.028) (0.026) (0.027) highisced 0.47*** 0.45*** 0.45*** 0.42*** 0.34*** 0.34*** (0.042) (0.038) (0.038) (0.036) (0.034) (0.035) preveduc 0.03** -0.03*** -0.03*** -0.03*** -0.03*** -0.02** (0.014) (0.010) (0.010) (0.010) (0.010) (0.011) prevunemp -0.14*** -0.12*** -0.12*** -0.11*** -0.10*** -0.09*** (0.018) (0.015) (0.015) (0.015) (0.015) (0.014) prevoth -0.07*** -0.08*** -0.08*** -0.07*** -0.06*** -0.06*** (0.015) (0.015) (0.015) (0.015) (0.014) (0.017) emptenure 0.01*** 0.01*** 0.01*** 0.01*** 0.01*** (0.002) (0.002) (0.002) (0.002) (0.002) emptenuresq -0.00*** -0.00*** -0.00* -0.00* -0.00* (0.000) (0.000) (0.000) (0.000) (0.000) train_courses_in 0.07*** 0.07*** 0.05*** 0.04*** 0.03*** (0.009) (0.009) (0.008) (0.008) (0.007) train_courses_out 0.04*** 0.04*** 0.04*** 0.03*** 0.03*** (0.011) (0.011) (0.010) (0.010) (0.010) train_ojt 0.02** 0.02** 0.01 0.00 0.01 (0.008) (0.009) (0.008) (0.008) (0.007) overskilled -0.00 -0.01 -0.01 -0.00 (0.006) (0.006) (0.005) (0.005) skilldef -0.00 -0.00 -0.00 0.00 (0.000) (0.000) (0.000) (0.000) temporary -0.05*** -0.05*** -0.06*** (0.013) (0.012) (0.012) informal -0.03 -0.02 -0.01 (0.023) (0.024) (0.027) multisite 0.02*** 0.02*** 0.02** (0.007) (0.007) (0.007) private 0.03** 0.02* 0.02* (0.011) (0.011) (0.010) size10to49 0.06*** 0.06*** 0.05*** (0.011) (0.011) (0.012) size50to99 0.07*** 0.07*** 0.06*** (0.013) (0.013) (0.011) size100to249 0.12*** 0.11*** 0.10*** (0.013) (0.012) (0.013)

28
size250to499 0.14*** 0.14*** 0.13*** (0.015) (0.016) (0.017) size500 0.16*** 0.16*** 0.15*** (0.018) (0.017) (0.017) jobnrout -0.00 -0.01 -0.00 (0.010) (0.010) (0.009) joblearn -0.01* -0.03*** -0.03*** (0.008) (0.008) (0.010) jobaut 0.03*** 0.03*** 0.02** (0.008) (0.008) (0.007) jobteam -0.02*** -0.02** -0.02** (0.008) (0.008) (0.008) role_promoted 0.09*** 0.07*** 0.07*** (0.014) (0.014) (0.014) advlit 0.06*** 0.06*** (0.008) (0.008) advnum 0.02** 0.01* (0.008) (0.008) modict 0.08*** 0.07*** (0.009) (0.008) advict 0.10*** 0.10*** (0.017) (0.018) highiskill 0.03*** 0.02** (0.007) (0.007) factor_suitskills 0.01*** (0.001) factor_experience -0.01*** (0.001) factor_security -0.01*** (0.002) factor_career 0.01*** (0.002) factor_reputation -0.00*** (0.001) factor_benefits 0.02*** (0.002) factor_closehome -0.01*** (0.001) factor_intrinsic 0.00 (0.002) factor_worklife 0.01*** (0.002) Country dummies YES YES YES YES YES YES Constant 1.62*** 1.80*** 1.80*** 1.73*** 1.69*** 1.66*** (0.133) (0.118) (0.122) (0.110) (0.106) (0.114) Observations 35,522 35,423 35,315 35,315 35,315 31,277 R-squared 0.59 0.59 0.59 0.60 0.60 0.61 NB: Robust standard errors in parentheses, clustered for country; *** p<0.01, ** p<0.05, * p<0.1 Source: Cedefop European skills and job (ESJ) survey

29
Table 3: OLS estimates of wage equation, higher educated adult employees, 2014, EU28 (1) (2) (3) (4) (5) (6) Basic HC Augmented
HC Skill
mismatch Job Skill needs Motives
overeducated -0.24*** -0.22*** -0.22*** -0.21*** -0.17*** -0.15*** (0.014) (0.012) (0.012) (0.013) (0.014) (0.015) age 0.04*** 0.03*** 0.03*** 0.03*** 0.03*** 0.03*** (0.007) (0.006) (0.006) (0.006) (0.006) (0.006) agesq -0.00*** -0.00*** -0.00*** -0.00*** -0.00*** -0.00*** (0.000) (0.000) (0.000) (0.000) (0.000) (0.000) male 0.10*** 0.10*** 0.10*** 0.08*** 0.08*** 0.07*** (0.013) (0.013) (0.014) (0.013) (0.013) (0.013) preveduc 0.03* -0.02 -0.02 -0.01 -0.01 -0.00 (0.013) (0.010) (0.010) (0.011) (0.011) (0.013) prevunemp -0.14*** -0.13*** -0.13*** -0.11*** -0.11*** -0.08*** (0.025) (0.022) (0.022) (0.020) (0.020) (0.020) prevoth -0.05* -0.06** -0.06** -0.04 -0.04 -0.03 (0.025) (0.025) (0.025) (0.026) (0.025) (0.027) teacher 0.02 0.01 0.01 0.04 0.04 0.04* (0.029) (0.029) (0.029) (0.027) (0.027) (0.023) humanities -0.02 -0.01 -0.01 -0.02 -0.02* -0.03** (0.013) (0.013) (0.014) (0.012) (0.013) (0.013) econ 0.07*** 0.07*** 0.07*** 0.06*** 0.05*** 0.05*** (0.014) (0.014) (0.014) (0.012) (0.011) (0.014) othersocial -0.02 -0.02 -0.02 -0.02* -0.03** -0.02** (0.012) (0.013) (0.013) (0.012) (0.012) (0.011) natural 0.01 0.01 0.01 0.00 -0.00 -0.02 (0.016) (0.017) (0.017) (0.016) (0.016) (0.016) maths 0.04 0.04 0.04 0.03 0.03 0.03 (0.027) (0.026) (0.026) (0.024) (0.024) (0.019) ict 0.07*** 0.07*** 0.07*** 0.05*** 0.04** 0.04** (0.017) (0.017) (0.018) (0.016) (0.016) (0.014) engineering 0.07*** 0.08*** 0.08*** 0.06*** 0.05** 0.04** (0.017) (0.018) (0.018) (0.017) (0.017) (0.016) agri -0.05 -0.05 -0.05 -0.05 -0.05 -0.06* (0.037) (0.038) (0.038) (0.040) (0.038) (0.034) medicine 0.02 0.01 0.01 0.01 0.02 0.03 (0.018) (0.020) (0.020) (0.018) (0.018) (0.019) service -0.05*** -0.06*** -0.07*** -0.07*** -0.06*** -0.07*** (0.015) (0.016) (0.016) (0.015) (0.015) (0.017) emptenure 0.01*** 0.01*** 0.01** 0.01** 0.01** (0.003) (0.003) (0.003) (0.003) (0.003) emptenuresq -0.00** -0.00** -0.00 -0.00 -0.00 (0.000) (0.000) (0.000) (0.000) (0.000) train_courses_in 0.05*** 0.04*** 0.03** 0.02* 0.02 (0.012) (0.012) (0.012) (0.012) (0.013) train_courses_out 0.02* 0.02* 0.02* 0.02 0.01 (0.013) (0.013) (0.012) (0.012) (0.012) train_ojt 0.00 0.00 -0.00 -0.01 -0.00 (0.010) (0.010) (0.009) (0.008) (0.009)

30
overskilled -0.02* -0.02** -0.02* -0.00 (0.009) (0.009) (0.008) (0.007) skilldef -0.00 -0.00 -0.00 -0.00 (0.001) (0.001) (0.001) (0.001) temporary -0.04*** -0.04*** -0.04** (0.016) (0.016) (0.018) informal -0.05** -0.05** -0.05* (0.021) (0.022) (0.026) multisite 0.03*** 0.03*** 0.03*** (0.008) (0.008) (0.007) private 0.02 0.02 0.02 (0.015) (0.015) (0.013) size10to49 0.07*** 0.07*** 0.07*** (0.017) (0.017) (0.017) size50to99 0.08*** 0.08*** 0.07*** (0.019) (0.019) (0.018) size100to249 0.15*** 0.14*** 0.13*** (0.019) (0.019) (0.020) size250to499 0.16*** 0.15*** 0.15*** (0.015) (0.015) (0.017) size500 0.18*** 0.18*** 0.16*** (0.022) (0.022) (0.022) jobnrout -0.01 -0.01 -0.01 (0.016) (0.015) (0.014) joblearn -0.03** -0.03*** -0.04*** (0.010) (0.010) (0.012) jobaut 0.04*** 0.04*** 0.02** (0.008) (0.008) (0.009) jobteam -0.03*** -0.03*** -0.03*** (0.007) (0.007) (0.007) role_promoted 0.07*** 0.07*** 0.07*** (0.014) (0.014) (0.014) advlit 0.07*** 0.07*** (0.012) (0.010) advnum 0.02 0.01 (0.010) (0.011) modict 0.04** 0.03 (0.015) (0.016) advict 0.05** 0.03 (0.019) (0.021) highiskill 0.03*** 0.02* (0.008) (0.008) factor_suitskills 0.01*** (0.003) factor_experience -0.01*** (0.003) factor_security -0.01*** (0.003) factor_career 0.01 (0.003)

31
factor_reputation -0.01** (0.002) factor_benefits 0.02*** (0.002) factor_closehome -0.01*** (0.002) factor_intrinsic 0.01* (0.003) factor_worklife 0.01*** (0.002) Country dummies YES YES YES YES YES YES Constant 1.75*** 1.92*** 1.94*** 1.86*** 1.79*** 1.74*** (0.158) (0.139) (0.147) (0.138) (0.138) (0.145) Observations 16,880 16,845 16,811 16,811 16,811 14,868 R-squared 0.58 0.59 0.58 0.59 0.60 0.61 NB: Robust standard errors in parentheses, clustered for country; *** p<0.01, ** p<0.05, * p<0.1 Source: Cedefop European skills and job (ESJ) survey

32
Table 4: OLS estimates of wage equation, medium educated adult employees, 2014, EU28 (1) (2) (3) (4) (5) (6) Basic HC Augmented
HC Skill
mismatch Job Skill needs Motives
overeducated -0.18*** -0.15*** -0.15*** -0.14*** -0.09*** -0.08*** (0.022) (0.020) (0.020) (0.020) (0.020) (0.018) age 0.02*** 0.01 0.01 0.01 0.01 0.01** (0.007) (0.007) (0.007) (0.007) (0.007) (0.006) agesq -0.00* -0.00 -0.00 -0.00 -0.00 -0.00* (0.000) (0.000) (0.000) (0.000) (0.000) (0.000) male 0.13*** 0.12*** 0.13*** 0.11*** 0.11*** 0.10*** (0.018) (0.018) (0.019) (0.018) (0.018) (0.018) preveduc 0.05** -0.04** -0.04** -0.03** -0.03** -0.03** (0.020) (0.016) (0.016) (0.016) (0.016) (0.017) prevunemp -0.14*** -0.12*** -0.12*** -0.11*** -0.11*** -0.11*** (0.027) (0.023) (0.023) (0.022) (0.023) (0.024) prevoth -0.06** -0.07** -0.07** -0.06** -0.05* -0.06* (0.027) (0.028) (0.028) (0.028) (0.029) (0.033) emptenure 0.01*** 0.01*** 0.01*** 0.01*** 0.01*** (0.002) (0.002) (0.002) (0.002) (0.002) emptenuresq -0.00*** -0.00*** -0.00** -0.00** -0.00* (0.000) (0.000) (0.000) (0.000) (0.000) train_courses_in 0.08*** 0.08*** 0.06*** 0.05*** 0.04*** (0.012) (0.012) (0.012) (0.012) (0.011) train_courses_out 0.03** 0.03** 0.03** 0.02 0.02 (0.014) (0.014) (0.014) (0.015) (0.015) train_ojt 0.04*** 0.04*** 0.03** 0.02** 0.03** (0.010) (0.010) (0.010) (0.010) (0.010) overskilled -0.01 -0.02 -0.01 -0.01 (0.010) (0.009) (0.009) (0.010) skilldef -0.00 0.00 0.00 0.00 (0.000) (0.000) (0.000) (0.000) temporary -0.08*** -0.07*** -0.08*** (0.019) (0.018) (0.021) informal -0.02 -0.01 0.03 (0.049) (0.049) (0.055) multisite 0.02 0.01 0.01 (0.011) (0.011) (0.012) private 0.03* 0.03* 0.02 (0.015) (0.015) (0.017) size10to49 0.04** 0.04** 0.03* (0.016) (0.016) (0.017) size50to99 0.04** 0.04** 0.03** (0.018) (0.017) (0.016) size100to249 0.08*** 0.07*** 0.07*** (0.023) (0.023) (0.023) size250to499 0.12*** 0.12*** 0.11*** (0.025) (0.025) (0.025) size500 0.15*** 0.14*** 0.13*** (0.020) (0.019) (0.016)

33
jobnrout -0.00 -0.01 -0.01 (0.014) (0.014) (0.015) joblearn -0.00 -0.01 -0.01 (0.013) (0.013) (0.015) jobaut 0.03** 0.02* 0.01 (0.011) (0.012) (0.012) jobteam 0.00 0.01 0.00 (0.015) (0.016) (0.016) role_promoted 0.09*** 0.07*** 0.07*** (0.022) (0.022) (0.022) advlit 0.05*** 0.06*** (0.012) (0.013) advnum 0.00 -0.00 (0.012) (0.012) modict 0.09*** 0.08*** (0.011) (0.010) advict 0.12*** 0.11*** (0.023) (0.025) highiskill 0.01 0.01 (0.012) (0.012) factor_suitskills 0.00 (0.002) factor_experience -0.01*** (0.002) factor_security -0.01* (0.003) factor_career 0.01** (0.003) factor_reputation -0.00 (0.002) factor_benefits 0.02*** (0.003) factor_closehome -0.01*** (0.001) factor_intrinsic 0.00 (0.002) factor_worklife 0.01*** (0.003) Country dummies YES YES YES YES YES YES Constant 2.06*** 2.20*** 2.20*** 2.11*** 2.00*** 1.98*** (0.137) (0.139) (0.138) (0.140) (0.139) (0.133) Observations 14,500 14,451 14,403 14,403 14,403 12,802 R-squared 0.59 0.60 0.60 0.60 0.61 0.61 NB: Robust standard errors in parentheses, clustered for country; *** p<0.01, ** p<0.05, * p<0.1 Source: Cedefop European skills and job (ESJ) survey
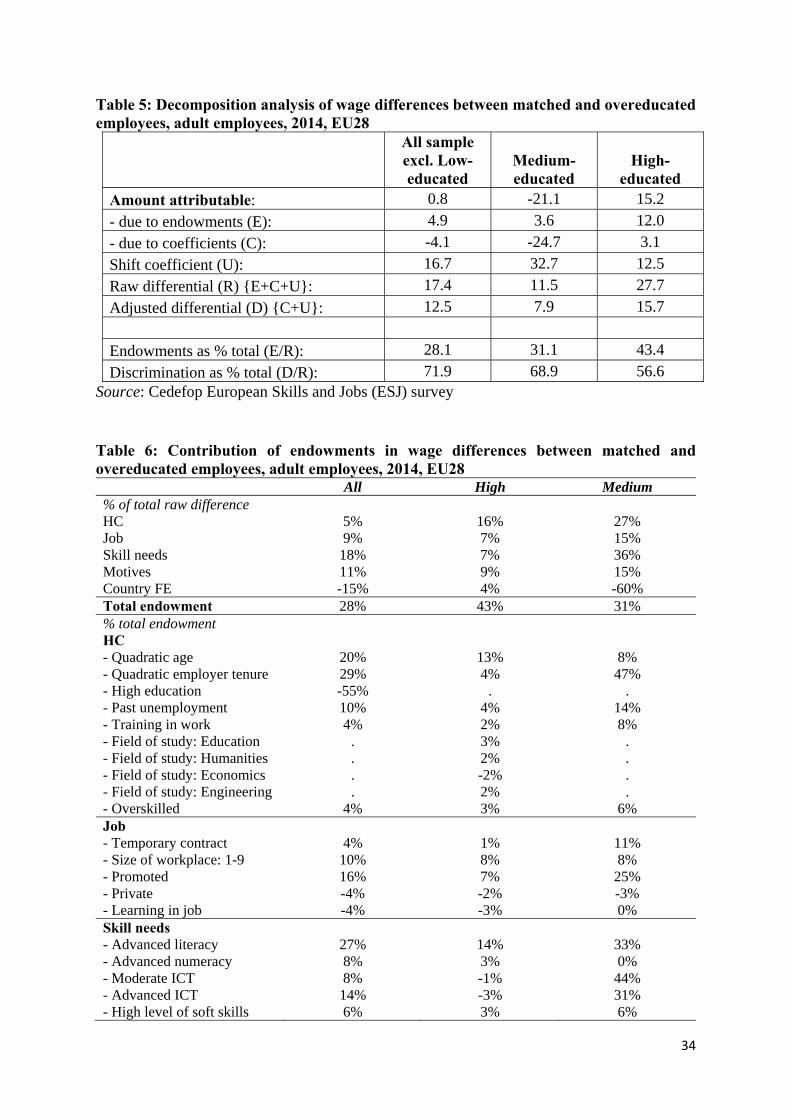
34
Table 5: Decomposition analysis of wage differences between matched and overeducated employees, adult employees, 2014, EU28
All sample excl. Low-educated
Medium-educated
High-educated
Amount attributable: 0.8 -21.1 15.2
- due to endowments (E): 4.9 3.6 12.0
- due to coefficients (C): -4.1 -24.7 3.1
Shift coefficient (U): 16.7 32.7 12.5
Raw differential (R) {E+C+U}: 17.4 11.5 27.7
Adjusted differential (D) {C+U}: 12.5 7.9 15.7
Endowments as % total (E/R): 28.1 31.1 43.4
Discrimination as % total (D/R): 71.9 68.9 56.6 Source: Cedefop European Skills and Jobs (ESJ) survey
Table 6: Contribution of endowments in wage differences between matched and overeducated employees, adult employees, 2014, EU28 All High Medium % of total raw difference HC 5% 16% 27% Job 9% 7% 15% Skill needs 18% 7% 36% Motives 11% 9% 15% Country FE -15% 4% -60% Total endowment 28% 43% 31% % total endowment HC - Quadratic age 20% 13% 8% - Quadratic employer tenure 29% 4% 47% - High education -55% . . - Past unemployment 10% 4% 14% - Training in work 4% 2% 8% - Field of study: Education . 3% . - Field of study: Humanities . 2% . - Field of study: Economics . -2% . - Field of study: Engineering . 2% . - Overskilled 4% 3% 6% Job - Temporary contract 4% 1% 11% - Size of workplace: 1-9 10% 8% 8% - Promoted 16% 7% 25% - Private -4% -2% -3% - Learning in job -4% -3% 0% Skill needs - Advanced literacy 27% 14% 33% - Advanced numeracy 8% 3% 0% - Moderate ICT 8% -1% 44% - Advanced ICT 14% -3% 31% - High level of soft skills 6% 3% 6%

35
Motives Information - Suits qualifications & skills 24% 18% 14% - Pay & benefits 22% 8% 33% Career concerns - Gain work experience -14% -5% -22% - Career prospects 12% 2% 28% Job attributes - Employer reputation -4% -3% -3% - Close to home 2% 2% 0% - Intrinsic satisfaction 1% -8% - Work-life balance 1% 14% - Job security -3% -8%
Source: Cedefop European Skills and Jobs (ESJ) survey
Table 7: Unexplained raw wage differences between matched and overeducated employees, adult employees, 2014, EU28 All High Medium % total raw difference HC 71% 96% -163% Job 9% 12% -7% Skill needs -22% -32% -10% Motives -47% -51% 10% Country FE -33% -12% -46% HC - Age 82% 194% -325% - Age square -10% -63% 200% - Male -5% 0% -24% - High education 39% . . - Previously in education & training 1% 3% -7% - Previously in unemployment -1% -1% 4% - Overskilled -6% -10% 19% - Skill deficit 5% -1% 20% - Employer tenure -43% -44% -30% - Employer tenure square 14% 12% 15% - Training courses during work 2% 5% -17% - Training courses out of work -1% 1% -8% - Training as part of work -4% -1% -11% Job - Temporary contract -1% 1% -9% - Informal contract -2% -1% -5% - Multi site workplace 12% 14% 4% - Private sector -6% -8% 16% - Size1to9 -3% -1% -11% - Size10to49 -1% -2% 3% - Size50to99 0% 1% -3% - Size100to249 2% 1% 4%

36
- Size250to499 -1% 0% -3% - Size500 2% 0% 6% - Non-routine job 3% 1% 5% - Job with need to learn 3% -1% 17% - Job with autonomy 2% 3% -3% - Job in teams -3% 4% -28% - Promotion 1% 0% 1% Skill needs - Advanced literacy -7% -6% -4% - Advanced numeracy 5% 4% 5% - Moderate ICT -17% -25% -12% - Advanced ICT -6% -6% -3% - High level of soft skills 3% 0% 5% Motives Information - Suits qualifications & skills 29% 24% 46% - Pay and benefits 14% 19% -3% Career concerns - Gain work experience 17% 12% 17% - Career progression -17% -26% 17% Job attributes - Job security -26% -32% -5% - Employer reputation 13% 9% 30% - Close to home -21% 0% -91% - Intrinsic reasons -50% -23% -83% - Work-life balance -6% -33% 82%
Source: Cedefop European Skills and Jobs (ESJ) survey

37
Annex: Definitions of main variables Variable Definition
overeducated D: 1 if respondent’s highest level of education attained is greater than the qualification level needed to do the job; 0 otherwise
Human capital characteristics
age C: age of respondent derived as difference between year of survey and declared date of birth in survey
agesq C: Quadratic age term
male D: 1 if male; 0 if female
preveduc D: Main activity before start of work with current employer was ‘In education or training’
prevunemp D: Main activity before start of work with current employer was ‘Unemployed’
prevoth D: Main activity before start of work with current employer was ‘Other-not working (e.g. child care, family responsibilities, injury, disability)’
prevemp (reference) D: Main activity before start of work with current employer was ‘Employed in another job’
teacher D: Main area or field of the highest qualification is: ‘Teacher training and education sciences’
humanities D: Main area or field of the highest qualification is: ‘Humanities, languages and arts’
econ D: Main area or field of the highest qualification is: ‘Economics, Business, Law or Finance’
othersocial D: Main area or field of the highest qualification is: ‘Other social sciences’
natural D: Main area or field of the highest qualification is: ‘Natural sciences’
maths D: Main area or field of the highest qualification is: ‘Mathematics and statistics’
ict D: Main area or field of the highest qualification is: ‘Computing sciences’
engineering D: Main area or field of the highest qualification is: ‘Engineering sciences’
agri D: Main area or field of the highest qualification is: ‘Agriculture and veterinary sciences’
medicine D: Main area or field of the highest qualification is: ‘Medicine and health-related sciences’
service D: Main area or field of the highest qualification is: ‘Security, transport or personal services’
otherfield (reference) D: Main area or field of the highest qualification is: ‘Other specific subject area’
emptenure C: years of tenure with current employer; derived by the question: ‘how many years in total have you been working for your current employer?’
emptenuresq C: years of employer tenure squared
train_courses_in D: In the last 12 months (since started your job if tenure less than 12 months) respondent has undergone ‘training courses attended mostly or only during work hours’
train_courses_out D: In the last 12 months (since started your job if tenure less than 12 months) respondent has undergone ‘training courses attended mostly or only outside of work hours’
train_ojt D: In the last 12 months (since started your job if tenure less than 12 months) respondent has undergone ‘training courses whilst performing your regular job (e.g. instruction by supervisor/co-worker; job rotation; peer support; quality circles)’
train_no (reference) D: In the last 12 months (since started your job if tenure less than 12 months) respondent has ‘Not undergone any training’
overskilled D: 1 if respondent’s skills are higher than needed to do the job; 0 otherwise
skilldef C: Measure of respondent’s skill deficit, derived as the difference between the respondent’s own skill level, assessed on a 0-100 scale, and a value of 100 defined as the level needed to do the job as well as possible.
Job characteristics
temporary D: Type of employment contract in current job: ‘A fixed-term/temporary contract’
informal D: Type of employment contract in current job: ‘No formal contract’
indefinite (reference) D: Type of employment contract in current job: ‘Indefinite/permanent contract’
multisite D: 1 if respondent works for organisation with more than one workplace (e.g. a branch or local unit); 0 otherwise
private D: 1 if respondent works in a private company or partnership; 0 otherwise
size1to9 (reference) D: 1 if number of people who work in the respondent’s workplace is: 1-9
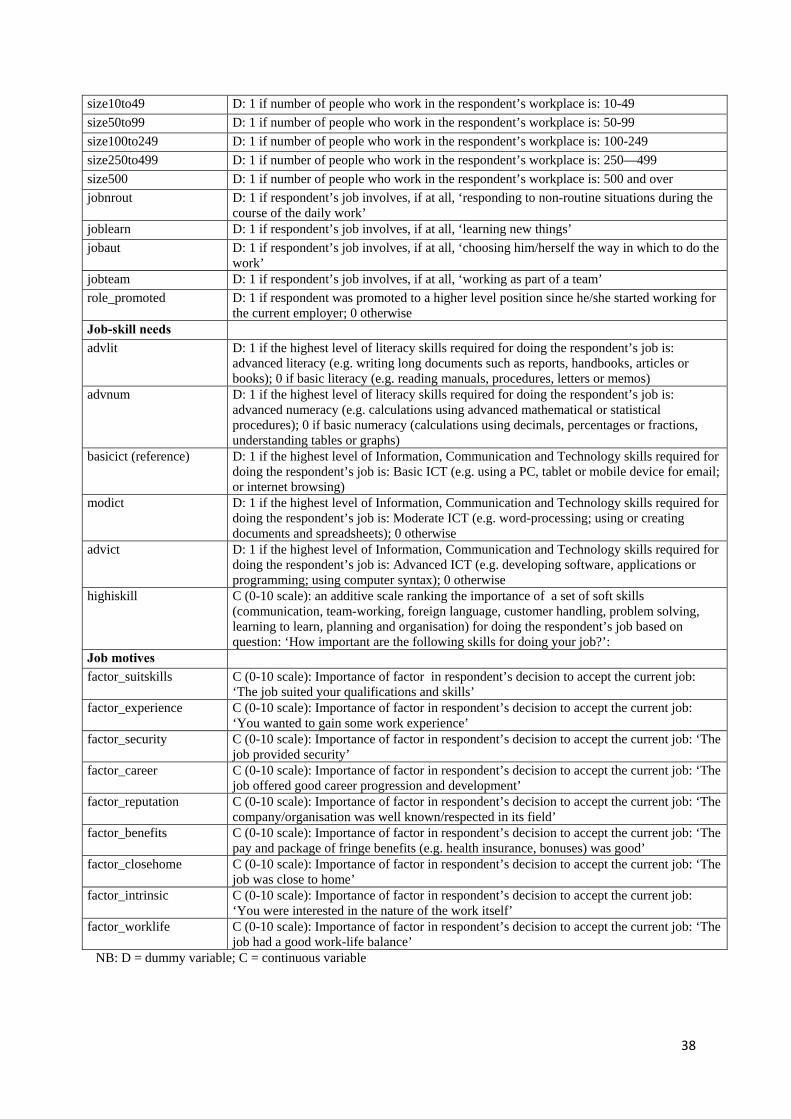
38
size10to49 D: 1 if number of people who work in the respondent’s workplace is: 10-49
size50to99 D: 1 if number of people who work in the respondent’s workplace is: 50-99
size100to249 D: 1 if number of people who work in the respondent’s workplace is: 100-249
size250to499 D: 1 if number of people who work in the respondent’s workplace is: 250—499
size500 D: 1 if number of people who work in the respondent’s workplace is: 500 and over
jobnrout D: 1 if respondent’s job involves, if at all, ‘responding to non-routine situations during the course of the daily work’
joblearn D: 1 if respondent’s job involves, if at all, ‘learning new things’
jobaut D: 1 if respondent’s job involves, if at all, ‘choosing him/herself the way in which to do the work’
jobteam D: 1 if respondent’s job involves, if at all, ‘working as part of a team’
role_promoted D: 1 if respondent was promoted to a higher level position since he/she started working for the current employer; 0 otherwise
Job-skill needs
advlit D: 1 if the highest level of literacy skills required for doing the respondent’s job is: advanced literacy (e.g. writing long documents such as reports, handbooks, articles or books); 0 if basic literacy (e.g. reading manuals, procedures, letters or memos)
advnum D: 1 if the highest level of literacy skills required for doing the respondent’s job is: advanced numeracy (e.g. calculations using advanced mathematical or statistical procedures); 0 if basic numeracy (calculations using decimals, percentages or fractions, understanding tables or graphs)
basicict (reference) D: 1 if the highest level of Information, Communication and Technology skills required for doing the respondent’s job is: Basic ICT (e.g. using a PC, tablet or mobile device for email; or internet browsing)
modict D: 1 if the highest level of Information, Communication and Technology skills required for doing the respondent’s job is: Moderate ICT (e.g. word-processing; using or creating documents and spreadsheets); 0 otherwise
advict D: 1 if the highest level of Information, Communication and Technology skills required for doing the respondent’s job is: Advanced ICT (e.g. developing software, applications or programming; using computer syntax); 0 otherwise
highiskill C (0-10 scale): an additive scale ranking the importance of a set of soft skills (communication, team-working, foreign language, customer handling, problem solving, learning to learn, planning and organisation) for doing the respondent’s job based on question: ‘How important are the following skills for doing your job?’:
Job motives
factor_suitskills C (0-10 scale): Importance of factor in respondent’s decision to accept the current job: ‘The job suited your qualifications and skills’
factor_experience C (0-10 scale): Importance of factor in respondent’s decision to accept the current job: ‘You wanted to gain some work experience’
factor_security C (0-10 scale): Importance of factor in respondent’s decision to accept the current job: ‘The job provided security’
factor_career C (0-10 scale): Importance of factor in respondent’s decision to accept the current job: ‘The job offered good career progression and development’
factor_reputation C (0-10 scale): Importance of factor in respondent’s decision to accept the current job: ‘The company/organisation was well known/respected in its field’
factor_benefits C (0-10 scale): Importance of factor in respondent’s decision to accept the current job: ‘The pay and package of fringe benefits (e.g. health insurance, bonuses) was good’
factor_closehome C (0-10 scale): Importance of factor in respondent’s decision to accept the current job: ‘The job was close to home’
factor_intrinsic C (0-10 scale): Importance of factor in respondent’s decision to accept the current job: ‘You were interested in the nature of the work itself’
factor_worklife C (0-10 scale): Importance of factor in respondent’s decision to accept the current job: ‘The job had a good work-life balance’
NB: D = dummy variable; C = continuous variable