overeducation and crowding out of low-skilled workers
TRANSCRIPT
Corresponding author.*
Overeducation and Crowding Out of Low-Skilled Workers
J. Muysken and B.J. Ter Weela, * b
Department of Economics and MERIT, Maastricht University, P.O. Box 616, 6200 MD, Maastricht, thea
Netherlands; Tel: 0031-43-3883821; E-mail: [email protected].
MERIT, Maastricht University, P.O. Box 616, 6200 MD, Maastricht, the Netherlands; b
Tel: 0031-43-3883873; E-mail: [email protected].
Abstract
This paper develops a model to explain the following stylised facts: (1) returns to schooling have declined strongly
over time and are only recovering gradually, whereas schooling attainment did recover much more strongly; (2)
there is a rather general level of overeducation; (3) unemployment for low educated persons is much higher than
for high educated persons; (4) the rate of return on overeducation is positive. In the model the search-theoretical
analysis of Pissarides is applied to skilled demand for labour and extended to allow for job competition. It is
combined with human capital theory to explain the level of education.
Keywords: overeducation, job competition, low skilled unemployment
JEL Classification:
[1998] J. Muysken and B.J. Ter Weel / Overeducation and Crowding Out of Low-Skilled Workers 1
In 1996 Groot and Maassen van den Brink (1996) triggered a discussion on overeducation in the Netherlands.1
They state that overeducation did not increase between 1982 and 1995, based on two different data sets for theNetherlands. This point is criticised by Groeneveld (1996, p. 511), who points out that overschooling definitelymay have increased when differences between these sets are corrected. However, an interesting observation ofGroot and Maassen van den Brink is that overschooling is concentrated at part-time workers, workers withinterrupted careers and beginning workers. Hence it is not necessarily crowding out low educated persons, butmay be compensating lack of experience. Oosterbeek and Webbink (1996) also criticise the results reported by
1. Introduction
When Gottschalk (1997) discusses the increase in income inequality in the Nordic countries, the
Netherlands, France and Japan in the late 1980's and early 1990's he observes that “the relatively
small increase in inequality in the Netherlands reflects a decline in the college premium, which
largely offsets the substantial increase in inequality between experience groups and the increase
in inequality within groups.” And this decline is due to “the large increase in the supply of
college workers” while this “supply shift” is not further explained (pp. 34-35). He observes a
similar phenomenon for Sweden.
The Swedish situation is presented by Topel (1997) who shows a sharp decrease in the college
premium from the late sixties onwards, and again a small increase after the mid-eighties. Male
school enrollment also drops sharply in the early seventies “which shows that college enrollments
do respond to declining returns to schooling” (p. 69). However, Topel does not comment on the
much stronger increase in school enrollment in the late eighties and early nineties, when
compared to the very modest increase in the college premium. With respect to the latter he
comments that “the returns to education in Sweden remain extraordinary low” (p. 70). Thus we
observe the stylised fact that returns of schooling have declined strongly over time and are only
recovering gradually, whereas schooling attainment if it declined at all, did recover much more
strongly.
This observation is consistent with another stylised fact: there is a rather general level of
overschooling, that is many persons are working on jobs that require less schooling than
obtained. We illustrate this for the Netherlands in Table 1. From the table one sees that in
particular in the lower segment of the labour market overschooling occurs to a large extent. One1

[1998] J. Muysken and B.J. Ter Weel / Overeducation and Crowding Out of Low-Skilled Workers 2
Groot and Maassen van den Brink. They use a different analysis in which returns on overeducation arecalculated and compared to normal returns for men and women in the Netherlands, 1982 and 1995. Theirresults show a decline for men in returns of overschooling, but for women the opposite holds.
Gelderblom cs. (1997) observe that education may be related to opportunity to find a job, which in its turn may2
lead to crowding out of low educated persons. Van Ours and de Ridder (1995) find that no crowding out didoccur in the Netherlands, but their results have been criticised by De Beer (1996) because Van Ours and Ridderassume that low and high educated persons have the same probability to be accepted on a low skilled job.
may wonder to what extent this is consistent with crowding out of low skilled workers by high
skilled workers, but at least it indicates that high skilled school leavers find more easily a job2
than low skilled ones.
Table 1:
Percentage workers with excess education in the Netherlands
Educational level of vacancies: CBA De Beer CBS
1995 1996 1990 1995
Basic 83 43 65 72
Lower (MAVO) 31 32
32 36Medium (LBO) 16 11
Source: CBA (1995), De Beer (1996), CBS (1995)
This is also observed in Gelderblom and De Koning (1994, pp. 40-41) who estimate age-activity
profiles for men and women respectively, based on OSA-panel data for the Netherlands 1990.
Their results show that the profile is higher, the higher the type of education - in particular in the
case of women the difference is striking. The notion that high skilled school leavers find more
easily a job than low skilled ones is also corroborated by the observation that the unemployment
spell for school leavers decreases with educational level. And this is also reflected in the well-
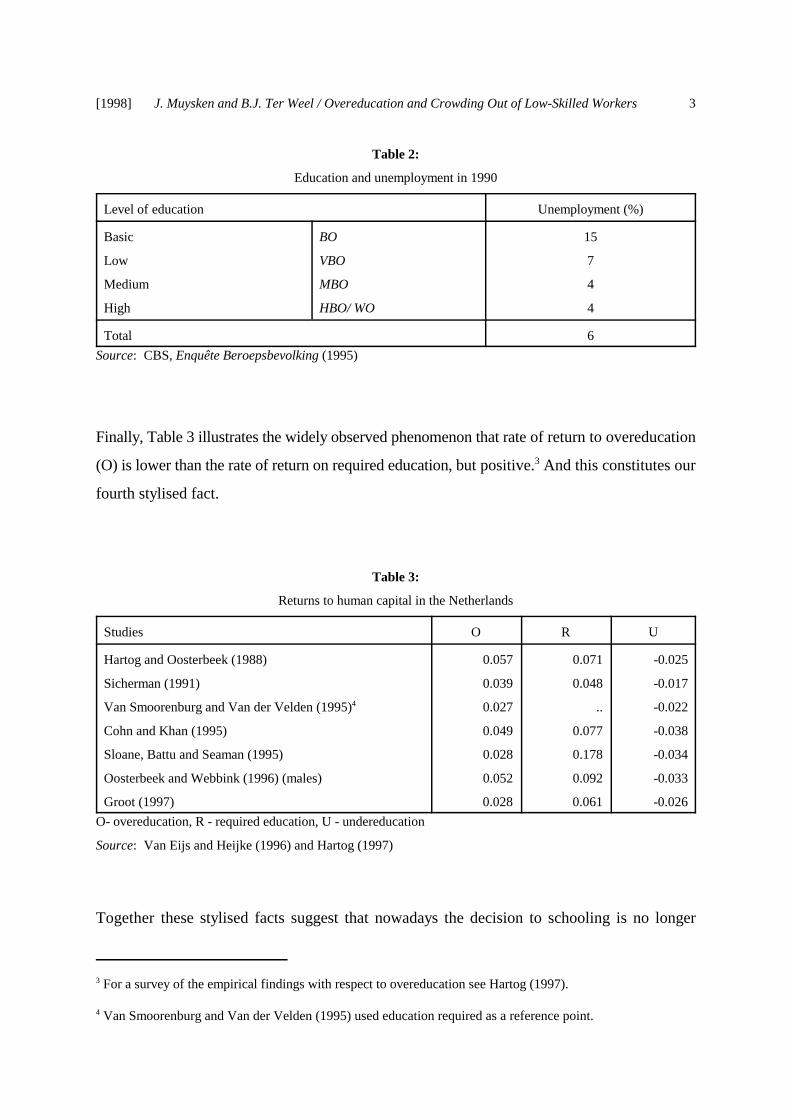
known fact that the rate of unemployment decreases with the educational level - cf. Table 2 This
is the third stylised fact we would like to present.
[1998] J. Muysken and B.J. Ter Weel / Overeducation and Crowding Out of Low-Skilled Workers 3
For a survey of the empirical findings with respect to overeducation see Hartog (1997).3
Van Smoorenburg and Van der Velden (1995) used education required as a reference point.4
Table 2:
Education and unemployment in 1990
Level of education Unemployment (%)
Basic BO 15
Low VBO 7
Medium MBO 4
High HBO/ WO 4
Total 6
Source: CBS, Enquête Beroepsbevolking (1995)
Finally, Table 3 illustrates the widely observed phenomenon that rate of return to overeducation
(O) is lower than the rate of return on required education, but positive. And this constitutes our3
fourth stylised fact.
Table 3:
Returns to human capital in the Netherlands
Studies O R U
Hartog and Oosterbeek (1988) 0.057 0.071 -0.025
Sicherman (1991) 0.039 0.048 -0.017
Van Smoorenburg and Van der Velden (1995) 0.027 .. -0.0224
Cohn and Khan (1995) 0.049 0.077 -0.038
Sloane, Battu and Seaman (1995) 0.028 0.178 -0.034
Oosterbeek and Webbink (1996) (males) 0.052 0.092 -0.033
Groot (1997) 0.028 0.061 -0.026
O- overeducation, R - required education, U - undereducation
Source: Van Eijs and Heijke (1996) and Hartog (1997)
Together these stylised facts suggest that nowadays the decision to schooling is no longer
[1998] J. Muysken and B.J. Ter Weel / Overeducation and Crowding Out of Low-Skilled Workers 4
To a certain extent this is corroborated by Webbink (1996) who uses survey data for 1990 and 1995 to5
determine the extent to which the choice for a certain type of education is motivated by labour marketperspectives. He finds that labour market perspectives definitely do matter. However, people often usestereotypes of labour market chances in this context. And an interesting observation is that the 1995 generationis more fixed on labour market perspectives than the 1990 generation.
An interesting overview of sorting theory as opposed to human capital theory is given in Weiss (1995). The6
labour queue theory is developed in Thurow (1979).
See, e.g. Schultz (1961) and Becker (1962) for the initial approaches of human capital theory.7
primarily influenced by future wages, but by the possibility to get a proper job. Thus the relevant5
characteristic of the job which determines schooling is not primarily the level of education
required and its corresponding wage, but the probability of obtaining that job at all - although the
corresponding wage level may be relatively low. This notion is consistent with the sorting
hypothesis and the related labour queue theory. For employers typically use education as a6
screening device for unobserved characteristics like ability to learn, and a low quit rate. And
workers therefore use this as a device to signal their unobservable characteristics.
According to human capital theory, productivity, and hence wages, are not influenced by job
characteristics but by individual endowments; this implies that the wage rate is merely
determined by the supply side. Estimating wage functions and explaining differences in these
wages are important issues in human capital theory. Ability, education and training are the
determinants of the amount of human capital an individual embodies and, as a result, of an
individual’s productivity on the job. Embedded in a neoclassical framework, human capital7
theory implies that a higher ability and more education do not only result in a higher level of
productivity but also leads to a higher wage rate. This wage rate varies with in the absolute
amount of human capital an individual embodies. This feature of human capital theory is
criticized in Thurow (1975). In his job competition model productivity and wages are tied to jobs
instead to persons. Workers are ranked in a so-called labour queue based on their training cost.
This means that high skilled workers are ranked higher than low skilled workers, because the
former group is more easily to train than the latter, i.e. the relative educational level determines
the individual’s employment chance.
While human capital theory focuses on the supply side of the labour market and job competition
[1998] J. Muysken and B.J. Ter Weel / Overeducation and Crowding Out of Low-Skilled Workers 5
In this paper we only make a distinction between skilled (L ) and unskilled (L ) labour. For a more elaborate8s u
model on skills see, e.g. Van Zon, Muysken and Meijers (1998) and Hollanders and Ter Weel (1998).
Groot and Hoek (1997) illustrate the working of the labour market under the assumptions of human capital and9
labour queue theory. They stress the differences between both theories.
In this context Kettunen (1994) also uses a different argument from sorting: a higher educated person can10
perform a job at a lower level, but a low educated person cannot perform a job at a higher level.
models focus on the demand side, matching theory concentrates on both. On the one hand, the
demand side of the labour market is assumed to consist of jobs with different skill requirements.
On the other hand, the supply side consists of individuals that have acquired skills by means of
education. Pissarides (1990), Layard, Nickell and Jackman (1991) and Phelps (1994) build a8
model that treats both sides of the labour market. However, the combination between job
competition models, human capital theory and matching theory is never explicitly stated.
Starting from a matching function we build a model that captures all ingredients of both human
capital theory and labour queue theory. We show that the adjustment mechanism in the economy9
is determined on the one hand via wages but on the other hand through the number of jobs
supplied by employers, given the level of skills. Next to that we are able to show that the wage
level is rather stable despite the major absolute increase in the level of education. Here human
capital theory would predict an enormous rise in wages, whereas labour queue theory defines a
stable wage level in accordance with a stable supply of the relative skill level.10
In order to explain the four stylised facts, we are interested in a more precise analysis of the
interaction of schooling decision, duration of unemployment and wages. A framework for such
an analysis is presented in this paper. We proceed in the following way. First, we build a model
on matching, ability and years of schooling which serves as our general framework for the
remainder of the paper. Then, we extend this model in section 3 to show the impact and
implications of different levels of skills for our analysis. In section 4 we explain and show some
evidence with respect to the stylised facts stated in the introduction. We end with some
concluding remarks.

[1998] J. Muysken and B.J. Ter Weel / Overeducation and Crowding Out of Low-Skilled Workers 6
To large extent we will follow the analysis as developed in Pissarides (1990), chapter 1.11
2. Matching, Ability and Years of Schooling
The General Structure
The labour market consists of two sectors. One sector requires skilled labour - which has a level
of skills s of at least a given level ¹ - whereas the other sector requires only unskilled labour.
Supply of skilled labour can be increased by means of schooling. We assume the wage rate for
unskilled labour to be fixed at the level w , which is above the unemployment benefit. Moreover,u
employers will prefer skilled labour to unskilled labour to perform unskilled jobs at the wage rate
w . Hence we assume unemployment, if any, to be concentrated to unskilled workers. Skilledu
workers working in the unskilled sector are called underemployed.
In the analysis we will focus on the skilled sector. Since employers are looking for skilled labour,
we first analyse the matching process resulting from the search for skilled workers. This shows
how underemployment duration is related to labour-market tightness. The latter is ultimately
determined by the wage formation process for skilled labour. Therefore we elaborate how given
the level of skills required, ¹, the wage is determined in a bargaining process between workers
and firms. Given both underemployment duration and wage we next analyse how many years a
worker wants to school himself in order to obtain that required skill ¹. This finally defines supply
of skilled labour and underemployment in the skilled sector.
The Matching Process
Employers in the skilled sector require skilled labour and hence will search for that type of
labour, whereas skilled workers prefer to work in the skilled sector since it will pay a higher
wage. To make this more explicit we introduce the matching process in the analysis. 11
mv
q(�) q�, q
��< 0
d(�) 1
[�.q(�)]d�
< 0
u�
x
[x�1
d(�)]
u�
< 0
[1998] J. Muysken and B.J. Ter Weel / Overeducation and Crowding Out of Low-Skilled Workers 7
We assume the matching function to be linear and homogenous in unemployment and vacancies. Pissarides12
(1979), Blanchard and Diamond (1990), Layard, Nickell and Jackman (1991), Van Ours (1991) and Romer(1996) show that constant returns to scale is a satisfactory approximation to reflect the matching process and toadopt an appropriate matching function.
(1)
(2)
(3)
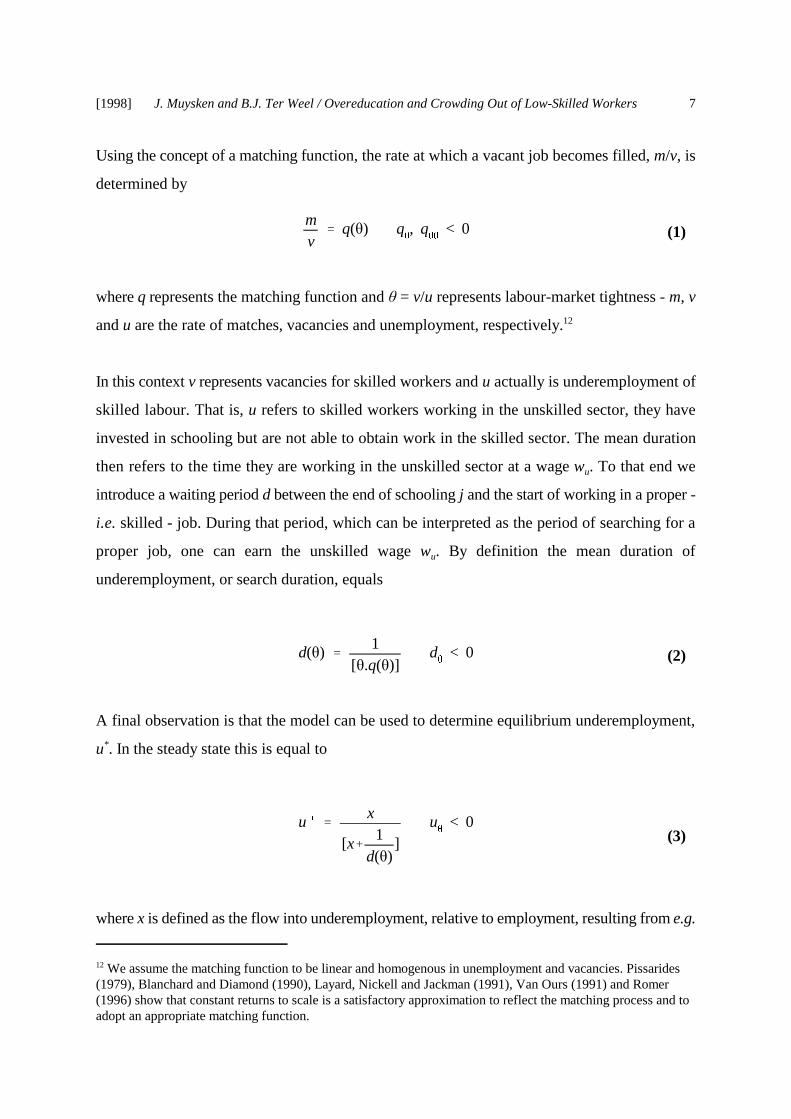
Using the concept of a matching function, the rate at which a vacant job becomes filled, m/v, is
determined by
where q represents the matching function and � = v/u represents labour-market tightness - m, v
and u are the rate of matches, vacancies and unemployment, respectively.12
In this context v represents vacancies for skilled workers and u actually is underemployment of
skilled labour. That is, u refers to skilled workers working in the unskilled sector, they have
invested in schooling but are not able to obtain work in the skilled sector. The mean duration
then refers to the time they are working in the unskilled sector at a wage w . To that end weu
introduce a waiting period d between the end of schooling j and the start of working in a proper -
i.e. skilled - job. During that period, which can be interpreted as the period of searching for a
proper job, one can earn the unskilled wage w . By definition the mean duration ofu
underemployment, or search duration, equals
A final observation is that the model can be used to determine equilibrium underemployment,
u . In the steady state this is equal to*
where x is defined as the flow into underemployment, relative to employment, resulting from e.g.
y f(k) fk > 0, fkk < 0
fk r � /
g f(k) (r � /)k
[1998] J. Muysken and B.J. Ter Weel / Overeducation and Crowding Out of Low-Skilled Workers 8
(4)
(5)
(6)
structural shifts in the demand for labour. As one might expect, equilibrium underemployment
will follow search duration d closely.
Wage Formation and Underemployment
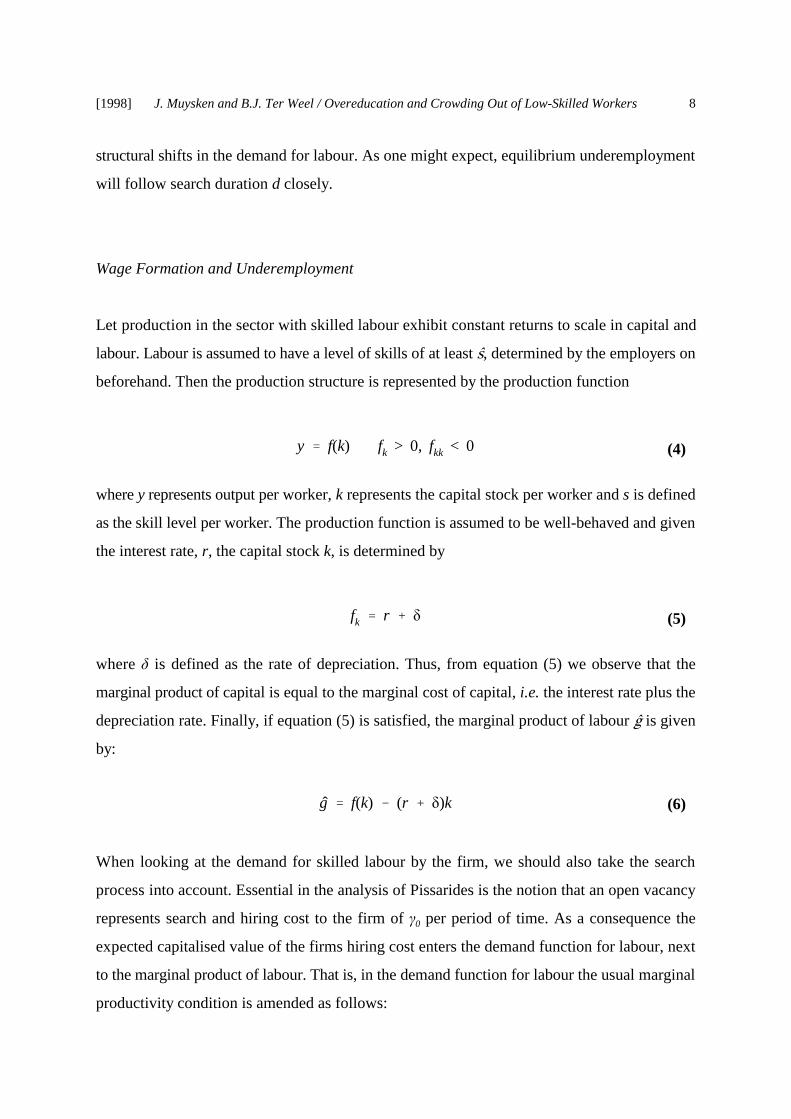
Let production in the sector with skilled labour exhibit constant returns to scale in capital and
labour. Labour is assumed to have a level of skills of at least ¹, determined by the employers on
beforehand. Then the production structure is represented by the production function
where y represents output per worker, k represents the capital stock per worker and s is defined
as the skill level per worker. The production function is assumed to be well-behaved and given
the interest rate, r, the capital stock k, is determined by
where / is defined as the rate of depreciation. Thus, from equation (5) we observe that the
marginal product of capital is equal to the marginal cost of capital, i.e. the interest rate plus the
depreciation rate. Finally, if equation (5) is satisfied, the marginal product of labour � is given
by:
When looking at the demand for skilled labour by the firm, we should also take the search
process into account. Essential in the analysis of Pissarides is the notion that an open vacancy
represents search and hiring cost to the firm of � per period of time. As a consequence the0
expected capitalised value of the firms hiring cost enters the demand function for labour, next
to the marginal product of labour. That is, in the demand function for labour the usual marginal
productivity condition is amended as follows:
ws g
(r�x)�0
q(�)
w�
s (1�)wu � �(� � ��0)
we wu �
�0.�
1�(�e �
r�xq(�e)
)
[1998] J. Muysken and B.J. Ter Weel / Overeducation and Crowding Out of Low-Skilled Workers 9
As Pissarides (1990), p. 12 states:“Workers are rewarded for the saving of hiring cost that the firm enjoys13
when a job is formed.” Burdett and Smith (1996) choose a different route by emphasising that the outsideoption for firms increases when more workers are available.
(7)
(8)
(9)
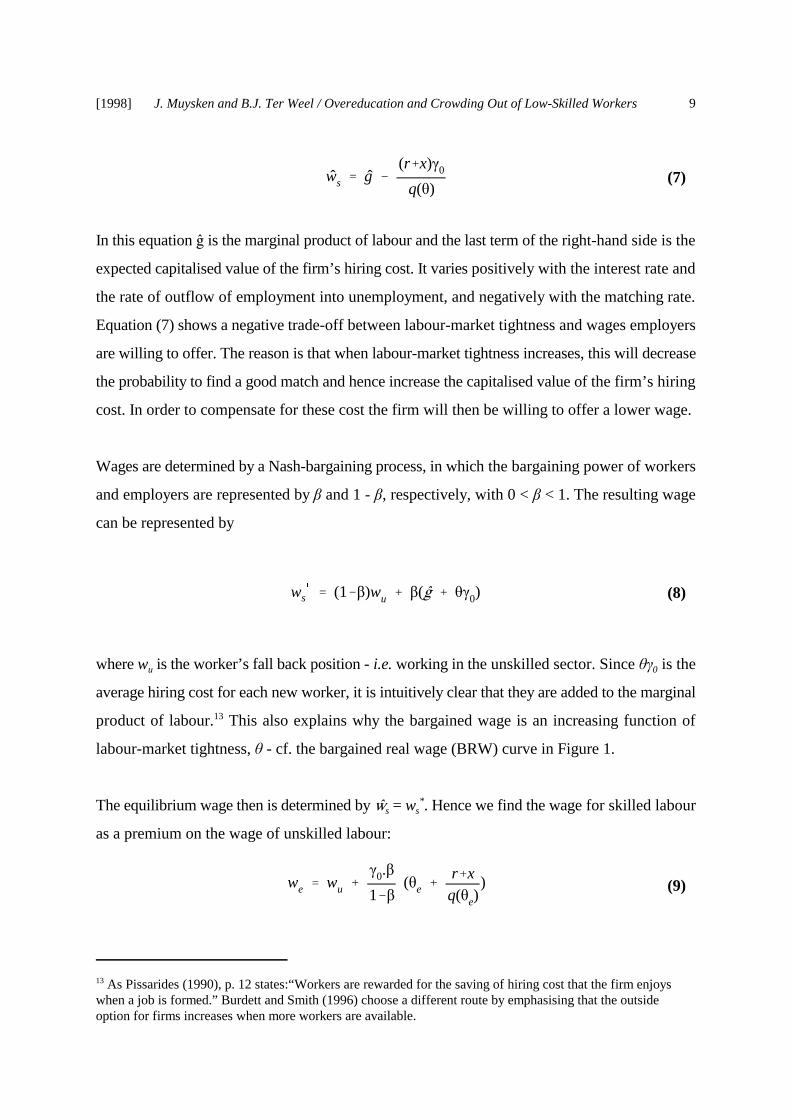
In this equation � is the marginal product of labour and the last term of the right-hand side is the
expected capitalised value of the firm’s hiring cost. It varies positively with the interest rate and
the rate of outflow of employment into unemployment, and negatively with the matching rate.
Equation (7) shows a negative trade-off between labour-market tightness and wages employers
are willing to offer. The reason is that when labour-market tightness increases, this will decrease
the probability to find a good match and hence increase the capitalised value of the firm’s hiring
cost. In order to compensate for these cost the firm will then be willing to offer a lower wage.
Wages are determined by a Nash-bargaining process, in which the bargaining power of workers
and employers are represented by � and 1 - �, respectively, with 0 < � < 1. The resulting wage
can be represented by
where w is the worker’s fall back position - i.e. working in the unskilled sector. Since �� is theu 0
average hiring cost for each new worker, it is intuitively clear that they are added to the marginal
product of labour. This also explains why the bargained wage is an increasing function of13
labour-market tightness, � - cf. the bargained real wage (BRW) curve in Figure 1.
The equilibrium wage then is determined by Í = w . Hence we find the wage for skilled labours s*
as a premium on the wage of unskilled labour:
s a.e.j. > 0
[1998] J. Muysken and B.J. Ter Weel / Overeducation and Crowding Out of Low-Skilled Workers10
� is implicitly defined by the equality of the right hand sides of equations (7) and (8).14e
For simplicity we assume A < ¹ , hence anybody will follow some schooling.15
(10)
where � is the equilibrium level of labour-market tightness. As one might expect the premiume
is increasing when the bargaining power of workers and the search and hiring cost increase.
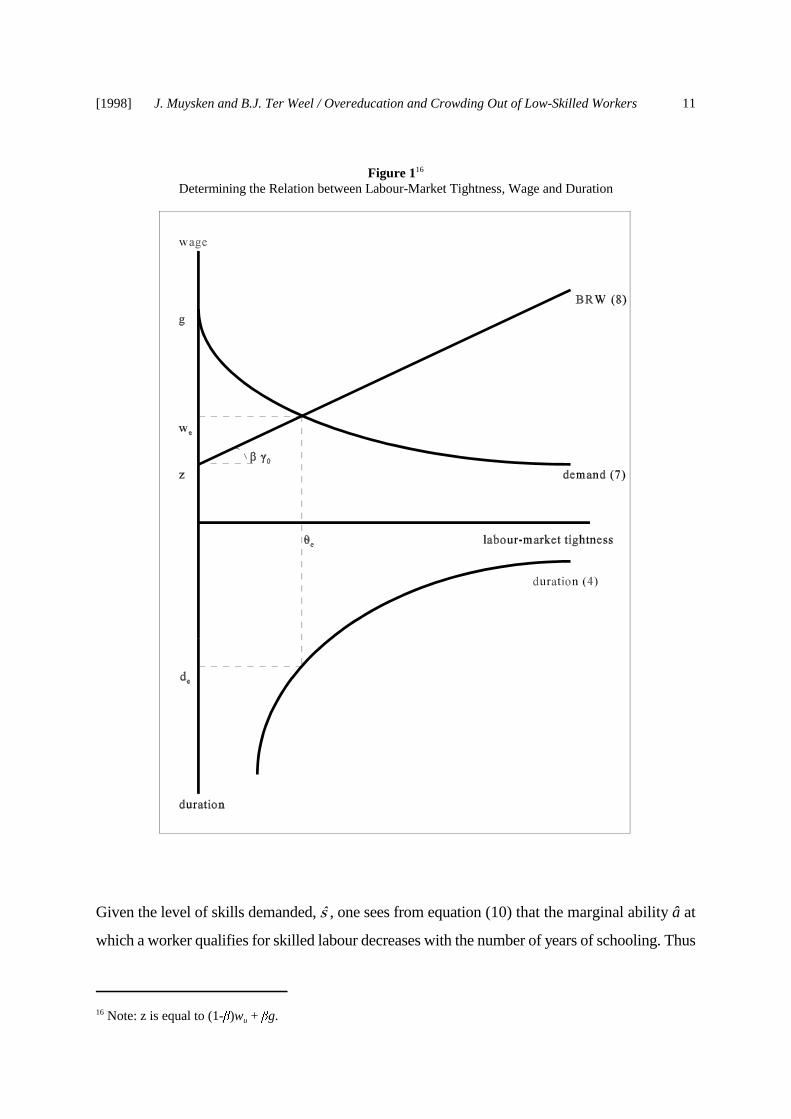
This equilibrium is illustrated in Figure 1. It is obvious that equation (8) - the BRW-curve - is
a straight line, increasing in labour-market tightness � with slope �� . Equation (7) - the demand0
for labour - on the other hand is decreasing in labour-market tightness: the higher the elasticity
of the matching function is with respect to � in absolute terms, the stronger the function will be
sloping downward. The intersection between both lines defines � and w . The lower half ofe e 14
Figure 1 shows the inverse relationship between duration and labour-market tightness - cf.
equation (2). Thus the equilibrium labour-market tightness � determines search duration d . Ande e
the equilibrium rate of underemployment is determined by substituting d in equation (3).e
Supply of Skills and Schooling
With respect to supply of labour we assume an ability distribution over the labour force N. More
specific, we assume that abilities a are distributed uniformly over the range [0, A]. However,
although abilities imply a certain amount of skills, the skills can be improved by schooling. 15
Therefore, we define the level of skills s as a positive function of ability a and years of education
j. A convenient expression is:
Thus workers with an ability below the level of skills required in the skilled sector, ¹, can try to
obtain work in that sector by schooling themselves. The parameter . indicates the productivity
of schooling - the higher ., the more productive is schooling.
[1998] J. Muysken and B.J. Ter Weel / Overeducation and Crowding Out of Low-Skilled Workers11
Note: z is equal to (1-�)w + �g.16u
Figure 116
Determining the Relation between Labour-Market Tightness, Wage and Duration
Given the level of skills demanded, ¹ , one sees from equation (10) that the marginal ability â at
which a worker qualifies for skilled labour decreases with the number of years of schooling. Thus
L s
N P
A
a(j)
da 1 s.e.j
A
P�
0
wuertdt P
j
0
(c�wu)ertdt � P
�
j
wsertdt
P�
0
wuertdt P
j
0
(c�wu)ertdt � P
j�de
j
wuertdt � P
�
j�de
weertdt
[1998] J. Muysken and B.J. Ter Weel / Overeducation and Crowding Out of Low-Skilled Workers12
(11)
(12)
(13)
supply of skilled labour is determined by the years of schooling in the following way:
It is obvious that supply of skilled employment increases with years of schooling. The remaining
part of the labour force, with ability below â, constitutes unskilled labour supply.
With respect to the determination of years of schooling, we follow the tradition of human capital
theory. Therefore we assume that schooling is an investment decision, with regard to the years
of education, that pays off by means of a higher wage. While unskilled work pays a wage w , itu
is expected that a higher educational level will earn a higher wage w . From human capital theorys
we know that the individual with a marginal ability will obtain education for j years such that
holds. In this equation r represents the rate of interest and c corresponds to the real cost of
schooling per year (minus any direct utility from schooling).
However, due to the introduction of the search process, we have to adapt the above representation
of human capital theory to explain this phenomenon. Since skilled workers expect a search
duration d as determined in Figure 1, they expect to earn w during d periods, before earninge u e
the skilled wage w . Therefore, we elaborate equation (12) in the following manner:e

we erde[erj
1] (2wu�c) � wu
[1998] J. Muysken and B.J. Ter Weel / Overeducation and Crowding Out of Low-Skilled Workers13
We assume that the expectations will always be realised.17
(14)
where w and d are defined by the analysis in Figure 1. Solving equation (13), yieldse e17
Equation (14) gives an implicit solution j of years of schooling of the individual with a marginale
ability, such that the required skill level ¹ is reached. Substituting j in equation (11) thene
determines supply of skilled labour.
It should be emphasised that equation (14) refers to the individual with the marginal ability. For
others with a higher ability will obtain less schooling. Actually, individuals in the range [â, A]
will follow precisely sufficient years of schooling to obtain skill ¹ . This follows immediately
from the insight that the right-hand side of equation (13), which represents the total returns from
schooling, is decreasing in the number of years of schooling.
From equation (14) one sees that the marginal individual’s decision to obtain education depends
positively on the wage this person can earn after schooling, w , and negatively on forgone incomee
w , search duration d , and the cost of education c. However, it is remarkable that in the analysisu e
the level of skills required has no impact on schooling whatsoever. We will return to this point
below.
Equilibrium on the Skilled Labour Market
Thus far we have determined the wage rate w and supply of labour L , but demand for laboureS
still has not been discussed. Actually it is implicit in the analysis, and to point that out enhances
our understanding of the nature of the equilibrium of the labour market.
As is obvious from the above analysis, equilibrium is determined through the process of wage
L D
11 � x.de
. L S
[1998] J. Muysken and B.J. Ter Weel / Overeducation and Crowding Out of Low-Skilled Workers14
(15)
formation. Given the level of skills required, the equilibrium wage w is determined in ae
bargaining process. This implies that a certain labour-market tightness � and a correspondinge
search duration d are necessary to ensure that the bargained real wage - cf. equation (8) - equalse
the real wage employers are willing to offer - cf. equation (7). As a consequence the equilibrium
rate of underemployment is determined by substituting d in equation (3). This implies thate
employers will demand labour consistent with that rate, given a certain supply of labour. Hence
demand for labour L will equal: D
where L follows from substituting j - cf. equation (14) - in equation (11).Se
[1998] J. Muysken and B.J. Ter Weel / Overeducation and Crowding Out of Low-Skilled Workers15
Burdett and Smith (1996) use a somewhat related model to study the relation between matching and education18
- although they emphasise the bargaining process between (un)skilled workers and firms and pay no explicitattention to the duration of search.
This argument is also used by Kettunen (1994). However, he assumes that the matching probability will19
decrease again at higher levels of education, since he assumes that both the lump-sum costs and the variablecosts of accepting another job also increase with education.
3. The Impact of Skills
The Matching Process
In the above model employers in the skilled sector search for skilled labour at a given level of
skills. However, we ignored the fact that schooling has a positive impact on the matching process
since more job opportunities arrive when the level of education is higher. For a higher educated18
person can perform a job at a lower level, but a lower educated person cannot perform a job at
a higher level, an employer will prefer to hire a person with a higher level of education for a
lower skilled job at the same wage he would pay a lower skilled worker for at least two reasons.19
First, the worker may turn out to be more productive than a lower skilled worker - which will be
compensated by a higher wage to an extent depending on the bargaining power of both parties.
Second the lower skilled job provides a good opportunity to observe and monitor the qualities
of the worker, before he might be offered a higher skilled job. This argument is consistent with
the screening hypothesis and the job queue theory mentioned in the introduction. Screening
theory underscores information generated on individuals by education. The general idea is that
higher educated and, therefore, highly skilled individuals are more productive than less educated
and skilled individuals. Spence (1973) describes this process as follows. An applicant knows his
productivity and skills when he applies for a job. However, the employer observes both
exogenous indices like e.g. race, age and gender and endogenous signals given by the applicant
like e.g. education and commitment to influence his choice. The employer uses these both the
exogenous and endogenous variables to estimate the applicant’s productivity, i.e. he computes
a kind of inference rule. Now, an equilibrium is obtained when the applicants’s signals given the
inference rule and the inference rule itself are correct. Since information is imperfect, a potential
employee’s productivity cannot be recognised on beforehand and hence employing a worker at
mv
q(�, s/s) qs > 0, q�, q
��< 0, s � s
d(�, s/s) 1
[�.q(�, s/s)]ds, d
�< 0
u(�, s/s) x
x�1
d(�, s/s)
[1998] J. Muysken and B.J. Ter Weel / Overeducation and Crowding Out of Low-Skilled Workers16
(16)
(17)
(18)
first on a low-skilled job is a good opportunity for the employer to monitor his newly hired
employee. The related labour queue theory assumes that specific skills are required which have
to be acquired by on-the-job training. However, firm specific training involves costs. Since, well-
educated individuals are more easily to train, and the costs involved are therefore lower, these
individuals are in front of the labour queue. In Thurow’s words: “Education and training have
to great extent been based on a ‘wage competition’ view of the labour market. They have not had
the predicted impact since they have ignored ‘job competition’ elements in the labour market.”
(Thurow, 1979, pp. 17-18). Instead of competing against each other based on wages, individuals
compete for jobs based on background characteristics.
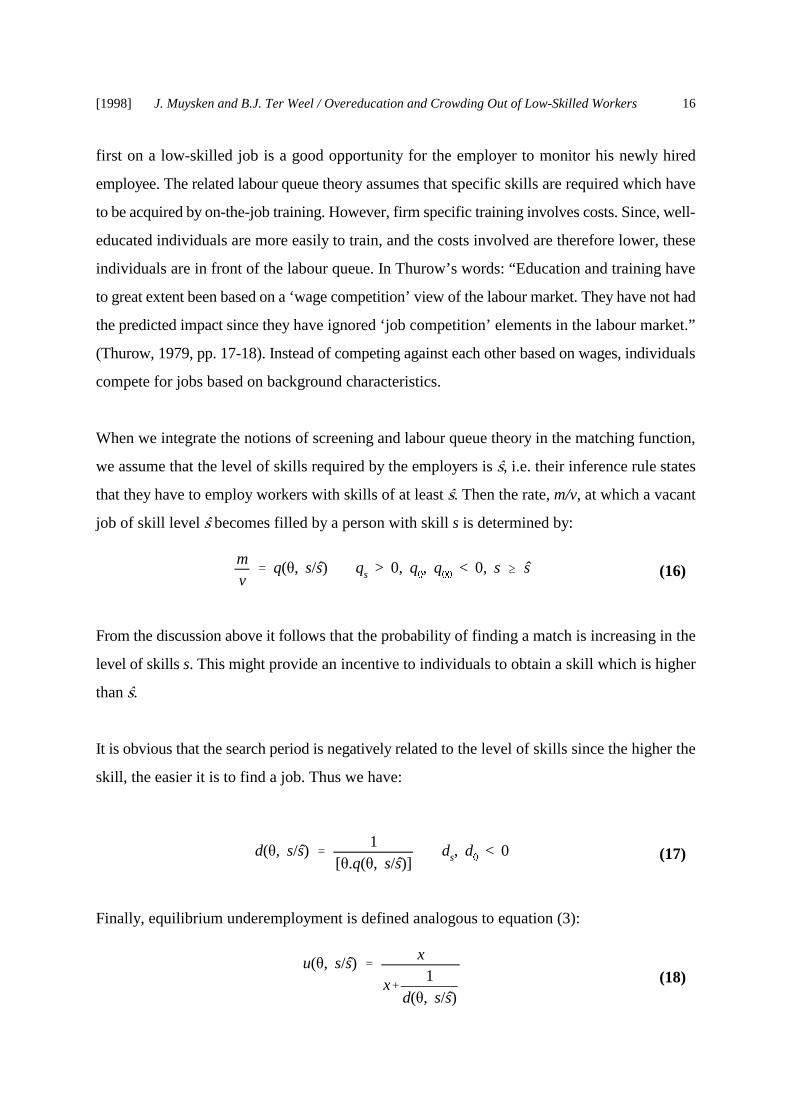
When we integrate the notions of screening and labour queue theory in the matching function,
we assume that the level of skills required by the employers is ¹, i.e. their inference rule states
that they have to employ workers with skills of at least ¹. Then the rate, m/v, at which a vacant
job of skill level ¹ becomes filled by a person with skill s is determined by:
From the discussion above it follows that the probability of finding a match is increasing in the
level of skills s. This might provide an incentive to individuals to obtain a skill which is higher
than ¹.
It is obvious that the search period is negatively related to the level of skills since the higher the
skill, the easier it is to find a job. Thus we have:
Finally, equilibrium underemployment is defined analogous to equation (3):
1q
.qs > 1. .de
.erje
erj e1
[1998] J. Muysken and B.J. Ter Weel / Overeducation and Crowding Out of Low-Skilled Workers17
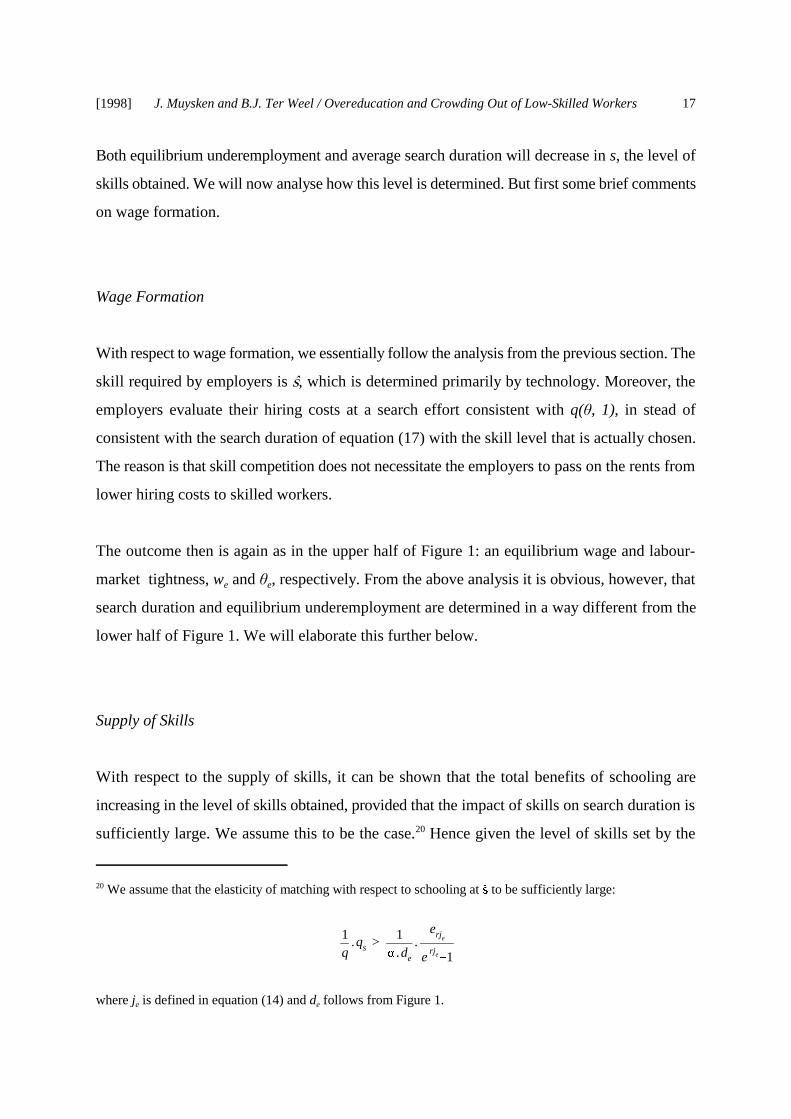
We assume that the elasticity of matching with respect to schooling at ¹ to be sufficiently large:20
where j is defined in equation (14) and d follows from Figure 1.e e
Both equilibrium underemployment and average search duration will decrease in s, the level of
skills obtained. We will now analyse how this level is determined. But first some brief comments
on wage formation.
Wage Formation
With respect to wage formation, we essentially follow the analysis from the previous section. The
skill required by employers is ¹, which is determined primarily by technology. Moreover, the
employers evaluate their hiring costs at a search effort consistent with q(�, 1), in stead of
consistent with the search duration of equation (17) with the skill level that is actually chosen.
The reason is that skill competition does not necessitate the employers to pass on the rents from
lower hiring costs to skilled workers.
The outcome then is again as in the upper half of Figure 1: an equilibrium wage and labour-
market tightness, w and � , respectively. From the above analysis it is obvious, however, thate e
search duration and equilibrium underemployment are determined in a way different from the
lower half of Figure 1. We will elaborate this further below.
Supply of Skills
With respect to the supply of skills, it can be shown that the total benefits of schooling are
increasing in the level of skills obtained, provided that the impact of skills on search duration is
sufficiently large. We assume this to be the case. Hence given the level of skills set by the20
..s�.ds[�e,s�
s] 1 �
2wu � c
[we wu].er.d[�e,
s�
s]
we er.d(�e,
s�
s)[er.j�
1] (2wu�c) � wu
[1998] J. Muysken and B.J. Ter Weel / Overeducation and Crowding Out of Low-Skilled Workers18
(19)
(20)
entrepreneurs ¹, there is always a potential for higher skills. This is also consistent with the
notion mentioned above that skill competition does not necessitate the employers to pass on the
rents from lower hiring costs to skilled workers.
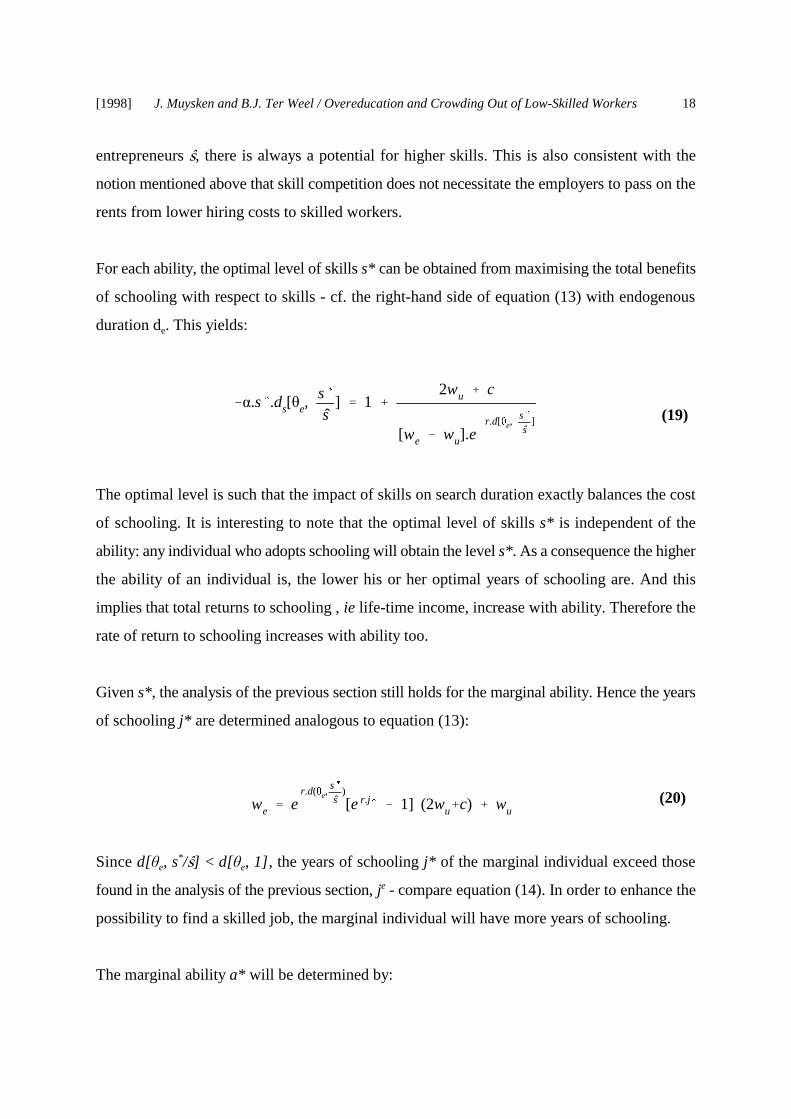
For each ability, the optimal level of skills s* can be obtained from maximising the total benefits
of schooling with respect to skills - cf. the right-hand side of equation (13) with endogenous
duration d . This yields:e
The optimal level is such that the impact of skills on search duration exactly balances the cost
of schooling. It is interesting to note that the optimal level of skills s* is independent of the
ability: any individual who adopts schooling will obtain the level s*. As a consequence the higher
the ability of an individual is, the lower his or her optimal years of schooling are. And this
implies that total returns to schooling , ie life-time income, increase with ability. Therefore the
rate of return to schooling increases with ability too.
Given s*, the analysis of the previous section still holds for the marginal ability. Hence the years
of schooling j* are determined analogous to equation (13):
Since d[� , s /¹] < d[� , 1], the years of schooling j* of the marginal individual exceed thosee e*
found in the analysis of the previous section, j - compare equation (14). In order to enhance thee
possibility to find a skilled job, the marginal individual will have more years of schooling.
The marginal ability a* will be determined by:
a�
s�.e..j�. > 0
[1998] J. Muysken and B.J. Ter Weel / Overeducation and Crowding Out of Low-Skilled Workers19
One might argue that this is inconsistent with rational expectations. However, in this case the employers state21
their wages in the context of a wage bargaining process. Their claim will be that they demand a wage consistentwith a level of skills ¹. And it is in their interest to keep the wage as low as possible since when they laterdemand more persons because the hiring costs turn out to be lower, the resulting profits will be higher.
A similar argument is found in Groot and Hoek (1997) who argue the decline in search and hiring costs can22
be explained from labour queue theory. For in a slack labour market, as is currently experienced in theNetherlands, labour queues are longer than job queues. In these relatively long labour queues workers at the endof the queue remain unemployed. Now, a rise in the level of education in a slack labour market, does not lead toa higher wage but to lower hiring cost on the side of employers because they face a better educated andtherefore more easy to employ workforce.
(21)
Since both j < j* and ¹ < s , the impact on the marginal ability has opposite effects. However,e *
it can be shown that these effects neutralise each other such that the marginal ability a* is exactly
equal to the marginal ability â found in the previous section - cf. equation (11).This implies that
supply of labour is equal to that of the analysis in the previous section in terms of number of
persons. However, the level of skills is higher.
Equilibrium and overeducation
Since the level of skills is higher, search duration is lower and therefore equilibrium
underemployment is lower as can be seen from equation (18). We then know from equation (15)
that demand for skilled labour will be higher. The reason for a higher demand for labour lies in
the lower hirings costs than expected. Employers evaluate the expected hiring costs at a skill ¹,
whereas the skills turn out to be higher at a level s*. As a consequence the matching process21
is improved and hiring costs are lower. At the same wage then more persons will be hired.22
When we compare this situation with the situation in the previous section, where the impact of
skills on the matching process is ignored, the following observations can be made. The level of
skills demanded by employers and the wage rate for skilled labour have not changed. The same
number of persons will offer skilled labour. However, the level of skills offered s* is higher and
lies above the level of skills ¹ demanded. In that sense overeducation is a general phenomenon
for skilled labour. Since wages have not increased, this implies lower returns to schooling, while

[1998] J. Muysken and B.J. Ter Weel / Overeducation and Crowding Out of Low-Skilled Workers20
In that sense overschooling can be said to cause the chimney-effects as discussed in Van Zon, Muysken and23
Meijers (1998).
schooling attainment has increased. Moreover, the rate of return to overschooling is positive for
all persons with a skill higher than the marginal skill. This follows from the observation made
above that the total returns to schooling increase with ability.
On the other hand, the rate of underemployment is lower. Hence less skilled persons will be
working in the low-skilled sector. And therefore also less crowding out will take place.23
These observations show already that it can be used to explain the stylised facts which we have
discussed in the introduction of our paper. However, for a proper discussion, we have to analyse
evolution of the labour market in the course of time. This is the subject of the next section.
[1998] J. Muysken and B.J. Ter Weel / Overeducation and Crowding Out of Low-Skilled Workers21
See various papers in Muysken and De Neubourg (1989).24
An overview is presented in Muysken (1989).25
The same holds for the impact of the demand shock resulting from the oil crises.26
4. The Stylised Facts Explained
It seems reasonable to argue that several of the variables which are exogenous to our analysis
have changed in the course of time and therefore had an impact on overeducation and
underemployment as can be explained from the analysis in the previous section. The resulting
picture then is consistent with the stylised facts as we shall show below.
Changes over Time in Exogenous Variables
We first look at the process of wage formation as depicted in the upper half of Figure 1. The
slope of the wage offered by employers - cf. equation (7) - is equal to -(r + x).� .0(q, �)/ q, where0
0(q, �) is the absolute value of the elasticity of matching with respect to labour-market tightness.
The slope of the bargained wage - cf. equation (8) - is equal to �� . Hence the higher the hiring0
costs are and the stronger the bargaining power of workers is, the steeper equation (8) will be.
Moreover, higher hiring costs also imply a stronger slope of equation (7). The same holds for a
higher of interest and a higher rate of turnover.
Actually, in the early seventies most of these variables have increased. Moreover, the UV-curve24
shifted outwards, indicating a deterioration of the matching process. This also had an impact25
on the slope of equation (7). The resulting shifts are shown in Figure 2, which shows how a26
higher wage resulted, together with a slacker labour market - cf. the increase from w to w and1 2
the decrease from � to � , respectively. The consequences of this process for un(der)employment1 2
can be derived from the lower half of Figure 2, through the impact on duration. While the slacker
labour market already implies an increase in duration of unemployment, the impact was
worsened by the outward shift in the duration curve due to the worsening of the matching
[1998] J. Muysken and B.J. Ter Weel / Overeducation and Crowding Out of Low-Skilled Workers22
Van der Geest (1995) gives four reasons for the decline in the Netherlands. In the first place he notes that27
large industrial firms with a lot of unskilled workers have disappeared. This is attended by a decline in unionmembership. Secondly, a change in the composition of the labour force from un- and low-skilled male workersto a well-educated workforce with many women and part time workers involved has led to a decline in unionmembership. Thirdly, cultural changes like individuality accompanied an adverse shock to union membership.Finally Van der Geest argues that due to decentralised wage bargaining the unions lost bargaining power.
See for recent studies in the Netherlands Lever (1995), Van Lede (1995) and Koeman (1996). Kleinknecht28
(1996) counter argues with respect to the success of wage moderation that employment growth is only observedbecause of a lack in labour productivity relative to other OECD countries.
process.
Many of these tendencies have been reversed in the eighties and nineties. Although no hard
figures are available, it seems highly plausible that the power of the unions � and the search and
hiring costs � have declined, when compared to the early seventies. For instance, in the0
Netherlands the percentage union members among the working labour force fell from 38% in
1975 to 25% in 1996. In addition, since the early 1980s wage moderation has been an important27
component of labour-market policy. 28
The decline in search and hiring costs can be explained by the increase in part-time working. The
OECD (1998, pp. 160-166) argues that even when schedules in a firm are fixed within the
working day, part-time employment may add to flexibility if it can be arranged to coincide with
peaks in labour requirements. In establishment surveys in some European countries, the majority
of managers said that the primary reason for the introduction of part-time working was to meet
the needs of the firm. In such circumstances, managers favoured shorter hours (< 20 a week), and
mainly saw a need for low-skilled part-time workers. Moreover, for the European Union,
calculations from the European Union Labour Force Survey show that one-third of all part-time
workers are employed during evenings, nights and weekends. Particularly and most importantly,
part-time workers are very unlikely to attract overtime premiums and may well be cheaper than
the same hours worked by full-time workers. Finally, it should be noted that the extent of part-
time employment is very large in the Netherlands. In 1996 the part-time employment as a
percentage of total employment was 36.5% whereas it was only 16.6% in 1979. By contrast,
Austria, Belgium, Finland, France, Portugal and Spain do not even reach the Dutch 1979-level
in 1996, while Sweden and Switzerland are numbers two and three with only 23.6% and 27.4%
[1998] J. Muysken and B.J. Ter Weel / Overeducation and Crowding Out of Low-Skilled Workers23
Sufficient conditions are that for duration d , d < 0 does hold, and the right-hand side of equation (19)29s� ss
exceeds 1 + ..
part-time workers - cf. OECD (1998).
These trends will lead to a reversion of the process in the seventies as depicted in the upper half
of Figure 2. Wages have a tendency to decrease from w towards w and labour-market tightness2 1
will increase from � to � .2 1
From the point of view of our analysis also an important change did occur in the matching
process. It seems plausible that the impact of schooling on matching has increased strongly. Such
an effect has been underlined by, amongst others, Howell and Wolff (1992) for the US and by
Goux and Maurin (1995) for France. These authors argue that the increased demand for skilled
labour could be stimulated by slacks in labour markets which induce longer stays in initial formal
education to delay entry into the labour market and by individuals trying to improve their chances
of finding employment. In their view the increased demand for education therefore certainly is
a part of the explanation for increasing average levels of education and the number of years of
education attended as apparent in all OECD countries.
The observation that increased demand for schooling may result from a slack labour market is
consistent with our analysis, since a change in labour-market tightness will affect the optimal
level of skills and hence schooling. From equation (19) it can be derived that under plausible
assumptions a slack labour market will correspond to a higher level of skills, i.e. ds*/d� < 0.29
This is also intuitively clear since in a slack labour market the matching probability is lower and
hence there is a higher need for additional schooling.
However, it also seems plausible that the elasticity of matching with respect to schooling has
increased. Employers are believed to be more focussed on skills nowadays than they were in the
early seventies. One of the reasons is a rachet effect: once a level of skills is provided above the
level demanded by the employers, the employers will automatically adapt to that level and hence
demand higher skills than they originally intended to do. Another reason is the larger availability
of schooling opportunities in general. Amongst others these reasons imply an inward shift of the
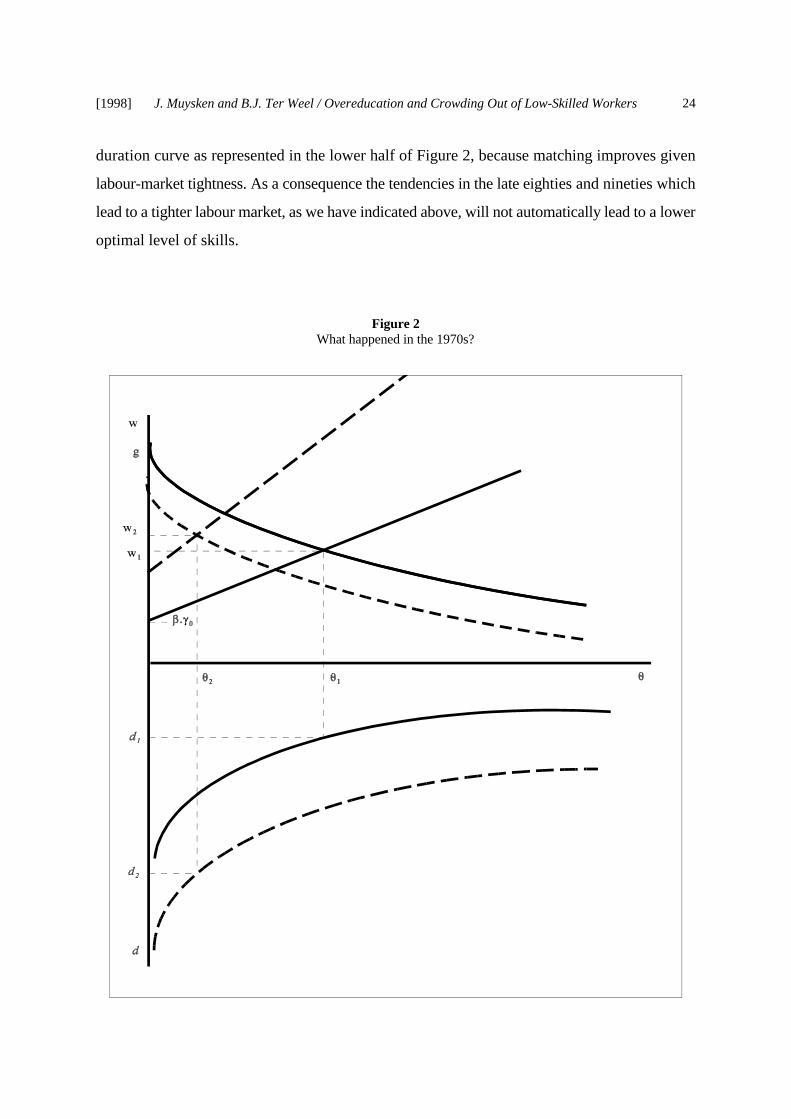
[1998] J. Muysken and B.J. Ter Weel / Overeducation and Crowding Out of Low-Skilled Workers24
duration curve as represented in the lower half of Figure 2, because matching improves given
labour-market tightness. As a consequence the tendencies in the late eighties and nineties which
lead to a tighter labour market, as we have indicated above, will not automatically lead to a lower
optimal level of skills.
Figure 2What happened in the 1970s?

[1998] J. Muysken and B.J. Ter Weel / Overeducation and Crowding Out of Low-Skilled Workers25
Also an important reservation should be made with regard to the analysis above, for not all
workers faced a decline in search duration during the 1980s and 1990s. If search duration would
have fallen to the levels of the 1960s and early 1970s, unemployment levels should be down too.
This is not what we observe in the contemporary Dutch labour market. Only high-skilled workers
have faced a dramatic fall in search duration and unemployment in the second half of the 1990s,
which was mainly due to an upturn in the economy in favour of high-skilled workers. This notion
of skill-biased technical change has reduced the demand for low-skilled workers relative to high-
skilled workers; particularly in the R&D-intensive and rapidly expanding sectors of the Dutch
economy - cf. Bruinshoofd and Ter Weel (1998) for a recent empirical analysis.
In addition, hysteresis in unemployment - in particular in the low-skilled sector - should be taken
into account. As explained in e.g. Lindbeck and Snower (1986), it can be acknowledged that
long-term unemployed workers are not included in the (Nash) bargaining process of wage
determination. Thus wages are set so that involuntary unemployment remains (and becomes
long-term), but the unemployed are nevertheless unable to improve their position through
underbidding. These latter notions are not included in our present analysis. Nonetheless, our
analysis highlights some aspects of skill formation and the matching process that enable us to
explain the stylised facts mentioned above.
The Stylised Facts
In the introduction we presented four related stylised facts, which we have elaborated on in our
analysis. First, we have shown that the returns to schooling have declined strongly over time
which is in line with our first observation. Our intuition was that nowadays people invest in
schooling not only to obtain higher wages but also to get a decent job. In our framework we have
shown that this statement could plausibly be modelled and explained by taking into account both
supply and demand side characteristics of the labour market.
Secondly, the general level of overeducation is explained. Not only are individuals who cannot
become employed in the skilled sector overeducated, also workers in the skilled sector turn out

[1998] J. Muysken and B.J. Ter Weel / Overeducation and Crowding Out of Low-Skilled Workers26
to be overeducated. This can be explained in line with our first findings that the investment
decision is not merely taken to maximise life-time income, as would be the outcome of human
capital theory.
Thirdly, we have shown that unemployment for low educated persons is much higher than for
high educated persons. Skilled individuals who cannot get a job in the skilled sector are by
definition employed in the unskilled sector. This means that the general tendency towards
overeducation - and therefore an increase in the amount of skilled labour supplied - leads to a
further deterioration of the labour-market position of unskilled labour, which among others leads
to crowding out.
Finally, the statement that the rate of return on overeducation is positive can be observed from
the skilled labour market. In the analysis above, we have shown that this holds for the worker
with an ability higher than the marginal ability.
[1998] J. Muysken and B.J. Ter Weel / Overeducation and Crowding Out of Low-Skilled Workers27
5. Concluding Remarks
This paper is a contribution to economic theory to the extent that it provides a systematic
approach to incorporate several labour-market theories into one model. In addition, the model
is able to explain several observations from the Dutch economy which could so-far not be
explained by the existing models.
Building a theoretical framework along the search-theoretic lines of Pissarides (1990) and
extending this model with human capital, labour queue and screening theory, we have been able
to explain four stylised facts. First we have provided a solid basis for the paradox that the returns
to schooling have declined strongly while attainment remained the same. Our explanation is that
individuals prefer to invest in schooling not only to maximise their life-time income (human
capital theory) but to increase the chance (search theory) that they will obtain a proper job (job
competition and screening theory). Combining these approaches we can rather straightforward
explain the general level of overeducation. In addition, it is clear from our analysis that the
returns to overschooling are lower than the returns to the required level of schooling, but still
positive.
In line with the observation that a general level of overschooling is prevalent in the Netherlands,
we are able to explain that low-skilled workers have more difficulties in finding a job than their
high-skilled colleagues. Since there are only a limited number of jobs, individuals who embody
higher levels of human capital are in front of the labour queue, give the right signals to
employers, and have therefore the best chance to become employed. Hence, low-skilled
individuals observe higher unemployment rates. This phenomenon is made stronger by the fact
that high-skilled workers who cannot obtain a job in the high-skilled sector will be employed in
the low-skilled sector, thereby crowding out low-skilled workers.
[1998] J. Muysken and B.J. Ter Weel / Overeducation and Crowding Out of Low-Skilled Workers28
Literature
Becker, G.S. (1962). “Investment in Human Capital: A Theoretical Analysis.” Journal ofPolitical Economy, vol. 70, no. 1, pp. 9-49.
Beer, P. d. (1996). “Laag Opgeleiden: Minder Kans op een Baan, meer Kans op Ontslag.”Economisch Statistische Berichten, 06-11-1996, pp. 908-912.
Blanchard, O. J. and P. A. Diamond (1990). “The Aggregate Matching Function.” NBERWorking Paper 4000, Cambridge MA.
Bruinshoofd, W.A. and B.J. Ter Weel (1998). “Skill-Biased Technical Change: On Technologyand Wages in the Netherlands.” MERIT Research Memorandum 2/98-024.
Burdett, K. and E. Smith (1996). Education and Matching Externalities. Acquiring Skills. MarketFailures, Their Symptoms and Policy Responses. A. S. Booth and D. J. Snower.Cambridge MA, Cambridge University Press, pp. 63-80.
Eijs, P. v. and H. Heijke (1996). The Relation between the Wage, Job-related Training and theQuality of the Match between Occupations and Types of Education. Maastricht, ROA.
van der Geest, L. (1995). “De Neergang van de Vakbeweging.” Economisch StatistischeBerichten, 23-08-1995, pp. 729.
Gelderblom, A. and J. d. Koning (1994). “Leren: Batig Investeren?” Den Haag, OSA.
Gelderblom, A., J. d. Koning and J. Odink (1997). “Loont Studeren?” Economisch StatistischeBerichten, 18-06-1997, pp. 500-504.
Gottschalk (1997). “Inequality, Income Growth, and Mobility: The Basic Facts”, Journal ofEconomic Perspectives, Spring 1997, vol. 11, no. 2, pp. 21-40.
Goux, D. and E. Maurin (1996), Changes in the Demand for Labour in France, STI Review, No.18, OECD Paris.
Groeneveld, S. (1996), “Het Meten van Overscholing.” Economisch Statistische Berichten, 05-06-1996, pp. 511.
Groot, W. and H. Maassen van den Brink (1996). “Overscholing en Verdringing op deArbeidsmarkt.” Economisch Statistische Berichten, vol. , no. pp. 74-77.
Groot, L. and A. Hoek (1997). Job Competition in the Dutch Labour Market. LOWER, London.
Hartog, J. (1997). On Returns to Education: Wandering along the Hills of ORU land. (AEA),Maastricht, MacMillan.
[1998] J. Muysken and B.J. Ter Weel / Overeducation and Crowding Out of Low-Skilled Workers29
Hollanders, H. en B.J. Ter Weel (1998). “Skill-Biased Technological Change in an EndogenousGrowth Model.” MERIT Research Memorandum 2/98-019.
Howell, D.R. and E.N. Wolff (1991), “Trends in the Growth and Distribution of Skills in the USWorkplace 1960-1985.” Industrial and Labour Relations, vol. 44, no. 3, pp. 186-219.
Kettunen, J. (1994). “The Effects of Education on the Duration of Unemployment.” Labour, vol.8, no. 2, pp. 331-352.
Kleinknecht, A. (1996). “Potverteren met Loonmatiging en Flexibilisering.” EconomischStatistische Berichten, 21-08-1996, pp. 622-625.
Koeman, J. (1996). “Loonmatiging en Macro-Economie.” Economisch Statistische Berichten,21-08-1996. 692-693.
Layard R., S. J. Nickell and R. Jackman (1991). Unemployment. New York, Oxford UniversityPress.
van Lede, C. J. A. (1995). “Werk Boven Inkomen: Wensdroom of Werkelijkheid?” EconomischStatistische Berichten, 04-10-1995, pp. 876-880.
Lever, M. H. C. (1995). “Cao's en Werkgelegenheid.” Economisch Statistische Berichten, 29-03-1995, pp. 300-303.
Linbeck, A. and D.J. Snower (1986). “Wage Setting, Unemployment, and Insider-OutsiderRelations.” American Economic Review, vol. 76, no,. 2, AEA Papers and Proceedings,pp. 235-239.
Muyksen, J. (1989). “Classification of Unemployment: Analytical and Policy Relevance” DeEconomist, vol. 137, no. 4, pp. 397-424.
Muyksen, J. and C. de Neubourg (eds.) (1989). Unemployment in Europe, MacMillan, London.
OECD (1998), Employment Outlook, OECD Paris.
Oosterbeek, H. and D. Webbink (1996). “Over Scholing, Overscholing en Inkomen.”Economisch Statistische Berichten, 13-03-1996, pp. 240-241.
Phelps, E. S. (1994). Structural Slumps. Cambridge MA, Harvard University Press.
Pissarides, C. A. (1979). “Job Matching with State Employment Agencies and Random Search.”Economic Journal, vol. 89, no. 3, pp. 818-833.
Pissarides, C. A. (1990). Equilibrium Unemployment Theory. Cambridge, MA, Basil BlackwellLtd.
[1998] J. Muysken and B.J. Ter Weel / Overeducation and Crowding Out of Low-Skilled Workers30
Romer. D. (1996). Macroeconomics. McGraw-Hill, New York.
Schultz, T. W. (1961). “Investment in Human Capital.” American Economic Review, vol. 51, no.1, pp. 1-17.
Spence, A.M. (1973). “Job Market Signaling.” Quarterly Journal of Economics, vol.87, no. 3,pp. 355-74.
Thurow, L. C. (1975). Generating Inequality. Basic Books, New York.
Thurow, L. C. (1979). A Job Competition model, in: Priore (ed) Unemployment and Inflation:Institutionalist and Structuralist views, White Plains, New York: 17-32.
Topel, R. H. (1997). “Factor Proportions and Relative Wages.” Journal of EconomicPerspectives, vol. 11, no. 2, pp. 55-74.
Van Ours, J. C. (1991). “The Efficiency of the Dutch Labour Market in MatchingUnemployment and Vacancies.” De Economist, vol.139, no. 3, pp. 358-378.
Van Ours, J. C. (1995). “An Empirical Note on Employed and Unemployed Job Search.”Economics Letters, vol. 49, no. 4, pp. 447-452.
Van Ours, J. C. and G. Ridder (1995). “Job Matching and Job Competition: Are Lower EducatedWorkers at the Back of Job Queues?” European Economic Review, vol. 39, no. 9, pp.1717-1731.
Van Smoorenburg, M. en R. Van der Velden (1995). Schoolverlaters Tussen Onderwijs enArbeidsmarkt, ROA.
Webbink, D. (1996). Arbeidsmarktverwachtingen en Opleidingskeuze. ROA 10, Maastricht,Avessbury.
Weiss, A. (1995). “Human Capital vs. Signalling Explanations of Wages.” Journal of EconomicPerspectives, vol. 9, no. 4, pp. 133-154.
Zon, A. van, J. Muysken, H. Meijers (1998), Assymetric Skill Substitution, Labour MarketFlexibility, and the Allocation of Qualifications, in: H. Heijke and L. Borghans (Eds.),Towards a Transparent Labour Market for Educational Decisions, Avebury Publishers,London.