decision no. 388
TRANSCRIPT

PUBLIC COPYISBN No. 0114-2720
J3922
Decision No. 388
Determination pursuant to the Commerce Act 1986 in the matter of an application forclearance of a business acquisition involving:
New Zealand Seafood Investments Limited
and
Basuto Investments Limited
The Commission: M J Belgrave (Chair)M N BerryK M BrownE M Coutts
Summary ofProposed Acquisition: The acquisition by New Zealand Seafood Investments Limited
of 100% of the shares in Basuto Investments Limited.
Determination: Pursuant to s 66(3)(a) of the Commerce Act 1986, the majorityof the Division of the Commission determines to give clearancefor the proposed acquisition.
Date of Determination: 23 March 2000
CONFIDENTIAL MATERIAL IN THIS REPORT ISCONTAINED IN SQUARE BRACKETS [ ]

2
TABLE OF CONTENTS
THE PROPOSAL ..........................................................................................................................................4
THE PROCEDURES.....................................................................................................................................4
THE PARTIES...............................................................................................................................................4NEW ZEALAND SEAFOOD INVESTMENTS LTD ................................................................................................4AMALTAL ....................................................................................................................................................5TALLEY’S ....................................................................................................................................................5AMALGAMATED ...........................................................................................................................................5SANFORD .....................................................................................................................................................5BASUTO .......................................................................................................................................................5SEALORD .....................................................................................................................................................6
THE ASSOCIATION BETWEEN THE PARTIES ......................................................................................6
OTHER RELEVANT PARTIES...................................................................................................................7TREATY OF WAITANGI FISHERIES COMMISSION .............................................................................................7INDEPENDENT FISHERIES LTD (INDEPENDENT) ..............................................................................................7UNITED FISHERIES LTD (UNITED) .................................................................................................................8SIMUNOVICH FISHERIES LTD (SIMUNOVICH)..................................................................................................8VELA FISHING LTD (VELA)...........................................................................................................................8
BACKGROUND ............................................................................................................................................8SIZE OF THE FISHING INDUSTRY ....................................................................................................................8HISTORY PRIOR TO THE QUOTA MANAGEMENT SYSTEM ................................................................................8QUOTA MANAGEMENT SYSTEM ....................................................................................................................9INDIVIDUAL TRADABLE QUOTAS ..................................................................................................................9RECENT HISTORY OF QUOTA TRADING AND QUOTA LEASING ......................................................................10FUTURE CHANGES ......................................................................................................................................11SPECIES .....................................................................................................................................................12
Inshore Species .....................................................................................................................................12Deep-sea species...................................................................................................................................13Crustacean/Molluscs.............................................................................................................................14
FISHING TECHNIQUES .................................................................................................................................14PROCESSING...............................................................................................................................................15RATIONALISATION .....................................................................................................................................15
MARKET DEFINITION .............................................................................................................................16INTRODUCTION ..........................................................................................................................................16THE RELEVANT MARKETS ..........................................................................................................................17FINFISH MARKETS......................................................................................................................................18
Product Markets ...................................................................................................................................18Functional Markets...............................................................................................................................20Geographic Markets .............................................................................................................................21Conclusion on Finfish Markets..............................................................................................................22
SHELLFISH MARKETS .................................................................................................................................22Product Markets ...................................................................................................................................22Functional Markets...............................................................................................................................23Geographic Markets .............................................................................................................................24Conclusion on Shellfish Markets............................................................................................................24
CONCLUSION ON THE RELEVANT MARKETS.................................................................................................24
COMPETITION ANALYSIS ......................................................................................................................25INTRODUCTION ..........................................................................................................................................25THE MARKET FOR THE HARVESTING AND SUPPLY OF FINFISH IN NEW ZEALAND ..........................................26
Existing Competition.............................................................................................................................27Existing Competition.............................................................................................................................29Constraint from Competition in Downstream Markets ...........................................................................29Conclusion on Constraint from Existing Competition.............................................................................30
CONDITIONS OF ENTRY...............................................................................................................................30Individual Transferable Quota ..............................................................................................................30Harvesting Capacity .............................................................................................................................31

3
CONSTRAINTS FROM MARKET ENTRY .........................................................................................................32Likelihood and Sustainability of Entry ...................................................................................................32Extent of Entry ......................................................................................................................................33Timeliness of Entry ...............................................................................................................................33Conclusion on Constraints from Market Entry.......................................................................................33
CONCLUSION ON THE MARKET FOR THE HARVESTING AND SUPPLY OF FINFISH IN NEW ZEALAND .................34THE MARKET IN NEW ZEALAND FOR THE PROCESSING AND WHOLESALE SUPPLY OF FINFISH IN NEW ZEALAND
(“THE PROCESSING MARKET”) ...................................................................................................................34Market Concentration ...........................................................................................................................34Constraint from Existing Competition....................................................................................................36Potential Competition ...........................................................................................................................38Likelihood and Sustainability of Entry ...................................................................................................38Extent of Entry ......................................................................................................................................38Timeliness of Entry ...............................................................................................................................38Constraint from the Countervailing Power of Buyers .............................................................................38Conclusion on the Processing Market in New Zealand...........................................................................39
THE MARKET FOR THE PROCESSING AND WHOLESALE SUPPLY OF VALUE-ADDED FINFISH PRODUCTS IN NEW
ZEALAND (“THE VALUE-ADDED MARKET”)................................................................................................40Market Concentration ...........................................................................................................................40Constraint from Existing Competition....................................................................................................40Potential Competition ...........................................................................................................................41Conclusion on the Value-Added Market in New Zealand........................................................................41
THE MARKET FOR THE CULTIVATION AND SUPPLY OF GREENSHELL MUSSELS NEW ZEALAND ......................42Market Concentration ...........................................................................................................................42Existing Competition.............................................................................................................................42Potential Competition ...........................................................................................................................43Regulatory Compliance.........................................................................................................................43Capital Costs of Entry...........................................................................................................................43The “Lets” Test ....................................................................................................................................44Conclusion on the “Lets” Test...............................................................................................................44The Countervailing Power of Buyers and Suppliers ...............................................................................45Conclusion on the Market for the Cultivation and Supply of Greenshell Mussels in New Zealand ...........45
THE MARKET FOR THE HARVESTING AND SUPPLY OF SCALLOPS IN NEW ZEALAND.......................................45Market Concentration ...........................................................................................................................45Constraint from Existing Competition....................................................................................................46Potential Competition ...........................................................................................................................47Conclusion on the “Lets” test................................................................................................................48The Countervailing Power of Buyers and Suppliers ...............................................................................48Conclusion on the Market for the Harvesting and Supply of Scallops in New Zealand ............................48
THE MARKET FOR THE HARVESTING AND SUPPLY OF DREDGE OYSTERS IN NEW ZEALAND...........................49Market Concentration ...........................................................................................................................49Constraint from Existing Competition....................................................................................................50Potential Competition ...........................................................................................................................50The “Lets” Test .....................................................................................................................................51Conclusion on the “Lets” test................................................................................................................52Countervailing Power of Buyers and Suppliers......................................................................................52Conclusion on Market for the Harvesting and Supply of Dredge Oysters in New Zealand......................52Market Concentration ...........................................................................................................................52Constraint from Existing Competition....................................................................................................54The “Lets” Test ....................................................................................................................................55
OVERALL CONCLUSION.........................................................................................................................56
DETERMINATION ON NOTICE OF CLEARANCE ...............................................................................57
APPENDIX A…………………………………………………………………………..…………………….…58
APPENDIX B……………………………………………………………………………………………………59
DISSENTING OPINION OF K M BROWN AND E M COUTTS………………………………………….60

4
THE PROPOSAL
1 In a notice to the Commission dated 7 March 2000, pursuant to section 66(1) of theCommerce Act (the Act), New Zealand Seafood Investment Ltd (NZSI) soughtclearance to acquire a 100% share of Basuto Investments Ltd (“Basuto”). Basutocontrols 50% of the shares in the Sealord Group Ltd (“Sealord”).
THE PROCEDURES
2 The application was received on 7 March 2000. Section 66(3) of the Act requires theCommission either to clear or to decline to clear a notice given under section 66(1)within 10 working days, unless the Commission and the person who gave the noticeagree to a longer period. An extension of two working days was sought by theCommission. Accordingly, a decision was required by 23 March 2000.
3 The applicant advised the Commission that its initial indicative bid for Basuto must beaccompanied by any necessary clearances, and be submitted by 24 March 2000. Forthis reason, the applicant asked that the Commission treat the matter as urgent.
4 In the application NZSI sought confidentiality for sensitive commercial informationcontained in the application, and a confidentiality order was made in respect of thatinformation for a period of 20 working days from the Commission’s determination ofthe notice. When that order expires, the provisions of the Official Information Act1982 will apply to the information.
5 The Commission’s determination is based on an investigation conducted by its staff,and their subsequent advice to the Commission.
6 In the course of the investigation, Commission staff discussed the application with alarge number of parties, including fishermen, shellfish farmers, the Ministry ofFisheries, purchasers of fish and fish products, and fishery stakeholder companies.
THE PARTIES
7 There are many major parties within the fishing industry who will be affected by theacquisition. A diagram showing how the parties mentioned below are connected isattached in Appendix A.
New Zealand Seafood Investments Ltd
8 NZSI is an investment company, owned 50% by Amaltal Corporation Ltd (“Amaltal”)and 50% by Sanford Ltd (“Sanford”). It is being used as a vehicle for the purchase ofBasuto and is not involved in fishing per se.

5
Amaltal
9 Amaltal was formed through a joint venture by Talley’s Fisheries Ltd (“Talley’s”) andAmalgamated Marketing Ltd (“Amalgamated”) in 1983. Talley’s and Amalgamatedeach hold a 50% share. Amaltal is now reputedly New Zealand’s third largest fishingcompany and is involved in the procurement and processing of deep-sea fish. It ownsfour freezer trawlers and several fresh fish trawlers with long-line capacities. Amaltalexports 99.2%, with the remaining 0.8% sold on New Zealand markets as fresh fish.Examples of the species it catches include hoki, orange roughy, oreo dory, squid, ling,and hake.
Talley’s
10 Talley’s was established in 1936 and is a private company owned by Peter and MichaelTalley. Talley’s own both inshore and deep-sea fishing vessels, mussel farms, cool-store facilities, and specialised fish processing factories. Talley’s also contractsindependent fishermen to harvest fish for it, and has significant holdings in otherfishing companies.
11 Talley’s harvest most commercial species, ranging from deep-sea fish such as orangeroughy, to surface fish such as tuna, and shellfish such as scallops. Talley’s alsoproduces frozen vegetables and ice cream.
Amalgamated
12 Amalgamated is part of the Amalgamated Dairies Group which trades in primaryproducts. Amalgamated is a holding company which does not involve itself in fishingper se. Amalgamated Dairies Group also holds a share of 48% in Sanford.
Sanford
13 Sanford is a listed company formed in 1881. Sanford owns a diverse fleet of vessels,fishing both inshore and deep-sea, and ten onshore processing plants. It trades in alltypes of commercial seafood including shellfish. Sanford is New Zealand’s leadingaqua-culturist (farmer of seafood) in terms of production volumes and varieties. In1999 Sanford was ranked as the 65th largest company in New Zealand by Deloittes Top200 New Zealand Firms survey with revenues of $335 million.
Basuto
14 Basuto is a holding company owned by Brierley Investments Ltd (“BIL”), and is beingpurchased for its 50% ownership of Te Ika Paewai Ltd (“TIP”). The other 50% of TIPis owned by Te Waka Una Ltd, a 100% owned subsidiary of the Treaty of WaitangiFisheries Commission (“TOWFC”). TIP owns all shares in Sealord.

6
Sealord
15 Sealord specialises in deep-sea fish species, and is the largest quota holder in NewZealand. It is supplied by approximately 25 owned or leased fishing vessels. Sealordalso have on-shore processing plants which prepare fish for export and domesticmarkets. In 1999 Sealord was ranked as the 49th largest company in New Zealand byDeloittes Top 200 NZ Firms survey with revenues of $473 million.
THE ASSOCIATION BETWEEN THE PARTIES
16 A preliminary question arises whether the applicant, its various shareholders, and thetarget company, should be treated as associated persons for the purposes of section 47.If so, then it would be necessary to treat all of these parties as “one head” in the marketfor the purposes of the application.
17 The applicant has argued that the general assumption by the Commission that ashareholding of 20% in a relevant company gives rise to association in terms of section47(3), is too low.
18 The applicant has submitted that the thresholds set out in the article by Berry and Riley1
should be used. The article posits a number of presumptions, which are rebuttable onthe facts in each case. A substantial degree of influence is presumed to be likely toarise where the relevant shareholding is between 30 and 50%. The applicant hassubmitted that this assumption should be rebutted in the circumstances of thisapplication where there is only one other shareholder with an equal and constrainingpower to ensure that neither 50% partner can exercise the level of influence envisagedunder section 47(3).
19 The applicant also argues that by the time Talley’s will be in a position to bring anyinfluence to bear on Sealord, it will have an effective shareholding of only 12.5%.
20 The Commission must consider whether the applicant and any persons associated withit in terms of section 47(3) of the Commerce Act will have the ability to exert, eitherdirectly or indirectly, substantial influence over the activities of (1) the personsassociated with it at the time of the application and (2) the target company. In thisapplication, it is therefore relevant to consider the positions of influence of theshareholders in the applicant company and their interests in the relevant markets, andthe competition effects of the amalgamation of their interests in the applicant with thatof Sealords.
21 The Commission rejects the applicant’s argument that Talley’s and Amalgamated donot exercise substantial influence over Amaltal because the two equal shareholdings“cancel each other out”. On the contrary, here they are both 50/50 joint venturepartners with a community of interest in the relevant markets, and all of the directors ofAmaltal are appointees of Talley’s and Amalgamated. In the present case emphasismust be given to the fact that Amaltal and Sanford are joint venture partners; they haveequal representation and alternating chairmanship on the board of NZSI; they both havean equal ability to direct the policy, decision-making and operation of the applicant;
1 Mark Berry and Anne Riley, “Beware the new business acquisitions provisions in the Commerce Amendment
Act 1990” (1991) 21 VUWLR 91, 110.

7
and they have entered into this arrangement for the purpose of pursuing joint aims andends. These factors, together with the levels of shareholding, provide reasons toconclude that the upstream shareholders of NZSI, identitifed in Appendix A, should beconsidered to be “associated persons” for the purposes of this application. In reachingthis conclusion it is emphasised that various of these factors, such as the directorshipsand the ability to direct policies, are of greater significance than shareholding levelstaken in isolation.2
22 The amalgamation of these interests would, in the Commission’s opinion, provide theapplicant and its shareholders with the ability to exert a substantial degree of influenceover Sealord via Basuto’s 50% shareholding of TIP.
23 Accordingly, the Commission proceeds on the basis that, for the purposes of thisapplication, Amalgamated Dairies, Sanford, Talley’s and Sealord should be viewed as“one head” in the market in determining whether there will be, or will likely to be, theacquisition or strengthening of a dominant position in any of the relevant markets.
24 The Commission also notes that the level of shareholding required under the fisherieslegislation for parties’ interests to be combined, is not relevant in determining“association” for the purposes of the Commerce Act. Throughout this decision, theparties listed in paragraph 23 are referred to as the “associated companies”.
OTHER RELEVANT PARTIES
Treaty of Waitangi Fisheries Commission
25 As party to the Treaty of Waitangi settlement, the Government set aside 10% of allTACCs to be distributed among Maori tribes (iwi). The Treaty of Waitangi FisheriesCommission (TOWFC) has been given the task of overseeing the management anddistribution of quota. At this stage, iwi have been unable to agree among themselves ona fair way of allocating the quota and a resolution is not foreseeable in the near future.Until a decision is reached, the quota has been leased out at a discounted rate to iwi ona year-by-year basis.
Independent Fisheries Ltd (Independent)
26 Independent is a fishing and processing company formed in 1959. Independent’s mainfocus is on value-added products, such as crumbed squid rings and battered fish fillets,which are produced at its processing factory in Christchurch. Independent employsover 400 workers at this plant.
27 Independent is the fourth largest holder of hoki quota in New Zealand. It harvests thisquota through a combination of its own deep-sea vessels as well as those charteredfrom Poland and the Ukraine.
2 Ibid at p 114-115.

8
United Fisheries Ltd (United)
28 United was formed in 1975 and operates from Christchurch. It owns a large processingfactory which produces mainly fish fillets, but also has significant capacity to producevalue-added products. United owns only inshore vessels, so charters Ukrainian deep-sea vessels to harvest its quota for deep-sea species.
Simunovich Fisheries Ltd (Simunovich)
29 Simunovich is an Auckland-based firm, established in 1960. It has one of the largestfleets in New Zealand, comprising of both deep-sea freezer trawlers and inshorevessels. Simunovich also owns onshore processing factories. Simunovich’s mainproduct is scampi, but also it produces a variety of wet-fish products, including hokiand orange roughy fillets.
Vela Fishing Ltd (Vela)
30 Vela is one of the oldest fishery firms in New Zealand having been established in 1929.It owns two deep-sea trawlers which have on-board factories to process most of thefish. Vela is the fifth largest holder of hoki quota in New Zealand, and the hoki catch isprocessed into fillets and blocks.
BACKGROUND
Size of the Fishing Industry
31 The fishing industry is important to New Zealand in terms of export earnings andemployment. In 1999, seafood exports accounted for approximately $1.3 billion inrevenue, making it New Zealand’s fourth largest export earner behind dairy, meat, andforestry. The major exports are hoki, greenshell mussels, orange roughy, and crayfish.The seafood industry also provided around 40,000 jobs throughout the country. In thedomestic market, sales of seafood amount to approximately $150 million.
32 Currently, about 90% of all seafood harvested in New Zealand is exported, the majormarkets being Japan, United States, and Australia. This is the largest proportion ofexports of any country except Iceland. Despite its export focus, New Zealand’s seafoodexports account for less than 1% of world seafood production.
History prior to the Quota Management System
33 Until 1978, New Zealand controlled a 12 mile exclusion zone around its coastline.Foreign vessels were not allowed to fish within this zone but were able to fish withoutlimit outside it. During this time, deep-sea fish resources were greatly depleted bylarge overseas vessels.

9
34 In 1978, in recognition of rapidly falling fish stocks around the world, an internationalagreement allowed countries to establish a 200 mile Exclusive Economic Zone (EEZ),within which each country could control fishing. Because New Zealand hasjurisdiction of several out-lying islands (such as the Chathams), New Zealand’s EEZ isone of the largest in the world, covering 1.2 million square nautical miles.
35 By the 1980s, New Zealand’s fish stocks were still falling, especially those of inshorespecies. As an attempt to preserve New Zealand’s fish resources, a Quota ManagementSystem (QMS) was introduced in 1986.
Quota Management System
36 The QMS controls the amount of fish harvested commercially for all of the majorspecies found within New Zealand’s EEZ. Its purpose is to ensure that fish stocksremain at a sustainable level, and that no species is driven to extinction through over-fishing.
37 New Zealand’s EEZ is broken down into several “management areas” for each species,and each year the Government, based on information about stock levels, determines thequantity of fish that may be caught of each species in each particular area.2 Estimatesof fish stocks are made by researchers appointed by the Ministry of Fisheries, and fromresearch conducted by bodies within (and funded by) the industry itself. The Ministertakes into consideration information from both sources, as well as the views ofenvironmental, recreational, and Maori representatives, when making decisions aboutpermitted catch sizes each year.
38 The quantity of fish of each species which may be caught is based on the concept ofmaximum sustainable yield (MSY). MSY is an estimate of the maximum amount offish that can be caught, while still leaving sufficient stock to be able to sustain numbersthrough reproduction. This quantity is known as the Total Allowable Catch (TAC).The quantity of interest in this clearance application, however, is the Total AllowableCommercial Catch (TACC) which is simply the TAC after allowing for recreationalfishing and customary Maori uses.
Individual Tradable Quotas
39 In 1986 the TACC for each species was broken down and allocated in the form ofIndividual Tradable Quotas (ITQs). These allocations were given in proportion to thehistorical catches of fishers, with those who had harvested the most getting the largestITQs. The ITQs gave the owner the right to catch a certain tonnage of the TACC, in agiven management area.
40 In 1990, the Government changed the quotas from a tonnage basis to a percentage ofthe TACC. This enabled the Government to change the TACC without the problem ofhaving either to purchase or sell quota itself to meet the desired figure. This systemplaces greater risk on the fishermen as it is they who will bear the burden when the
2 An example of management areas is that for ling shown in Appendix B. Management areas vary from
species to species.

10
TACC for a particular species is reduced. However, they also gain from any TACCincrease.
41 If quota is overcaught substantially or fish is caught for which no quota is held,fishermen must pay a “deemed value” for the fish to the Ministry of Fisheries. Thedeemed value is set by the Ministry and is designed to eliminate any economicincentive to catch without quota.
42 One important aspect of the ITQs is that (as the name suggests) they are tradeable.Owners of the ITQs are free to sell, trade, or lease the quotas as they choose.Fishermen must hold quota to fish, either by owning it themselves or by leasing it fromsomeone else. The ITQs represent a considerable asset to the owners.
43 The prices of buying and leasing quota have increased markedly since the inception ofthe QMS. In particular, the prices of by-catch quota, such as hake and ling, have risento reflect a value far above the value of the fish per se. This probably reflects therequirement to have by-catch quota in order to catch the main species, such as hoki.The changes in price are illustrated in Tables 1 and 2 below. These revealunexpectedly high prices for low value by-catch species such as hake and ling.
Table 1: Quota purchase prices for selected species/zone
Oct 1999 –Jan 2000
Oct 1986 – Jan 2000
Species/zone Average ($per tonne)
Average ($per tonne)
Low High
Hoki 1 2248 1639 2 11250Hake 1 5000 3536 88 10000Ling 1 8399 4410 1000 11000Orange Roughy 3B 11380 8983 90 12000
Table 2: Quota annual lease prices for selected species/zone
Oct 1999 –Jan 2000
Oct 1986 – Jan 2000
Species/zone Average ($per tonne)
Average ($per tonne)
Low High
Hoki 1 172 288 2 650Hake 1 426 445 10 1463Ling 1 657 806 35 1500Orange Roughy 3B 1096 997 2 3375
Recent History of Quota Trading and Quota Leasing
44 There is consistently a range of quantities of quota for different species that are on themarket and are brokered through various companies or the fishing companiesthemselves. For the large quota areas and species, most quota is tightly held by a few

11
companies and there is little movement in it. This depends on the species; for someinshore species, particularly lobster, paua and some of the inshore finfish species thereis quite a lot of trading activity in the market. For the big offshore species, such asorange roughy and hoki, there is little activity and most of it is done inhouse throughcompanies.
45 There are a number of different commercial and strategic relationships between fishersand quota holders. Fishing operations may own or charter fishing vessels to fish theirquota. In turn, the quota may be owned or leased. Quite often, fishers enter intoFAAQH (Fishing Against Another’s Quota Holding) agreements. In this case, havingarranged a fishing permit, an independent fisher will harvest the quota held by anotherparty. The quota holder will then control the landed catch. Once the fish has beencaught, the FAAQH agreement has been satisfied. A FAAQH agreement will not showup as either a quota trade or lease transaction.
The Fisheries Act 1983
46 The Fisheries Act 1983 relates to the management and conservation of New Zealand’sfishing industry. The Act created the Ministry of Fisheries, which in turn regulates theQMS. The Fisheries Act was amended in 1996, and it is understood that anotheramendment bill is currently under consideration.
47 Section 28w(a) of the Fisheries Act states that the maximum amount of the quota for aparticular species/management area that an entity and its associates may hold is 35%.However, there is provision for this maximum to be exceeded given an exemption fromthe Minister, and it is understood that some companies currently have permission tohold up to 45%. If the Fisheries Act Amendment Act is enacted in its present form, themaximum quota holding will be increased to 45%. Companies can already beexempted, and some are, at the discretion of the Minister. This provision suggests thatthe Fisheries Act would serve to prevent a merger between two significant holders ofquota, which leads to an aggregation exceeding that figure. It should be noted,however, that the association test specifed in the Fisheries Act and used by the Ministryof Fisheries differs significantly from that used by the Commission under theCommerce Act. The Commission uses a test of “substantial influence”, whereas theMinistry of Fisheries uses an “associated persons” test based on the aggregation ofvoting interests of the associates.
Future Changes
48 Presently the right to catch some seafood species is tied in with the long term propertyright inherent in the quota. In the future and under the new legislation, which isintended to come into operation on 1 October 2001, the two rights will becomeseparate. There will be a new register established for quota, which will be the longterm property right that can be mortgaged and officially borrowed against and forwhich there will be a secured right. Separate to that will be the ACE (Annual CatchEntitlement) register. At the start of the fishing year, a quota holding will generate acertain amount of catch right which can be traded and used quite separately from thequota, but it will only last one year. The proposed legislation will enable fishermen toenter the harvesting market by purchasing catch rights.

12
49 There will be a minimum amount of ACE required to go fishing but that will not behigher than current requirements, and therefore not a significant deterrent. The marketwill determine whether ACE can be purchased. If an owner does not want to sell it,they cannot be forced to do so. Catch rights will be similar to an annual lease, grantingownership rights, which can be on sold.
50 Currently quota is required to catch fish. One defence to catching fish without quota isthe payment of the deemed value of the fish. In the future, there will be no criminalliability for failing to have ACE when fishing. It will be driven by the deemed value,so if a permit is obtained and the fisherman chooses to fish without ACE, nothing canbe done except to levy the deemed value on the fisherman. The fisherman will make achoice as to whether to absorb the cost. For individual fishermen, there would bediffering impacts. The vertically integrated companies with better margins will be ableto sustain higher deemed value prices than those who are price takers. If the deemedvalue is set right, it should be a deterrent so that the ACE market is used and not thedeemed value. The deemed value will drive the value of ACE.
Species
51 The fishing industry can broadly be divided into three main activities covering inshorespecies, deep-sea species, and crustaceans/molluscs. The data provided for respectiveTACCs, amount exported, and value of export gives an indication of the relativeimportance of each activity to the New Zealand fishing industry.
Inshore Species
52 Inshore species are defined as those found near the shore and down to 200 metres, andinclude: flounder, sole, snapper, john dory, groper, gurnard, butterfish, trevally,bluenose, tarakihi, blue cod, and monkfish. The current TACCs for major inshorespecies are listed below in Table 3.
53 New Zealand’s traditional fisheries centre on the inshore species. They hold specialsignificance for Maori and are obviously of importance to recreational anglers. Inaddition, because the species have historically been fished (and eaten), they aregenerally the preferred species for “white-cloth” fish dishes in New Zealandrestaurants. In the North Island, restaurants typically offer groper, snapper, or tarakihi,while South Island restaurants tend to offer flatfish such as sole and flounder.
54 Vessels used to fish these species are relatively small. This is because the law prohibitsthe use of vessels longer than 43 metres fishing within 12 miles of the shore forenvironmental reasons.

13
Table 3: Major inshore speciesSpecies TACC (kg) Value of Export
($NZ)Snapper 6,494,000 39,252,818Trevally 3,880,634 7,530,606Sole 5,974,964Flounder
6,535,566(for all flatfish) 5,667,160
John Dory 1,049,000 5,266,604Groper 2,129,700 3,212,320Tarakihi 5,930,000 798,232Gurnard 5,056,754 532,743
Deep-sea species
55 Deep-sea species are defined as those that normally live at depths between 200 and1200 metres, and include: hoki, orange roughy, hake, ling, oreo dory, squid, and silverwarehou.
56 The New Zealand deep-sea fishery has been developed only over the last 20 years sincethe QMS was introduced. Initially, all deep-sea fishing was contracted out to overseasvessels. This was because deep-sea fishing vessels were highly technical, required ahigh level of expertise to operate, and were very expensive, and overseas markets wereneeded for the large quantities of fish caught. As the industry grew, however, NewZealand firms learned enough about the industry and accumulated sufficient capital tomeet the cost of their own vessels. Currently, deep-sea fishing is done mostly by NewZealand owned and operated vessels, with some fishing contracted to foreign vessels.
57 Most deep-water vessels currently in operation are completely self-contained, havingprocessing, packing, and freezing facilities on-board. This ensures that the fish is of ahigh quality, as the fish is processed as soon as it is brought on-board.
58 The development of deep-sea fishing has been largely responsible for the rise in exportearnings over the last twenty years. Deep-sea species provide significantly more exportrevenue than inshore species, because the stock numbers are higher, and they commandmuch greater demand overseas. Of those species, it is generally accepted that hoki isthe most important, accounting for just under $300 million per year in export revenue.
Table 4: Major deep-sea speciesSpecies TACC (kg) Value of exports
($NZ)Hoki 249,932,970 299,893,642Orange Roughy 20,345,780 102,892,045Hake 14,057,540 36,701,845Ling 22,003,900 59,418,580Oreo Dory 23,934,000 27,698,306

14
Crustacean/Molluscs
59 This category includes shellfish species such as oysters, scallops, and mussels, andcrustacea such as the spiny rock lobster and crab.
60 In terms of revenue, the shellfish industry has grown significantly in recent years,particularly the output of mussels. This is has been mainly due to the development offarming techniques (“aquaculture”) for shellfish, which has meant that large quantitiescan be supplied on demand to overseas buyers. Mussel exports have increased from$2.6 million in 1981, to $34 million in 1990, and to $117 million in 1999.
Table 5: Major molluscs/crustacean speciesSpecies TACC (kg) Value of Exports
($NZ)Pacific Oysters* No TACC 10,134,486Scallops 826,000 24,565,125Mussels** No TACC 116,894,894Spiny Rock Lobster 2,833,417 115,666,855* Pacific oysters are farmed so are not subject to quota. No Bluff or Nelson oysters areexported.** Mussels are farmed so are not subject to quota.
Fishing Techniques
61 Fishing techniques vary depending on the type of fish being harvested, the mostcommon method being trawling.
62 Trawling is the dominant form of fishing major inshore and deep-sea species. Thetechnique involves one or two boats dragging an elongated net through the water wherethe fish are schooling. Vibrating ropes encourage fish between the boat and the net toswim in the net’s path rather than away.
63 In the past trawling has been rather “hit-and-miss”, but with modern technology it hasbecome much more precise. Sonar and radar can accurately determine the size of theschool of fish, their location, and their depth in the water. Despite the technology, acertain amount of “by-catch” unavoidably gets caught by the trawl nets.
64 Netting involves stretching a net across an area and catching all fish above a certainsize that swim into it. The net is kept upright by a series of floats along the top andweights on bottom. By using lighter weights the net can be used to catch surface fish,while using heavier weights will allow the fishermen to catch deeper dwelling fish.Netting is considered one of the most selective of all fishing methods, as the size of themesh can determine the size and type of fish caught.
65 Long-lining involves the use of a series of lines with baited hooks. Long-lining can beused on the surface or on the seabed depending on the type of fish being harvested.

15
66 Squid jigging is the method used to catch squid. Squid are encouraged to gather underthe boat at night by bright lights shone across the water, and are hooked on linescontaining a series of lures dropped down the side.
67 Dredging is used to collect scallops and oysters. The system involves a steel frameddredge being dragged across the ocean floor. The shellfish are picked up and thensorted on-board.
68 Greenshell mussels are farmed on ropes suspended in the water by floats. There is onelong-line that runs across the surface, generally several kilometres long. From thisshorter ropes drop down into the water in loops, on which the mussels grow.
Processing
69 Processing can occur either on the vessel itself or onshore. Inshore vessels arerelatively small and so do not have on-board processing facilities. Typically, therefore,they will spend one or two days fishing before returning to port to unload the fish theyhave harvested for processing. Their catch is chilled while at sea to maintain freshness.
70 Most deep-sea vessels have on-board factories and process the fish as soon as it iscaught. Immediate processing ensures that the fish retains its flavour, and avoids theneed to freeze it, thaw it on-shore for processing, and then refreeze it for export. Thefactories also pack the fish, leaving the product ready for export as soon as its landed.Fish by-products such as fish meal are also produced. The deep-sea vessels employ upto 60 staff, working 6 hour shifts, 24 hours per day.
71 Onshore processing factories are similar to on-board factories but are typically of alarger scale. Both onshore and on-board factories have expensive automated systemsthat remove the head, tail, spine, and skin as well as coat the fish for value addedproducts. The process is, however, still quite labour-intensive, as workers still gut,fillet, and pack the fish.
72 The main product is fillets (in various forms) but a significant share of fish is used tomake fillet block. Fillet block refers to a large frozen block of packed fish. This blockcan then be divided up as required using a “bandsaw” type cutter, for use in value-added products.
73 Value-added products refer to seafood that has been “enhanced” in some way toincrease its value. This might include battering or crumbing the fish, adding a sauce, ormincing it and reshaping it. There is a plethora of different value-added productsincluding fish fingers, fish burgers, fish cakes, squid rings, seafood sticks, scallop bites,and the like. These products are typically marketed under a brand name. All value-added processing is done onshore.
Rationalisation
74 Deep-sea and inshore fisheries have developed very differently. Because inshorespecies had been fished for a long time and had relatively low capital costs for entry,the introduction of the QMS dispersed the ITQs to a wide range of small fishing

16
operations. Today the market is extremely fragmented with no fishing entity holding asignificant share of the TACCs for in-shore fishing.
75 In contrast, deep-sea fishing requires highly technical, expensive equipment. The costof a deep-sea vessel (up to $40 million for a new vessel) is typically out of reach for allbut the very largest firms in the industry. Smaller quota holders can contract foreignfirms to harvest fish for them, but it has been the larger firms that own large shares ofquota, and have their own vessels and processing facilities, that have grown thequickest, benefiting from scale economies and being able to control fish flows.
MARKET DEFINITION
Introduction
76 The purpose of defining a market is to provide a framework within which thecompetition implications of a business acquisition can be analysed. The relevantmarkets are those in which competition may be affected by the acquisition beingconsidered. Identification of the relevant markets enables the Commission to examinewhether the acquisition would result, or would be likely to result, in the acquisition orstrengthening of a dominant position in any market in terms of section 47(1) of the Act.
77 Section 3(1A) of the Act provides that:
“. . . the term ‘market’ is a reference to a market in New Zealand for goods and services as well asother goods and services that, as a matter of fact and commercial common sense, are substitutablefor them.”
78 Relevant principles relating to market definition are set out in Telecom Corporation ofNew Zealand Ltd v Commerce Commission,3 and in the Commission’s BusinessAcquisition Guidelines (“the Guidelines”).4 A brief outline of the principles follow.
79 Markets are defined in relation to three dimensions, namely product type, geographicalextent, and functional level. A market encompasses products which are closesubstitutes in the eyes of buyers, and excludes all other products. The boundaries of theproduct and geographical markets are identified by considering the extent to whichbuyers are able to substitute other products, or across geographical regions, when theyare given the incentive to do so by a change in the relative prices of the productsconcerned. A market is the smallest area of product and geographic space in which allsuch substitution possibilities are encompassed. It is in this space that a hypothetical,profit-maximising, monopoly supplier of the defined product could exert market power,because buyers, facing a rise in price, would have no close substitutes to which to turn.
80 A properly defined market includes products which are regarded by buyers or sellers asbeing not too different (‘product’ dimension), and not too far away (‘geographical’dimension), and are therefore products over which the hypothetical monopolist wouldneed to exercise control in order for it to be able to exert market power. A market
3 (1991)4 TCLR 473.4 Commerce Commission, Business Acquisition Guidelines, 1999, pp. 11-16.

17
defined in these terms is one within which a hypothetical monopolist would be in aposition to impose, at the least, a “small yet significant and non-transitory increase inprice” (the “ssnip” test), assuming that other terms of sale remain unchanged.
81 Markets are also defined in relation to functional level. Typically, the production,distribution, and sale of products takes place through a series of stages, which may bevisualised as being arranged vertically, with markets intervening between suppliers atone vertical stage and buyers at the next. Hence, the functional market level affectedby the application has to be determined as part of the market definition. For example,that between manufacturers and wholesalers might be called the “manufacturingmarket”, while that between wholesalers and retailers is usually known as the“wholesaling market”.
The Relevant Markets
82 The applicant has claimed, on the basis of the common business activities of Amaltal,Sanford and Sealord, that there are three markets where aggregation would occur as aresult of the proposed acquisition, as follows:
• markets for the procurement of finfish for processing in New Zealand;
• markets for the procurement of shellfish for processing in New Zealand; and
• markets for the supply or distribution of finfish and shellfish in New Zealand.
83 It is not clear why the term “market” is used in the plural in the above definitions. Inthe finfish procurement markets, for example, this could imply that there are separatemarkets for deep-sea and inshore fishing, or for different species. Both of these aspectsare mentioned in the explanation of the market, although neither is actually built into anelaborated market definition. However, in the last market, the applicant doesdistinguish two separate “sectors”, namely the “processed/frozen retail market sold insupermarkets”, and the “food service/fresh/restaurant market”.
84 Following the Commission’s earlier decision in Treaty of Waitangi FisheriesCommission/Salmond Smith Biolab (AUT/BA-T13/1, 6 September 1995), the applicantconsiders that the markets for the sale and purchase of ITQs, and the leasing of ITQs,need not be considered as their operation is governed by the Fisheries Act. TheCommission understands that the aggregation levels of quota under the Fisheries Actare not actively policed, although the penalties for breaching the levels are high. In anycase, such aggregation still falls to be considered under section 47 of the CommerceAct. The Commission also notes that the need to obtain ITQs is a regulated, structuralfeature of the markets and a condition of entry into fishing. Quotas are dealt with in thediscussion on competition below.
85 The Commission considers that the applicant’s proposed definitions are too aggregated,both in relation to products and to functional market levels, but has found it difficult todefine precise boundaries for the relevant markets in this case. The difficulties stemfrom a number of factors, including the following: the limited timeframe available toinvestigate the issues raised by the application; the difficulty of obtainingcomprehensive information on what is a large and diverse industry; the complications
18
introduced through the regulation of the industry by the QMS; and the determination ofhow the variety of fish and fish products fit within the wider spectrum of consumerfoods. Hence, the Commission has adopted a pragmatic approach using theinformation available (collected from a number of industry participants), and largelyrestricting the analysis to those markets where the proposed acquisition would lead toaggregation of market share. The difficulties noted have resulted in a tendency todefine the markets rather broadly, so possible limitations in the definitions used are alsonoted.
86 In what follows, the markets will be considered in two groups: those for finfish, andthose for shellfish.
Finfish Markets
Product Markets
87 The applicant, in its market definitions, has proposed two product markets, namelythose for processed finfish and processed shellfish, but has not elaborated as to thereasons for this distinction. There appears to be an implication that canned fish,crustaceans and salmon are not included, although this is not explicitly stated. Aseparate market for so-called “value added” or manufactured fish products is notmentioned.
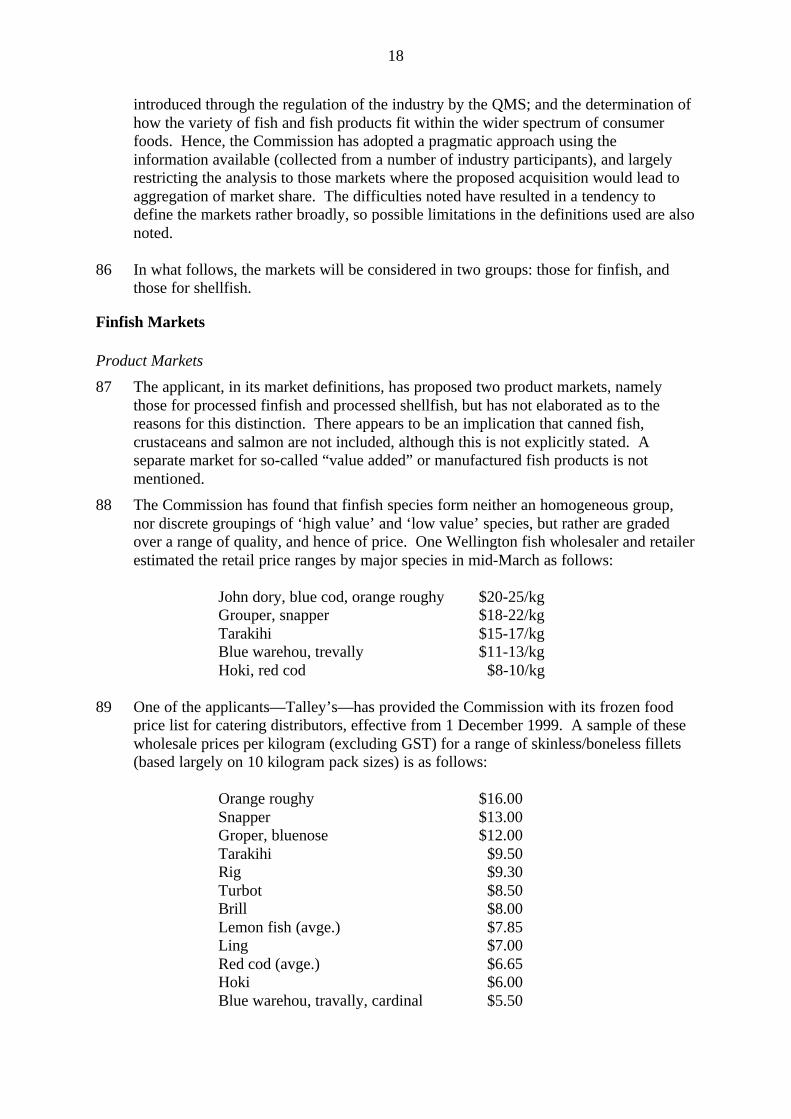
88 The Commission has found that finfish species form neither an homogeneous group,nor discrete groupings of ‘high value’ and ‘low value’ species, but rather are gradedover a range of quality, and hence of price. One Wellington fish wholesaler and retailerestimated the retail price ranges by major species in mid-March as follows:
John dory, blue cod, orange roughy $20-25/kgGrouper, snapper $18-22/kgTarakihi $15-17/kgBlue warehou, trevally $11-13/kgHoki, red cod $8-10/kg
89 One of the applicants—Talley’s—has provided the Commission with its frozen foodprice list for catering distributors, effective from 1 December 1999. A sample of thesewholesale prices per kilogram (excluding GST) for a range of skinless/boneless fillets(based largely on 10 kilogram pack sizes) is as follows:
Orange roughy $16.00Snapper $13.00Groper, bluenose $12.00Tarakihi $9.50Rig $9.30Turbot $8.50Brill $8.00Lemon fish (avge.) $7.85Ling $7.00Red cod (avge.) $6.65Hoki $6.00Blue warehou, travally, cardinal $5.50

19
90 From a demand-side perspective, it is unlikely that, say, orange roughy and hokicompete closely one against the other, but it is likely that each will compete with othersat its price level and in the immediately adjacent price level. For example, for thoseconsumers who buy premium quality fish, it seems likely that snapper will be asubstitute for orange roughy, but not hoki, in the event that the price of orange roughywere to rise. This overlapping substitutability between species at adjacent quality/pricelevels should result in a chain of substitutability stretching from the premium quality tothe budget quality species. On this basis, all major finfish species would fall within thesame product market. This conclusion has been supported by a range of parties withinthe industry.
91 An argument that has been considered is that as the industry is split into inshore anddeep-sea fishing, with very different technologies and entry costs being required ineach, this might lead to a differentiation of markets for inshore species such as red codand grouper from that for deep-sea species such as hoki and orange roughy. However,while the industry is characterised by this supply-side differentiation, it would have nobearing on the product market definition if, as assessed, the inshore and deep-seaspecies compete one with another for the consumer dollar. Thus, a hypotheticalmonopolist in, say, the deep-sea fishery could not, in those circumstances, exert marketpower by raising the price of the deep-sea species, because it would lose sales tosuppliers of the inshore species. In addition, some deep-sea species such as orangeroughy and hoki are caught in inshore waters as a by-catch, and the hoki spawningground fishery in the south-east approaches of the Cook Strait is an inshore fishery.For these reasons, there appears to be no basis for distinguishing separate productmarkets according to supply-side factors.
92 The Commission has also considered whether there might be a separate product marketfor hoki. This would rest on the fact that hoki is easily the most important species inboth tonnage and value terms, comprising about 40% of the total tonnage landed ofabout 600,000 tonnes. A large part of the catch is made in the deep-sea fishery byfactory freezer trawlers, which process it onboard. Hoki is by far the most importantexport species, and is the major species used in the manufacture of value-added fishproducts. It is conceivable that a company which, hypothetically, gained control of thequota for hoki might be able to exert market power, simply because no other speciescould provide the volumes of fish required. However, the Commission notes that thetonnages used in the domestic market are much smaller, and that other species withsubstantial quota volumes such as southern blue whiting, warehou and trevally are usedfor value added fish products besides hoki. Hence, it appears unlikely that there couldbe a separate hoki-based market in New Zealand.
93 The Commission proposes to exclude salmon from its assessment of this application. Ittakes this view because salmon appears to be a specialist “niche” market, as opposed tothe more general “finfish” products. Further, salmon is farmed and is not subject toquota, unlike other finfish. Finally, of the associated companies, only Sanford has aninvolvement in salmon processing. Therefore, there will be no aggregation in salmon-related activities. For these reasons, the Commission considers that it is appropriate toexclude salmon from its analysis of this current application.

20
94 For the retail buyer and end consumer, finfish as a product may be distinguished by thedegree of processing it has undergone. In general terms, there appear to be two majorcategories: ‘basic processed’ product, where the finfish is marketed as wet fish, eitherwhole, or in fillets (although it may have been frozen at an intermediate stage); andmanufactured or ‘value-added’ product, where it has undergone further processing intocrumbed and breaded fillets, and into frozen, branded products such as fish fingers,burgers, bites, and cakes. Some of the latter products are manufactured either fromminced fish, or from frozen “fish blocks”—made from compressed and frozen off-cutsof filleted fish—and band-sawed piece-by-piece into the required size. The hoki isused extensively in the production of value-added fish products, but other species suchas hake, john dory and snapper are also used.
95 The fresh, basic processed, product is important for restaurants, fish and chip shops,seafood shops and (to a degree) for supermarkets. The value-added, branded productsare marketed predominantly through supermarkets and other retail outlets asconvenience food items. This suggests that there are two end-product markets, the firstfor fresh, basic processed finfish, and the second for value-added finfish products. Thelatter are likely to meet at least some competition from other processed, frozenconvenience, meat products such as chicken fingers, bites and patties, but theCommission has not been able to determine in the time available whether there is awider product market encompassing all of these products.
96 The Commission concludes that for the purpose of assessing the competitionimplications of the proposed acquisition, the relevant product markets are for processedfinfish (excluding salmon), and for value-added finfish products (excluding cannedfinfish).
Functional Markets
97 As indicated earlier, finfish pass through various stages, or functional levels, from thepoint of harvest to the consumer. The functional levels of the market are harvesting;basic processing; value-added processing; and distribution (including exporting).
98 Harvesting of finfish is undertaken by both deep-sea and inshore boats, as alreadynoted. In general, the former are much larger vessels, which travel much farther to thefishing grounds, and stay at sea for much longer – often for several weeks at a time.They may also have onboard processing of the catch. The inshore boats often fish on aday-by-day basis, and are less able to cope with bad weather. Hence, the two fleets arenot interchangeable. Indeed, participants from within the fishing industry havecommented that it would not be economic to employ a large, capital-intensive, deep-seavessel in an inshore fishery. In any case, regulations prevent such vessels from fishingwithin 12 miles of New Zealand’s coastline. Nonetheless, the two fleets effectivelycompete because the fish they harvest are substitutable in the manner described above.Hence, there is likely to be a generic harvesting functional market, even though thetechnologies and entry costs differ substantially between the inshore and deep-seafleets.
99 The processing market involves processors receiving whole fish supplied through thecatching process. On the demand side, there are no close substitutes for finfish as aninput into modern processing. Processing may be undertaken by the fisher, a land-

21
based processing plant, or by the whole-fish customer such as a fish shop or restaurant.Processing plant is designed specifically for handling fish, with both manual andautomated lines removing the head, tail and entrails of the raw fish, then filleting andfreezing the product. The automated lines can be calibrated to handle a range ofspecies and sizes within certain tolerances, but remain specialised and unable to processnon-fish products.
100 Substantial further investment in plant and marketing is required to produce value-added finfish products. Continuity of supply is important for this processing, thoughstocks of frozen fish can be held for periods of 12-18 months, albeit at a significant costin terms of the specialised refrigerated storage required. Only a few of the largestfishing companies are present in this value-added market.
101 A complication for market definition is the vertical integration across functional levels.For example, in the deep-sea fishery, the catch is often processed at sea. Most of thecatch is harvested by large factory freezer trawlers, which at least partially process andfreeze the catch immediately. For premium hoki fillets it is critical that the catch isprocessed and frozen within half-an-hour. Fish blocks are also produced. The productis then either distributed, including for overseas sale, or further processed onshore.
102 The largest operators tend to be vertically integrated across all functional levels. Theyharvest fish using owned quota and boats, process the catch themselves, and distributeand market the product also. However, in other cases, companies may lease quota toindependent fishers who supply their catch to the leasing company, or independentprocessors may rely on others to supply their finfish input. Many small fishers have noconnection with processing other than supplying the raw fish. Hence, there appears tobe sufficient vertical disintegration in the industry for it to be appropriate to treat eachfunctional level as a separate market.
103 The Commission concludes that the relevant functional levels of the market are for theharvesting, processing and value-added manufacturing, of finfish.
Geographic Markets
104 The applicant has asserted that the relevant geographic market is the whole of thecountry. The Commission’s investigations suggest that the geographic dimensions ofthe markets are at least national in extent.
105 With regard to harvesting, quota by species relates to particular management areas, andonshore processing facilities tend to receive fish from vessels fishing the adjacentregional waters, particularly for inshore species. Thus, there are regional differences inthe domestic market with, for example, snapper being more prevalent in Auckland,tarakihi in Wellington, and flatfish species in Christchurch This appears to reflectregional differences in species availability, and consequently differences in consumertastes. However, harvesting and processing companies do transport catch around thecountry, or acquire fish from other fishing companies—and this includes fish beingtransported between the South and North Islands—in order to reduce regionaldiscrepancies between supply and demand, and to smooth out seasonal fluctuations insupply.
106 In the case of processing and wholesale supply, finfish in both fresh, frozen andprocessed forms are transported around the country, and a very large proportion of the

22
industry’s output is sold overseas. Hence, the market is at least nationwide in extent.Under the terms of section 3(1A) of the Act, the market cannot be wider than NewZealand, and hence imports and exports have to be incorporated in the evaluation ofcompetition in the relevant markets.
107 The Commission has concluded that the geographic extent of all of the relevant finfishmarkets is New Zealand-wide.
Conclusion on Finfish Markets
108 The Commission considers that the following finfish markets are relevant for theconsideration of the present proposal:
• the market for the harvesting and supply of finfish in New Zealand (the‘harvesting market’);
• the market for the processing and wholesale supply of finfish in New Zealand(the ‘processing market’); and
• the market for the processing and wholesale supply of value-added finfishproducts in New Zealand (the ‘value-added market’).
Shellfish Markets
Product Markets
109 Previous Commission decisions have defined the relevant domestic product markets forshellfish as including the procurement, processing and supply of the products ofseparate shellfish species.5 The Commission’s investigation in the present case, whichhas involved greenshell mussels, scallops and dredge oysters, has confirmed thatdifferent shellfish are likely to fall into different product markets.
110 Greenshell mussels are a species native only to New Zealand, and are farmed in thesheltered waters of the Marlborough Sounds, Golden Bay and the Hauraki Gulf. A lineof buoys is anchored to the sea floor which support a “long-line” on the surface, fromwhich hang vertical growing lines at intervals. Greenshell mussels are mostly sold inthe half-shell form in export markets, and in the marinated form and as mussel meatdomestically. On the demand side the retail product is assumed to be homogeneous,notwithstanding the fact that mussels are sold in many forms.6 The blue mussel, whichis not native to New Zealand, is smaller than the greenshell mussel and its meat has adifferent texture, but it is commonly regarded as a substitute for it. The blue mussel issupplied to the New Zealand market by domestic supply and imports, but the quantity isrelatively small. Mussels make up the bulk of the shellfish harvest, and a largeproportion are exported.
111 Unlike greenshell mussels, which are farmed, both scallops and dredge oysters aresubject to the QMS, and the tonnages produced are much smaller. Both of theseshellfish species are harvested using the dredging technique, whereby a meshed dredge
5 Treaty of Waitangi Fisheries Commission/Salmond Smith Biolab (AUT/BA-T13/1, 6 September 1995).6 B M H Sharp, “Fishing”, in A Bollard and M Pickford (eds) The Structure and Dynamics of New Zealand
Industries, Dunmore Press, Palmerston North, 1998) p 67.

23
is dragged along the sea floor by a boat. Dredge oysters are harvested on a seasonalbasis in the two quota management areas around Nelson and Bluff, and all areconsumed domestically.
112 Evidence supplied to the Commission by different market participants and interestedparties suggests that from a demand-side perspective, mussels, scallops and oysters arenot substitutes one for another. The mussel is a lower priced product relative to theother two (and to paua), and it has different consumption characteristics. Scallops anddredge oysters are highly valued and high priced shellfish which are considered to bedifferentiated from other shellfish species, and each other, by their uniquecharacteristics. Evidence from the market suggests that the pricing and performancecharacteristics of the three shellfish species are such that they occupy separate productmarkets.
113 On the supply-side, production of each species tends to be quite location-specific.Mussels are distinguished by their mode of cultivation from the harvesting approachused for the other two shellfish species, and there is no substitutability between the twomethods of production. Mussel producers cannot easily switch to producing the othertwo species, and vice versa. Switching between scallops and dredge oysters is possiblefrom a technical point of view, but is inhibited by the need to acquire the necessaryquota. Thus, the QMS would prevent operators switching between scallops and oysters(although quota has been traded), and neither would be able to switch production tomussels in a timely manner without significant new investment in plant and equipment.Further, Pacific oysters are generally farmed in inter-tidal areas using a different ‘rack’system. Although it is not determinative, the three species of shellfish are thus alsodifferentiated on the supply-side.
114 The Commission concludes that there are separate product markets for mussels,scallops and oysters.
Functional Markets
115 The functional levels of the market is that for the cultivation (in the case of mussels) orharvesting(in the case of scallops and dredge oysters) and supply of the three types ofshellfish, and that for the processing of shellfish. For all three species, in someinstances, vertical integration means that these functions are integrated within the firm,but there is also a considerable volume of external transactions because of the largenumber of independent cultivators who lack any processing capacity. Hence,harvesting and processing can be distinguished as separate functional levels in themarket.
116 The processing of different species of shellfish involves similar resources andcompetencies, and requires a licence from the Ministry of Fisheries. Scallops andoysters are opened by skilled processors in a controlled environment in which themaintenance of very high hygiene standards is important. They are supplied as “meat”or in their half shells.
117 The processing of mussels requires additional resources to that required for scallopsand oysters. The mussels are washed, graded by hand and their “beards” are removedmechanically. The mussels are then cooked, have one shell removed manually if sold

24
as “half shell”, or go through a mechanical shaker where the meat is removed from theshell. They then can be sold as mussel meat, be marinated, or go through furtherprocessing. This further degree of processing compared to scallops and oysters,increases required capital investment. Nonetheless, about 40% of mussel processorsare also involved in the processing of other shellfish, suggesting that all three shellfishspecies can be processed through the same or similar facilities. The processed shellfishare then distributed to the domestic and overseas markets.
118 The Commission concludes that there are two functional levels of the shellfish productmarkets, namely those for the cultivation/harvesting and supply of the relevantshellfish, and for the processing and wholesale supply of shellfish.
Geographic Markets
119 Generally, shellfish are processed at plants near the source of supply. However, as arelatively high-value, low-bulk product they can be transported comparativelyinexpensively using refrigerated transport. For example, in the case of mussels, thelargest producing area—accounting for 77% of total production in the year to 31 March1998—is the Marlborough region. Nearly half of this production was transported out-of-region for processing, with about 15% being processed in the Canterbury region,30% in Nelson, and about 1.5% in the Hauraki region. This level of internaltransportation of mussels for processing suggests that the market is a national one.Once processed, the product is distributed nationally and internationally.
120 The Commission concludes that the geographic dimension of the market is nation-wide.
Conclusion on Shellfish Markets
121 The Commission considers that the following shellfish markets are relevant for theconsideration of the present proposal:
• the cultivation and supply of greenshell mussels in New Zealand;• the harvesting and supply of scallops in New Zealand;• the harvesting and supply of dredge oysters in New Zealand; and• the processing and wholesale supply of shellfish in New Zealand.
Conclusion on the Relevant Markets
122 On the basis of the analysis above, and on the information currently available, theCommission has reached the conclusion that the relevant markets for the purposes ofanalysing the competition issues arising from the proposed merger are the following:
• the market for the harvesting and supply of finfish in New Zealand (the‘harvesting market’);
• the market for the processing and wholesale supply of fresh finfish in NewZealand (the ‘processing market’); and
• the market for the processing and wholesale supply of value-added finfishproducts in New Zealand (the ‘value-added market’).

25
• the cultivation and supply of greenshell mussels in New Zealand;• the harvesting and supply of scallops in New Zealand;• the harvesting and supply of dredge oysters in New Zealand; and• the processing and wholesale supply of shellfish in New Zealand.
COMPETITION ANALYSIS
Introduction
123 According to section 47(1) of the Commerce Act,
“No person shall acquire assets of a business or shares if, as a result of the acquisition, -
(a) That person or another person would be, or would be likely to be, in a dominant positionin a market; or
(b) That person’s or another person’s dominant position in a market would be, or would belikely to be, strengthened.”
124 Section 3(9) of the Commerce Act states that:
“For the purposes of sections 47 and 48 of this Act, a person has, or 2 or more persons thatare interconnected or associated together have, as the case may be, a dominant position in amarket if that person as a supplier or acquirer, or those persons as suppliers or acquirers, ofgoods or services, is or are in a position to exercise a dominant influence over theproduction, acquisition, supply, or price of goods or services in that market …”
125 That section also states that a determination of dominance shall have regard to:
(a) The share of the market, the technical knowledge, the access to materials or capital of thatperson or those persons:
(b) The extent to which that person is, or those persons are, constrained by the conduct ofcompetitors or potential competitors in that market:
(c) The extent to which that person is, or those persons are, constrained by the conduct ofsuppliers or acquirers of goods or services in that market.”
126 In the Commission’s view, as expressed in its Business Acquisitions Guidelines 1999(page 17), a dominant position in a market is generally unlikely to be created orstrengthened where, after the proposed acquisition, either of the following situationsexist:
• The merged entity (including any interconnected or associated persons) has lessthan in the order of a 40% share of the relevant market; or
• The merged entity (including any interconnected or associated persons) has lessthan in the order of a 60% share of the relevant market, and faces competition fromat least one other market participant having no less than in the order of a 15%market share.

26
127 The test for dominance has been considered by the High Court. McGechan J stated:7
“The test for ‘dominance’ is not a matter of prevailing economic theory, to be identifiedoutside the statute.”…“Dominance includes a qualitative assessment of market power. It involves more than ‘high’market power; more than mere ability to behave ‘largely’ independently of competitors; andmore than power to effect ‘appreciable’ changes in terms of trading. It involves a high degreeof market control.”
128 Both McGechan J and the Court of Appeal, which approved this test,8 stated that alower standard than “a high degree of market control” was unacceptable.9 In itsBusiness Acquisition Guidelines 1999 (page 21) the Commission has acknowledgedthis test:
“A person is in a dominant position in a market when it is in a position to exercise a highdegree of market control. A person in a dominant position will be able to set prices orconditions without significant constraint by competitor or customer reaction.”
“A person in a dominant position will be able to initiate and maintain an appreciable increasein price or reduction in supply, quality or degree of innovation, without suffering an adverseimpact on profitability in the short term or long term. The Commission notes that it is notnecessary to believe that a person will act in such a manner to establish that it is in a dominantposition, it is sufficient for it to have that ability.”
129 The role of the Commission in respect of an application for clearance of a businessacquisition is prescribed by the Commerce Act. Where the Commission is satisfied thatthe proposed acquisition would not result, or would not be likely to result, in anacquisition or strengthening of a dominant position in a market, the Commission mustgive a clearance. Where the Commission is not satisfied, clearance is declined.
130 The Commission applies the dominance test in the following competition analysis.
The Market for the Harvesting and Supply of Finfish in New Zealand
131 In considering whether the proposal might lead to the acquiring or strengthening of adominant position in a market, the Commission takes into account the extent of rivalrywithin the market and the constraint provided by the threat of new entrants. There mayalso be some constraint in the form of countervailing market power in the hands ofcustomers and/or suppliers. These factors are considered below.
132 In addition to adopting the broad market definition of finfish, a separate analysis ofhoki is also provided. As noted in the earlier section on market definition, this is inrecognition of the particular importance of the hoki fishery to the New Zealand fishingindustry, in particular to the value-added market. The hoki TACC (250,000 tonnes outof a total finfish TACC of approximately 600,000 tonnes) is easily the largest for any
7 Commerce Commission v Port Nelson Ltd (1995) 5 NZBLC 103,762 103,787 (HC). 8 Commerce Commission v Port Nelson Ltd (1996) 5 NZBLC 104,142 104,161 (CA). 9 Commerce Commission v Port Nelson Ltd (1995) 5 NZBLC 103,762 103,787 (HC)
and Commerce Commission v Port Nelson Ltd (1996) 5 NZBLC 104,142 104,161 (CA).

27
finfish species in New Zealand. The next largest finfish TACCs are for jack mackerel(60,547 tonnes) and southern blue whiting (58,000 tonnes). Combining the TACCs forthe important orange roughy, hake and snapper fisheries amounts to just under 41,000tonnes.
Existing Competition
Market Concentration
133 An examination of market concentration often provides a useful first indication ofwhether or not a merged firm may be constrained by other participants, and thus theextent to which it may be able to exercise market power.
134 In examining market concentration, the Commission has developed a set of ‘safeharbours’ (see above). These safe harbours recognise the importance of both theabsolute levels of market share and the distribution of market shares between themerged entity and its competitors in determining the extent to which rivals are able toconstrain the behaviour of the merged firm.
135 If, given an appropriate definition of markets and market shares, a proposed acquisitionfalls within these safe harbours, the Commission will usually grant approval. If,however, the acquisition falls outside of these harbours, the Commission will consider arange of additional factors before drawing conclusions on market dominance.
136 Prior to discussing market shares for the harvesting and supply of finfish in NewZealand, it should be recalled that about 90% of all seafood harvested in New Zealandis exported. Thus, these market shares taken in isolation are not necessarily reflectiveof potential dominance concerns within New Zealand. In this context the ability ofsuppliers other than the associated companies to satisfy domestic demand is ofparticular relevance.
137 Tables 6 and 7 set out the main owners and holders of total finfish quota, and of hokiquota, respectively. The tables aggregate the ownership and holdings contained in theMinistry of Fisheries quota database. The tables provide a snapshot of quota ownershipand quota holdings as of 21 March 2000.

28
Table 6: Quota Ownership and Holdings (Total Finfish)
Total QuotaOwned (tonnes)
MarketShare
Total QuotaHeld (tonnes)
MarketShare
Sealord/TIP 134,492 23% 128,596 22%Sanford 110,901 19% 112,342 19%Amaltal 63,326 11% 51,906 9%Talleys 17,641 3% 16,622 3%Associated Companies 326, 360 56% 309,466 53%TOWFC 67,849 12% 11,620 2%Independent 38,910 7% 43,255 7%Vela 32,389 6% 21,498 4%United 19,113 3% 14,394 2%Moana Pacific 7,357 1% 15,181 3%Other 89,256 15% 165,820 29%Total 581,234 100% 581,234 100%
138 According to Table 6, the associated companies would own 56% of the total finfishquota. This situation falls just outside the safe harbours, as the market share of thelargest rival is the 12% owned by the Treaty of Waitangi Fisheries Commission(TOWFC).
139 Table 6 also shows the concentration of quota holdings. Quota held includes quotaowned and fished, as well as quota leased in from other parties. Quota held willtherefore tend to better reflect harvesting capacity. The associated companies wouldhold 53% of total finfish quota. This again falls outside the safe harbours.
140 Turning specifically to the hoki fishery, Table 7 shows the ownership and holdings ofHOK1 quota. The hoki fishery in New Zealand is covered by the single QMA 1. Theassociated companies would own approximately 64% of HOK1 quota, and would hold62% of HOK1. The next largest ownership share of HOK1 is the 10% owned byTOWFC, and the next largest holding is Independent’s 10%.
Table 7: Quota Ownership and Holdings (HOK1)
Total QuotaOwned (tonnes)
MarketShare
Total QuotaHeld (tonnes)
MarketShare
Sealord/TIP 75,706 30% 75,431 30%Sanford 35,100 14% 37,100 15%Amaltal 42,286 17% 34,785 14%Talleys 6,738 3% 6,816 3%Associated Companies 159,830 64% 154,132 62%TOWFC 24,993 10% - -Independent 19,674 8% 23,855 10%Vela 17,918 7% 15,018 6%United 5,129 2% 4,955 2%Moana Pacific 867 0% 2,876 1%Other 21,589 9% 49,164 19%Total 250,000 100% 250,000 100%

29
141 In general, quota holdings will roughly reflect catch levels, bearing in mind that theunder- or over-catching of quota by 10% can be transferred from one year to the next.
Existing Competition
142 The Treaty of Waitangi Fisheries Commission owns 12% of the total quota. TOWFCwas established as the vehicle for receiving, and allocating to iwi, quota as the basis ofthe full and final settlement of Maori claims to sea fisheries. The settlement includes10% of all existing TACCs, 20% of the TACCs for any new species added to the QuotaManagement System, and 50% of Sealord. However, TOWFC’s quota will eventuallybe distributed to iwi groups, and therefore will be spread across a diverse base. It iscurrently leased out to Iwi groups on an annual basis.
143 The next largest parcels of quota are owned by Independent (7%) and Vela (6%).
144 In considering the market shares as an indicator of ability to exert market control,reliance is implicitly placed on the ability of rivals to respond to any increase in prices.However, a peculiar feature of the finfish harvesting market is the supply rigidity set bythe TACC. This has the effect of limiting the supply response of other companies in asituation where one company, having aggregated quota, seeks to exploit its potentialmarket power by restricting output and raising prices. Normally, the output-restrictingpower of such a company would be limited or nullified by the ability of other sizeableproducers to expand production, thereby maintaining market supply.
145 This is not possible with finfish harvesting, where the output of rival companies isabsolutely restricted by the quota system (unless their quota was to some extentundercaught, thus allowing them to expand production within existing quota holdings).Hence, in the absence of external effects - such as export diversion or imports indownstream markets - a single large firm may be able to exert significant marketpower, and hence be dominant, at a much lower level of market share than wouldnormally be the case.
146 However, notwithstanding this restriction, of particular significance is the size of rivals’quota relative to the domestic demand. The Commission considers that this is anunusual case in which conventional output restriction concerns need not be given toomuch weight. Of particular relevance is the question of the associated companies’ability to raise prices above the export price, and the likely response of incumbentrivals. These issues are considered further below.
Constraint from Competition in Downstream Markets
147 The extent to which a harvesting firm could exploit market power is likely to be cappedas a result of competitive forces at play in the processing and wholesale markets. Theseforces include the possibility of export diversion and/or imports. The role of imports ismore fully discussed later in this decision. Although the line between harvesting andprocessing in the fishing industry has been considerably blurred due to the nature ofprocessing methods, any attempt by a harvester to extract higher landed fish pricesfrom processors would at some point lead to a switch towards semi-processed imports.

30
148 The potential for rival companies to divert product from export markets to the domesticmarket will reinforce this constraint, and a number of companies have indicated thatthey would divert exports in response to a favourable change in relative prices. Theremay be some potential for this to occur directly in the harvesting market, given thatsome fish is exported whole in a largely unprocessed state.
149 The Commission considers export diversion and imports to be key elements in theanalysis of competition within the fishing industry. These concepts are furtherdiscussed later in this report.
Conclusion on Constraint from Existing Competition
150 The proposed acquisition, and the resulting association of Sealord, Sanford, Amaltaland Talley’s, is likely to lead to a significant aggregation of finfish quota which wouldfall just outside the usual safe harbours. However the reliability of such concentrateddata must be assessed in the context of a product which is 90% exported. Further,competition in the harvesting market cannot be examined in isolation from competitionin the downstream processing and wholesale markets, and constraints in those marketsare likely to inhibit the extent to which any potential harvesting dominance could infact be exploited.
Conditions of Entry
151 The Commission accepts that a business acquisition is unlikely to result in a dominantposition in a market if the threat of new entrants acts as a significant constraint onbehaviour in that market. An assessment of the nature and extent of that constraintrepresents a key element of the Commission’s assessment of competition and marketdominance.
152 Before the threat of new entry into the market can be evaluated, the conditions of entryhave to be assessed and any barriers to entry need to be identified. If these barriers arehigh in aggregate, the threat of new entry will diminish.
153 The Commission’s Business Acquisitions Guidelines 1999 sets out a non-exhaustive listof barriers to entry. Following discussions with members of the fishing industry, theCommission has reviewed the relevant entry conditions below.
Individual Transferable Quota
154 In order to be able to harvest fish from New Zealand’s Exclusive Economic Zone,sufficient Individual Transferable Quota (ITQ) must be obtained in order to cover thecatch. This applies both to the target species (for example, hoki) and any species takenas by-catch (such as hake). By-catch is largely unavoidable because individual speciescannot be targeted precisely. Failure to secure enough by-catch quota would result inthe fisher having to pay the ‘deemed value’ of the by-catch to the Crown.
155 The total amount of ITQ (which is equivalent to the TACC) is fixed for each speciesand Quota Management Area, and can be either purchased or leased from other quota-holders.

31
156 ITQs are a unique and finite asset, designed to promote the efficient and sustainableharvesting of a ‘common property’ resource. ITQs, however, represent a significantcost of entering into the fish harvesting sector. For example, the Commission has beeninformed that one freezer trawler operating in the hoki fishery requires approximately8,000 tonnes of hoki ITQ per annum. According to trade prices for the period October1999-January 2000,10 the purchase of this amount of HOK1 quota would cost about $18million, while leasing the same quantity would cost $2.3 million per annum. Inaddition, sufficient quantities of quota would be required to cover any by-catch of hakeor other species. Recent trade and lease prices for hake have been in the ranges $4,699-$10,449 and $429-$688 per tonne respectively.
157 The Commission has also been informed that it is becoming increasingly difficult forincumbents, let alone new entrants, to purchase quota for the major finfish species suchas hoki and orange roughy, as the markets for these ITQs have become illiquid. Thiswould not necessarily rule out new entry, as quota can also be obtained on the leasemarket. Some concerns have been expressed about the fluidity of the quota leasingmarket for certain species. However, the Commission has obtained data on leasingtransactions which suggests a reasonably fluid market for quota leases.11
158 The Commission concludes that the existence of ITQs represents a significant barrier toentry to the fish harvesting market.
Harvesting Capacity
159 In addition to quota, a new entrant into the harvesting sector would have to obtainharvesting capacity. As with quota, this could be achieved through either purchasing orchartering an appropriate fishing vessel(s). The level of investment will depend verymuch on the particular fishery.
160 The main deepwater fisheries in New Zealand revolve around hoki and orange roughy.Hoki is taken by midwater trawling (300-600 metres), while orange roughy is a deep-sea trawl fishery (750-1200 metres).
161 The existing deep-sea catching capacity is dominated by large factory freezer trawlers.These vessels are up to 70 metres in length, have 40-50 crew, and may spend 6-7 weeksat sea per trip. The vessels are equipped with processing lines that snap-freeze semi- orfully-processed product, which is then landed for either on-processing or distribution.The capital cost of a fillet freezer trawler is in excess of $20 million, while for a freezertrawler with semi-processing facilities (heading and gutting) costs upwards of $15million.
162 In the inshore fisheries, there is less onboard processing of catch than for the deepwaterindustry. Most inshore catch is taken by smaller vessels on trips of up to four days,with the catch often iced and then landed fresh at shore-based facilities for processing.Typical inshore methods are trawling and longlining, and vessels of these types costbetween $200,000 and $2 million, depending on the size and age of the vessel.
10 FishServe Quota Monitoring System, Feb 2000.11 Ibid.

32
163 Industry sources have noted that there is currently a global surplus of fishing vessels.Used vessels are frequently available for purchase.
164 Harvesting capacity can also be chartered, avoiding the high capital cost of purchasinga vessel. Quota holders often charter other domestic or foreign vessels to catch some orall of their quota. For example, Amaltal undertakes some contract catching for otherquota holders. Approximately 20 overseas charter vessels are currently operating inNew Zealand.
165 The Commission concludes that while the capital costs associated with investment indeepwater harvesting capacity are significant, the ability to charter vessels, and thesmaller investment outlays required in the inshore fisheries, significantly reduce thecosts of accessing capacity in the fish harvesting market.
Constraints from Market Entry
166 In making this assessment, the Commission’s approach is to consider whether the entryof new participants in response to the exercise of market power is likely, sufficient inextent, timely and sustainable. This is referred to as the ‘lets’ test.
Likelihood and Sustainability of Entry
167 In order to be an effective constraint on incumbent market participants, entry into thefishing sector must be considered likely on commercial grounds. In addition, entry islikely only if there is likely to be a lasting economic incentive.
168 Since the introduction of the QMS in 1986, there has been considerable rationalisationin the harvesting sector of New Zealand’s fishing industry. ITQs were initiallyallocated on the basis of catch histories, and as a result, fishing operations received awindfall gain in the form of valuable fishing quota. Industry sources have informed theCommission that many small operators sold their quota and exited the industry soonafter the introduction of the QMS, while larger companies have consolidated theirholdings of quota. One industry source suggested that the number of fishers in theindustry has declined by 30% over the last five years.
169 The Commission considers the history of past market entry as an indicator of thelikelihood of future entry. At the same time as quota holdings have become lessdiverse, there is little evidence of newcomers to the fishing industry. The main fishingcompanies were established well before the advent of the QMS.
170 The existence of ITQs as a necessary prerequisite to entry, owned by incumbents, islikely to distort any supply-side responses that could be expected in other markets.Typically, if a dominant company attempts to raise prices in its market, it can expectthe price rise to draw new suppliers into the market. The existence of ITQs as afisheries management tool blunts this supply-side response, as potential new entrantswould have to obtain a share of a fixed total supply of quota.
171 For example, the TACC for the hoki fishery is currently 250,000 tonnes. A dominantfirm, owning say 75% of the quota or 187,500 tonnes, could raise the price of landed

33
hoki, knowing that the aggregate response of competitors, both incumbent and potentialnew entrants, would be constrained by the remaining 62,500 tonnes of quota.
172 The above discussion of the barriers to entry and the history of entry into the fishharvesting sector suggest that potential entry on a scale that could provide an effectiveconstraint on incumbent operators is unlikely.
173 On the basis of the analysis and the information received, the Commission hasconcluded that entry on a significant scale is neither likely nor sustainable.
Extent of Entry
174 If entry is to constrain an otherwise dominant firm, then entry must potentially be at ascale as to impact significantly on its behaviour.
175 The Commission has found that entry on a significant scale into deep-sea, and to alesser extent inshore, harvesting is unlikely, and an examination of the recent trend ofrationalisation and industry reorganisation confirms this.
176 The Commission concludes that it is unlikely that new entry could be achieved on ascale sufficiently large to effectively constrain the associated companies.
Timeliness of Entry
177 To effectively constrain the exercise of market power to the extent necessary toalleviate concerns about market dominance, entry must be likely to occur beforeconsumers or users in the relevant market are detrimentally affected to a significantextent. The Commission has noted that the relevant time period has to be consideredon a case-by-case basis.
178 There is nothing to suggest that there is a significant lead-in time for entry into thefinfish harvesting sector. Once harvesting capacity, quota, and other regulatoryapprovals have been arranged, fishing can proceed. Notwithstanding the fore-mentioned concerns over the availability of quota for certain species, in which caseentry may be delayed, the Commission considers that entry could be achieved in atimely manner.
Conclusion on Constraints from Market Entry
179 The need to hold sufficient ITQ to cover any harvesting represents a significant barrierfor potential competitors, and may restrict the extent to which they can respond to anyincrease in landed fish prices. The high entry costs associated with purchasing bothITQ and deep-sea fishing vessels can to some extent be avoided through leasearrangements, which appear to be reasonably common. However, any entry wouldentail an equal-sized exit from the industry.
180 Having regard to the above factors, the Commission concludes that any new entry intothe harvesting market is unlikely to be of a sufficient scale to act as an effectiveconstraint on the associated companies in this market.

34
Conclusion on the Market for the Harvesting and Supply of Finfish in New Zealand
181 The proposed acquisition, and the resulting association of Sealord, Sanford, Amaltaland Talley’s, is likely to lead to a significant aggregation of finfish quota. According tocurrent information, the associated companies would own in the order of 56% of totalfinfish quota, and would hold 53% of the total. Given the disparate nature of rivalownership and holdings, this appears to fall outside the safe harbours. However, theCommission notes the potential unreliability of equating these shares with dominanceconcerns in New Zealand, given that 90% of seafood is exported and there appears tobe available supply harvested by existing competitors which will act as a constraint tothe associated companies. In addition, the Commission also notes that the associatedcompanies are strongly export-oriented.
182 Further, competition in the harvesting market cannot be examined in isolation fromcompetition in the processing and wholesale markets. The associated companies arevertically integrated and face a number of competitive constraints in downstreammarkets. In particular, the ability of medium-sized companies such as Independent,Vela, and United to divert exports to the domestic market represents a significantconstraint on the ability of the associated companies to exert market power in thedomestic processing and wholesale market. Furthermore, the ability to import seafoodproducts provides an alternative source of product for domestic wholesalers.
183 The Commission’s examination of the above factors has led it to conclude thatcompetitive forces in downstream markets are likely to be sufficient to inhibit theextent to which any potential harvesting dominance could in fact be exploited.
The Market in New Zealand for the Processing and Wholesale Supply of Finfish in NewZealand (“The Processing Market”)
Market Concentration
184 This market involves the receipt of finfish, its processing and wholesale to consumersin New Zealand.
185 Major participants in this market include the associated companies, Independent,United, Simunovich, Moana Pacific, Ngai Tahu Fisheries and Vela. In addition, thereare a number of other processors of varying sizes.
186 As noted earlier, the fishing industry in New Zealand is export-orientated, withapproximately 90% of all fish harvested sent to overseas buyers. While theCommission’s focus is the likely effect of the proposal on the domestic market, thedomestic market cannot be analysed in isolation from the export markets. Therefore,the Commission has, as a starting point, considered the overall processing capacity inNew Zealand.
187 An estimate has been made of the total finfish processing capacity in New Zealand.Commission staff requested processing and supply revenue figures from the majorprocessors, and further data from the New Zealand Seafood Industry Council (SeaFIC).This data, for both domestic and export markets, is listed in Table 8 below.

35
Table 8: Processing and Wholesale Supply of Finfish to Domestic and Export Markets
Supplier Annual Revenue(NZ$ million)
Estimated MarketShare (%)
Sanford [ ] [ ]
Amaltel [ ] [ ]
Sealord [ ] [ ]
Talley’s [ ] [ ]
Associatedcompanies
[ ] [ ]
Moana Pacific [ ] [ ]
Simunovich [ ] [ ]
United [ ] [ ]
Ngai Tahu [ ] [ ]
Independent [ ] [ ]
Other [ ] [ ]
Total [ ] 100
188 If the current proposal were implemented, the associated companies would (on the basisof the above figures) account for approximately [ ]% of the finfish output. Of theremaining suppliers the largest has a share of [ ]% of the total output.
189 As noted earlier, the crucial figure is the amount of finfish which is processed andsupplied to wholesalers by the associated companies in the domestic market. Industryestimates suggest that, out of a total estimated annual production of [ ], about [ ] is supplied to the domestic market, with the balance being exported. On thebasis of information currently available to the Commission, the estimated domesticmarket share of the combined entity is represented in Table 9 below.

36
Table 9: Processing and Wholesale Supply to Domestic Market
Supplier Estimated AnnualRevenue (NZ$ million)
Estimated MarketShare (%)
Combined entity [ ] [ ]
Other domestic [ ] [ ]
Imports [ ] [ ]
Total [ ] 100
190 On the basis of the above figures, the associated companies are estimated to supplyapproximately [ ]% of domestic consumption. The balance of supplies is made up ofimports and other domestic suppliers. A market share of [ ]% places the associatedcompanies within the Commission’s first “safe harbour” guideline (refer para 126), thatis, having a market share less than in the order of 40%.
191 In considering its analysis of both the harvesting and processing markets, theCommission considers that this market share figure is of the greatest relevance, relatingas it does directly to the supply of finfish in New Zealand.
Constraint from Existing Competition
192 The processing market is characterised by a large number of processors, ranging in sizefrom small processing “sheds” catering for a small range of fish species, to large scaleprocessing facilities that can produce a wide range of seafoods.
193 The larger fishing companies, including the applicant parties, are vertically integratedthrough harvesting, processing and supply. Smaller processors organise theiroperations in a number of ways. For example, they may own quota and fish itthemselves, with leased quota “topping up” their requirements. Other processors willnot own quota at all, but contract independent fishermen to supply them with fish.
194 The fish processed is then on-sold for further processing (eg. value-added products),exported, sold domestically through wholesalers and retail outlets, or supplied directlyto the food service industry.
195 Based upon the information available, the Commission estimates that existingcompetition to the associated companies, from a wide range of domestic processorssupplying the domestic market, accounts for approximately [ ]% of this market. Insuch circumstances, it is unlikely that dominance concerns will arise, given the currentcompetitive force of these processors.
196 A further constraint that would appear to alleviate dominance concerns in this market isthe ability of competitors to divert export supplies back to the domestic market. Asignificant feature of this market is that approximately 90% of all the TACC isexported. This raises the issue of whether any market power can be exercised in thesupply of fish to the domestic market, if export supply can readily be diverted to thedomestic market.

37
197 The applicant has submitted that “any number of fishing entities could supply the entireNew Zealand market”, and that fishing businesses will and do divert export productonto the domestic market if there is a price advantage in doing so.
198 [ ] advised that diversion of export supply was readily available, and could bedone quickly if domestic market conditions were attractive. Other fish suppliers agreedthat fish could be diverted to the domestic market. [ ] advised that this decisionwould be “price driven”. Presently, much of its output is exported, with a smallquantity supplied to local wholesalers and retail stores.
199 [ ], similarly, advised that export product can be diverted to the domestic market ifit was “commercially viable” to do so. Both [ ] and [ ] also considered thatexport supplies could be diverted to the domestic market, if the returns from thedomestic market were more attractive.
200 Industry sources advised that the relative export volumes of the major processors(outside of the associated companies) allows them to continue export supply as well asdivert product back to the domestic market (if the domestic market conditions arefavourable).
201 The Commission understands that, typically, a harvester will “land” fish then supplythat fish to the most attractive market. The decision to supply any particular purchaseris based upon a number of considerations, but primarily is influenced by the domesticprice as opposed to the “spot” price at overseas markets (eg. the Sydney fish market).
202 Based upon the figures available to the Commission, existing competitors processapproximately [ ] million of finfish per annum. As per Table 9 above, domesticconsumption accounts for approximately [ ] million. Therefore, on the basis of thesefigures, the balance of processed finfish supplied by processors other than theassociated companies would appear to comfortably satisfy domestic finfish demand.Indeed, the existing competitors process more than double the domestic consumption.
203 The Commission therefore views export sales by competitors as providing an ongoingcompetitive constraint. It appears unlikely that the associated companies could raiseprices in the domestic market, without a competitive response by other suppliers. Theability of these other suppliers to divert exports affords them a ready response to anyattempt to exercise market power by the associated companies. It is therefore likelythat existing competitors provide a constraint upon the associated companies, withregard to the supply of finfish in New Zealand.
204 A further feature of this market that appears to provide a constraint upon any exerciseof market power is the availability of imports. The Commission understands that, whilethe importation of frozen finfish is not significant “across the board”, it represents animportant source for certain sectors of the food industry. For example, a number ofindustry sources referred to the recent importation of South American hake. Whilegenerally considered to be of a lower quality (by the industry) than locally caughtfinfish, it was widely purchased by fish and chip shops and processors of value-addedproducts. For these purchasers, the price/quality mix was considered satisfactory, andafforded an alternative source of supply to domestically harvested finfish.

38
Potential Competition
205 A business acquisition is unlikely to result in any person acquiring or strengthening adominant position in a market if behaviour in that market continues to be subject tosignificant constraints from the threat of market entry.
Likelihood and Sustainability of Entry
206 As described earlier, processing facilities differ in their operational bases. While someare vertically integrated, and own or lease quota at the harvesting level, otherprocessors operate by purchasing raw material directly from fishermen and fishingcompanies. Consequently, their entry is not constrained by quota as is the case in theharvesting market.
207 The relatively large number of participants in this market suggests that entry conditionsare not onerous. A number of processors (independent of the associated companies)supply the supermarkets and major wholesalers.
Extent of Entry
208 If entry is to constrain an otherwise dominant firm, then entry must potentially be at ascale and spread of operations as to impact significantly on its behaviour.
209 The range of operators in this market evidences the varying sizes at which entry can beeffected.
Timeliness of Entry
210 To constrain effectively the exercise of market power to the extent necessary toalleviate concerns about market dominance, entry must be likely to occur beforeconsumers or users in the relevant market are detrimentally affected to a significantextent. The Commission has said that the relevant time period has to be considered ona case-by-case basis.
211 The Commission understands that entry into this market requires a supply of rawmaterial, and the necessary processing equipment. The processors in this market haveadvised that supply is sourced from a variety of suppliers, from around New Zealand.
212 Processing equipment is available new or second-hand, both domestically andinternationally. Industry sources estimated that a reasonable sized processing facilitywould cost approximately $1 million.
213 These factors are not considered onerous and, therefore, it is likely that entry could beeffected within a reasonable timeframe.
Constraint from the Countervailing Power of Buyers
214 It has been estimated by the Fishing Industry Board that in the mid-1990s over 60% ofwet fish marketed domestically was sold through supermarkets.12 The general trend hasbeen for supermarkets to increase their share at the expense of small, independentretailers, although speciality retail outlets have remained strong in Auckland.
12 New Zealand Fishing Industry Board, The New Zealand Seafood Industry: Economic Review, 1994-96,
Wellington: NZFIB, 1996, p. 10.

39
215 Supermarkets spoken to by the Commission have expressed concerns about the currenthigh prices for fish supplies, the difficulty of getting sufficient quantities and species ofa good quality on a regular basis, and the poor standard of service provided. They haveexpressed concerns that this situation may worsen should the proposed acquisitionproceed. However, the applicants have argued that supermarkets sometimes haveunreasonable expectations about wet fish availability and price, fuelled by comparisonswith the margins they earn on other chilled food items, and by apparent consumerresistance to paying the relatively high prices. They argue that domestic fish pricesessentially reflect export prices, and that availability is subject to weather variations andseasonal factors which are outside of the control of the fishers. The situation is alsoexacerbated by consumer unwillingness to try species of fish outside of the handfulwith which they are familiar, and which tend to be in more plentiful supply.
216 It is probably true to say that currently, supermarkets have little or no countervailingpower to negotiate lower prices with fish suppliers. The export price provides the floorbelow which domestic prices will not fall. None of the larger suppliers wouldrationally sell fish domestically at prices less than those for which they could be soldoverseas, after allowing for the extra costs associated with exporting. However, in thehypothetical situation where the combined entity was potentially able to exert marketpower in the domestic market by withholding supplies, and forcing up the price abovethe export price, one source of constraint would likely be the countervailing power ofthe supermarkets. Faced with a domestic price significantly higher than the exportprice, the supermarkets would have a strong incentive to ‘shop around’ between thevarious suppliers outside of the combined entity to secure a better deal, and thosesuppliers would have an incentive to undercut the high price in order to secure thevolume of sales made available by a supermarket contract. In this way, theCommission anticipates that the countervailing power of the supermarkets would helpto undermine any attempts by the combined entity to exert market power.
Conclusion on the Processing Market in New Zealand
217 Based on the information available, the associated companies are likely to hold amarket share of approximately [ ]%. A market share of under 40% places theassociated companies within the first of the Commission’s “safe harbours”, andindicates that there are unlikely to be dominance concerns.
218 Further, it is likely that the associated companies will continue to face competition fromexisting processors supplying the domestic market. The Commission estimates thatthese competitors, representing a wide range of processors, make up to [ ]% of thismarket. The current competitive constraint effected by these competitors is expected tocontinue should this proposal be implemented.
219 In addition, there exists the ability of harvesters to divert export supplies to thedomestic market, if it is commercially viable to do so. In these circumstances, undersuch conditions, it is unlikely that the associated companies could exert any degree ofmarket power in regards to the supply of finfish in New Zealand. Further, theavailability of imports, while not a notable current feature of the market in NewZealand, appears to offer an alternative supply source for certain buyers, and may beconsidered as representing a further constraint upon the associated companies.
220 The Commission concludes, therefore, that the associated companies would not, orwould not be likely to, acquire or strengthen a dominant position in the processingmarket in New Zealand.

40
The Market for the Processing and Wholesale Supply of Value-Added Finfish Productsin New Zealand (“The Value-Added Market”)
Market Concentration
221 The associated companies are the major producers of value-added seafood products inNew Zealand. Sealord produces the “Sealord” and “Captain Choice” branded products.Outside of the associated companies, Independent is a major producer, supplyingproducts under the “Sea Casket” and “Independent” brands.
222 The balance of sales in this market is made up of a number of value-added processors,supplying the food service industry (fish and chip shops, restaurant trade, etc), andsupermarkets.
223 The applicant provided AC Neilson data for frozen processed fish products, soldthrough the supermarket retail chains in New Zealand. It is noted that the data does notrepresent all sales of processed fish products, as sales through dairies and direct to thefood service industry are not included. However, the Commission understands thatsupermarkets account for a large proportion of the sales of processed fish products.Given the time available, the Commission considers that this information provides afair estimation of overall market share. This data is reproduced in table 10 below.
Table 10: Value-Added Fish Product Sales through Supermarkets
Suppliers Estimated Market Share
Sealord [ ]%
Independent [ ]%
Other [ ]%
Total 100%
224 The above market share figures place the associated companies within theCommission’s “safe harbour” guidelines.
Constraint from Existing Competition
225 As evidenced by the above figures, Independent currently provide effective competitionto Sealord in this market. This is expected to continue should the current proposal beimplemented.
226 There are other smaller processors of value-added products, such as Food Partners,Polaris, and Franklin Foods. These processors purchase fish from domestic suppliers,and manufacture value-added products under their own label, or under contract foranother party. Typically, the sourcing of raw materials for manufacture is not subjectto any one supplier, and manufacturers are able to buy particular species as and when itis available.
227 Food Partners currently supplies its own branded products, “Leader”, through the foodservice and supermarket chains. [ ]. Polaris manufactures

41
value-added fish products and markets these under its own brand name “Polaris”.Franklin Foods manufactures products under the “Andrew Corbett” brand.
228 In addition to the presence of other branded fish products, supermarkets and otherindustry sources considered that value-added fish products compete with other value-added frozen products, such as crumbed chicken portions. These products are alldisplayed in the frozen foods selection of a supermarket, and consumers, to somedegree, appear to treat these products as substitutable. As stated earlier, theCommission has chosen to adopt a narrower value-added “fish” product market.However, it appears likely that these products will face some constraint from othervalue-added meat and protein products.
Potential Competition
229 Entry into this market requires a supply of raw material, and the necessary processingequipment.
230 Processors in this market source fish supplies from any number of suppliers. Generally,the main species in frozen breaded products is hoki and southern blue whiting, althoughthe Commission understands that other species can be, and are, used. Substitutablespecies include trevally and warehou.
231 Recently, there has been an importation of South American hoki into New Zealand.This hoki, generally regarded by many industry sources as being of slightly inferiorquality to the locally-caught hoki, is used by the food service, principally fish and chipshops, and in value-added processed fish products. [ ] advised that it uses SouthAmerican hoki in its value-added products, due to the high price of locally caught hoki.
232 The cost of entry into the value-added market appears moderate. The Commissionunderstands that the requisite second-hand machinery is available for approximately$200,000 (to produce a particular line or product). Set-up costs for new equipment canbe up to $2 million.
233 The Commission has been advised that there is a ready market worldwide forsecondhand processing equipment, and that it is readily obtainable through brokersspecialising in such equipment.
234 In this case the Commission considers that, given the above considerations, that marketentry is likely to be both likely and sustainable, to be of sufficient extent, and to beeffected in a timely manner. That is, the threat of market entry is likely to satisfy the“Lets” test, and provide a sufficient constraint on the exercise of market power.
Conclusion on the Value-Added Market in New Zealand
235 Based upon the information available, the market share figures in this market appear tofall within the Commission’s “safe harbours”. Further, competition from existingoperators, particularly Independent, appears to be reasonably strong. In addition,barriers to entry appear moderately low.
236 The Commission concludes, therefore, that the associated parties would not, or wouldnot be likely to, acquire or strengthen a dominant position in the value-added market inNew Zealand.

42
The Market for the Cultivation and Supply of Greenshell Mussels New Zealand
Market Concentration
237 Greenshell mussels are farmed using a series of buoys and ropes. There are about 605farms in New Zealand waters with about 478 farms being located in the shelteredwaters of the Marlborough Sounds. Other areas that produce mussels include Hauraki,Nelson and Southland.
238 Ownership of mussel farms is relatively fragmented, with 200 individual ownersowning the total production capacity. Sealord own 32 mussel farms, Sanford 66, andTalley’s 16. The Commission obtained production figures from the associated partiesto the proposal, as well as several other major producers of greenshell mussels. Thefigures obtained by the Commission are shown in Table 11 below.
Table 11Market Shares of the Market for the Cultivation and Supply of
Greenshell Mussels in New Zealand
Supplier Production (GWT) Market Share (%)Sealord [ ] [ ]Sanford [ ] [ ]Talley’s [ ] [ ]Associated Companies [ ] [ ]Pacifica [ ] [ ]Marlborough Seafoods [ ] [ ]Nelson Ranger [ ] [ ]United [ ] [ ]Other [ ] [ ]Total [ ] 100%
239 The associated companies would have a market share of [ ] with the next largestcompetitor having a market share of [ ]. The merged entity’s market share would bewithin the Commission’s ‘safe harbour’ guidelines, which indicates no dominance.However a competition analysis will be conducted to ensure that dominance will not beacquired.
Existing Competition
240 As Table 11 shows, the production of greenshell mussels is relatively fragmented andthis merger will result in some consolidation in this market. The associated companieswould have a market share of [ ] with Pacifica Seafoods being the next largestcompetitor with a market share of [ ]. There are three other smaller competitors with acombined market share of [ ]. The remaining production is highly fragmented.
241 The mussel industry is maturing, and companies involved in the industry are becominglarger and vertically integrating their operations. This ensures a secure supply of theproduct, with most large producers supplying a large proportion of their production to

43
their own processing operations. The balance of their supply, will be from independentproducers who account for about [ ] of total production.
242 The associated companies would not be in a position to exercise market power at thisfunctional level of the market because of their vertically integrated structure, they arenet purchasers of mussels. They would rely heavily on supply from independentproducers to satisfy their demand.
Potential Competition
243 A business acquisition is unlikely to result in the acquisition or strengthening ofdominance if there is a credible threat of market entry. Potential competition can act asa constraint on market power, and so an examination of the nature and extent of thisconstraint is part of the Commission’s assessment of competition.
244 Entry conditions, including the nature and height of any entry barriers, must beconsidered before the threat of new entry, which might constrain the conduct of amerged entity, can be evaluated.
Regulatory Compliance
245 Mussel farming requires the allocation of public coastal space for commercial purposes,this is a critical input. In the past the process for allocating the coastal resource hasbeen through leases, Ministry of Fisheries licences and resource consents. All consentsare now issued under the Resource Management Act 1991, and are for a limited period.The maximum term under the Act is 35 years and the renewal of a consent is notautomatic as the environmental impact of the activity is reviewed.
246 The coastal space areas where mussel farming is permitted are becoming more tightlycontrolled by local body authorities, which has the effect of reducing the ability ofexisting farms to increase production, and the ability of new entrants to enter the marketand increasing output. However in Marlborough, the largest producing area, aDepartment of Conservation moratorim on the issue of new licences was lifted in July1999. Since that time the Marlborough District Council has received 320 applicationsrelating to the increase of production capacity.
247 This regulatory environment has created some advantage for incumbent firms and aregulatory barrier to entering the market for potential entrants. However it is theCommission’s view that these barriers are not onerous, and there is a strong likelihoodthat productive capacity will be increased in the future. Eventually, as the productivespace is utilised, the rising cost of acquiring rights to this space could limit supply.13
Capital Costs of Entry
248 The capital investment required to enter this market are not large with an investment ofabout [ ] required to set up a small farm. Many of the activities of mussel farmscan be outsourced to contractors, which makes smaller farms more economical.
13 Supra note 6, at p67.

44
The “Lets” Test
249 The “lets” test will now be applied to the market under analysis.
Likelihood of Entry
250 The greenshell mussel is product unique to New Zealand and is currently subject toincreased demand in overseas markets. These conditions have resulted in an increase inthe price for the product and improved industry profitability.
251 New entry into this market would require compliance with Ministry of Fisheryregulations and the Resource Management Act. Since the lifting of a Department ofConservation imposed two year moratorium, the Marlborough District Council havereceived 320 applications for the issuance of new licences. Successful applicationsrequire a resource consent and this will be determined by the nature of the application.Once this has been achieved it is the Commission’s view that entry into this market islikely because of the improved profitability and the existence of space available fordevelopment.
Extent of Entry
252 The addition of extra production capacity could be of a sufficient scale to constrain adominant firm if it attempted to exercise market power.
Timeliness of Entry
253 The obtaining of the necessary resource consents is a time consuming process,especially if the application is prolonged by the appeal process. The Commissionunderstands that in Marlborough, the major production region, there is a currentbacklog of applications. This is likely to result in a processing period of up to twoyears, which accords with the Commission’s timeframe for considering entry.However, the Commission understands that a number of early applications have been,and are currently being, processed, which will result in new entrants entering thismarket within the stated timeframe. Entry in the future is likely to be subject to somedelay, however it is also likely that entry can still be effected within two years.
Sustainability of Entry
254 Profitability in the industry has improved due to the increasing demand for thegreenshell mussel. It is the Commission’s view that although there will be pricefluctuations, entry into this could be sustainable due to the positive long-term outlookfor the industry.
Conclusion on the “Lets” Test
255 Entry into this market is likely and could be effected in a timely and sustainable mannerwhich would offer constraint to the exercise of market power.

45
The Countervailing Power of Buyers and Suppliers
256 The operations of larger companies in this industry are internal through verticalintegration. Notwithstanding this fact, these companies still need to purchase some oftheir supply of mussels from independent farmers. The effect of this verticalintegration results in the merged entity being the net purchasers, with a low level ofcountervailing power.
Conclusion on the Market for the Cultivation and Supply of Greenshell Mussels in NewZealand
257 The associated companies would have a market share of [ ] with the next largestcompetitor having a market share of [ ]. The remaining [ ] of production is highlyfragmented. These levels of market share place the merged entity within theCommission’s ‘safe harbour’ guidelines. The merged entity through its verticallyintegrated structure, are net purchasers of mussels, therefore it is not in their economicinterests to raise prices.
258 The main barrier to entering this market is the regulatory barrier of obtaining a fishingpermit and obtaining the necessary resource consents. However it is the Commission’sview that these barriers are not onerous and the threat of new entry would constrain themerged entity if it attempted to exercise market power by raising prices.
259 On the basis of the matters discussed above, the Commission concludes that NZSI andassociated parties are not currently dominant in the market for the harvesting of musselsfor processing, and would not be likely to acquire a dominant position in this market asa result of the acquisition.
The Market for the Harvesting and Supply of Scallops in New Zealand
Market Concentration
260 The harvesting of scallops is subject to the QMS. The TACC for the 1999/00 fishingyear was set at 826 tonnes.14 In the 1997/98 fishing year the TACC was 909 tonnes ofwhich 357 tonnes were harvested.
261 The market share of quota owned and quota held for the scallop fishery is shown inTable 12.15
14 meatweight tonnes. To convert to greenweight tonnes (GWT) the conversion ratio of 7 to 1 is used.15 Quota ‘owned’ means ownership of the property right, quota ‘held’ means quota owned and fished or quota
leased.

46
Table 12Production and Supply of Scallops in New Zealand
Quota Holder Quota Owned(tonnes)
ProductionShare (%)
Quota Held(Tonnes)
ProductionShare (%)
Talley’sFisheries
249.145 30% 249.145 30%
Sanfords 18.579 2.2% - -Associatedcompanies
267.724 32.2% 249.145 30%
Guards SeaHoldings
34.745 4.2% 34.745 4.2%
McDonald &Brown
28.472 3.5% 28.472 3.5%
Rongo Marie 27.164 3.2% 27.164 3.2%Ngati Apa 21.474 2.6% 21.474 2.6%TOWFC 21.199 2.5% - -Ngati Koata 20.509 2.5% 20.509 2.5%Ngati Kuia 20.509 2.5% 20.509 2.5%Ngati Rarua Iwi 20.509 2.5% 20.509 2.5%Ngati Tama 20.509 2.5% 20.509 2.5%Te Atiawa 20.509 2.5% 20.509 2.5%Ika Toa - - 20.509 2.5%Other 322.677 39% 341.946 41.3%Total 826 100% 826 100%Source: Ministry of Fisheries.
262 Table 12 shows that the associated companies would have a market share of 32.2% inthe quota owned category and 30% in the quota held category. The next largestcompetitor would have a market share of 4.2%. These levels of market shares areinside the Commission’s ‘safe harbour’ guidelines and as such do not indicatedominance. However a competition analysis will be conducted to ensure thatdominance will not be acquired.
Constraint from Existing Competition
263 Quota holdings by competitors are highly fragmented in this fishery, with the largestcompetitor to the merged entity having 4.2% of the quota holdings. The remainingquota is held or owned by a large number of entities each owning or holding arelatively small amount.
264 The effect of the QMS is to fix the domestic supply of scallops. If the associatedcompanies were to attempt to exercise market power by increasing the price, theexisting competitors would be limited in their ability to constrain the merged entity byexpanding output.

47
265 However, presently a proportion of the scallop catch is exported. In 1999 there were521.4 tonnes of scallops exported,16 this represents about 11% of the total catch. Someof this quantity is exported by existing competitors who could divert export supply tothe domestic market if the associated companies attempted to raise prices above thecompetitive level.
266 Further, scallops are imported, with 220 tonnes being imported in 1999.17 Evidencefrom the market suggests that the imported product competes with the domestic productand therefore offers competitive constraint to the associated companies if they were toincrease the price of New Zealand scallops.
Potential Competition
267 The inherent characteristics of the QMS are such that the total supply of scallops for afishing year is fixed, with total supply being increased or decreased each year based onscientific factors. The quantity of scallops any one entity can harvest is determined bytheir quota holding. Quota holdings can be increased through purchasing or leasingquota. This requirement of quota holding creates a large barrier to entering this market.
268 Between October 1986 and January 2000 there were 1090.197 tonnes of quota traded,or 1.31 times of the current TACC. There were 179 transactions In the same period,there were3,938.507 tonnes of quota leased or 4.76 times of the current TACC. Therewere 966 leasing transactions within this period. These figures show that ownership ofquota is relatively stable, however there is an active leasing market with 966 leasingtransactions within the period.
269 Recently, during the period October 1999 to January 2000 14.977 tonnes of quota weretraded which related to 4 transactions. The average price per tonne for thesetransactions was $51,814. Whilst in the same period 29.448 tonnes of quota wereleased which related to 14 transactions.
270 These figures show that the purchasing of quota is capital intensive. However the mostimportant barrier to entering the market is access to quota and the figures show thatsuch access is not easily obtained.
The “Lets” Test
Likelihood of entry
271 The harvesting of scallops is governed by the quota system so a new entrant wouldhave to either purchase or lease quota to enter the market. Currently, the market for thepurchase of scallop quota appears illiquid, although the lease market is quite active,suggesting opportunities for entry in the short-term through leasing quota.
16 <http://www.seafood.co.nz/Export_Stats/table_99totals.htm>17 Data provided by Statistics New Zealand.

48
Extent
272 It is unlikely that a new entrant could enter the market to the extent that it could provideany additional constraint on a dominant firm. Given the new entrant would have toeither purchase or lease quota, this merely equates to a transfer of market share, leavingthe new firm in no stronger a position than the old one. It is considered, therefore, thatthe extent aspect of the test is not satisfied.
Timeliness
273 The main entry conditions are obtaining quota and purchasing capital equipment.Provided the potential entrant is prepared to meet the necessary investment, entry ispossible within a reasonably short time-frame.
Sustainability
274 The scallop industry in New Zealand makes up a small part of what is a large worldmarket. It is reasonable to assume, therefore, that new entrants could expect theirharvest to be in demand.
275 The Commission recognises that in all industries a business must maintain some degreeof efficiencies to guarantee survival and the shellfish industry is no different. Thecharacteristics of the quota system, however, has created a degree of security to quotaholders. Quota holders are not threatened by new entrants flooding the market anddepressing prices. Instead, incumbents are almost guaranteed a good price for theirshellfish. Similarly, new entrants know that should they obtain quota and enter themarket, the price is likely to be maintained at its current level, ensuring long-termprofitability.
Conclusion on the “Lets” test
276 The Commission concludes that given a new entrant could not enter the market to theextent required to constraint a dominant firm, and so the “lets” test is not satisfied.
The Countervailing Power of Buyers and Suppliers
277 The associated companies have vertically integrated structures. In this market, Sealord,Sanford and Talleys are involved in quota ownership or quota leasing, and theprocessing and wholesale supply of scallops. The associated companies would be netpurchasers of scallops, relying on independent supply. There are other smallerpurchasers of scallops. However, in these circumstances, they are unlikely to hold anysignificant degree of countervailing power.
Conclusion on the Market for the Harvesting and Supply of Scallops in New Zealand
278 The associated companies would have a market share of 30% of quota owned and32.2% of quota held. This level of market share is inside the Commission’s ‘safeharbour’ guidelines. The remaining ownership is very fragmented with a large numberof entities owning a small amount of quota. If the associated companies attempted to

49
exercise market power it is the Commission’s view that they would be constrained bythe behaviour of existing competitors diverting export supply to the domestic market.Scallops are also imported, which would also constrain the associated companiesthrough increased supply to the domestic market.
279 The barriers to entering the market are high because the total annual supply is fixed andthe ability to harvest scallops is determined by the amount of quota held. Quota istraded relatively infrequently and requires a large capital investment to obtain asignificant holding.
280 The Commission’s examination of these factors has led it to conclude that theassociated companies would not, or would not be likely to, acquire or strengthen adominant position in this market as a result of the proposed acquisition.
The Market for the Harvesting and Supply of Dredge Oysters in New Zealand
Market Concentration
281 The harvesting of dredge oysters is subject to the QMS. The TACC for the 1998/99fishing year was 505 tonnes for the QMA OYS7 and 14.950 (million oysters) for theQMA OYU5. The merged entity would have 38% of quota held and 37% of quotaowned for QMA OYS7. The associated companies would have a very small proportionof the quota held for QMA OYU5. The level of quota held and quota owned is outlinedbelow in Table 13.
Table 13Quota Holdings of Dredge Oysters
Supplier Quota Owned18
(Tonnes)ProductionShare (%)
Quota Held(Tonnes)
ProductionShare (%)
Talley’s 186.323 9% 165.323 8%Sealord - - 25.25 1%Associated companies 186.323 9% 190.573 9%TOWFC 305.102 15% - -ITQ ManagementLimited
265.306 13% - -
Otakou Fisheries 132.653 6.5% 285.204 14%Pacifica Seafoods - - 265.306 13%Ngai Tahu - - 149.591 7%Other 1133.616 56% 1,132.326 57%Total 2023 100% 2,023 100%Source: Ministry of Fisheries
18 The OYS7 TACC is 505 tonnes. However, the OYU5 TACC is identified by a catch limit, the figure for the
1999/00 year being 14.950 million oysters. There are 23 quotas for this fishery, with 1 quota relatingto 650,000 oysters. Using a conversion rate supplied by the industry, 800 oysters = 81.25kg, 14.950million oysters weighs approximately 1,518 tonnes. The total TACC for both fisheries is therefore2,023 tonnes. Market shares were calculated using this methodology.

50
282 The associated companies would have a market share of 9% of total quota owned and9% of total quota held in both of these QMA fisheries. The largest quota holder ofoysters is the TOWFC with 15%. This quota is leased to Iwi groups on an annual basis.Otakou Fisheries is the largest competitor with 6.5% of owned and 14% of quota held.Pacifica Seafoods has 13% of quota held. The distribution of the remaining ownershipis highly fragmented, with a large number of holders each owning or holding a smallamount. These levels of market shares are well within the Commission’s ‘safe harbour’guidelines and do not indicate dominance. However a competition analysis will beconducted to ensure that dominance is not acquired.
Constraint from Existing Competition
283 Presently, 100% of the production of dredge oysters is consumed domestically; nodredge oysters are exported. The effect of the QMS is to fix the supply of dredgeoysters onto the domestic market. If the associated companies attempted to exercisemarket power by reducing supply to the domestic market therefore increasing price,their low level of market share suggests that they would be constrained by thebehaviour of existing competitors.
284 There is also a quantity of dredge oysters imported, the predominant form being frozenoyster meat as opposed to fresh oysters. In the 1999 year 58,950 dozen frozen oysterswere imported,19 this represents a small proportion of the total supply to the domesticmarket. However, an increased supply of imported oysters could act as a constraint onthe behaviour of the associated companies.
Potential Competition
285 As discussed above in the analysis on the scallop market, quota is required to enter thismarket and this creates a large barrier to entry. Quota can either be purchased orleased.
286 For the period October 1986 to January 2000, there were 19 trades of quota in theOYU5 fishery relating to a total tonnage of 5,853.322. This figure illustrates that thecurrent catch limit has been traded 3.8 times in the 14 year period. During the sameperiod, there were 60 trades of quota in the OYS7 fishery relating to 600.534 tonnes.This figure shows that the current catch limit has been traded about 1.18 times which isnot large when considering the time period.20 These facts illustrate that quota isinfrequently traded.
287 During the same period, there were 43 lease transactions in the OYU5 fishery, relatingto 21,948.683 tonnes. The current catch limit has been leased about 14 times. In theOYS7 fishery there were 159 transaction relating to 1,623.997 tonnes. The currentTACC has been leased 3.2 times which is not large when considering the time period.
288 For the most recent period, October 1999 to January 2000, there has been one leasetransaction in OYU5 relating to 305.102 tonnes, and 27 lease transactions in OYS7relating to 456.690 tonnes. These figures show that there is some liquidity in the
19 Data supplied by Statistics New Zealand.20 Commercial Fisheries Services Limited, Quota Monitoring System, February 2000, 33.

51
leasing market with a significant proportion of the leasing transactions relating to largeamounts.21
289 The ability to access quota is the most important factor for any potential entrant intothis market. The above analysis illustrates that there is some liquidity in the trading andleasing of quota. However quota is generally leased for short periods, over the courseof a fishing season. This would explain the high level of leasing activity.
290 The investment in quota represents a large capital cost which would impose a barrier toentering the market for smaller fishing operations. However a larger fishing operatorwould have the financial resources to purchase quota, the issue such an entrant wouldface would be the availability of quota to purchase.
The “Lets” Test
291 The harvesting of oysters is similar in many aspects to that of scallops. For this reason,the respective lets tests are analogous in places.
Likelihood of Entry
292 The harvesting of oysters is governed by the quota system so a new entrant would haveto either purchase or lease quota to enter the market. Currently, the market for thepurchase of oyster quota appears fairly illiquid, although the lease market is active,suggesting opportunities for short-term entry through leasing quota.
Extent
293 It is unlikely that a new entrant could enter the market to the extent that it could provideany additional constraint on a dominant firm. Given the new entrant would have toeither purchase or lease quota, this merely equates to a transfer of market share, leavingthe new firm in no stronger a position than the old one. It is considered, therefore, thatthe extent aspect of the test is not satisfied.
Timeliness
294 The main barriers to entry are obtaining quota and purchasing capital equipment.Provided the potential entrant is prepared to meet the necessary investment, entry ispossible within a reasonably short time-frame.
Sustainability
295 Oysters are extremely popular in New Zealand and typically sell out despite retailingfor over $1 per oyster. It is assumed, therefore, that a firm harvesting oysters andsupplying to wholesalers would have great demand for their produce.
21 Ibid at 38.

52
296 As per scallops, the quota system has resulted in maintaining prices by restrictingsupply. Current and prospective quota holders can be confident that current prices willbe maintained, ensuring long-term profitability.
Conclusion on the “Lets” test
297 The Commission concludes that given a new entrant could not enter the market to theextent required to constrain a dominant firm, the lets test is not satisfied.
Countervailing Power of Buyers and Suppliers
298 Generally the sale of harvested dredge oysters to processors is internal, most of thelarge operations are vertically integrated therefore creating a neutral effect for thecountervailing power of buyers. The associated companies are net purchasers of dredgeoysters.
Conclusion on Market for the Harvesting and Supply of Dredge Oysters in New Zealand
299 The associated companies would have a market share well inside the Commission’s‘safe harbour’ guidelines. This level of market share does not indicate dominance. Themerged entity could be constrained by the behaviour of existing competitors andthrough imported oysters. The barriers to entering the market are high; to harvestoysters quota is needed which requires a large capital investment, and it is also difficultto purchase. It is unlikely that the associated companies could be constrained by thethreat of new entrants.
300 The Commission’s examination of these factors has led it to conclude that theassociated companies would not, or would not be likely to, acquire or strengthen adominant position in this market as a result of the proposed acquisition.
The Market for the Processing and Wholesale Supply of Shellfish in New Zealand
Market Concentration
301 The processing of one species of shellfish is substitutable for another species ofshellfish (refer paragraphs 115-118). If a processor of one species wanted to expandinto the processing of another species of shellfish, they could do so in a timely mannerwithout significant investment in sunk costs. The Commission has obtained frommarket participants, processing figures to enable the calculation of market shares. Thefigures for the total processing and wholesale supply of shellfish are outlined below inTable 14. The figures for the processing and wholesale supply of shellfish in NewZealand are outlined in Table 15.

53
Table 14The Estimated Market Shares for the Processing and Wholesale Supply of Shellfish
Processor Mussels(GWT)
Scallops(GWT)
Oysters(GWT)
Total(GWT)
Marketshare(%)
Sealord [ ] [ ] [ ] [ ] [ ]Talleys [ ] [ ] [ ] [ ] [ ]Sanfords [ ] [ ] [ ] [ ] [ ]Associatedcompanies
[ ] [ ] [ ] [ ] [ ]
PacificaSeafood
[ ] [ ] [ ] [ ] [ ]
MarlboroughSeafoods
[ ] [ ] [ ] [ ] [ ]
NelsonRanger
[ ] [ ] [ ] [ ] [ ]
BarnesOysters
[ ] [ ] [ ] [ ] [ ]
Other [ ] [ ] [ ] [ ] [ ]Total [ ] [ ] [ ] [ ] [ ]
Table 15The Estimated Market Share of the Market for the Processing and Wholesale Supply of
Shellfish in New Zealand
Processor Mussels(GWT)
Scallops(GWT)
Oysters(GWT)
Total(GWT)
Marketshare(%)
Sealord [ ] [ ] [ ] [ ] [ ]Talleys [ ] [ ] [ ] [ ] [ ]Sanfords [ ] [ ] [ ] [ ] [ ]Associatedcompanies
[ ] [ ] [ ] [ ] [ ]
PacificaSeafood
[ ] [ ] [ ] [ ] [ ]
MarlboroughSeafoods
[ ] [ ] [ ] [ ] [ ]
NelsonRanger
[ ] [ ] [ ] [ ] [ ]
BarnesOysters
[ ] [ ] [ ] [ ] [ ]
Other [ ] [ ] [ ] [ ] [ ]Total [ ] [ ] [ ] [ ] 100%

54
302 The associated companies would have a market share of [ ] and the next largestcompetitors having market shares of [ ] and [ ]. These levels of market shares areoutside the Commission’s ‘safe harbour’ levels and are an indicator of possibledominance. A competition analysis will be conducted to examine whether dominancecould be acquired.
Constraint from Existing Competition
303 The next largest competitors are Barnes Oysters an oyster supplier, and PacificaSeafoods and Marlborough Seafoods. These companies are both vertically integratedbusinesses who purchase a quantity of their supply from independent mussel farmers.If the associated companies attempted to exercise market power by reducing the pricepaid to independent suppliers, existing competitors could utilize existing capacity orexpand capacity to process an increased supply. The Commission understands thatover [ ]% of mussel production is exported. If the merged entity increased thewholesale price of mussels to the domestic market, existing competitors could increasesupply to the market by diverting export supply therefore constraining the behaviour ofthe associated companies.
304 The associated companies would be large processors and wholesale suppliers ofscallops. If they attempted to exercise market power by reducing the price paid tosuppliers below the market price, existing competitors could expand their capacity toprocess or diversify into processing the species in a timely manner and withoutincurring substantial sunk costs. If the associated companies increased the wholesaleprice above the market price, existing competitors could increase supply to thedomestic market by diverting exported product or by increasing the supply of importedproduct.
305 The associated companies would also be a large processor and wholesale supplier ofdredge oysters. If they attempted to exercise market power by reducing the price paidto suppliers below the market price, existing competitors could expand processingcapacity or diversify into processing the species in a timely manner without incurring alarge sunk cost. If the associated companies increased the wholesale price of processedoysters to the domestic market, other processors could not increase their domesticsupply because their supply is fixed. It may not be economical to do this if fixed costsare high and this behavour increases average costs. The harvesting period is alsoseasonal. The behaviour could be constrained by the increased importation of frozenoyster meat.
Constraint from Potential Competition
306 The resources required to successfully enter this market are a suitable plant thatcomplies with the various regulations, and various stainless steel equipment used in theprocessing operation. A larger investment in equipment is required for musselprocessing because of the characteristics of the product. There is a second-hand marketfor this type of equipment.
307 An investment in mussel processing equipment would involve a capital cost of between$5m and $10m to enable production to reach an efficient scale.

55
308 The processing of oysters and scallops is seasonal and therefore some capacity is partlyultilized. The processing of mussels by the bigger companies is normally done on anannual basis ensuring better utilization of capacity.
309 Access to a secure supply of product would impose a barrier to entering the market fora new entrant, particulary for scallops and oysters. This is one of the reasons why thereis a high level of vertical integration in the industry. A new entrant could obtain asupply of mussels by negotiating with existing suppliers to supply at a price premium.A new entrant could also obtain a supply of scallops or oysters if the merged entityattempted to exercise market power. However, excluding those conditions it would bedifficult for a new entrant to access supply.
The “Lets” Test
Likelihood of Entry
310 The barriers to entering this market are not onerous, this is evidenced by the relativelarge number of competitors in the market. As the demand for shellfish increases,current excess capacity will be utilised as supply increases, and further capitalinvestment will be required in this market. Entry is likely in this market.
Extent of Entry
311 Entry into this market could be made at a level that would achieve efficiencies andwould offer significant constraint to the exercise of market power.
Timeliness of Entry
312 Entry could be made in a timely manner. If the entrant was investing in new plant andequipment, entry could be effected within a period of six months to one year.
Sustainability of Entry
313 With growth in the cultivation and supply market, particulary in the supply of mussels,and as existing excess capacity was utilised, this would create a condition where newentry would be sustainable.
Conclusion on the “Lets” Test
314 On the basis of the above analysis, entry into this market is likely, and this threat ofentry would constrain the exercise of market power.
The Countervailing Power of Buyers and Suppliers
315 Independent suppliers are generally fragmented but they do have the ability to switchpurchasers and exercise a level of constraint. Buyers, particularly supermarketpurchasers, are concentrated and do exercise a level of countervailing power by theirability to switch suppliers.

56
Conclusion on the Market for the Processing and Wholesale Supply of Shellfish in NewZealand
316 The merged entity would have a market share of [ ], whilst the next largest competitorwould have a market share of [ ]. These levels of market share are outside theCommission’s ‘safe harbour’ guidelines.
317 Notwithstanding these market shares, potential supply sources for shellfish are onlylimited with regard to dredge oysters (see para 299). Mussels and scallops are availablethrough new entry and imports. However, with regard to dredge oysters, the associatedcompanies have a production share of [ ]% (see Table 13), alleviating dominanceconcerns.
318 If the associated companies attempted to exercise market power they would beconstrained by the behaviour of existing competitors, although this level of constraintwould be limited for the processing of oysters.
319 The main barriers to entering the market would be the access to supply of an inputparticulary for scallops and oysters, because of the nature of the QMS. However it isthe Commission’s view that if market power were exercised by lowering the price paidfor the input, access to supply could be obtained.
320 The Commission’s examination of these factors has led it to conclude that theassociated companies would not, or would not be likely to, acquire or strengthen adominant position in this market as a result of the proposed acquisition.
OVERALL CONCLUSION
321 The Commission has considered the likely impact of the proposal in the followingmarkets:
• the market for the harvesting and supply of finfish in New Zealand (the ‘harvestingmarket’);
• the market in New Zealand for the processing and wholesale supply to domestic andexport markets of finfish in fresh and frozen form (the ‘processing market’);
• the market in New Zealand for the processing and wholesale supply of frozen,branded, sea-food products (the ‘value-added market’);
• the cultivation and supply of greenshell mussels in New Zealand;
• the harvesting and supply of scallops in New Zealand;
• the harvesting and supply of dredge oysters in New Zealand; and
• the processing and wholesale supply of shellfish in New Zealand.
322 Having regard to the various elements of section 3(9) of the Act, and all the otherrelevant factors, the Commission is satisfied that the proposal would not result, orwould not be likely to result, in any person acquiring or strengthening a dominantposition in any of the markets listed in paragraph 321.

57
323 The Commission has made its determination based on market share and fishing quotaheld by the applicant and its associated companies as at the date of the clearance. Inreaching these conclusions the Commission has relied on the provisions of theCommerce Act 1986 and not the regimes established under the various Fishing Acts forthe acquisition and aggregation of quota. If there were to be further acquisition ofquota by either purchase or lease in the future by the applicant or its associatedcompanies, then that acquisition is subject to section 47 of the Commerce Act 1986.
DETERMINATION ON NOTICE OF CLEARANCE
324 Pursuant to section 15(5) and section 15(6) of the Act, issues before the Commission(including issues before a division of the Commission) shall be determined by majorityvote, and in the event of an equality of votes, the Chairman shall have a deliberativevote and also a casting vote.
325 The Chairman, Mr Belgrave, and Deputy Chairman, Mr Berry, determined to clear theapplication. Commissioners Brown and Coutts dissented. The Chairman exercised hiscasting vote in the same manner as his deliberative vote.
326 Accordingly, pursuant to section 66(3)(a) of the Act, the majority of the division of theCommission determines to give clearance for the proposed acquisition by New ZealandSeafood Investments Limited of 100% of the shares in Basuto Investments Limited.
Dated this 23rd day of March 2000
M J BelgraveChair

58
Talleys Amalgamated
Amaltal Sanford
AmalgamatedDairies
NZSI(applicant)
Basuto
TIP
Te WakaUna
Treaty of WaitangiFisheries
Commission
Sealord
50%
50%
100%
48%
50%
50%
100%
100%
50%
50%
APPENDIX A
100

59
APPENDIX B: Management areas for Ling

60
DISSENTING OPINION OF K M BROWN AND E M COUTTS
INTRODUCTION
1. Having regard to the various elements of section 3(9) of the Commerce Act 1986 (theAct), and all other relevant factors, Commissioners Brown and Coutts are not satisfiedthat the acquisition would not result, or would not be likely to result, in any personacquiring or strengthening a dominant position in a market.
2. The reasons for the dissenting opinion, which relate primarily to timing constraints andmarket definition, follow.
THE PROPOSAL
3. In a notice to the Commission dated 7 March 2000, pursuant to section 66(1) of the Act,New Zealand Seafood Investment Limited (NZSI) sought clearance to acquire a 100%share of Basuto Investments Limited (Basuto). Basuto controls 50% of the shares in theSealord Group Limited.
THE PROECEDURES
4. The application was received on 7 March 2000. Section 66(3) of the Act requires theCommission either to clear or to decline to clear a notice given under section 66(1) within10 working days, unless the Commission and the person who gave the notice agree to alonger period. An extension of two working days, sought by the Commission, was agreedby the applicant. Accordingly, a decision was required by 23 March 2000.
5. As NZSI’s initial indicative bid for Basuto had to be submitted by 24 March 2000 andaccompanied by any necessary clearances, NZSI asked the Commission to consider theapplication urgently. In the view of Commissioners Brown and Coutts, the timeconstraint which precluded any extension past 24 March 2000, did not give theCommission sufficient time to analyse all the material competitive effects of, and to makean informed and considered decision in respect of, the application.
6. Commissioners Brown and Coutts agree with the text of Decision 388 through paragraphs4 and 79 of the majority decision. The divergence of opinion rests primarily with themarket definitions, and subsequent competition analysis.
Market Definition
Introduction
7. The purpose of defining a market is to provide a framework within which the competitionimplications of a business acquisition can be analysed. The relevant markets are those inwhich competition may be affected by the acquisition being considered. Identification ofthe relevant markets enables the Commission to examine whether the acquisition wouldresult, or would be likely to result, in the acquisition or strengthening of a dominantposition in any market in terms of section 47(1) of the Act.

61
8. Section3(1A) of the Act provides that:
“…the term ‘market” is a reference to a market in New Zealand for goods and services aswell as other goods and services that, as a matter of fact and commercial commonsense, are substitutable for them”
9. Relevant principles relating to market definition are set out in Telecom Corporation ofNew Zealand Ltd v Commerce Commission,22 and in the Commission’s BusinessAcquisitions Guidelines (the Guidelines).23 A brief outline of the principles follow.
10. Markets are defined in relation to three dimensions, namely product type, geographicalextent, and functional level. A market encompasses products which are close substitutesin the eyes of buyers, and excludes all other products. The boundaries of the product andgeographical markets are identified by considering the extent to which buyers are able tosubstitute other products, or across geographical regions, when they are given theincentive to do so by a change in the relative prices of the products concerned. A marketis the smallest area of product and geographic space in which all such substitutionpossibilities are encompassed. It is in this space that a hypothetical, profit-maximising, monopoly supplier of the defined product could exert market power,because buyers, facing a rise in price, would have no close substitutes to which toturn (emphasis added).
11. A properly defined market includes products which are regarded by buyers or sellers asbeing not too different (‘product’ dimension), and not too far away (‘geographical’dimension). And are therefore products over which the hypothetical monopolist wouldneed to exercise control in order for it to be able to exert market power. A market definedin these terms is one within which a hypothetical monopolist would be in a position toimpose, at the least, a “small yet significant and non-transitory increase in price” (the“ssnip” test), assuming that other terms of sale remain unchanged.
12. Markets are also defined in relation to functional level. Typically, the production,distribution, and sale of products takes place through a series of stages, which may bevisualised as being arranged vertically, with markets intervening between suppliers at onevertical stage and buyers at the next. Hence, the functional market level affected by theapplication has to be determined as part of the market definition. For example, thatbetween manufacturers and wholesalers might be called the “manufacturing market”,while that between wholesalers and retailers is usually known as the “wholesalingmarket”.
13. Commissioners Brown and Coutts do not believe that these principles have been appliedin this decision. The market definitions decided upon by the majority are at the broadestlevel, rather than the smallest product and geographical space that might apply andprovide market dominance. Commissioners Brown and Coutts believe that there couldbe specialised, perhaps even regional and seasonal, markets for fresh fish which could notbe fully considered because of the time constraint. Likewise, the belief of CommissionersBrown and Coutts that there could be a domestic market for fresh fish, distinct from the
22 (1991)4 TCLR 473.23 Commerce Commission, Business Acquisition Guidelines, 1999, pp. 11-16.
62
frozen domestic fish market and the export markets, could not be fully consideredbecause of the time constraint.
14. Paragraph 90 of the majority decision records that the listing of prices for various speciesof fish was taken to mean:
“That overlapping substitutability between species at adjacent quality/price levelsshould result in a chain of substitutability stretching from the premium quality to thebudget quality species. On this basis, all major finfish species would fall within thesame product market.”
15. Commissioners Brown and Coutts do not accept this argument. They believe it is just aslikely that there are some discrete groupings of fish that will follow the pattern suggestedabove. In addition, other consumer responses, including foregoing acceptable species offish, are at least as likely as the idea of overlapping substitution which lead to theconclusion that there is one market. Again, the time constraint prevented anyconsideration of empirical evidence and industry data to see whether they supportedeither the argument or the conclusion.
16. Paragraph 108 of the majority decision records that the market defined for analysing allthe material competitive effects of the acquisition is:
• “The market for the processing and wholesale supply of finfish in New Zealand (the‘processing market’)”.
17. The competition analysis in the majority decision is based upon this broad marketdefinition. Because Commissioners Brown and Coutts are not convinced that this marketdefinition is appropriate for analysing all the material competitive effects of theacquisition, they cannot accept the result of the competition analysis and the conclusionsdrawn from it.
18. Other markets were also part of the application and decision. While CommissionersBrown and Coutts have fewer concerns about those markets, again the time constraintprecludes them from being able to agree with the majority decision that there are nocompetition concerns in those markets.
19. Having regard to the various elements of section 3(9) of the Act, and all other relevantfactors, Commissioners Brown and Coutts are not satisfied that the acquisition would notresult, or would not be likely to result, in any person acquiring or strengthening adominant position in a market.
20. Therefore, Commissioners Brown and Coutts consider that the Commission shoulddecline to give clearance for the proposed acquisition by New Zealand SeafoodInvestments Limited of 100% of the shares in Basuto Investments Limited.
K M Brown E M CouttsCommissioner Commissioner

63