dear investor, table 1: performance of portfolio stocks
TRANSCRIPT

Dear Investor,
Greetings from Trivantage Capital. We do hope and wish that you and your family members are in good health.
The stocks of leading financial services businesses in India have bounced back quite remarkably over the past six months. Table 1 below indicates how pronounced this pullback has been for our portfolio companies and how this has even positively spruced up the one year performance which for many companies have turned positive thereby overcoming the virus led meltdown in March.
Table 2 alongside indicates the distance that still exists from the life time highs of these stocks and as can be noticed five stocks are already at or near their life time highs and for the remaining the opportunity continues for them to reach that milestone.
What we have described above has surprised many market veterans and investors alike. An overwhelming opinion in the marketplace was that the financial services stocks have been permanently derated. Consequently, several leading fund managers had re-allocated their portfolios by reducing the exposure to the financial sector.
November 2020
Table 1: Performance of Portfolio Stocks Over the Last 1 Year (as on 20 November ’20)
Table 2: Distance from Lifetime Highs (as on 20 November ’20)

2
As the Q2 FY21 earnings begun unfolding, many of the leading private sector banks and Non-Banks surprised the street with a much better picture of asset quality, adequate provision coverage levels, extremely comfortable tier-1 capital positions and impressive credit growth under the given circumstances.
Several Foreign Institutional Investors responded to the earnings in a very pronounced manner by bringing in over 5 billion USD in just the month of November. Bulk of this allocation was made to many of our portfolio companies. In this process, we have seen many domestic fund managers compelled to reverse their earlier decisions and bring back some of these stocks.
We list below the following themes post the recently concluded earnings season:
1. Leading private sector banks are winning market shares in both deposits and loans
The most compelling theme of this decade is the shifts in market shares away from the PSBs in favour of the stronger private sector banks. Post Demonetisation, we saw a surge in deposits into Public Sector Banks (PSBs) but, increasingly now, private sector banks are gaining ground both in loans and deposits. Table 3 indicates the disparities in credit growth between the PSBs that collectively grew at a mere 2.6 % as compared to the largest private sector lender HDFC Bank growing at 15.8%.
Table 4 shows how the PSBs grew their deposits at around 9% as compared to the two largest private sector banks, HDFC and ICICI growing at around 20%.
Table 3: Loan Growth (YoY) in Q2FY21
Source: HDFC Securities, November 2020
Table 4: Deposit Growth (YoY) in Q2FY21
Source: HDFC Securities, November 2020

3
Table 5 shows how the low-cost granular CASA deposits also show a wide variation with Kotak Bank leading the pack at 57% as compared to PSBs at 38%.
Table 6 shows the most crucial and significant disparity and that is in the capital positions of the banks across the ownership spectrum.
The top 4 private sector banks are very strongly capitalised and have demonstrated that they can get equity capital from the global and domestic markets quite comfortably whereas the PSBs can under the current market conditions only expect to get capital from the Government. This poses a huge constraint for the PSBs to grow in any meaningful manner.
Table 5: CASA % (as on September 30, 2020)
Source: HDFC Securities, November 2020
Table 6: Tier 1 % (as on 30 September 2020)
Source: HDFC Securities, November 2020

4
2. Most lenders have surprised the street with their collection efficiency The table below shows how most banks have reported a collection efficiency in mid- 90% range. This is quite remarkable as the market was fearing much worse situation due to the severity of lockdowns and loss of incomes. Though the geographic disparities amongst lenders are quite wide, the overall position of collections is satisfactory.
3. Growth estimates for 2021 have improved significantly
Tables 8 & 9 indicate GDP growth forecasts from Morgan Stanley where they have predicted that the Global GDP will return to the pre-Covid glide path by Q2 2021.
They have also predicted that India’s real GDP growth rate will spurt to 9.8 percent in 2021.
With an estimated CPI of 4.5% the nominal GDP growth rate would therefore be expected around 14%.
Table 7: Collection efficiency for banks is surprisingly clustered around the 90-95% wide variation in customer, risk and geographic profiles across these lenders
Source: IIFL Securities, November 2020
Table 8: Real GDP growth forecasts
2020 E 2021 E 2022 E MS MS Cons. MS Cons.
GLOBAL -3.5 6.4 5.4 4.4 3.7 DM -5.4 5.1 4.2 3.9 2.7 US -3.5 5.9 3.8 4.1 3.0 Euro Area -7.2 5.0 5.2 3.9 2.8 Japan -5.2 2.4 2.5 2.4 1.5 UK -11.4 5.3 5.5 5.5 3.0 EM -2.0 7.4 6.3 4.7 4.5 China 2.3 9.0 8.0 5.4 5.4 India -5.7 9.8 8.3 6.0 5.6 Brazil -4.0 4.3 3.5 2.7 2.5 Russia -4.0 3.4 3.0 3.2 2.3
Source: Morgan Stanley. Note: Aggregates are PPP-weighted. Cons = consensus.

5
In an environment such as this, the leading private sector lenders, both banks and non-banks that have sufficient capital for growth and cautious provision coverage levels can grow at 18-20%.
4. Negative Real interest rates are extremely positive for Equities
We expect that whilst the food inflation will moderate in the coming quarters India will continue to experience a sticky core inflation. If the growth estimates as highlighted in the above theme prove to be right, then that would also provide the upside risks to inflation. We expect that the RBI will end their accommodative stance in 2021 and shift to Neutral as they get convinced of the sustainability of economic growth and the end of the current healthcare crisis.
The year 2021 may however continue to maintain negative real interest rates which will compel the savers to allocate away from interest rate savings options, towards Equities.
Our Latest Portfolio Stance & Outlook
Table 10 highlights how the daily new Covid-19 cases are showing a different trend between the developed markets of US and Europe versus the emerging markets.
This will also be directly correlated with the differential growth prospects in these markets and will thus dictate the flow of capital to the EMs.
We are extremely positive on the prospects of growth and capital flows into India in 2021 and have aligned our portfolio accordingly.
Table 9: Global GDP - Pre-COVID-19 levels achieved in 4Q20, back to pre-COVID-19 path by 2Q21
Source: Morgan Stanley. Note: The pre-COVID-19 GDP path refers to the trajectory that global GDP would have followed prior to the COVID-19 shock and is calculated using Morgan Stanley Research forecasts as of January 21, 2020.
Table 10: New COVID-19 cases are still rising in the US but declining in the euro area and EMs ex China
Source: Morgan Stanley. Note: Euro area includes Germany, France, Italy, Spain and Netherlands. EMXC includes India, Russia, Indonesia, Korea, Brazil, Mexico, Turkey, Thailand and South Africa.
6
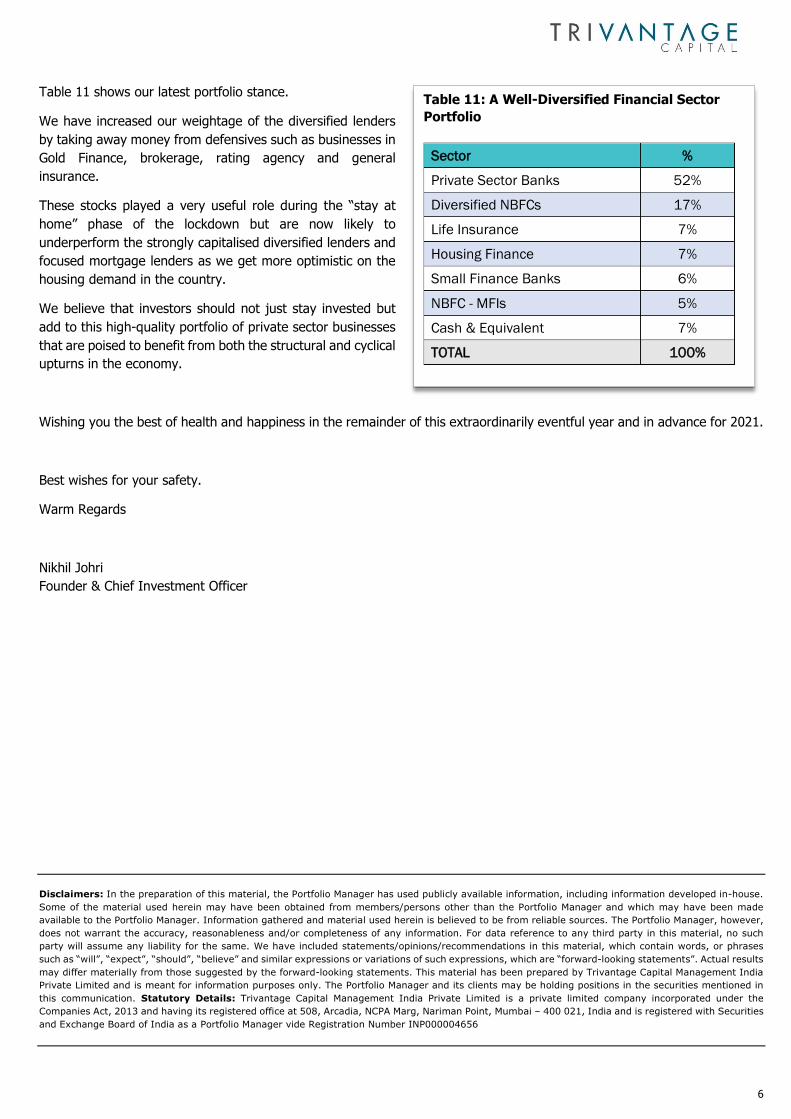
Table 11 shows our latest portfolio stance.
We have increased our weightage of the diversified lenders by taking away money from defensives such as businesses in Gold Finance, brokerage, rating agency and general insurance.
These stocks played a very useful role during the “stay at home” phase of the lockdown but are now likely to underperform the strongly capitalised diversified lenders and focused mortgage lenders as we get more optimistic on the housing demand in the country.
We believe that investors should not just stay invested but add to this high-quality portfolio of private sector businesses that are poised to benefit from both the structural and cyclical upturns in the economy.
Wishing you the best of health and happiness in the remainder of this extraordinarily eventful year and in advance for 2021.
Best wishes for your safety.
Warm Regards
Nikhil Johri Founder & Chief Investment Officer Disclaimers: In the preparation of this material, the Portfolio Manager has used publicly available information, including information developed in-house. Some of the material used herein may have been obtained from members/persons other than the Portfolio Manager and which may have been made available to the Portfolio Manager. Information gathered and material used herein is believed to be from reliable sources. The Portfolio Manager, however, does not warrant the accuracy, reasonableness and/or completeness of any information. For data reference to any third party in this material, no such party will assume any liability for the same. We have included statements/opinions/recommendations in this material, which contain words, or phrases such as “will”, “expect”, “should”, “believe” and similar expressions or variations of such expressions, which are “forward-looking statements”. Actual results may differ materially from those suggested by the forward-looking statements. This material has been prepared by Trivantage Capital Management India Private Limited and is meant for information purposes only. The Portfolio Manager and its clients may be holding positions in the securities mentioned in this communication. Statutory Details: Trivantage Capital Management India Private Limited is a private limited company incorporated under the Companies Act, 2013 and having its registered office at 508, Arcadia, NCPA Marg, Nariman Point, Mumbai – 400 021, India and is registered with Securities and Exchange Board of India as a Portfolio Manager vide Registration Number INP000004656
Table 11: A Well-Diversified Financial Sector Portfolio
Sector %
Private Sector Banks 52%
Diversified NBFCs 17%
Life Insurance 7%
Housing Finance 7%
Small Finance Banks 6%
NBFC - MFIs 5%
Cash & Equivalent 7%
TOTAL 100%